Article

Numerical Study on the Influence of Cooling-Fin Geometry on the Aero-Thermal Behavior of a Rotating Tire

1
Mechanical Engineering, Graduate School of Wonkwang University, Iksan-daero 460, Iksan-si 54538, Jeollabuk-do, Republic of Korea
2
Mechanical Engineering, Wonkwang University, Iksan-daero 460, Iksan-si 54538, Jeollabuk-do, Republic of Korea
*
Author to whom correspondence should be addressed.
Energies 2025, 18(12), 3133; https://doi.org/10.3390/en18123133
Submission received: 29 May 2025 / Revised: 12 June 2025 / Accepted: 12 June 2025 / Published: 14 June 2025

Abstract

:
An excessive temperature rise in vehicle tires during driving can degrade dynamic performance, safety, and fuel efficiency by increasing rolling resistance and softening materials. To mitigate these issues, it is essential to enhance the cooling performance of tires without inducing significant aerodynamic penalties. In this study, we propose the use of sidewall-mounted cooling fins and investigate their aero-thermal effects under both ground-contact and no-ground-contact conditions. Seven fin configurations were tested, with installation angles ranging from −67.5° to 67.5°, with positive angles indicating an orientation opposite to the direction of wheel rotation and negative angles indicating alignment with the direction of rotation. High-fidelity unsteady Reynolds-averaged Navier–Stokes simulations were conducted using the SST k-w turbulence model. The sliding mesh technique was employed to capture the transient flow behavior induced by tire rotation. The results showed that, under no-ground-contact conditions, the 45° configuration achieved a 16.8% increase in convective heat transfer with an increase in drag less than 3%. Under ground-contact conditions, the 22.5° configuration increased heat transfer by over 13% with a minimal aerodynamic penalty (~1.7%). These findings provide valuable guidance for designing passive cooling solutions that improve tire heat dissipation performance without compromising aerodynamic efficiency.

1. Introduction

Tires serve as the sole contact interface between a vehicle and the ground and are subjected to friction and periodic vehicle loads during driving. These combined loads lead to repeated deformation and heat generation, resulting in an increase in tire temperature. Such thermal effects are exacerbated in the summer, where elevated road and ambient temperatures amplify frictional interactions. Elevated ground temperatures result in higher tire surface temperatures. As the tire material softens, the contact area increases, leading to greater friction between the tire and the road surface. Additionally, higher ambient temperatures reduce convective heat dissipation, limiting a tire’s ability to release accumulated heat. This process generates a feedback loop, wherein an increasing temperature leads to greater friction and a further temperature rise, ultimately compromising tire performance and safety.
Previous studies on tires have primarily focused on internal thermal behavior as influenced by material properties, structural configurations, and driving conditions. Farroni et al. developed a numerical model to analyze internal heat generation due to cyclic deformation, revealing significant temperature increases in the sidewall region under repetitive compression [1]. Kang et al. proposed a thermo-mechanical coupled model incorporating three-dimensional tread patterns to investigate the effect of tread geometry on heat generation and temperature distribution [2]. Similarly, Jeong et al. validated a numerical approach to predicting the thermal distribution of patterned tires, achieving good agreement with experimental data [3]. Zhou et al. conducted both full-scale wind tunnel experiments and uRANS/DES-based CFD simulations on three types of tread patterns. Their comparative analysis revealed that the vortex structure and pressure distribution vary significantly depending on the tread groove pattern. Furthermore, changes in groove depth and geometry were shown to affect both aerodynamic drag reduction and thermal behavior [4]. In addition, numerous experimental and numerical studies have been conducted to investigate the heat dissipation performance of tires with varying tread patterns [1,5,6].
These investigations, however, have focused on tread or internal structures to enhance thermal performance, with limited attention paid to the tire sidewall’s role in heat dissipation. Yamaguchi et al. conducted an experimental and numerical analysis to assess the effect of cooling-fin geometry—i.e., height, width, and spacing—on convective heat transfer over a flat plate and subsequently applied these fins to the tire sidewall [7]. Although their study demonstrated the high potential of cooling fins in enhancing heat dissipation, the fin designs were optimized for flat surfaces, and the authors did not fully consider the fins’ aerodynamic impact when applied to rotating tires.
Several studies have analyzed the influence of wheel and tire geometry on aerodynamic performance. Lee et al. examined the effects of wheel offset and tire corner radius, observing increased drag with a reduced corner radius [8]. Josefsson et al. investigated aero-wheel design, evaluating wheel covers, spoke shapes, and protrusions [9]. Leśniewicz et al. compared the aerodynamic performance of slick and grooved tires, finding that longitudinal grooves suppressed jetting effects and reduced drag [10]. Brandt et al. highlighted the significant impact of wheel rim coverage on drag reduction [11]. Skea et al. analyzed the flow characteristics around rotating wheels through CFD and wind tunnel experiments, reporting complex vortex patterns influenced by wheel width and rotation [12]. Croner et al. employed an unsteady Reynolds-averaged Navier–Stokes (uRANS) framework with the ONERA k–kL turbulence model and validated their results against wind tunnel and particle image velocimetry (PIV) data, confirming that CFD can reliably replicate experimental observations [13]. Subsequently, Haag et al. applied Delayed Detached Eddy Simulation (DDES) and showed that the results exhibited good agreement with PIV measurements, particularly in terms of capturing vortex shedding due to rim geometry [14]. Aultman et al. conducted a study on the long-wavelength wake structures generated by rotating tires using a simplified vehicle model and reported that aerodynamic drag decreased by approximately 7% compared to a stationary-wheel case [15]. Yu et al. also performed RANS-based simulations on the DrivAer model, demonstrating that the combination of rotating tires and moving ground promotes pressure recovery in the wake region and leads to a reduction in aerodynamic drag [16].
While previous studies have primarily concentrated on either thermal or aerodynamic optimization, relatively few have addressed both aspects in an integrated manner. Considering that convective heat transfer is inherently governed by airflow, a coupled analysis of thermal and aerodynamic performance is imperative for a comprehensive evaluation.
In this study, we propose using sidewall-mounted cooling fins as a design strategy for enhancing heat dissipation without incurring significant aerodynamic penalties. Building upon prior findings [7], which demonstrated the thermal benefits of finned structures, we employed high-fidelity numerical simulations to systematically investigate the effects of fin orientation and geometry, both in the presence and absence of ground influence. By evaluating the aerodynamic penalties and thermal benefits across a range of fin angles and ground-contact conditions, we identified configurations that achieve optimal performance balance. These findings offer practical design insights for passive cooling strategies for vehicle tires without compromising aerodynamic efficiency.
This paper is structured as follows. Section 2 presents the geometry of the tire and cooling fins as well as the simulation domain. It also describes the numerical methods employed, computational mesh generation, and mesh sensitivity analysis. Section 3 discusses the aerodynamic and thermal performance of the tire for various fin configurations under both ground-contact and no-ground-contact conditions. A comparative analysis of the results is provided. Finally, Section 4 concludes the paper with a summary of our key findings and final remarks.

2. Methodology

2.1. Geometry and Computational Domain

The wheel of the DrivAer model, with its smooth tire geometry, featuring a diameter and width of 0.637 m and 0.226 m, respectively, was used as the baseline model [17]. Figure 1 presents the wheel–tire geometry under ground-contact conditions. To increase the simulation’s robustness, a contact patch was defined at the surface where the tire comes into contact with the ground, as presented in Figure 1a [18]. The far-field boundaries in the streamwise (L), lateral (W), and vertical (H) directions were positioned at distances of 30D, 8D, and 10D, respectively, where D denotes the tire diameter. A downstream distance of more than 20D was ensured to satisfy the pressure outlet boundary condition, allowing for adequate development of the wake region and minimizing reverse flow effects.
Figure 2a shows the cooling-fin geometry used in the simulation. Each fin was designed with a width of 1 mm, a height of 2 mm, and a length of 88.5 mm based on findings from a prior study [7]. As shown in Figure 2b, the fins were installed on the tire sidewall at 22.5° intervals to cover an angle range from −67.5° to 67.5°, creating a total of seven configurations. Here, negative fin angles correspond to fins aligned opposite to the direction of wheel rotation, analogous to a backward-curved fan, while positive fin angles indicate alignment with the direction of rotation, resembling a forward-curved fan, as shown in Figure 3. In all configurations, 120 fins (for both the left and right sidewall) were uniformly placed along the tire sidewall.

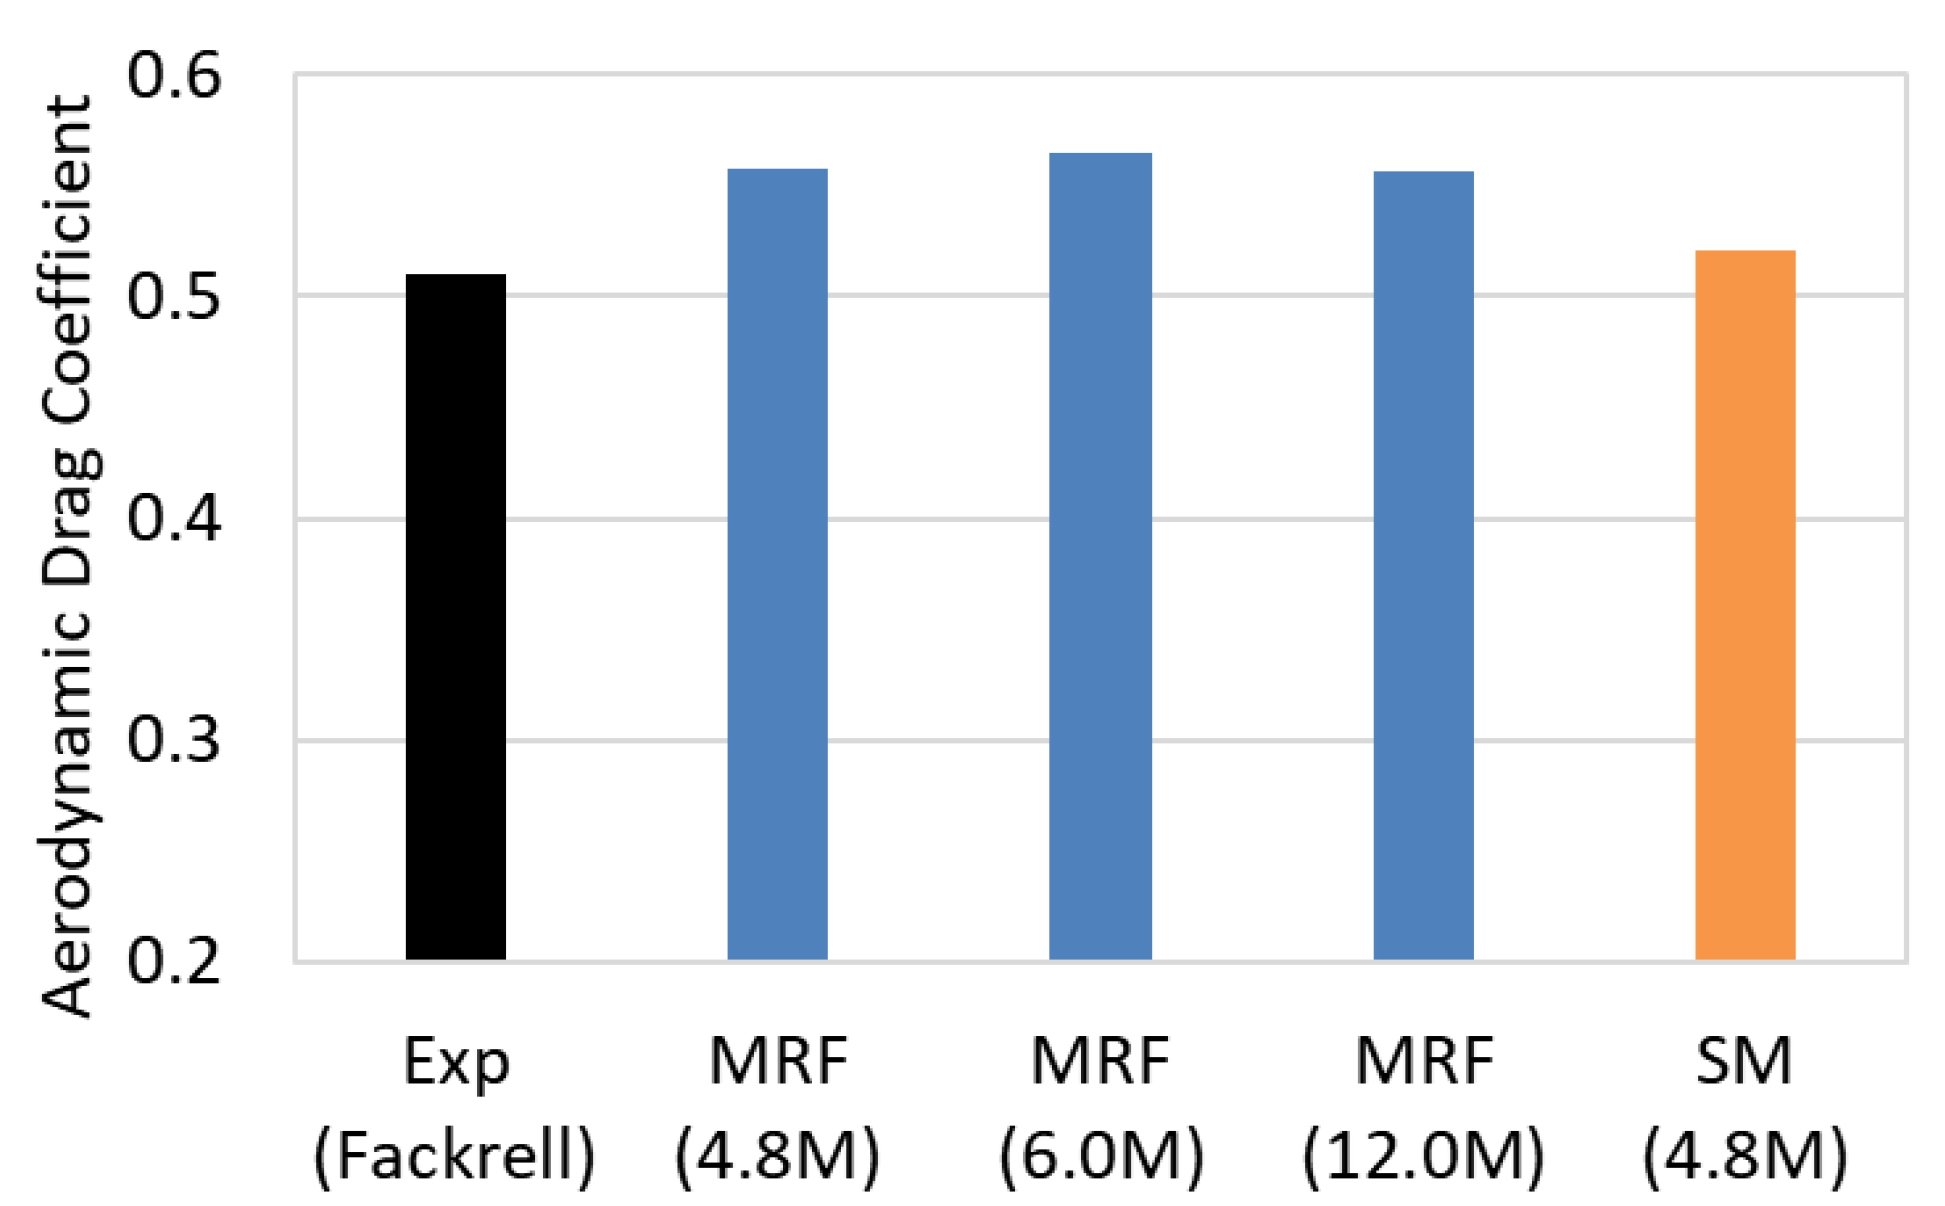
2.2. Numerical Method

In this study, Computational Fluid Dynamics (CFD) simulations were performed to investigate the complex flow behavior and heat dissipation characteristics associated with tire sidewall cooling fins. For this purpose, commercial CFD software, ANSYS Fluent V2023R1 [19], was used to conduct coupled aerodynamic and thermal simulations.
The governing equations of flow were unsteady Reynolds-averaged Navier–Stokes (uRANS) equations [19]. The SST kω turbulence model was used due to its superior performance under the influence of strong adverse pressure gradients and flow separation phenomena frequently encountered in rotating systems [4,15,20,21,22,23,24]. In addition, this model is also well-suited for convective heat transfer analysis, as it provides an accurate resolution of thermal boundary layers near solid surfaces [1,4,5,6].
Spatial discretization was performed using a second-order upwind scheme combined with the Green–Gauss node-based gradient method, and a fully coupled algorithm was used to couple velocity and pressure in an incompressible flow field. To accurately analyze the unsteady aerodynamic effects induced by tire rotation, the sliding mesh (SM) technique was employed. This technique allows for precise modeling of the transient interaction between the rotating geometry and the surrounding flow field by accounting for the physical rotation of the tire mesh. The rotational speed of the tire was set to 50.24 rad/s (480 rpm). Considering the tire’s diameter (D = 0.637 m), we set the corresponding freestream velocity to 16 m/s (48 km/h). To replicate realistic road conditions, the ground was modeled using a moving wall boundary condition with a surface velocity matching the tire’s tangential speed. In transient simulations, the selection of an appropriate time step is critical to ensuring both numerical stability and computational efficiency. In this study, the time step (dt) was set to 0.00104 s, corresponding to a 3.0° rotation of the tire per time increment. A total of 50 inner iterations were performed at each time step to ensure sufficient convergence throughout the transient calculation. Details regarding the validation of the numerical methodology employed in this study are provided in the Appendix A.
The tire surface and the freestream temperatures were set to 80 °C and 26.85 °C, respectively, as boundary conditions for the energy equation. Heat dissipation performance was evaluated based on the average heat transfer coefficient (HTC) at the surface.

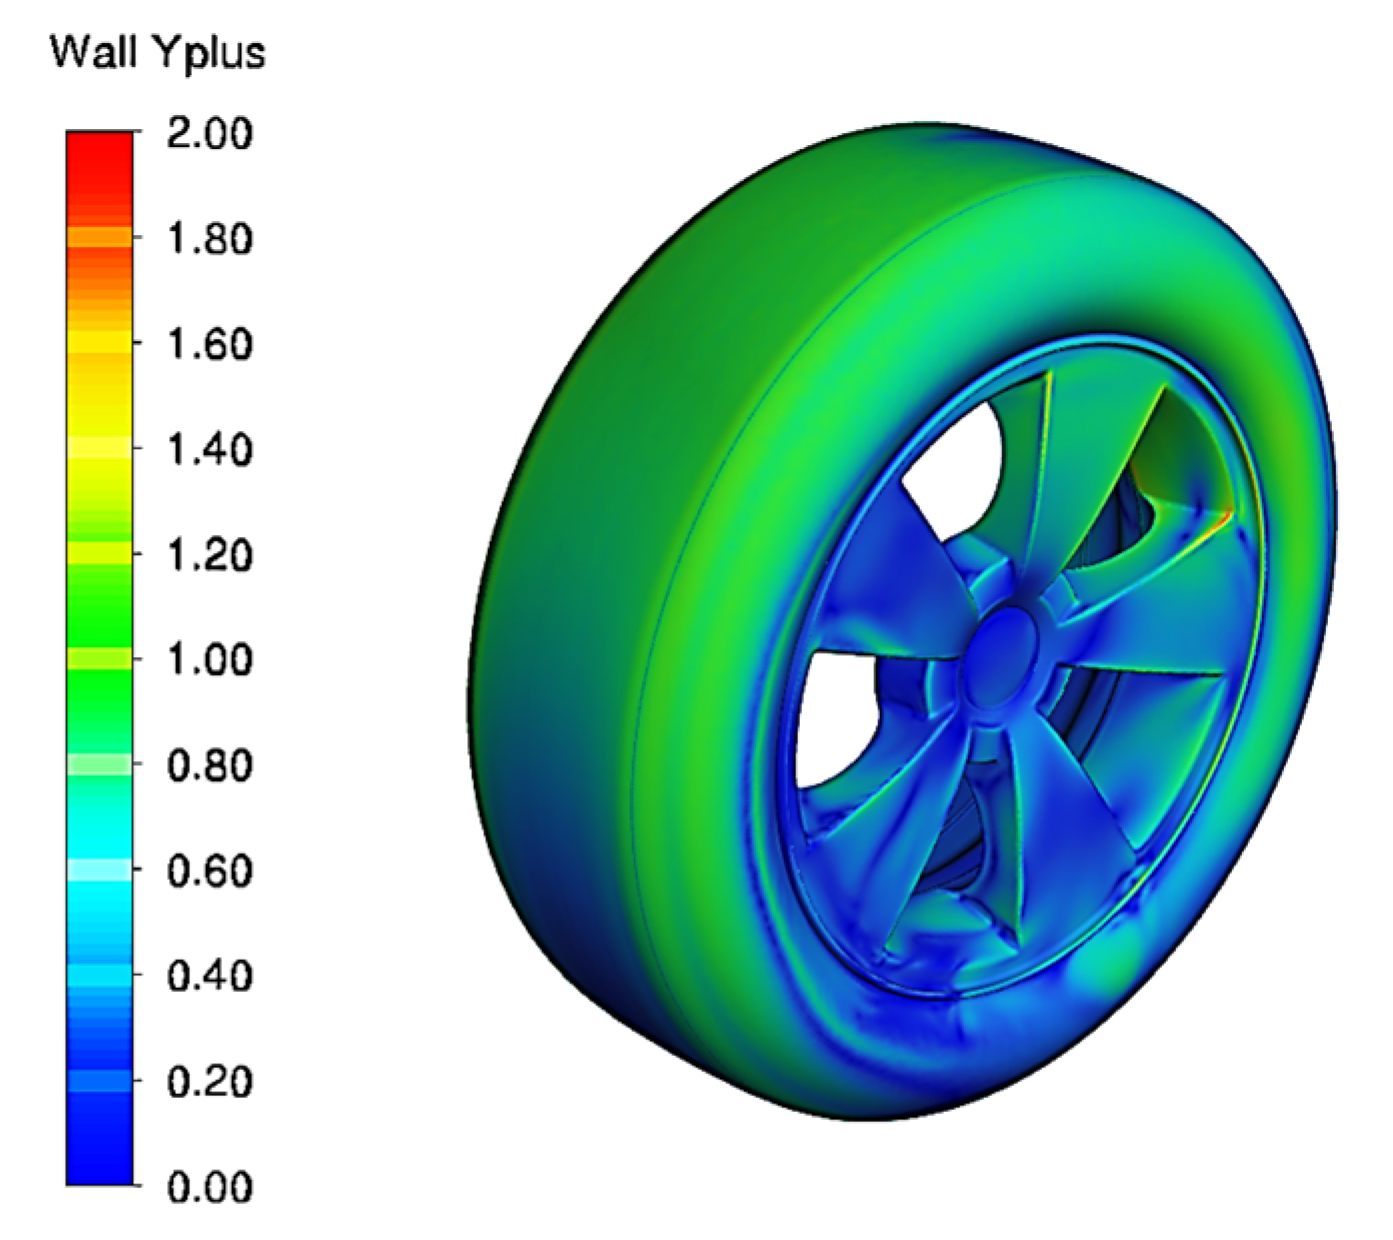
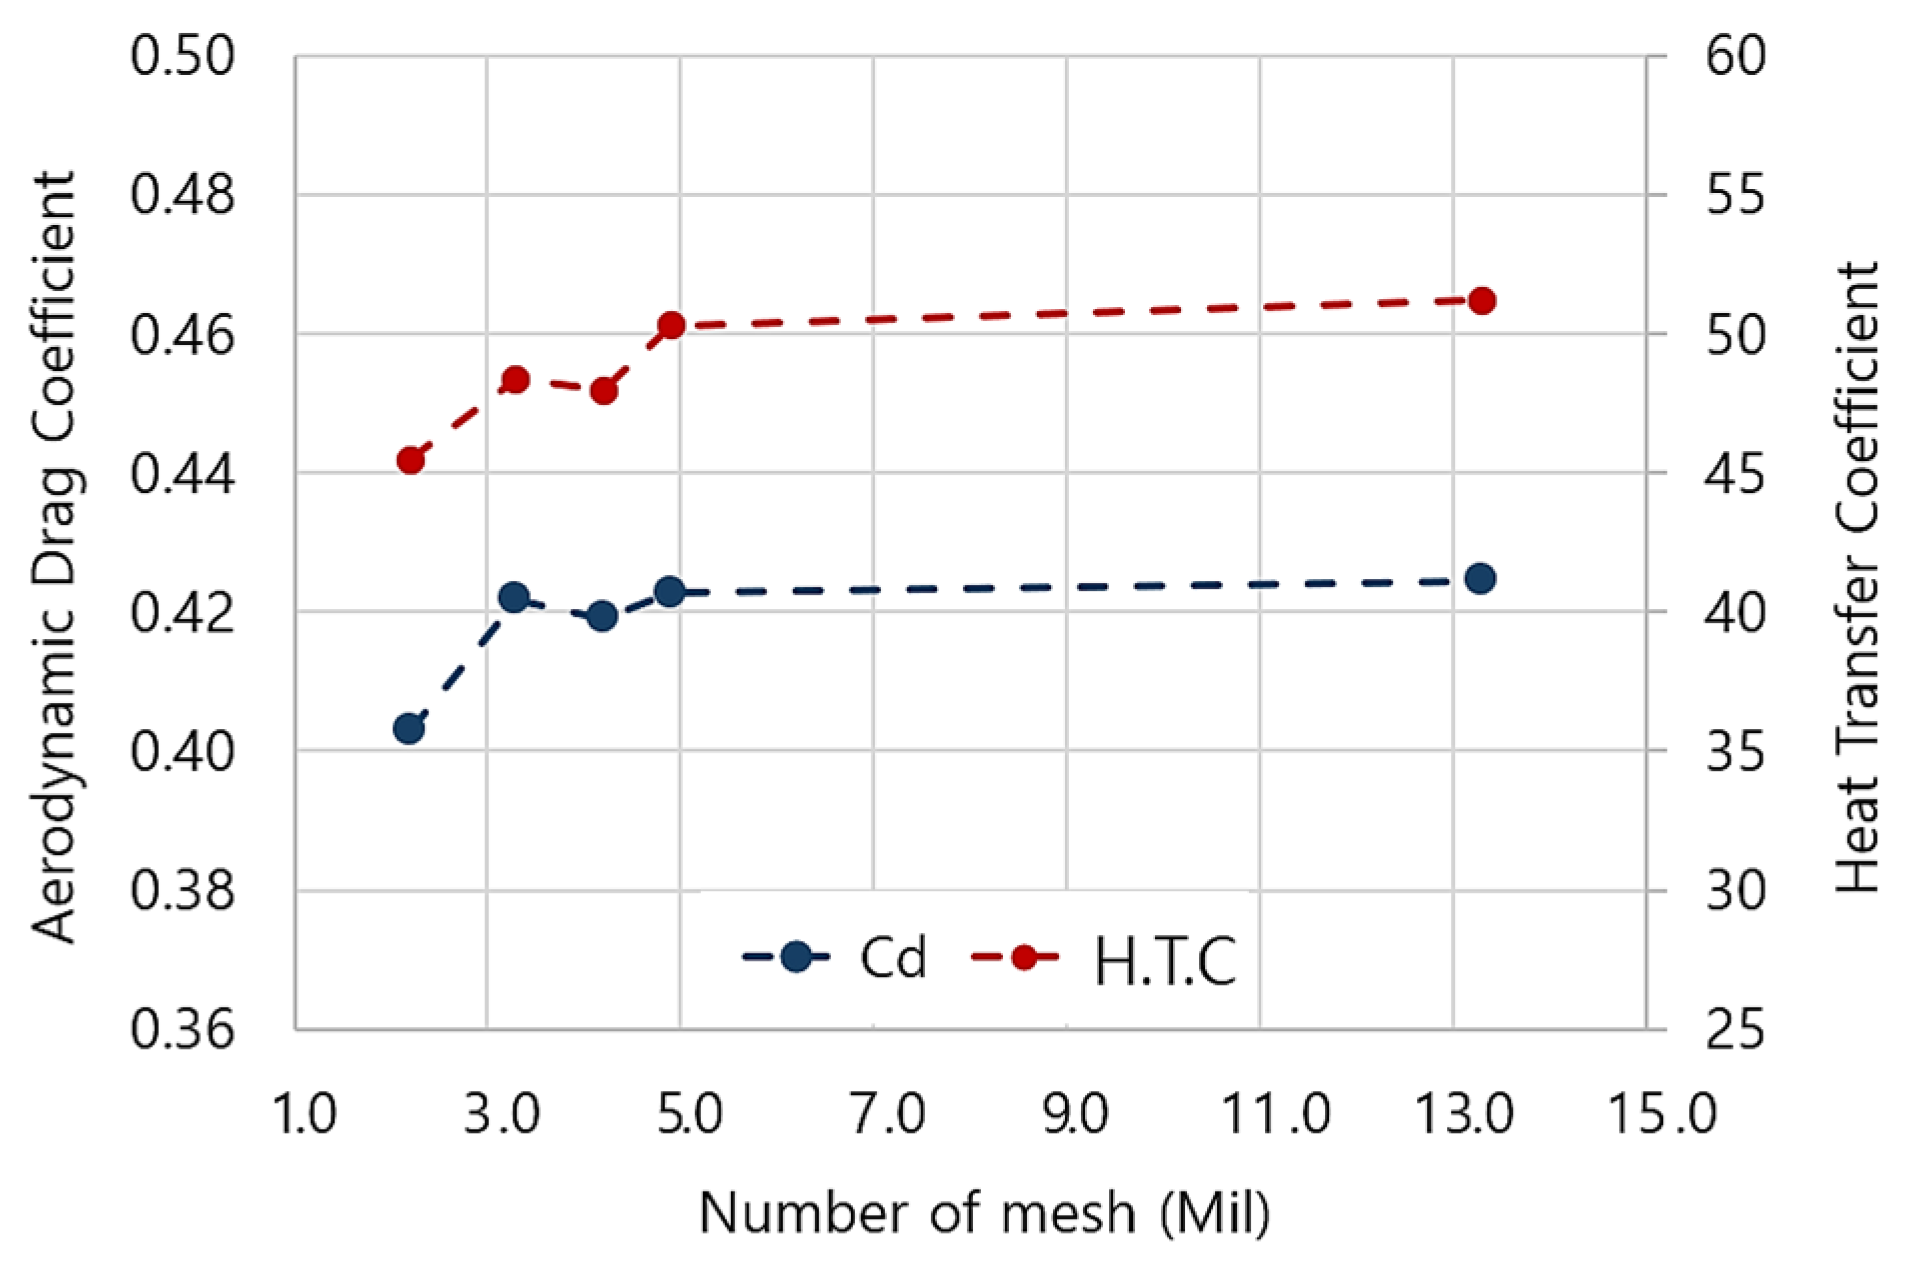
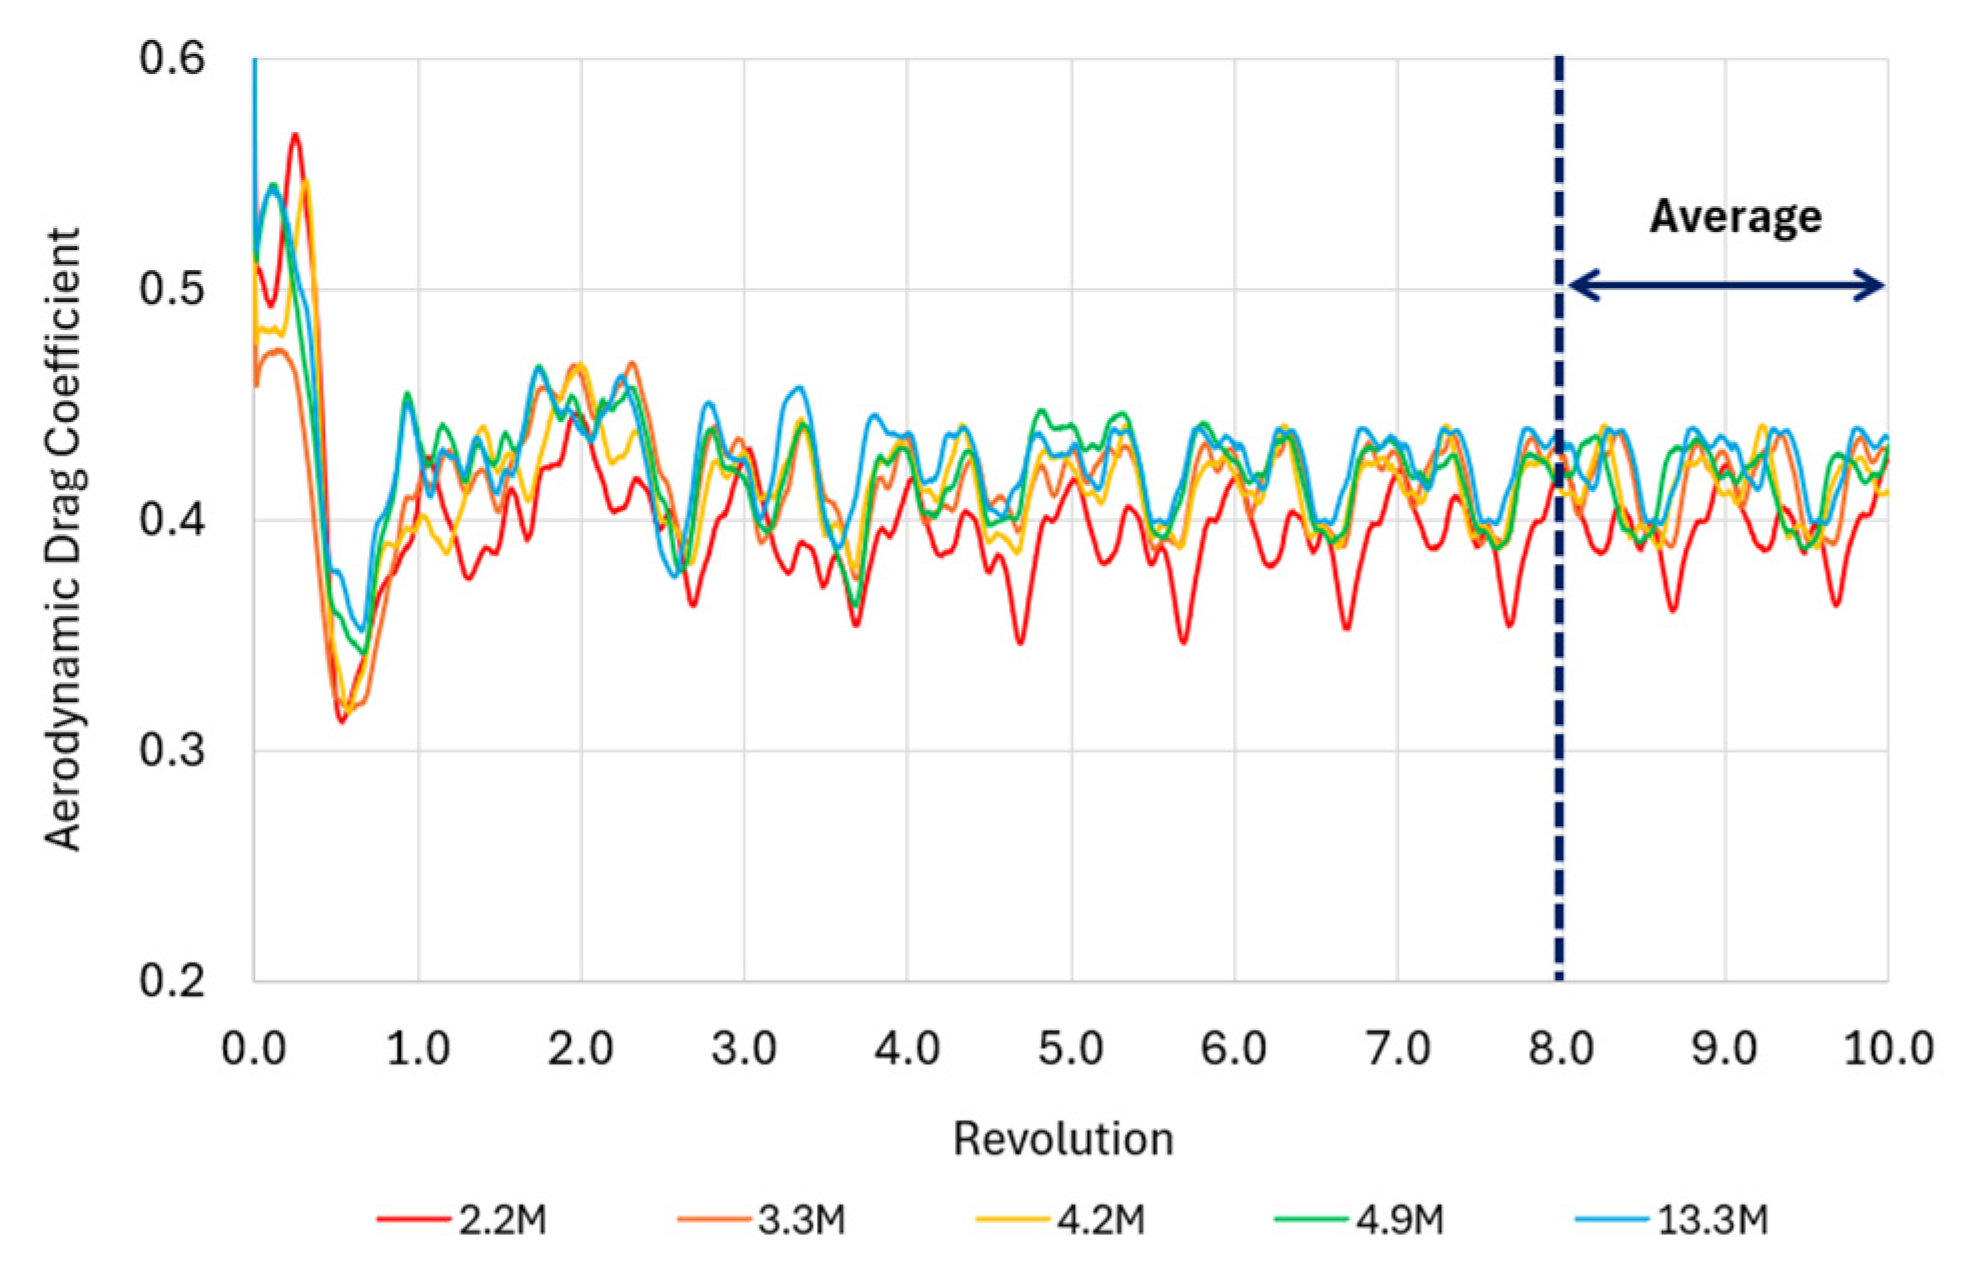
2.3. Mesh Generation and Mesh Sensitivity Analysis
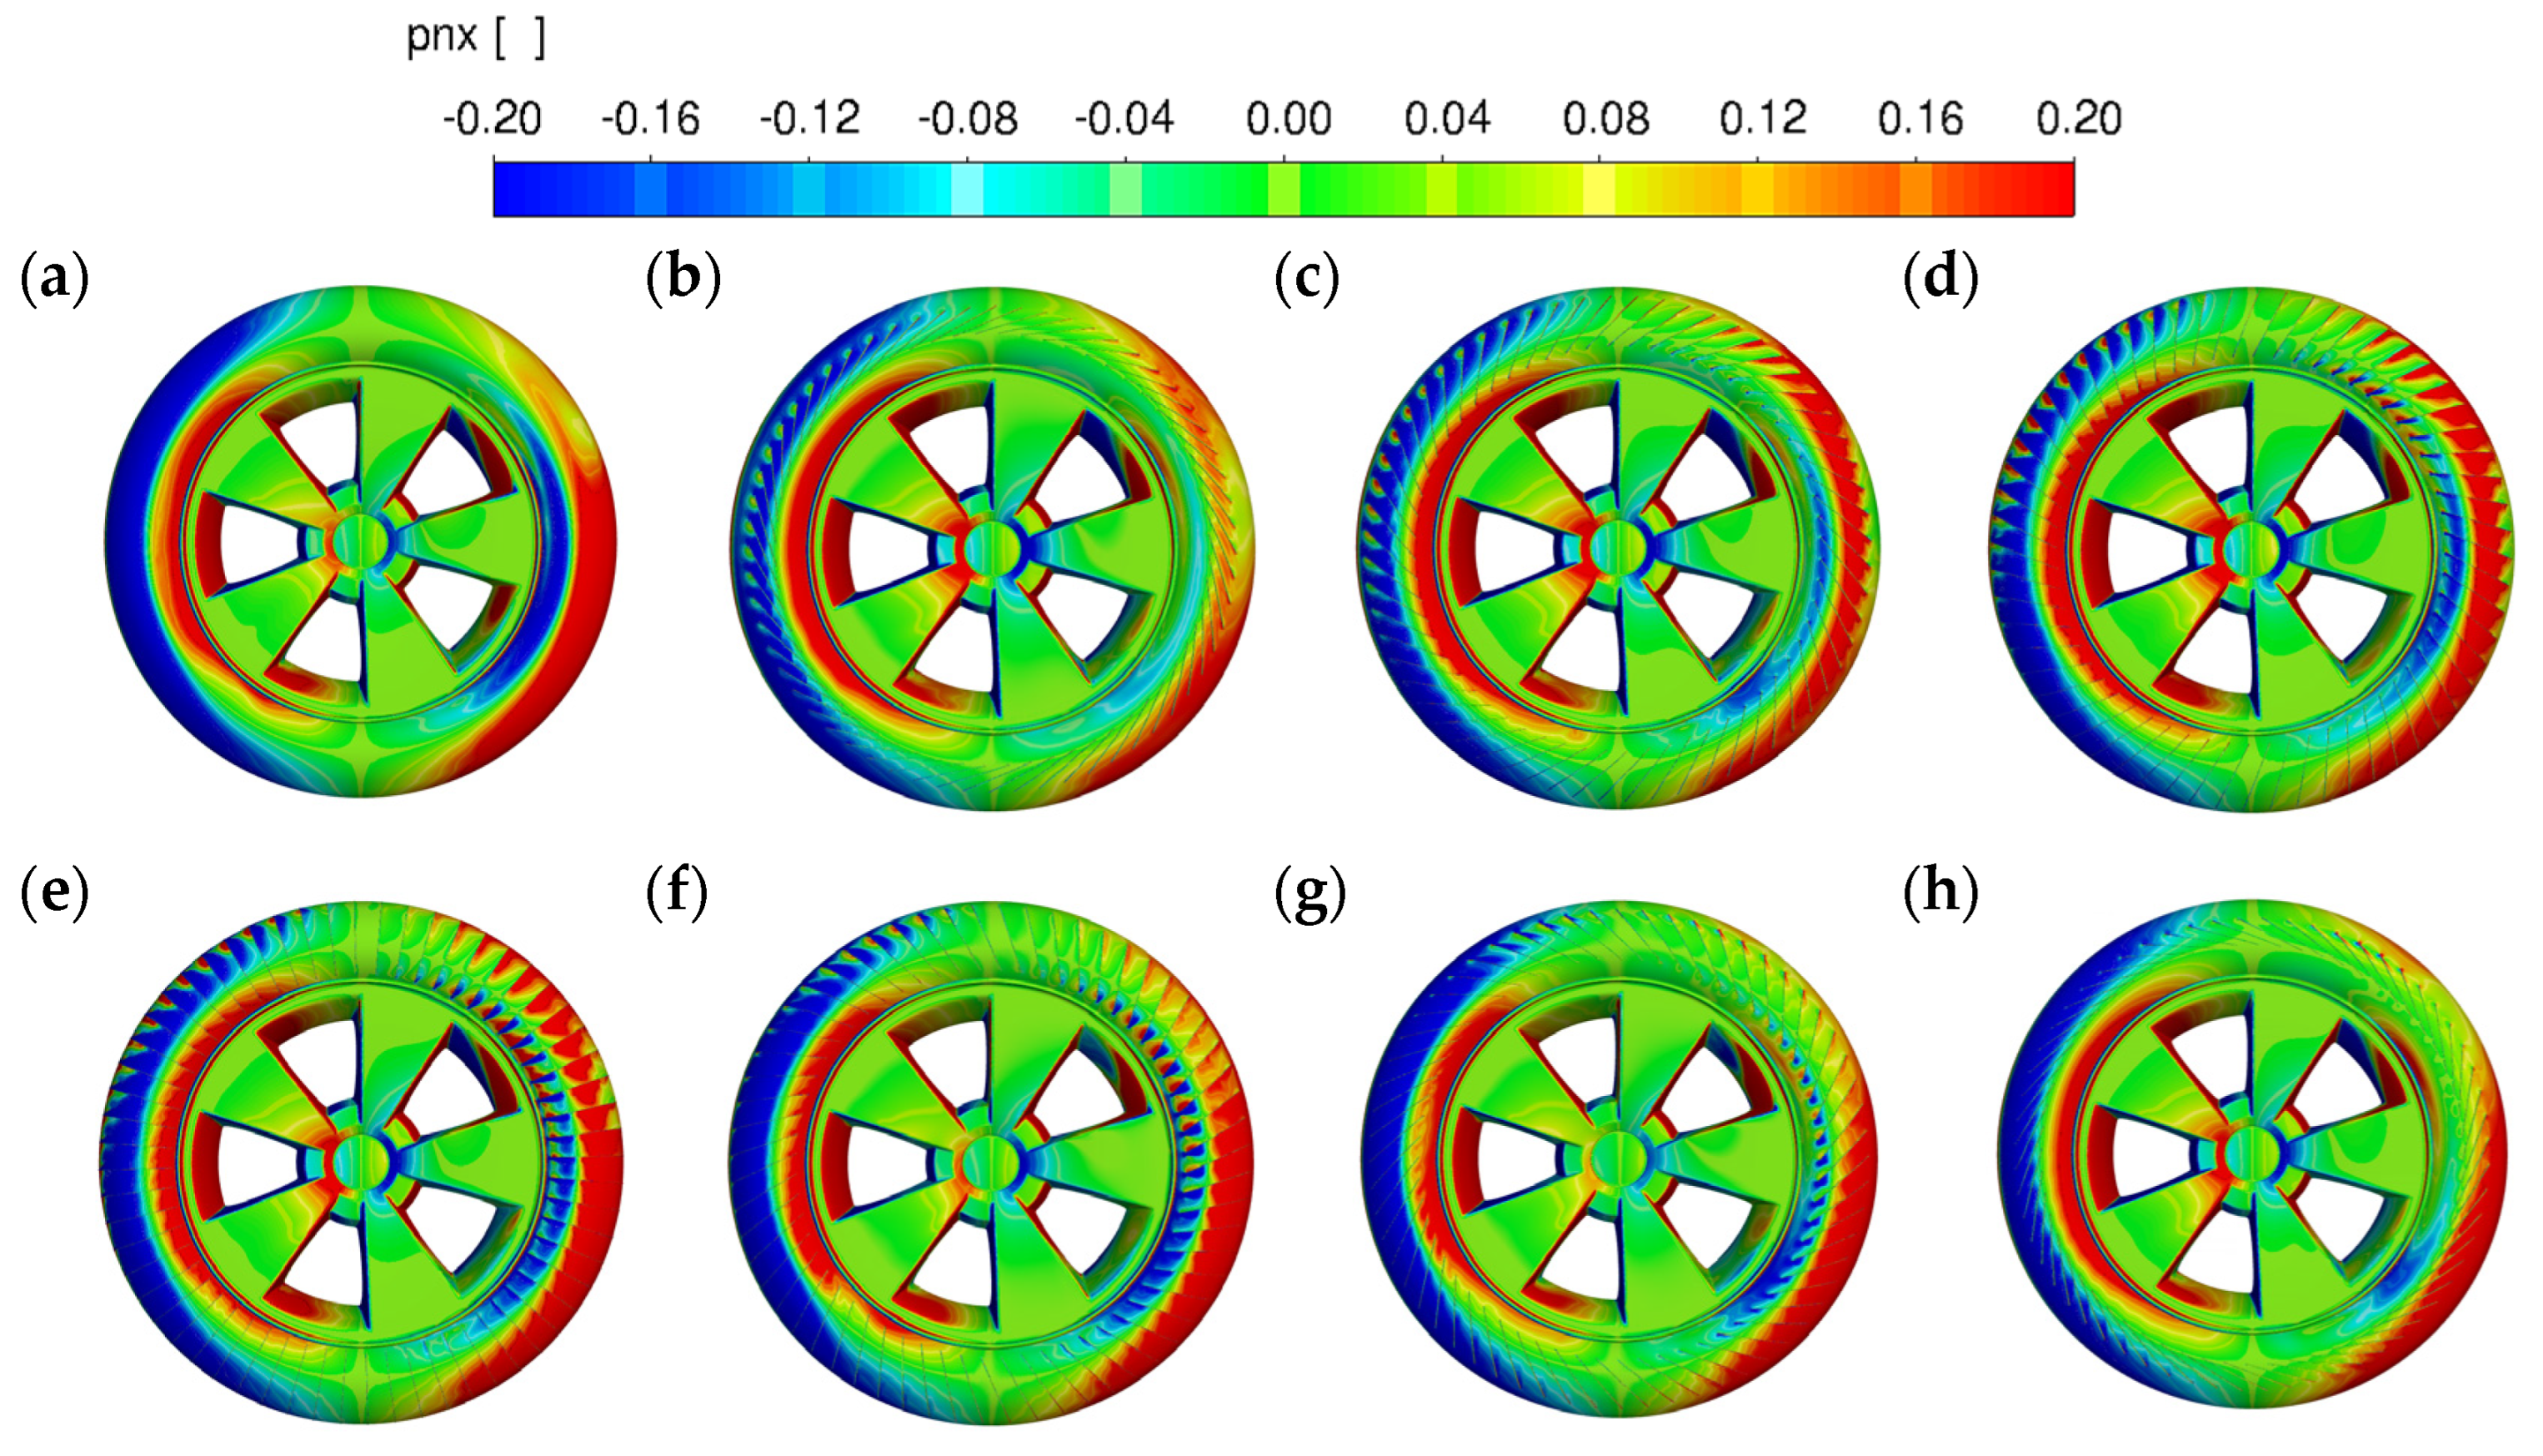
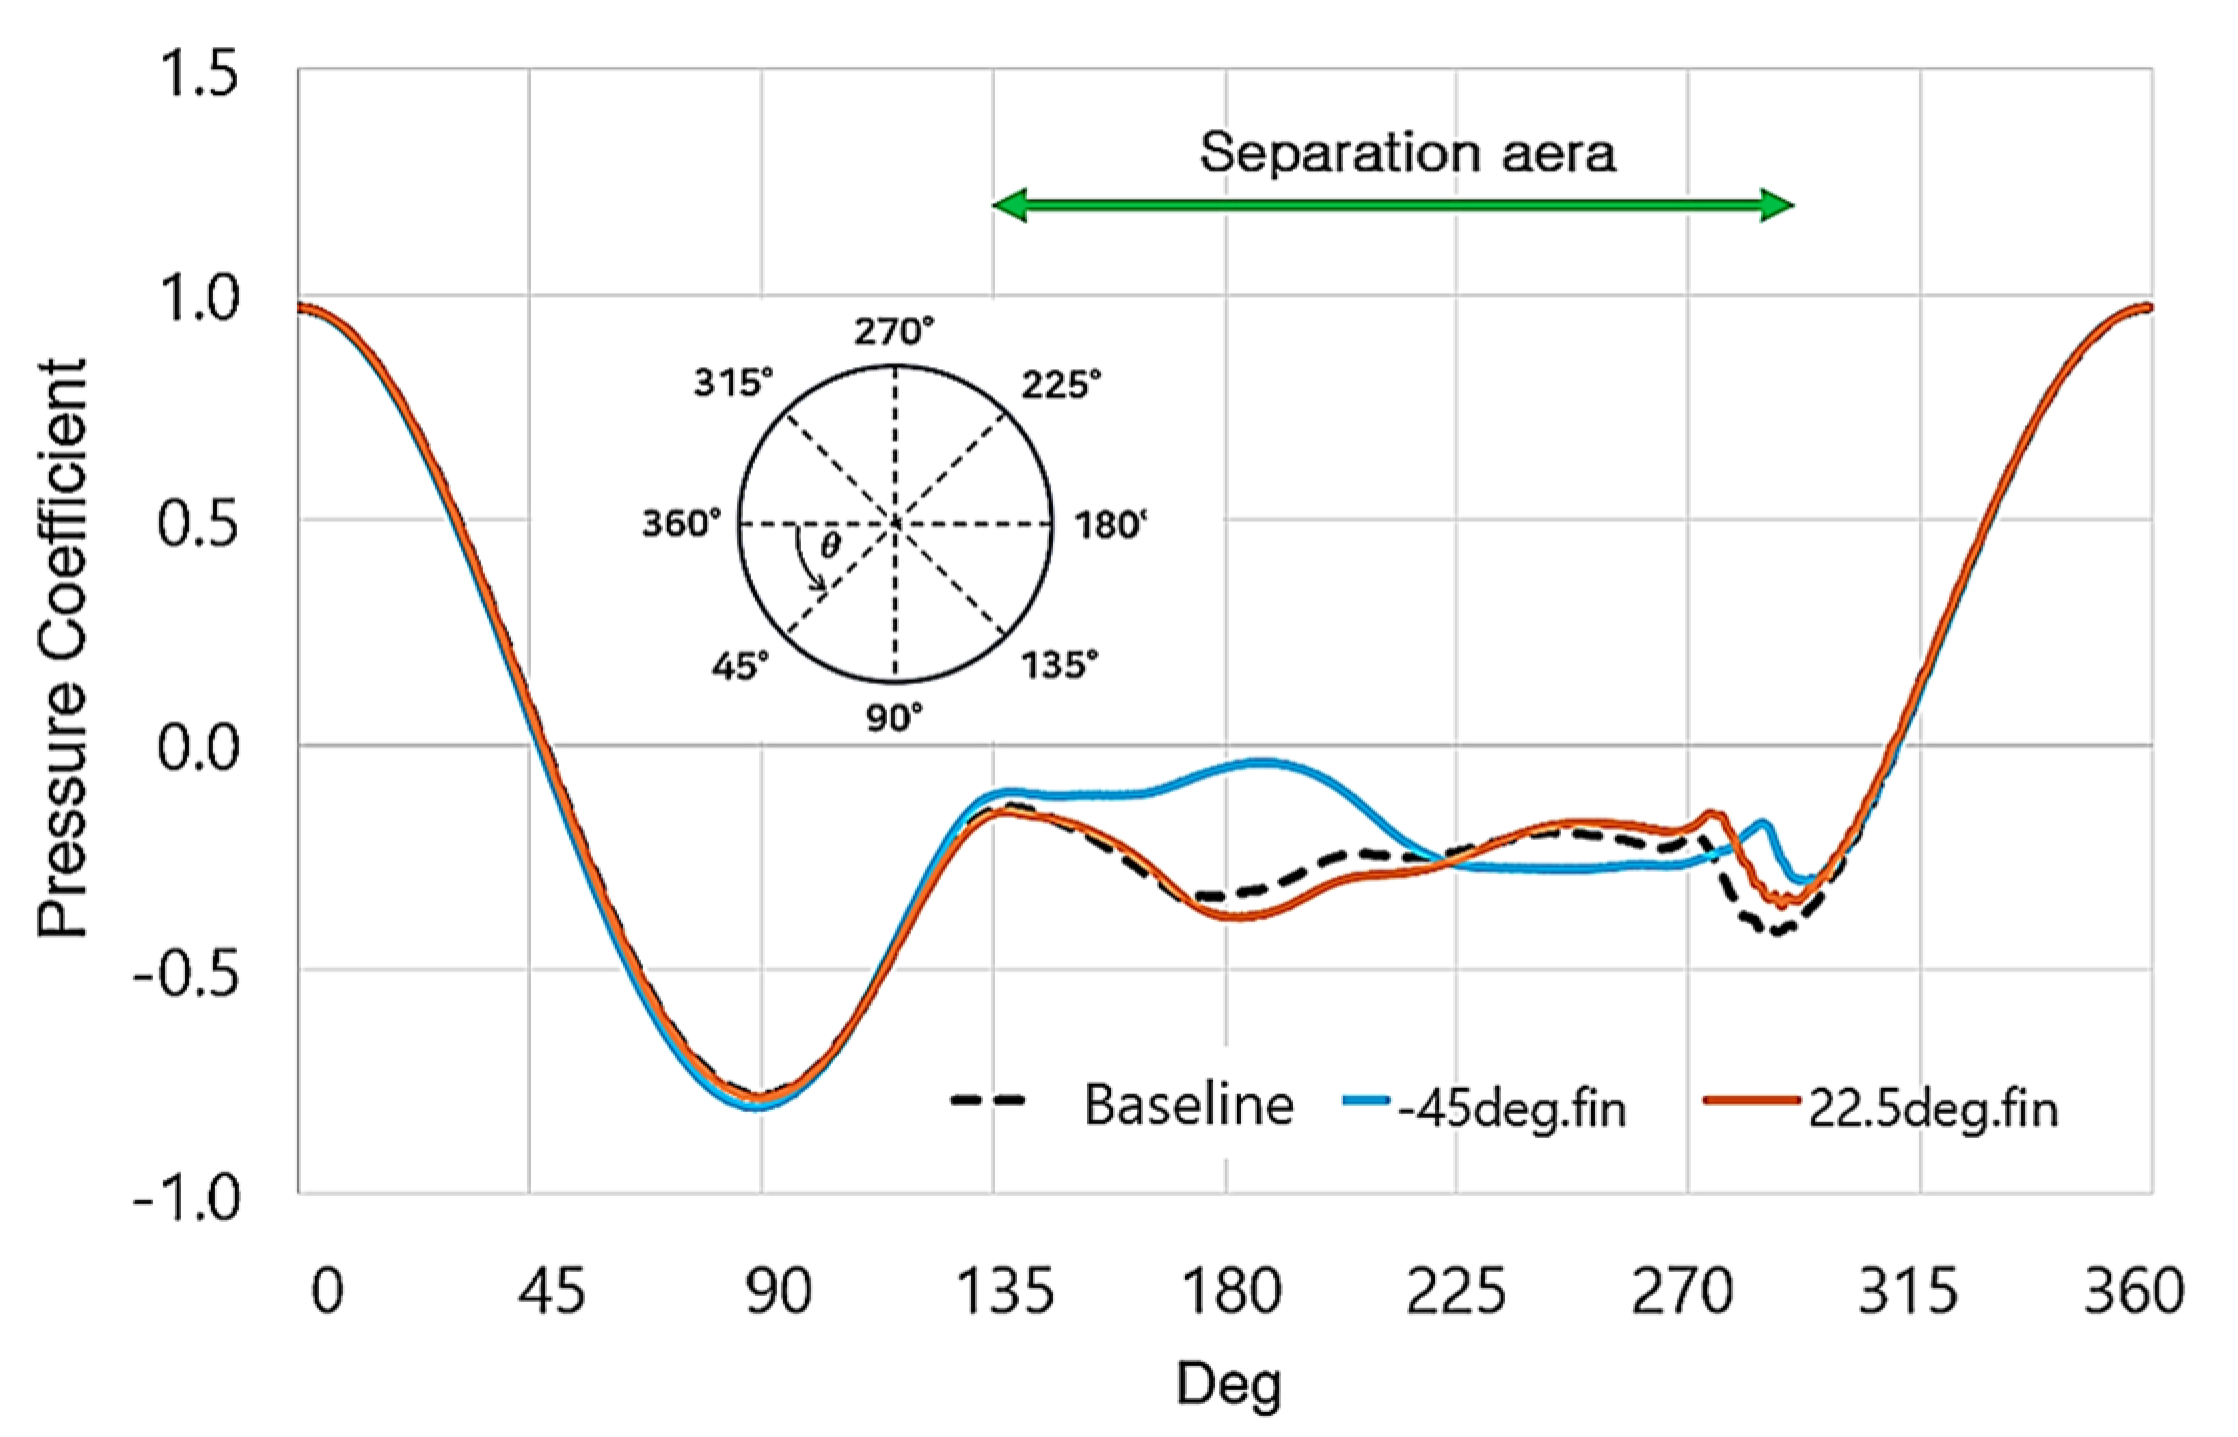
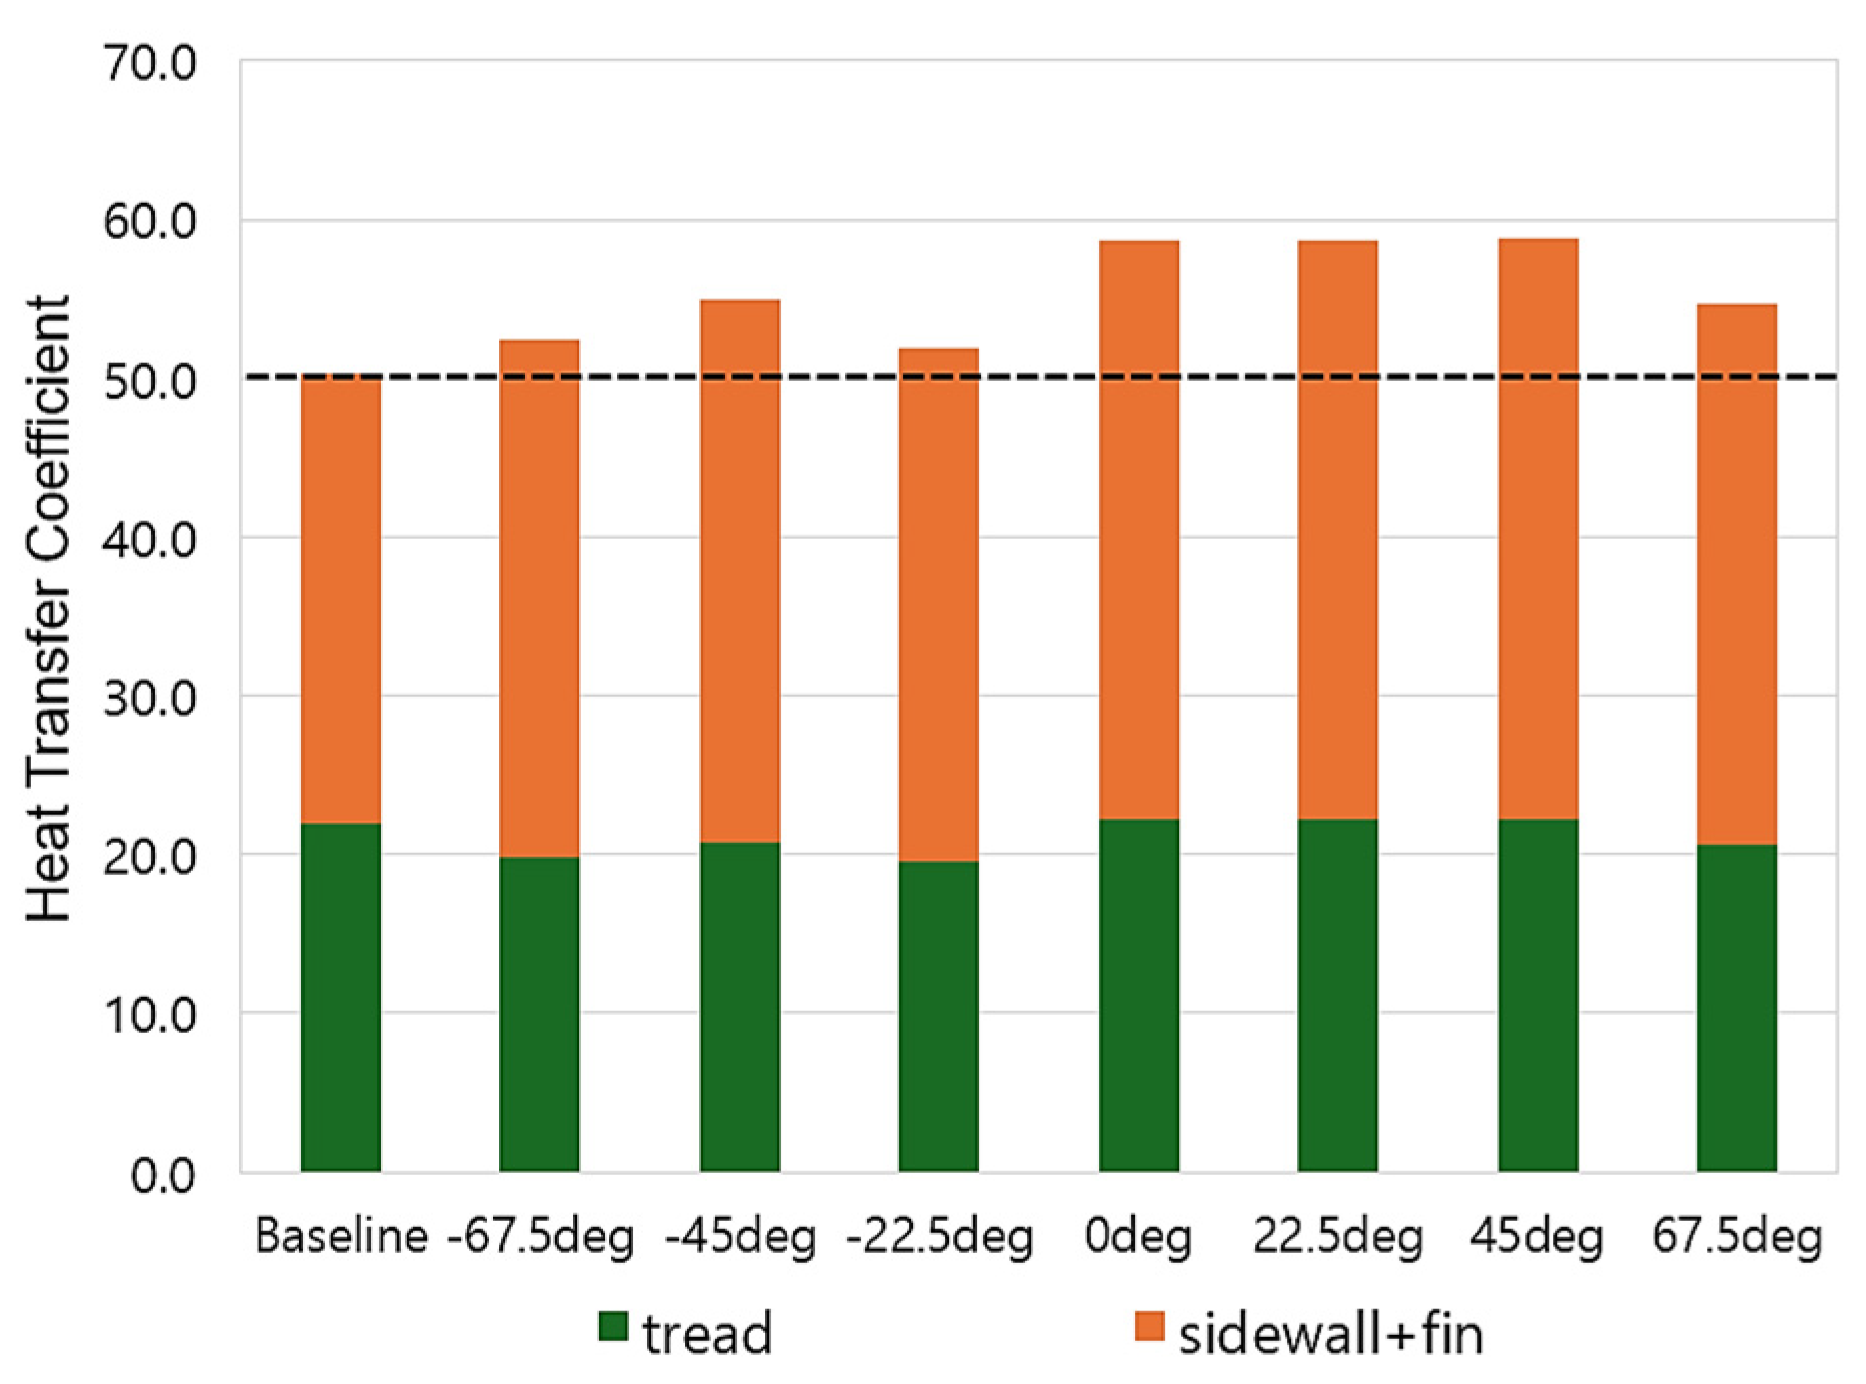
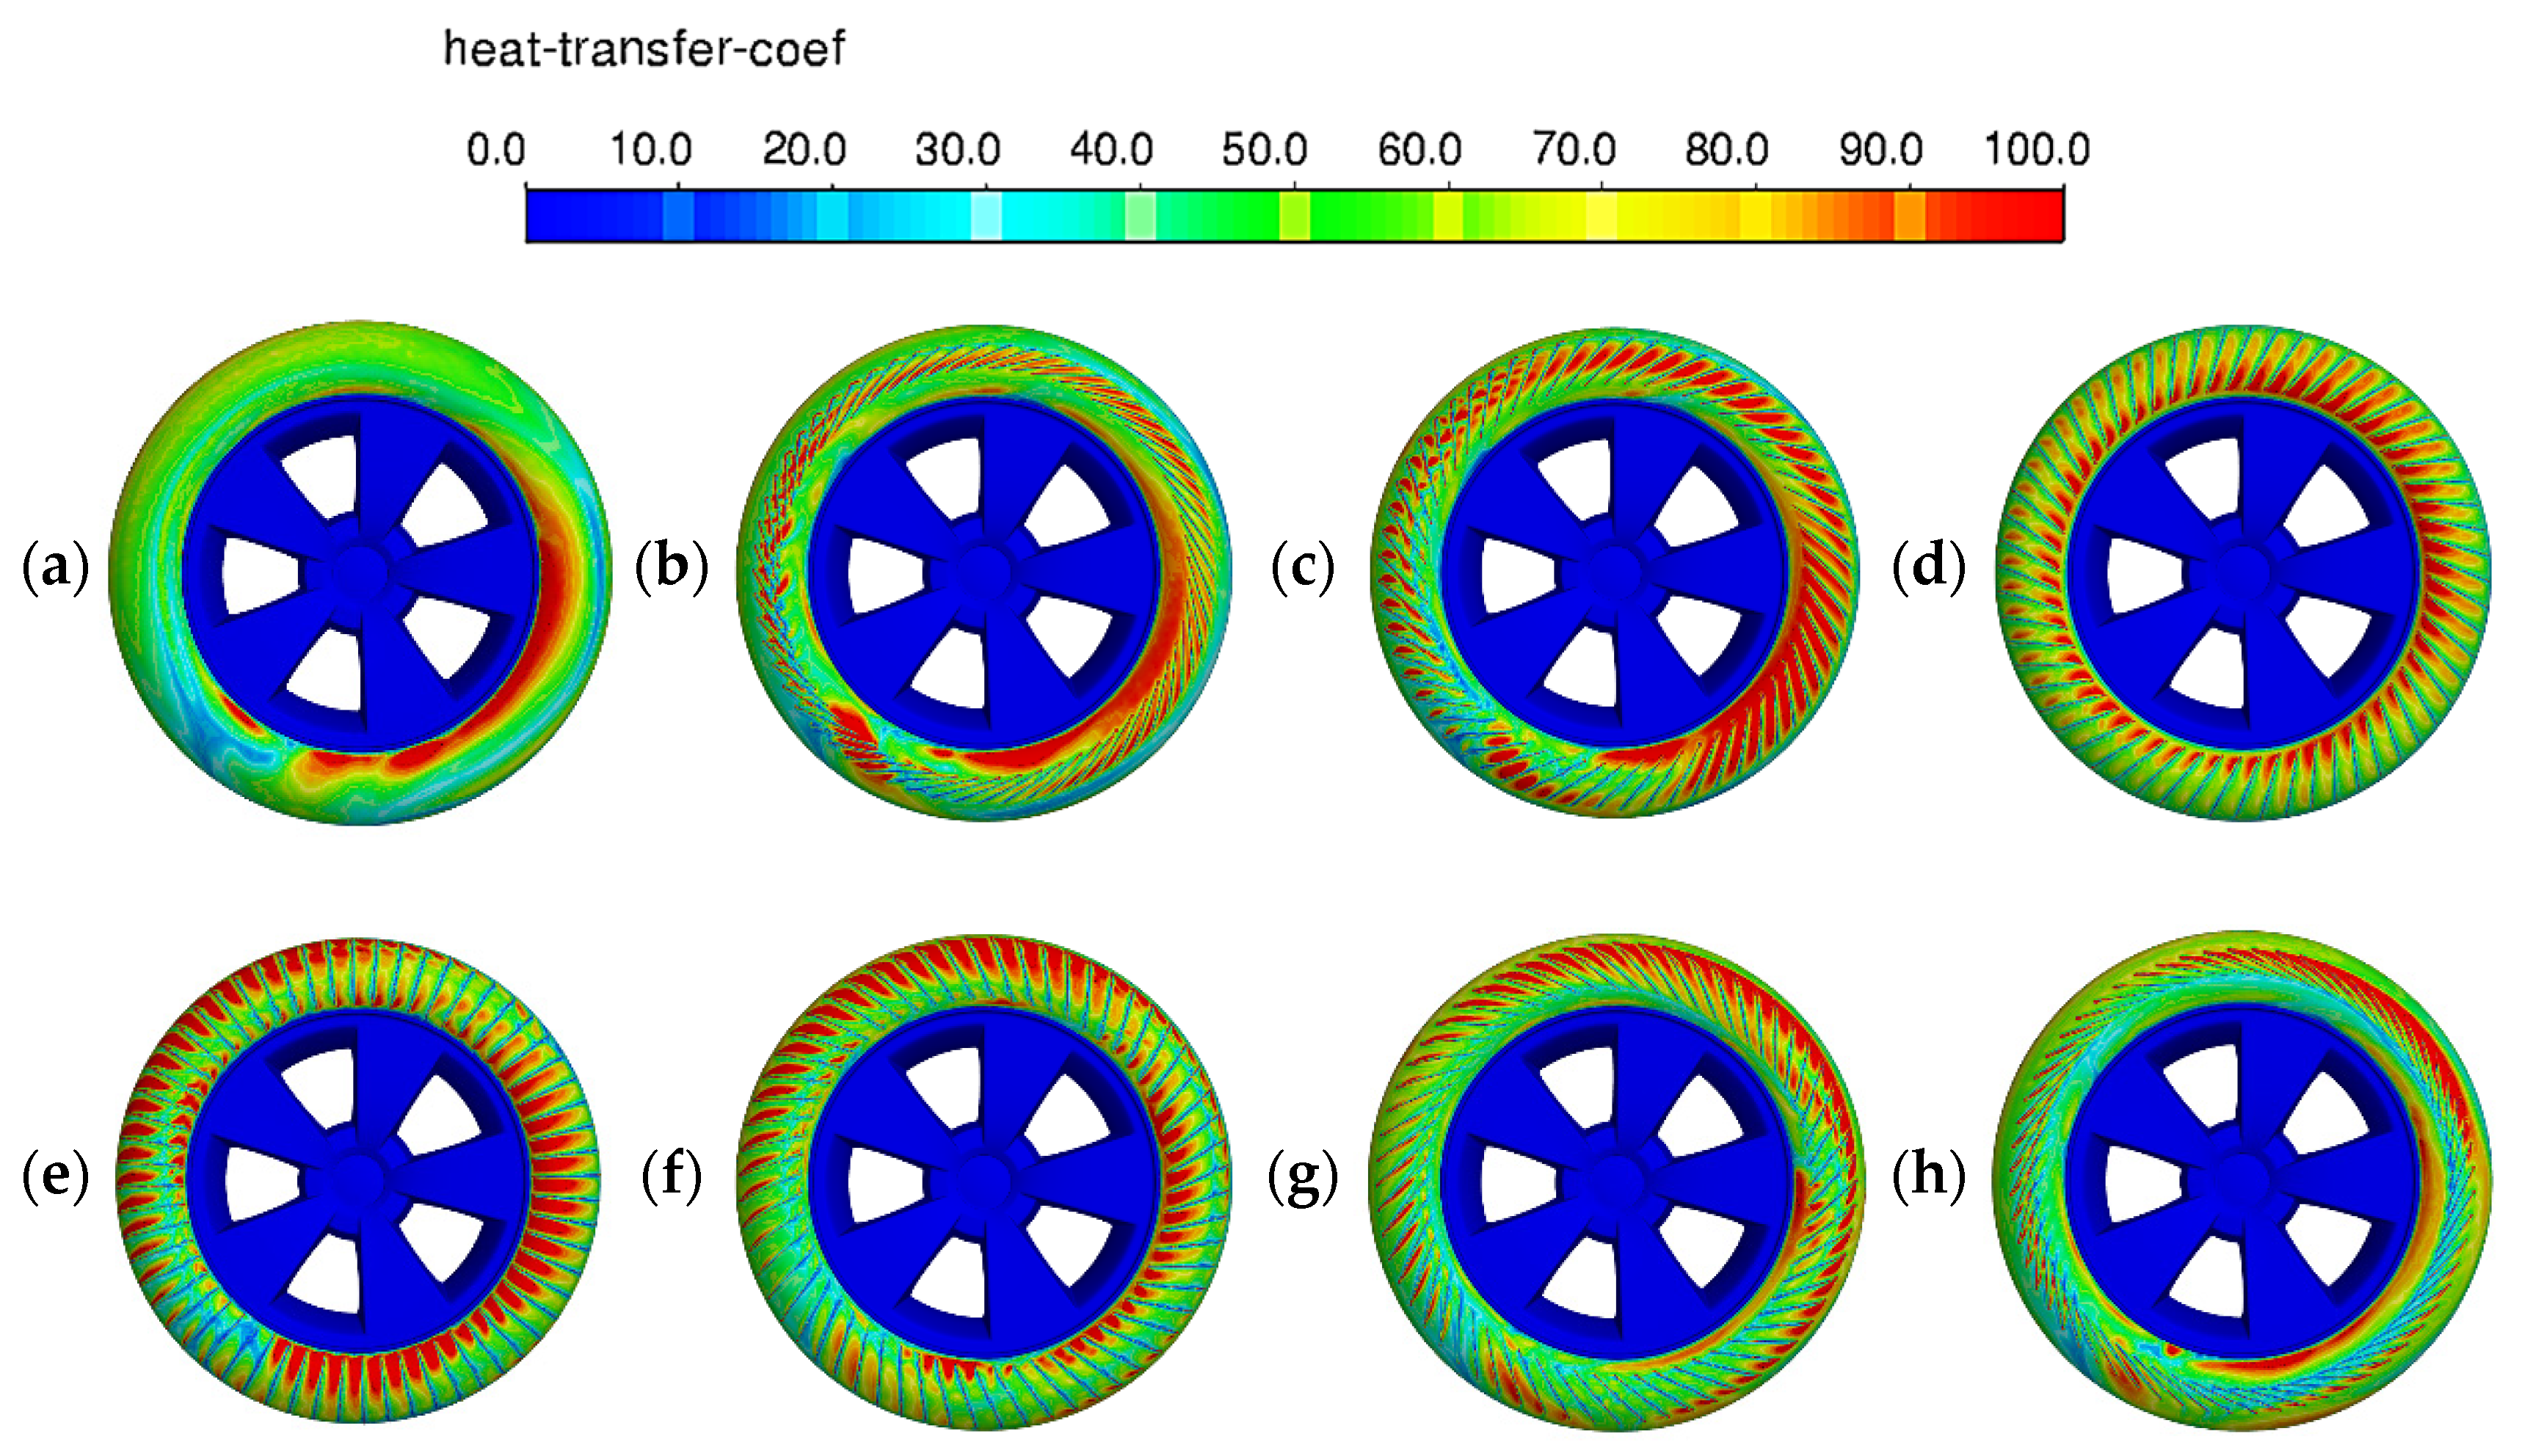
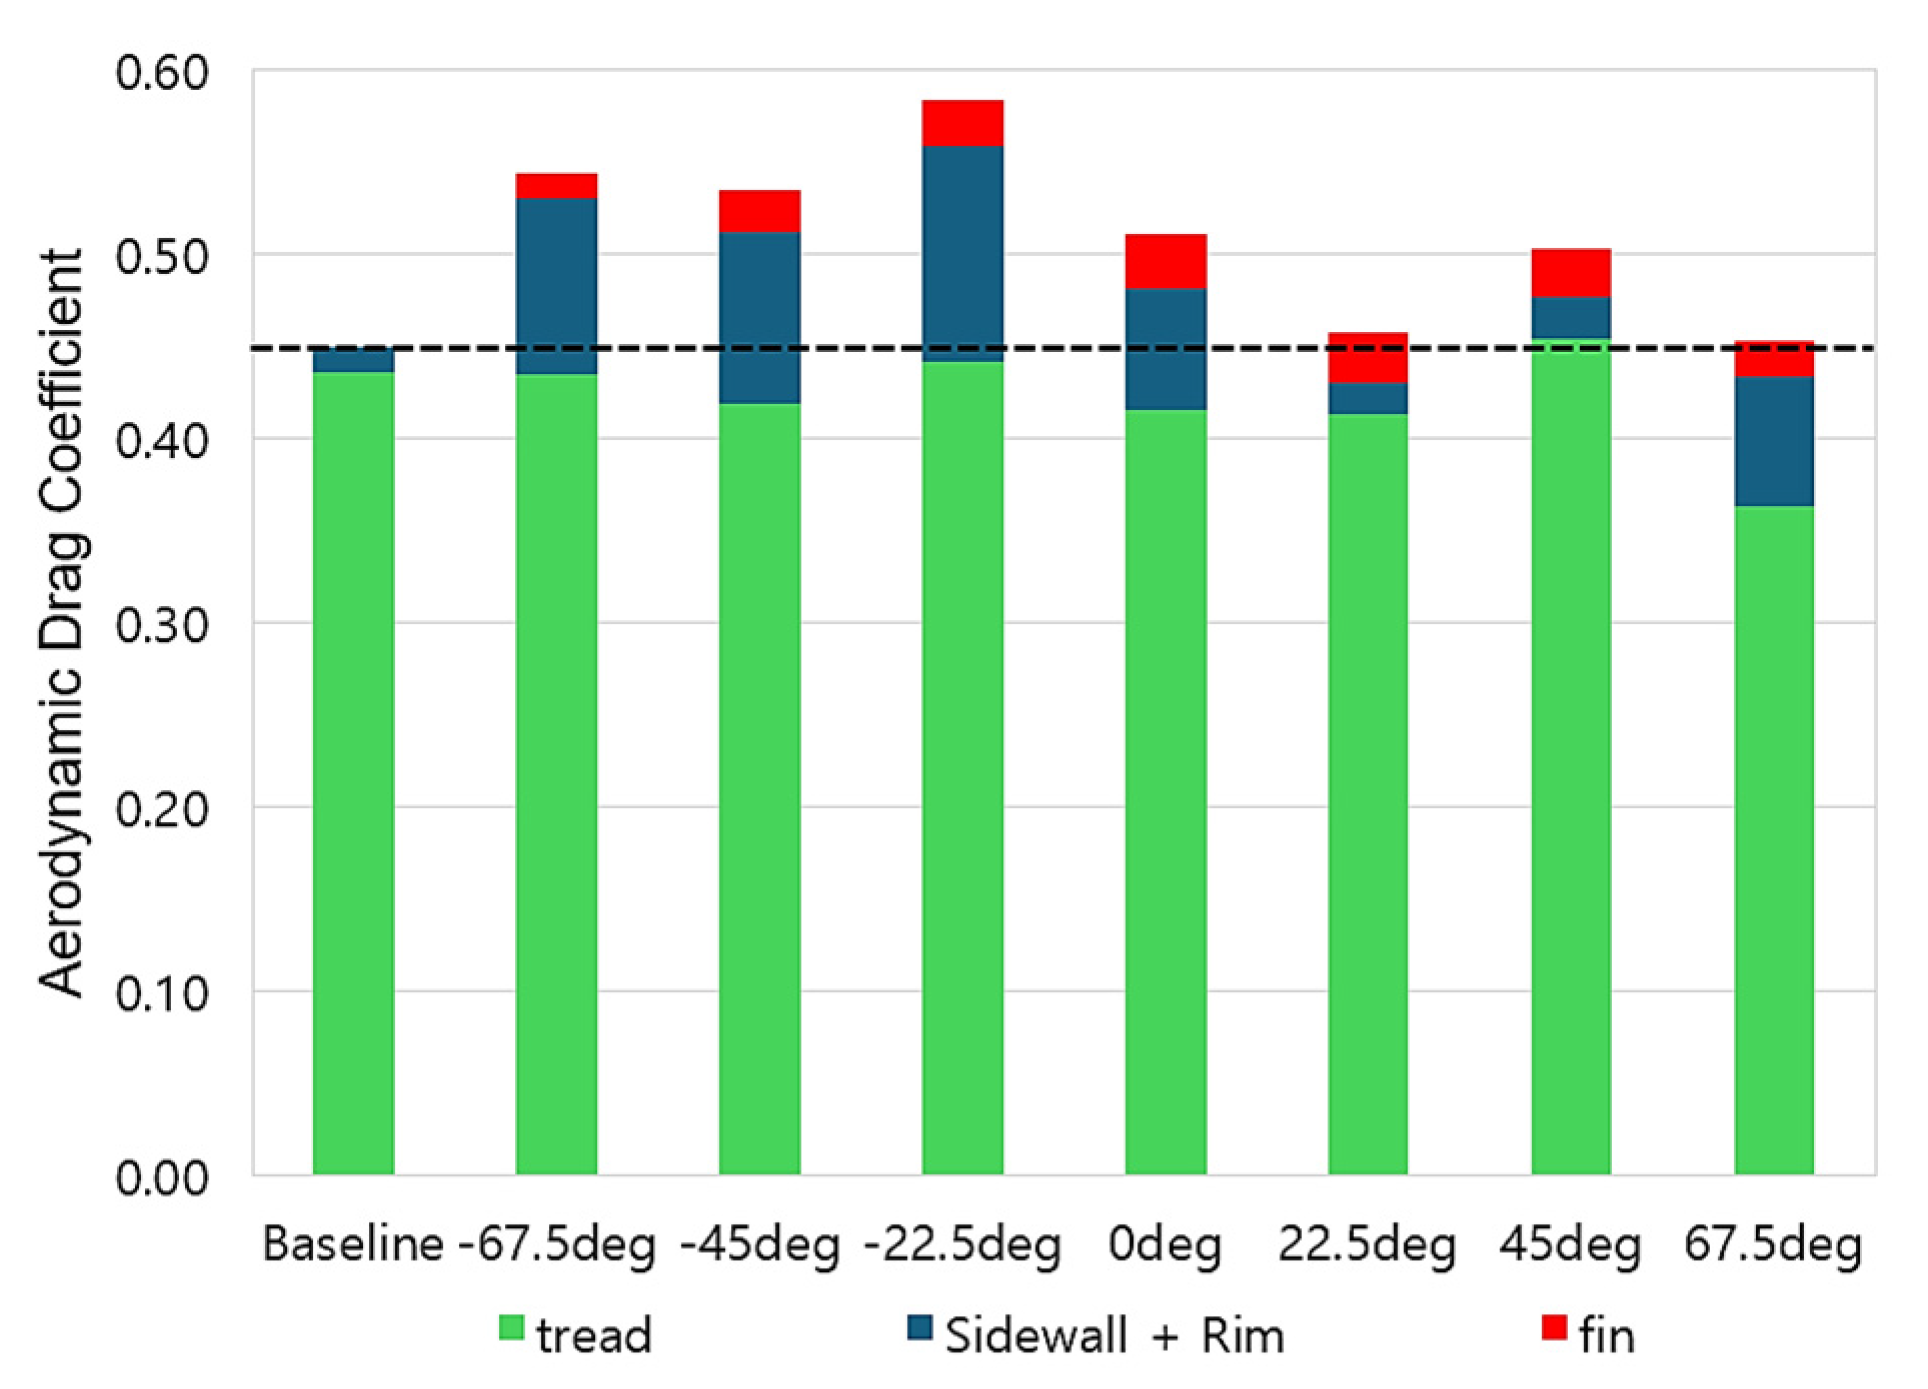
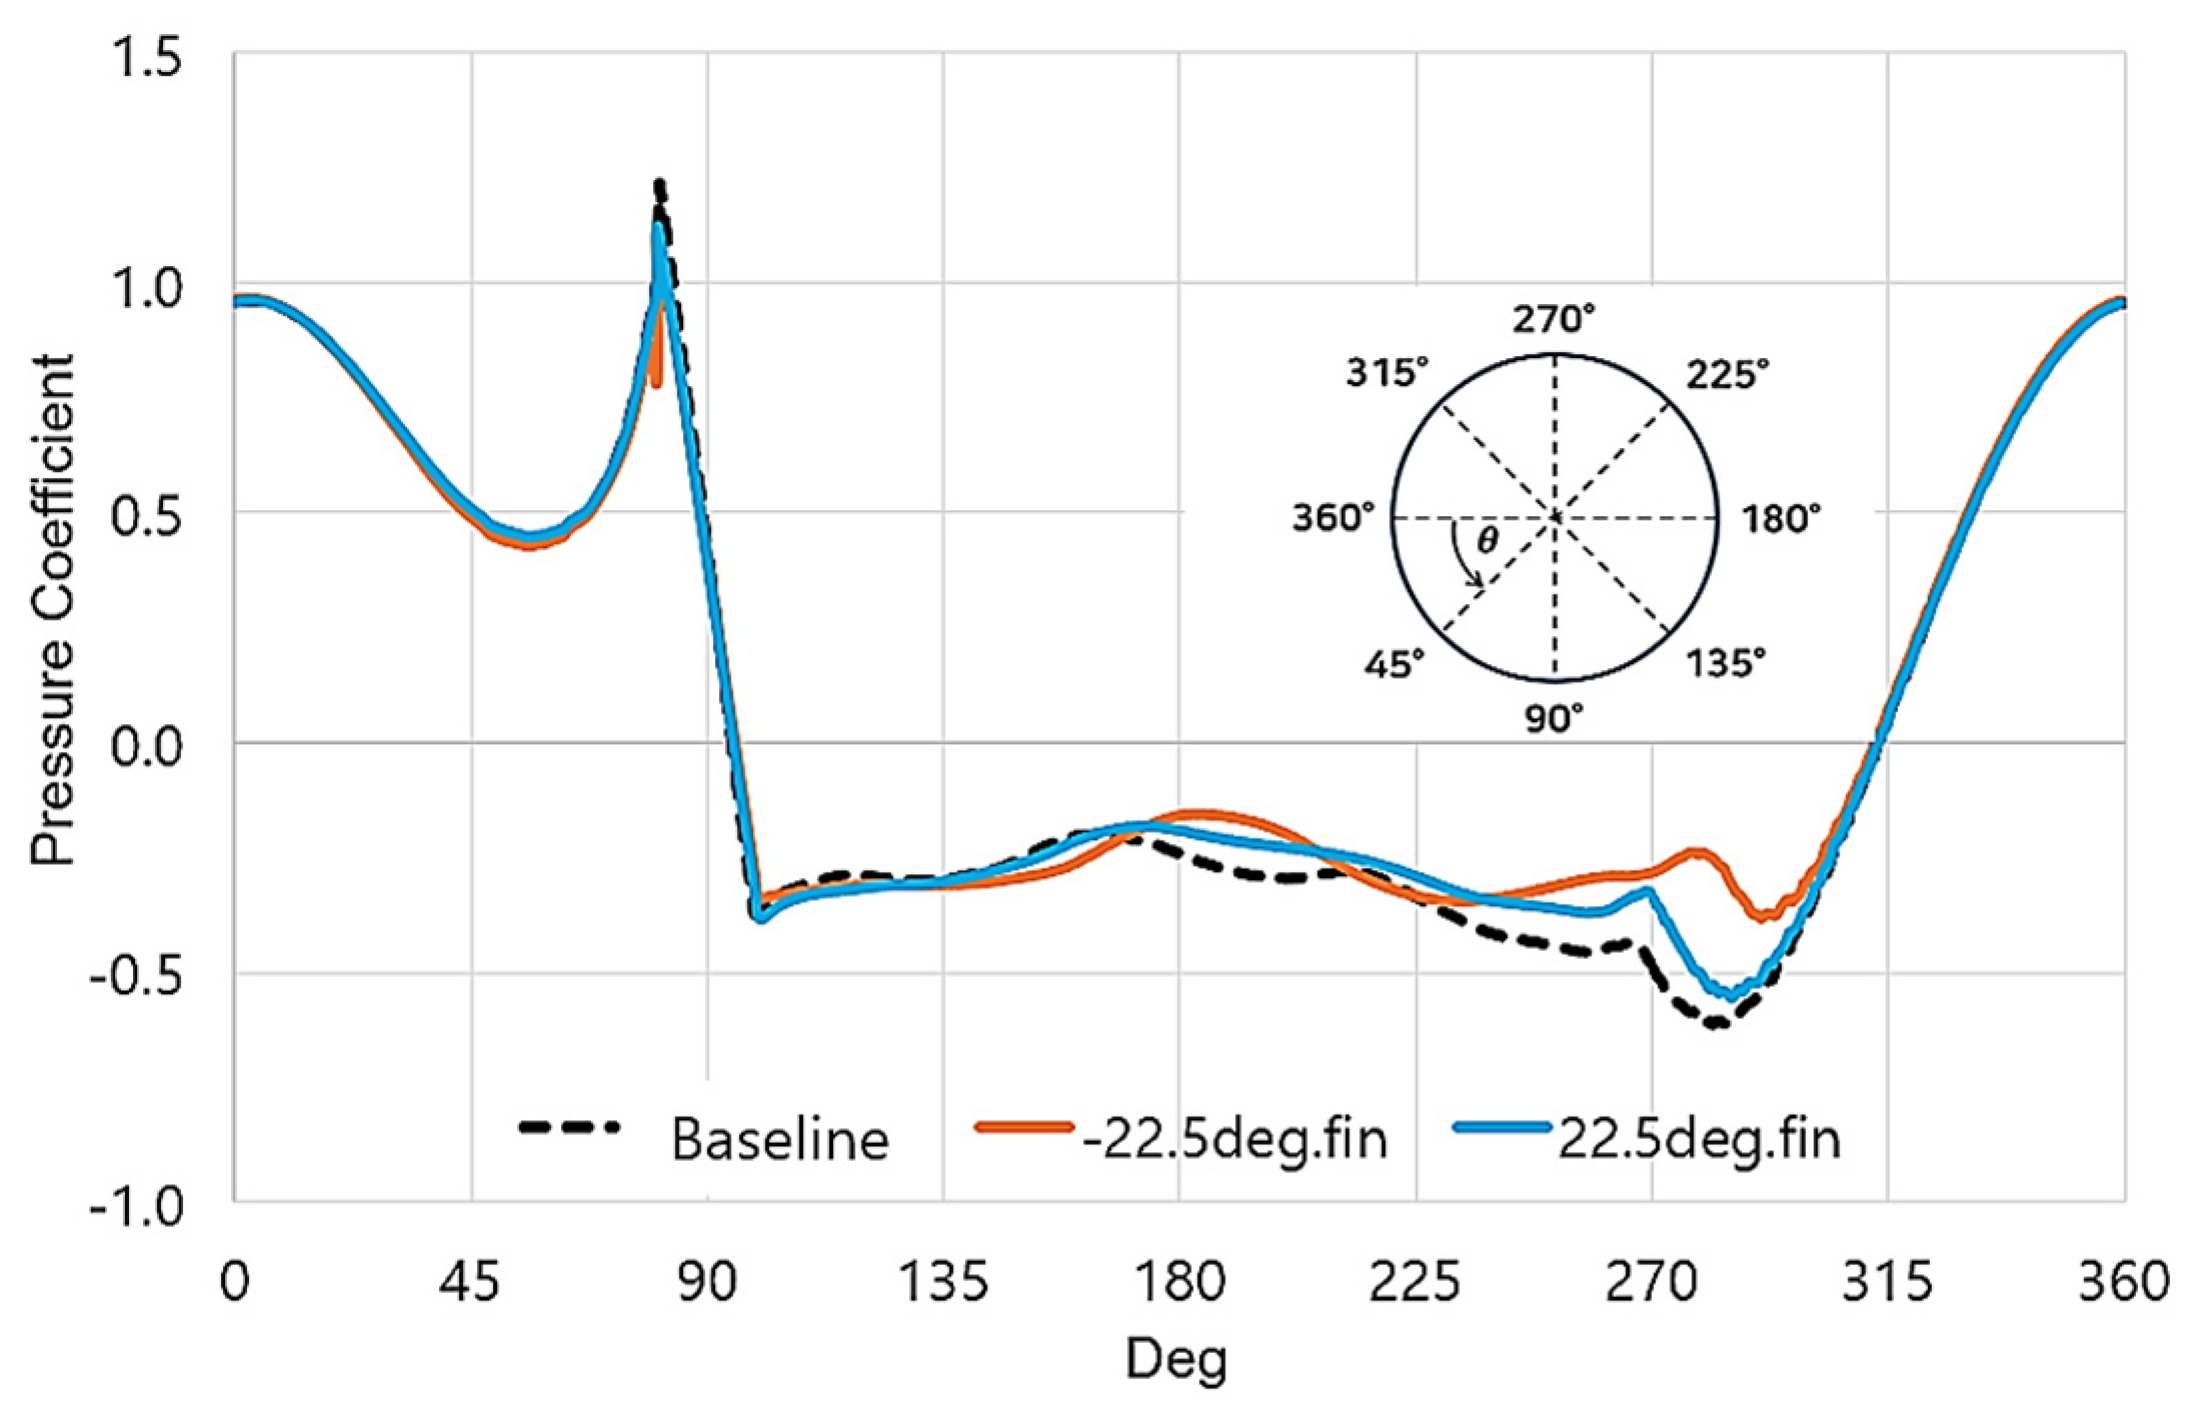
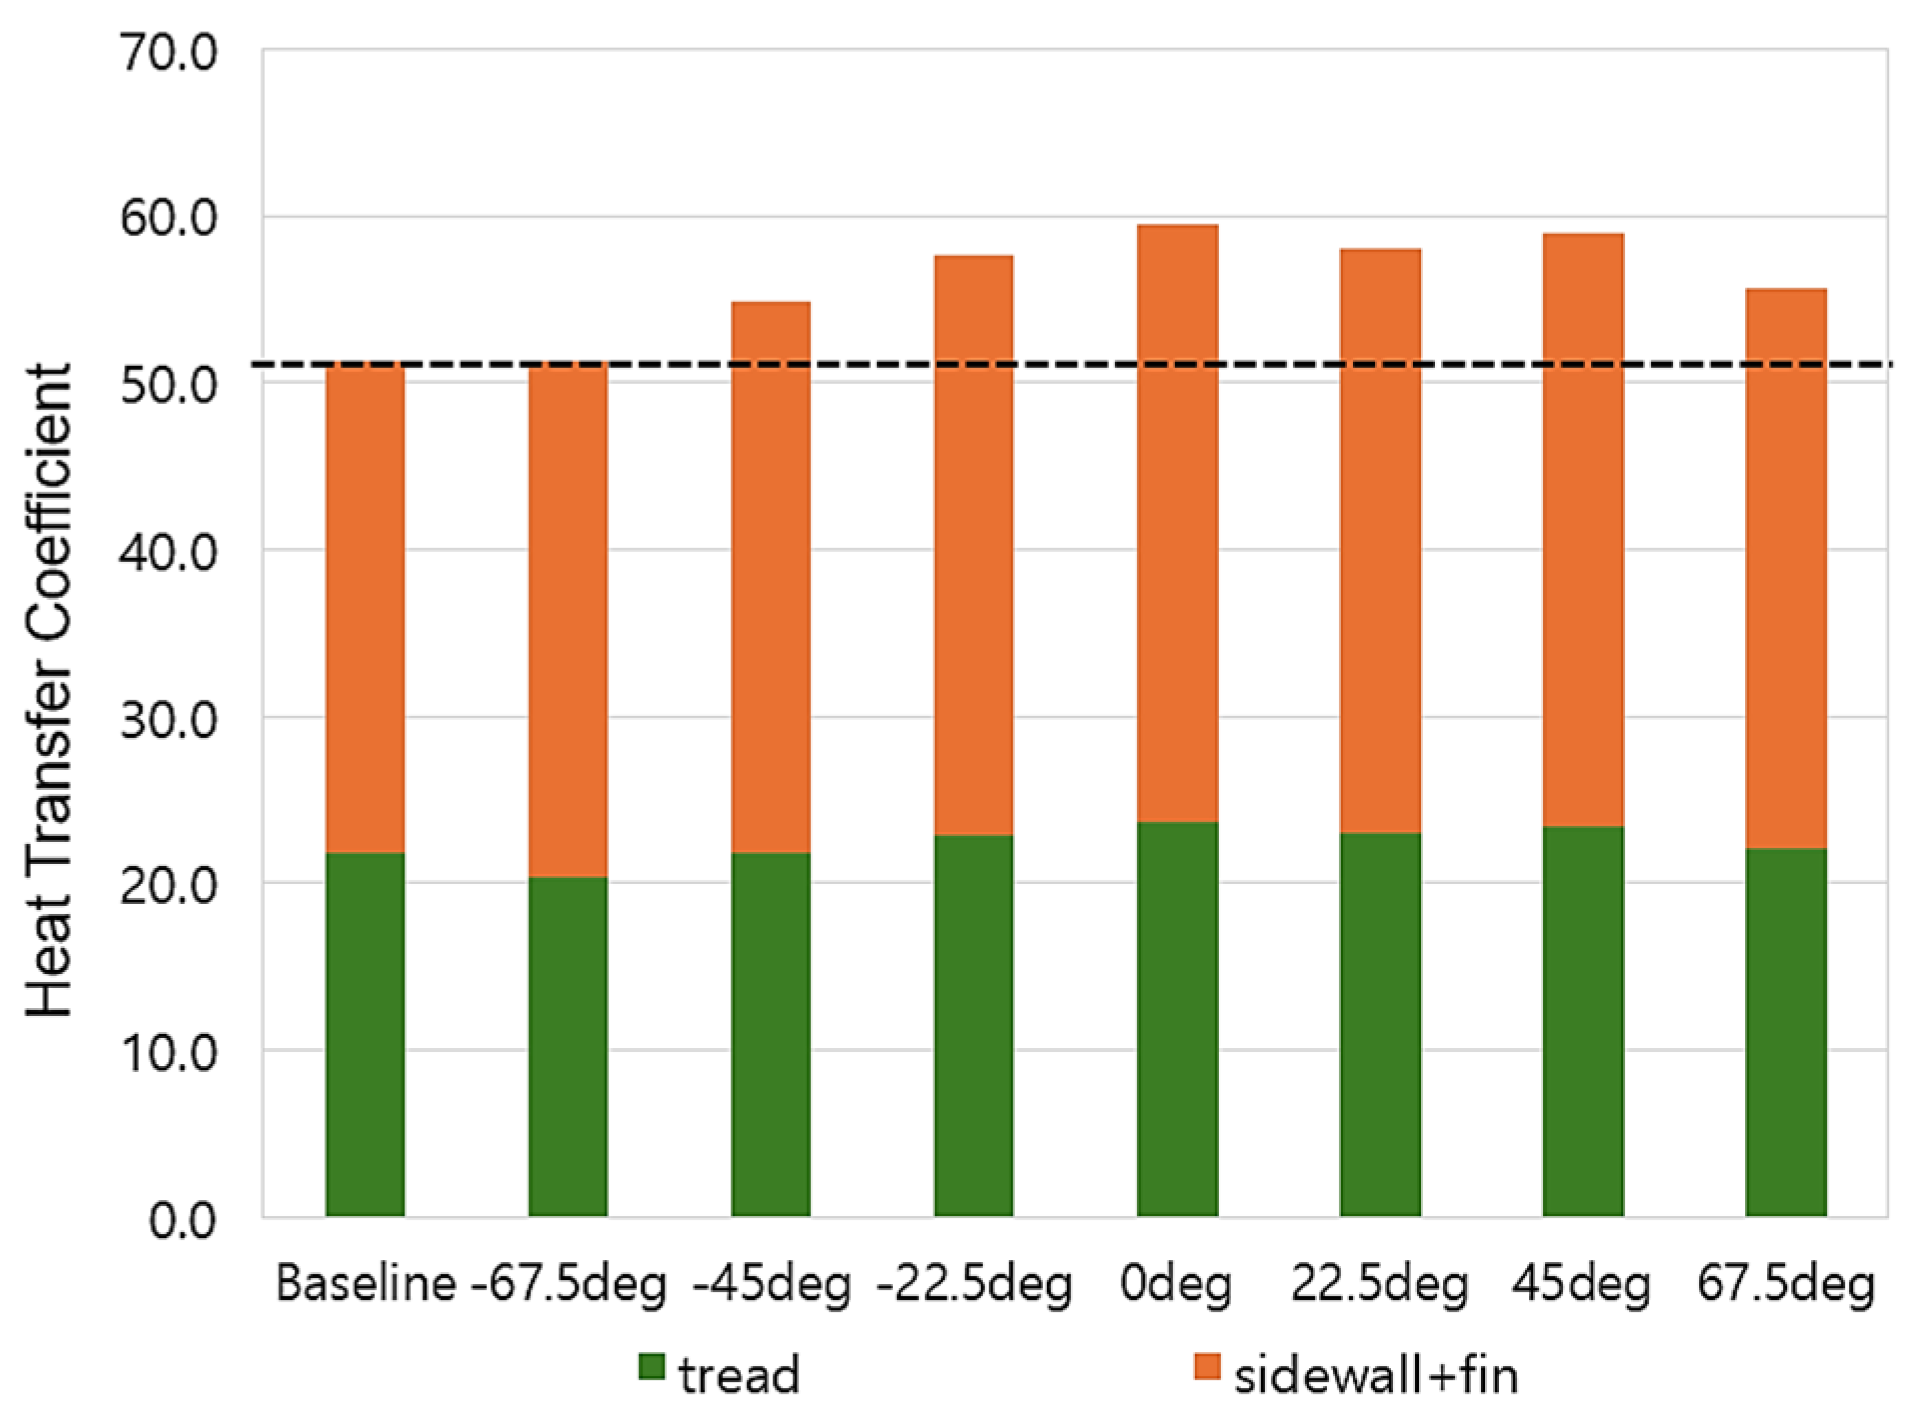
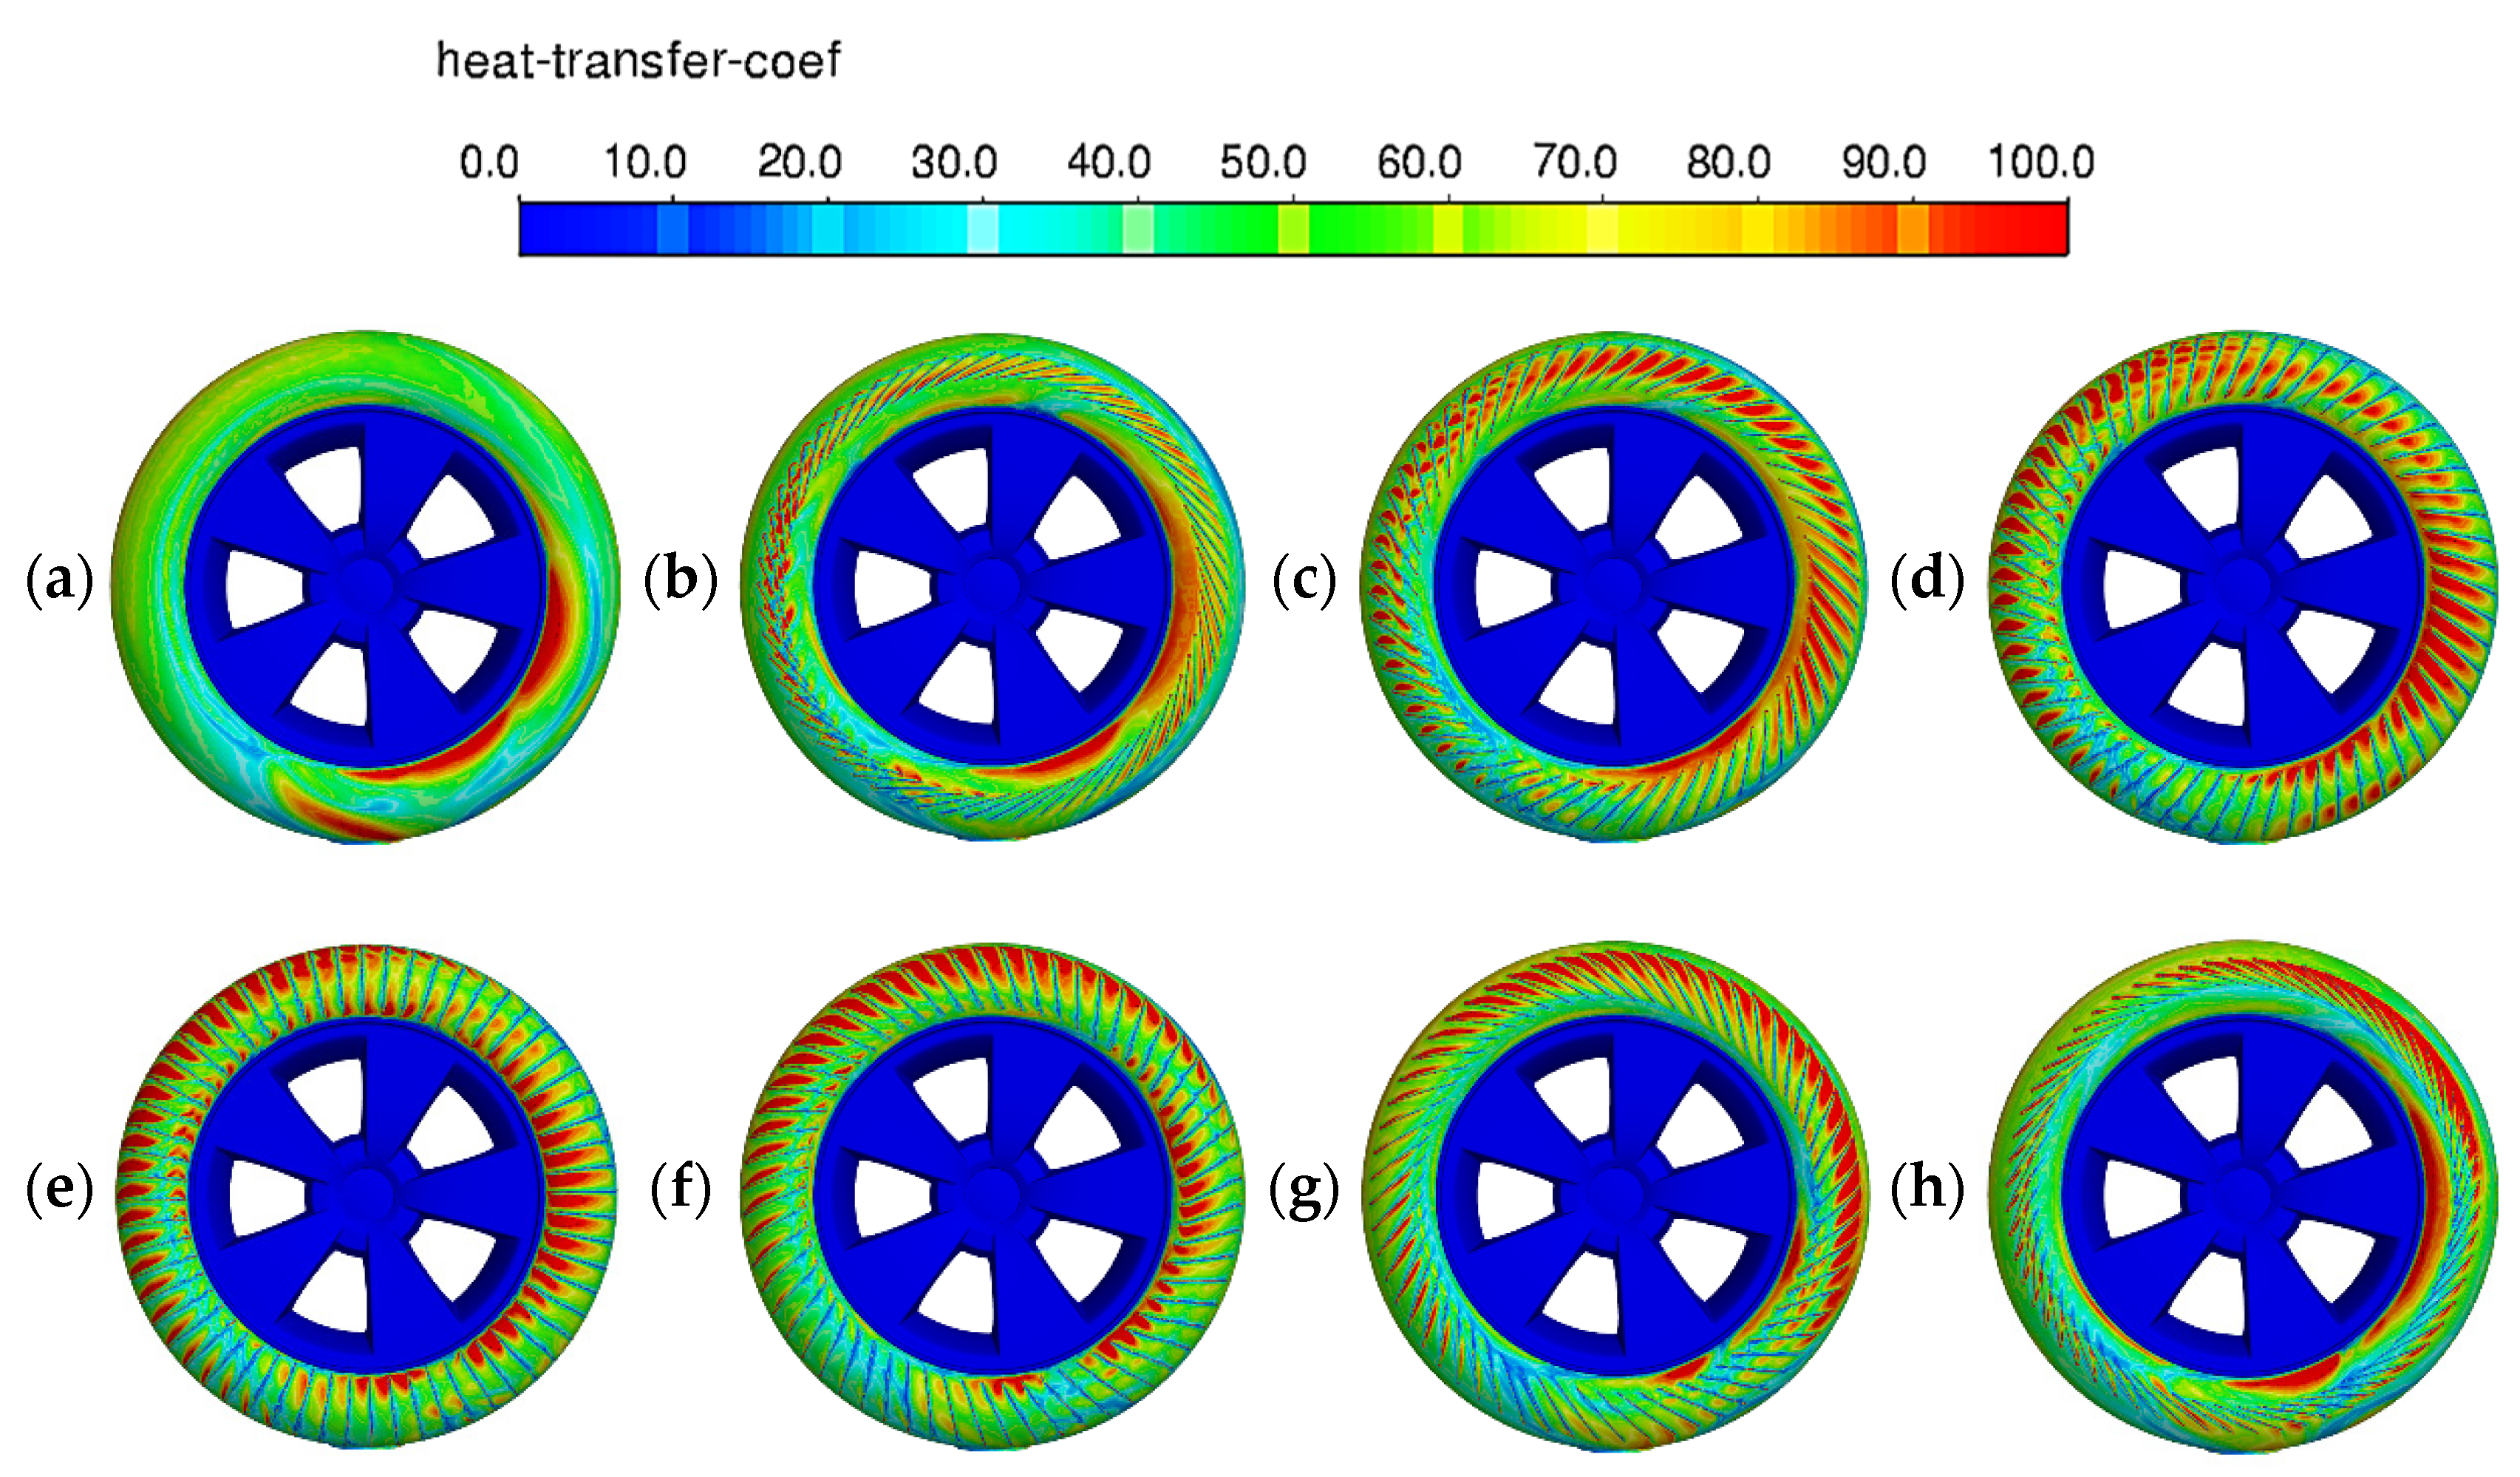
Figure 4a shows partial views of the computational meshes, which are composed of a stationary zone and a sliding mesh zone. The polyhedral mesh was used to efficiently represent the complex geometry of the tire and surrounding fluid region while maintaining computational robustness. To minimize interpolation errors at the interface between the stationary zone and the sliding mesh (SM) zone, a conformal mesh was generated across the interface region. To accurately capture boundary layer flow phenomena, we determined the height of the first layer in order to satisfy y+~1. From the laminar Blasius approximation, the height of the first cell was set to 0.02 mm, and a total of ten viscous layer meshes were applied, as shown in Figure 4b.
A mesh sensitivity analysis was carried out by setting the total number of meshes such that it varied between 2.2 million and 13.3 million. Figure 5 presents the distribution of y+ on the tire surface. With the exception of localized regions around the wheel spokes, the majority of the surface exhibits y+ < 1, indicating that the near-wall mesh resolution is sufficient to accurately capture the boundary layer characteristics.
The aerodynamic drag coefficient (Cd) and average HTC with respect to various mesh resolutions are presented in Figure 6. These coefficients are defined as follows:
C d = F D 0.5 ρ V 2 S .
H T C = q T s T f , q = k e f f T n w a l l
where F D denotes the drag force, ρ is the density, V represents the freestream velocity, S is the projected reference area, T s is the surface temperature, T f is the fluid temperature, and k e f f is the effective thermal conductivity. The temperature gradient T n is evaluated normal to the wall surface [18].
Based on the results from the finest mesh case (~13.3 million cells), the optimal mesh size was determined to be approximately 4.9 million cells, providing a reasonable trade-off between computational accuracy and efficiency. This mesh configuration was adopted as the baseline for all subsequent simulations to ensure consistency. For the tire models equipped with sidewall cooling fins, the total number of meshes varied from approximately 14 million to 16 million, depending on the specific fin installation angle.
As illustrated in Figure 7, the aerodynamic drag coefficient did not converge to a steady value for any mesh density but exhibited periodic fluctuations due to the unsteady flow separation induced by tire rotation. In this study, a periodic pattern was observed after approximately four complete tire rotations, and the aerodynamic drag coefficient was evaluated by averaging the values over the final two rotations. The transient simulation using the finest mesh resolution (~16 million cells), which encompassed a total rotational angle of 3600°, required approximately 88 h of wall-clock on a 48-core Intel Xeon processor system.

3. Results

3.1. Without Ground Contact

As a preliminary step, flow simulations were performed in the absence of a ground surface to isolate the aerodynamic behavior of the sidewall cooling fins and eliminate any aerodynamic interactions between the tire and the ground [13].
Figure 8 presents the aerodynamic drag coefficient (Cd) of the tire for various fin installation angles. Although the addition of sidewall cooling fins is generally expected to substantially increase aerodynamic drag, the simulation results showed that only a moderate drag increase of approximately 3% occurred, except for mounting angles between 0° and 22.5°. Moreover, at a mounting angle of −45°, a drag reduction of about 2.9% was also observed. Interestingly, the fins themselves contributed minimally to the overall aerodynamic drag, exhibiting a drag coefficient of approximately 0.02, which accounts for less than 4% of the total drag. Nonetheless, the installation of fins led to notable changes in the drag distribution over the sidewall + rim and tread regions, and these changes, in turn, had a significant impact on the overall flow field.
Figure 9 illustrates the x-directional surface pressure (pnx) distribution viewed from the side. Here, pnx is defined via Equation (1), where p ,   p ,   V , and n x ^ are surface pressure, pressure at the far-upstream region, freestream velocity, and the surface normal vector, respectively. This figure provides a direct visualization of the pressure drag distribution, where a positive pnx indicates a drag component, while a negative pnx represents a thrust component.
p n x = p p 1 2 ρ V 2   n x ^
As the flow accelerates past the shoulder region of the tire, thrust components created by low pressure can be observed along the front shoulder area (270~90°). However, in the separated flow region (90~225°), the low pressure contributes to an increase in pressure drag. Also, there is a noticeable difference in the drag distribution on the rear part of the sidewall depending on the fin angle.
To investigate the changes in aerodynamic drag throughout the tread region, we compared the pressure distribution along the centerline of the tread, as presented in Figure 10. The results show that the onset and extent of flow separation vary depending on the mounting angle of the fin, occurring within the range of 135° to 300°. Slight differences in pressure within the separation region, depending on the fin installation angle, appear to have caused variations in the drag acting on the tread region. In particular, the −45° fin configuration exhibited a relatively high pressure level downstream of the separation point, indicating enhanced pressure recovery, which contributes to aerodynamic drag reduction. This phenomenon is further illustrated in Figure 11, which shows the pressure coefficient distributions and streamline patterns.
The influence of fin geometry on the cooling performance of the tire was assessed using the average HTC as a key metric. Figure 12 presents a comparison of the average HTC values for various fin mounting angles, indicating that all of the fin-equipped configurations enhanced heat dissipation relative to the baseline (finless) tire. Here, fin angles of 0°, 22.5°, and 45° led to an increase of over 16% in the average HTC, while the angle of −22.5° led to the smallest improvement, with only a 3.15% increase. Also, the average HTC on the sidewall region increased in all of the fin-equipped cases, suggesting that the sidewall cooling fin modified the near-wall flow, thereby promoting convective heat transfer on the tire’s surface.
A qualitative assessment of heat transfer is shown in Figure 13, which displays the average HTC distribution on the surface of the tire. The regions near the fin attachment exhibit elevated average HTC levels, indicating local enhancement of convective heat transfer due to fin-induced flow modification.
Table 1 summarizes the aerodynamic drag and average HTC for various fin mounting angles. The changes in aerodynamic drag remained within ±3% for most cases, whereas an average HTC enhancement of approximately 16.7% was observed for fin angles ranging from 0° to 45°. As previously mentioned, the cooling fins at this positive installation angle adopt a geometry similar to that of a forward-curved fan. It is well known that forward-curved configurations promote broader airflow diffusion around the surface and effectively disturb the boundary layer, thereby enhancing convective heat transfer [25]. A similar mechanism is believed to contribute to the improved thermal performance observed for the cooling-fin design discussed herein.

3.2. With Ground Contact

To better understand real-world conditions, simulations were performed under ground-contact conditions. In these simulations, a moving wall boundary condition was applied, ensuring that the ground moved at the same speed as the tire.
Figure 14 presents the variation in the drag coefficient for various fin mounting angles. Among the seven tested configurations, the 22.5° and 67.5° fins led to only a marginal increase in drag, i.e., less than 1.7%, indicating that these installation angles imposed a minimal aerodynamic penalty. In contrast, the −22.5° fin led to an approximately 29.33% increase in drag coefficient. Similar to the case without ground contact, the fins themselves had little effect on the overall drag, with the major changes mainly being due to the rim, sidewall, and tread regions.
Figure 15 shows the x-directional surface pressure distribution. In comparison with Figure 9, a pronounced change in the drag distribution can be observed between 90° and 135°, primarily due to the strong jetting flow induced near the contact patch region where the rotating tire meets the ground [13]. Consistent with the trends shown in Figure 9, the drag distribution varies with the fin mounting angle, and the 22.5° case demonstrates the most significant reduction in pressure drag.
Figure 16 shows a comparison of the pressure coefficient profiles along the tire’s centerline for different configurations: minimum drag coefficient, maximum drag coefficient, and baseline. In the front of the tire (315°~90°), where the freestream is dominant, the pressure coefficient distribution showed little variation regardless of the fin’s mounting angle. However, significant differences were observed in the flow separation region (135°~300°) depending on the fin configuration. For the baseline and the 22.5° fin configurations, which were associated with the lowest drag increase, flow separation occurred near 270°. In contrast, the −22.5° fin configuration, which showed the highest drag coefficient, exhibited earlier flow separation around 285°.
The flow separation induced by the cooling fins is also evident in the wake structures presented in Figure 17. The baseline and 22.5° fin configurations exhibited very similar flow structures, both in the separation region over the upper surface of the tire and in the wake region. In contrast, the −22.5° fin configuration led to a relatively larger wake region originating from the upper surface of the tire, a finding consistent with the observed increase in aerodynamic drag.
Figure 18 shows a comparison of the average HTC values. As expected, improvements in the average HTC were observed depending on the mounting angle of the fin. Among all of the configurations tested, the 0° fin exhibited the greatest enhancement, with an enhancement of approximately 15.95% compared to the baseline tire. In particular, the 22.5° fin configuration, which exhibited the lowest increase in aerodynamic drag, resulted in an increase in the average HTC by more than 13%. Also, unlike Cd, the average HTC values in the tread area did not show substantial differences, and the improvement mainly stemmed from the sidewall + fin area.
A comparison of the average HTC values along the sidewall is presented in Figure 19. As shown, all of the fin-equipped configurations exhibited higher average HTC values than the baseline, likely due to the enhanced flow mixing near the boundary caused by localized eddies or small turbulences around the cooling fins.
Table 2 summarizes the aerodynamic drag and average HTC values for various fin mounting angles. The aerodynamic drag showed a wide variation from 1.74% to 29.33% depending on the fin mounting angle, while the thermal performance varied between 0.08% and 15.95%. This information will assist in the design of cooling fins that can optimize aerodynamic drag and heat dissipation performance. In this study, at a fin mounting angle of 22.5°, an average HTC improvement of over 13% was achieved, with a mere 1.7% increase in aerodynamic drag.

4. Conclusions

In this study, numerical simulations were performed to evaluate the effect of a sidewall cooling fin on the aerodynamic and thermal performance of a rotating tire under both ground-contact and no-ground-contact conditions. In the absence of ground contact, the installation of a cooling fin generally enhanced convective heat transfer by promoting interaction with the surrounding airflow. Among the seven fin configurations tested, the 45° fin configurations exhibited the most effective thermal performance, achieving a 16.8% increase in the average HTC while incurring only a moderate increase (~3.0%) in aerodynamic drag. Under ground-contact conditions, the fin mounting angle appeared to significantly influence the separation point over the upper surface of the tire as well as the overall flow pattern. As a result, we found that at a fin mounting angle of 22.5°, thermal performance could be improved by more than 13%, with only a 1.74% increase in aerodynamic drag. Regardless of ground contact, the fin configurations with positive installation angles consistently demonstrated an enhanced heat transfer performance. This improvement was attributed to the fact that the fins geometrically resemble a forward-curved fan configuration, which is known to promote greater flow diffusion and boundary layer disturbance. These results also provide insight into the design of cooling fins that can optimize aerodynamic drag and heat dissipation performance.
The optimal fin angle for balancing drag minimization and heat transfer maximization differed under ground-contact and no-ground-contact conditions, highlighting the strong sensitivity of performance to the surrounding flow environment. Therefore, future studies should evaluate the effectiveness of the forward-curved fin configuration under a broad range of operating conditions. Moreover, while our results provide valuable insights into fin-induced aero-thermal behavior, future research should focus on validating these findings under realistic vehicle-mounted tire conditions, where the integrated effects of wheel housing, suspension components, and full underbody aerodynamics are at play.

Author Contributions

Conceptualization, K.Y. and S.L.; methodology, simulation, and validation, K.Y.; writing—original draft preparation, K.Y.; writing—review and editing, S.L.; visualization, K.Y.; supervision, S.L.; funding acquisition, S.L. All authors have read and agreed to the published version of the manuscript.

Funding

This research was funded by Wonkwang University 2023.

Data Availability Statement

The data presented herein cannot be shared openly but are available on request from the authors.

Conflicts of Interest

The authors declare no conflicts of interest.

Abbreviations

The following abbreviations are used in this manuscript:
CdAerodynamic drag coefficient
CFDComputational fluid dynamics
CpSurface pressure coefficient
DESDetached eddy simulation
F D Drag force
HTCHeat transfer coefficient
MRFMultiple reference frame
n x ^ X-directional surface normal vector
pStatic pressure
p Static pressure of freestream
PnxX-directional pressure distribution
q″Heat flux
SProjection area
SMSliding mesh
SST k-ωShear stress transport k-w turbulence model
TTemperature
T s Surface temperature
T f Fluid temperature
uRANSUnsteady Reynolds-averaged Navier–Stokes
V Freestream velocity
y+Non-dimensional wall distance
ρAir density
μDynamic viscosity
κThermal conductivity

Appendix A

To further address the validity of our numerical approach, it is important to note that although numerous wind tunnel tests and numerical studies were conducted on the aerodynamic characteristics of the DrivAer model with the wheel/tire system mounted on a vehicle [15,16,17,22,24], there is a lack of research focusing exclusively on isolated wheel/tire configurations. Specifically, we found no wind tunnel experiments or standalone CFD analyses for an isolated wheel and tire geometry.
To validate the accuracy of the numerical methodology employed in this study, additional simulations were conducted using the well-known Fackrell configuration [18,26], for which both wind tunnel data and numerical results are available. The geometry is illustrated in Figure A1. The computational domain was defined based on the tire diameter D: W × L × H = 4 D × ( 5 D + 15 D ) × 3 D . The freestream velocity was set to 18.6 m/s, corresponding to a tire rotational speed of 89.42 rad/s. To replicate realistic road conditions, the ground was modeled using a moving wall boundary condition with a surface velocity matching the tire’s tangential speed.
The numerical setup followed the same approach used in the main study. The uRANS equations were solved in conjunction with the SST k-w turbulence model. Tire rotation was modeled using both the sliding mesh and MRF (multiple reference frame), and the resulting drag coefficients were compared for validation purposes.
Figure A1. Wheel/tire geometry and simulation domain of Fackrell wheel: (a) overview of wheel/tire geometry and contact patch, and (b) schematic view of simulation domain.
Energies 18 03133 g0a1
Even though the same numerical methodology was applied, the MRF approach exhibited a general tendency to overpredict the drag coefficient, with a maximum deviation of 10.78%. In contrast, the sliding mesh yielded significantly better agreement, achieving an error of 2.16% even with a relatively coarse mesh. This observation is in good agreement with the findings of previous studies comparing MRF and SM techniques [14,27,28], thereby reinforcing the validity and reliability of the numerical method adopted in this study.
Figure A2. Aerodynamic drag coefficient of various mesh density and simulation methodologies.
Energies 18 03133 g0a2

References

  1. Farroni, F.; Mancinelli, N.; Timpone, F. A Real-Time Thermal Model for the Analysis of Tire/Road Interaction in Motorcycle Applications. Appl. Sci. 2020, 10, 1604. [Google Scholar] [CrossRef]
  2. Kang, S.; Jeong, K.; Kim, K.; Chang, D. Numerical estimation of rolling resistance and temperature distribution of 3-D periodic patterned tire. Int. J. Solids Struct. 2013, 50, 86–96. [Google Scholar]
  3. Jeong, K.; Kang, S.; Park, W.; Kim, H.; Kim, K. Finite Element Analysis for Temperature Distribution Prediction of Steady Rolling Tires with Detailed Tread Pattern. Trans. Korean Soc. Automot. Eng. 2014, 22, 117–125. [Google Scholar] [CrossRef]
  4. Zhou, H.; Jiang, Z.; Wang, G.; Zhang, S. Aerodynamic characteristics of isolated loaded tires with different tread patterns: Experiment and simulation. Chin. J. Mech. Eng. 2021, 34, 6. [Google Scholar] [CrossRef]
  5. Cattani, P.; Cattani, L.; Magrini, A. Tyre–Road Heat Transfer Coefficient Equation Proposal. Appl. Sci. 2023, 13, 11996. [Google Scholar] [CrossRef]
  6. Teodosio, L.; Alferi, G.; Genovese, A.; Farroni, F.; Mele, B.; Timpone, F.; Sakhnevych, A. A numerical methodology for thermo-fluid dynamic modelling of tyre inner chamber: Towards real time applications. Meccanica 2021, 56, 549–567. [Google Scholar] [CrossRef]
  7. Yamaguchi, M.; Makoto, T.; Kenshiro, K. Experimental and CFD Analysis of Tire Cooling Sidewall. SAE Int. J. Passeng. Cars-Mech. Syst. 2008, 1, 1–8. [Google Scholar] [CrossRef]
  8. Lee, J.; Park, S.; Kim, M.; Kim, Y.; Oh, B. Vehicle aerodynamic drag for tire shape parameters using numerical analysis. Int. J Automot. Technol. 2020, 23, 335–344. [Google Scholar] [CrossRef]
  9. Josefsson, E.; Hobeika, T.; Sebben, S. Evaluation of wind tunnel interference on numerical prediction of wheel aerodynamics. J. Wind Eng. Ind. Aerodyn. 2022, 224, 104945. [Google Scholar] [CrossRef]
  10. Leśniewicz, P.; Kulak, M.; Karczewski, M. Aerodynamic analysis of an isolated vehicle wheel. J. Phys. Conf. Ser. 2014, 530, 012064. [Google Scholar] [CrossRef]
  11. Brandt, A.; Berg, H.; Bolzon, M.; Josefsson, L. The effects of wheel design on the aerodynamic drag of passenger vehicles. SAE Int. J. Adv. Curr. Pract. Mobil. 2019, 1, 1279–1299. [Google Scholar] [CrossRef]
  12. Skea, A.; Bullen, P.; Qiao, J. CFD Simulations and Experimental Measurements of the Flow over a Rotating Wheel in a Wheel Arc; SAE Technical Paper; SAE: Warrendale, PA, USA, 2000. [Google Scholar]
  13. Corner, E.; Mothay, G.; Socit, C.; Bezard, H. Aerodynamic analysis of an isolated wheel wake. In Proceedings of the Conference on Modelling Fluid Flow (CMFF’12), 15th International Conference on Fluid Flow Technologies, Budapest, Hungary, 4–7 September 2012. [Google Scholar]
  14. Haag, L.; Blacha, T.; Indinger, T. Experimental investigation on the aerodynamics of isolated rotating wheels and evaluation of wheel rotation models using CFD. Int. J. Autom Eng 2017, 8, 7–14. [Google Scholar] [CrossRef] [PubMed]
  15. Aultman, M.; Auza-Gutierrez, R.; Disotell, K.; Duan, L. Effects of Wheel Rotation on Long-Period Wake Dynamics of the DrivAer Fastback Model. Fluids 2022, 7, 19. [Google Scholar] [CrossRef]
  16. Yu, X.; Jia, Q.; Yang, Z. Comprehensive Study of the Aerodynamic Influence of Ground and Wheel States on the Notchback DrivAer. Energies 2022, 15, 1124. [Google Scholar] [CrossRef]
  17. Heft, A.; Indinger, T.; Adams, N. Experimental and Numerical Investigation of the DrivAer Model. In Fluids Engineering Division Summer Meeting; American Society of Mechanical Engineers: New York, NY, USA, 2012; pp. 41–51. [Google Scholar]
  18. Cho, S.; Lee, S. Aerodynamic performance analysis on various wheel configurations of commercial vehicle. Microsyst. Technol. 2025, 31, 1147–1159. [Google Scholar] [CrossRef]
  19. ANSYS Inc. ANSYS Fluent User’s Guide; ANSYS Inc.: Canonsburg, PA, USA, 2023. [Google Scholar]
  20. Yang, Y.; Wang, C.; Guo, R.; Zhang, M. Numerical analyses of the flow past a short rotating cylinder. J. Fluid Mech. 2023, 975, A15. [Google Scholar] [CrossRef]
  21. John, A.; Gianluca, I. An Aerodynamic Investigation of an Isolated Rotating Formula 1 Wheel Assembly. J. Fluids Eng. 2012, 134, 121101. [Google Scholar]
  22. Qin, P.; Ricci, A.; Blocken, B. CFD simulation of aerodynamic forces on the DrivAer car model: Impact of computational parameters. J. Wind Eng. Ind. Aerodyn. 2024, 248, 105711. [Google Scholar] [CrossRef]
  23. Josefsson, E.; Hobeika, T.; Sebben, S.; Urquhart, M. Investigation of Tyre Pattern Effect on the Aerodynamics of a Passenger Vehicle. ASME J. Fluids Eng. 2022, 144, 111209. [Google Scholar] [CrossRef]
  24. Baek, S.; Lee, S. Aerodynamic drag reduction on a realistic vehicle using continuous blowing. Microsyst. Technol. 2020, 26, 11–23. [Google Scholar] [CrossRef]
  25. Lin, S.; Huang, C. An integrated experimental and numerical study of forward-curved centrifugal fan. Exp. Therm. Fluid Sci. 2002, 26, 421–434. [Google Scholar] [CrossRef]
  26. Fackrell, J.; Harvey, J. The Aerodynamics of an Isolated Road Wheel. In Proceedings of the Second AIAA Symposium of Aerodynamics of Sports and Competition Automobiles, Los Angeles, CA, USA, 11 May 1975. [Google Scholar]
  27. Jan, R.; Haag, L.; Indinger, T. CFD investigation on fully detailed and deformed car tires. Int. J. Automot. Eng. 2019, 10, 324–331. [Google Scholar]
  28. Nakata, A.; Okamoto, S.; Morikawa, Y.; Nakashima, T. Effects of detailed tire geometry and wheel rotation on the aerodynamic performance of deflectors. Int. J. Automot. Eng. 2023, 14, 84–91. [Google Scholar] [CrossRef] [PubMed]
Figure 1. Wheel/tire geometry and simulation domain: (a) overview of wheel/tire geometry and contact patch, and (b) schematic of simulation domain and corresponding boundary conditions.
Energies 18 03133 g001
Figure 2. Sidewall cooling-fin geometry and installation angle: (a) dimensions of the sidewall cooling fin, and (b) definition of cooling-fin installation angles.
Energies 18 03133 g002
Figure 3. Geometry of the tire sidewall with various cooling-fin installation angles: (a) baseline; (b) −67.5 deg; (c) −45.0 deg; (d) −22.5 deg; (e) 0.0 deg; (f) 22.5 deg; (g) 45.0 deg; (h) 67.5 deg.
Energies 18 03133 g003
Figure 4. Detailed views of the computational meshes: (a) interface mesh within the sliding zone; (b) combined view of the stationary and sliding mesh zones; (c) zoomed-in view of meshes around the sidewall cooling fin; (d) viscous layer meshes near the contact patch region.
Energies 18 03133 g004
Figure 5. Surface y+ distribution of the baseline tire at a rotation speed of 50.24 rad/s.
Energies 18 03133 g005
Figure 6. Variation in drag coefficient with respect to various mesh sets.
Energies 18 03133 g006
Figure 7. Convergence history regarding the aerodynamic drag coefficient.
Energies 18 03133 g007
Figure 8. Comparison of the aerodynamic drag coefficients of various cooling-fin installation angles under without-ground-contact conditions. The bold dashed line represents the value for the baseline configuration.
Energies 18 03133 g008
Figure 9. Comparison of x-directional surface pressure distributions on tire surface with respect to various cooling-fin installation angles: (a) baseline; (b) −67.5 deg; (c) −45.0 deg; (d) −22.5 deg; (e) 0.0 deg; (f) 22.5 deg; (g) 45.0 deg; (h) 67.5 deg.
Energies 18 03133 g009
Figure 10. Comparison of surface pressure coefficients at the center line of the tire tread.
Energies 18 03133 g010
Figure 11. Comparison of flow structure: (a) pressure distribution on the tire’s center plane and (b) streamline near the rotating tire.
Energies 18 03133 g011
Figure 12. Comparison of average HTC under no-ground-contact conditions. The bold dashed line represents the value for the baseline configuration.
Energies 18 03133 g012
Figure 13. Comparison of average HTC distributions on the surface of the tire with respect to various cooling-fin installation angles: (a) baseline; (b) −67.5 deg; (c) −45.0 deg; (d) −22.5 deg; (e) 0.0 deg; (f) 22.5 deg; (g) 45.0 deg; (h) 67.5 deg.
Energies 18 03133 g013
Figure 14. Comparison of drag coefficients under ground-contact conditions. The bold dashed line represents the value for the baseline configuration.
Energies 18 03133 g014
Figure 15. Comparison of x-directional surface pressure distributions on the tire’s surface with respect to various cooling-fin installation angles under ground-contact conditions: (a) baseline; (b) −67.5 deg; (c) −45.0 deg; (d) −22.5 deg; (e) 0.0 deg; (f) 22.5 deg; (g) 45.0 deg; (h) 67.5 deg.
Energies 18 03133 g015
Figure 16. Comparison of pressure coefficients at the center of the tire tread under ground-contact conditions.
Energies 18 03133 g016
Figure 17. Iso-surface of the zero-total pressure coefficient under ground-contact conditions: (a) baseline; (b) −22.5 deg; (c) 22.5 deg.
Energies 18 03133 g017
Figure 18. Comparison of average HTC under ground-contact conditions. The bold dashed line represents the value for the baseline configuration.
Energies 18 03133 g018
Figure 19. Comparison of average HTC distributions on the tire’s surface with respect to various cooling-fin installation angles under ground-contact conditions: (a) baseline; (b) −67.5 deg; (c) −45.0 deg; (d) −22.5 deg; (e) 0.0 deg; (f) 22.5 deg; (g) 45.0 deg; (h) 67.5 deg.
Energies 18 03133 g019
Table 1. Rate of change in aerodynamic drag and average HTC with respect to various cooling-fin installation angles.
Fin Angle∆ Drag Coefficient∆ Average HTC
−67.5 deg3.05%4.26%
−45.0 deg−2.92%9.27%
−22.5 deg3.33%3.15%
0.0 deg11.82%16.76%
22.5 deg16.23%16.67%
45.0 deg2.70%16.77%
67.5 deg2.80%8.60%
Table 2. Rate of change in aerodynamic drag and average HTC with respect to various cooling-fin installation angles under ground-contact conditions.
Fin Angle∆ Drag Coefficient∆ Average HTC
−67.5 deg20.98%−0.09%
−45.0 deg18.91%6.93%
−22.5 deg29.93%8.29%
0.0 deg13.50%15.94%
22.5 deg1.74%13.07%
45.0 deg11.83%14.83%
67.5 deg21.84%8.27%
Disclaimer/Publisher’s Note: The statements, opinions and data contained in all publications are solely those of the individual author(s) and contributor(s) and not of MDPI and/or the editor(s). MDPI and/or the editor(s) disclaim responsibility for any injury to people or property resulting from any ideas, methods, instructions or products referred to in the content.

