Article

Convergence or Divergence? A Cluster Analysis of Energy Poverty Patterns Across the European Union Amidst Policy Shifts and Crises

AGH University, Department of Petroleum Engineering, al. Mickiewicza 30, 30-059 Krakow, Poland
Energies 2025, 18(12), 3117; https://doi.org/10.3390/en18123117
Submission received: 15 May 2025 / Revised: 8 June 2025 / Accepted: 10 June 2025 / Published: 13 June 2025
(This article belongs to the Special Issue Policy and Economic Analysis of Energy Systems)

Abstract

:
This paper investigates the dynamics of energy poverty across EU Member States from 2015 to 2023, a period characterized by economic recovery, the COVID-19 pandemic, and a significant energy crisis. Utilizing Eurostat EU-SILC data, the study analyzes trends in four key indicators: the inability to keep homes adequately warm, arrears on utility bills, housing cost overburden rate, and the at-risk-of-poverty rate. Data processing and trend analysis were performed using R and RStudio, while a k-means cluster analysis, executed in Python via Visual Studio Code, identified and compared distinct country groupings based on their energy poverty profiles in 2015 and 2023. The findings reveal a general improvement in energy poverty indicators across the EU until 2019, followed by a marked deterioration, particularly in energy affordability metrics post-2021 due to the energy crisis. This impact was observed to be distinct from general income poverty trends. While significant geographical disparities persist, with Southern and Eastern European countries often more vulnerable, the analysis also points to notable improvements in several Central and Eastern European nations. The cluster analysis, which identified eight clusters in 2015 and seven in 2023, suggests a degree of partial convergence. Key shifts include Poland’s transition to a lower-risk cluster and Spain’s move to a higher-risk group, while Southern Europe generally remains highly susceptible. This research underscores the dynamic and multifaceted nature of energy poverty, highlighting the necessity for targeted, context-specific policies. Addressing energy poverty is crucial for enhancing household resilience and achieving truly comprehensive energy security throughout the EU, especially amid the ongoing energy transition and potential future socio-economic shocks.

1. Introduction

The concept of energy security has evolved from a narrow focus on uninterrupted fossil fuel supply to a comprehensive, multidimensional framework encompassing sustainability, climate action, technological innovation, and social equity. This paradigm shift recognizes that true energy security extends beyond mere resource availability to include accessibility, affordability for all segments of society, and the environmental and social acceptability of energy systems. Within this broadened understanding, energy poverty—the inability of households to secure adequate energy services for a decent standard of living—emerges as a critical socio-economic challenge and a direct manifestation of energy insecurity, particularly impacting the affordability dimension.
The European Union, while striving for a secure, sustainable, and competitive energy system, faces significant disparities in energy poverty levels across its Member States. These disparities are influenced by a complex interplay of household income, energy prices, building energy efficiency, and national policy frameworks. Recent geopolitical and economic shocks, notably the COVID-19 pandemic and the subsequent energy crisis exacerbated by the war in Ukraine, have further underscored the vulnerabilities of European households and highlighted the urgent need for robust monitoring and targeted interventions.

2. Materials and Methods

This paper aims to provide a comprehensive analysis of energy poverty dynamics within the European Union between 2015 and 2023. It deliberately intertwines the macro-level concept of energy security with the household-level phenomenon of energy poverty, arguing that the latter is a critical and inseparable manifestation of the former’s affordability and social acceptability dimensions, which is essential for a truly comprehensive understanding of energy security in our times. Drawing on Eurostat data, primarily from the EU Statistics on Income and Living Conditions (EU-SILC) survey, we examine trends in four key indicators: the inability to keep homes adequately warm, arrears on utility bills, the housing cost overburden rate, and the at-risk-of-poverty rate. Furthermore, a k-means cluster analysis is employed to identify distinct groupings of EU Member States based on their energy poverty profiles in 2015 and 2023, allowing for an assessment of shifts in these patterns over time. By contextualizing these findings within the evolving definition of energy security and the impact of recent crises, this study seeks to contribute to a deeper understanding of the multifaceted nature of energy poverty and inform evidence-based policymaking. This research builds upon the author’s ongoing work exploring various facets of energy security, including those related to the production and consumption of primary energy [1,2], thereby extending the inquiry into the critical social dimensions of energy system performance.
The initial data processing, trend analysis, and data preparation for further investigation were conducted using the R 4.4.0 programming language [3] within the RStudio 2025.05.0 IDE [4]. Subsequently, a k-means cluster analysis was employed to identify distinct groupings of EU Member States based on their energy poverty profiles in 2015 and 2023 using the Python 3.10 programming language [5] in the Visual Studio Code 1.100 IDE  [6]. During the preparation of this manuscript, the author used ChatGPT 4o and Gemini 2.5 models for the purposes of English language quality improvement and supporting the coding process (debugging, commenting, development and testing of ideas).
The remainder of this article is structured as follows: Section 3 describes the theoretical foundations of energy security, chronicling its conceptual evolution and detailing common frameworks and indicators for its assessment, including the 4A model. This section also establishes the link between energy security and energy poverty. Section 4 focuses on energy poverty within the European Union, providing operational definitions and outlining the key Eurostat indicators used, followed by an analysis of their trends at both EU aggregate and Member State levels between 2015 and 2023. Section 5 presents the methodology and results of the k-means cluster analysis, identifying distinct country groupings based on their energy poverty profiles in 2015 and 2023 and examining the shifts between these periods. Finally, the article concludes with a summary of the findings, a discussion of their implications, limitations,  avenues for future research, and overall conclusions.

3. Energy Security

3.1. Energy Security: Definition and Evolution

The concept of energy security has undergone a significant evolution from a narrow, traditional framing to contemporary approaches that integrate sustainable development objectives, climate policy, and technological innovation. Initially, energy security was understood chiefly as the guarantee of uninterrupted deliveries of fossil fuels within centralized supply systems [7]. This traditional paradigm emphasized supply-side and geopolitical dimensions (e.g., access to crude oil), treating energy security as a component of national security. Following the oil shocks of the 1970s, industrialized countries built cooperative mechanisms, most notably the International Energy Agency and the establishment of strategic reserves, yet they largely retained a narrow, supply-centered view of security of supply [8].
Since the 1990s and 2000s, the meaning of energy security has steadily broadened and deepened. Scholars and policymakers began to link the term to environmental and social issues such as energy efficiency, climate protection, and access to modern energy for the poorest segments of society [8]. Yet a single, universally accepted scientific definition remained elusive; as Yergin observed, it is one of the most overused and imprecisely defined concepts in the energy debate [8]. Different authors have emphasized divergent dimensions, political, economic, or otherwise, often in ways that reflected their own ideological agendas [8].
Today, there is broad agreement that energy security is multidimensional and interdisciplinary. Proskuryakova [7] stresses the need to revise classical theories in light of rapid sectoral changes: the expansion of renewables and smart grids, the decentralization of power systems, and emerging environmental and climate challenges. Her research shows that traditional approaches rooted in the realist and liberal strands of international relations theory fail to capture these latest trends adequately. Consequently, the literature increasingly calls for wider frameworks that, beyond resource availability and supply stability, encompass ecological and social considerations as well as resilience to future threats. Fang et al. [9], for instance, introduced the notion of sustainable energy security by adding a fifth component—developability—to the four classical dimensions, capturing a system’s capacity for modernization and adaptation. Applying this expanded Comprehensive Security of Energy Systems (CSES) index to China, they demonstrated that, alongside supply and accessibility, technological development potential is pivotal for long-term energy security.
The social dimension of energy security has also been gaining prominence in recent research. Lee et al. [10] identified a statistically significant relationship between energy security and income inequality: during the early stages of economic development, improvements in energy security may exacerbate inequality, whereas once a certain developmental threshold is reached, further gains in security help reduce disparities. This finding signals the growing incorporation of social justice perspectives into the energy security discourse. Likewise, Strojny et al. [11] noted that contemporary scholarship offers a very wide array of operational definitions, each highlighting different facets and often competing with one another. The absence of a single theoretical approach is not seen as a weakness; rather, it underscores the natural plurality of perspectives within the social sciences and the need to integrate diverse viewpoints to better understand the essence of energy security. Experts nevertheless agree on the urgent need for ongoing conceptual work so that energy security frameworks fully reflect the new realities of the global energy transition [11].
In summary, the evolution of the energy security concept spans a trajectory from a narrow, supply-centered interpretation to a broad, integrated perspective that encompasses supply stability, accessibility, and affordability while simultaneously incorporating climate protection, technological innovation, and the social dimension (development and energy poverty).
From a practical standpoint, the literature traces five successive stages in the concept’s development:
  • Classical approach—a national focus on safeguarding fuel supplies (primarily oil).
  • Coordinative approach (post-1970s crises)—international cooperation to manage shortage risks.
  • Agenda broadening phase (1990s–2000s)—introduction of sustainable development concerns (climate policy, renewables, efficiency).
  • Multidimensional approach (since the 2010s)—the integration of economic, environmental, and social facets, including energy poverty and justice.
  • Dynamic (contemporary) approach—emphasis on system resilience, the minimization of vulnerability, and the role of innovation in shaping future security.
Within this latest stage, increasing attention is devoted to aligning energy security with the low-carbon energy transition and climate policy, as well as to guaranteeing universal access to affordable energy without driving households into energy poverty [9].

3.2. Indicators for Assessing Energy Security

As the definition of energy security has expanded, so too have the tools and metrics designed to measure it. The literature now offers a variety of typologies that seek to capture the concept’s multidimensional character. The most frequently cited approaches include the 4A framework, the distinction between ex ante and ex post metrics, composite indices that aggregate numerous measures, multidimensional indicator matrices, and country-level energy security rankings. Each is outlined below.

3.2.1. Multidimensional 4A Indicators

In the early 2000s, scholars proposed classifying the key elements of energy security into four dimensions—4A [12,13,14]. This framework has since gained widespread acceptance and is now a standard reference point in the literature. The four dimensions are as follows
  • Availability denotes the physical availability of energy carriers in the required quantities [12]. This dimension covers, inter alia, the geological supply of resources (domestic reserves of oil, gas, coal), the level of indigenous energy production, and the degree of import dependence [13]. Traditionally, availability has been regarded as the foremost pillar of energy security. In the EU context, relevant indicators include the energy self-sufficiency ratio, the diversification of the energy basket, and the volume of strategic reserves.
  • Accessibility refers to the physical and geopolitical security of access to energy sources [15]. It encompasses energy infrastructure (transmission networks, pipelines, LNG terminals, interconnectors) together with geopolitical and geographic factors. In the EU, gas crises involving Russia and Ukraine (2006, 2009) illustrate accessibility problems. In regions such as Sub-Saharan Africa, this dimension often signifies the population’s basic physical access to electricity.
  • Affordability concerns the economic dimension of energy security, namely the cost of energy to the economy and society [16,17]. Energy should be available at prices that are acceptable, do not impede economic growth, and do not unduly burden households. Indicators include wholesale and retail energy prices, the share of household budgets devoted to energy, and price stability. This dimension links energy security to a country’s wider economic security.
  • Acceptability encompasses the environmental and social acceptability of energy sector activities and the technologies employed [8]. Its importance has grown markedly with the advent of climate policy imperatives. Indicators include emission levels, the share of clean sources (renewables, nuclear) in the energy mix, and the incidence of social opposition to infrastructure projects [18,19]. In the EU, energy policy is tightly intertwined with climate policy; the drive toward climate neutrality necessitates a transformation of the energy mix, which can pose challenges for supply security and price stability.
Over time, the 4A framework became the conceptual starting point for many composite indicators: each dimension is represented by a set of submetrics (e.g., availability by the energy self-sufficiency ratio or source diversification; affordability by energy expenditure as a share of GDP). Early adopters emphasized that the categories are interlinked and may involve trade-offs; improved environmental acceptability through climate policy can, for instance, temporarily reduce affordability [8]. Today, the 4A approach is widely regarded as canonical in the literature and serves as a standard conceptual lens for energy security assessment.

3.2.2. Ex Post vs. Ex Ante Indicators

Ex post metrics capture the effects of past shocks (e.g., price volatility, outage days), whereas ex ante metrics anticipate potential risks through proxies such as import dependence or supplier concentration, thereby signaling system vulnerability [16].

3.2.3. Composite Aggregate Indices

Multidimensional indices merge numerous sub-metrics into a single score, but differing choices of indicators, weights, and normalization can skew comparability [13,20]. A well-known example is the 25-item AESPI, which rates countries 0–10 for retrospective and prospective analysis [21].

3.2.4. Indicator Matrices and Multi-Criteria Approaches

Dashboards such as the Energy Security Matrix map technical, economic, and political vulnerabilities across subsectors, allowing scenario testing without collapsing results into one headline figure [14].

3.2.5. Rankings and Institutional Indicators

International bodies deploy their own tools—e.g., the World Energy Council’s Trilemma Index and the EU’s import dependency ratio, often complemented by diversification metrics. Reviews show that while such sets proliferate, many overlook fast-moving market, policy, and trade dynamics, underscoring the need for ever more interdisciplinary assessment [13,14,22].

3.3. Energy Poverty and Energy Security

Energy poverty is a complex socio-economic issue that has gained increasing prominence in the European Union’s policy agenda in recent years. It is generally defined as a situation in which a household is unable to secure an adequate level of energy services—such as heating, cooling, lighting, and energy for cooking and powering essential appliances—that are necessary to ensure a decent standard of living, health, and full participation in society [23,24].
Energy poverty is a phenomenon distinct from general income poverty, although the two are strongly correlated [25,26]. A household may experience energy poverty even if its income is above the official poverty line—for instance, if it resides in a dwelling with very low energy efficiency, resulting in extremely high energy needs for heating. The core drivers of energy poverty are typically identified as a combination of three main factors:
  • Low household income.
  • High energy prices (relative to income).
  • Poor energy efficiency of residential buildings and appliances [23,24].
Historically, energy poverty was often identified using simpler, expenditure-based metrics. Foundational concepts included the `10% rule’, which defined a household as fuel-poor if it needed to spend more than 10% of its income on energy, and later the Low-Income High-Cost (LIHC) framework, which classified households as energy-poor if they had both relatively low incomes and higher-than-average energy costs [27]. While these approaches were crucial in establishing the field, the contemporary understanding adopted by the EU has evolved towards a more multidimensional view that encompasses not just affordability but also access to essential services and housing quality, as reflected in the indicators discussed below.
The issue of energy poverty can be analyzed through the lens of the 4A energy security framework, as it reflects deficiencies in at least three of its key dimensions:
  • Affordability. This is the most direct and visible linkage. When energy costs account for an excessively high share of household budgets, households may be forced to reduce their energy consumption below necessary levels or sacrifice other basic needs (e.g., food, medicine, education) to pay utility bills [17,28,29].
  • Availability/Accessibility. While access to electricity networks is nearly universal in most EU countries, certain regions—especially rural, remote, or less developed areas—may still lack access to modern energy infrastructure, such as gas grids or stable electricity networks capable of supporting modern heating systems [25]. Limited access to more efficient or affordable energy carriers may compel residents to rely on more expensive (e.g., electric resistance heating) or environmentally and health-wise harmful alternatives (e.g., low-quality solid fuels).
  • Acceptability. This dimension relates to energy poverty, primarily through the quality of housing stock. Poor energy performance of buildings (e.g., lack of insulation, leaky windows), which significantly increases energy demand, is often associated with broader housing deficiencies such as dampness and mold, which negatively impact residents’ health and comfort [29]. Improving energy standards in buildings—part of efforts toward greater environmental acceptability (e.g., emission reductions) and social acceptability (e.g., improved living conditions)—is also a key tool for combating energy poverty [24]. Additionally, low-income households may be forced to rely on energy sources that are cheap but environmentally or health-wise unacceptable.

4. Energy Poverty in the European Union

4.1. Definitions and Indicators

Energy poverty is a complex socio-economic phenomenon that has gained increasing prominence in the political agenda of the European Union in recent decades. Although for a long time, there was no unified, formal definition at the EU level—making consistent monitoring and comparison across Member States difficult—there was broad consensus regarding its fundamental causes and manifestations. It has been widely understood as a situation in which households are unable to meet their basic energy needs, such as adequate heating, cooling, lighting, and the powering of appliances, at affordable costs [30]. The key factors leading to energy poverty are generally recognized as a combination of three elements: low household income, high energy expenditures (often representing a disproportionately large share of the household budget), and low energy efficiency of the residential buildings and appliances in use [31].
A major breakthrough was the introduction of the first EU-wide definition of energy poverty under the “Fit for 55” package. Both the regulation establishing the Social Climate Fund (SCF) and the revised Energy Efficiency Directive (EED) of 2023 define energy poverty as `a household’s lack of access to essential energy services that provide a basic and decent standard of living and health, including adequate heating, hot water, cooling, lighting, and energy to power appliances, in the relevant national context, taking into account existing social policy and other relevant policies.’ [32]. This definition emphasizes access to energy services rather than mere access to energy itself and explicitly acknowledges the national context.
The analysis of energy poverty in this article is based on four indicators available in the Eurostat database, primarily derived from the European Union Statistics on Income and Living Conditions (EU-SILC) survey. The analysis utilizes all available data for the 27 EU Member States for the specified years, with Eurostat’s aggregate figures inherently accounting for any changes in membership composition during the period. It should be noted, however, that each of these indicators has its own specific characteristics and limitations, and a comprehensive understanding of the phenomenon requires their combined interpretation. We will analyze the following indicators [30]:
  • Inability to Keep Home Adequately Warm (Eurostat code: ilc_mdes01)
    Definition: This indicator measures the share of individuals in the population who report that their household cannot afford to keep their home adequately warm. The EU-SILC survey question refers to the subjective assessment of the household’s financial ability to maintain an adequate indoor temperature, regardless of whether the household actually experiences the need for heating at the time of the survey.
    Relevance to Energy Poverty: This is one of the most direct indicators reflecting the inability to meet a basic energy need—thermal comfort—due to financial constraints. A high value of this indicator directly points to issues of energy affordability related to heating.
    Limitations: The main limitation is the subjectivity of the assessment. As pointed out by the EU Energy Poverty Observatory [33], what constitutes an ’adequate temperature’ may vary significantly not only due to individual preferences, age, or gender but also across countries due to different climatic conditions and cultural norms regarding thermal comfort. This can introduce a regional bias, where the same response might reflect different objective conditions in different parts of the EU.
  • Arrears on Utility Bills (Eurostat code: ilc_mdes07)
    Definition: This indicator measures the share of individuals living in households that, over the past 12 months, have been in arrears on utility bills (heating, electricity, gas, water) due to financial difficulties. The EU-SILC survey asks, `In the last twelve months, has the household been in arrears, meaning unable to pay on time due to financial difficulties, utility bills (heating, electricity, gas, water) for the main dwelling?’
    Relevance to Energy Poverty: Arrears on utility bills are a clear signal of a household’s financial struggles in covering basic living expenses, including energy costs. It is considered an objective (though self-reported) indicator of payment difficulties.
    Limitations: The indicator includes all utility bills, including water, and not solely energy-related bills, which may slightly overestimate the extent of strictly energy-related poverty. More importantly, it does not capture so-called `hidden energy poverty,’ where households avoid arrears by drastically reducing their energy consumption, often below levels necessary for comfort and health. Additionally, it does not account for the presence of support mechanisms, such as social tariffs, emergency assistance, or installment payment plans, which may help households avoid arrears despite financial hardship.
  • Housing Cost Overburden Rate (Eurostat code: ilc_lvho07c)
    Definition: This indicator measures the percentage of the population living in households where total housing costs (after the deduction of housing allowances) exceed 40% of the household’s disposable income (also after deduction of housing allowances). Housing costs include rent (for tenants), mortgage interest payments (for owners), utility bills (water, electricity, gas, heating), insurance, local taxes, and the costs of regular maintenance and repairs.
    Relevance to Energy Poverty: Although this indicator measures the overall burden of housing costs rather than energy costs specifically, it is relevant because energy expenditures often constitute a significant part of total housing expenses. Excessive housing costs can restrict a household’s ability to meet other basic needs and may signal a risk of energy poverty, particularly when combined with the low energy efficiency of the dwelling.
    Limitations: The 40% income threshold is set arbitrarily. The indicator covers a broad range of housing costs, not just energy-related expenses, meaning that a high value does not necessarily point to problems with energy costs specifically. Moreover, it does not directly measure thermal comfort or energy efficiency.
  • At-Risk-of-Poverty Rate (AROP) (Eurostat code: ilc_li02)
    Definition: The at-risk-of-poverty (AROP) rate measures the proportion of individuals whose equivalent disposable income (after social transfers) falls below the at-risk-of-poverty threshold, set at 60% of the national median equivalent disposable income (after social transfers). Equivalent disposable income is calculated by adjusting household income for household size and composition using the modified OECD equivalence scale.
    Relevance to Energy Poverty: Low income is one of the three main risk factors for energy poverty. Individuals at risk of income poverty, by definition, have limited financial resources, making it more difficult for them to afford energy costs, especially in the context of high prices or poor energy efficiency of their dwellings. AROP serves as a key contextual indicator for analyzing energy poverty. It is also one of the three components of the broader AROPE indicator (At Risk of Poverty or Social Exclusion).
    Limitations: AROP is a relative, not an absolute measure—the poverty threshold depends on the overall income level in a given country and year. This means that a person considered at risk of poverty in one country might not be classified as such in another. Moreover, this indicator does not directly measure energy expenditure, housing conditions, or thermal comfort.

4.2. Analysis of Trends of Selected Indicators in European Union Countries

An analysis of the dynamics of average values of selected indicators for the European Union (based on the weighted average for EU27 countries) allows for the identification of general trends in energy poverty and the assessment of the impact of major events, such as the post-2021 energy crisis.
Inability to Keep Home Warm: As shown in Figure 1 and Table 1, the average share of the EU27 population reporting an inability to keep their home adequately warm displayed a clear downward trend from 2012 until 2019, when it reached its lowest level of 6.9%. After a slight increase in the pandemic year 2020 and a return to 6.9% in 2021, the indicator surged to 10.6% in 2023.
Arrears on Utility Bills: Similar to the heating-related indicator, the share of the EU27 population in arrears on utility bills also followed a declining trend before 2019, falling to 6.2%. However, since 2020, this indicator has begun to rise. Although the increase was not as dramatic as it was for the inability to heat one’s home, it reversed the previous positive trajectory.
Housing Cost Overburden: The trend for the housing cost overburden indicator in the EU27 mirrors that of arrears on utility bills, but it reached its lowest point a year later in 2020 (7.8%). In subsequent years, a slight increase occurred, although the indicator remained below earlier levels. It is important to note that this indicator covers all housing-related costs, not only energy expenditures.
Persons at Risk of Poverty: Data for the at-risk-of-poverty (AROP) rate in the EU27 is available from 2015 onward and shows a trend similar to the indicators discussed above. Its value decreased from 24% in 2015 to 21.1% in 2019, followed by a modest increase. Despite the pandemic, the energy crisis, the war in Ukraine, and rising inflation, the overall poverty risk indicator at the EU level did not exhibit a sharp increase during 2022–2023.
In addition to trend analysis at the EU-wide level, it is essential to understand the heterogeneity of energy poverty conditions across individual Member States. A comparison of data from 2015 and 2023 enables an assessment of both the persistence of geographical patterns of energy poverty and potential shifts in the relative positions of specific countries.
A clear geographical divide is observed, with Southern and Eastern European countries generally exhibiting significantly higher indicator values than those in Northern, Central, and Western Europe.
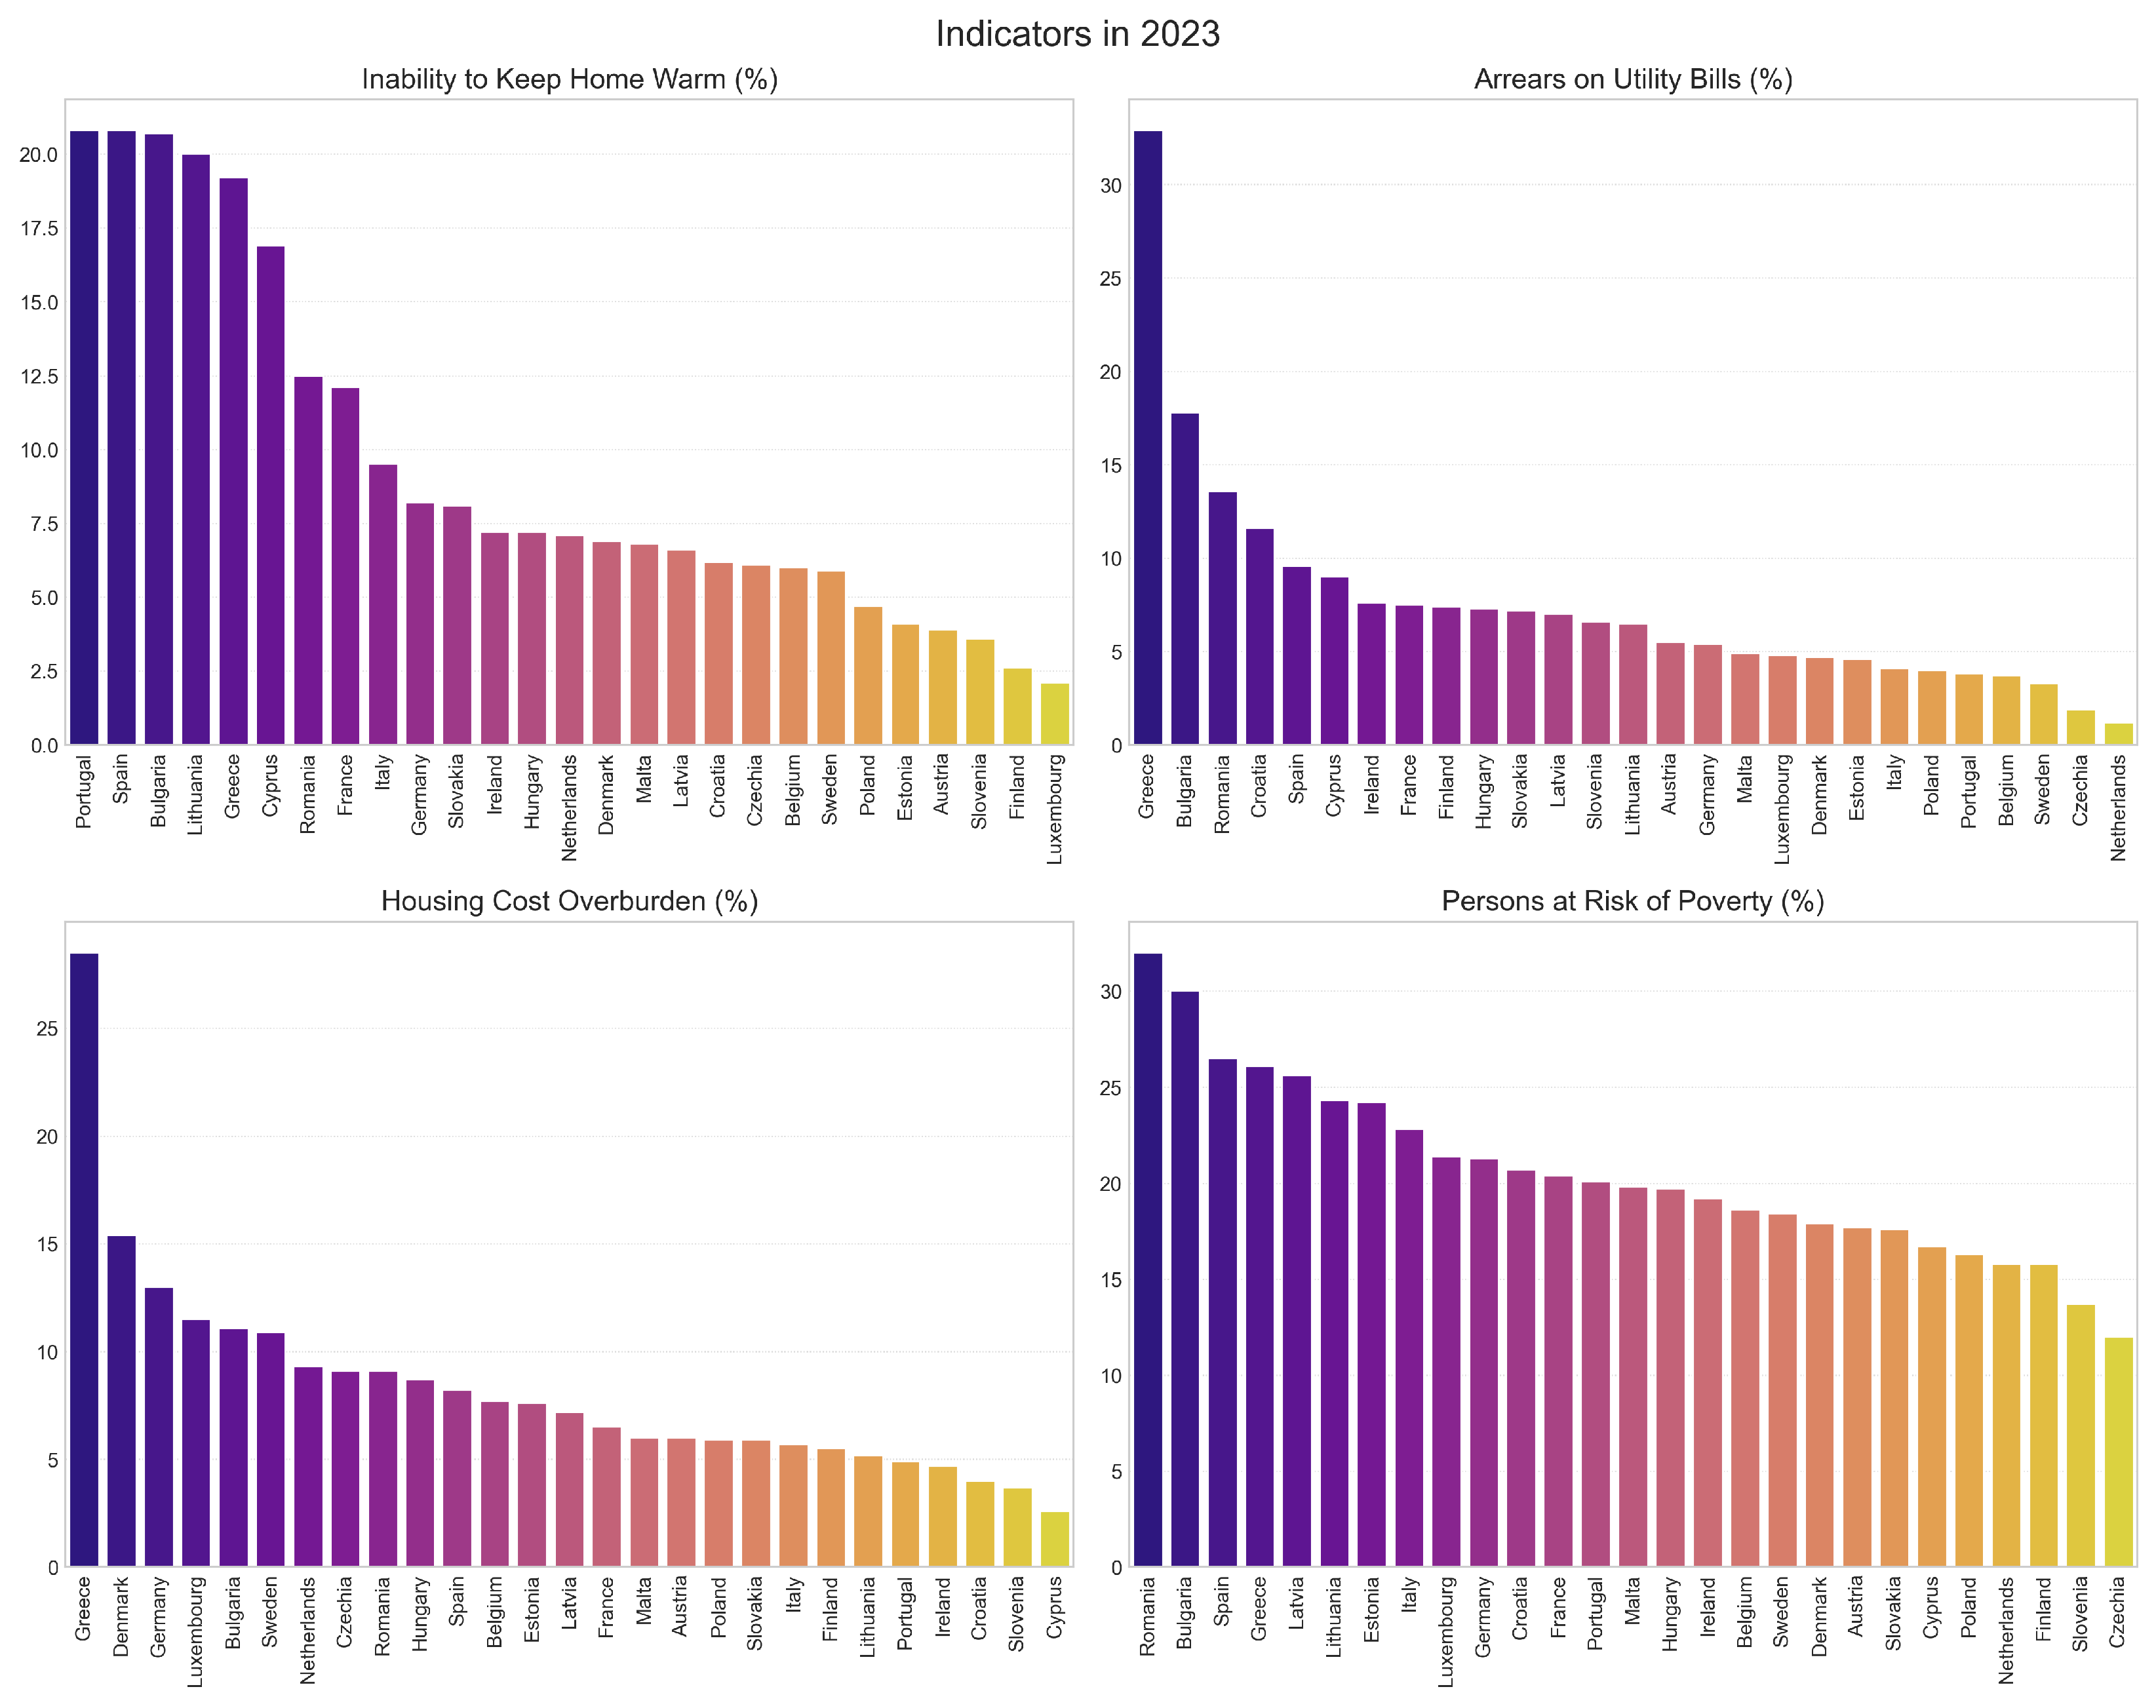
Inability to Keep Home Warm: In 2023, the highest rates of the reported inability to keep the home adequately warm were recorded in Spain (20.8%), Portugal (20.8%), Bulgaria (20.7%), Lithuania (20.0%), and Greece (19.2%). At the opposite end of the spectrum were Luxembourg (2.1%), Finland (2.6%), and Slovenia (3.6%). Particularly substantial increases in this indicator were observed in Spain (+10.2 pp) and France (+6.6 pp). However, several countries—especially those with historically high values—such as Bulgaria (•18.5 pp), Cyprus (•11.4 pp), Lithuania (•11.1 pp), and Greece (•10.0 pp)—recorded significant decreases.
Arrears on Utility Bills: In 2023, the highest shares of individuals in arrears on utility bills were recorded in Greece (32.9%), Bulgaria (17.8%), and Romania (13.6%). The lowest values of this indicator were observed in the Netherlands (1.2%), Czechia (1.9%), and Sweden (3.3%).
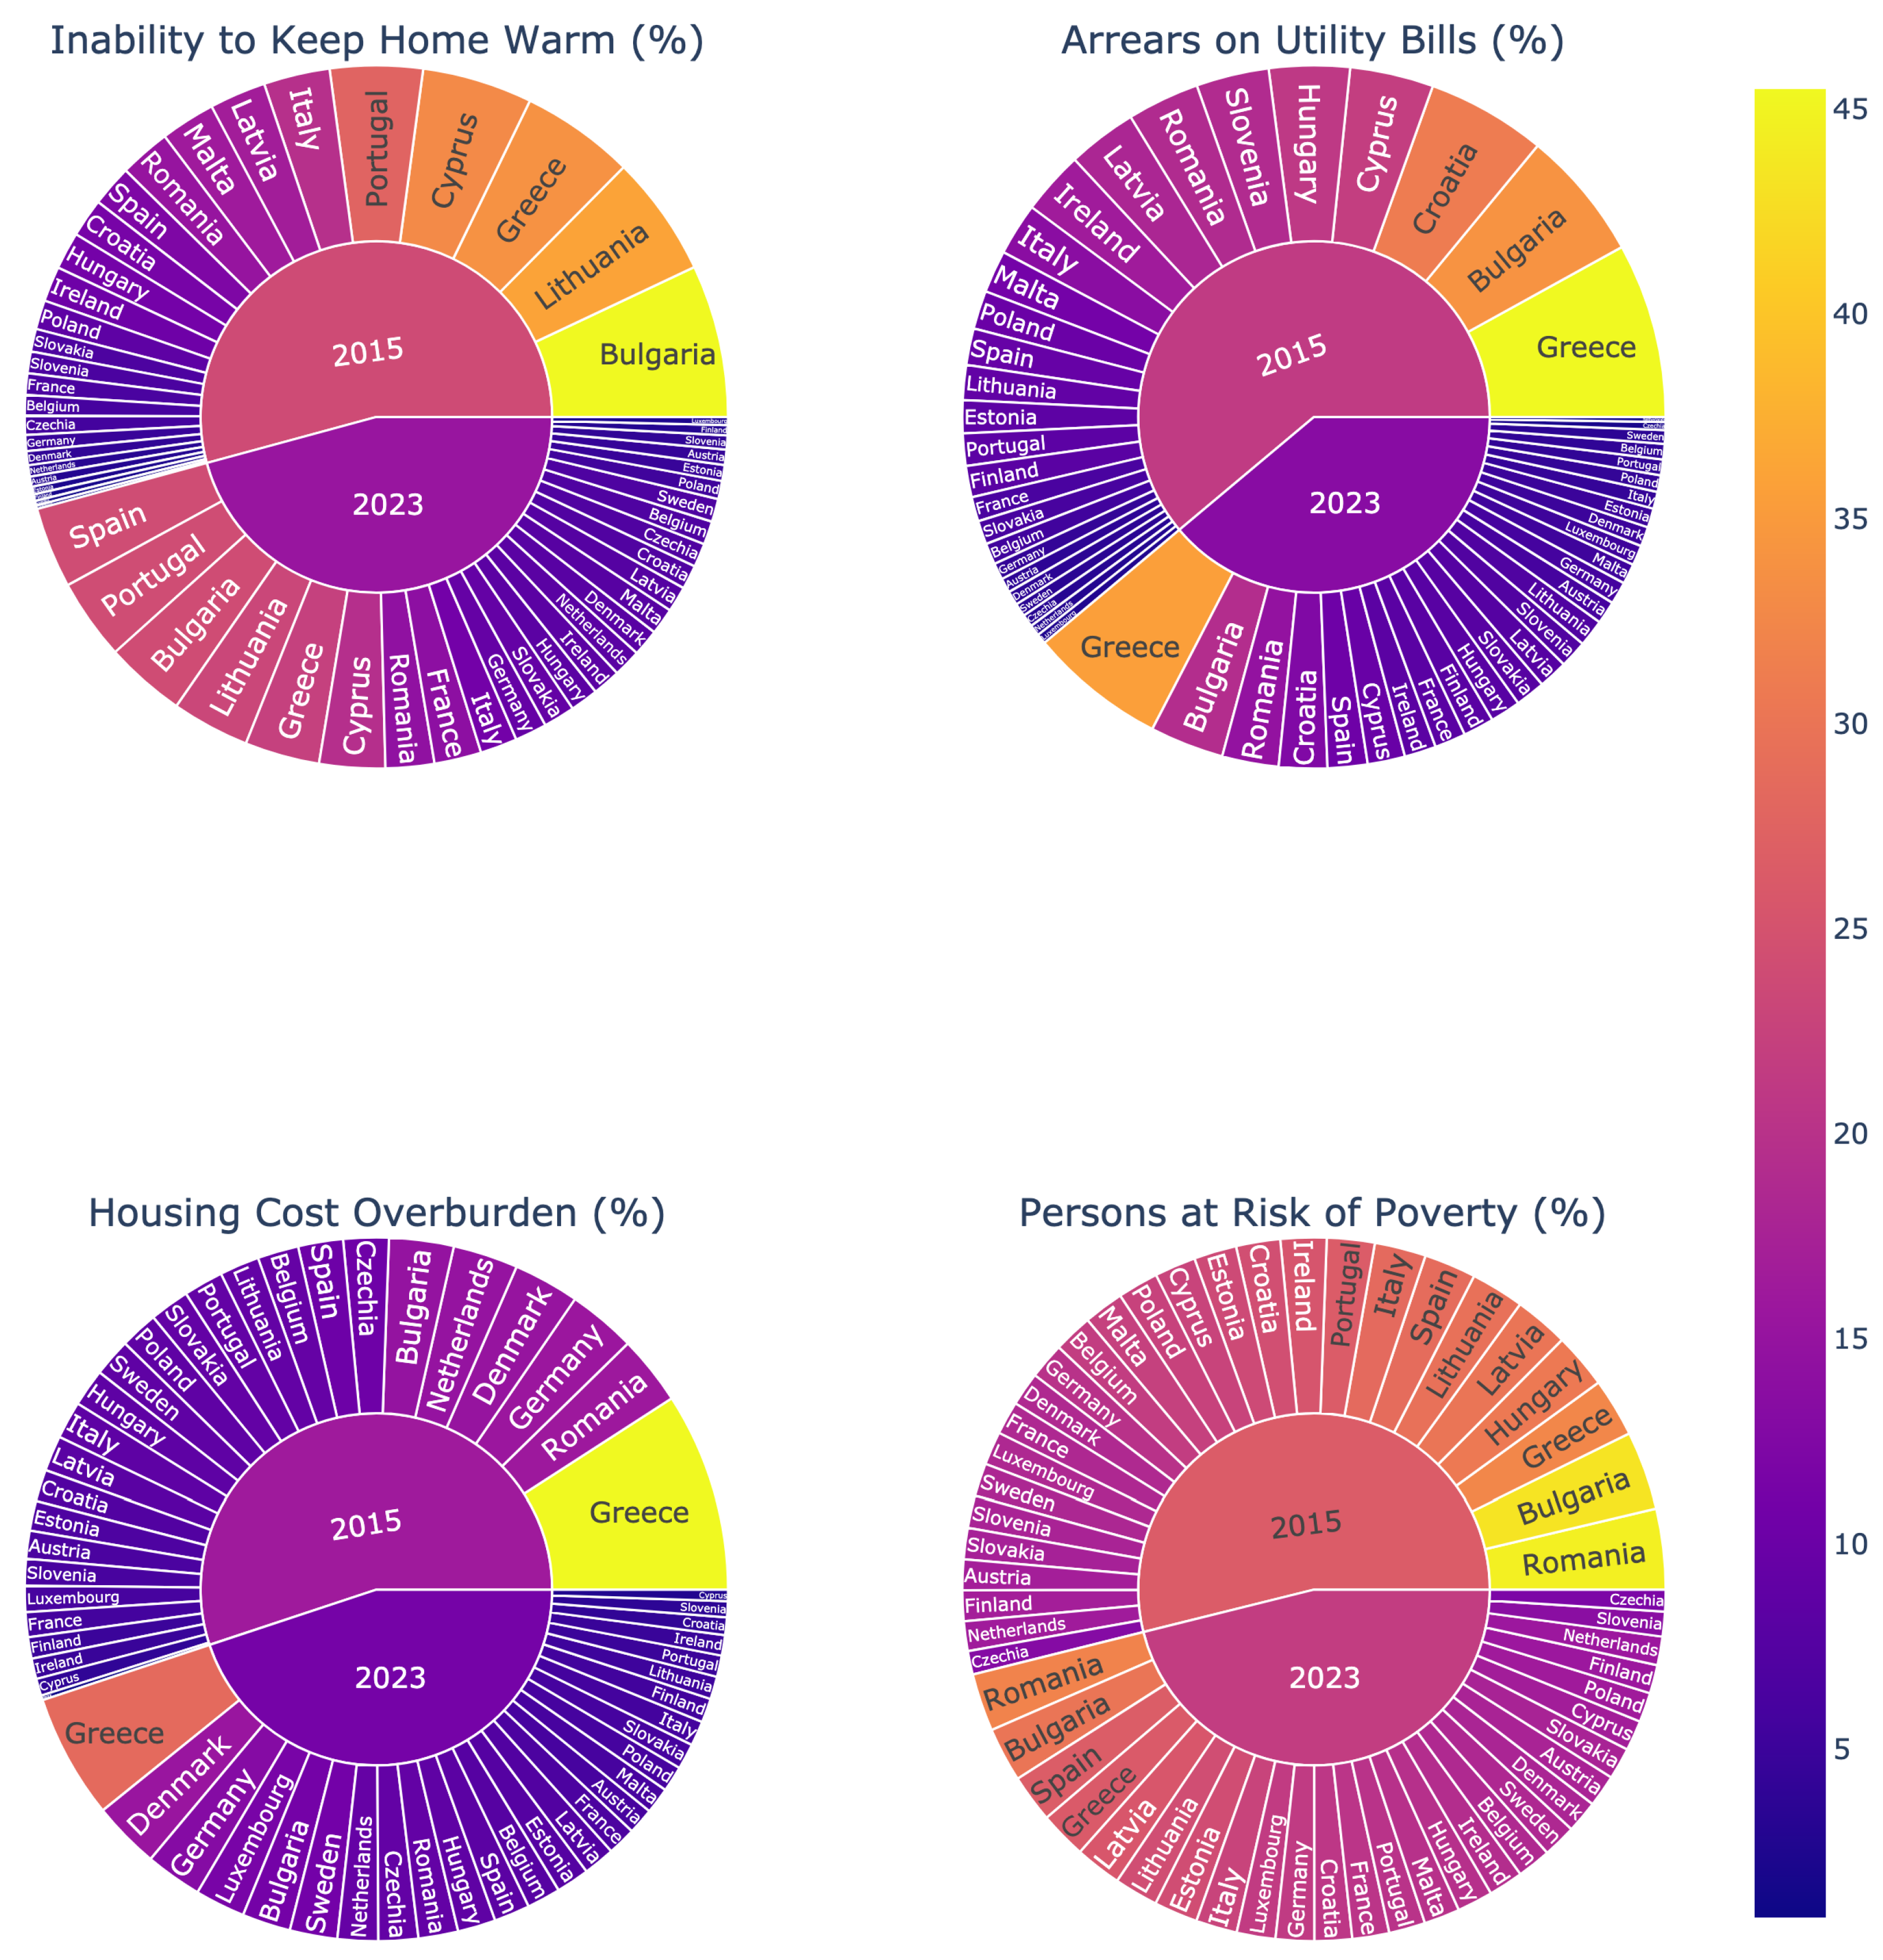
Compared to 2015, the situation worsened slightly in several countries, though the increases were relatively modest—for example, Luxembourg (+2.4 percentage points), Austria (+2.0 pp), and France (+1.6 pp). In contrast, many countries experienced a significant decline in this indicator. The largest improvements were recorded in Croatia (•17.1 pp), Bulgaria (•13.6 pp), Hungary (•12.1 pp), and Cyprus (•11.1 pp).
Housing Cost Overburden: In 2023, by far the highest housing cost overburden rate was observed in Greece (28.5%), significantly exceeding the next highest countries—Denmark (15.4%) and Germany (13.0%). The lowest rates were recorded in Cyprus (2.6%), Slovenia (3.7%), and Croatia (4.0%).
Compared to 2015, this indicator dropped significantly in Greece (by 17 pp), Romania (•6.8 pp), and the Netherlands (•5.6 pp). Increases were recorded in Luxembourg (+5.5 pp), Malta (+4.9 pp), and Sweden (+2.2 pp). In many countries, the indicator remained relatively stable or declined slightly.
This indicator exhibits a different geographical pattern compared to the previous ones: high values are also found in countries with generally high living costs, such as Denmark, Germany, and Luxembourg.
Persons at Risk of Poverty: In 2023, the highest at-risk-of-poverty (AROP) rates were recorded in Romania (32.0%), Bulgaria (30.0%), Spain (26.5%), and Greece (26.1%). The lowest rates were observed in Czechia (12.0%), Slovenia (13.7%), the Netherlands (15.8%), and Finland (15.8%).
Compared to 2015, this indicator decreased in most EU Member States. The largest reductions were noted in Bulgaria (•13.3 percentage points), Romania (•12.5 pp), and Hungary (•10.9 pp). Slight increases were observed in Luxembourg (+3.0 pp), France (+2.0 pp), Germany (+1.3 pp), and Austria (+0.8 pp).
The overall downward trend in many countries—despite the energy crisis—suggests once again that factors beyond current income levels (such as energy prices and energy efficiency) have played a crucial role in the recent increases in energy poverty-specific indicators.
Key Insights: The trend analysis clearly identifies the post-2019 period as a critical turning point, particularly for indicators directly related to energy affordability. The sharp increase in energy prices—driven by post-pandemic economic recovery, supply chain disruptions, and the Russian invasion of Ukraine—contributed to the deterioration of household conditions across the EU. This reversal of previous, often long-term, positive trends highlights the vulnerability of the EU population to energy market price shocks.
A comparison of trends in income poverty indicators and energy-specific indicators (heating and utility arrears) suggests that the energy crisis had a distinct and additional impact on household budgets, independent of general income trends. While the at-risk-of-poverty rate slightly declined during 2022–2023, the inability to adequately heat one’s home increased sharply. This underscores the importance of analyzing energy poverty as a separate phenomenon rather than merely a derivative of general income poverty.
It should be emphasized that the dynamics of the indicators over the analyzed period are generally positive, and the situation has improved in most EU member states.
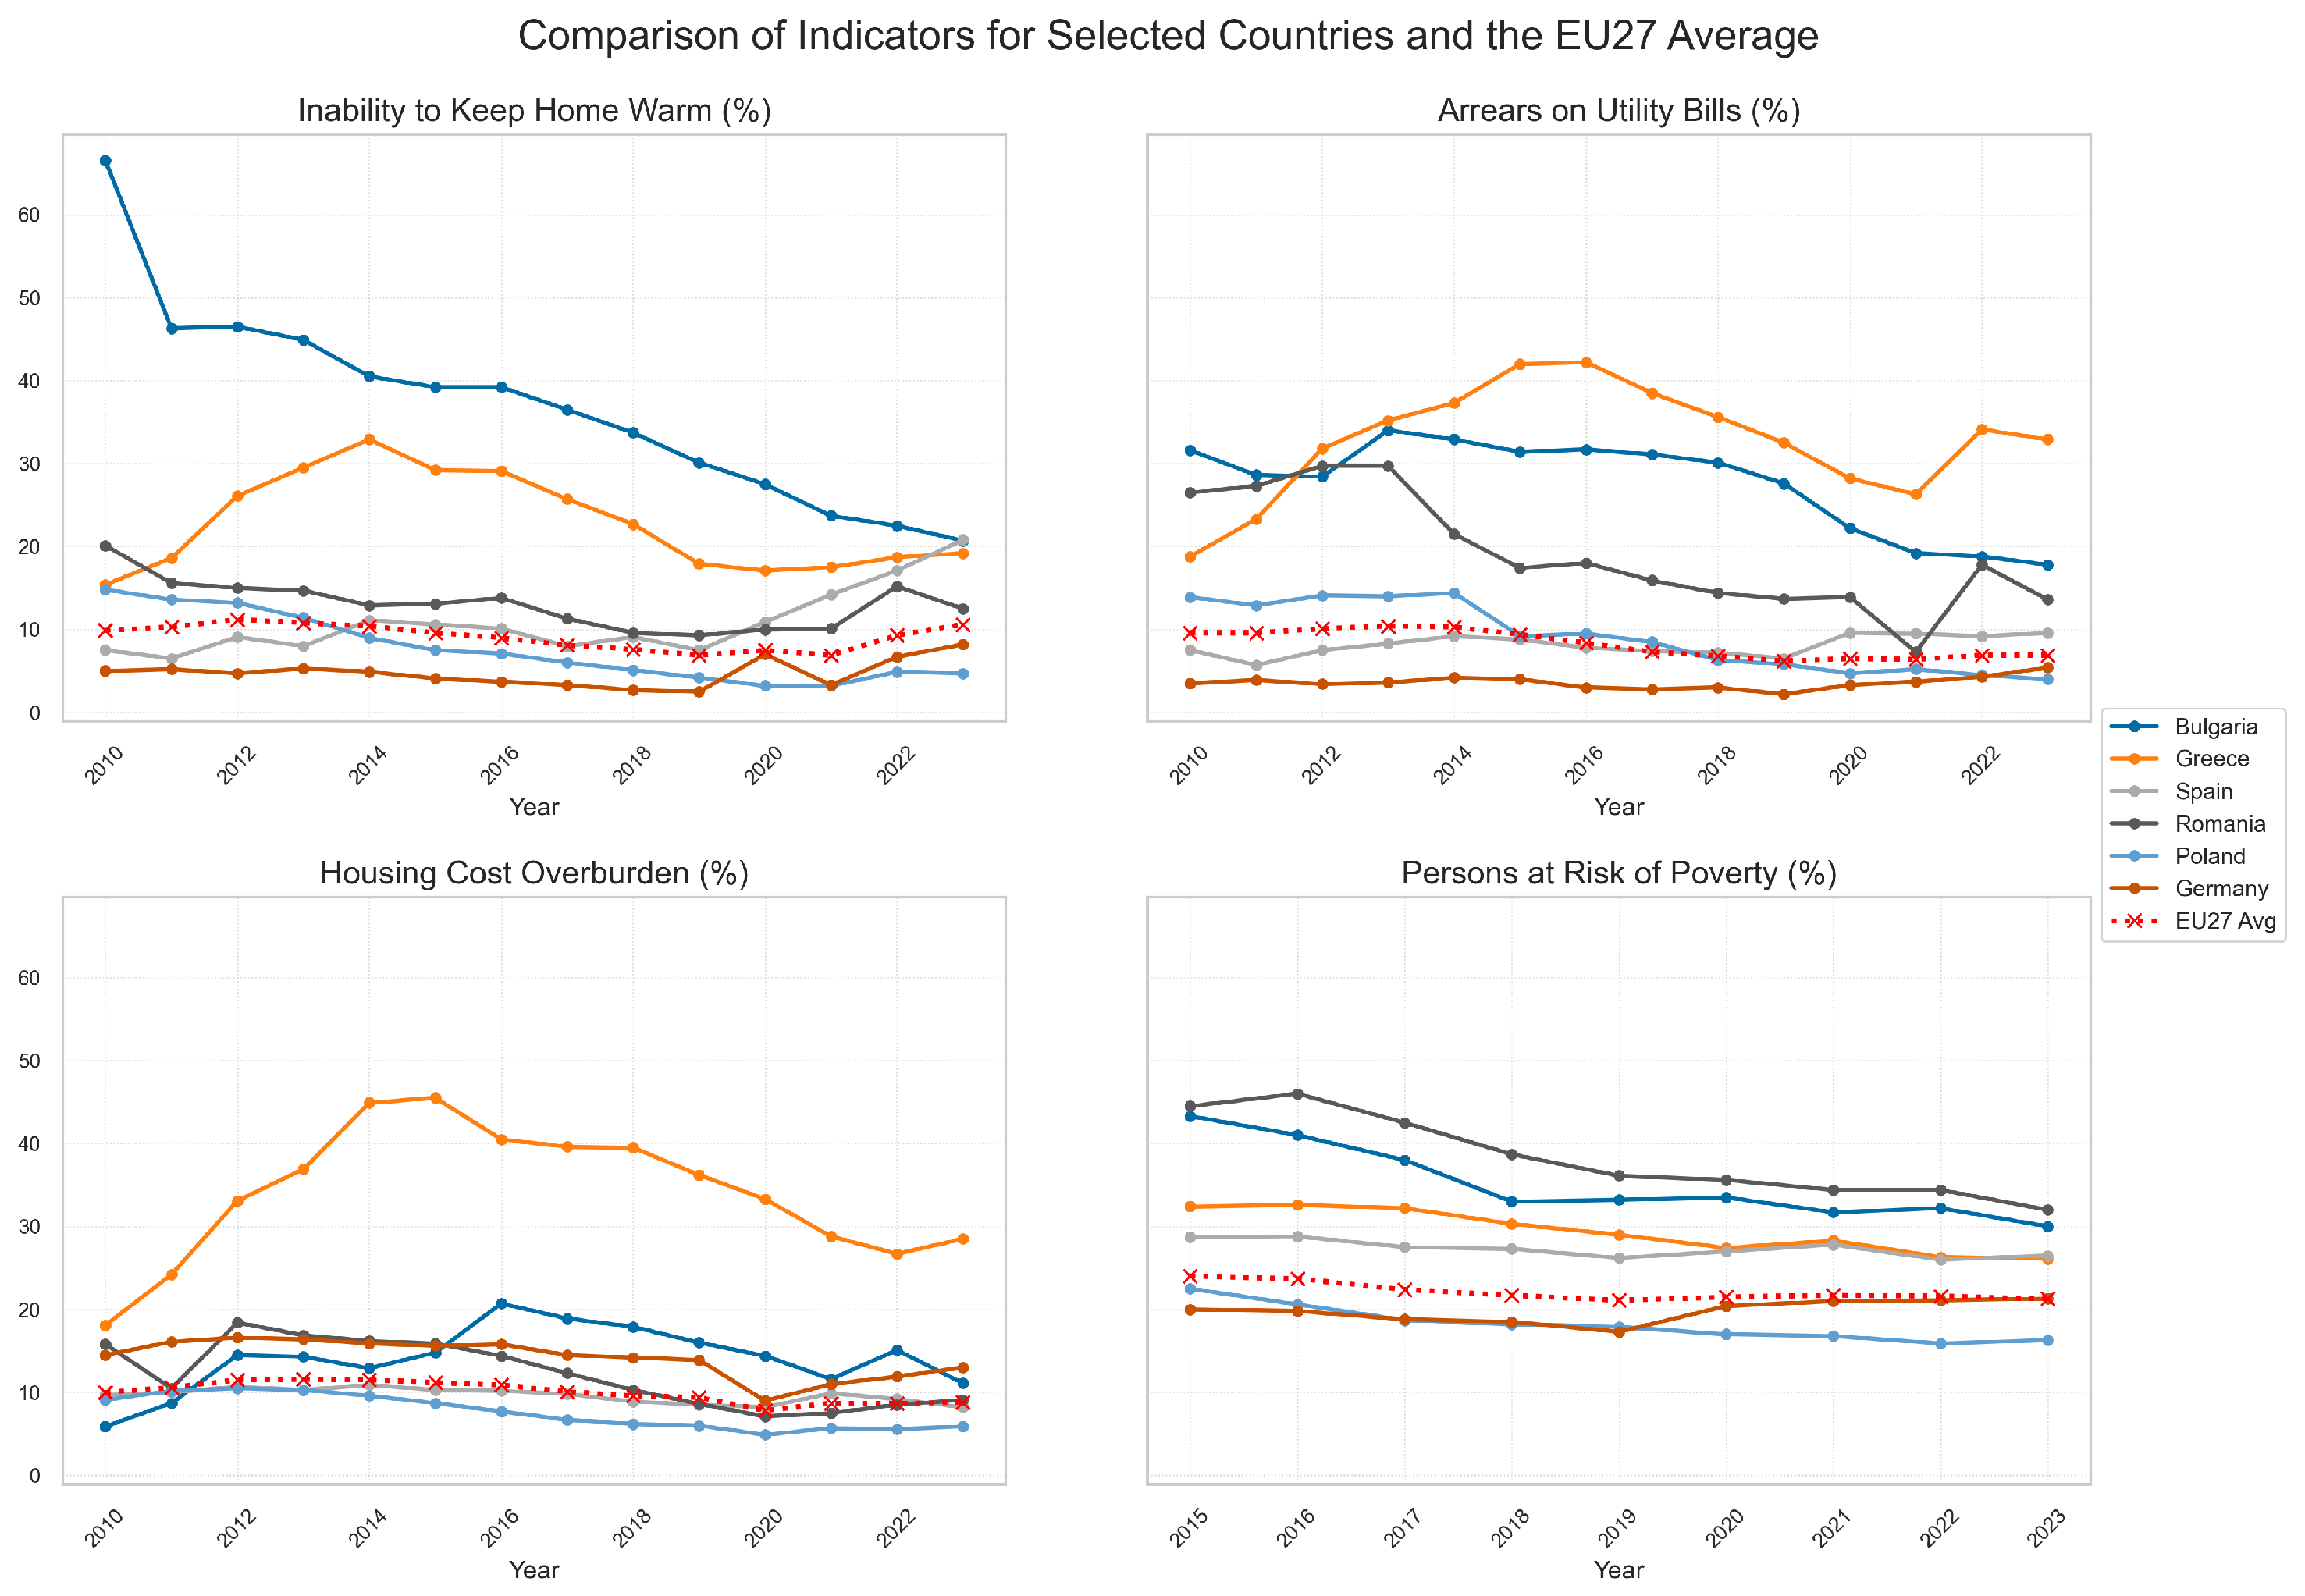
Figure 2 illustrates the comparative dynamics of indicators for selected countries. Those countries represent different geographical regions and energy poverty profiles: Germany (a low-risk Western EU country), Poland (an improving Central European country), and Spain and Greece (Southern EU countries with high or deteriorating indicators). Figure 3 presents the values of the indicators across individual Member States in the year 2023. It consists of four separate bar charts, one for each indicator, where Member States are ranked in descending order. This format allows for an immediate visual assessment of the countries facing the most significant challenges in each specific dimension of energy poverty in the most recent year of analysis. Figure 4, in turn, compares the indicator values for the years 2015 and 2023. It utilizes a radial chart format, where two values are juxtaposed for each country—from 2015 (upper ring) and 2023 (lower ring). This visualization technique enables a direct comparison of the changes over time for each Member State, making it easy to identify countries that have seen the most significant improvement or deterioration.

5. Cluster Analysis

5.1. Theoretical Introduction

Cluster analysis is an unsupervised statistical technique that groups objects so that members of the same cluster are internally similar while remaining as distinct as possible from those in other clusters. It reveals hidden structure, aids dimensionality reduction, and supports the interpretation of complex data. Among many clustering procedures, the k-means algorithm introduced by MacQueen [34] remains especially influential. Broad surveys of clustering theory, advantages, and pitfalls are given by Jain and Dubes [35], Kaufman and Rousseeuw [36], Xu and Wunsch [37], Mirkin [38], Everitt et al. [39], and Hennig, who proposed a `true-cluster’ validation criterion [40].
The k-means routine repeatedly assigns observations to their nearest centroids and recalculates those centroids to minimize within-cluster squared deviations [41,42,43]. Its main assets are straightforward implementation, fast convergence, and linear scalability, which make it suitable for very large data sets; moreover, its clusters are usually easy to interpret. Nevertheless, outcomes depend on the initial centroid positions and can be distorted by outliers; the method implicitly assumes roughly spherical, equally sized clusters, is sensitive to feature scaling, and requires a user-chosen value of k.
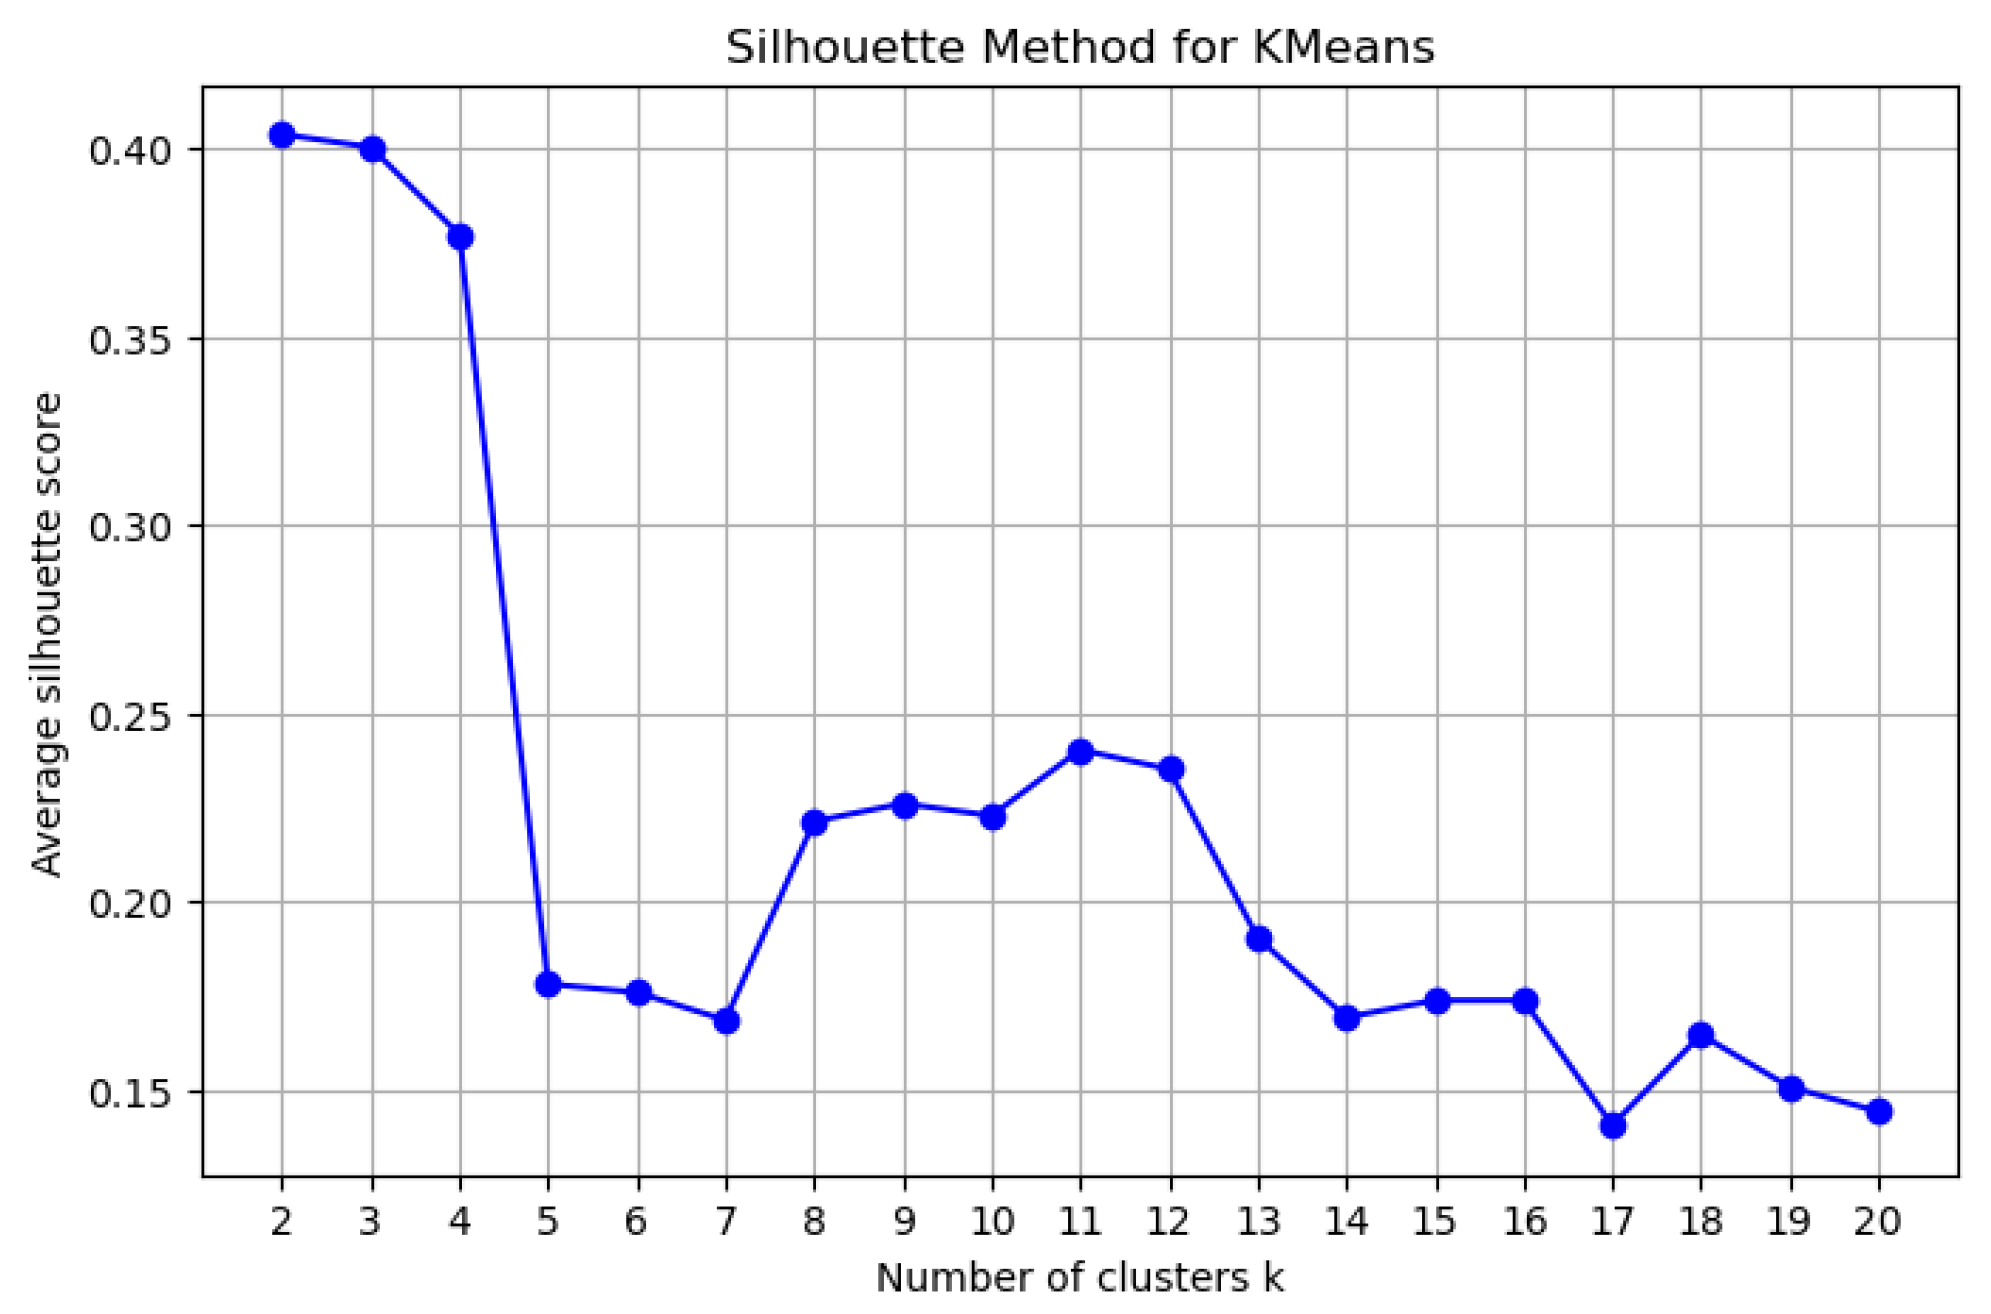
Selecting the optimal k is typically guided by two heuristics. The elbow approach plots the total within-cluster sum of squares (WSS) against successive k values and chooses the point where the decline in WSS noticeably flattens [43,44,45]. Alternatively, the silhouette coefficient compares a point’s cohesion inside its cluster with its separation from neighboring clusters; the k yielding the highest average silhouette is preferred, and the measure generalizes beyond k-means [36,46].

5.2. Results

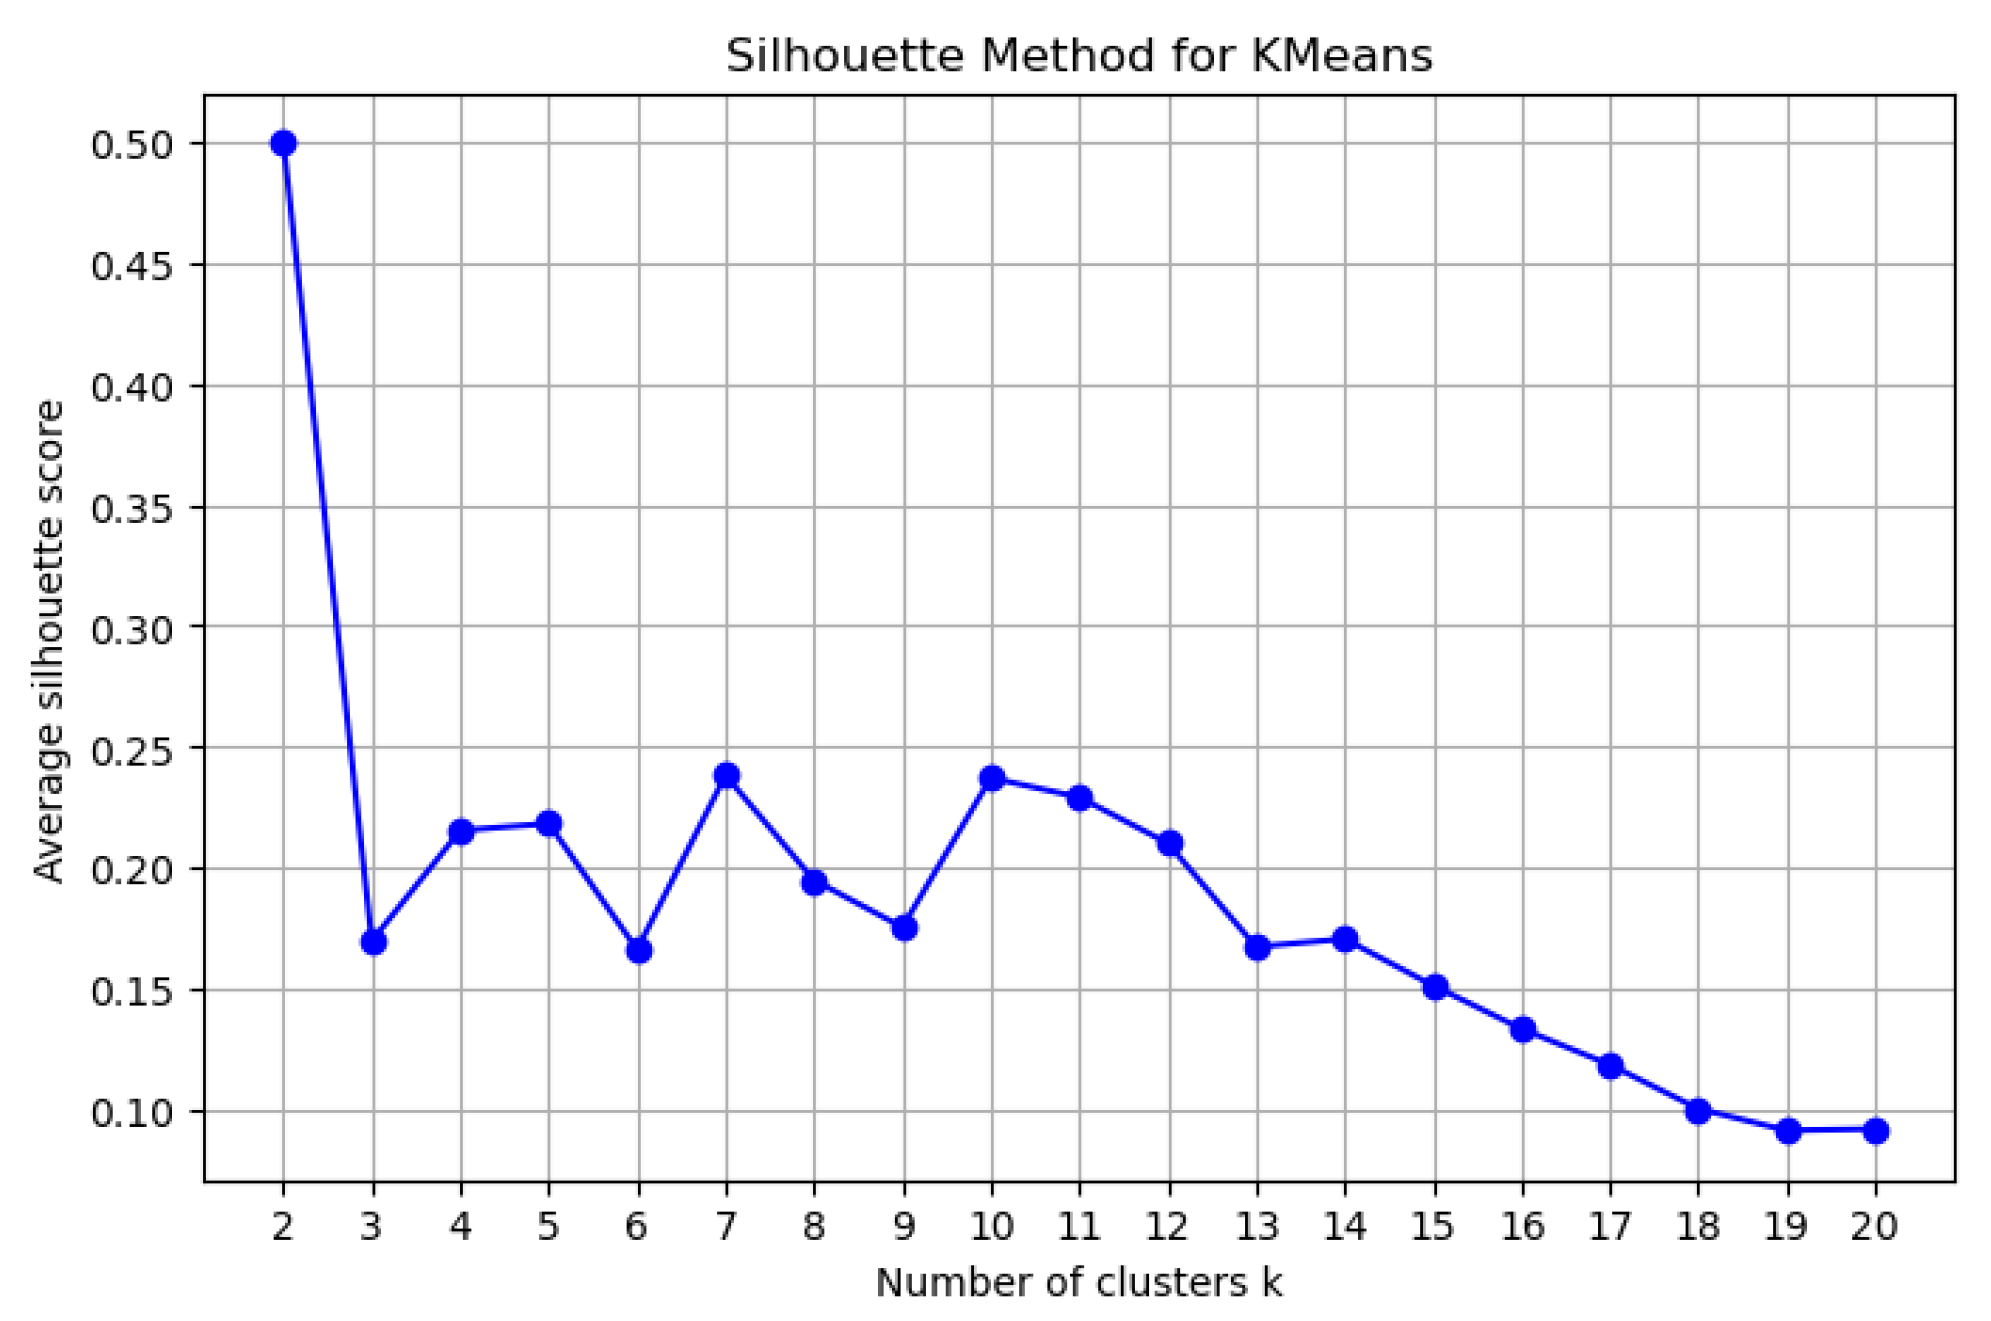
The analysis draws on Eurostat data, covering all EU Member States. A k-means clustering algorithm was applied to group countries with comparable levels of energy poverty. Prior to applying the algorithm, all four indicators were standardized. This procedure ensures that each variable contributes equally to the distance calculations, regardless of its original scale or variance. The optimal number of clusters was determined using the silhouette analysis. Based on this heuristic, the procedure produced eight clusters for 2015 and seven clusters for 2023, with the differing numbers reflecting the model’s adaptation to the evolving data distribution. Cluster labels were subsequently ordered by increasing risk: Cluster 1 designates countries with the lowest incidence of energy poverty in a given year, whereas the final cluster aggregates the Member States facing the highest risk. Cluster-level means of the indicators were used to characterize overall living standards and energy-related challenges within each group. Comparing the cluster assignments in 2015 and 2023 makes it possible to trace each country’s trajectory over time.
The 2015–2023 window encompasses two distinct sub-periods. From 2014 to 2019, the EU experienced a gradual economic recovery from the global financial crisis and the euro-area crisis, which fostered a broad decline in energy poverty. By contrast, 2020–2022 were dominated first by the COVID-19 pandemic shock and then by a sharp energy crisis, triggered by a surge in gas and electricity prices that peaked in 2021/2022, partly as a consequence of Russia’s invasion of Ukraine. These shocks reversed earlier gains: in 2022, the share of EU residents unable to keep their homes adequately warm rose to about 9.3% (up from 6.9% in 2021) and climbed further to 10.6% in 2023. The clustering analysis accounts for these dynamics, and the interpretation of the results considers, inter alia, the moderating effects of government interventions (e.g., energy-price shields) and the long-term structural factors that shape energy poverty.

5.2.1. Cluster Profiles for 2015

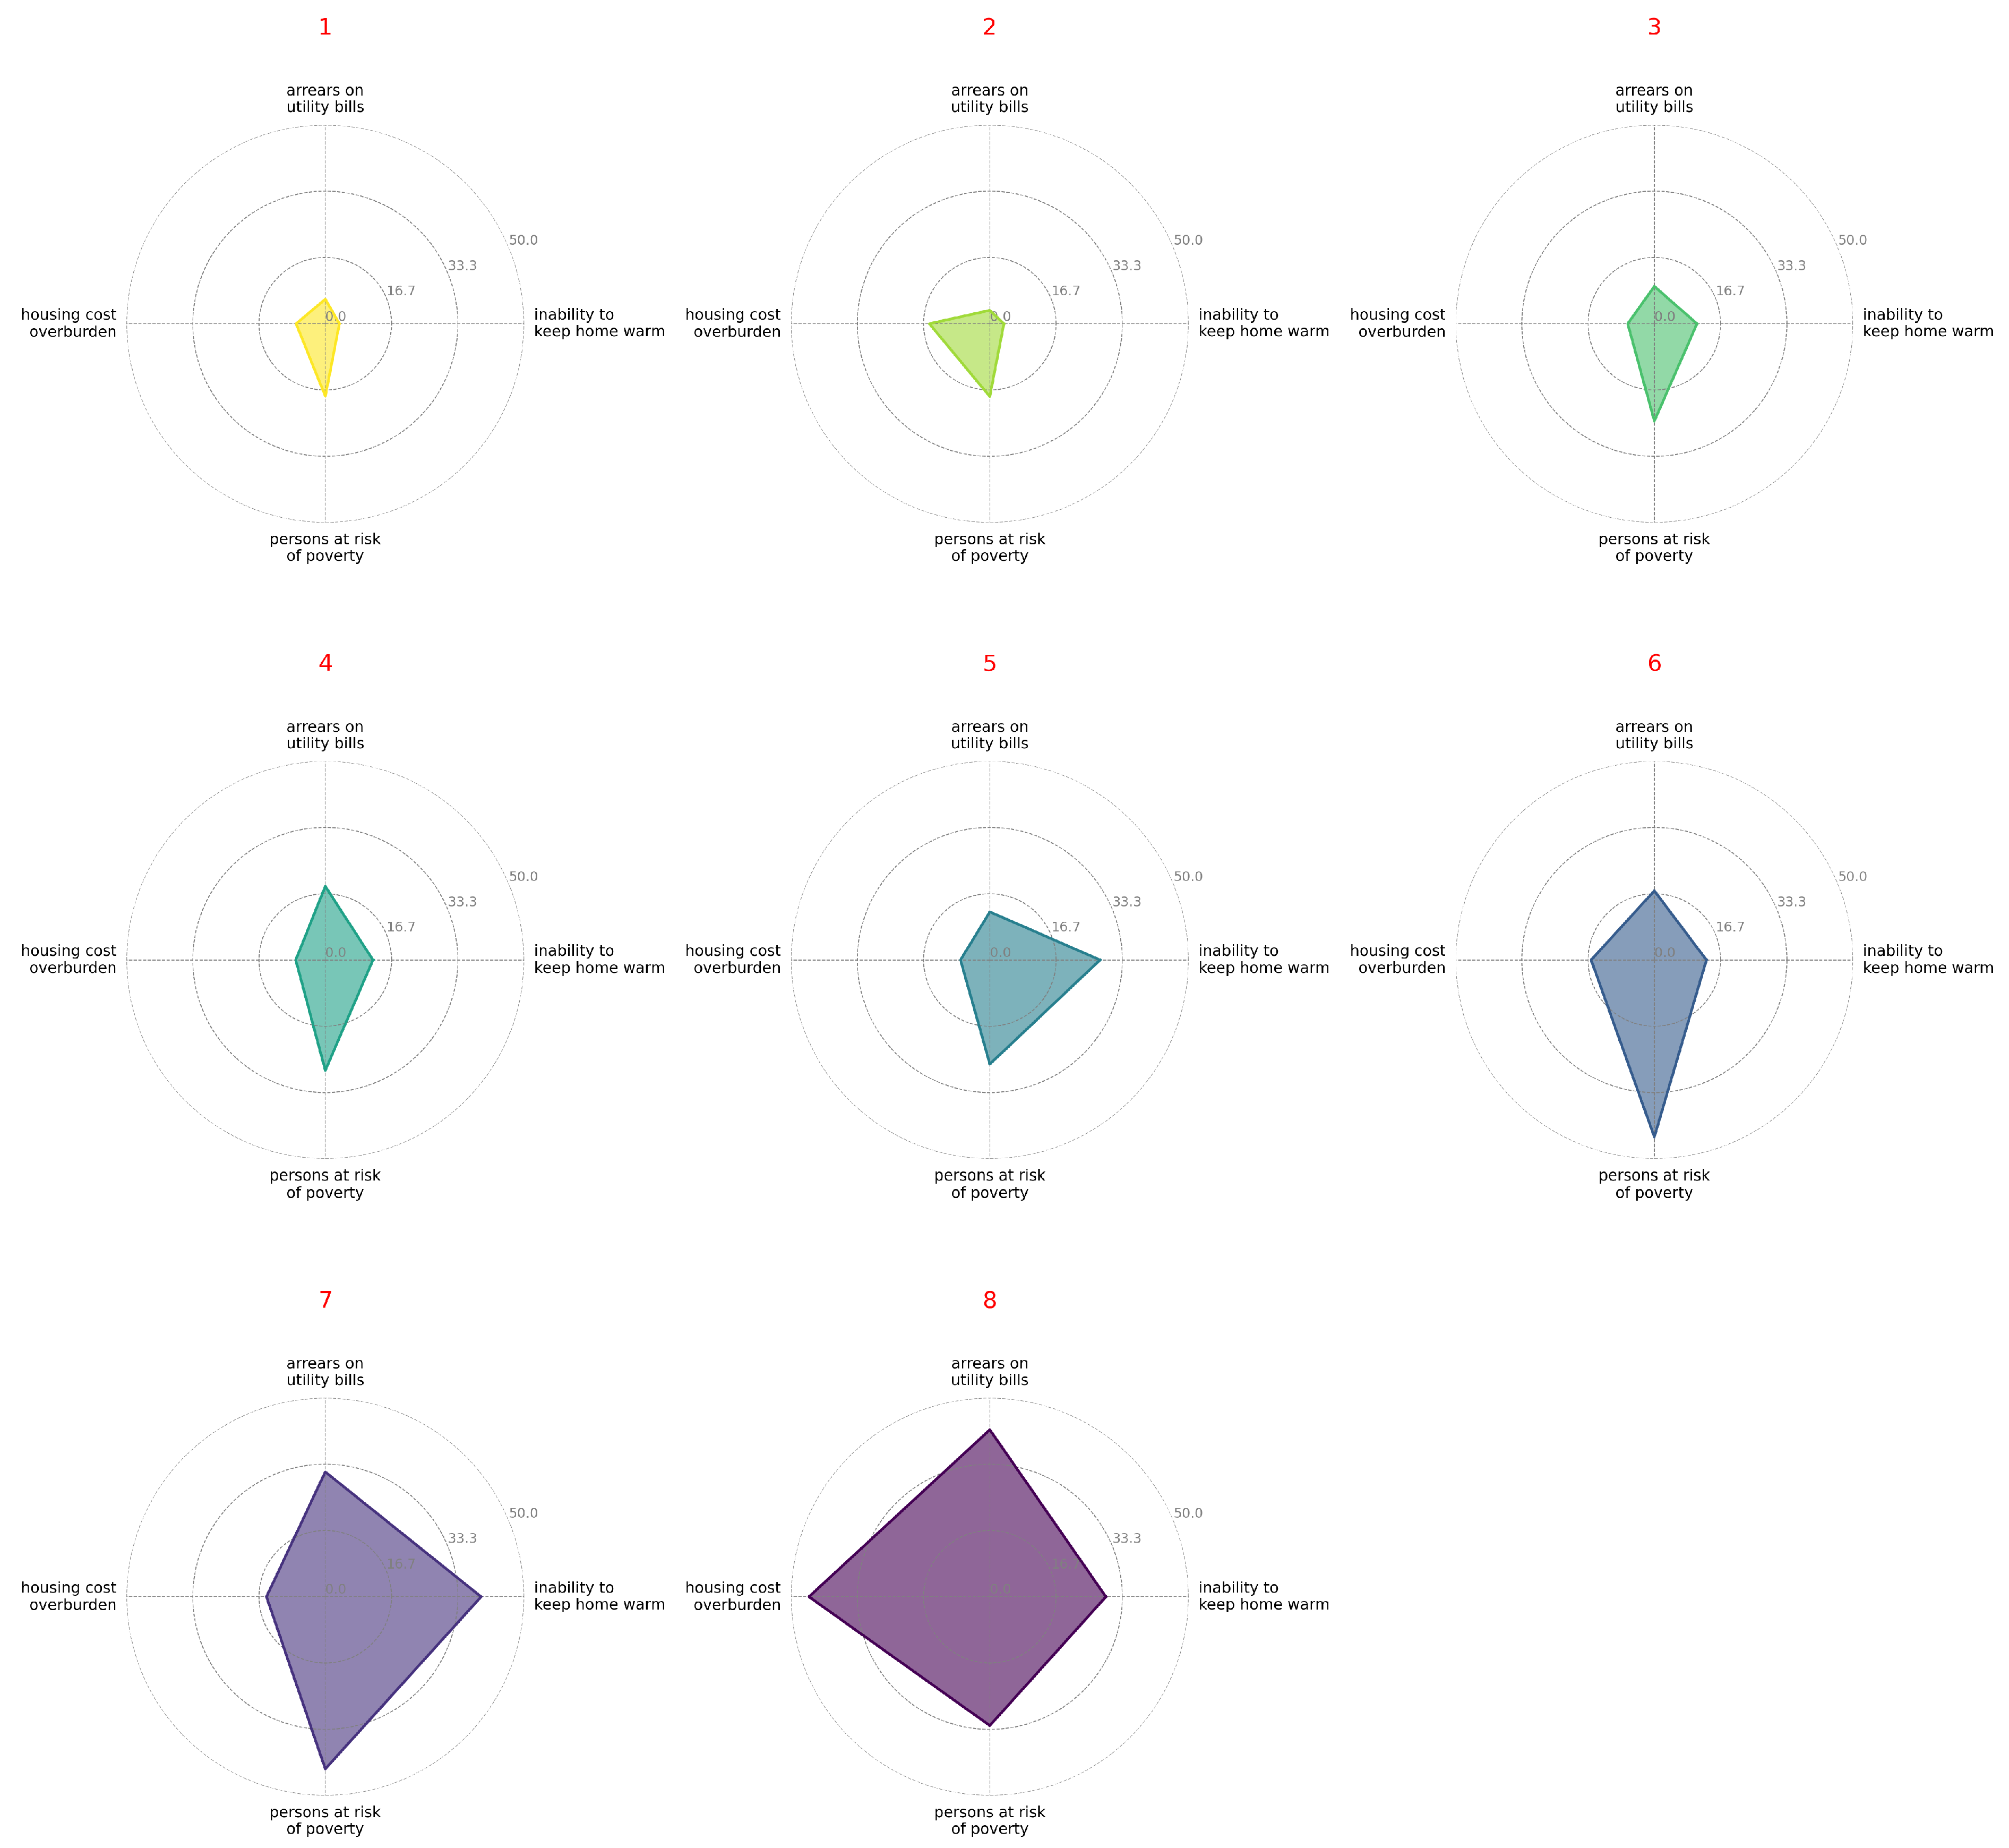
In 2015, eight clusters of EU Member States were identified on the basis of their energy-poverty risk (Figure 5). Table 2 reports the mean values of the four key indicators for each cluster, with cluster labels ordered from 1 (lowest risk) to 8 (highest risk). The graphical distribution of the cluster means is depicted in Figure 6.
Cluster 1:
Lowest-risk group. Only 3.6% of the population was unable to keep their dwelling adequately warm, and 6.2% was in arrears on utility bills. The incidence of housing cost over-burden (defined as housing costs exceeding 40% of disposable income) was 7.4%, while the at-risk-of-poverty rate stood at 18.2%. This cluster was composed mainly of the wealthiest `old-EU’ economies with extensive welfare systems and high building energy efficiency. Countries: Austria, Belgium, Czechia, Estonia, Finland, France, Luxembourg, Sweden, Slovenia, and Slovakia.
Cluster 2:
Very low-risk group with high housing costs. Arrears were virtually negligible (3.4%), and the inability to heat affected only 3.5% of residents. By contrast, the housing-cost over-burden rate reached 15.2%. The profile is consistent with high-income countries where energy poverty is rare but housing (rents, mortgages) is expensive. Countries: Germany, Denmark, and the Netherlands.
Cluster 3:
Moderate-risk group with low housing costs. On average, 10.7% of the population could not afford adequate heating, and 9.4% were in arrears—figures slightly above Clusters 1–2 but still below the 2015 EU mean of roughly 11%. The housing-cost burden was very modest (6.7%), and the at-risk-of-poverty rate was 24.5%. Countries: Spain, Malta, and Poland.
Cluster 4:
Moderate risk with high arrears. Arrears were markedly higher (18.5%), while the share unable to heat was 12.0%. The poverty rate reached 27.8%, and the housing-cost burden 7.4%, pointing to somewhat weaker economic fundamentals than in Cluster 3. Countries: Croatia, Hungary, Ireland, Italy, and Latvia.
Cluster 5:
High risk driven by heating deprivation. A striking 27.7% of residents could not keep their dwelling warm, yet arrears (12.1%) and housing-cost burden (7.4%) were moderate. The poverty rate was 26.2%. Countries: Cyprus, Lithuania, and Portugal.
Cluster 6:
High poverty with moderate energy indicators. An exceptional 44.5% of the population was at risk of poverty, whereas 13.1% lacked adequate warmth, 17.4% were in arrears, and 15.9% faced housing-cost over-burden. Countries: Romania.
Cluster 7:
Very high energy-poverty risk. Roughly 39.2% of inhabitants were unable to heat their homes, 31.4% were in arrears, and 43.3% were at risk of poverty—alarmingly high across all dimensions. Countries: Bulgaria.
Cluster 8:
Extreme financial strain (highest-risk group). While the share unable to heat (29.2%) was slightly below Cluster 7, an unprecedented 42.0% of the population was in arrears, and 45.5% faced housing cost over-burden; the poverty rate was 32.4%. This extreme value for housing cost overburden reflects the severe and unique economic context of Greece in 2015, which was still grappling with the effects of the sovereign debt crisis, leading to a sharp decline in disposable incomes against relatively inflexible housing costs. Countries: Greece.
Figure 7 presents the distribution of EU countries across energy poverty risk clusters in 2015. Countries are grouped from Cluster 1 (lowest risk, in yellow) to Cluster 8 (highest risk, in dark purple). The lowest-risk group includes Nordic, Western, and Central European countries such as Sweden, Finland, Germany, and France, characterized by low levels of energy poverty and well-developed welfare systems. Some Central, Eastern, and South European countries (e.g., Poland, the Czech Republic, Spain, and Italy) fall into moderate-risk clusters, reflecting structural vulnerabilities but also relatively low housing costs. The highest-risk clusters (7–8) are concentrated in the Balkans and Southeastern Europe, especially Bulgaria, Romania, and Greece, where high rates of arrears, poverty, and inadequate home heating were prevalent. This spatial pattern reflects historical socio-economic divides within the EU and underscores the persistent East–South vs. North–West energy poverty gradient.

5.2.2. Cluster Profiles for 2023

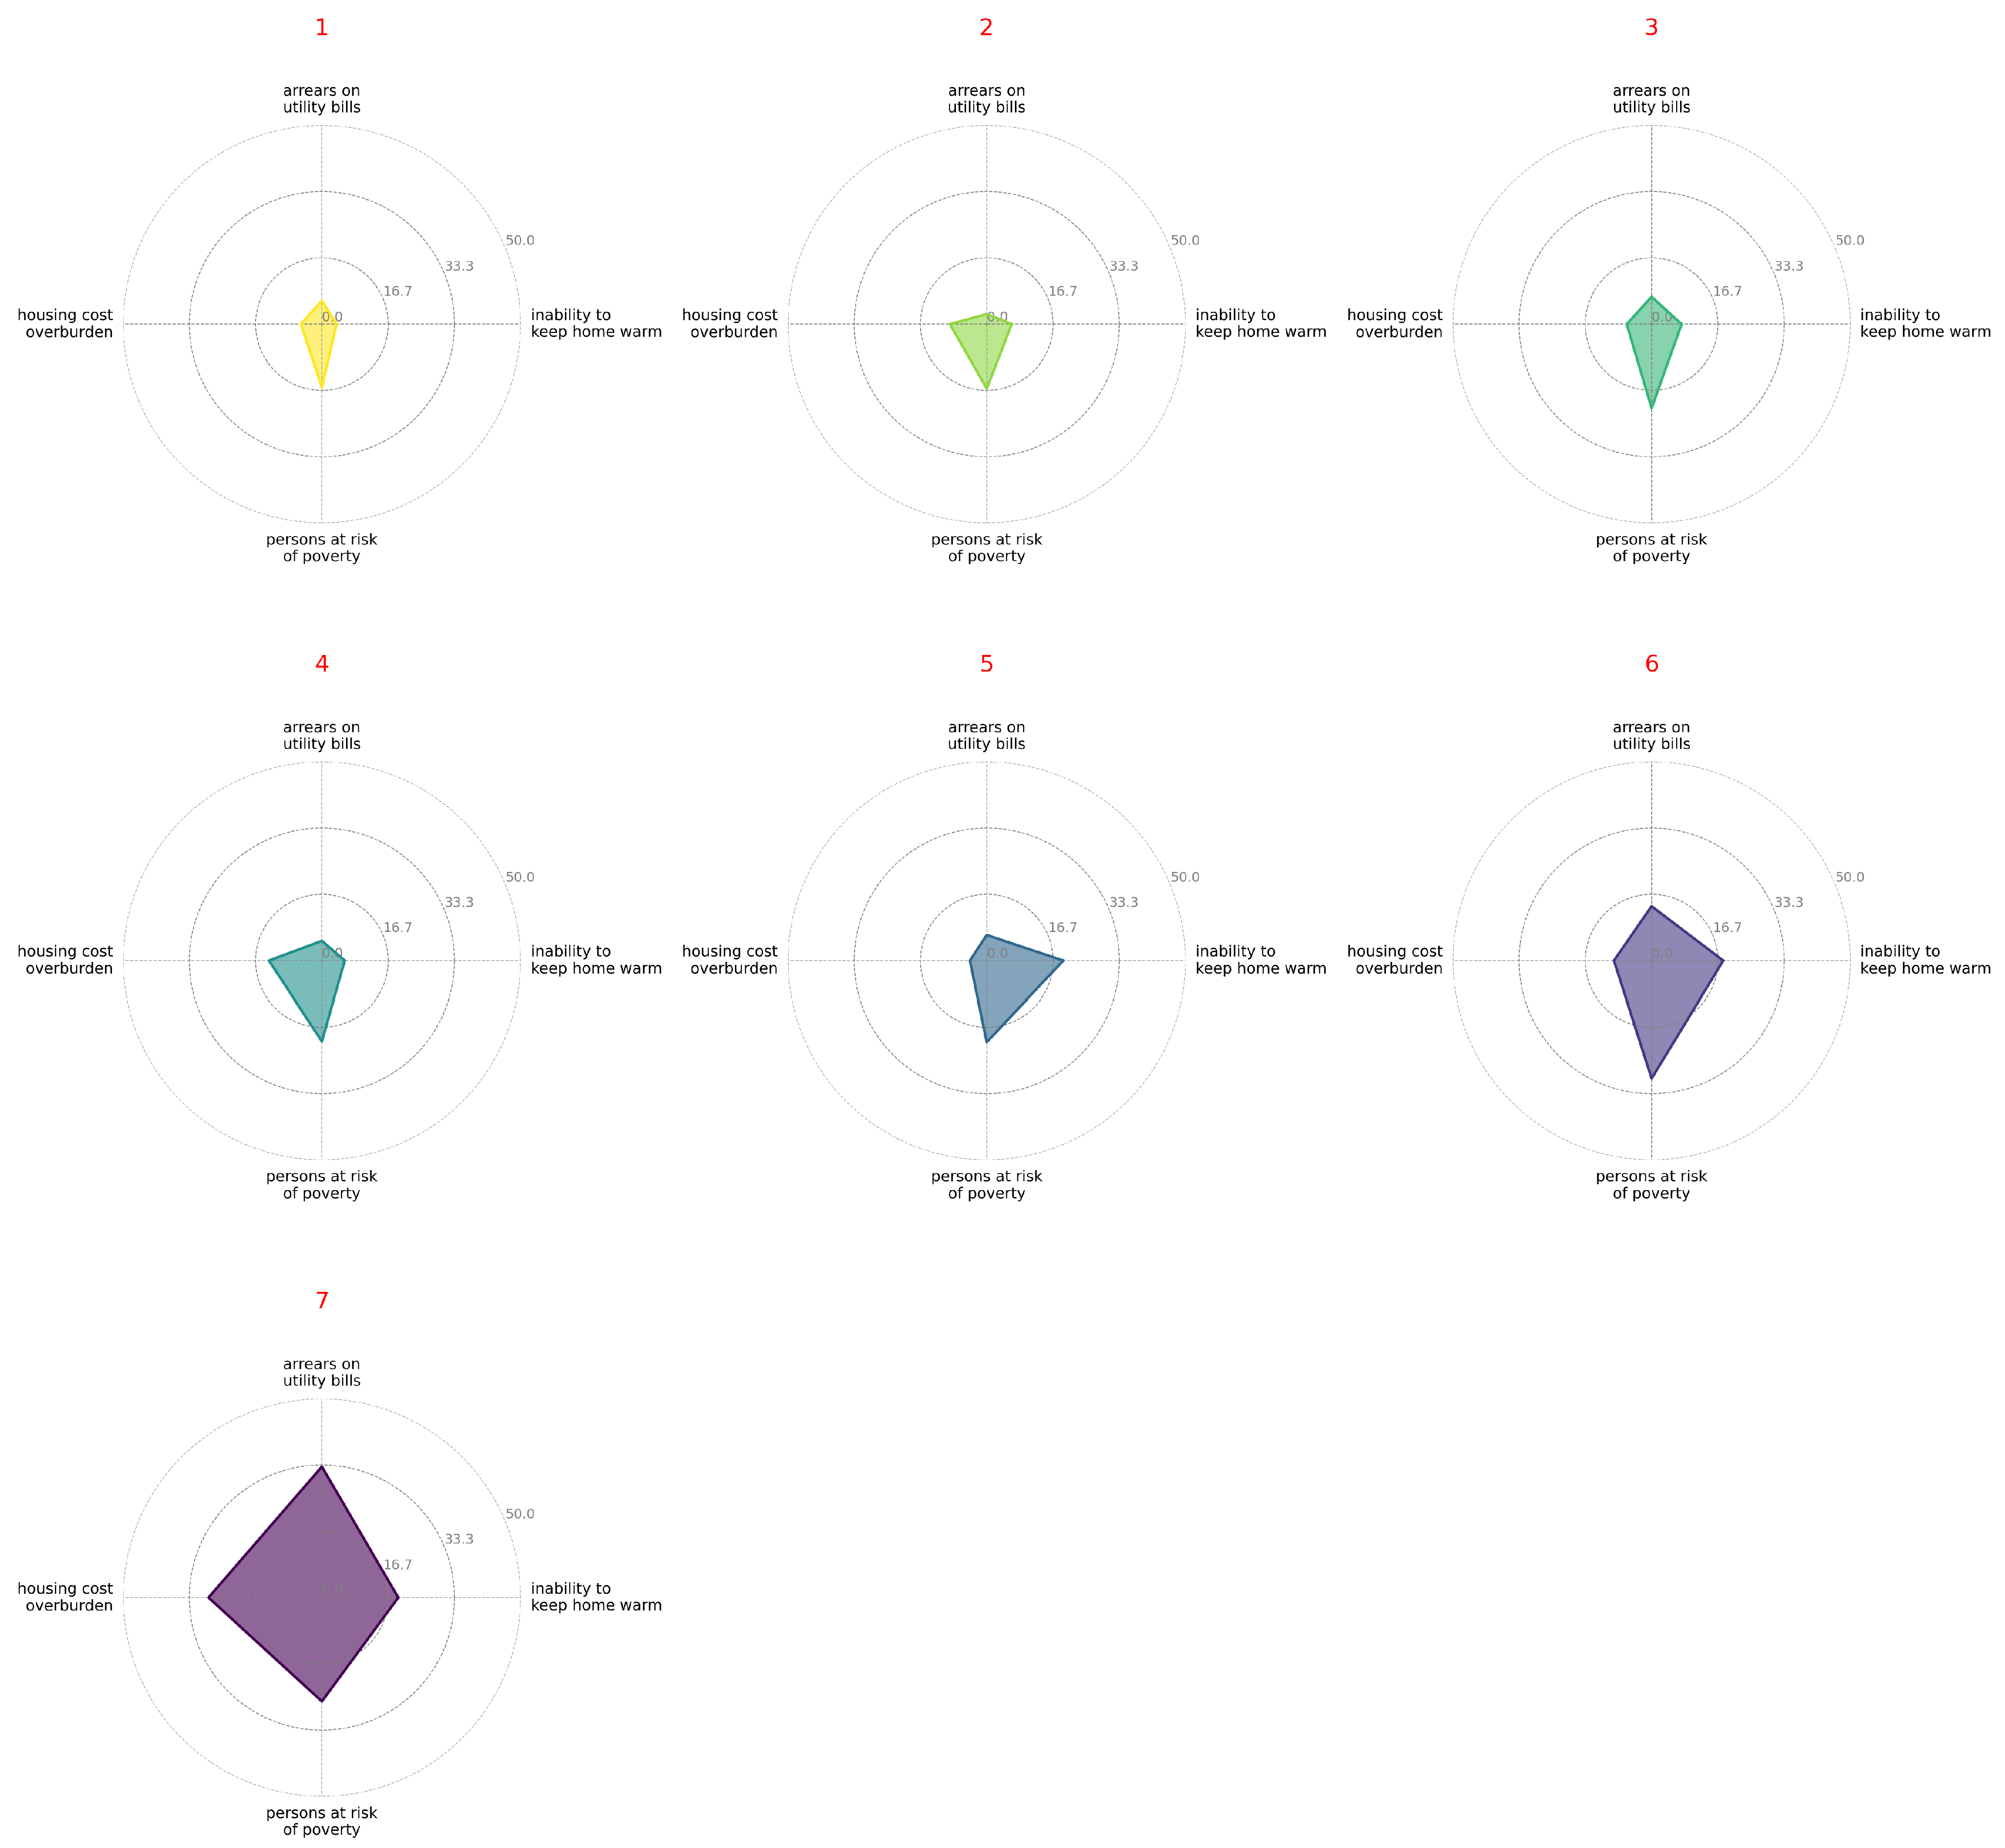
In 2023, the distribution of EU Member States with respect to energy poverty underwent marked changes. Seven risk clusters were identified (Figure 8). Table 3 reports the mean indicator values for the 2023 clusters. The graphical distribution of the cluster means is depicted in Figure 9.
The data for 2023 capture the post-transition landscape shaped by the major shocks of 2015–2022. A first glance suggests partial convergence: the gap between the best and worst clusters has narrowed. No Member State now registers the ∼40% share of residents unable to heat their home, which characterized the worst cluster in 2015; the highest cluster mean has fallen to ∼19.2%. Likewise, the maximum at-risk-of-poverty rate declined to ∼29.5% and the peak arrears rate to ∼32.9%. Nonetheless, the range between the lowest- and highest-risk groups remains wide: only 3.7 % of Cluster 1’s population struggles to heat their dwellings, versus 19.2 % in Cluster 7—more than a five-fold difference. The seven cluster profiles for 2023 are characterized below (Cluster 1 = lowest risk; Cluster 7 = highest).
Cluster 1:
Lowest-risk group. The average for direct thermal deprivation is only 3.7% and 5.9% for being in arrears on utility bills. Housing-cost over-burden affected 5.3%, while the at-risk-of-poverty rate dropped to 15.9%. Countries: Austria, Finland, Poland, and Slovenia.
Cluster 2:
Very low risk with minimal arrears. This cluster shows the lowest arrears mean in the sample (2.5%) and a small share of residents unable to heat (6.3%). The housing cost over-burden is somewhat higher (9.3%); the poverty rate is 16.2%. Countries: Belgium, Czechia, Netherlands, and Sweden.
Cluster 3:
Low-risk catching-up group. Thermal deprivation stands at 7.5%, arrears at 6.9%, and poverty at 21.1%. Countries: Estonia, France, Croatia, Hungary, Ireland, Italy, Latvia, Malta, and Slovakia.
Cluster 4:
Moderate risk with high housing costs. Thermal deprivation (5.7%) and arrears (5.0%) are comparable to Clusters 1–3, but the housing-cost over-burden peaks at 13.3%. The poverty rate is 20.2%. Countries: Germany, Denmark, Luxembourg.
Cluster 5:
Structural energy deprivation. A high 19.2% of residents live in inadequately heated dwellings, but only 6.4% are in arrears and 4.2% face excessive housing costs; poverty stands at 20.4%. Countries: Cyprus, Lithuania, and Portugal.
Cluster 6:
High-risk peripheral group. Roughly 18.0% cannot heat their homes; 13.7% are in arrears; 9.5% bear excessive housing costs; and nearly 29.5% are at risk of poverty. Countries: Bulgaria, Spain, and Romania.
Cluster 7:
Highest-risk group. Thermal deprivation affects 19.2% of the population; arrears reach 32.9%; housing cost over-burden stands at 28.5%; and the poverty rate is 26.1%. Countries: Greece.
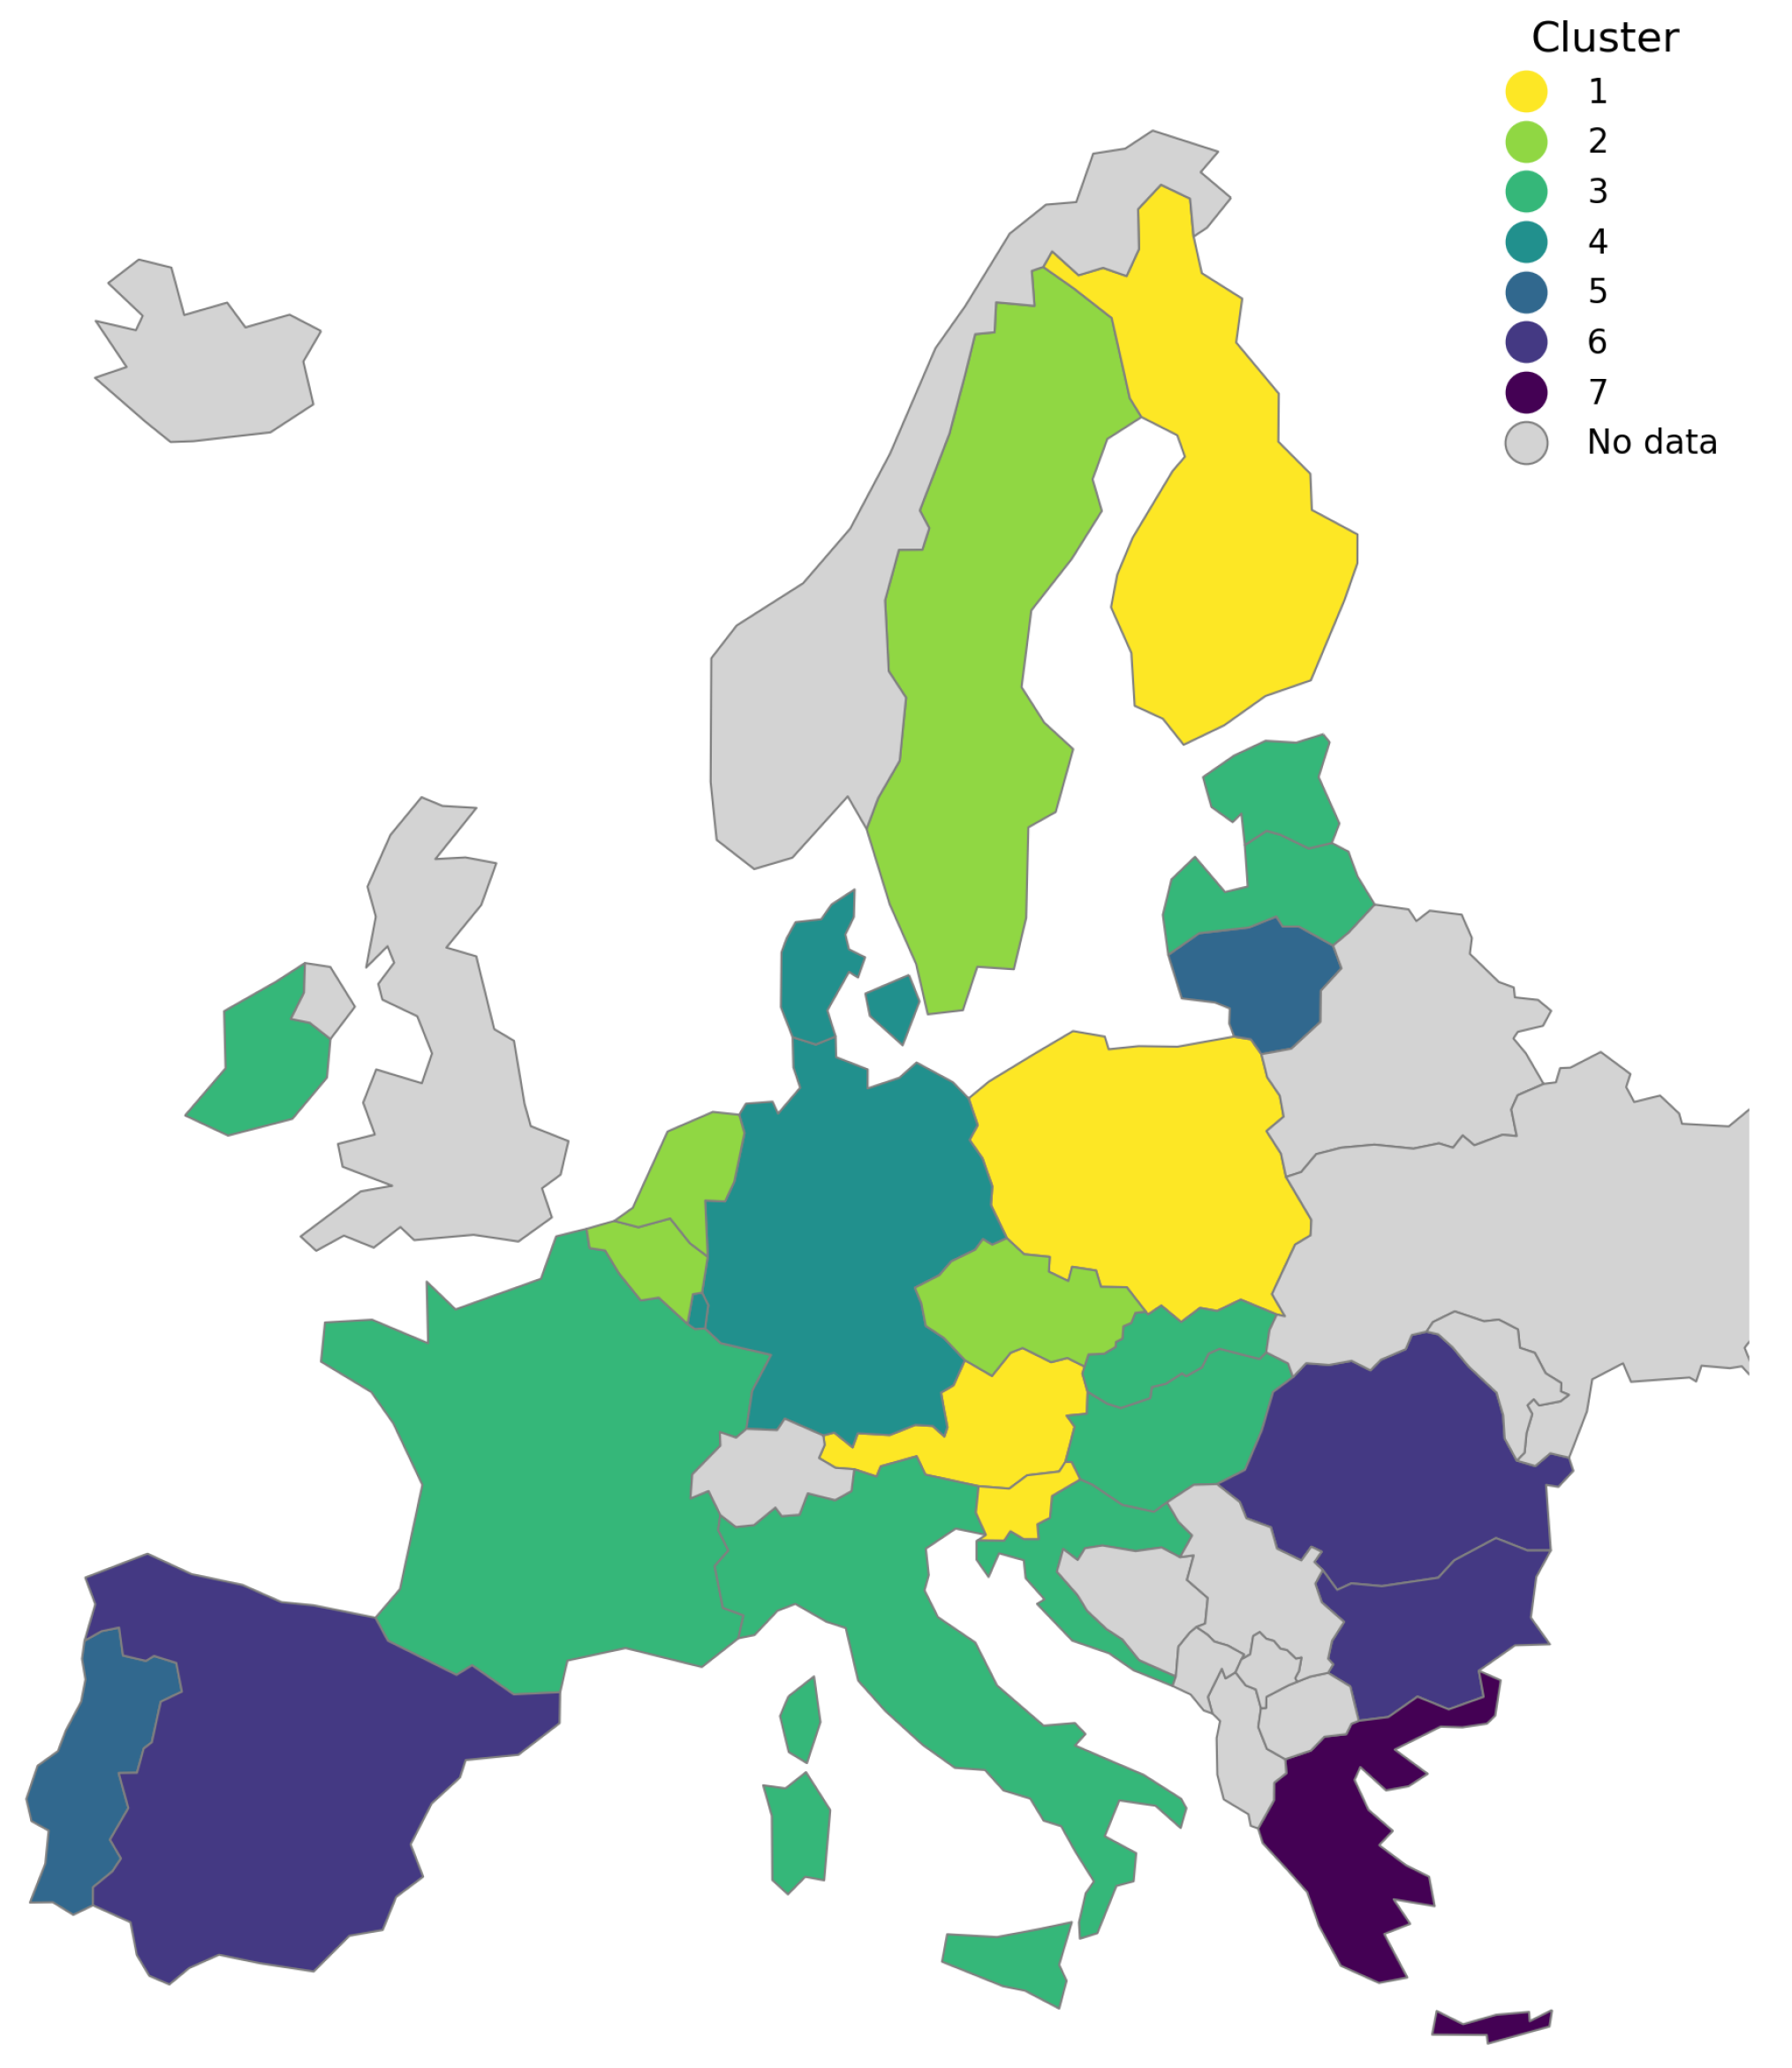
Figure 10 shows the distribution of EU countries across energy poverty risk clusters in 2023, using a 7-cluster scale from Cluster 1 (lowest risk, yellow) to Cluster 7 (highest risk, dark purple). Compared to 2015, there is clear evidence of gradual convergence: Central and Eastern European countries have moved into lower-risk clusters, reflecting income growth, improved housing efficiency, and public support policies. Northern and Western countries (e.g., Sweden, Austria, the Netherlands) have largely retained their low-risk status. However, Southern Europe remains highly vulnerable: Spain and Greece are now among the highest-risk countries (Clusters 6–7), experiencing significant levels of arrears and unaffordable housing costs, exacerbated by the energy price crisis of 2021–2022. Bulgaria and Romania, while still at high risk, show moderate improvement since 2015.

5.2.3. Key Changes Between 2015 and 2023

Cluster analysis revealed an evolution of the energy poverty situation in EU Member States between 2015 and 2023. The number of identified clusters decreased from eight in 2015 to seven in 2023, reflecting the model’s adaptation to the evolving data distribution and indicating a certain, albeit limited, convergence. Clusters are ordered by increasing level of energy poverty risk—from Cluster 1 (lowest risk) to Cluster 7 or 8 (highest risk).
Key Trends and Country Transitions:
In 2023, partial convergence was observed—the gap between the lowest- and highest-risk clusters narrowed in terms of indicators such as the inability to keep homes adequately warm or the share of persons at risk of poverty. Nevertheless, significant disparities remained.
  • Improvements in Central and Eastern Europe:
    Poland demonstrated significant improvement, transitioning from Cluster 3 (moderate risk, low housing costs) in 2015 to Cluster 1 (lowest risk) in 2023.
    Slovenia maintained its position in Cluster 1 (lowest risk).
    Czechia moved from Cluster 1 to Cluster 2 (very low risk with minimal arrears).
    Slovakia and Estonia transitioned from Cluster 1 to Cluster 3 (low-risk catching-up group).
    Croatia, Hungary, and Latvia improved their positions, moving from Cluster 4 (moderate risk with high arrears) to Cluster 3.
    Bulgaria, although still in a high-risk group, improved its position, transitioning from Cluster 7 (very high-risk) to Cluster 6 (high-risk peripheral group).
    Lithuania remained in Cluster 5, characterized by structural energy deprivation.
  • Maintenance of Low Risk or Minor Changes in Northern and Western Europe:
    Austria and Finland remained in Cluster 1 (lowest risk).
    Belgium and Sweden moved from Cluster 1 to Cluster 2.
    The Netherlands remained in Cluster 2.
    France transitioned from Cluster 1 to Cluster 3.
    Germany, Denmark, and Luxembourg moved from Cluster 2 (Germany, Denmark) and Cluster 1 (Luxembourg) to Cluster 4 (moderate risk with high housing costs).
    Ireland improved its position from Cluster 4 to Cluster 3.
  • Deterioration or Persistence of High Risk in Southern Europe:
    Spain experienced a notable deterioration, moving from Cluster 3 (moderate risk) to Cluster 6 (high-risk peripheral group). This significant negative shift can be attributed to the severe impact of the post-2021 energy price crisis on households, likely exacerbated by a high dependency on volatile gas prices in its electricity mix and pre-existing structural vulnerabilities that were not fully mitigated by policy interventions.
    Italy and Malta transitioned from Cluster 4 and Cluster 3, respectively, to Cluster 3, signifying an improvement for Italy and a similar risk level for Malta.
    Portugal and Cyprus remained in Cluster 5 (structural energy deprivation).
    Romania remained in Cluster 6 (high risk), although the source text mentions moderate improvement in its indicators.
    Greece moved from Cluster 8 (extreme financial strain, highest-risk group) to Cluster 7 (the highest-risk group in the new 7-cluster structure), still remaining among the most vulnerable countries.
These changes reflect both long-term developmental trends and public policies, as well as the impact of macroeconomic shocks such as the COVID-19 pandemic and the 2021–2022 energy crisis, which reversed earlier positive trends in energy poverty reduction across the EU.

6. Conclusions

This paper has provided a multifaceted analysis of energy security and energy poverty within the European Union, tracing the conceptual evolution of energy security and empirically investigating energy poverty dynamics between 2015 and 2023. The study began by outlining the shift in understanding energy security from a traditional supply-centric view to a contemporary, multidimensional approach incorporating availability, accessibility, affordability, and acceptability (the 4A framework), alongside sustainability, resilience, and social justice. It highlighted energy poverty as a significant impediment to achieving comprehensive energy security, particularly concerning the affordability and accessibility of essential energy services for households.
The empirical analysis focused on four key Eurostat indicators: inability to keep homes adequately warm, arrears on utility bills, housing cost overburden rate, and the at-risk-of-poverty (AROP) rate. Trend analysis for the EU27 aggregate revealed a general improvement in energy poverty indicators until 2019, followed by a significant deterioration, especially in the ability to keep homes warm and arrears on utility bills, largely attributable to the post-2021 energy crisis. Despite these shocks, the AROP rate at the EU level did not show a correspondingly sharp increase, suggesting the distinct impact of energy price volatility on household budgets independent of general income poverty trends. This is quantitatively supported by the data presented in Figure 1, where the `Inability to Keep Home Warm’ indicator surged by 3.7 percentage points between 2021 and 2023, while the `At Risk of Poverty’ rate actually decreased by 0.4 percentage points over the same period. Substantial heterogeneity was observed across Member States, with a persistent geographical divide where Southern and Eastern European countries generally exhibited higher vulnerability, although some recorded significant improvements over the period.
A k-means cluster analysis was conducted for 2015 and 2023, identifying eight and seven clusters, respectively, ordered by increasing risk of energy poverty. This analysis demonstrated a degree of partial convergence, with the gap between the best and worst-performing clusters narrowing. Notably, several Central and Eastern European countries, such as Poland, transitioned to lower-risk clusters, reflecting income growth, improved housing efficiency, and supportive policies. Conversely, some Southern European countries, like Spain, experienced a worsening of their relative positions, particularly exacerbated by the recent energy price crisis. Northern and Western European countries largely maintained their low-risk status, albeit with some minor shifts. The reduction in the number of clusters and the movement of countries between them underscored the dynamic nature of energy poverty, influenced by economic recovery, subsequent crises, and national policy responses.
The empirical results highlight the impact of macroeconomic shocks and energy price volatility on household well-being. The sharp rise in indicators like the inability to keep homes warm, even while general income poverty rates remained relatively stable or even decreased in some cases during the crisis peak, confirms that energy poverty is a distinct phenomenon requiring specific policy attention. This “energy-specific” poverty can affect households not traditionally considered income-poor, especially those in energy-inefficient buildings or those reliant on price-volatile energy sources. The observed geographical disparities, while showing some signs of convergence, remain a significant challenge for EU cohesion policy. The success of some Central and Eastern European countries in mitigating energy poverty suggests that targeted investments in energy efficiency, income support, and diversification of energy sources can yield tangible results. However, the heightened vulnerability in parts of Southern Europe, exacerbated by the energy crisis, points to deep-seated structural issues and the need for sustained and potentially enhanced support mechanisms.
The empirical results, highlighting the vulnerability of households to energy price shocks, are reflected in the growing political priority the European Union gives to tackling energy poverty. In recent years, particularly as part of the `Fit for 55’ package, a range of instruments has been introduced to provide both direct and structural responses to this challenge. The revised EED not only established the first EU-wide definition of energy poverty but also mandated Member States to prioritize energy-poor households in their energy efficiency measures. Furthermore, the SCF has become a key instrument designed to mitigate the social impacts of the energy transition, offering Member States funding for both direct income support and investments in building renovations and clean transport. These policy actions constitute the critical framework within which the trends analyzed in this paper will evolve in the coming years, and their effectiveness will largely determine the pace and equity of Europe’s energy transition
The cluster analysis proved effective in typifying country-level vulnerabilities and tracking their evolution. The shift from eight to seven clusters, alongside the inter-cluster movements, paints a picture of a dynamic landscape rather than static national conditions. This dynamism reflects a combination of long-term structural changes (e.g., economic development and housing stock improvements), the impact of acute crises, and the varying effectiveness of national and EU-level policy interventions (e.g., energy price shields, social tariffs, renovation programs). The `partial convergence’ observed suggests that while disparities are narrowing in some respects, significant differences persist, necessitating tailored approaches rather than one-size-fits-all solutions. For instance, for countries in the high-risk peripheral group like Bulgaria, Spain, and Romania (Cluster 6 in 2023), policies should prioritize a combination of direct income support to alleviate immediate financial strain and long-term investments in deep building renovations to tackle structural inefficiencies. In contrast, for countries in Cluster 4 (e.g., Germany, Denmark), where the primary issue is the high housing cost overburden rather than low income alone, interventions might focus more on rental market regulations, support for tenants, and promoting energy efficiency in the large rental housing stock.
Limitations of this study include those inherent in the chosen Eurostat indicators, such as the subjectivity of `adequate warmth’ or the fact that arrears on utility bills may not capture `hidden’ energy poverty, where consumption is self-restricted to avoid debt. The k-means clustering algorithm, while useful, also has its own methodological limitations, such as sensitivity to initial centroid choices and the assumption of spherical clusters. Future research could expand upon this work by incorporating a wider array of indicators, including those related to cooling needs (increasingly relevant due to climate change), transport poverty, and the energy efficiency of building stocks at a more granular level. Qualitative case studies could also complement the quantitative analysis to provide deeper insights into the lived experiences of energy poverty and the effectiveness of specific policy measures in different national contexts. Furthermore, exploring the differential impacts on various socio-demographic groups (e.g., single-parent households, the elderly, rural populations) would be a valuable extension.
Furthermore, future research could focus on modeling potential scenarios based on the trends and vulnerabilities identified in this analysis. Two distinct pathways could be explored:
  • A ’convergence scenario’, where the effective implementation of EU and national policies, such as the SCF, combined with sustained investments in energy efficiency, leads to a continued narrowing of the energy poverty gap between Member States. This would be driven by significant improvements in the Southern, Central, and Eastern European countries identified in the higher-risk clusters.
  • An alternative ’divergence scenario’, in which future energy market shocks, an economic slowdown, or the insufficient implementation of protective measures could deepen existing divides. In such a scenario, the most vulnerable countries could face further marginalization, undermining the EU’s social cohesion goals and the fairness of the green transition.
The analysis of such scenarios could provide valuable input for risk assessment and the strategic planning of more resilient energy and social policies at the EU level
The journey toward comprehensive energy security in the European Union is intrinsically linked to the resolute effort to eradicate energy poverty. This study demonstrates that while progress has been made, significant challenges persist, exacerbated by recent energy crises. The evolving understanding of energy security now firmly embeds social equity and affordability at its core, demanding that policies are designed not only to ensure supply and promote green transition but also to protect vulnerable households.
The analysis of trends and the clustering of EU Member States reveal a dynamic but persistently uneven landscape of energy poverty. While some convergence is evident, deep-seated geographical and structural disparities require targeted, context-specific interventions. The distinct impact of energy price shocks, separate from general income trends, underscores the need for energy-specific safety nets and structural measures, particularly enhancing the energy efficiency of the housing stock.
As the EU navigates the complexities of the energy transition, climate neutrality objectives, and geopolitical uncertainties, a continued focus on the social dimension of energy policy is paramount. This research, by providing an updated assessment of energy poverty dynamics and typologies, contributes to the evidence base necessary for crafting effective and equitable policies. It reinforces that achieving a truly secure and sustainable energy future for all Europeans necessitates placing the fight against energy poverty at the forefront of the EU’s agenda. This endeavor remains a critical component of the author’s broader investigation into the multifaceted challenges and opportunities inherent in ensuring robust and equitable energy security for the 21st century.

Funding

This research received no external funding.

Data Availability Statement

Only publicly available data were used in this article.

Acknowledgments

During the preparation of this manuscript, the author used ChatGPT 4o and Gemini 2.5 models for the purposes of English language quality improvement and supporting the coding process (debugging, commenting, development and testing of ideas). The author have reviewed and edited the output and take full responsibility for the content of this publication.

Conflicts of Interest

The author declares no conflicts of interest.

Abbreviations

The following abbreviations are used in this manuscript:
EUEuropean Union
EU-SILCEuropean Union Statistics on Income and Living Conditions
COVID-19Coronavirus Disease 2019
IDEIntegrated Developmnet Environment
CSESComprehensive Security of Energy Systems
LNGLiquefied Natural Gas
AESPIAggregated Energy Security Performance Indicator
SCFSocial Climate Fund
EEDEnergy Efficiency Directive
AROPAt-Risk-of-Poverty
OECDOrganisation for Economic Co-operation and Development
AROPEAt-Risk-of-Poverty or Social Exclusion
EU27European Union 27
ppPercentage Points
WSSWithin-cluster Sum of Squares

References

  1. Kosowski, P.; Kosowska, K.; Janiga, D. Primary Energy Consumption Patterns in Selected European Countries from 1990 to 2021: A Cluster Analysis Approach. Energies 2023, 16, 6941. [Google Scholar] [CrossRef]
  2. Kosowski, P. From Fossil Fuels to Renewables: Clustering European Primary Energy Production from 1990 to 2022. Energies 2024, 17, 5596. [Google Scholar] [CrossRef]
  3. R Core Team. R: A Language and Environment for Statistical Computing; R Foundation for Statistical Computing: Vienna, Austria, 2024. [Google Scholar]
  4. RStudio Team. RStudio: Integrated Development Environment for R; RStudio, PBC: Boston, MA, USA, 2024. [Google Scholar]
  5. Python Software Foundation. Python Language Reference, version 3.11; Python Software Foundation: Wilmington, DE, USA, 2025.
  6. Microsoft Corporation. Visual Studio Code; Microsoft Corporation: Redmond, WA, USA, 2025. [Google Scholar]
  7. Proskuryakova, L. Updating energy security and environmental policy: Energy security theories revisited. J. Environ. Manag. 2018, 223, 203–214. [Google Scholar] [CrossRef] [PubMed]
  8. Cherp, A.; Jewell, J. The concept of energy security: Beyond the four As. Energy Policy 2014, 75, 415–421. [Google Scholar] [CrossRef]
  9. Fang, D.; Shi, S.; Yu, Q. Evaluation of Sustainable Energy Security and an Empirical Analysis of China. Sustainability 2018, 10, 1685. [Google Scholar] [CrossRef]
  10. Lee, C.; Xing, W.; Lee, C. The impact of energy security on income inequality: The key role of economic development. Energy 2022, 248, 123564. [Google Scholar] [CrossRef]
  11. Strojny, J.; Krakowiak-Bal, A.; Knaga, J.; Kacorzyk, P. Energy Security: A Conceptual Overview. Energies 2023, 16, 5042. [Google Scholar] [CrossRef]
  12. Asia Pacific Energy Research Centre (APERC). A Quest for Energy Security in the 21st Century Resources and Constraints; APERC: Tokyo, Japan, 2007. [Google Scholar]
  13. Kruyt, B.; van Vuuren, D.; de Vries, H.; Groenenberg, H. Indicators for energy security. Energy Policy 2009, 37, 2166–2181. [Google Scholar] [CrossRef]
  14. Kisel, E.; Hamburg, A.; Härm, M.; Leppiman, A.; Ots, M. Concept for Energy Security Matrix. Energy Policy 2016, 95, 1–9. [Google Scholar] [CrossRef]
  15. Abdullah, F.; Iqbal, R.; Hyder, S.; Jawaid, M. Energy security indicators for Pakistan: An integrated approach. Renew. Sustain. Energy Rev. 2020, 133, 110122. [Google Scholar] [CrossRef]
  16. Löschel, A.; Moslener, U.; Rübbelke, D. Indicators of energy security in industrialised countries. Energy Policy 2010, 38, 1665–1671. [Google Scholar] [CrossRef]
  17. Amin, S.; Chang, Y.; Khan, F.; Taghizadeh-Hesary, F. Energy security and sustainable energy policy in Bangladesh: From the lens of 4As framework. Energy Policy 2021, 161, 112719. [Google Scholar] [CrossRef]
  18. Fouladvand, J. Behavioural attributes towards collective energy security in thermal energy communities: Environmental-friendly behaviour matters. Energy 2022, 261, 125353. [Google Scholar] [CrossRef]
  19. Paravantis, J.; Kontoulis, N. Energy Security and Renewable Energy: A Geopolitical Perspective; IntechOpen Book Chapter; IntechOpen: London, UK, 2020. [Google Scholar] [CrossRef]
  20. Valdés, J. Arbitrariness in Multidimensional Energy Security Indicators. Ecol. Econ. 2018, 145, 263–273. [Google Scholar] [CrossRef]
  21. Martchamadol, J.; Kumar, S. An aggregated energy security performance indicator. Appl. Energy 2013, 103, 653–670. [Google Scholar] [CrossRef]
  22. Siksnelyte-Butkiene, I.; Štreimikienė, D.; Lekavičius, V.; Baležentis, T. Comprehensive analysis of energy security indicators and measurement of their integrity. Technol. Forecast. Soc. Change 2024, 200, 123167. [Google Scholar] [CrossRef]
  23. Cornelis, M. What Is the Status of Energy Poverty in the European Union? Available online: https://eu.boell.org/en/2024/11/20/what-status-energy-poverty-european-union (accessed on 22 April 2025).
  24. Heller, A.L.; Brunzema, I.; Schlomann, B. Energy Efficiency Policies Across the EU and Their Impact on Alleviating Energy Poverty. Insights from the MURE Database; Technical Report; Fraunhofer-Gesellschaft: Munich, Germany, 2024. [Google Scholar] [CrossRef]
  25. Bouzarovski, S.; Petrova, S. A global perspective on domestic energy deprivation: Overcoming the energy poverty–fuel poverty binary. Energy Res. Soc. Sci. 2015, 10, 31–40. [Google Scholar] [CrossRef]
  26. Castaño Rosa, R.; Solís-Guzmán, J.; Rubio-Bellido, C.; Marrero, M. Towards a multiple-indicator approach to energy poverty in the European Union: A review. Energy Build. 2019, 193, 36–48. [Google Scholar] [CrossRef]
  27. Galvin, R. Reducing poverty in the UK to mitigate energy poverty by the 10% and LIHC indicators: What tax changes are needed, and what are the consequences for CO2 emissions? Ecol. Econ. 2024, 217, 108055. [Google Scholar] [CrossRef]
  28. European Commission. Action Plan for Affordable Energy Unlocking the True Value of Our Energy Union to Secure Affordable, Efficient and Clean Energy for All Europeans. Communication from the Commission. 2025. Available online: https://energy.ec.europa.eu/document/download/7e2e6198-b6b8-46fe-b263-984b437da3ab_en?filename=Communication (accessed on 22 April 2025).
  29. Bouzarovski, S.; Thomson, H.; Cornelis, M. Confronting Energy Poverty in Europe: A Research and Policy Agenda. Energies 2021, 14, 858. [Google Scholar] [CrossRef]
  30. Thomson, H.; Bouzarovski, S. Addressing Energy Poverty in the European Union: State of Play and Action; Technical Report; European Energy Poverty Observatory (EPOV): Brussels, Belgium, 2019; Available online: https://energy-poverty.ec.europa.eu/system/files/2024-05/paneureport2018_updated2019.pdf (accessed on 27 April 2025).
  31. Yougova, D.; Energy Poverty in the EU. EP Think Tank | European Parliamentary Research Service Blog. 2015. Available online: https://epthinktank.eu/2015/12/11/energy-poverty-in-the-eu/ (accessed on 27 April 2025).
  32. Widuto, A. Energy Poverty in the EU; Briefing; European Parliamentary Research Service (EPRS): Brussels, Belgium, 2023; Available online: https://www.europarl.europa.eu/RegData/etudes/BRIE/2022/733583/EPRS_BRI(2022)733583_EN.pdf (accessed on 27 April 2025).
  33. EU Energy Poverty Observatory. The Inability to Keep the Home Adequately Warm Indicator: Is It Enough to Measure Energy Poverty? EU Energy Poverty Observatory Newsroom: Brussels, Belgium, 2023; Available online: https://energy-poverty.ec.europa.eu/newsroom/news/nability-keep-home-adequately-warm-indicator-it-enough-measure-energy-poverty (accessed on 27 April 2025).
  34. MacQueen, J.B. Some Methods for Classification and Analysis of MultiVariate Observations. In Proceedings of the Fifth Berkeley Symposium on Mathematical Statistics and Probability; Cam, L.M.L., Neyman, J., Eds.; University of California Press: Oakland, CA, USA, 1967; Volume 1, pp. 281–297. [Google Scholar]
  35. Jain, A.K.; Dubes, R.C. Algorithms for Clustering Data; Prentice-Hall, Inc.: Upper Saddle River, NJ, USA, 1988. [Google Scholar]
  36. Kaufman, L.; Rousseeuw, P.J. (Eds.) Finding Groups in Data; John Wiley & Sons, Inc.: Hoboken, NJ, USA, 1990. [Google Scholar]
  37. Xu, R.; Wunsch, D. Survey of Clustering Algorithms. IEEE Trans. Neural Netw. 2005, 16, 645–678. [Google Scholar] [CrossRef] [PubMed]
  38. Mirkin, B. Clustering for Data Mining; Chapman and Hall/CRC: Boca Raton, FL, USA, 2005. [Google Scholar]
  39. Everitt, B.; Landau, S.; Leese, M. Cluster Analysis, 4th ed.; Arnold: London, UK, 2001. [Google Scholar]
  40. Hennig, C. What are the true clusters? Pattern Recognit. Lett. 2015, 64, 53–62. [Google Scholar] [CrossRef]
  41. Jain, A.K. Data clustering: 50 years beyond K-means. Pattern Recognit. Lett. 2010, 31, 651–666. [Google Scholar] [CrossRef]
  42. Arthur, D.; Vassilvitskii, S. K-Means++: The Advantages of Careful Seeding. In Proceedings of the Eighteenth Annual ACM-SIAM Symposium on Discrete Algorithms, SODA ’07, New Orlean, LA, USA, 7–9 January 2007; pp. 1027–1035. [Google Scholar]
  43. Tan, P.N.; Steinbach, M.; Kumar, V. Introduction to Data Mining; Addison-Wesley Longman Publishing Co., Inc.: Upper Saddle River, NJ, USA, 2005. [Google Scholar]
  44. Milligan, G.W.; Cooper, M.C. An examination of procedures for determining the number of clusters in a data set. Psychometrika 1985, 50, 159–179. [Google Scholar] [CrossRef]
  45. Hastie, T.; Tibshirani, R.; Friedman, J. The Elements of Statistical Learning; Springer: New York, NY, USA, 2009. [Google Scholar]
  46. Rousseeuw, P.J. Silhouettes: A graphical aid to the interpretation and validation of cluster analysis. J. Comput. Appl. Math. 1987, 20, 53–65. [Google Scholar] [CrossRef]
Figure 1. Trends in the analyzed indicators in the EU (data source: Eurostat).
Energies 18 03117 g001
Figure 2. Comparison of indicators for selected countries and the EU average (data source: Eurostat).
Energies 18 03117 g002
Figure 3. Indicator values in EU countries in 2023 (data source: Eurostat).
Energies 18 03117 g003
Figure 4. Comparison of indicator values in 2015 and 2023 (data source: Eurostat).
Energies 18 03117 g004
Figure 5. Silhouette score for 2015.
Energies 18 03117 g005
Figure 6. Cluster means for 2015.
Energies 18 03117 g006
Figure 7. Energy poverty risk clusters in the European Union—2015 classification.
Energies 18 03117 g007
Figure 8. Silhouette score for 2023.
Energies 18 03117 g008
Figure 9. Cluster means for 2023.
Energies 18 03117 g009
Figure 10. Energy poverty risk clusters in the European Union—2023 classification.
Energies 18 03117 g010
Table 1. Average values of the analyzed energy poverty indicators for the EU27 in selected years (%).
Indicator20102015201920212023
Inability to Keep Home Adequately Warm9.99.66.96.910.6
Arrears on Utility Bills9.69.46.26.46.9
Housing Cost Overburden Rate10.011.29.48.78.8
At Risk of Poverty RateNA24.021.121.721.3
Source: Eurostat data.
Table 2. Cluster means for energy poverty indicators and EU countries in 2015.
ClusterInability to Keep Home WarmArrears on Utility BillsHousing Cost OverburdenPersons at Risk of PovertyCountries
13.556.177.3518.20Austria, Belgium, Czechia, Estonia, Finland, France, Luxembourg, Sweden, Slovenia, Slovakia
23.533.3715.2018.33Germany, Denmark, Netherlands
310.739.406.7024.47Spain, Malta, Poland
412.0018.527.4427.76Croatia, Hungary, Ireland, Italy, Latvia
527.7312.107.3726.20Cyprus, Lithuania, Portugal
613.1017.4015.9044.50Romania
739.2031.4014.8043.30Bulgaria
829.2042.0045.5032.40Greece
Table 3. Cluster means for energy poverty indicators and EU countries in 2023.
ClusterInability to Keep Home WarmArrears on Utility BillsHousing Cost OverburdenPersons at Risk of PovertyCountries
13.705.885.2815.88Austria, Finland, Poland, Slovenia
26.282.539.2516.20Belgium, Czechia, Netherlands, Sweden
37.546.876.2621.11Estonia, France, Croatia, Hungary, Ireland, Italy, Latvia, Malta, Slovakia
45.734.9713.3020.20Germany, Denmark, Luxembourg
519.236.434.2320.37Cyprus, Lithuania, Portugal
618.0013.679.4729.50Bulgaria, Spain, Romania
719.2032.9028.5026.10Greece
Disclaimer/Publisher’s Note: The statements, opinions and data contained in all publications are solely those of the individual author(s) and contributor(s) and not of MDPI and/or the editor(s). MDPI and/or the editor(s) disclaim responsibility for any injury to people or property resulting from any ideas, methods, instructions or products referred to in the content.