Review

Review of Research on Supercritical Carbon Dioxide Axial Flow Compressors

1
Key Laboratory of Advanced Energy and Power, Institute of Engineering Thermophysics, Chinese Academy of Sciences, 11 Beisihuanxi Road, Beijing 100190, China
2
University of Chinese Academy of Sciences, No. 19 (A) Yuquan Road, Beijing 100049, China
*
Author to whom correspondence should be addressed.
Energies 2025, 18(12), 3081; https://doi.org/10.3390/en18123081
Submission received: 28 April 2025 / Revised: 30 May 2025 / Accepted: 4 June 2025 / Published: 11 June 2025

Abstract

Since the beginning of the 21st century, the supercritical carbon dioxide (sCO2) Brayton cycle has emerged as a hot topic of research in the energy field. Among its key components, the sCO2 compressor has received significant attention. In particular, axial-flow sCO2 compressors are increasingly being investigated as power systems advance toward high power scaling. This paper reviews global research progress in this field. As for performance characteristics, currently, sCO2 axial-flow compressors are mostly designed with large mass flow rates (>100 kg/s), near-critical inlet conditions, multistage configurations with relatively low stage pressure ratios (1.1–1.2), and high isentropic efficiencies (87–93%). As for internal flow characteristics, although similarity laws remain applicable to sCO2 turbomachinery, the flow dynamics are strongly influenced by abrupt variations in thermophysical properties (e.g., viscosities, sound speeds, and isentropic exponents). High Reynolds numbers reduce frictional losses and enhance flow stability against separation but increase sensitivity to wall roughness. The locally reduced sound speed may induce shock waves and choke, while drastic variation in the isentropic exponent makes the multistage matching difficult and disperses normalized performance curves. Additionally, the quantitative impact of a near-critical phase change remains insufficiently understood. As for the experimental investigation, so far, it has been publicly shown that only the University of Notre Dame has conducted an axial-flow compressor experimental test, for the first stage of a 10 MW sCO2 multistage axial-flow compressor. Although the measured efficiency is higher than that of all known sCO2 centrifugal compressors, the inlet conditions evidently deviate from the critical point, limiting the applicability of the results to sCO2 power cycles. As for design and optimization, conventional design methodologies for axial-flow compressors require adaptations to incorporate real-gas property correction models, re-evaluations of maximum diffusion (e.g., the DF parameter) for sCO2 applications, and the intensification of structural constraints due to the high pressure and density of sCO2. In conclusion, further research should focus on two aspects. The first is to carry out more fundamental cascade experiments and numerical simulations to reveal the complex mechanisms for the near-critical, transonic, and two-phase flow within the sCO2 axial-flow compressor. The second is to develop loss models and design a space suitable for sCO2 multistage axial-flow compressors, thus improving the design tools for high-efficiency and wide-margin sCO2 axial-flow compressors.

1. Introduction

1.1. Development and Current Situation of sCO2 Cycle

Since being proposed by Feher [1] and Angelino [2] in the 1960s, the supercritical carbon dioxide (sCO2) Brayton cycle has emerged as a promising power system for its potential in various energy conversion applications, including nuclear, solar thermal, and geothermal power generation. This innovative cycle capitalizes on the distinctive thermophysical properties of CO2 in supercritical states (T > 31.1 °C; P > 7.38 MPa), which simultaneously exhibit gas-like low-viscosity and liquid-like high-density properties, thereby enabling highly compact turbomachinery designs with a higher thermodynamic efficiency compared with conventional ORC and steam cycles at a certain temperature range. Since the dawn of the 21st century, driven by the development demands of the fourth-generation nuclear reactor technology, sCO2 Brayton cycle technology has entered a stage of rapid development [3]. Sandia National Laboratories [4], the Tokyo Institute of Technology [5], Bechtel Marine Propulsion Corporation [6], and the Korea Advanced Institute of Science and Technology [7] have established small-scale test facilities to validate the technical feasibility of this technology. During the last decade, research organizations, such as the Xi’an Thermal Power Research Institute [8,9,10] and the Institute of Engineering Thermophysics of the Chinese Academy of Sciences [11,12,13,14] in China and the National Energy Technology Laboratory [15,16] in the United States, have begun to carry out higher power level tests and demonstrations, intending to bring the sCO2 power cycle technology to a higher technology readiness level.

1.2. Key Role of Compressors in sCO2 Cycle

As the key component of the sCO2 power cycle, the compressor plays a pivotal role in influencing both the thermodynamic efficiency and operational stability of the entire system. Its primary function involves compressing the working fluid from states slightly above the critical point to supercritical high-pressure conditions, typically within the range of 10–30 MPa. Although the power consumption of an sCO2 compressor (approximately 30% of the turbine output power [3]) is significantly lower than that of conventional gas turbine compressors (55–60% of turbine output [17]), it still represents a substantial portion of the system’s energy balance. Recent investigations [18,19] demonstrate that a 1% improvement in compressor isentropic efficiency can lead to an approximately 0.2% enhancement in overall cycle efficiency, as illustrated by the blue curve in Figure 1. This trend exhibits a nearly linear correlation across the typical efficiency range of compressors (75–90%). A similar trend is found in turbines, as illustrated by the orange curve. While the exact slope of the curves may vary depending on specific cycle configurations, the fundamental trend remains consistent. Consequently, optimizing compressor performance is essential for improving system efficiency and represents a key step in sCO2 power cycle development.

1.3. sCO2 Compressor Type: Centrifugal and Axial Flow

The compressor configuration for sCO2 power cycles, analogous to air Brayton cycles, predominantly employs turbomachinery solutions, specifically centrifugal or axial-flow designs. However, so far, there has been no unified opinion yet on which type of compressor is more suitable for sCO2 power generation applications [20]. Experience from air compressor applications indicates that centrifugal compressors demonstrate superior performance in low-power systems because of their simple structure, high single-stage pressure ratio, broader operational envelope, and enhanced durability. In contrast, axial-flow compressors exhibit distinct advantages in high-power systems, where their multistage architecture enables both high thermodynamic efficiency and compact footprint. Current analyses [18,21] suggest that turbines and recompressors are recommended to be radial for systems with power levels below 30 MW and 100 MW, respectively, while axial-flow configurations are preferred for systems with power above these values. Notably, the main compressor is recommended to maintain a centrifugal design across all power levels due to the characteristically low volumetric flow rates and the requirement for more robust operating stability under conditions with significant variations in fluid thermophysical properties near the critical point.
In recent years, as demonstrations for the sCO2 Brayton cycle have been advancing towards high power, axial-flow compressor investigations have been gaining more attention. This paper presents a systematic review of research over the past two decades from three aspects: (1) performance and flow characteristics, (2) numerical and experimental studies, and (3) design and optimization methodologies. Finally, conclusions and prospects are given, aiming to provide a valuable reference for future research and industrial applications in this field.

2. Main Characteristics of sCO2 Axial-Flow Compressor

sCO2 axial-flow compressors, utilizing supercritical carbon dioxide as the working fluid, exhibit distinct characteristics compared to air compressors. These differences are systematically analyzed as follows.

2.1. Overall Performance Characteristics

Due to the high fluid density of sCO2, the volumetric flow rate through a compressor becomes extremely limited at low power scales below 10 MW [21]. To maintain the high specific speeds required for optimal axial-flow compressor performance, design strategies should be adopted either to increase rotational speeds or to decrease stage enthalpy increases. However, the former introduces significant challenges to bearings technology and rotor dynamics, while the latter increases the number of stages, causing higher costs and lower efficiencies. Consequently, sCO2 axial-flow compressors are more suitable for high-power systems, especially those above 100 MW [21]. Table 1 summarizes the design parameters of sCO2 axial-flow compressors reported in the open literature.
Based on the aforementioned research, sCO2 axial-flow compressors exhibit the following distinctive characteristics:
(1)
High mass flow rates and low rotational speeds:
The mass flow rates of sCO2 axial-flow compressors are typically larger than those of sCO2 centrifugal compressors, which are primarily designed for applications with mass flow exceeding 100 kg/s, half of which are even exceeding 1000 kg/s. The rotational speeds are generally maintained within the range of 3000–5000 rpm for applications with mass flow exceeding 1000 kg/s, which aligns with electrical grid frequencies or just requires a small gear transmission ratio. Only in cases with mass flow rates below 200 kg/s [24,27,29,30] are higher rotational speeds employed, reaching 10,000 rpm or more.
(2)
High sensitivity to inlet conditions:
Most inlet states are located in the vicinity of the critical point, 32~42 °C and 7.8~9.0 MPa, where the compressor’s performance becomes very sensitive to inlet conditions. Only the designs of Ha et al. [29] and Ghimire et al. [30] adopt inlet conditions far away from the critical point. Hu [31] performs a comprehensive analysis of sCO2 axial compressor performance under various operating conditions, showing that the inlet temperature strongly influences the compressor’s stable operating range.
To mitigate instability risks near the critical point, stage loading is normally designed conservatively, as described below.
(3)
Low stage loading:
In most cases, the stage loading is relatively low. Although with total pressure ratios around 2 to 3, the number of stages is large, resulting in low pressure ratios for single stages (below 1.2), and specific speeds ranging between 1.5 and 2. As a rather exceptional case, Syblik et al. [28] present a two-stage design for future nuclear fusion power plants with a high pressure ratio (4.4) and mass flow rate (7388 kg/s). Meanwhile, its specific speed is also as low as 0.688, which is comparable to the optimal value of a centrifugal compressor. The authors suggest that a six-stage configuration might represent a better solution.
(4)
High efficiency:
The cases exhibit high total isentropic efficiencies, typically ranging from 87% to 93%. In contrast, the compressor designed by Liu et al. [26] shows a relatively low value of 77.82%, which could be caused by inter-stage matching issues. Nevertheless, sCO2 axial-flow compressors generally exhibit higher efficiency compared with centrifugal ones, indicating their priority in applications with high mass flow rate.

2.2. Influence of Key Physical Parameters on Performance and Internal Flow

Although the aerodynamic characteristics of sCO2 axial-flow compressors are influenced by numerous physical property parameters, a dimensional analysis of similarity criteria has been widely recognized as the most comprehensive approach for characterizing the general performance of turbomachinery [32]. This method enables the transformation of multiple physical variables into a short set of dimensionless parameters. Tello et al. [33] investigated the aerodynamic performance of an axial-flow cascade (NACA 65-010) using air and sCO2 as working fluids. Their results show good agreement between the performance of blade cascades designed for air, with CO2 at 1 atm and CO2 at supercritical states, when design parameters correspond to the similarity criteria. This verifies the applicability of the similarity criteria in sCO2 compressor designs. Gou et al. [34] pointed out that the pressure coefficient distributions of air and sCO2 are quite similar during compression at a low Mach number of 0.34 and similar inlet conditions, despite their different properties. This indicates that blade-loading design methodologies developed for air compressors may be directly applicable to the sCO2 compressor design. These findings also imply that the experience and technologies regarding air compressors could be employed for sCO2 applications.

2.2.1. Similarity Laws

For turbomachines with incompressible working fluid (Mach number below 0.3), flow field similarity can be ensured by maintaining equality of three key dimensionless parameters: the flow coefficient (φ), Reynolds number (Re), and relative surface roughness (ε). Under these conditions, other dimensionless performance parameters—including the load coefficient (ψ), efficiency (η), and power coefficient ( P ^ )—will consequently exhibit corresponding equal values, as expressed by Equation (1) [32]:
ψ , η , P ^ = f φ , Re , ε
In fluid machinery, it is well-known that the flow becomes fully developed turbulent when the Reynolds number exceeds a critical threshold. Under such a condition, the influence of viscous forces becomes negligible compared to inertial forces, and the flow characteristics exhibit Reynolds number independence. This phenomenon leads to flow similarity that is no longer significantly affected by the Reynolds number or other similarity criteria. Consequently, flow characteristics tend toward a steady state. This condition is termed the “self-modeling region”, in which the flow exhibits the so-called self-similarity. For high-speed turbomachinery components like compressors, the design point of operating conditions normally lies within this self-modeling region. In this regime, the effects of both Reynolds number (Re) and relative surface roughness (ε) can be neglected for similarity analysis in which only the flow coefficient (φ) is required. This simplification is significant for the design and performance prediction of such machinery.
ψ , η , P ^ = f φ
Using this method, the performance characteristics of compressors can be comprehensively represented by functions of the flow coefficient. For example, the experimental data obtained from an MW-class centrifugal compressor [14] tested by the Institute of Engineering Thermophysics, Chinese Academy of Sciences, in Hengshui, Hebei Province, exhibits the following normalized curve characteristics, as illustrated in Figure 2, by transforming test data at different rotational speed and inlet conditions into a dimensionless quantity. Although the test results were obtained from a sCO2 centrifugal compressor, the similarity laws and the influence patterns of key physical parameters (such as isentropic exponents, viscosities, sound speeds, etc.) on the internal flow field of the compressor are also applicable to axial-flow compressors. Future experimental research should primarily focus on aspects such as inter-stage matching and diffusion limits in axial compressors.
For high-speed turbomachinery operating with compressible flows (Mach number over 0.3), the flow function relationship becomes more complex. In the case of ideal gases, the characterization of the flow field requires two additional thermodynamic parameters: the inlet stagnation sound speed (a01) and the isentropic exponent (ns). When dealing with non-ideal gases, it is necessary to additionally introduce the compressibility factor (Z) to account for real-gas effects. Equation (3) provides a more comprehensive description of the flow behavior.
ψ , η , P ^ = f ϕ , Re , ε , a , n s , Z
For ideal gases, dimensionless parameters commonly used in the field of high-speed turbomachinery can be expressed by
p 02 p 01 , η , Δ T 0 T 01 = f m ˙ γ R T 01 D 2 p 01 , Ω D γ R T 01 , Re , γ
For a given compressor operating with a fixed working fluid under high-Reynolds-number conditions, the expressions can be further simplified into
p 02 p 01 , η , Δ T 0 T 01 = f m ˙ T 01 p 01 , Ω T 01
where m ˙ T 01 p 01 and Ω T 01 represent the reduced flow rate and reduced rotational speed, respectively, which are commonly employed in compressor engineering practice. These parameters fundamentally characterize the inlet axial Mach number and circumferential Mach number. In contrast to Equation (2), the reduced rotational speed is contained in Equation (5), in addition to causing multiple characteristic curves in a single performance map of conventional compressors, due to different reduced rotational speeds. Conversely, hydraulic machinery can present all operating conditions with a single dimensionless performance curve. From this perspective, the sCO2 centrifugal compressors, whose characteristics are illustrated in Figure 2, behave more like hydraulic machinery. Gong et al. [35] indicate that adopting pump design methodologies for sCO2 compressors is, to a certain degree, a feasible approach.
Through the aforementioned discussion, the differences between the characteristics of sCO2 and air compressors are mainly the isentropic exponent, compressibility factor, Reynolds number, and Mach number. The impacts of these key parameters will be subsequently discussed.

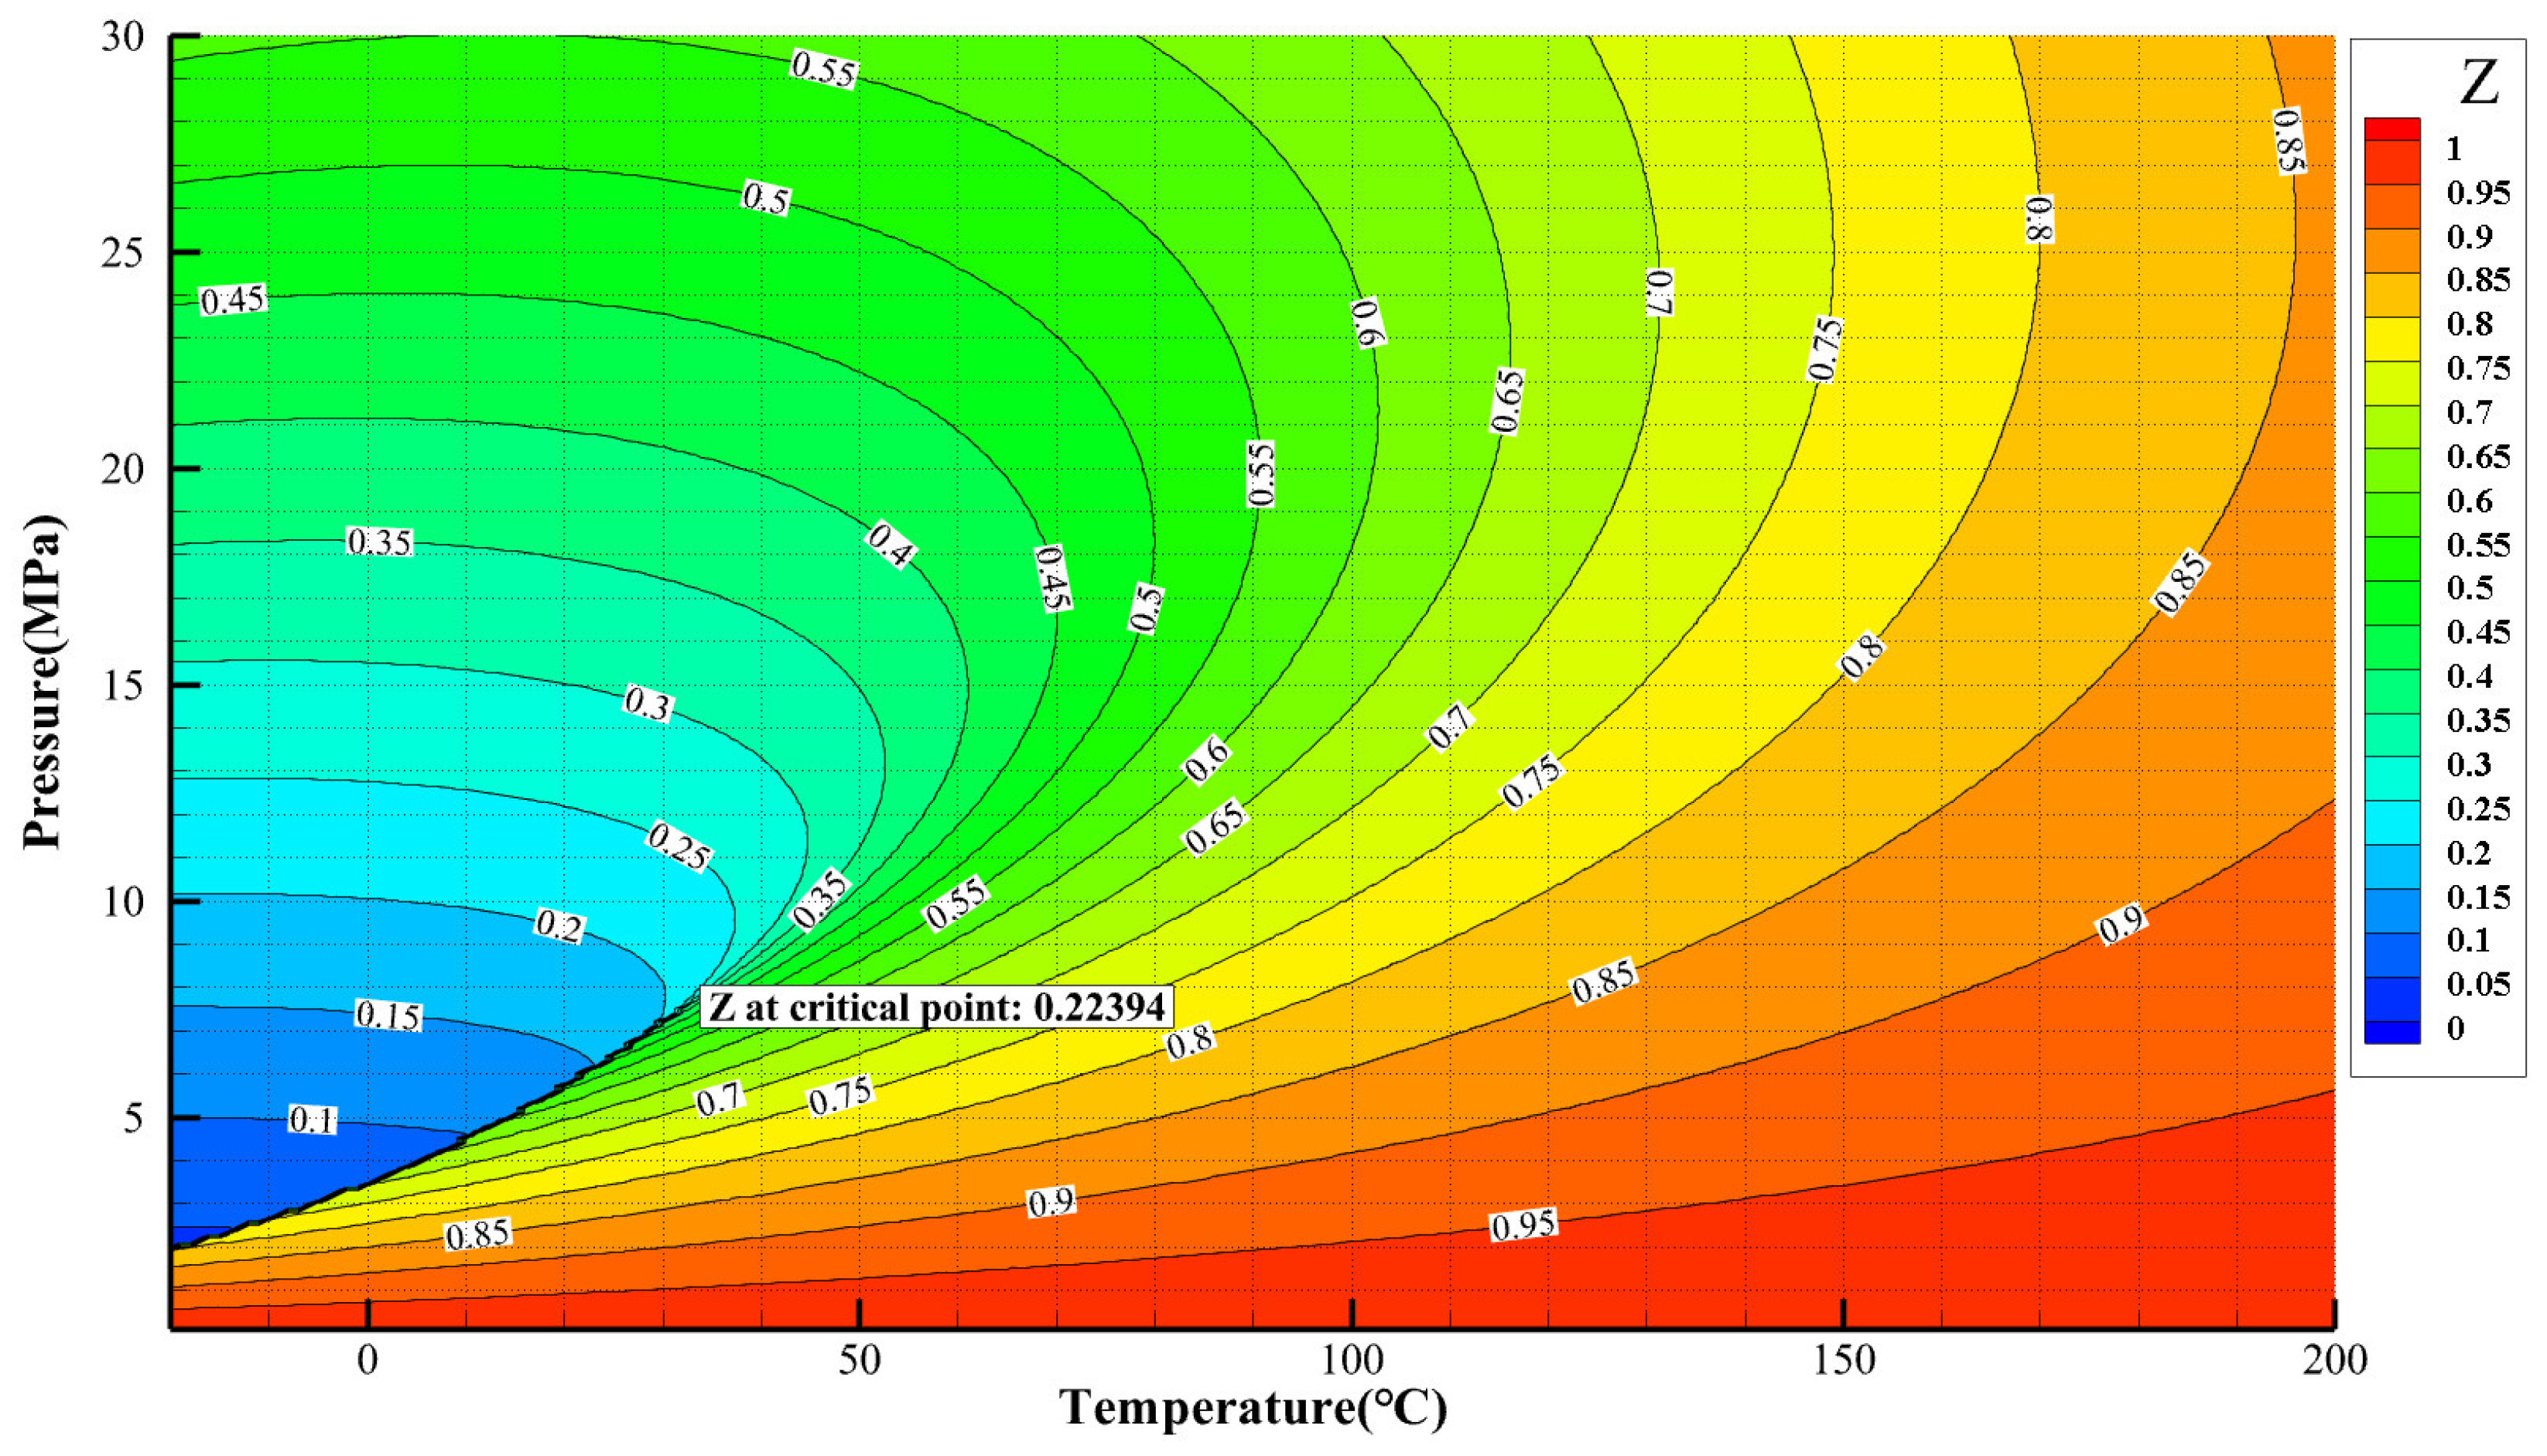
2.2.2. Isentropic Exponent and Compressibility Factor

For an adiabatic isentropic process, the pressure and specific volume ( v ) of a fluid should have the following relation:
p v n s = c o n s t
The isentropic exponent (ns) represents a thermodynamic parameter governing adiabatic isentropic processes. Its physical significance lies in characterizing the dimensionless rate of pressure variation with respect to volume during isentropic compression or expansion. The parameter is formally defined as follows:
n s = p v s p v
Only for an ideal gas does it become
n s = c p c v = γ
where the isentropic exponent and the specific heat ratio are equivalent and remain constant. However, for real gases, these two thermodynamic parameters are different and dependent on temperature and pressure. Notably, in the vicinity of the critical point, these quantities exhibit particularly pronounced variations, as shown in Figure 3 and Figure 4. Considering that the operating temperature and pressure of sCO2 compressors typically range from 7 to 10 MPa and from 300 to 350 K, respectively, the temperature and pressure ranges of the property-related curves in this study are extended to 0 to 30 MPa and 253 to 473 K based on this operational range.
In the study of real-gas behavior, the compressibility factor (Z) is considered to account for the interaction between molecules and to describe the deviation from the ideal gas law.
Z = p v R g T
For an ideal gas, Z is unity (Z = 1). In contrast, real gases exhibit Z values less than 1 in the typical application area. The variation in the compressibility factor for carbon dioxide as a function of pressure and temperature is presented in Figure 5.
Baltadjiev et al. [36] further derived the relationship between the isentropic exponent of real gases and the compressibility factor:
n s = γ 1 p Z Z p T , m s = γ 1 γ 1 p Z Z p T 1 + T Z Z T p
The pressure adiabatic exponent (ns) and temperature adiabatic exponent (ms) play a critical role in thermodynamic processes. As shown in Equation (10), if the compressibility factor equals one, the adiabatic exponents are only functions of the specific heat ratios.
The isentropic exponent and compressibility factor exert significant influence on compressor performance and internal flow characteristics through three primary mechanisms:
(1)
Direct effects on internal flow dynamics:
Gou et al. [25] conducted a comprehensive theoretical and numerical investigation of physical property effects on adiabatic compression processes using sCO2 as the working fluid. Their findings indicate that sCO2 typically exhibits faster compression characteristics compared to ideal air, resulting in a reduced outlet Mach number and an enhanced pressure rise ratio.
(2)
Through-flow matching between stages:
For an ideal compressible flow, the relationships between stagnation and static parameters are as follows:
p 0 p = 1 + γ 1 2 M 2 γ γ 1
T 0 T = 1 + γ 1 2 M 2
ρ 0 ρ = 1 + γ 1 2 M 2 1 γ 1
However, in the case of real gases, the equations above become invalid due to variations in the compressibility factor and specific heat ratio. Baltadjiev et al. [36] conducted a systematic study on this issue and subsequently derived analogous expressions applicable to real gases, as presented in Equations (14)–(16).
p 0 p = 1 + n s 1 2 M 2 n s n s 1
T 0 T = 1 + n s 1 2 M 2 m s n s n s 1
ρ 0 ρ = 1 + n s 1 2 M 2 1 n s 1
Although the above three formulas take into account the effect of real gases, the derivation relies on an integral assuming a constant isentropic exponent. This assumption is acceptable when the fluid state is far away from the critical point. However, in the proximity of the critical point, these relations may exhibit significant deviations. Baltadjiev [37] numerically tested an sCO2 converging nozzle and found that for the case where the total inlet conditions are away from the critical point, the isentropic exponent varies from 1.39 to 1.32, or only by 6%, while for the case slightly closer to the critical point, the variation increases up to 20%, which makes the calculation error for corrected mass flow increase from 1% to 7%.
At the same time, the concept of the stagnation compressibility factor Z0 is introduced:
Z 0 Z = 1 + n s 1 2 M 2 1 m s n s n s 1
The reduced mass flow rate applicable to the compressible flow of real gases can therefore be given by
m ˙ Z 0 R T 0 A p 0 n s = M 1 + n s 1 2 M 2 n s 1 2 n s 1
where A stands for flow area and m ˙ stands for mass flow rate. The influence of the isentropic exponent on the flow characteristics was systematically investigated by analyzing the variation in the reduced mass flow rate with a Mach number at various isentropic exponent values [36,37]. The results demonstrate that the isentropic exponent significantly affects the reduced flow rate. Baltadjiev et al. conducted further research pointing out that the compressor surge margin decreases by approximately 9% with an increasing isentropic exponent near the critical point. Additionally, the fluctuation in reduced mass flow per unit area increases by 5%, impacting the matching of downstream components.
Furthermore, the results [36] indicate that when the Mach number remains below 0.5, variations in the isentropic exponent exhibit negligible influence on the reduced mass flow rate.
(3)
Influence on the performance curve
In order to obtain performance characteristics of turbomachinery employing different working fluids based on the test data of air compressors, Zou and Ding [38] developed a similarity method for converting turbomachine performances with different working fluids, including the conversion of mass flow rate, efficiency, and pressure ratio. A new similarity criterion is established based on kinetic similarity and rotation enthalpy equivalent. The similarity method has acceptable accuracy in engineering, but it does not take into account the impact of real-gas effects. Robert et al. [39] studied the effect of the isentropic exponent on performance conversion between machines using different mediums, assuming a constant load coefficient φ.
Because the general performance curves calculated by the traditional relations of reduced flow rates and reduced rotation speeds are no longer applicable by considering real-gas effects, the authors’ previous work [40] proposed a method to express general performance curves under different working conditions of sCO2 compressors by using an axial Mach number and a circumferential Mach number instead of a reduced mass flow rate and a reduced rotation speed. This work also provides an iterative calculation method of axial and circumferential Mach numbers for engineering applications. Although the calculation and verification are based on centrifugal compressors, the relevant theory is fully applicable to axial-flow compressors.

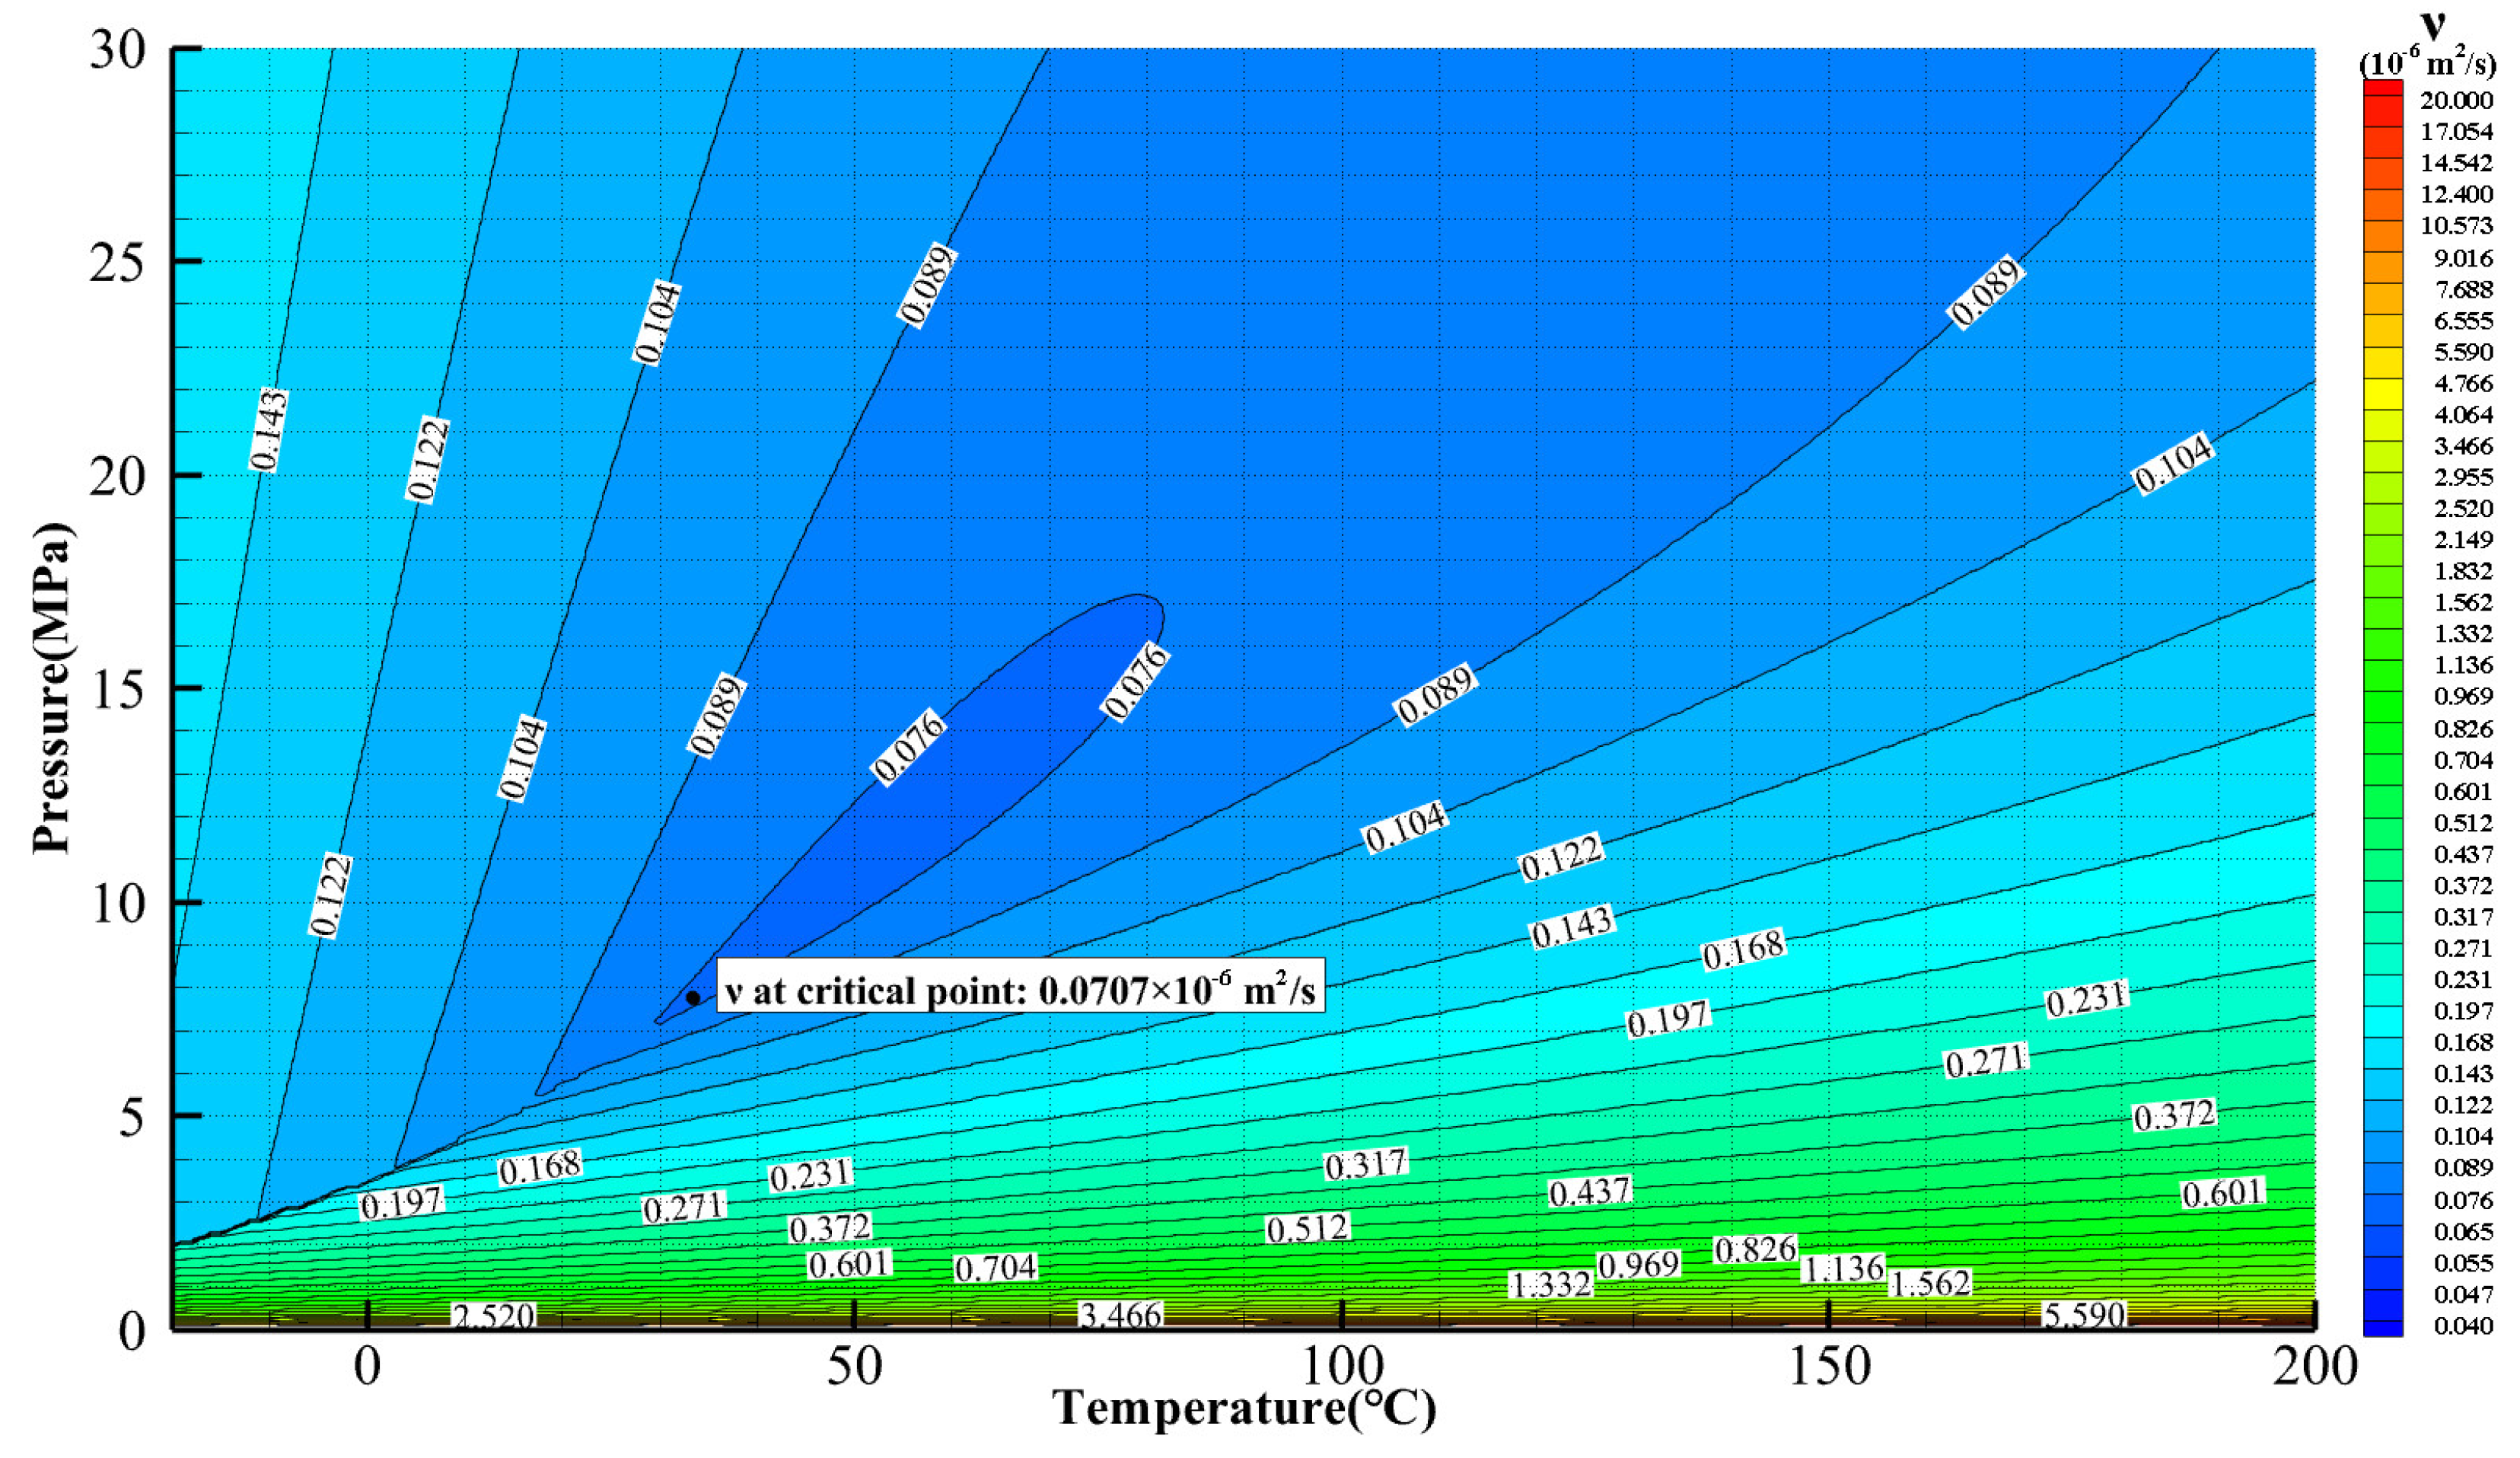
2.2.3. Viscosity and Reynolds Number

Due to the simultaneous high-density and low-viscosity properties, the Reynolds number of sCO2 in the compressor is usually two orders of magnitude higher than that of media such as air. The effects of density and dynamic viscosity can be combined into the effects of the kinematic viscosity ν.
Re = ρ U L μ = U L ν
Figure 6 shows that ν reaches the minimum in the vicinity of the critical point. This explains why the Reynolds number of the sCO2 compressor is large in this area.
Table 2 compares the kinematic viscosity of several typical working fluids. In combination with Equation (19), it can be seen that the Reynolds number of sCO2 will be one order of magnitude higher than that of water and two orders of magnitude higher than that of air at the same speed and size. This implies that the similarity characteristics of an sCO2 compressor are more like a water pump, verifying the design method introduced by Gong et al. [35] for sCO2 applications.
The high Reynolds number due to sCO2 properties could bring the following benefits:
(1)
The relative inertia of the fluid is large, resulting in a thin boundary layer and strong resistance to flow separation. Tello et al. [33] compared the aerodynamic performance of axial-flow cascade NACA 65-010 for both air and sCO2 through numerical calculations and pointed out that the total pressure loss of sCO2 is lower at the trailing edge in contrast to air cascades because of the higher Reynolds number of the sCO2 cascade. The simulation result also exhibits a smaller wake region, implying a better performance against flow separation. Furthermore, it is found that the sCO2 cascade has a wider operation range at high incidence angles because the flow separation is weaker. Monje et al. [41] reported less blockage of the sCO2 cascade due to a thinner boundary layer through numerical simulations. However, it needs to be noted that sCO2 may exhibit stronger flow separation in a flow path with a large curvature due to its large inertia. In such a case, sCO2 may exhibit a smaller diffusion coefficient and a larger blockage coefficient than air. This causes a sharp decrease in efficiency when a compressor with a vaned diffuser is operated under partial load. To avoid this, many designs apply a converging vaneless diffuser [42]. In addition, Lopez et al. [43] studied the distortion of inlet velocity distribution as well as the intensity and scale of turbulence. They found that, under similar boundary conditions, the inlet flow distortion has a weaker impact on pressure recovery in the diffuser when using CO2 compared to air.
(2)
The viscosity is low, so the coefficient of frictional resistance is small. In a channel without diffusion, the relationship between the friction coefficient and Reynolds number can be described by a Moody diagram, which is commonly used in engineering. If the wall roughness is identical, the friction coefficient will first decrease with increasing Reynolds number and remain constant as the Reynolds number reaches a certain value from which the flow exhibits full turbulent characteristics. This Reynolds number may be called the critical Reynolds number. Monje et al. [41] also came to the conclusion that the friction loss in an sCO2 compressor is lower than an air compressor due to a higher Reynolds number. This could be the reason for the higher overall efficiency of sCO2 compressors. Because of this, vaned diffusers are expected to have less sensitivity to the number of blades, and therefore, are able to be designed with either more blades or a smaller diffuser diameter to improve the flow angle.
It is important to note that, although various studies [44] have obtained different critical Reynolds numbers for air compressors, they reported values generally in the order of 105. In contrast, as pointed out by López et al. [43], the Reynolds number of sCO2 compressors is about 100 times higher than that of air, maintaining the benefits of the high Reynolds number region for a wider range. If the friction coefficient keeps decreasing as the Reynolds number increases from 105 to 107, the total pressure loss can be reduced by 50%.
In addition, wall roughness has a significant impact on the efficiency and stable operating range of the air compressor [45]. For sCO2 compressors, the impact of wall roughness may be much greater due to their much thinner boundary layer. Wisler [46] reported that the dimensionless roughness should also be considered as an additional parameter in similarity criteria, in the form of the roughness Reynolds number. The authors’ previous work has found significant effects of roughness on sCO2 compressor performance through experiments [47].

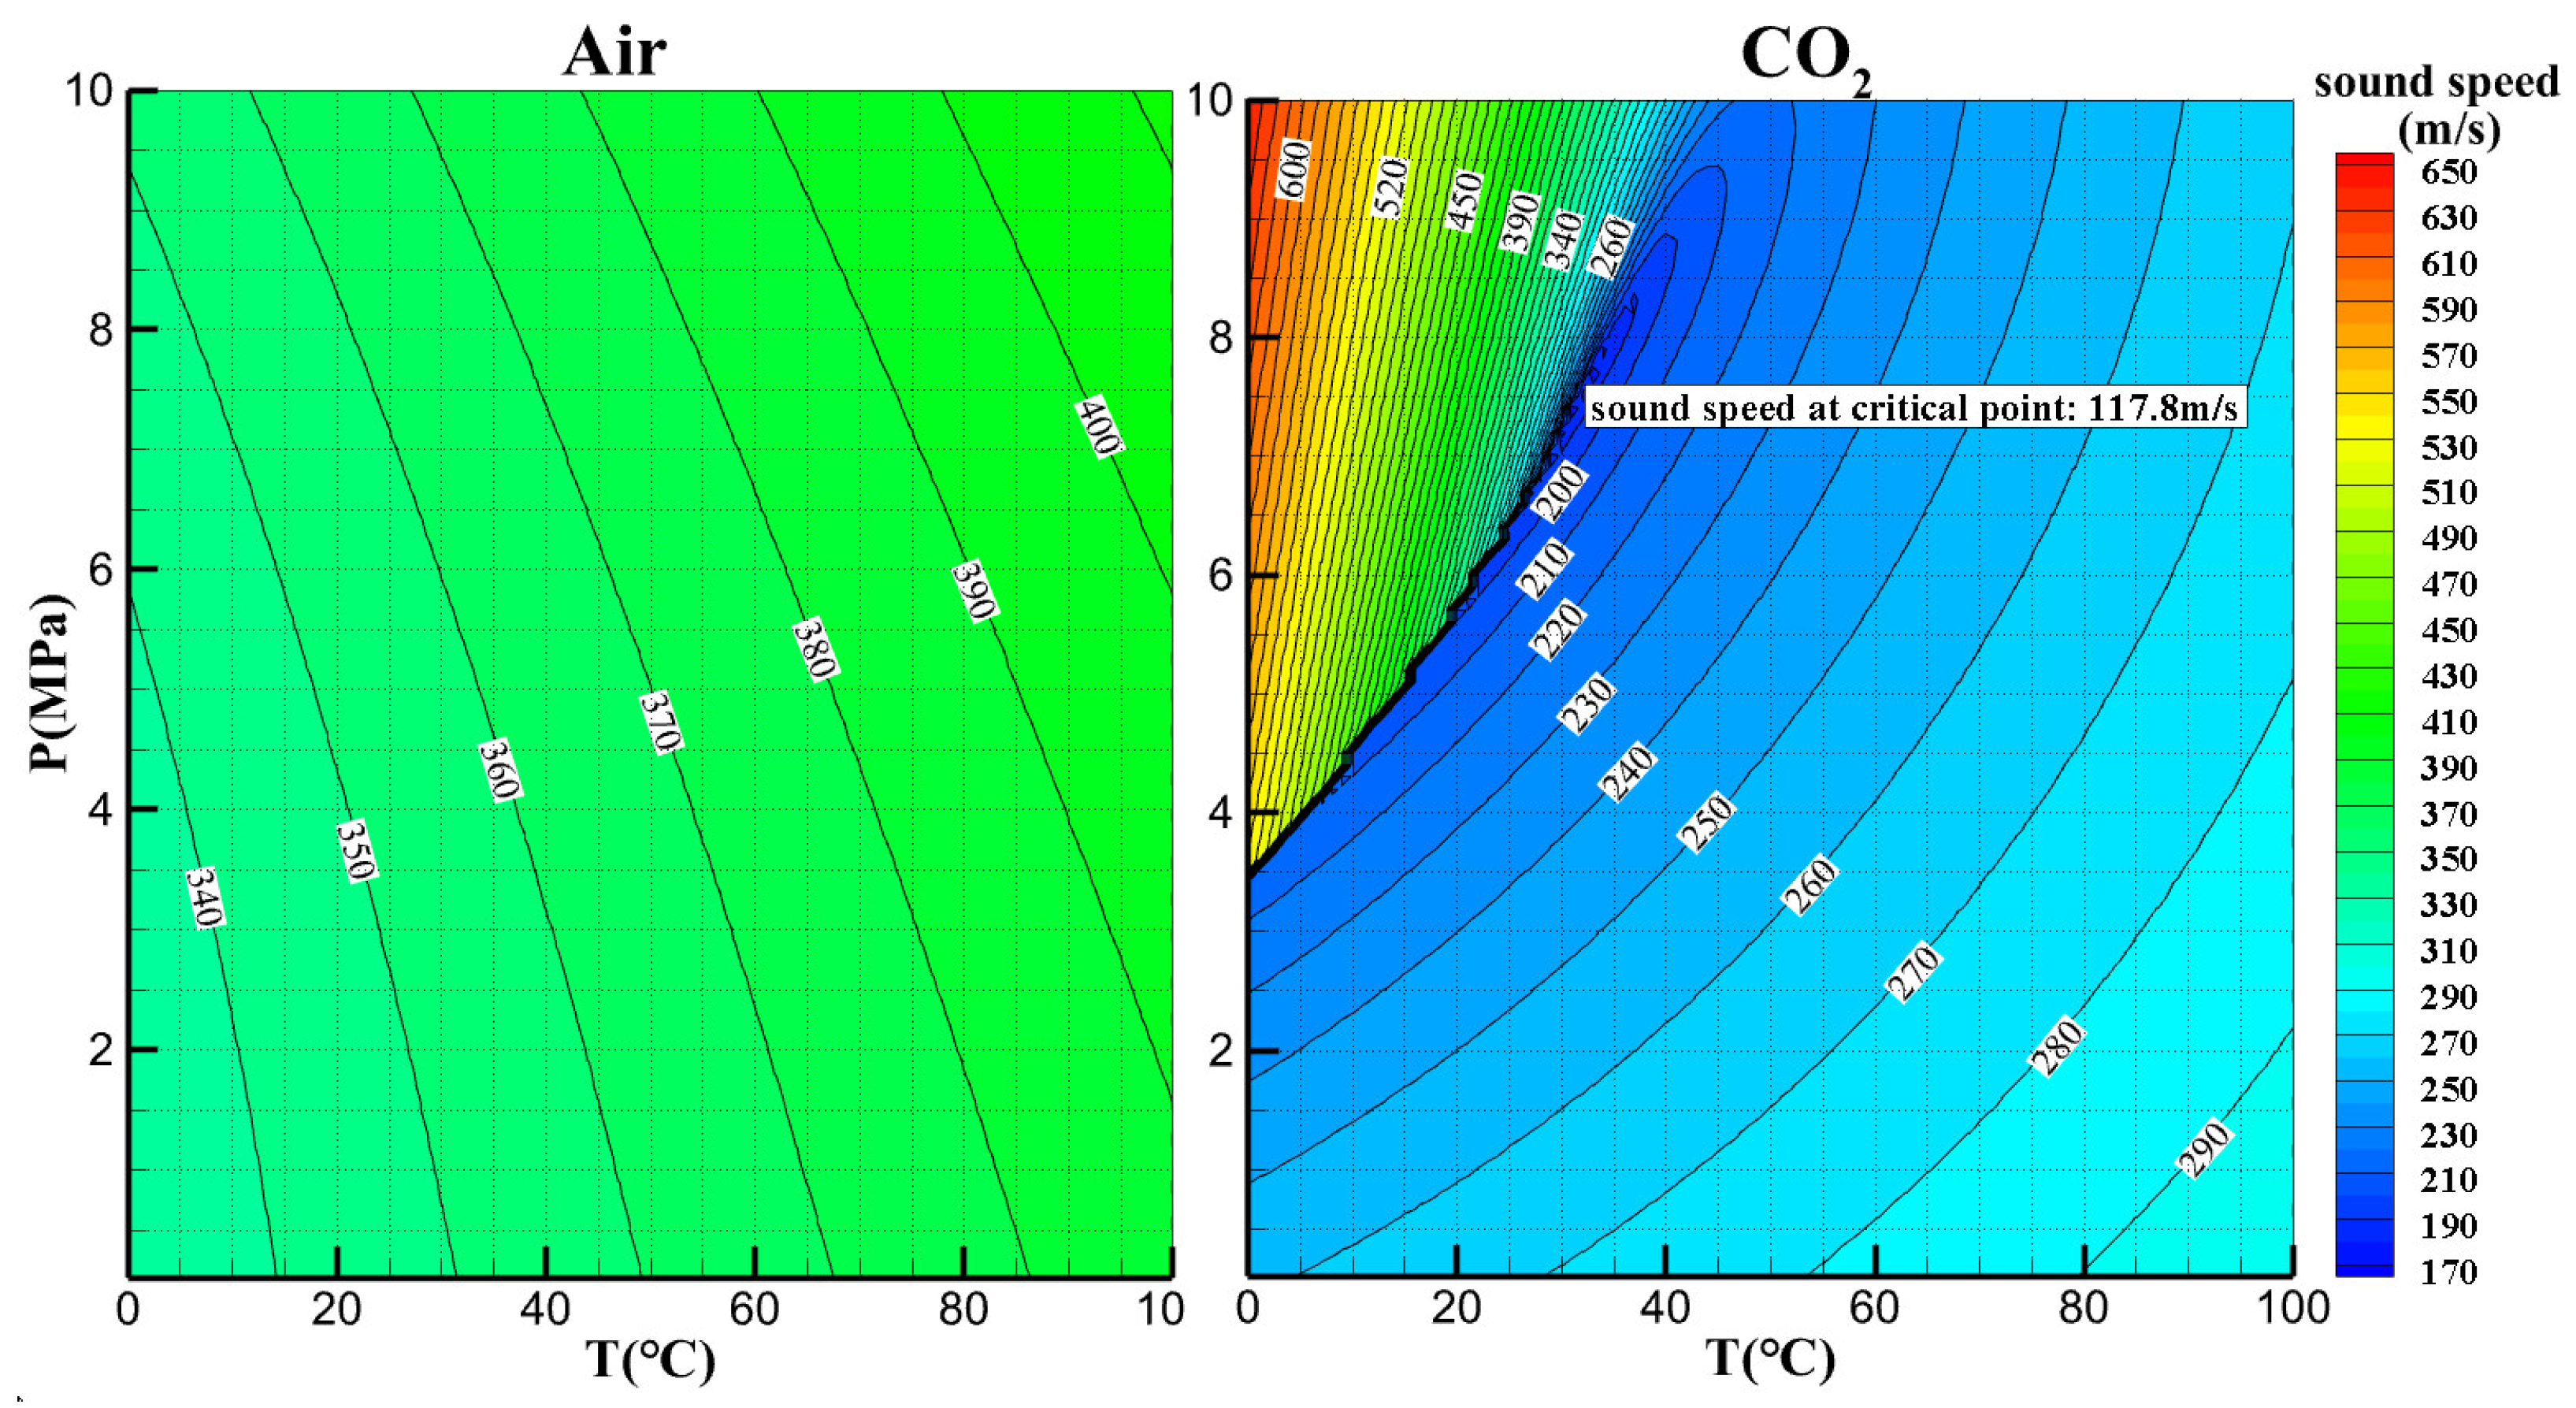
2.2.4. Sound Speed and Mach Number

The expression for the sound speed is as follows:
a = p ρ s = n s p v = n s Z R g T = n s Z R M g T
In the formula, R represents the universal gas constant, 8.314 J/(mol·K), Rg represents the mass-specific gas constant, and Mg is the molecular weight.
Generally speaking, CO2 has a lower sound speed than air due to its larger molecular weight, which is unfavorable for the transonic aerodynamic performance, as lower sound speeds mean higher Mach numbers. At the critical point, CO2 reaches the lowest sound speed around 170 m/s, which is less than half of the typical air sound speed (340 m/s), as shown in Figure 7, because it also has a smaller compressibility factor, Z, near the critical point, as shown in Figure 5. In the liquid region, the sound speed is higher due to the sharp increase in the isentropic exponent ns, as shown in Figure 4, whose growth rate is larger than the decreasing rate of the compressibility factor Z in the process of liquefaction.
Near the critical point, the sound speed of sCO2 exhibits large gradients, which will cause a sudden increase in Mach number, resulting in shock. In a two-dimensional planar cascade simulation of sCO2, Takashi et al. [48] found that the normal shock wave generated in the cascade channel largely depends on the supercritical pressure condition at the inlet. In the supercritical state, variations in the inlet pressure will cause variations in the sound speed, which in turn will lead to variations in the Mach number, thus causing the movement of the normal shock wave. As shown in Figure 8, the authors’ analysis in [40] found that the high Mach number region at the leading edge of the sCO2 centrifugal compressor blade was probably caused by the local near-critical low sound speed, although it did not cause significant shock loss. Although the discussion above is regarding centrifugal compressors, it should be further discussed whether these issues exist in axial-flow compressors.
In addition, through CFD simulations and one-dimensional theoretical analysis, Anderson [49] found that the flow may choke at Mach numbers much lower than one when sCO2 becomes liquid-like. This may cause issues during compressor operation, such as shock waves and corresponding losses.
Furthermore, the Mach number may influence the accuracy of the similarity criteria. Tello et al. [33] pointed out that the validity of the similarity criteria is constrained. Some early studies on air compressors have found that the difference in similar cascade performance increases with increasing inlet Mach number. Especially, when the Mach number is higher than 0.6, the influence of compressibility on the similarity criteria becomes significant. Gou et al. [34] simulated a two-dimensional compressor cascade with low and medium inlet Mach numbers. They found that at low Mach numbers, the pressure coefficients on the blade surface of the air and sCO2 compressor are almost the same. At high Mach numbers, the inlet Mach number, flow angle, and Reynolds number are equivalent, and the blade profile is similar to air compressors; in addition, sCO2 compressor cascades produce a larger Mach number upstream of the throat and a lower Mach number downstream of the throat, leading to a larger static pressure rise and a smaller static temperature rise in the wake zone. This indicates that the blade profile design approaches for air compressors with respect to blade load distribution can be applied for sCO2 compressors at low Mach numbers, but they should be further improved for applications at higher Mach numbers.

2.3. Vapor–Liquid Phase Change and Two-Phase Flow

When the inlet condition of sCO2 axial-flow compressors is in the vicinity of the critical point, the flow may enter the two-phase zone, forming the gas–liquid mixed flow at the suction surface of the leading edge or the tip clearance of the blade. The problems caused by gas–liquid two-phase flow to the compressor are as follows:
(1)
It affects the efficiency and stability of sCO2 axial-flow compressors. The experimental results from Sandia demonstrate that condensation has minimal impact on stable long-term operations [50,51]. Gou et al. [25] compared the distribution of static pressure and temperature, and the tip leakage flow in the rotor passage of a sCO2 axial-flow compressor to those of an air axial-flow compressor, which is geometrically similar, with the same inlet Reynolds number and Mach number. They found that these flow parameters are similar under certain conditions and pointed out the existence of a subcritical flow region extending from the blade root to the tip along the leading edge of the rotor, which may cause potential risks to the aerodynamic stability of the compressor system. Through numerical simulation, Li et al. [27] found that a 1% increase in the tip clearance of the sCO2 axial-flow compressor leads to a 1.75% reduction in efficiency in her research. And she found that there is a risk of condensation due to the inlet condition near the critical point. The authors’ previous work [40] quantitatively analyzed the effect of phase transition on the performance of sCO2 centrifugal compressors through numerical simulation. Although it may not be applicable to sCO2 axial-flow compressors, two types of phase transition, “cavitation” and “condensation”, proposed by the authors in their previous work [40] (Figure 9) may still exist. Hu [31] pointed out that the condensation problem is difficult to ignore in the design of a multistage sCO2 axial-flow compressor because the inlet conditions are close to the critical point. However, it is still necessary to figure out whether the phenomenon of condensation occurs and what the impact of the condensation problem is on sCO2 axial-flow compressors by implementing more unsteady numerical simulations and advanced experiments.
(2)
The presence of a two-phase flow may cause blade erosion. The concern about the blade erosion by a two-phase flow comes from the engineering experience of the steam turbine and water pump industry. The erosion of turbine blades by water droplets is critical due to the generation of a large amount of moisture in the low-pressure cylinder of the steam turbine [52]. In hydraulic machinery such as pumps and propellers, the erosion of cavitation on the blade is the most critical design problem [32]. However, the erosion effect of the two-phase flow in sCO2 compressors has not been found in most experimental studies at present [7,50,51,53], which may be related to the small density difference between the gas and liquid phases near the critical point.
(3)
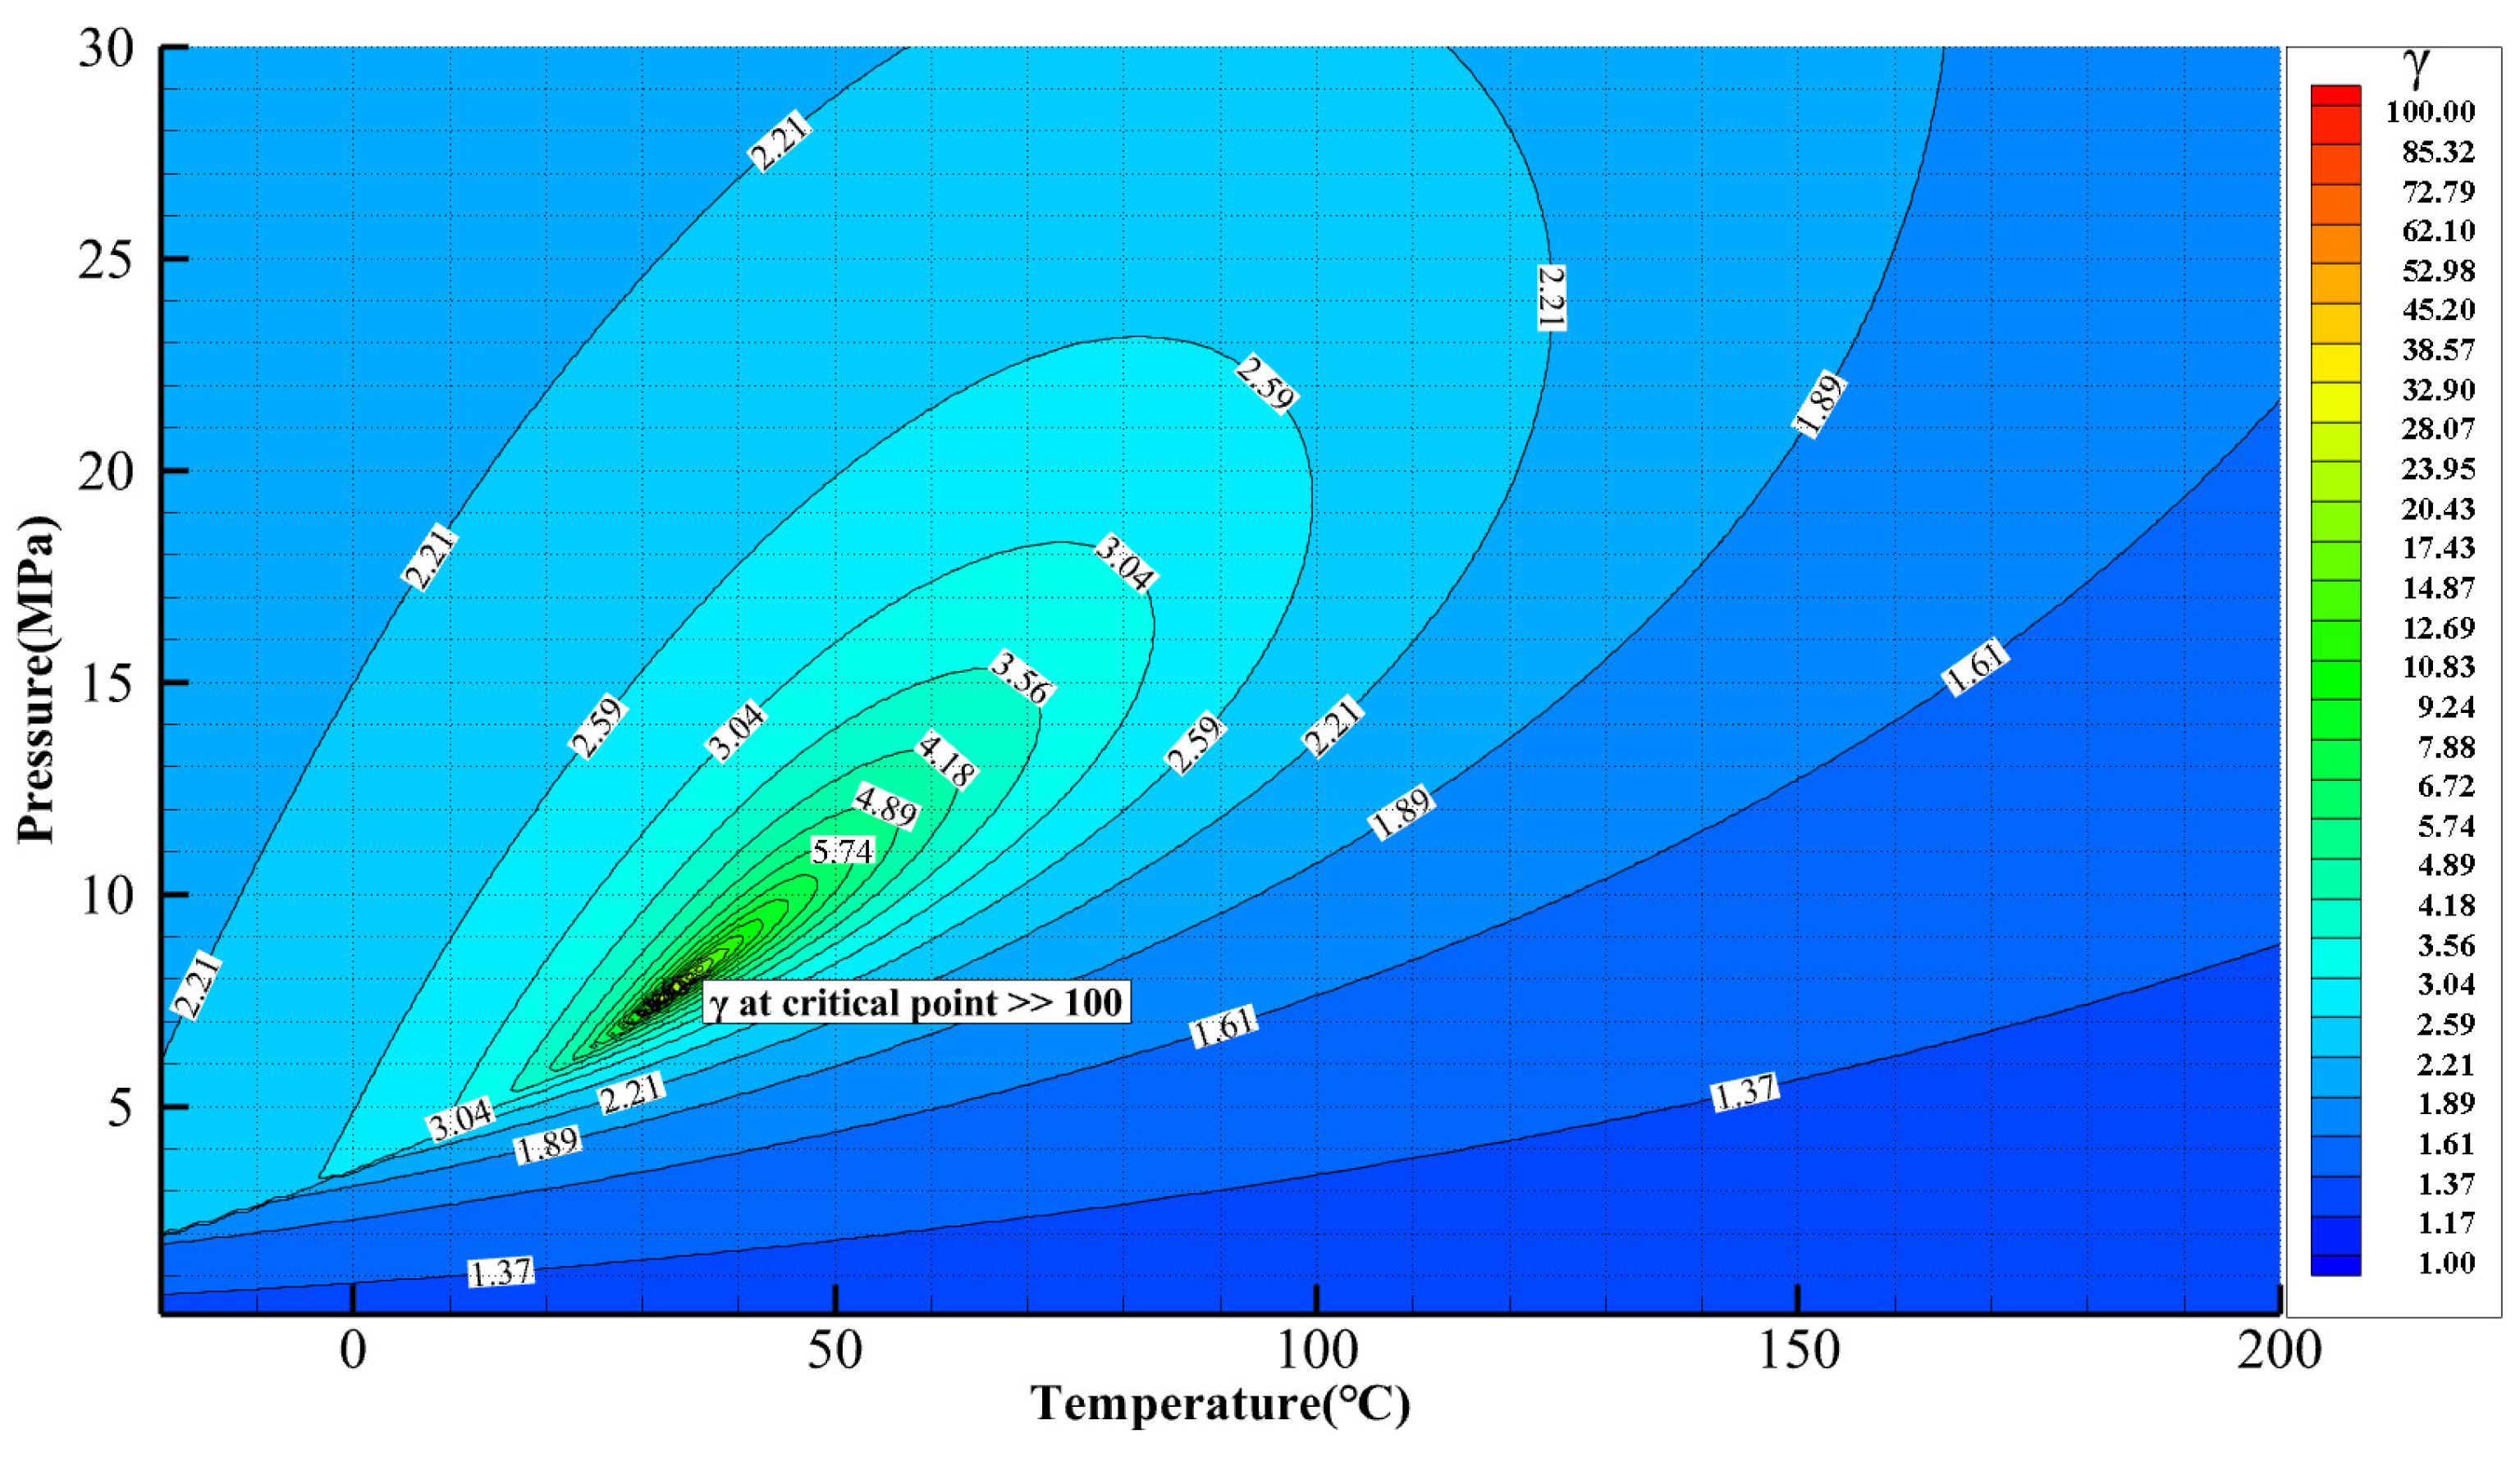
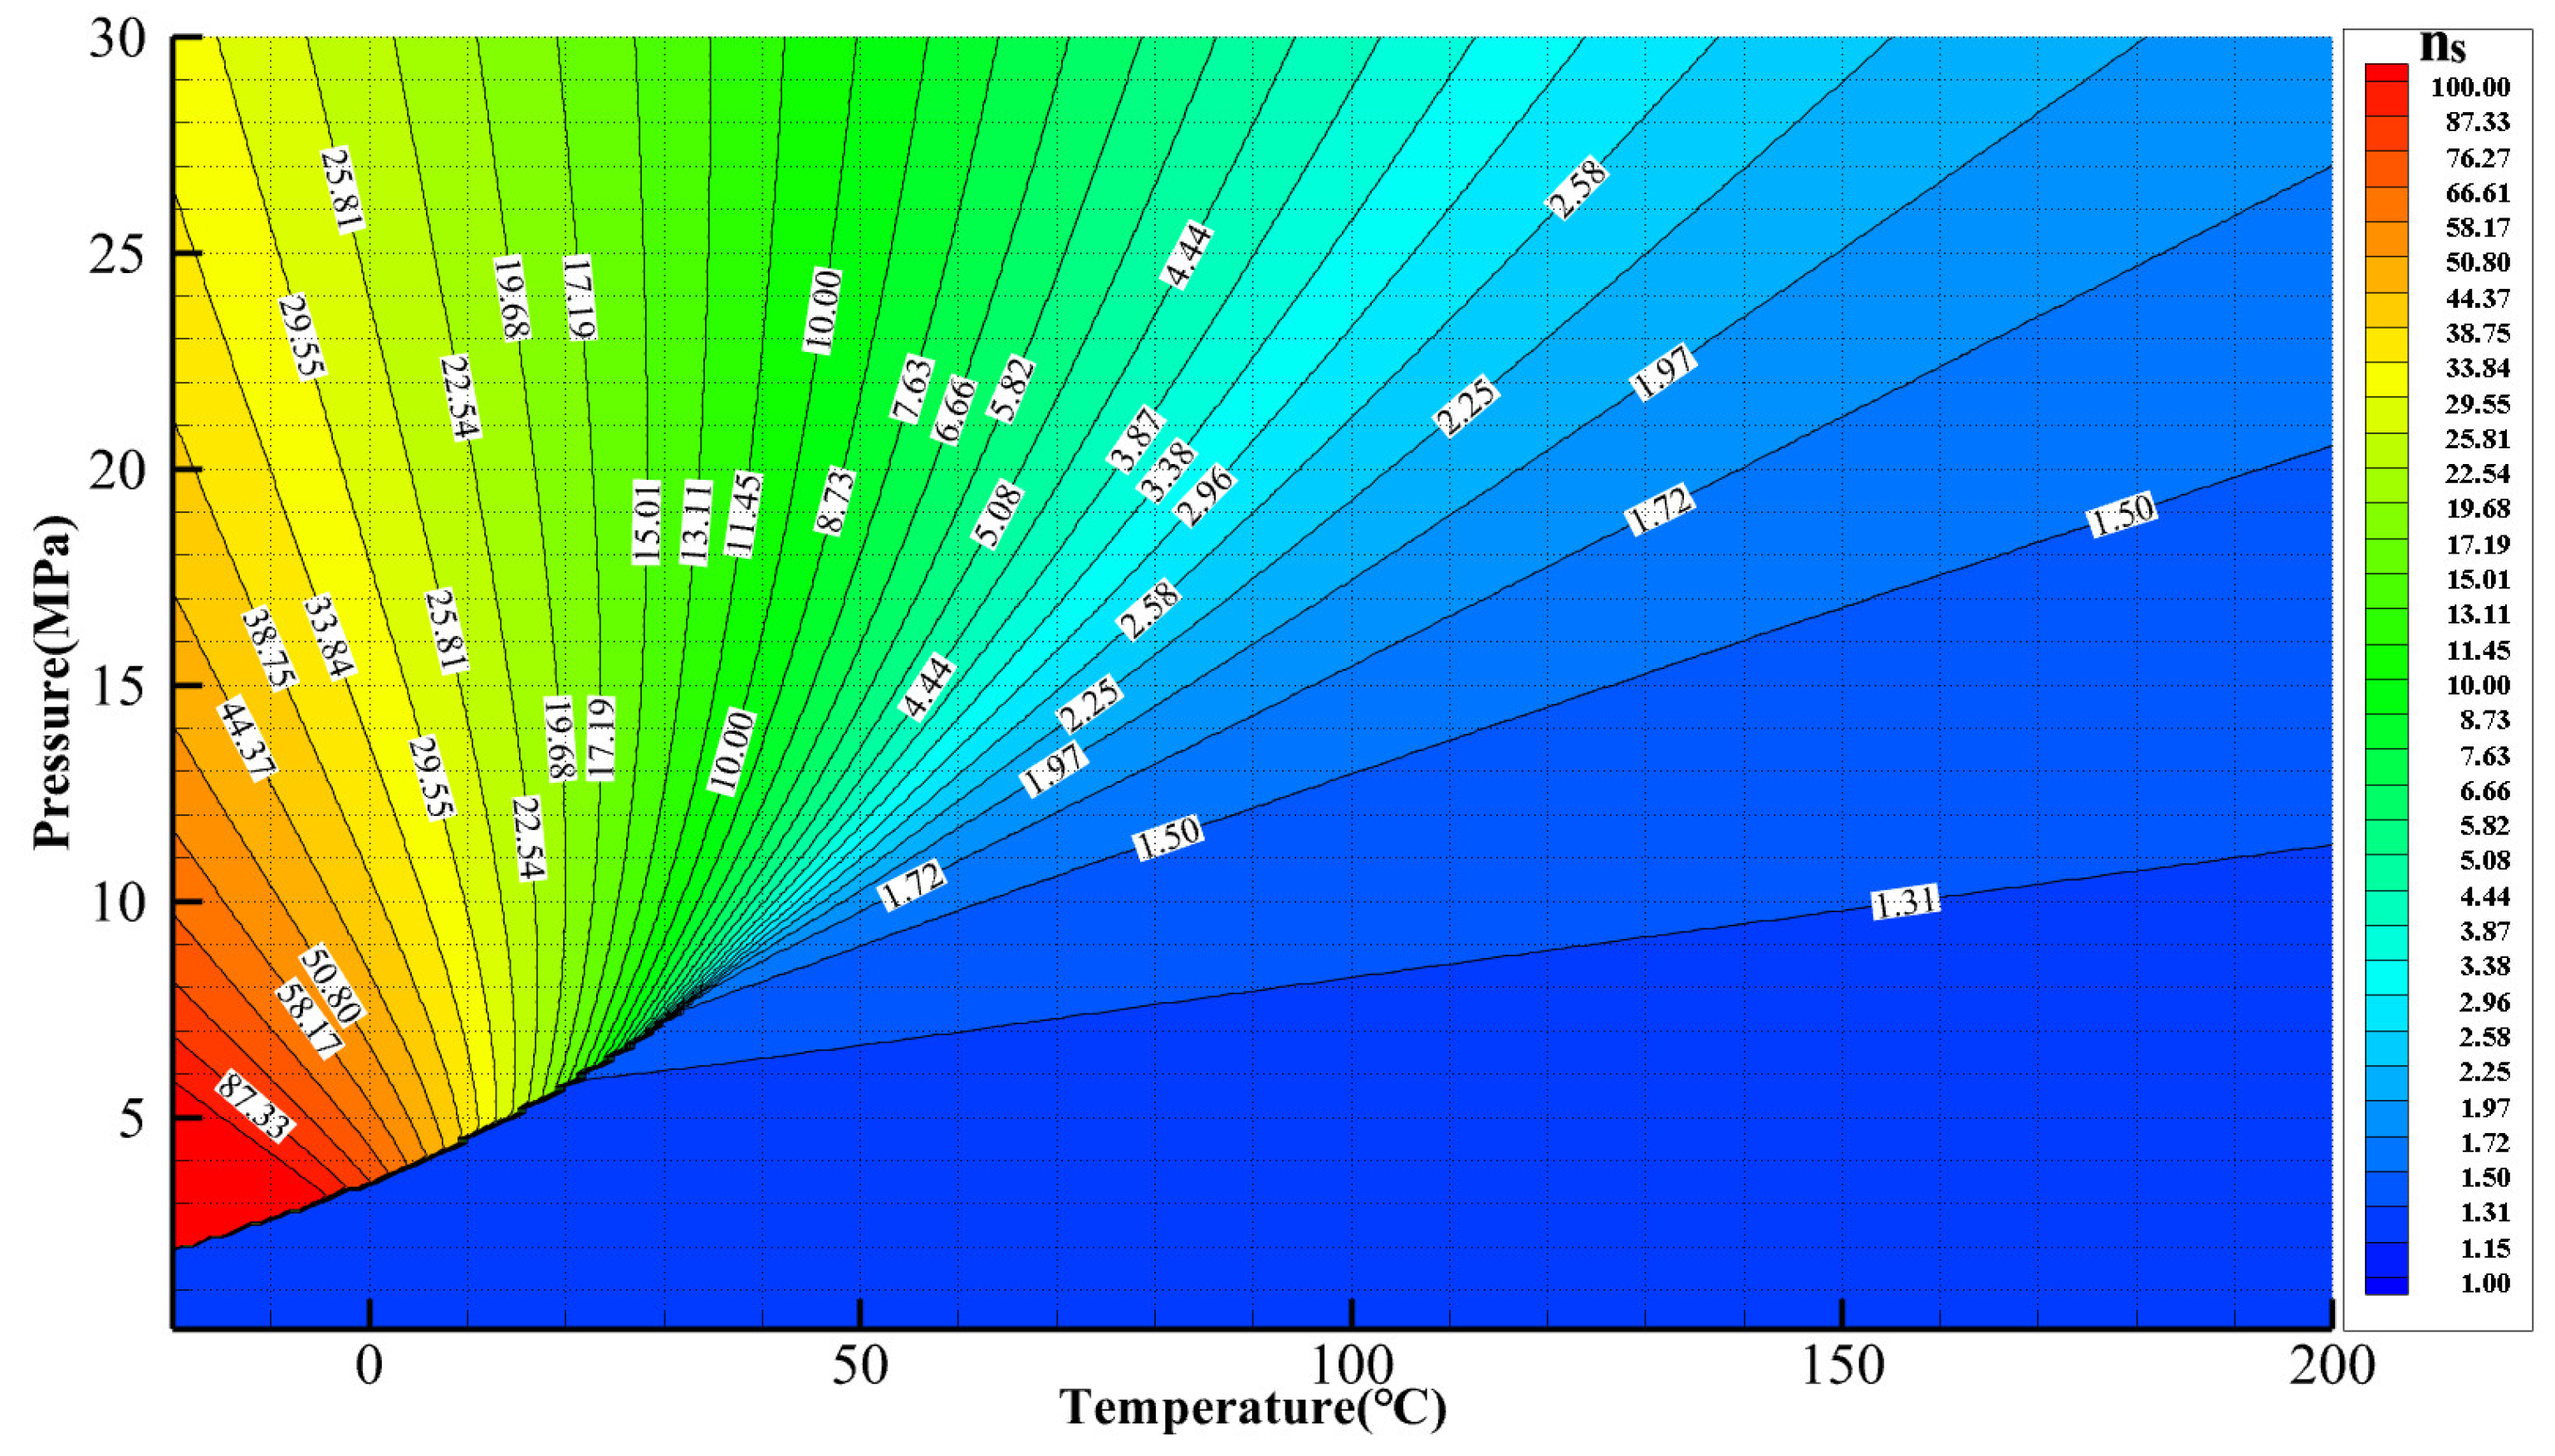
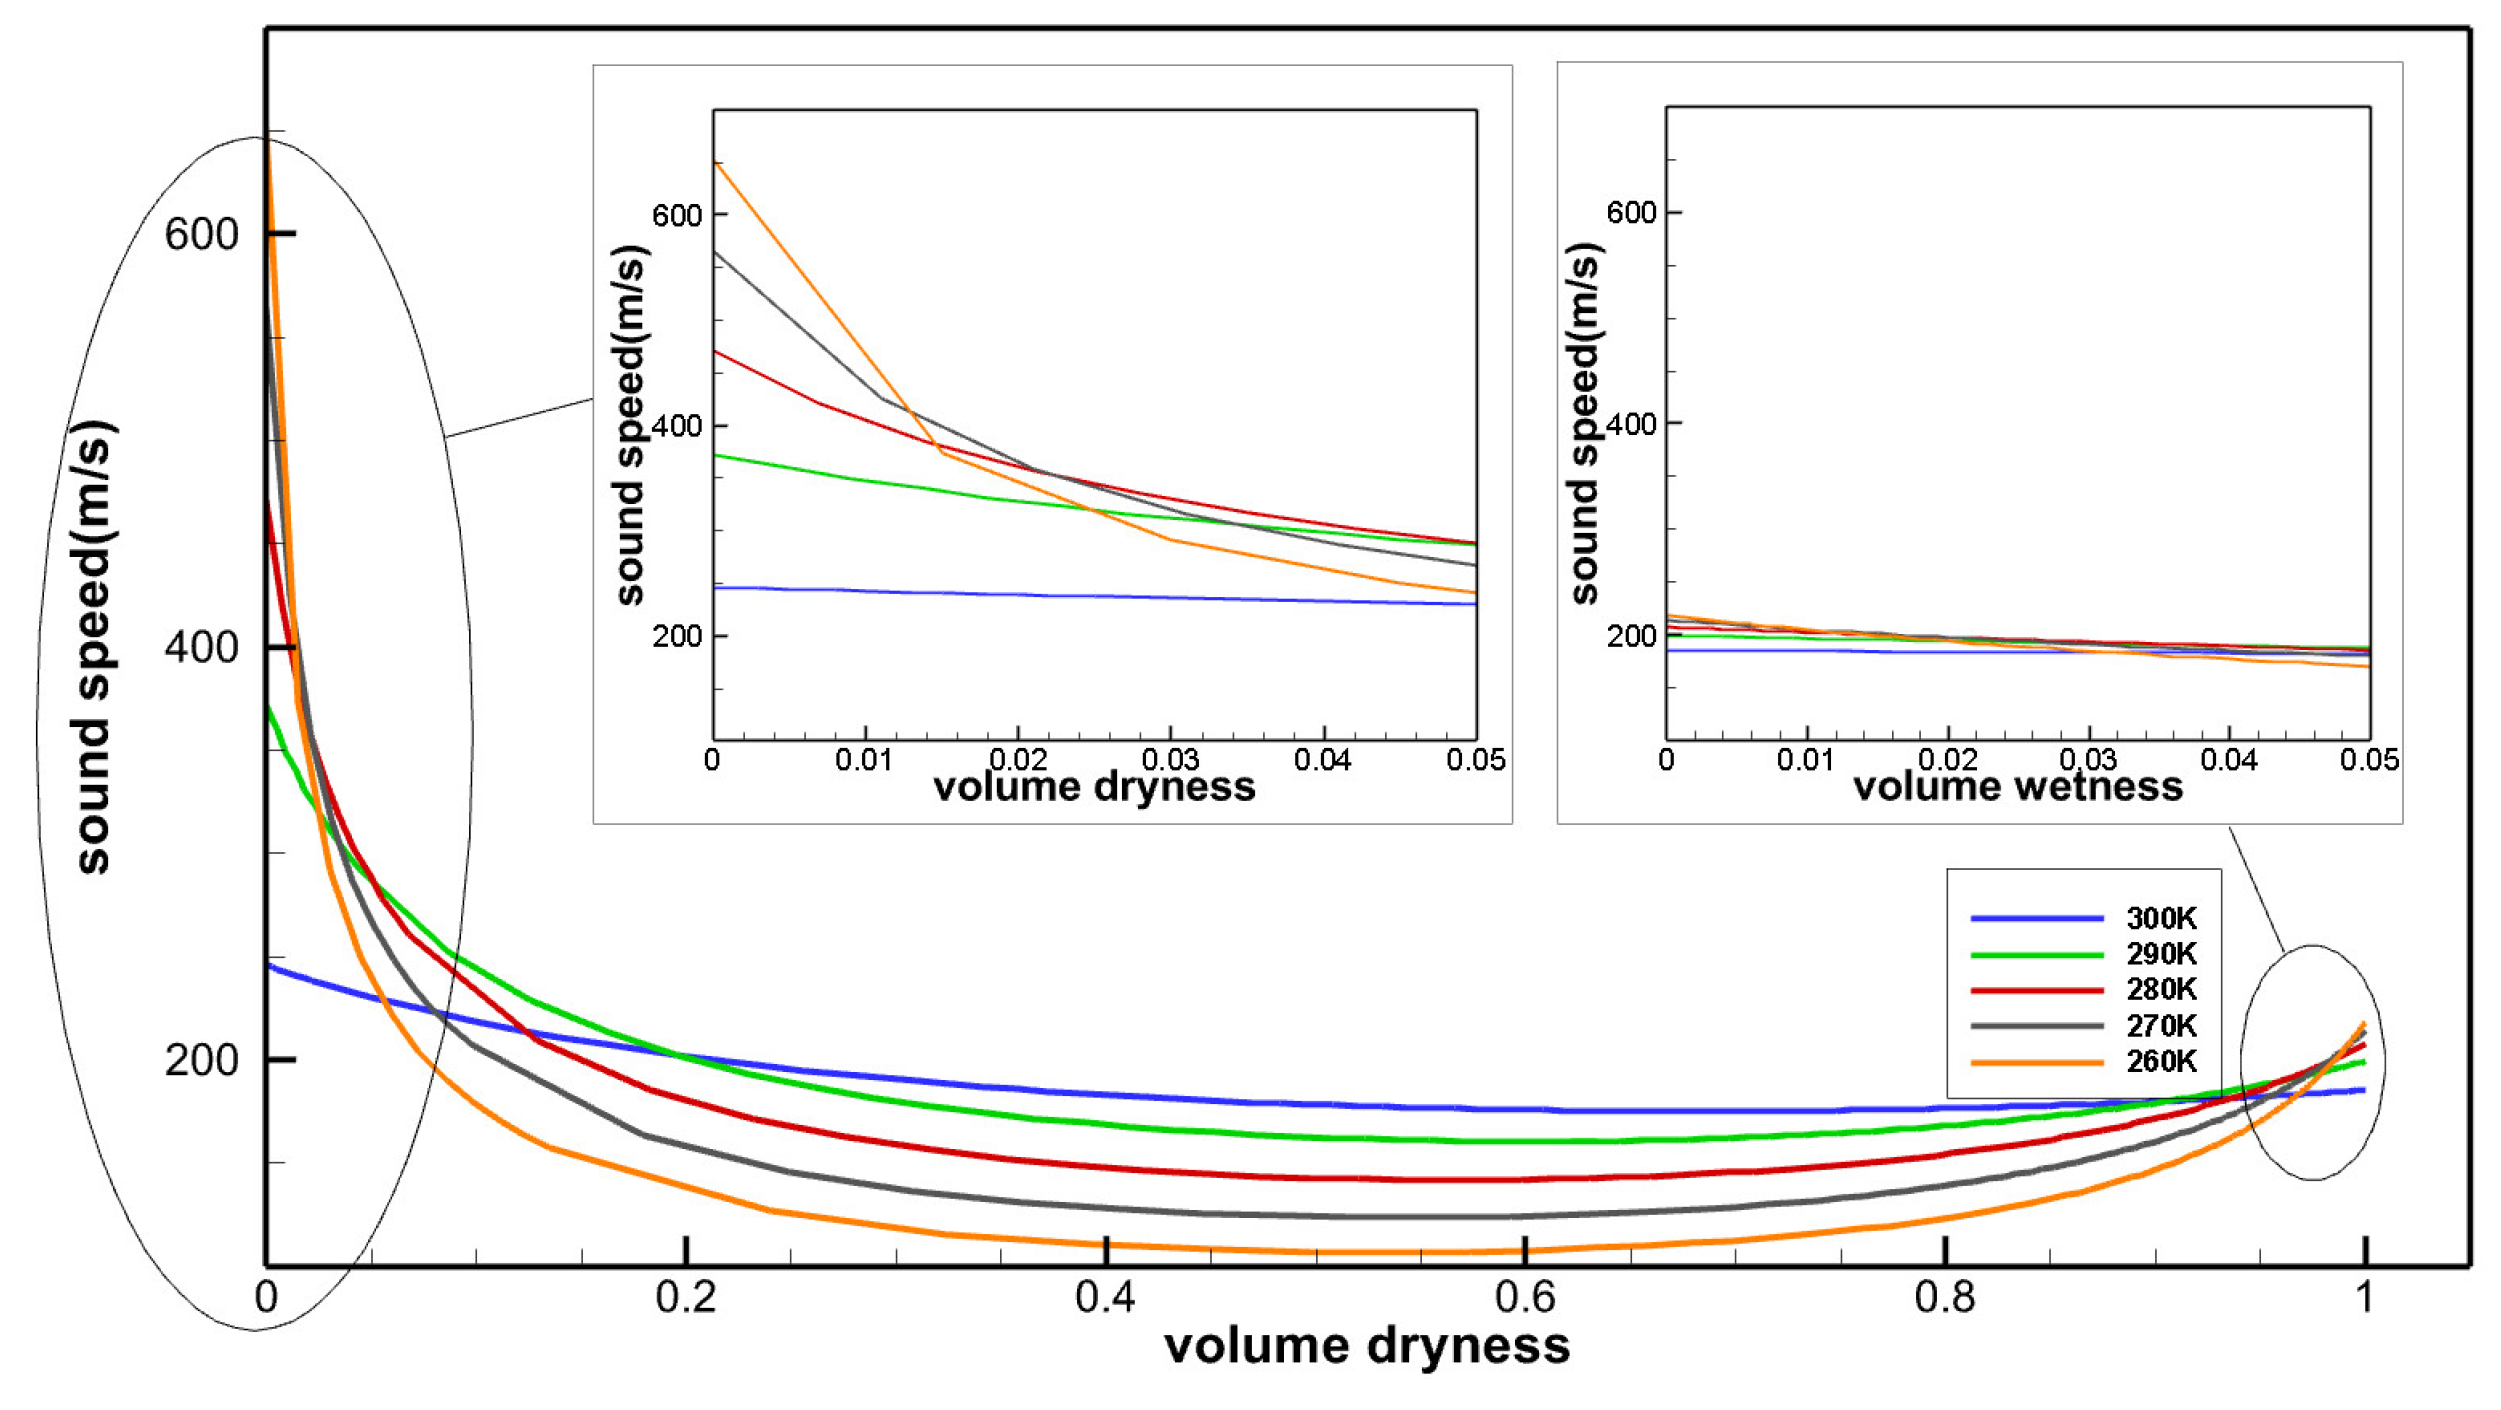
The two-phase flow will cause a decrease in the local sound speed and an increase in the Mach number, which may induce shock. The model given by Brennen [54] for the calculation of the sound speed in the two-phase flow can be transformed into the following weighted equation:
1 ρ a 2 = 1 q 1 ρ l a l 2 + q 1 ρ v a v 2
Variations in the sound speed with dryness in the two-phase flow of CO2 at various temperatures are shown in Figure 10 according to Equation (21). It was found that the sound speed of the gas–liquid mixing flow is lower than that of both the pure gas and pure liquid flows with the same temperature. Furthermore, the sound speed of the two-phase flow is close to that of the pure gas flow (volume dryness equals one in Figure 10) in most of the range of volume dryness (0.05~1). It can also be seen that a small bubble of gas in the liquid phase will dramatically affect the sound speed, while the presence of droplets in the gas phase leads to a shallow gradient of sound speed change. Generally, the further the saturation temperature is from the critical temperature, the more intense the effect of dryness is on the sound speed.

3. Numerical Simulation and Experimental Studies on sCO2 Axial-Flow Compressors

3.1. Numerical Method and Model

(1)
Physical property model
In the Computational Fluid Dynamics (CFD) simulation of sCO2 compressors, the physical property model is the first issue to be addressed.
In Lüdtke’s study [55], the three most commonly used real-gas models (BWRS model, RKS model, and LKP model) are compared. Regarding the compressibility factor, the LKP model exhibits the best agreement with experimental data for carbon dioxide in the pressure range of 5–25 MPa, with a deviation of less than 2%. In contrast, the BWRS model has a relatively poor agreement with a deviation of up to 5%. And the RKS model is not recommended by Lüdtke. These three models are all embedded in the commercial CFD software (FLUENT 2021) as available options, but they exhibit significant prediction errors for CO2 in the near-critical region.
Span and Wagner [56] developed the Span–Wagner (SW) model specifically for CO2, with an accuracy of the same order of magnitude as the uncertainty in density of 0.05%. Compared to the LK model, the greatest advantage of the SW model lies in its predictive accuracy near the critical point. At present, the widely used fluid property software, NIST REFPROP 9.1, employs the SW model for characterizing the thermophysical properties of CO2.
However, the SW equation is computationally intensive. To improve computational efficiency, a common approach is to generate property tables and incorporate them into computational programs, which necessitates the discretization of the property model. In sCO2 centrifugal compressors, extensive research has focused on the aforementioned treatment methods and impacts of near-critical sCO2 properties in CFD, including investigations of table resolution, which is another issue in CFD beyond grid resolution [57,58]. The relevant conclusions should be universally applicable to axial-flow compressors in sCO2 systems. Gou et al. [25] employed a high-resolution 301 × 301 property table generated by REFPROP for the steady-state simulation of a single-stage axial compressor, with a pressure range spanning from 1 to 20 MPa and the temperature ranging from 216.6 to 1000 K.
However, high-accuracy physical property models often introduce significant challenges in computational convergence. Takagi and Muto [20] employed FLUENT to simulate a 14-stage sCO2 axial-flow compressor. The study revealed that simulations utilizing real-gas models exhibit divergence near the critical point, whereas those adopting modified ideal gas models achieve convergence with errors below 9%.
(2)
Turbulence model
Turbulence models commonly used in CFD simulation include the k-ε model, the k-ω model, the Shear Stress Transport (SST) model, etc. Among them, the SST model [59] performs well in predicting boundary layer separation and secondary flow, so it is widely used in the simulation of sCO2 axial-flow compressors. For example, Gou et al. [25] employed the SST k-ω model to simulate the flow field of an sCO2 axial-flow compressor, obtaining relatively accurate pressure and temperature distributions. Li et al. [27] found, through using the SST k-ω model, that a 1% increase in tip clearance leads to a 1.75% reduction in efficiency, and identified condensation risks in the near-critical region. Grunloh and Calian [60] designed, implemented, and optimized an SST turbulence model based on the existing experimental data from published literature, and are currently developing an improved wall treatment scheme to incorporate buoyancy effects and to increase the sensitivity to anisotropic turbulence and streamline curvature through a nonlinear constitutive model. Incorporating these factors into the supercritical flow model will enhance the ability to handle complex fluid flows in axial-flow sCO2 compressors.
It should be noted that the SST turbulence model imposes extremely strict requirements on the height of the bottom layer of the grid (y + value). In air compressors, the near-wall grid height typically does not exceed approximately 1 μm based on their Reynolds number characteristics. However, for sCO2 flow, due to its significantly higher Reynolds number, the height of the viscous sublayer in the boundary layer will be much smaller, thereby posing far greater challenges to accurate grid generation.
(3)
Two-phase flow model
As previously mentioned, the gas–liquid two-phase flow may occur in certain regions of sCO2 axial compressors, e.g., at the leading edge of the suction side or the tip clearance zone. This type of two-phase flow represents a transcritical two-phase flow regime. Due to the high flow velocity in sCO2 compressors, the phase change process is a non-equilibrium process, requiring a non-equilibrium condensation model for accurate simulation.
Baltadjiev [37] referenced the non-equilibrium condensation phenomena in wet steam flow through turbine blade rows and employed the classical nucleation theory to model the local condensation process in sCO2 flow, using Equation (22) to calculate the droplet nucleation rate.
J = 2 σ π m 3 ρ v 2 ρ l e Δ G k T
where J represents the nucleation rate, σ is the surface tension, m is the mass of a single molecule, k is the Boltzmann constant, and Δ G * is the maximum Gibbs free energy change during the phase transition.
Baltadjiev [37] introduced a time scale ratio (tcl) between the condensation relaxation time (tr) and nucleation characteristic time (tn) to quantify the degree of deviation from equilibrium condensation, as shown in Equation (23). The non-equilibrium condensation model incorporates metastable fluid properties.
t c l = t r t n
Takashi et al. [48] also developed a non-equilibrium condensation model for sCO2 simulations based on classical nucleation theory, which adopts the ideal gas assumption and neglects real-gas effects during the condensation process. In the simulation of two-dimensional planar cascades, the non-equilibrium condensation model captures the localized condensation of CO2 in the region near the blade surface following the expansion zone at the leading edge. Subsequently, CO2 droplets grow rapidly within this localized area and flow downward along the surface.
To simultaneously investigate the phase transition behaviors of both condensation and cavitation, the authors’ previous work [40] adopted a simplified Lee model in the simulation of the sCO2 centrifugal compressor. The Lee model is a mass transfer model widely applied in phase change simulations. Based on kinetic theory, it assumes that the rate of phase change processes (such as evaporation or condensation) is proportional to the degree of deviation between the current phase state and equilibrium conditions. In the simulation, the coefficients of the Lee model, such as the relaxation time coefficients for evaporation/condensation, determining the phase change rate, were manually input. When the coefficient of the Lee model approaches infinity, the phase transition appears as equilibrium condensation, and the coefficient closest to the test data can be selected. The limitation of this method lies in its assumption that the phase transition rate depends only on temperature deviation, neglecting microscopic mechanisms such as nucleation effects.

3.2. Experimental Test

Experimental verification is an important link in the research of the sCO2 axial-flow compressor. However, current experimental studies on sCO2 compressors worldwide have mainly focused on centrifugal compressors, as shown in Table 3.
It should be noted that all data, excluding the final row in Table 3, represent centrifugal compressors, which means that the University of Notre Dame conducted the only experimental study on sCO2 axial-flow compressors. The test scope is the first stage [29] of a three-stage axial-flow compressor designed by the University of Cincinnati [30]. The test results [76] show that its efficiency (93%) is higher than the highest reported isentropic efficiency of sCO2 centrifugal compressors (84%) [71] as shown in Table 3. However, since this sCO2 axial-flow compressor is designed for a sCO2 energy storage system where the inlet state is far from the critical point, the performance of the near-critical sCO2 axial compressors still requires experimental validation.
In addition to its extensive power and pressure testing capabilities including a drive power of up to 10 MW and a maximum pressure of 30 MPa in a cycle, this compressor test facility is built to have a flow path large enough to enable detailed experimental measurements, including flow field measurements in the passage, steady-state and transient performance measurements, and aerodynamic and mechanical measurements of blades or impellers. This is highly expected, as all test data in the sCO2 compressor field mentioned earlier in this paper (whether for centrifugal or axial designs) are performance-oriented tests, while investigations of the internal flow field of compressors show a large gap.
Due to the sealing requirements imposed by the high-pressure flow inside sCO2 compressors, both flow and heat transfer measurements are constrained. Particularly, while the high density of sCO2 contributes to the compact design advantage of compressors, the consequent high pressure and extremely narrow internal spaces introduce significant challenges for the arrangement of measurement points. Therefore, non-invasive, high-spatial-resolution optic-based testing techniques are the best choice for the internal flow field measurements of sCO2 compressors. However, as the fluid approaches the critical point, the large density gradient and the resulting refractive index changes may distort the optical path of LDV (Laser Doppler Velocimetry) or entirely obscure the tracer particle images in PIV (Particle Image Velocimetry), causing significant challenges for optical-based diagnostic techniques. Therefore, special measures must be taken to minimize the optical path length and regulate density variations within the measurement zone.
Fernandez [77] pioneered PIV measurements of the inlet cascade in an sCO2 centrifugal compressor, obtaining optical velocity field data in the blade leading-edge area. For sCO2 axial-flow compressors, there is currently a notable gap in similar cascade flow test data to validate the applicability of classical air axial-flow compressor theory in sCO2 environments.

4. The Design and Optimization of sCO2 Axial-Flow Compressors

The design theory and methodology of the air axial-flow compressor have laid the foundation for research on sCO2 axial-flow compressors. The design of a conventional air axial-flow compressor is typically based on the one-dimensional mean-line method and the ideal gas law. By determining design parameters such as mass flow rates, pressure ratios, speeds, etc., and selecting key parameters such as stage numbers, flow coefficients, and reaction degrees, the velocity triangle is calculated to preliminarily define overall performance characteristics and the main dimensions of the compressor [32]. On this basis, two-dimensional or three-dimensional blade profiling techniques are further employed, combined with CFD, experimental data, and empirical formulas, to optimize blade shape, angles, airfoil geometry, and other aspects, thereby improving compressor efficiency and expanding its stable operating range. The relevant design and optimization methods have been relatively developed in the field of air axial-flow compressors. Modern industrial axial-flow compressors can comprise up to 10–20 stages, with a stage pressure ratio of 1.05–1.2 and stage efficiencies reaching 88–92% [17]. These achievements provide valuable references for the design of sCO2 axial-flow compressors.

4.1. Preliminary Design

4.1.1. Considerations for Real-Gas Physical Properties

Similar to air axial-flow compressors, the preliminary design of sCO2 axial-flow compressors typically begins with a one-dimensional mean-line design. However, this process needs to fully consider the real-gas physical properties of sCO2. Since the thermodynamic behavior of sCO2 significantly deviates from the ideal gas law near the critical point, conventional design methods based on the ideal gas law are no longer applicable. Therefore, as mentioned in Section 3.1, high-precision equations of state, such as the Span–Wagner equation, should be incorporated in the design process to accurately characterize the thermodynamic properties of sCO2.
Yong Wang et al. [22] employed the commercial software AXIALTM combined with the NIST thermophysical property database to design a 300 MW axial-flow compressor in the sCO2 Brayton cycle, fully considering the real-gas effects of CO2. Matthew Ha et al. [78] developed an open-source mean-line design tool for sCO2 axial-flow compressors named Py-C-DES. This tool integrates the REFPROP database to obtain accurate thermophysical properties of sCO2 and utilizes Python to realize convenient plotting and data analysis functions. Researchers at the Czech Technical University [28] developed TACOS, a preliminary design software for turbines and compressors using different cooling media. The software was programmed in Python and incorporated the open-source CoolProp wrap.
During the integration of a real-gas physical property database, lookup tables are generally adopted due to the high complexity of the Span–Wagner equation. The specific steps include the following:
(1)
The generation of physical property table: a CO2 physical property matrix is generated based on given pressures and temperatures at a specified resolution (e.g., 0.1 MPa/0.1 K), covering a certain range (e.g., 7–9 MPa; 300–350 K).
(2)
Physical property interpolation: interpolation methods (e.g., cubic spline) are employed to dynamically obtain parameters such as γ, μ, and Cp based on local p and T values, which are then used in the mean streamline equation calculations.
After the one-dimensional design, CFD simulations can further verify the impact of physical property discontinuities on velocity triangles, thereby refining the one-dimensional model through feedback iterations.

4.1.2. Main Design Constraints

The goal of the preliminary design is to select appropriate key parameters such as flow coefficient, load coefficient, and reaction degree under key aerodynamic and structural constraints, while providing the basis for subsequent optimal design. The key design constraints include the following:
(1)
Aerodynamic constraints
(i)
Inlet velocity limitation: In conventional air compressors, the inlet tip Mach number is typically controlled below 0.9 to prevent shock-induced separation losses. Similarly, in sCO2 compressors, the Mach number in the throat region of the first-stage rotor blade row should be maintained below 0.95 by adjusting the blade geometry [25]. However, sCO2 compressors present two special challenges:
First of all, the sound speed of CO2 near the critical point is relatively low, necessitating a significantly lower inlet axial velocity compared to axial air compressors. The tangential velocity is also limited.
Secondly, the critical point itself is the endpoint of the saturation line. Condensation may occur at the leading edge of sCO2 compressors due to local acceleration. This brings the fluid state into the two-phase region because the inlet condition is quite close to the critical point. Although some studies suggest that condensation in sCO2 compressors has a limited impact on stable operation [7,50,51,53], inlet axial velocity is still restricted in the design of sCO2 centrifugal compressors to prevent large-scale condensation [79,80].
  • (ii)
    Inlet absolute flow angle limitation: To maintain an acceptable throat area, the inlet absolute flow angle should not exceed 70°. Excessive angles can severely restrict the flow capacity of the blades due to an overly small throat area. A similar constraint is applied at the outlet of centrifugal compressor impellers [81]. Conventional designs require the absolute flow angle at the impeller outlet (relative to the meridional plane) to remain below 70°; otherwise, the excessively long flow path in the vaneless diffuser could lead to significant frictional losses.
    (iii)
    Diffusion limitation: The most commonly used index for evaluating the degree of diffusion in axial-flow compressors is the diffusion factor (DF) proposed by Lieblein et al. [82], which is expressed as
D F = 1 - w 2 w 1 + w 1 u w 2 u 2 w 1 s l
The first and second terms on the right side of the equation represent the deceleration degree of and flow turning condition within the blade passage, respectively. When the diffusion factor exceeds 0.6, flow separation begins to occur, leading to a sharp increase in cascade passage losses. Conventional blade designs typically maintain the diffusion factor below 0.5. In the study of Wang et al. [22], the designed sCO2 axial-flow main compressor and recompressor are verified to have diffusion factors below 0.5 for all blade rows (including both rotors and stators).
In addition, there exists a simpler index for evaluating the degree of diffusion called the De Haller number. The De Haller stall criterion [83] recommends that, for axial-flow compressors, preliminary blade designs should maintain a De Haller number no less than 0.72, as shown in Equation (25). Wang et al. [22] utilized a de Haller number of 0.72 in their design.
w 2 w 1 0.72
In contrast, the design of centrifugal compressors allows for a wider range of the De Haller number. For general stationary gas centrifugal compressors, a De Haller number no less than 0.5 is acceptable [81].
It should be noted that the currently recommended values of the DF or De Haller number are based on the empirical data from air compressors. The diffusion limit for sCO2 compressors still requires experimental validation through sCO2 cascade tests.
  • (iv)
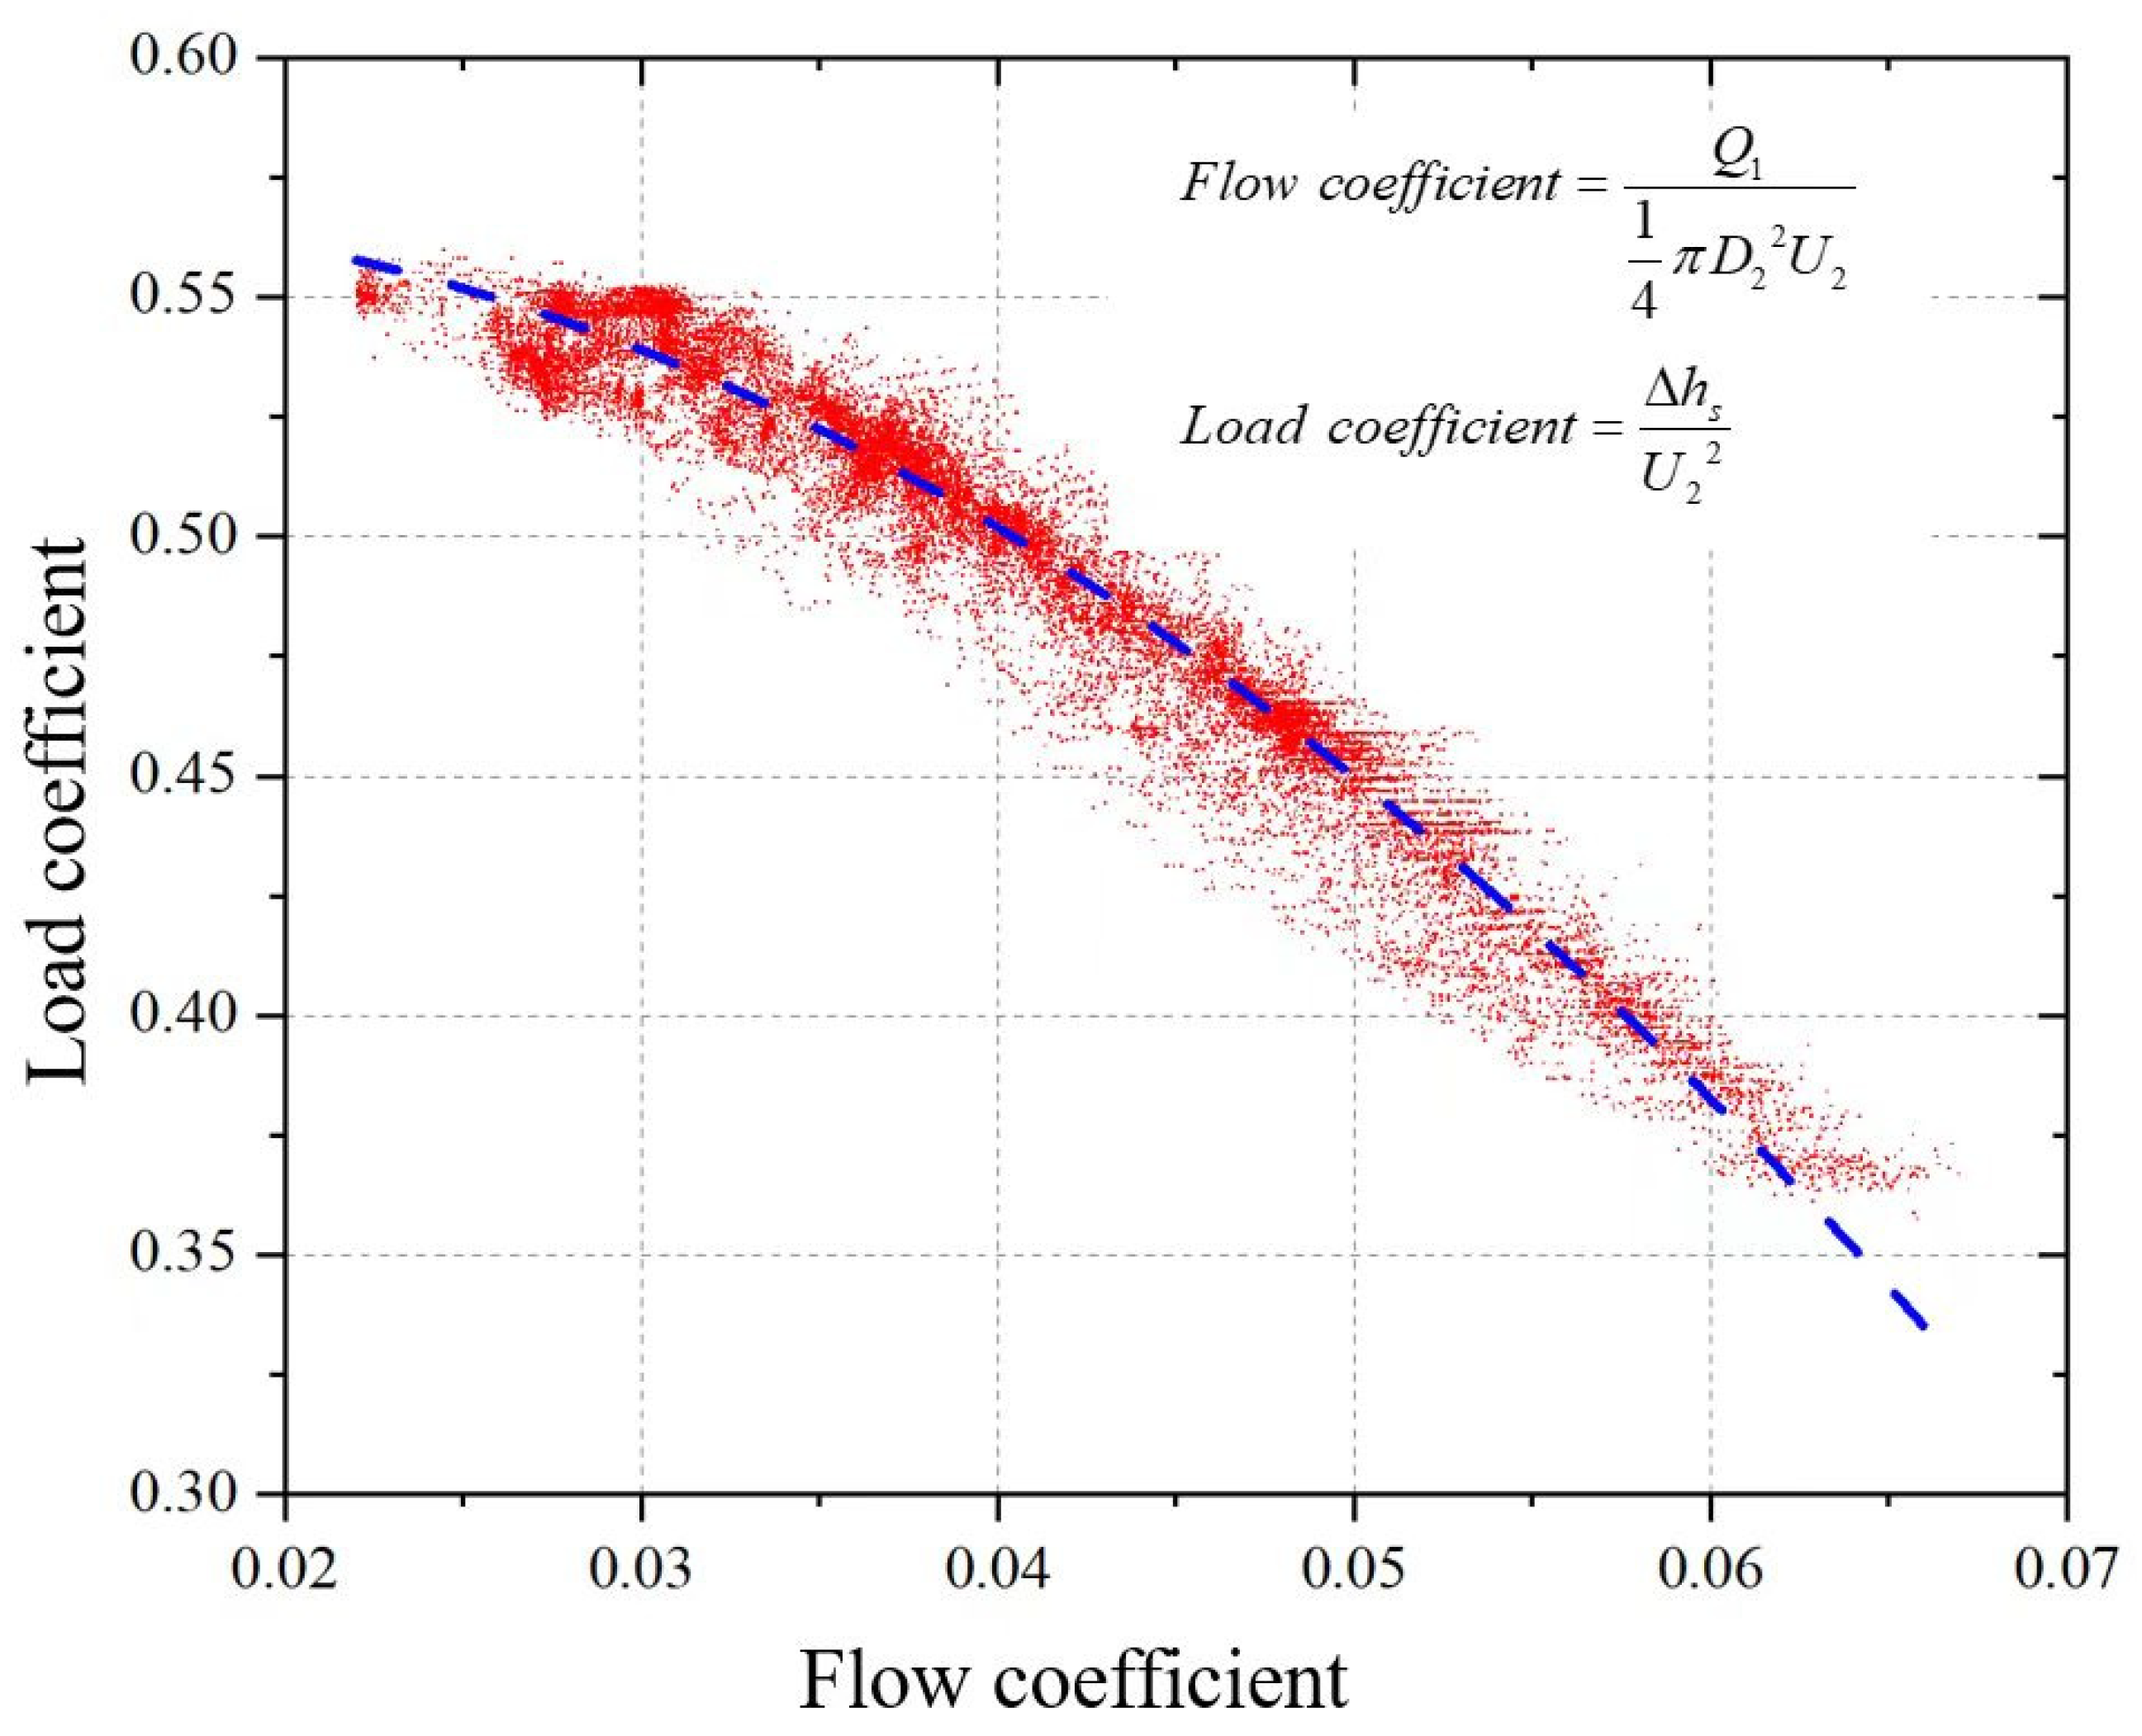
    Other constraints: In addition to the aforementioned inlet velocity limit, which indirectly restricts the flow coefficient, Smith [84] suggested limiting the flow coefficient to below 0.5 to enhance the axial-flow compressor’s resistance to inlet flow distortion. Wang et al. [22] adopted this recommendation in their design of an sCO2 axial-flow compressor and converted the above constraints in (ii)~(iv) into limitations of the flow coefficient, loading coefficient, and reaction degree, obtaining the design space based on these three basic dimensionless parameters.
(2)
Structural constraints
Due to the high-pressure operating conditions of the sCO2 cycle, compressor blades bear significant centrifugal force and aerodynamic load, particularly with aerodynamic bending loads being substantially higher than those in air axial-flow compressors. Therefore, a detailed stress analysis is essential during the design process to ensure that the strength of the blade material (such as 17-4PH stainless steel) meets the requirements. For example, Wang et al. [22] considered the magnitude of centrifugal stress, gas bending stress, and trailing-edge vibration stress in his design and reduced stress levels by increasing blade thickness and quantity. Munoz et al. [33] found that similarity criteria based on conventional turbomachines are still valid for sCO2 compressors. However, in practical cases, full similarity could not be achieved, as it would result in impractically small design dimensions. And their simulations showed that the high density of sCO2 increases the aerodynamic bending load by two orders of magnitude compared to air, suggesting increasing solidity or decreasing aspect ratios.
Compared to normal air conditions, the natural frequency of impellers decreases in high-density working fluids, potentially leading to impeller resonance. Sato et al. [61] found that the natural frequency of impellers drops to about 60% of that in normal air, necessitating the development of designs to prevent impeller resonance.

4.1.3. Loss Model

An accurate prediction of the flow losses in a compressor is crucial for designing an efficient sCO2 axial-flow compressor. Currently, commonly used loss models include the Koch and Smith model [85] and the Lieblein model [86], among others. These models mainly consider the following types of losses:
Profile loss: Profile loss is caused by friction on the blade’s surface and the momentum thickness of the trailing edge, usually related to blade geometry, surface roughness, and the Reynolds number.
End-wall loss and secondary flow loss: These losses are caused by boundary layer separation and secondary flows between the blades and the hub or casing and are influenced by factors such as hub-to-tip ratio and clearance size. The displacement thickness and tangential force thickness of the end-wall boundary layer significantly impact efficiency [22]. In particular, due to the relatively small aspect ratio of sCO2 compressors, end-wall losses require special emphasis.
Shock loss: When the Mach number is high, the generation of shock waves will lead to large flow loss, which is particularly significant in transonic or supersonic compressors. As previously mentioned in Section 2.2.4 and Section 2.3, the sound speed of CO2 is relatively low near the critical point and will be further reduced if two-phase flow occurs. Therefore, in the design of sCO2 compressors, it is particularly necessary to be concerned about the shock wave loss that may be caused by this local supersonic speed.
Gap leakage loss: The existence of tip clearance will lead to leakage, forming a vortex, causing loss, and affecting the stability of the compressor.
In the design of the sCO2 axial-flow compressors, the end-wall loss and clearance leakage loss may be more prominent due to the high-density and low-viscosity characteristics of sCO2. For example, studies [27] have shown that the increase in tip clearance will reduce the stage efficiency and pressure ratios. In addition, it may lead to local acceleration on the suction side of the tip, causing condensation. However, this study aimed to analyze the influence of condensation and incorporate this mechanism into the loss model if necessary.
At present, most studies believe that the above loss model in air axial-flow compressors can reasonably predict the performance of sCO2 compressors under design conditions [26,31,47], but the accuracy is insufficient under off-design conditions, especially under near-stall conditions. Therefore, it is still necessary to further develop the loss models for sCO2 axial-flow compressors.

4.2. Design Optimization

Optimization is a crucial part of the design process of sCO2 axial-flow compressors. The main steps are as follows:
(1)
Parametrically model the profile
An example of parametric modeling of a blade profile is when controlling the leading-edge/trailing-edge angle, the chord length and the distribution of thickness by defining the skeleton line through the B-spline curve whose control points are located at the leading edge (LE), trailing edge (TE), and 25%, 50%, and 75% of the chord length. The position of the maximum thickness is generally determined by the selected blade profile. Modern compressor design methods have begun to use the so-called prescribed velocity distribution method (PVD) to design the blade profile, by which a designer needs to select a blade surface velocity distribution and a calculation method to determine the thickness and curvature distribution to obtain the expected aerodynamic performance. Existing profiles can also be selected, such as the most common NACA65 series profiles, C-series profiles, and double-circular-arc (DCA) series profiles. One of the main differences between various profiles is the location of maximum thickness. For example, the C-series profile has its maximum thickness located very forward, at 30% of the chord from the leading edge, resulting in a rounder leading edge and a wider operating range. For sCO2 axial-flow compressors, it may be necessary to specially design the blade-loading position, which is affected by the maximum thickness position, in order to control inlet condensation.
(2)
Set the objective function
When using a computer optimization algorithm to carry out optimal designs, it is usually possible to set up multi-objective optimization. The most common multi-objective optimization is to optimize not only the performance of the design point, but also the performance of the off-design conditions, so the method of the weighted calculation of different conditions is used to set the objective function.
Ha et al. [29] considered a weight of 40% for the design points and 60% for the off-design points to obtain the weighted optimization loss coefficient (ω). This method can improve performance under all operational conditions.
(3)
Set constraints
The constraints in the preliminary design mentioned above hold for the optimization process.
(4)
Carry out the optimization
  • The optimization algorithm includes the following:
    • Global optimization: Genetic algorithms are often used to explore the design space, with population sizes and iterations for a certain number of generations.
    • The shape of the leading edge can be refined by the gradient method.
(5)
Verify the structure
Stress analysis should be carried out to ensure that the blade safety factor is >1.5.
Wang [22] optimized parameters such as the tip clearance, solidity, blade chord length, and blade thickness of sCO2 axial-flow compressors, increasing the efficiency of the main compressor from 89.5% to 93% and the efficiency of the recompressor from 88% to 93.2%. Hu [31] carried out one-dimensional optimization on an sCO2 multistage axial-flow compressor, selecting the relative flow angle at the rotor inlet, the absolute flow angle at the rotor outlet, and the cascade solidity of the rotor and stator as optimization parameters, improving the isentropic efficiency from 85.61% to 87.25%. The method by Ha [29,30] combined quasi-3D and fully 3D CFD optimization techniques. The quasi-3D technique applies the MISES solver for the partial optimization of blades, while FINE/Turbo was used in the full-3D optimization to implement multi-objective genetic algorithms. In the optimization process, parameters such as efficiency, pressure ratios, and stall margins at design and off-design points are comprehensively considered to improve the compressor’s performance and operating range.
It is worth mentioning that Dickens et al. [87] believed that a high reaction degree should be applied in the design of air axial-flow compressors with high stage loads to achieve high efficiencies. Wang et al. [22] used a high reaction rate of 0.85 in his design. Furthermore, for the sCO2 axial-flow compressors, high reaction rates can reduce load and pressure increases in the stator cascade, thus simplifying the solution for issues caused by high-pressure sealings.

5. Conclusions and Prospects

Since the 21st century, sCO2 Brayton cycle technology has been rapidly developing. The United States, Japan, South Korea, China, and other countries have successfully carried out sCO2 power cycle tests, demonstrating power scales from 10 kW to 10 MW, exhibiting a trend toward large power scales. Similar to gas turbine power cycles, sCO2 compressors, as the key component in sCO2 power cycles, are preferred as axial-flow-type designs due to their potentially higher efficiency compared to centrifugal compressors. Therefore, sCO2 axial compressors have been gaining more and more attention in recent years, although there are obviously more challenges to overcome in contrast to sCO2 centrifugal compressors. This paper comprehensively reviews the state of the art around the world, reaching the following conclusions:
  • In the past two decades, only several designs of sCO2 axial-flow compressors have been investigated. The designed sCO2 axial-flow compressors exhibit (a) large mass flow rates mainly above 100 kg/s, (b) inlet conditions close to the critical point, i.e., 32~42 °C and 7.8~9.0 MPa, and (c) low stage loads with pressure ratios below 1.2. These configurations result in multistage designs with relatively high efficiencies (87%~93%) compared with common centrifugal compressors.
  • Many studies have shown that the similarity law is still applicable to sCO2 turbomachines. However, due to significant changes in key physical parameters such as viscosities, sound speeds, isentropic exponents, compressibility factors, etc., the influence of the similarity parameters on the internal flow of sCO2 axial-flow compressors is significantly different from that of air compressors. A higher Reynolds number in sCO2 cascades leads to lower friction coefficients, stronger anti-separation abilities, and lower blockage coefficients. In addition, sCO2 cascades may exhibit a higher critical Reynolds number than air cascades. However, this simultaneously causes a thinner boundary layer, making the flow more sensitive to wall roughness. Low sound speeds at, for example, the leading edge of the sCO2 cascade, can lead to shock loss due to high Mach numbers. Moreover, the drastic changes in sound speeds may even lead to unusual phenomena such as chokes and shock waves at subsonic speeds.
Despite higher pressure increases in the sCO2 compressor cascades benefiting from high isentropic exponents near the critical point, the drastic variation in the isentropic exponent might affect the flow matching between compressor stages. Significant changes in the isentropic exponent and compressibility factor also make normalized performance curves invalid.
Furthermore, the potential phase change due to fluid states close to the critical point is also one of the main differences of sCO2 compressors compared to air compressors. Although many studies have found that such local phase change does not have a significant impact on the performance of sCO2 compressors, the engineering experience gained from steam turbines and water pumps still causes people to be highly concerned about the risks of large-scale phase changes to the aerodynamic performance and the safety of the blades. Quantitative impacts need to be investigated in conjunction with experiments.
3.
Compared with centrifugal compressors, there are few experimental studies on sCO2 axial-flow compressors at present. According to the public literature, only the University of Notre Dame in the United States has carried out an axial-flow test for the first stage of a 10 MW sCO2 axial-flow compressor used in an energy storage system. Although the test results show a much higher efficiency in contrast to a typical centrifugal compressor stage, the inlet condition (98 °C, 2.77 MPa) of the tested compressor is far from the critical point (31.1 °C, 7.38 MPa), failing to reflect the real operation conditions and performance characteristics of large-scale sCO2 power generation systems, of which the compressors generally operate at inlet conditions of 32–42 °C and 7.8–9.0 MPa.
4.
Currently, the design method of air compressors is widely used in sCO2 machines. However, the so-called real-gas properties need to be incorporated into calculations for both one- and three-dimensional designs. Furthermore, existing loss models should be improved by correcting empirical coefficients based on further tests. Furthermore, the influence of low sound speeds and phase changes on design constraints during optimization should be considered. More tests for sCO2 axial-flow cascades are needed to investigate whether empirical values based on air compressor tests, such as the diffusion factor (DF), are applicable to sCO2 axial-flow compressors. In addition, due to the high pressure and high density of sCO2, the structural strength constraints in sCO2 compressors are much more intensified than those of air compressors.
In order to advance the development and application of sCO2 axial-flow compressor technologies, future research should address the following two aspects:
Firstly, research on the internal flow of sCO2 axial-flow cascades should be carried out. In conjunction with advanced experimental and numerical methods, numerous tests can be conducted to figure out key characteristics and mechanisms in sCO2 compressors, such as high Reynolds numbers, diffusion factors, low sound speeds, local phase changes (condensation or cavitation), etc.
Secondly, the design theory and method of sCO2 axial-flow compressors need to be further developed to obtain more efficient optimization algorithms and design tools, where the key points are loss models and design spaces suitable for sCO2 multistage axial-flow compressors.
With the accelerating global energy transformation, the sCO2 axial-flow compressor is anticipated to experience rapid development and become a key technology in advanced clean energy innovation under carbon neutrality.

Funding

This research was funded by Chinese Academy of Sciences Stable Support Basic Research Youth Team Project (project no. YSBR-043) and the National Major Science and Technology Infrastructure Project “High Efficiency and Low Carbon Gas Turbine Research Facilities” (HiGT, project no. 2017-000052-73-01-001569).

Data Availability Statement

Data sharing is not applicable, no new data were created or analyzed in this study.

Conflicts of Interest

The authors declare no conflict of interest.

Nomenclature

AFlow area/m2
aSound speed/m∙s−1
cAbsolute velocity/m∙s−1
c p Specific heat capacity at constant pressure/kJ∙(kg∙K)−1
c v Specific heat capacity at constant volume/kJ∙(kg∙K)−1
DImpeller diameter/m
DFDiffusion factor
∆hsIsentropic enthalpy increment/J∙kg−1
LCharacteristic length/m
lChord length/m
MMach number
MgMolecular weight/g·mol−1
m s Temperature adiabatic exponent
m ˙ Mass flow rate/kg∙s−1
n s Isentropic exponent (pressure adiabatic exponent)
P ^ Power coefficient
pStatic pressure/Pa
p 01 Inlet total pressure/Pa
p 02 Outlet total pressure/Pa
QVolumetric flow rate/m3∙s−1
qDryness
RUniversal gas constant, 8.314 J/(mol·K)
RgMass-specific gas constant /J (kg∙K)−1
ReReynolds number
sPitch/m
TStatic temperature/K
T 01 Inlet total temperature/K
T 02 Outlet total temperature/K
tTime/s
UCharacteristic flow velocity of fluid/m∙s−1
v Specific volume/m3∙kg−1
wRelative velocity/m∙s−1
ZCompressibility factor
Z 0 Stagnation compressibility factor
γ Specific heat capacity ratio
εRelative roughness
ηEfficiency
μ Dynamic viscosity/Pa∙s
νKinematic viscosity/m2∙s−1
ρDensity/kg·m−3
φFlow coefficient
ψLoad coefficient
ΩRotation speed/rad∙s−1
Abbreviations
Baker HughesBaker Hughes, Nuovo Pignone
BMPCBechtel Marine Propulsion Corporation
BNIBarber Nichols Inc.
Dresser-RandDresser-Rand Company
HPS Hanwha Power Systems Americas, Houston
IET, CASInstitute of Engineering Thermophysics, Chinese Academy of Sciences
KAERIKorea Atomic Energy Research Institute
KAISTKorea Advanced Institute of Science and Technology
KAPLKnolls Atomic Power Laboratory
NNLNaval Nuclear Laboratory
Notre DameUniversity of Notre Dame
SNLSandia National Laboratories
SwRISouthwest Research Institute
TITTokyo Institute of Technology
TPRIXi’an Thermal Power Research Institute, China
UDEUniversity of Duisburg-Essen
Subscript
0Stagnation parameters
1Inlet of turbomachinery
2Exit of turbomachinery
aAxial
lLiquid phase
pIsobaric process
sIsentropic process
TIsothermal process
uTangential
vGas phase

References

  1. Feher, E.G. The Supercritical Thermodynamic Power Cycle. Energy Convers. 1968, 8, 85–90. [Google Scholar] [CrossRef]
  2. Angelino, G. Carbon Dioxide Condensation Cycles for Power Production. J. Eng. Power 1968, 90, 287–295. [Google Scholar] [CrossRef]
  3. Dostal, V. A Supercritical Carbon Dioxide Cycle for Next Generation Nuclear Reactors; Massachusetts Institute of Technology: Cambridge, MA, USA, 2004. [Google Scholar]
  4. Wright, S.A.; Pickard, P.S.; Fuller, R. Supercritical CO2 Heated but Unrecuperated Brayton Loop Operation and Test Results. In Proceedings of the Supercritical CO2 Power Cycle Symposium, Troy, NY, USA, 29–30 April 2009. [Google Scholar]
  5. Utamura, M.; Hasuike, H.; Ogawa, K.; Yamamoto, T.; Fukushima, T.; Watanabe, T.; Himeno, T. Demonstration of Supercritical CO2 Closed Regenerative Brayton Cycle in a Bench Scale Experiment. In Proceedings of the ASME Turbo Expo 2012, Copenhagen, Denmark, 11–15 June 2012. [Google Scholar]
  6. Kimball, K.J.; Clementoni, E.M. Supercritical Carbon Dioxide Brayton Power Cycle Development Overview. In Proceedings of the ASME Turbo Expo 2012, Copenhagen, Denmark, 11–15 June 2012. [Google Scholar]
  7. Ahn, Y.; Lee, J.; Kim, S.G.; Lee, J.I.; Cha, J.E.; Lee, S.-W. Design consideration of supercritical CO2 power cycle integral experiment loop. Energy 2015, 86, 115–127. [Google Scholar] [CrossRef]
  8. Li, H.; Zhang, Y.; Gao, W.; Yao, M. Preliminary design study on a Multi-Megawatts Fossil-based Supercritical CO2 Recompression and Reheat Integral Test Facility. In Proceedings of the 5th International Symposium—Supercritical CO2 Power Cycles, San Antonio, TX, USA, 28–31 March 2016. [Google Scholar]
  9. CSTA. China’s First 5MW Carbon Dioxide Cycle Generator Puts into Operation. Available online: http://en.cnste.org/html/csp/2021/1210/1139.html (accessed on 10 December 2021).
  10. Li, H.; Zhang, Y.; Bai, W.; Yang, Y.; Li, K.; Gao, W.; Zhang, L.; Zhang, C.; Wu, S.; Zhang, X.; et al. Control strategies and dynamic experimental tests on the wide-range and rapid load regulation of a first pilot multi-megawatts fossil-fired supercritical CO2 power system. Energy Convers. Manag. 2023, 279, 116748. [Google Scholar] [CrossRef]
  11. Wang, B.; Tian, Y.; Zhao, L.; Zhang, Z.; Xiao, Y. Progress in the construction of supercritical carbon dioxide cycle test Platform for the High-Efficiency and Low-carbon Gas Turbine Research Facility. In Proceedings of the Supercritical CO2 Power Cycle Symposium (China) 2019, Xi’an, China, 27–29 December 2019. [Google Scholar]
  12. Wang, B.; Xu, X.; Tian, Y.; Zhao, L.; Zhang, Z. Introduction to the Low Carbon Supercritical CO2 Brayton Cycle Test Platform. In Proceedings of the 2024 International Conference on Supercritical CO2 Power Cycle and Comprehensive Energy System, Shanghai, China, 20–24 September 2024. [Google Scholar]
  13. Zhu, Y.; Jiang, Y.; Liang, S.; Guo, C.; Guo, Y.; Gao, F.; Cai, H. Experimental research progress of supercritical carbon dioxide Brayton cycle compressor. Therm. Power Gener. 2020, 49, 11–20. [Google Scholar]
  14. Zhu, Y.; Liang, S.; Guo, Y.; Guo, C.; Guo, X.; Jiang, Y. Experimental Study on Supercritical CO2 Two-stage Centrifugal Compressor. Proc. CSEE 2022, 42, 8933–8942. [Google Scholar]
  15. Marionk, J.; Kutin, M.; McClung, A.; Mortzheim, J.; Ames, R. The STEP 10 MWe sCO2 Pilot Plant Demonstration. In Proceedings of the ASME Turbo Expo 2019, Phoenix, AZ, USA, 17–21 June 2019. [Google Scholar]
  16. Follett IV, W.W.; Moore, J.; Wade, J.; Pierre, S. The STEP 10 MWe sCO2 Pilot Installation and Commissioning Status Update. In Proceedings of the 8th International Supercritical CO2 Power Cycles Symposium, San Antonio, TX, USA, 26–29 February 2024. [Google Scholar]
  17. Boyce, M.P. Gas Turbine Engineering Handbook, 3rd ed.; Gulf Professional Publishing: Houston, TX, USA, 2006. [Google Scholar]
  18. Brun, K.; Friedman, P.; Dennis, R. Fundamentals and Applications of Supercritical Carbon Dioxide (sCO2) Based Power Cycles; Series in Energy; Woodhead Publishing: Cambridge, UK, 2017. [Google Scholar]
  19. Khan, A.; Bradshaw, C.R. Quantitative comparison of the performance of vapor compression cycles with compressor vapor or liquid injection. Int. J. Refrig. 2023, 154, 386–394. [Google Scholar] [CrossRef]
  20. Takagi, K.; Muto, Y. Research on Flow Characteristics of Supercritical CO2 Axial Compressor Blades by CFD Analysis. In Proceedings of the 17th International Conference on Nuclear Engineering, Brussels, Belgium, 12–16 July 2009. [Google Scholar]
  21. Sienicki, J.; Moisseytsev, A.; Fuller, B.; Wright, S.; Pickard, P. Scale dependencies of supercritical carbon dioxide Brayton cycle technologies and the optimal size for a next-step supercritical CO2 cycle demonstration. In Proceedings of the Supercritical CO2 Power Cycle Symposium, Boulder, CO, USA, 24–25 May 2011. [Google Scholar]
  22. Wang, Y.; Guenette, G.; Hejzlar, P.; Driscoll, M. Compressor Design for the Supercritical CO2 Brayton Cycle. In Proceedings of the 2nd International Energy Conversion Engineering Conference, Providence, RI, USA, 16–19 August 2004. [Google Scholar]
  23. Takagi, K.; Muto, Y.; Ishizuka, T.; Kikura, H.; Aritomi, M. Research on Flow Characteristics of Supercritical CO2 Axial Compressor Blades by CFD Analysis. J. Power Energy Syst. 2010, 4, 138–149. [Google Scholar] [CrossRef]
  24. Nassar, A.; Moroz, L.; Burlaka, M.; Pagur, P.; Govoruschenko, Y. Designing Supercritical CO2 Power Plants Using an Integrated Design System. In Proceedings of the ASME 2014 Gas Turbine India Conference, New Delhi, India, 15–17 December 2014. [Google Scholar]
  25. Gou, J.; Wang, W.; Ma, C.; Li, Y.; Lin, Y.; Li, H. Numerical Simulation of The Performance of an Axial Compressor Operating With Supercritical Carbon Dioxide. In Proceedings of the 26th International Conference on Nuclear Engineering, London, UK, 22–26 July 2018. [Google Scholar]
  26. Liu, Z.; Luo, W.; Zhao, Q.; Zhao, W.; Xu, J. Preliminary Design and Model Assessment of a Supercritical CO2 Compressor. Appl. Sci. 2018, 8, 595. [Google Scholar] [CrossRef]
  27. Li, J.; Wang, Y.; Jing, Q.; Xie, Y. Investigation on Aerodynamic Performance of a Multistage Axial Compressor for Supereritical Carbon Dioxide Power Cyele. Therm. Turbine 2019, 48, 83–89. [Google Scholar]
  28. Syblík, J.; Štěpánek, J.; Veselý, L.; Entler, S.; Dostál, V. Preliminary design of supercritical CO2 axial compressor for fusion and nuclear power plants. Fusion Eng. Des. 2023, 192, 113770. [Google Scholar] [CrossRef]
  29. Ha, M.; Holder, J.; Ghimire, S.; Ringheisen, A.; Turner, M.G. Detailed Design and Optimization of the First Stage of an Axial Supercritical CO2 Compressor. In Proceedings of the ASME Turbo Expo 2022, Rotterdam, The Netherlands, 13–17 June 2022. [Google Scholar]
  30. Ghimire, S.; Ha, M.; Holder, J.; Turner, M. Design and Optimization of a 3-Stage Axial Supercritical CO2 Compressor. In Proceedings of the 8th International Supercritical CO2 Power Cycles Symposium, San Antonio, TX, USA, 27–29 February 2024. [Google Scholar]
  31. Hu, Z. Parametric Design Optimization and Performance Analysis of Supercritical Carbon Dioxide Multi-stage Axial Flow Compressor; Tianjin University of Technology: Tianjin, China, 2024. [Google Scholar]
  32. Dixon, S.L.; Hall, C.A. Fluid Mechanics and Thermodynamics of Turbomachinery, 7th ed.; Butterworth-Heinemann, Elsevier: Amsterdam, The Netherlands, 2010. [Google Scholar]
  33. Tello, C.; Munoz, A.; Sanchez, D.; Kipouros, T.; Savill, M. Impact of Fluid Substitution on the Performance of an Axial Compressor Blade Cascade Working with Supercritical Carbon Dioxide. J. Eng. Gas Turbines Power 2020, 142, 011019. [Google Scholar] [CrossRef]
  34. Gou, J.; Zhang, K.; Lin, Y.; Li, Y.; Ma, C.; Ke, H. Physical property effects of the compression process with supercritical carbon dioxide as working fluid. J. Mech. Sci. Technol. 2020, 34, 3379–3393. [Google Scholar] [CrossRef]
  35. Gong, Y.; Carstens, N.A.; Driscoll, M.J.; Matthews, I.A. Analysis of Radial Compressor Options for Supercritical CO2 Power Conversion Cycles; Massachusetts Institute of Technology: Cambridge, MA, USA, 2006; MIT-GFR-034. [Google Scholar]
  36. Baltadjiev, N.D.; Lettieri, C.; Spakovszky, Z.S. An Investigation of Real Gas Effects in Supercritical CO2 Centrifugal Compressors. J. Turbomach. 2015, 137, 091003. [Google Scholar] [CrossRef]
  37. Baltadjiev, N.D. An Investigation of Real Gas Effects in Supercritical CO2 Compressors. Master’s Thesis, Massachusetts Institute of Technology, Cambridge, MA, USA, 2012. [Google Scholar]
  38. Zou, Z.; Ding, C. A new similarity method for turbomachinery with different working media. Appl. Therm. Eng. 2018, 133, 170–178. [Google Scholar] [CrossRef]
  39. Roberts, S.K.; Sjolander, S.A. Effect of the specific heat ratio on the aerodynamic performance of turbomachinery. J. Eng. Gas Turbines Power 2005, 127, 773–780. [Google Scholar] [CrossRef]
  40. Xie, W.; Tian, Y.; Jiang, P.; Wang, B.; Xu, X. Effects of Near-Critical Condensation and Cavitation on the Performance of S-CO2 Compressor. Energies 2024, 17, 854. [Google Scholar] [CrossRef]
  41. Monjea, B.; Sánchez, D.; Chacartegui, R.; Sánchez, T.; Savill, M.; Pilidis, P. Comparing the Pressure Rise of Air and Supercritical Carbon Dioxide in Conical Diffusers. In Proceedings of the ASME Turbo Expo 2012, Copenhagen, Denmark, 11–15 June 2012. [Google Scholar]
  42. Monje, B.; Sánchez, D.; Chacartegui, R.; Sánchez, T.; Savill, M.; Pilidis, P. Aerodynamic analysis of conical diffusers operating with air and supercritical carbon dioxide. Int. J. Heat Fluid Flow 2013, 44, 542–553. [Google Scholar] [CrossRef]
  43. López, A.; Monje, B.; Sánchez, D.; Chacartegui, R.; Sánchez, T. Effect of Turbulence and Flow Distortion on The Performance of Conical Diffusers Operating on Supercritical Carbon Dioxide. In Proceedings of the ASME Turbo Expo 2013, San Antonio, TX, USA, 3–7 June 2013. [Google Scholar]
  44. Dolan, F.X.; Runstadler, P.W. Pressure Recovery Performance of Conical Diffusers at High Subsonic Mach Numbers; National Aeronautics and Space Administration: Washington, DC, USA, 1973; NASA CR-2299. [Google Scholar]
  45. Khan, A.; Irfan, M.; Niazi, U.M.; Shah, I.M.; Legutko, S.; Rahman, S.; Alwadie, A.S.; Jalalah, M.; Glowacz, A.; Khan, M.K.A. Centrifugal Compressor Stall Control by the Application of Engineered Surface Roughness on Diffuser Shroud Using Numerical Simulations. Materials 2021, 14, 2033. [Google Scholar] [CrossRef]
  46. Wisler, D.C. Loss Reduction in Axial-Flow Compressors Through Low-Speed Model Testing. J. Eng. Gas Turbines Power 1985, 107, 354–363. [Google Scholar] [CrossRef]
  47. Zhu, Y. Study on Supercritical Carbon Dioxide Centrifugal Compressor; University of Chinese Academy of Sciences: Beijing, China, 2020. [Google Scholar]
  48. Furasawa, T.; Miyazawa, H.; Yamamoto, S. Numerical Method for Simulating Flows of Supercritical CO2 Compressor with Nonequilibrium Condensation. In Proceedings of the ASME Turbo Expo 2016, Seoul, Republic of Korea, 13–17 June 2016. [Google Scholar]
  49. Anderson, M.R. Atypical Fluid Behavior on the Liquid Side of the Saturation Line of CO2 With Implications for Compressor Design. In Proceedings of the 6th International Supercritical CO2 Power Cycles Symposium, Pittsburgh, PA, USA, 27–29 March 2018. [Google Scholar]
  50. Conboy, T.; Wright, S. Experimental Investigation of the S-CO2 Condensing Cycle. In Proceedings of the Supercritical CO2 Power Cycle Symposium, Boulder, CO, USA, 24–25 May 2011. [Google Scholar]
  51. Wright, S.A.; Radel, R.F.; Conboy, T.M.; Rochau, G.E. Modeling and Experimental Results for Condensing Supercritical CO2 Power Cycles; Sandia National Laboratories: New Mexico, USA, 2011; SAND2010-8840. [Google Scholar]
  52. Azevedo, C.R.F.; Sinátora, A. Erosion-fatigue of steam turbine blades. Eng. Fail. Anal. 2009, 16, 2290–2303. [Google Scholar] [CrossRef]
  53. Noall, J.S.; Pasch, J.J. Achievable Efficiency and Stability of Supercritical CO2 Compression Systems. In Proceedings of the Supercritical CO2 Power Cycle Symposium, Pittsburgh, PA, USA, 9–10 September 2014. [Google Scholar]
  54. Brennen, C.E. Fundamentals of Multiphase Flow; Cambridge University Press: Cambridge, UK, 2005. [Google Scholar]
  55. Ludtke, K.H. Process Centrifugal Compressors: Basics, Function, Operation, Design, Application; Springer: Berlin/Heidelberg, Germany, 2003. [Google Scholar]
  56. Span, R.; Wagner, W. A New Equation of State for Carbon Dioxide Covering the Fluid Region from the Triple-Point Temperature to 1100 K at Pressures up to 800 MPa. J. Phys. Chem. Ref. Data 1996, 25, 1509–1596. [Google Scholar] [CrossRef]
  57. Ameli, A.; Turunen-Saaresti, T.; Backman, J. Numerical Investigation of the Flow Behavior Inside a Supercritical Centrifugal Compressor. In Proceedings of the ASME Turbo Expo 2016, Seoul, Republic of Korea, 13–17 June 2016. [Google Scholar]
  58. Jiang, X.; Tian, Y.; Shao, W.; Xiao, Y. Numerical simulation of supereritical CO2 compressors characteristics. J. Aerosp. Power 2018, 33, 1685–1694. [Google Scholar]
  59. Menter, F.R. Two-Equation Eddy-Viscosity Turbulence Models for Engineering Applications. AIAA J. 1994, 32, 1598–1605. [Google Scholar] [CrossRef]
  60. Grunloh, T.P.; Calian, L. RANS Turbulence Modeling for Supercritical Carbon Dioxide Flows. In Proceedings of the 6th International Supercritical CO2 Power Cycles Symposium, Pittsburgh, PA, USA, 27–29 March 2018. [Google Scholar]
  61. Sato, T.; Tasaki, A.; Masutani, J. Re-injection Compressors for Greenhouse Gas (CO2); Technical Review; Mitsubishi Heavy Industries, Ltd.: Tokyo, Japan, 2004; Volume 41, pp. 1–4. [Google Scholar]
  62. Colby, G.M.; Griffin, T.R.; Gupta, M.K.; Miller, H.F.; Nove, S.E.; Sehlstedt, N.H. High Pressure CO2 Compressor Testing for TUPI 1, TUPI 2, And TUPI 3. In Proceedings of the ASME Turbo Expo 2012, Copenhagen, Denmark, 11–15 June 2012. [Google Scholar]
  63. Moore, J.; Pacheco, J.; Allison, T. Development of an Internally Cooled Centrifugal Compressor for Carbon Capture and Storage Applications. In Proceedings of the ASME Turbo Expo 2012, Copenhagen, Denmark, 11–15 June 2012. [Google Scholar]
  64. Utamura, M.; Fukuda, T.; Aritomi, M. Aerodynamic Characteristics of a Centrifugal Compressor Working in Supercritical Carbon Dioxide. Energy Procedia 2012, 14, 1149–1155. [Google Scholar] [CrossRef]
  65. Pasch, J.; Conboy, T.; Fleming, D.; Rochau, G. Supercritical CO2 Recompression Brayton Cycle: Completed Assembly Description; Sandia National Laboratories: Albuquerque, NM, USA, 2012; SAND2012-9546. [Google Scholar]
  66. Clementoni, E.M. Steady-State Power Operation of a Supercritical Carbon Dioxide Brayton Cycle. In Proceedings of the 4th International Symposium—Supercritical CO2 Power Cycles, Pittsburgh, PA, USA, 9–10 September 2014. [Google Scholar]
  67. Cha, J.E.; Bae, S.W.; Lee, J.; Cho, S.K.; Lee, J.I.; Park, J.H. Operation Results of a Closed Supercritical CO2 Simple Brayton Cycle. In Proceedings of the 5th International Symposium—Supercritical CO2 Power Cycles, San Antonio, TX, USA, 28–31 March 2016. [Google Scholar]
  68. Clementoni, E.M.; Cox, T.L.; King, M.A. Transient Power Operation of a Supercritical Carbon Dioxide Brayton Cycle. In Proceedings of the ASME Turbo Expo 2017, Charlotte, NC, USA, 26–30 June 2017. [Google Scholar]
  69. Hacks, A.J.; Vojacek, A.; Dohmen, H.J.; Brillert, D. Experimental investigation of the sCO2-HeRo compressor. In Proceedings of the 2nd European sCO2 Conference, Essen, Germany, 30–31 August 2018. [Google Scholar]
  70. Allison, T.C.; Smith, N.R.; Pelton, R.; Jung, S.; Wilkes, J.C. Experimental Validation of a Wide-Range Centrifugal Compressor Stage for Supercritical CO2 Power Cycles. In Proceedings of the ASME Turbo Expo 2018, Oslo, Norway, 11–15 June 2018. [Google Scholar]
  71. Park, J.H.; Cha, J.E.; Lee, S.W. Experimental investigation on performance test of 150-kW-class supercritical CO2 centrifugal compressor. Appl. Therm. Eng. 2022, 210, 118310. [Google Scholar] [CrossRef]
  72. Pelton, R.; Bygrave, J.; Wygant, K.; Wilkes, J. Near Critical Point Testing and Performance Results of A SCO2 Compressor for a 10MWe Brayton Cycle. In Proceedings of the ASME Turbo Expo 2022, Rotterdam, The Netherlands, 13–17 June 2022. [Google Scholar]
  73. Toni, L.; Romei, A.; Bellobuono, E.F.; Gaetani, P.; Valente, R.; Persico, G. Computational and Experimental Assessment of a MW-Scale Supercritical CO2 Compressor Operating in Multiple Near-critical Conditions. In Proceedings of the ASME Turbo Expo 2022, Rotterdam, The Netherlands, 13–17 June 2022. [Google Scholar]
  74. Toni, L.; Persico, G.; Bellobuono, E.F.; Romei, A.; Valente, R.; Gaetani, P. Experimental and Numerical Performance Survey of a MW-Scale Supercritical CO2 Compressor Operating in Near-Critical Conditions. In Proceedings of the 7th International Supercritical CO2 Power Cycles Symposium, San Antonio, TX, USA, 21–24 February 2022. [Google Scholar]
  75. Jeong, Y.; Kim, G.; Son, I.W.; Lee, S.; Lee, J.I. Supercritical CO2 compressor operation near stall and surge conditions. Case Stud. Therm. Eng. 2023, 50, 103499. [Google Scholar] [CrossRef]
  76. Kang, J.; Vorobiev, A.; Sutton, J.B.; Stewart, W.S.; Cameron, J.D.; Morris, S.C.; Turner, M.G.; Sedlacko, K.P.; Miller, J.D.; Held, T.J. Experimental Demonstration of an Advanced CO2 Axial Compressor for CO2-based Power Cycles and Energy Storage Systems. In Proceedings of the 8th International Supercritical CO2 Power Cycles Symposium, San Antonio, TX, USA, 27–29 February 2024. [Google Scholar]
  77. Fernandez, E.; Gabriel-Ohanu, E.; Vesely, L.; Kapat, J.; Hosangadi, A.; Weathers, T.; Cepero, A.; Cooper, P. Experimental and Numerical Performance Evaluation of a Modified sCO2 Compressor Blade Profile to Reduce Leading Edge Condensation. In Proceedings of the 8th International Supercritical CO2 Power Cycles Symposium, San Antonio, TX, 27–29 February 2024. [Google Scholar]
  78. Wells, K.; Turner, M.G. Open Source Axial Compressor Mean-Line Design Tool for Supercritical Carbon Dioxide. In Proceedings of the ASME Turbo Expo 2021, Virtual, 7–11 June 2021. [Google Scholar]
  79. Monge, B.; Sánchez, D.; Savill, M.; Sánchez, T. Exploring the Design Space of the SCO2 Power Cycle Compressor. In Proceedings of the 4th International Symposium—Supercritical CO2 Power Cycles, Pittsburgh, PA, USA, 9–10 September 2014. [Google Scholar]
  80. Poerner, M.; Musgrove, G.; Beck, G. Liquid CO2 Formation, Impact, and Mitigation at the Inlet to a Supercritical CO2 Compressor. In Proceedings of the ASME Turbo Expo 2016, Seoul, Republic of Korea, 13–17 June 2016. [Google Scholar]
  81. Zhong, H. Introduction and Mastery of Centrifugal Compressors; China Machine Press: Beijing, China, 2015. [Google Scholar]
  82. Lieblein, S.; Schwenk, F.C.; Broderick, R.L. Diffusion Factor for Estimating Losses and Limiting Blade Loadings in Axial-Flow-C ompressor Blade Elements; NASA: Washington, DC, USA, 1953; NACA-RM-E53D01. [Google Scholar]
  83. Haller, D. Das Verhalten von Tragflugelgittern in Axialverdichtern und im windkanal. BWK Z. 1953, 5, 333–337. [Google Scholar]
  84. Smith, L.H. Recovery Ratio—A Measure of the Loss Recovery Potential of Compressor Stages. J. Fluids Eng. 1958, 80, 517–523. [Google Scholar] [CrossRef]
  85. Koch, C.C.; Smith, L.H. Loss Sources and Magnitudes in Axial-Flow Compressors. J. Eng. Power 1976, 98, 411–424. [Google Scholar] [CrossRef]
  86. Lieblein, S. Experimental Flow in Two-Dimensional Cascades; NASA: Washington, DC, USA, 1955; NACA RM E56B03a. [Google Scholar]
  87. Dickens, T.; Day, I. The Design of Highly Loaded Axial Compressors. J. Turbomach. 2011, 133, 031007. [Google Scholar] [CrossRef]
Figure 1. Effect of turbomachinery efficiency on cycle efficiency (simple Brayton cycle at 700 °C) [18].
Energies 18 03081 g001
Figure 2. Multi-condition operation data of an MW-class sCO2 centrifugal compressor of the Institute of Engineering Thermophysics, Chinese Academy of Sciences. The blue line in the figure represents the approximate performance curve obtained through quadratic polynomial fitting of tens of thousands of operating points represented by the red dots.
Energies 18 03081 g002
Figure 3. Specific heat capacity ratio γ distribution of CO2.
Energies 18 03081 g003
Figure 4. Isentropic exponent n s distribution of CO2.
Energies 18 03081 g004
Figure 5. sCO2 compressibility factor distribution.
Energies 18 03081 g005
Figure 6. Distribution of ν of CO2.
Energies 18 03081 g006
Figure 7. Comparison of the sound speed of air and CO2.
Energies 18 03081 g007
Figure 8. Relative Mach number variation caused by variations in sound speed in cascade flow (The blue and red squares indicate local magnification) [40].
Energies 18 03081 g008
Figure 9. Different phase transition types caused by different inlet conditions of the compressor [40].
Energies 18 03081 g009
Figure 10. Variations in the sound speeds of the CO2 two-phase flow with dryness at different temperatures.
Energies 18 03081 g010
Table 1. Design results of sCO2 axial-flow compressors in the public literature around the world.
Inlet Temperature °C/Pressure MPaFlow Rate
kg/s
RPMNumber of StagesTotal Pressure RatioIsentropic
Efficiency %
Power
MW
Stage-Specific Speed
Wang et al. [22], MIT42/9.072574360042.292.9459.51.484
Wang et al. [22], MIT90/9.081175360082.293.0058.41.486
Takagi et al. [20,23], TIT35/8.2620353600142.4987.5 3.178
Nassar et al. [24], SoftInway32/7.87186.812,333122.53 2.996
Gou et al. [25], CSIC37/9.01000430011.193.52 2.443
Liu et al. [26], IET, CAS34.5/7.82000300092.5677.82 1.872
Li et al. [27], XJTU37/8.89515,00041.889.581.771.649
Syblik et al. [28]33/7.97388300024.488.73150.688
Ha et al. [29], UC98/2.7712419,80011.4193.013.21.882
Ghimire et al. [30], UC98/2.7711719,80032.6189.8591.834
Hu [31], TJUT37/8375830042.087.25 1.573
Table 2. Density and viscosity of several working media.
Working MediumTypical Working ConditionsDensity
kg/m3
Dynamic Viscosity
10−6 Pa·s
Kinematic Viscosity
10−8 m2/s
Air (compressor)20 °C, 0.1 MPa1.1918.21531.4
Water (pump)20 °C, 0.1 MPa998.21001.6100.3
CO2 (sCO2 compressor)33 °C, 8.0 MPa613.746.07.5
Table 3. sCO2 compressor tests (for centrifugal and axial flow) around the world.
InstitutionsTest YearInlet
Temperature and Pressure
°C/MPa
Number of StagesDesign ParametersTest ResultsApplication
Mass Flow Rate kg/sRotational Speed
rpm
Pressure RatioPower
or Efficiency
Hiroshima Machinery Works [61]200415/0.1721.6 20311.7 MWBasically agree with the design under full conditionsCCS
and EOR
Dresser-Rand [62]201220/0.38 103/
183
Basically agree with the design under full conditionsCCS
and EOR
SWRI [63]2012*/0.2~0.61~412,8501.5575 kWTest of
single-stage completed (with cooling)
CCS
TIT [64]201234.9/8.211.2100,0001.46 70% design RPM reached10 kWe power generation
SNL and BNI
[65]
201232.3/7.713.4675,0001.79 67% design RPM reached, pressure ratio of 1.45, efficiency of 67%100 kWe power generation
BMPC and KAPL [66]201435.6/9.315.4775,0001.8094.1 kW
60.8%
79% design RPM reached, pressure ratio of 1.45100 kWe power generation
KAERI and KAIST [67]201633/7.813.2 × 270,0001.865%50% design RPM reached, with efficiency of 27.5%, pressure ratio of about 1.1300 kWe power generation
BMPC and NNL [68]201735.6/9.315.4775,0001.8094.1 kW
60.8%
5~35% variable load transient test completed, performance exceeding expectations100 kWe power generation
UDE [69]201833/7.8310.6550,0001.57 kW100% design RPM reached, with good pressure ratio results
SWRI [70]201837/8.5215527,4091.9184%Air replacement test completed,
with good results
10 MWe power generation
IET, CAS [13]201935/8116.340,0002.580%80% design RPM achieved, with pressure ratio of 1.96, efficiency of 68.4%1 MWe power generation
IET, CAS [14]202135/821830,0002.63 Design parameters reached, with pressure ratio of 2.69, efficiency of 73%1 MWe power generation
TPRI [8,9]202135/7.938585002.6872%Design parameters reached5 MWe power generation
KAERI [71]202234.1/7.94112.5536,0001.75150 kWDesign parameters reached, with efficiency up to 84%500 kWe power generation
HPS [72]202237/8.5215527,4093.21.99 MWDesign parameters reached10 MWe power generation
Baker Hughes [73,74]202233/7.982 11,400 5.4 MWDesign parameters reached25 MWe power generation
KAIST [75]202335/7.611.536,0001.9 Surge limit dynamic test completed50 kWt power generation
Notre Dame [76]202498/2.77112519,8001.4193%, 3.19 MW100% design RPM reached, with an efficiency of 89.3%100 MWe energy storage
Symbols: * Data not available in published literature.
Disclaimer/Publisher’s Note: The statements, opinions and data contained in all publications are solely those of the individual author(s) and contributor(s) and not of MDPI and/or the editor(s). MDPI and/or the editor(s) disclaim responsibility for any injury to people or property resulting from any ideas, methods, instructions or products referred to in the content.

