


Comprehensive Performance and Economic Analyses of Transcritical CO2 Heat Pump Water Heater Suitable for Petroleum Processes and Heating Applications

 ,
, 
Abstract
1. Introduction
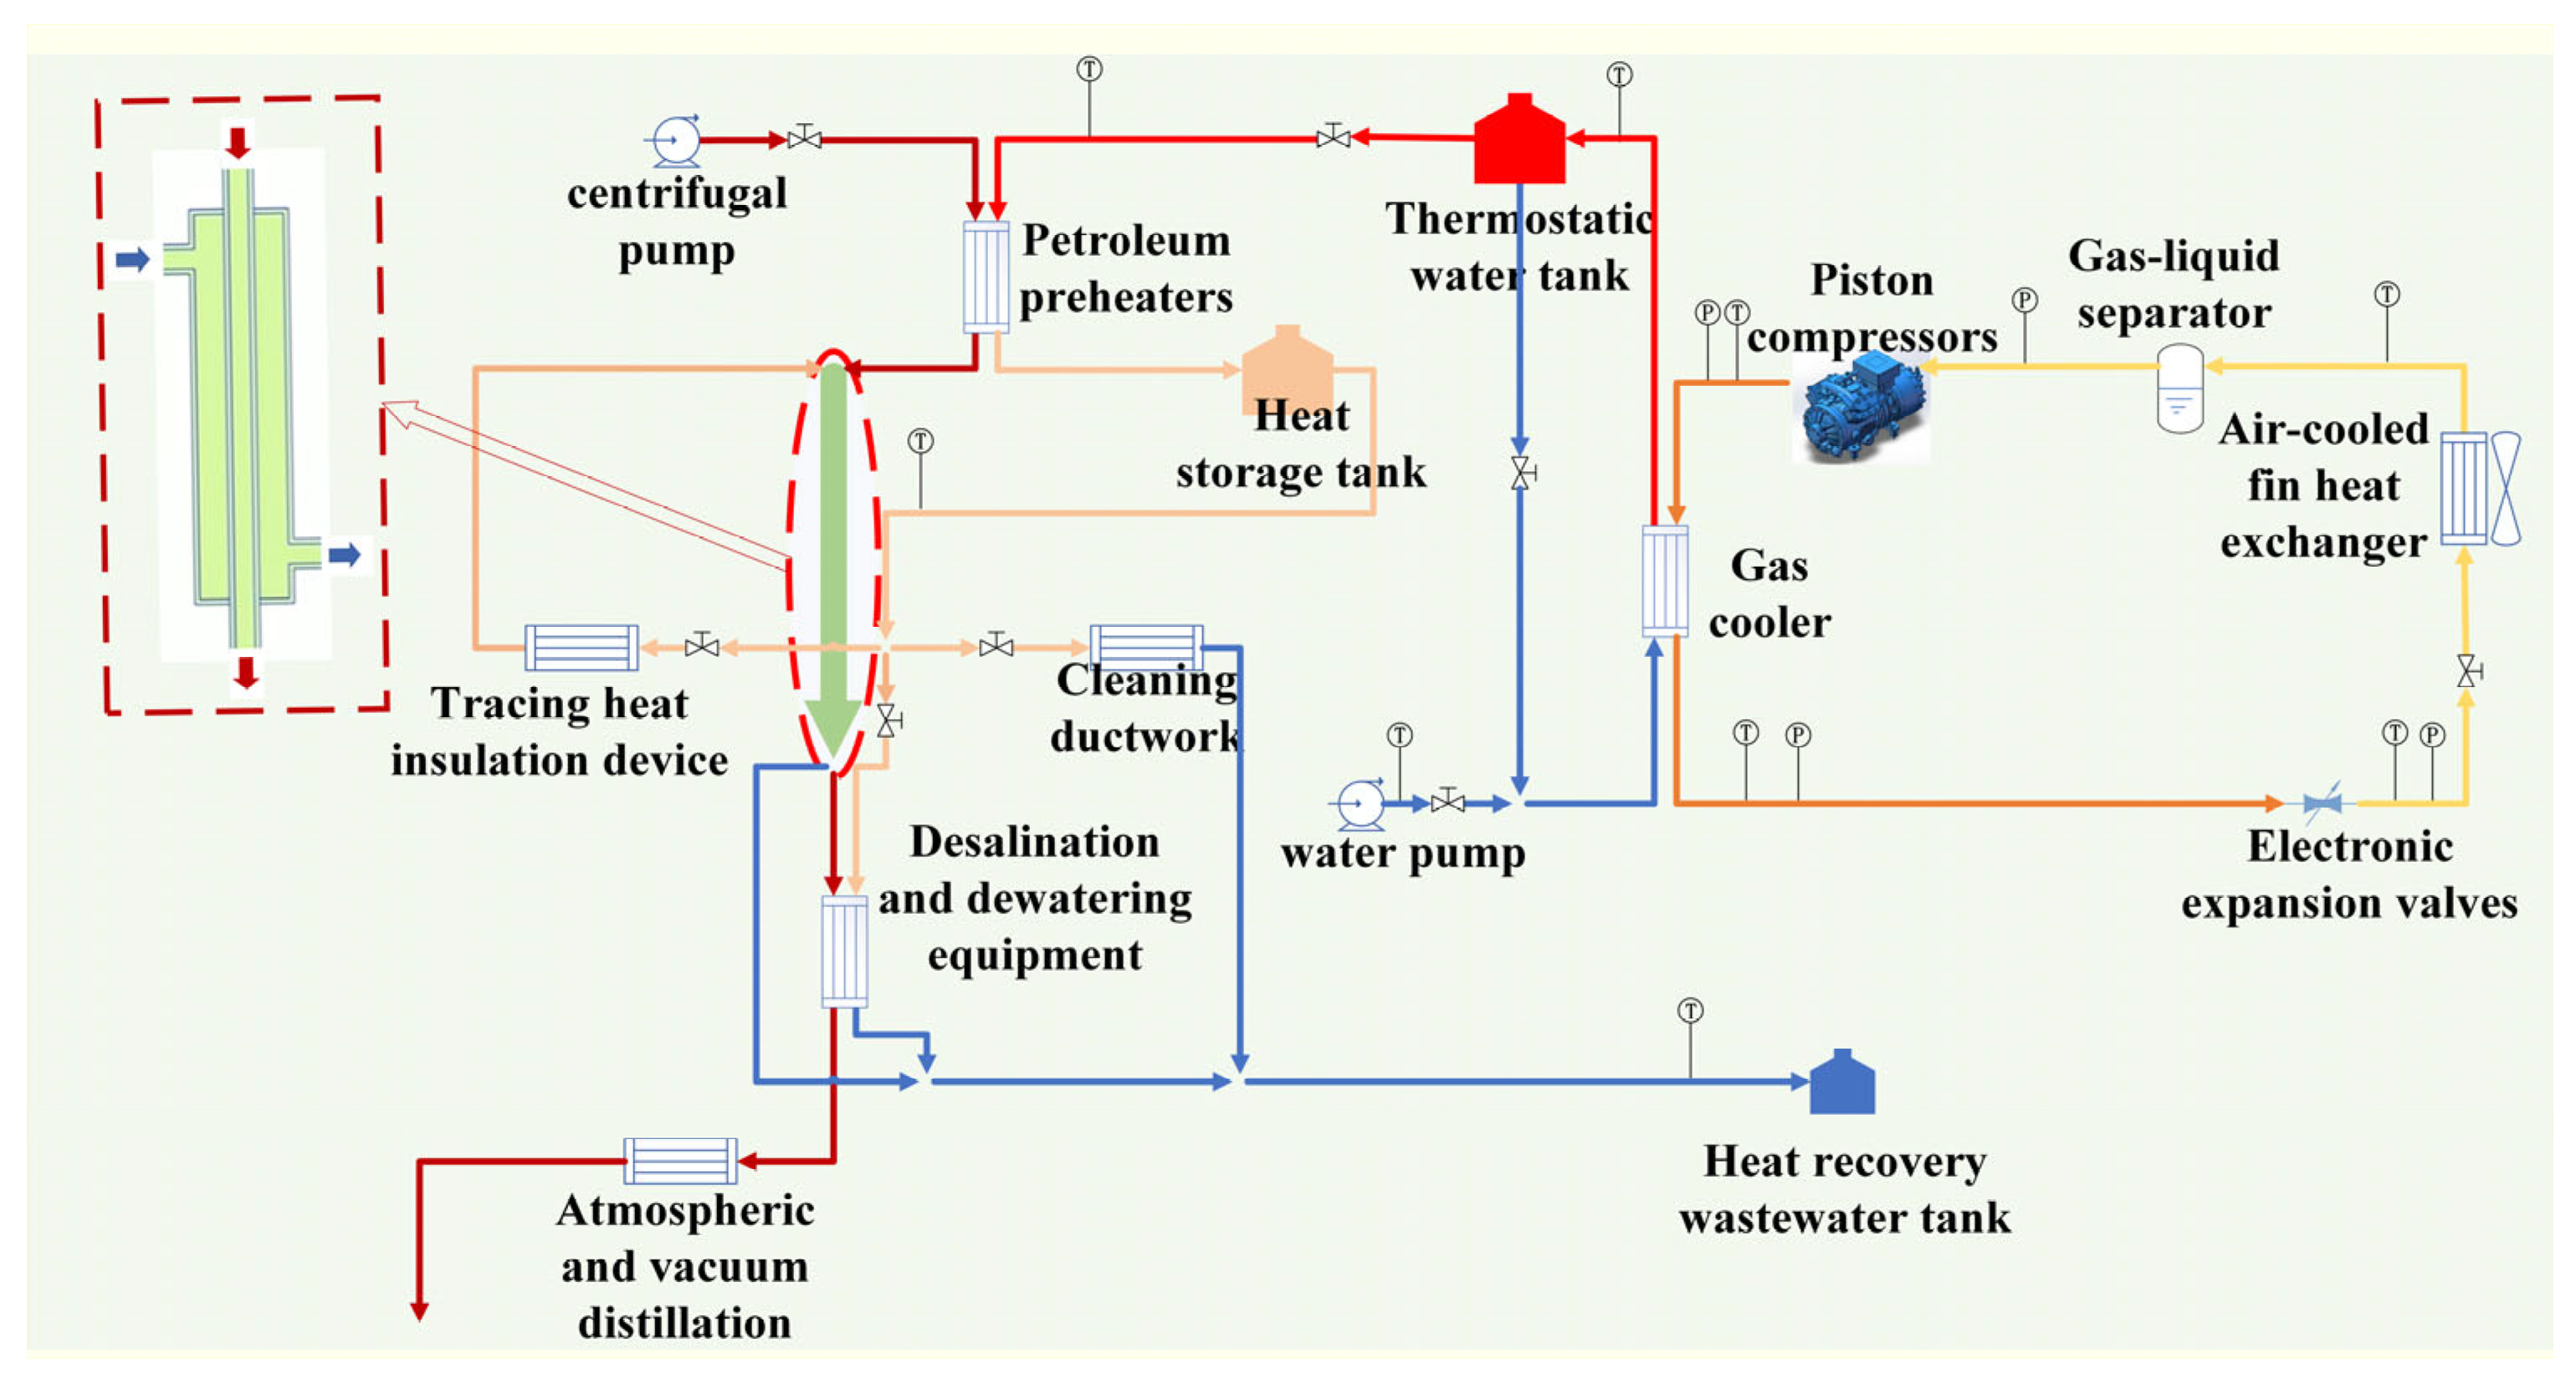
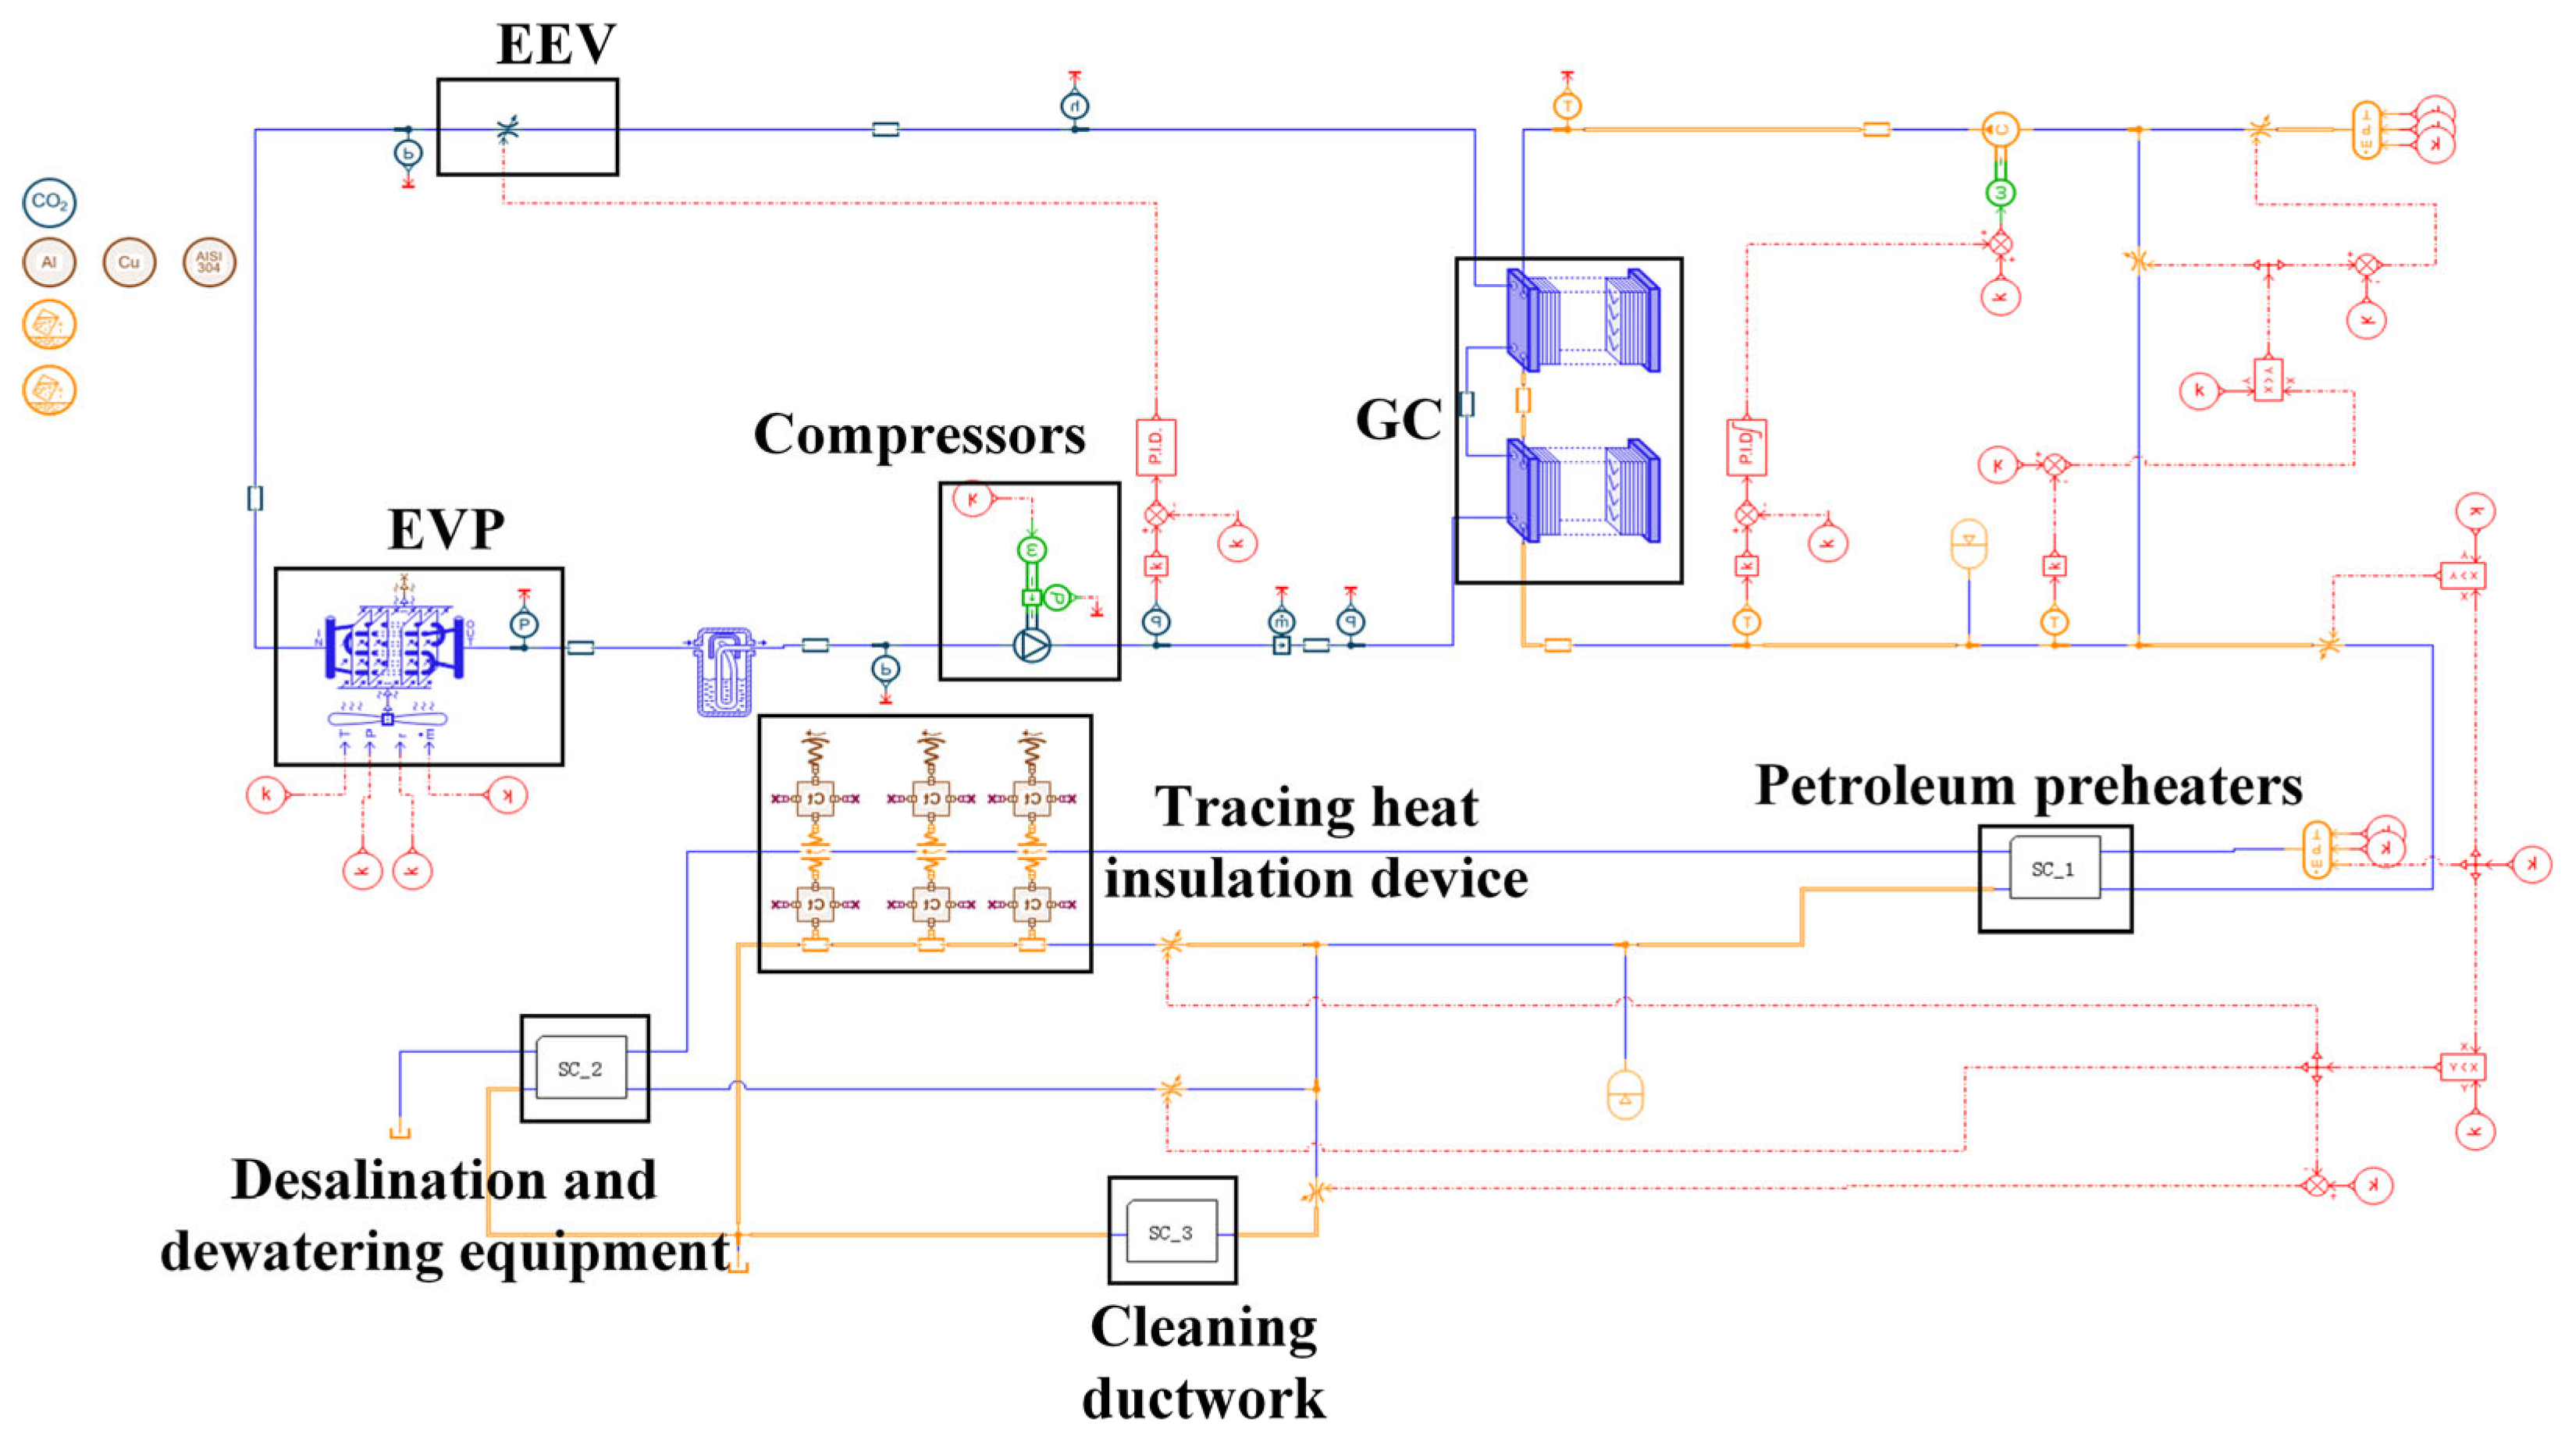
2. System Description
3. Methodology
3.1. Mathematical Modeling of Air Source Transcritical CO2 Heat Pump System
3.2. Solution Method
4. Results and Discussion
4.1. Verification of Simulation Results
4.2. Parametric Analysis of Air Source Transcritical CO2 Heat Pumps
- (1)
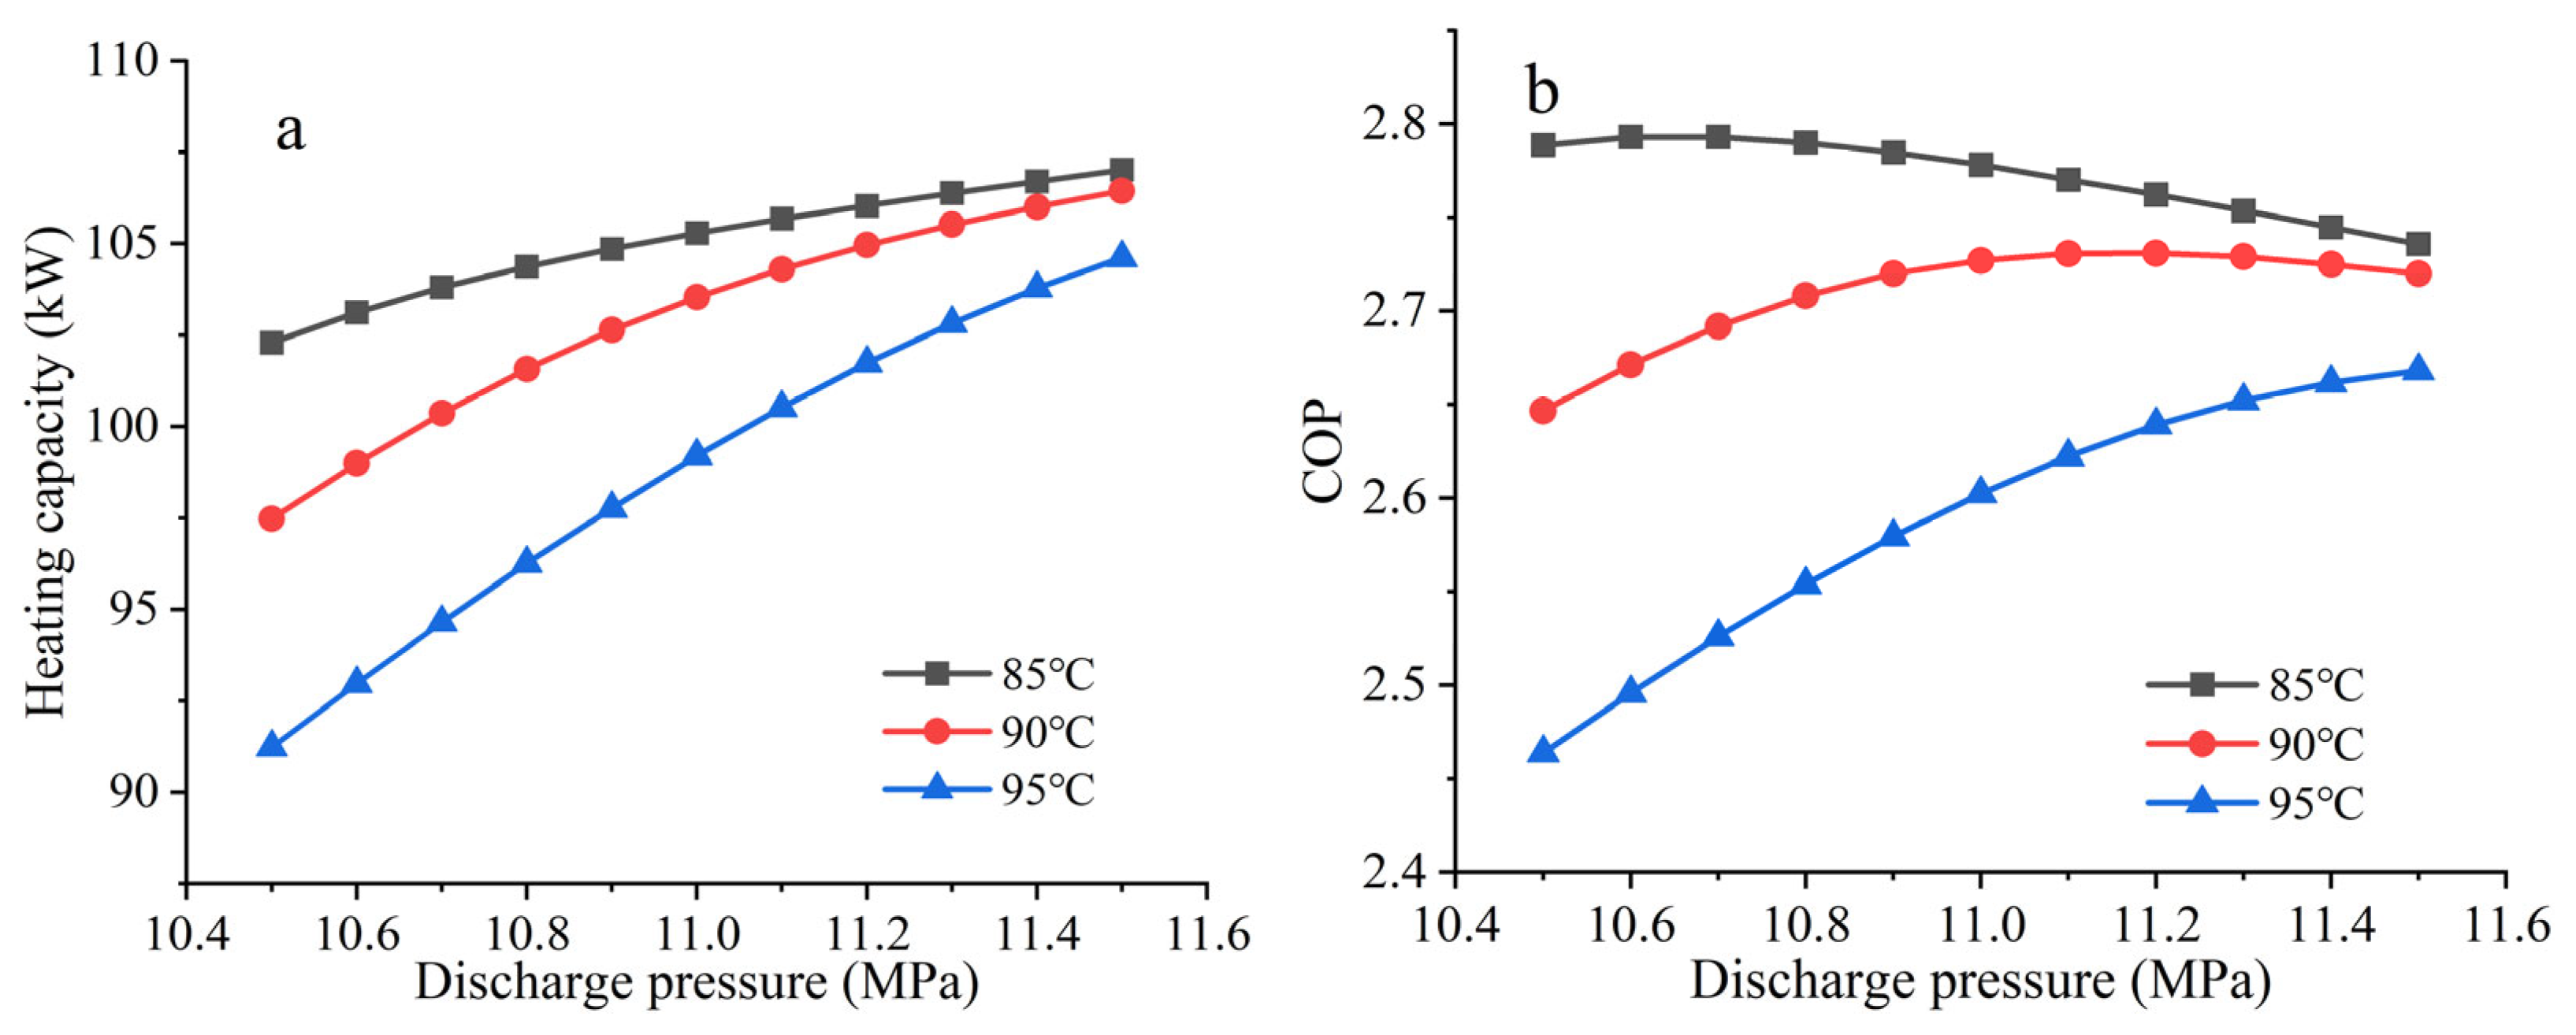
- Static analysis
- (2)
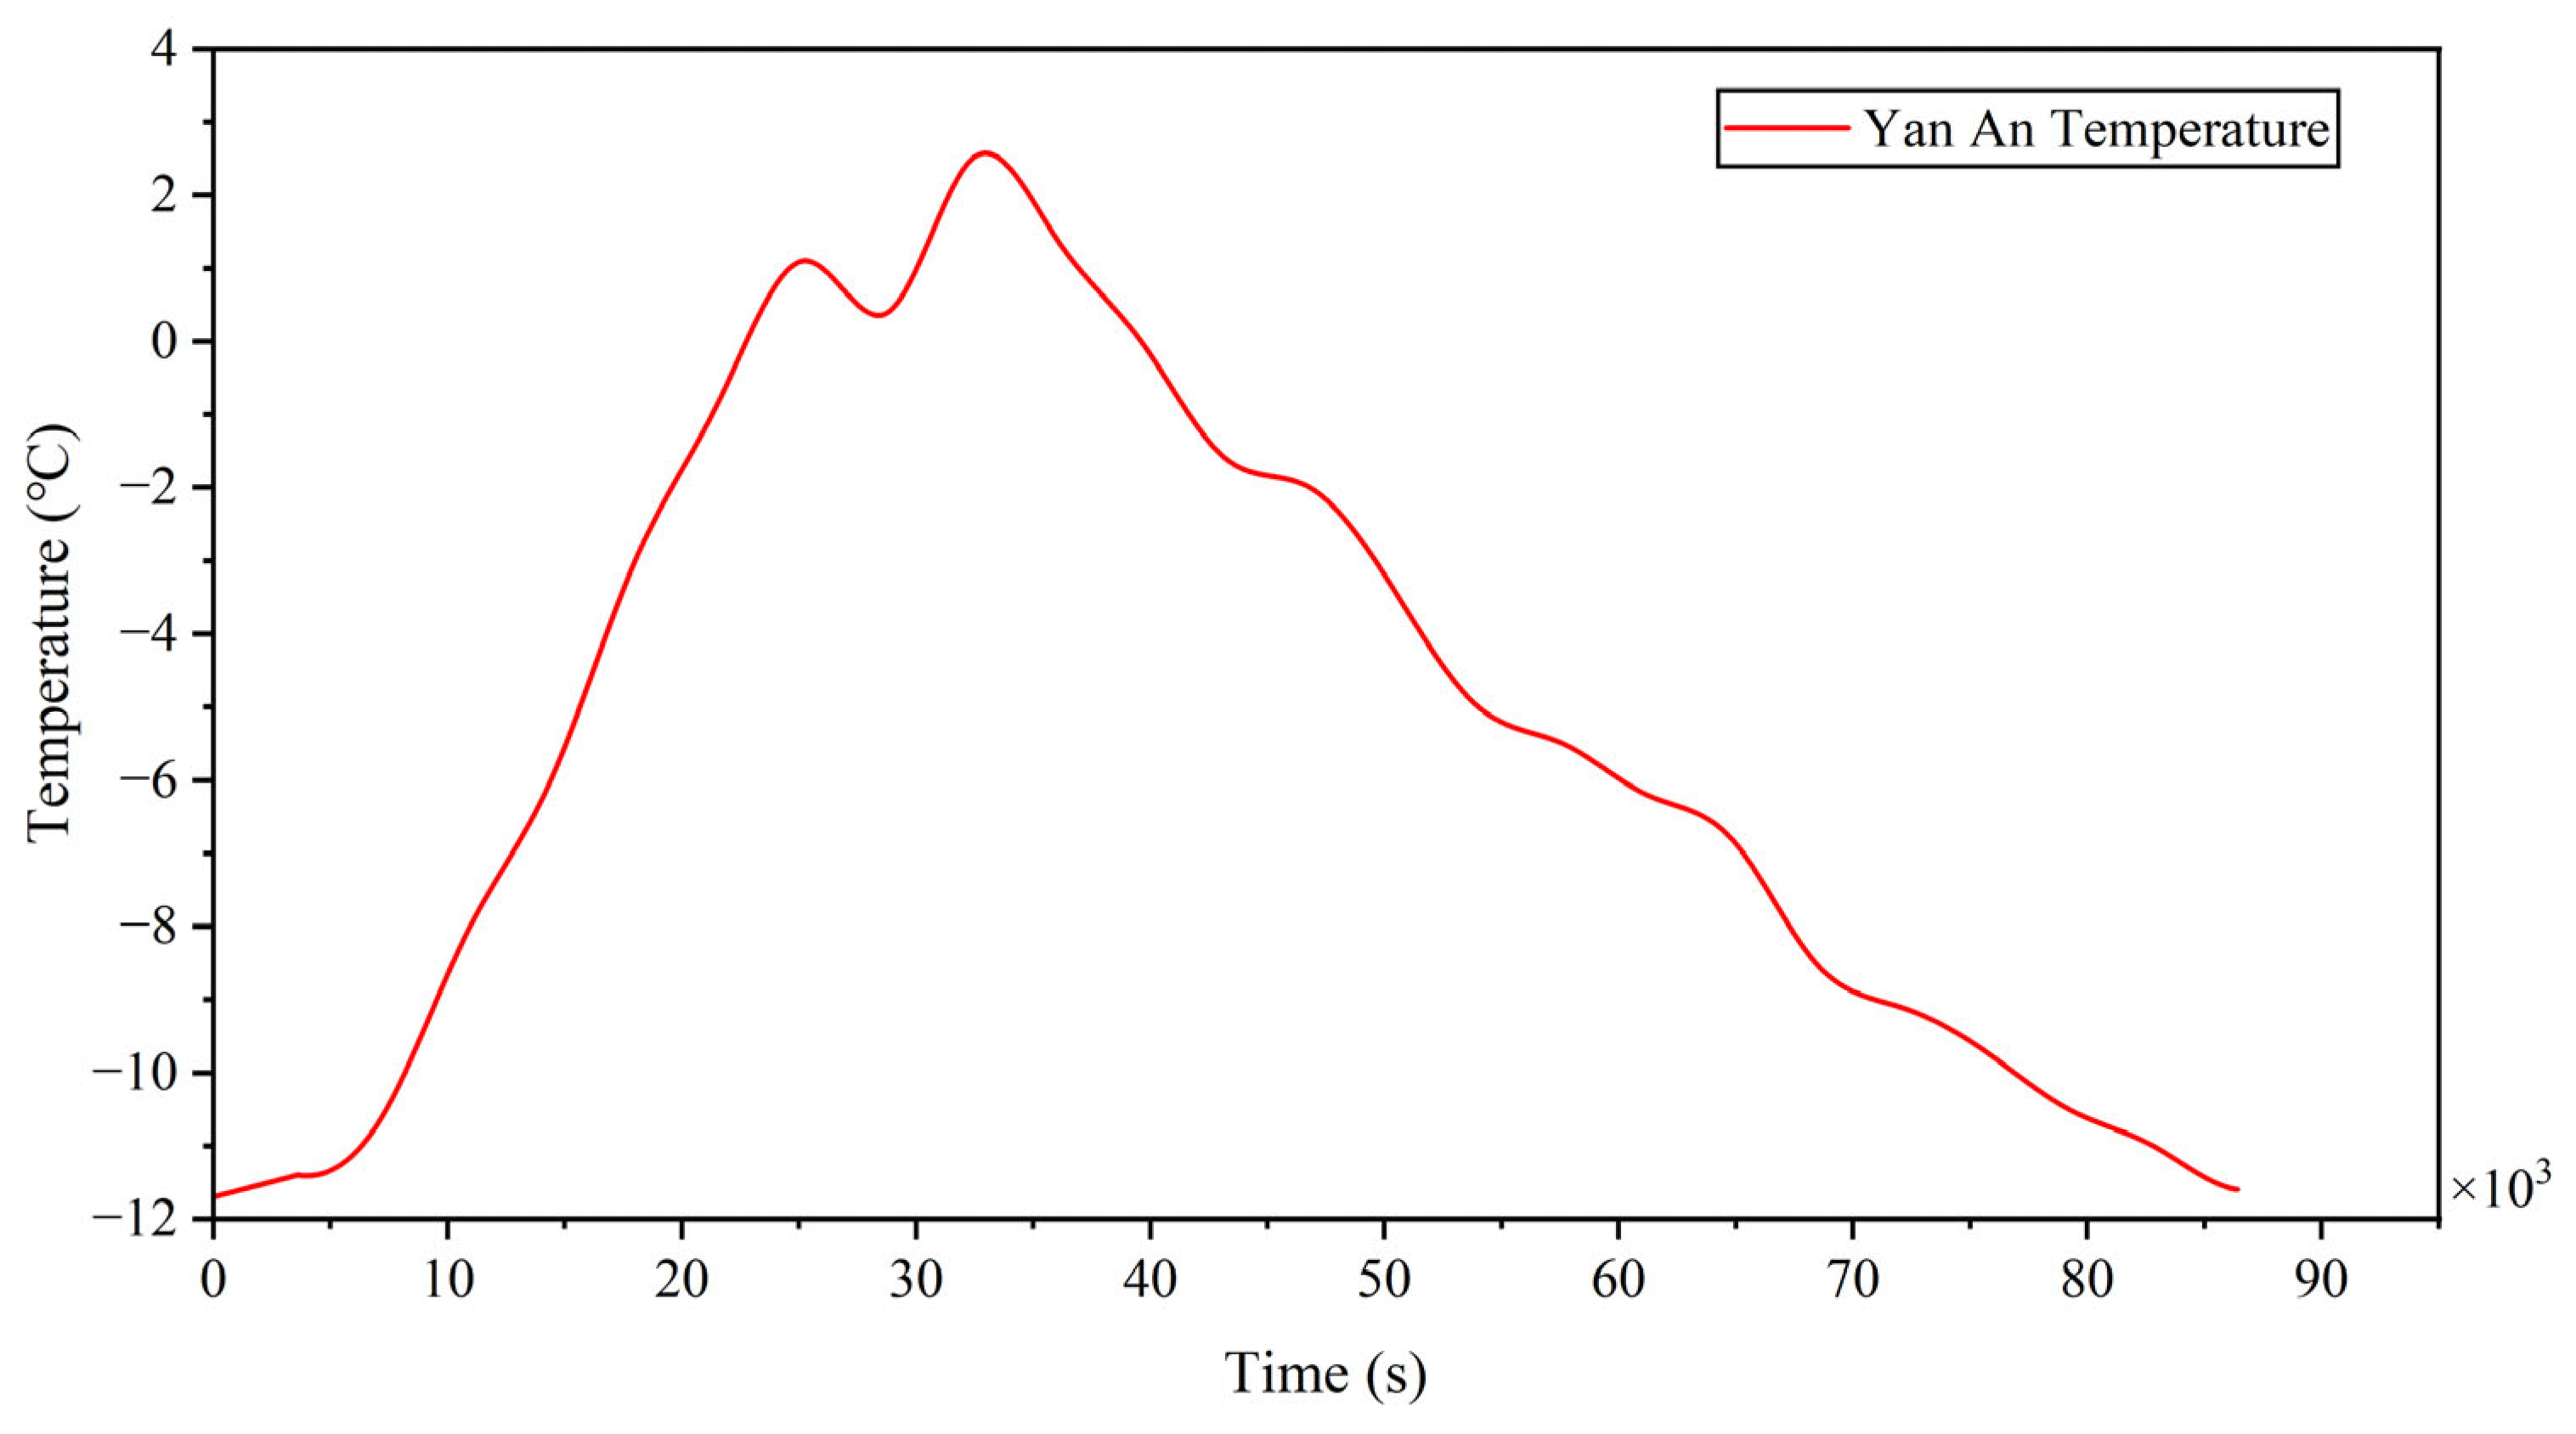
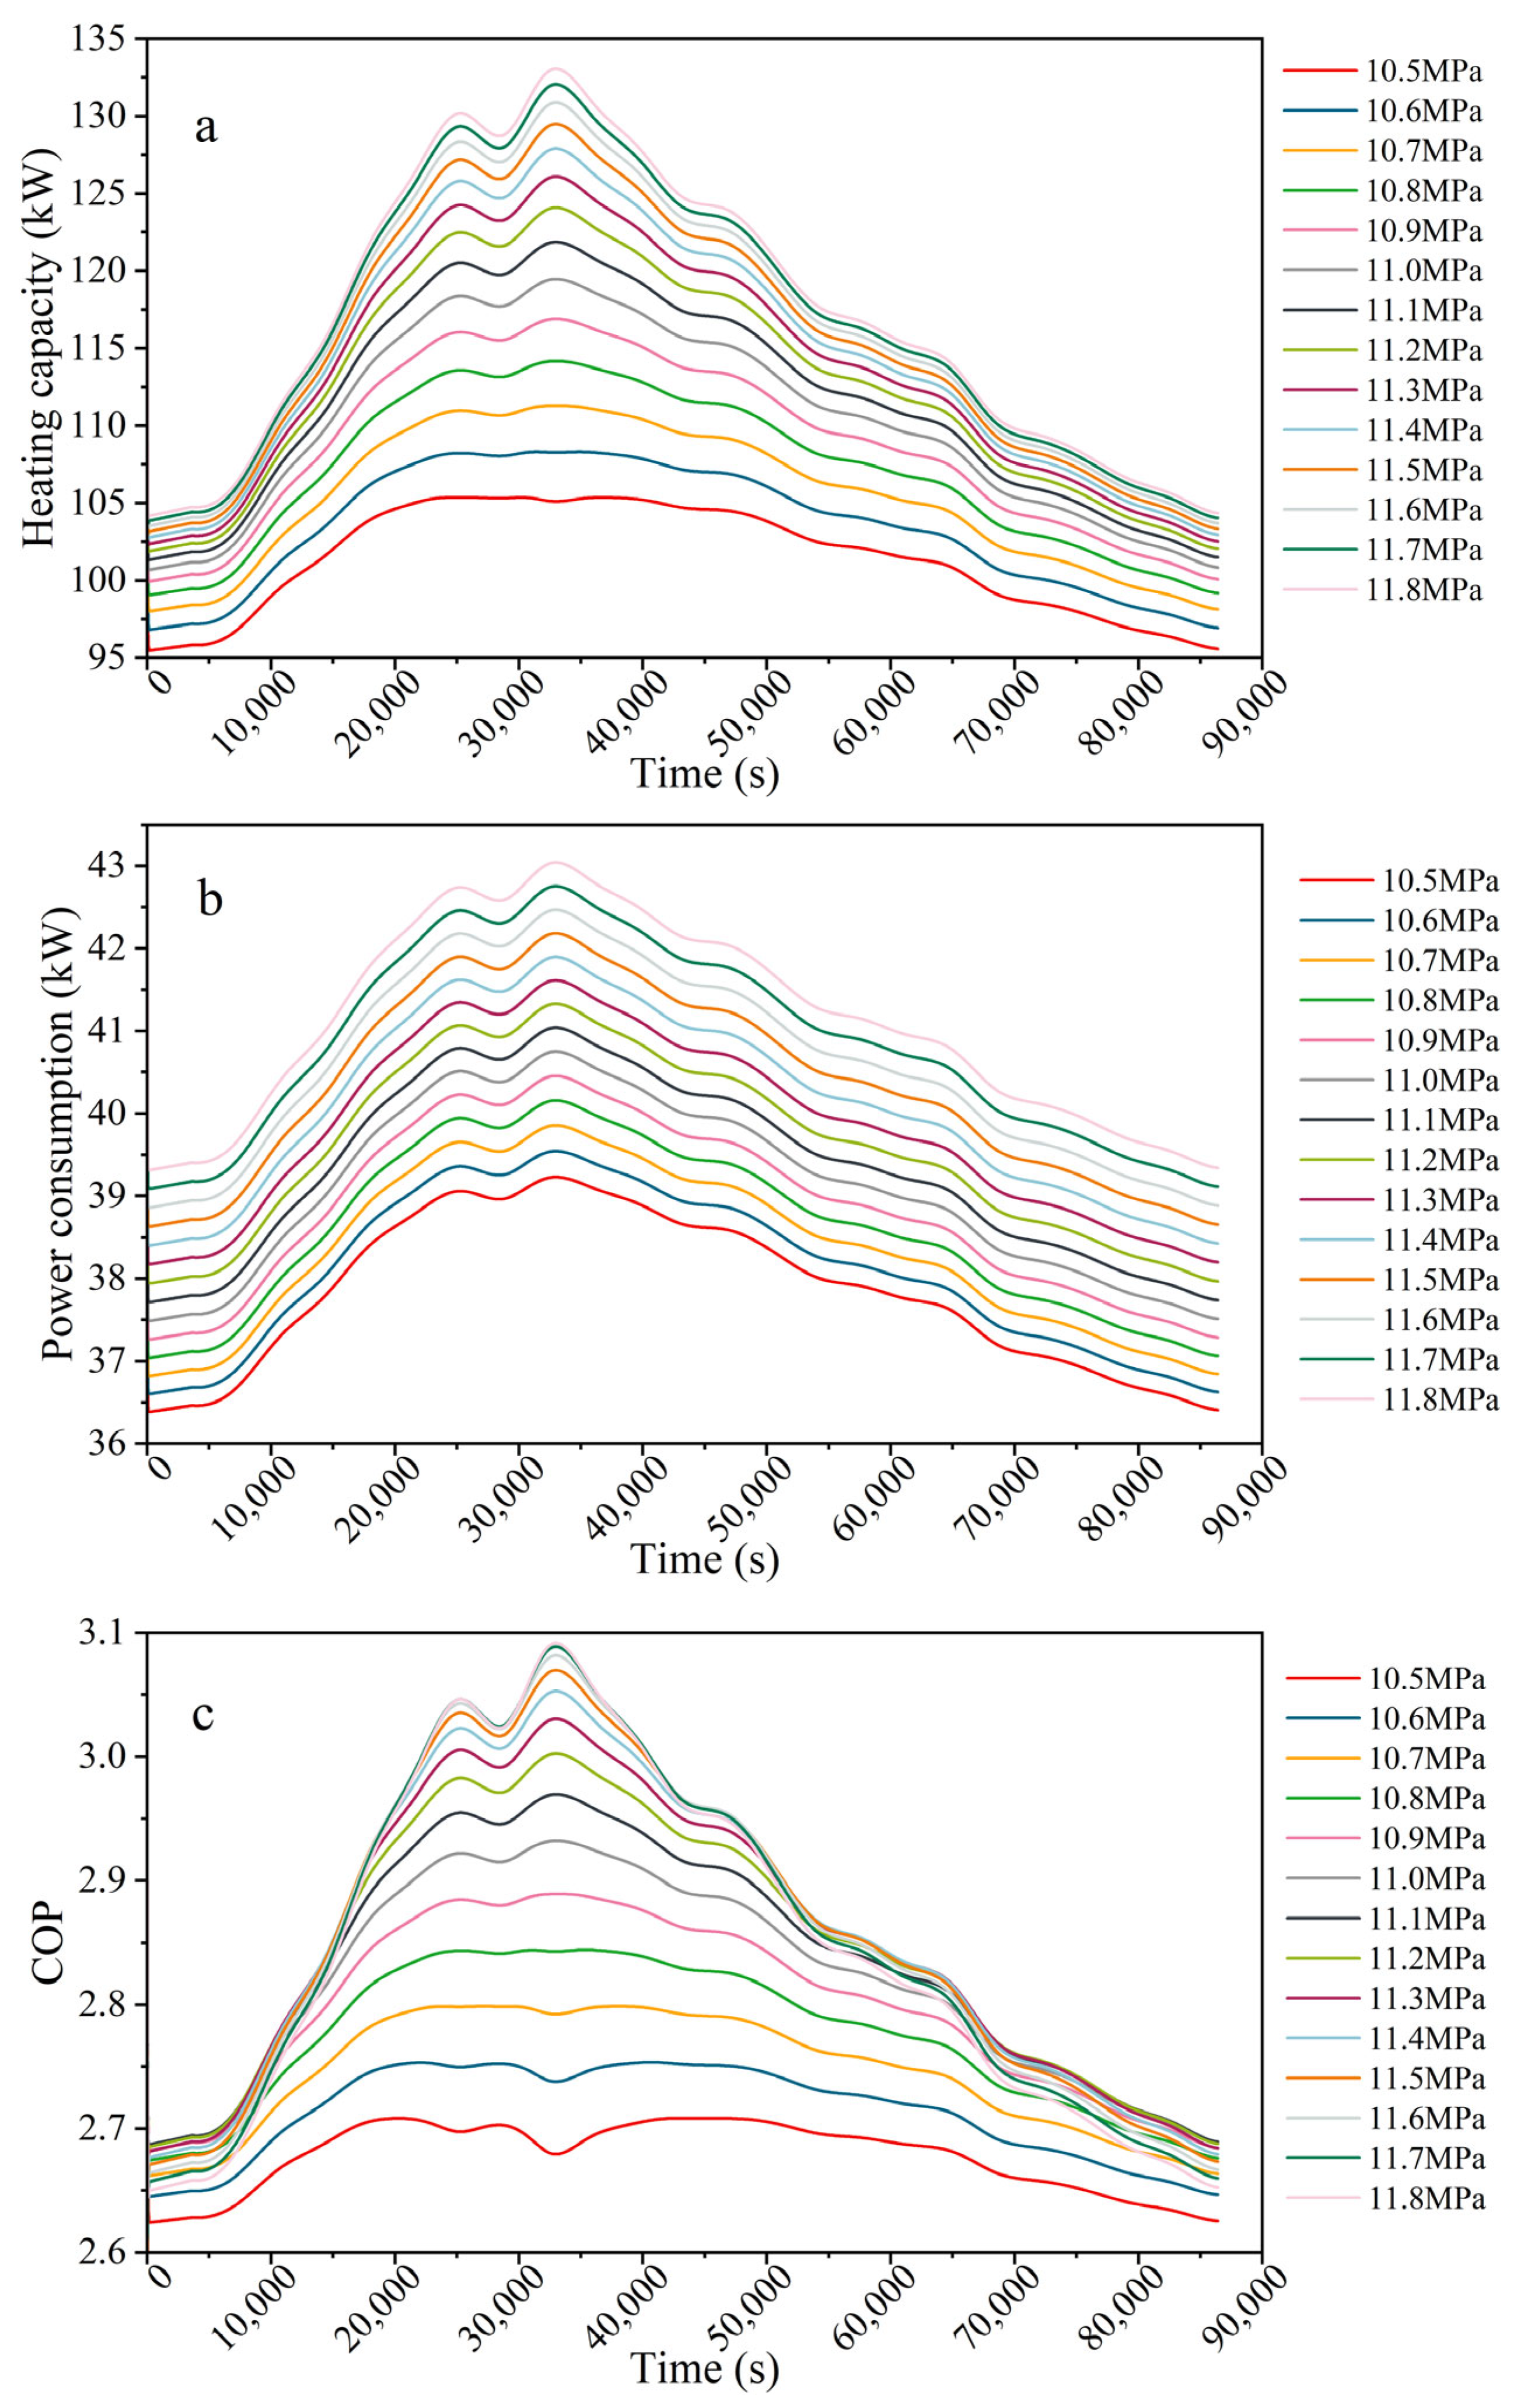
- Impact of discharge pressure under dynamic environmental conditions
- (3)
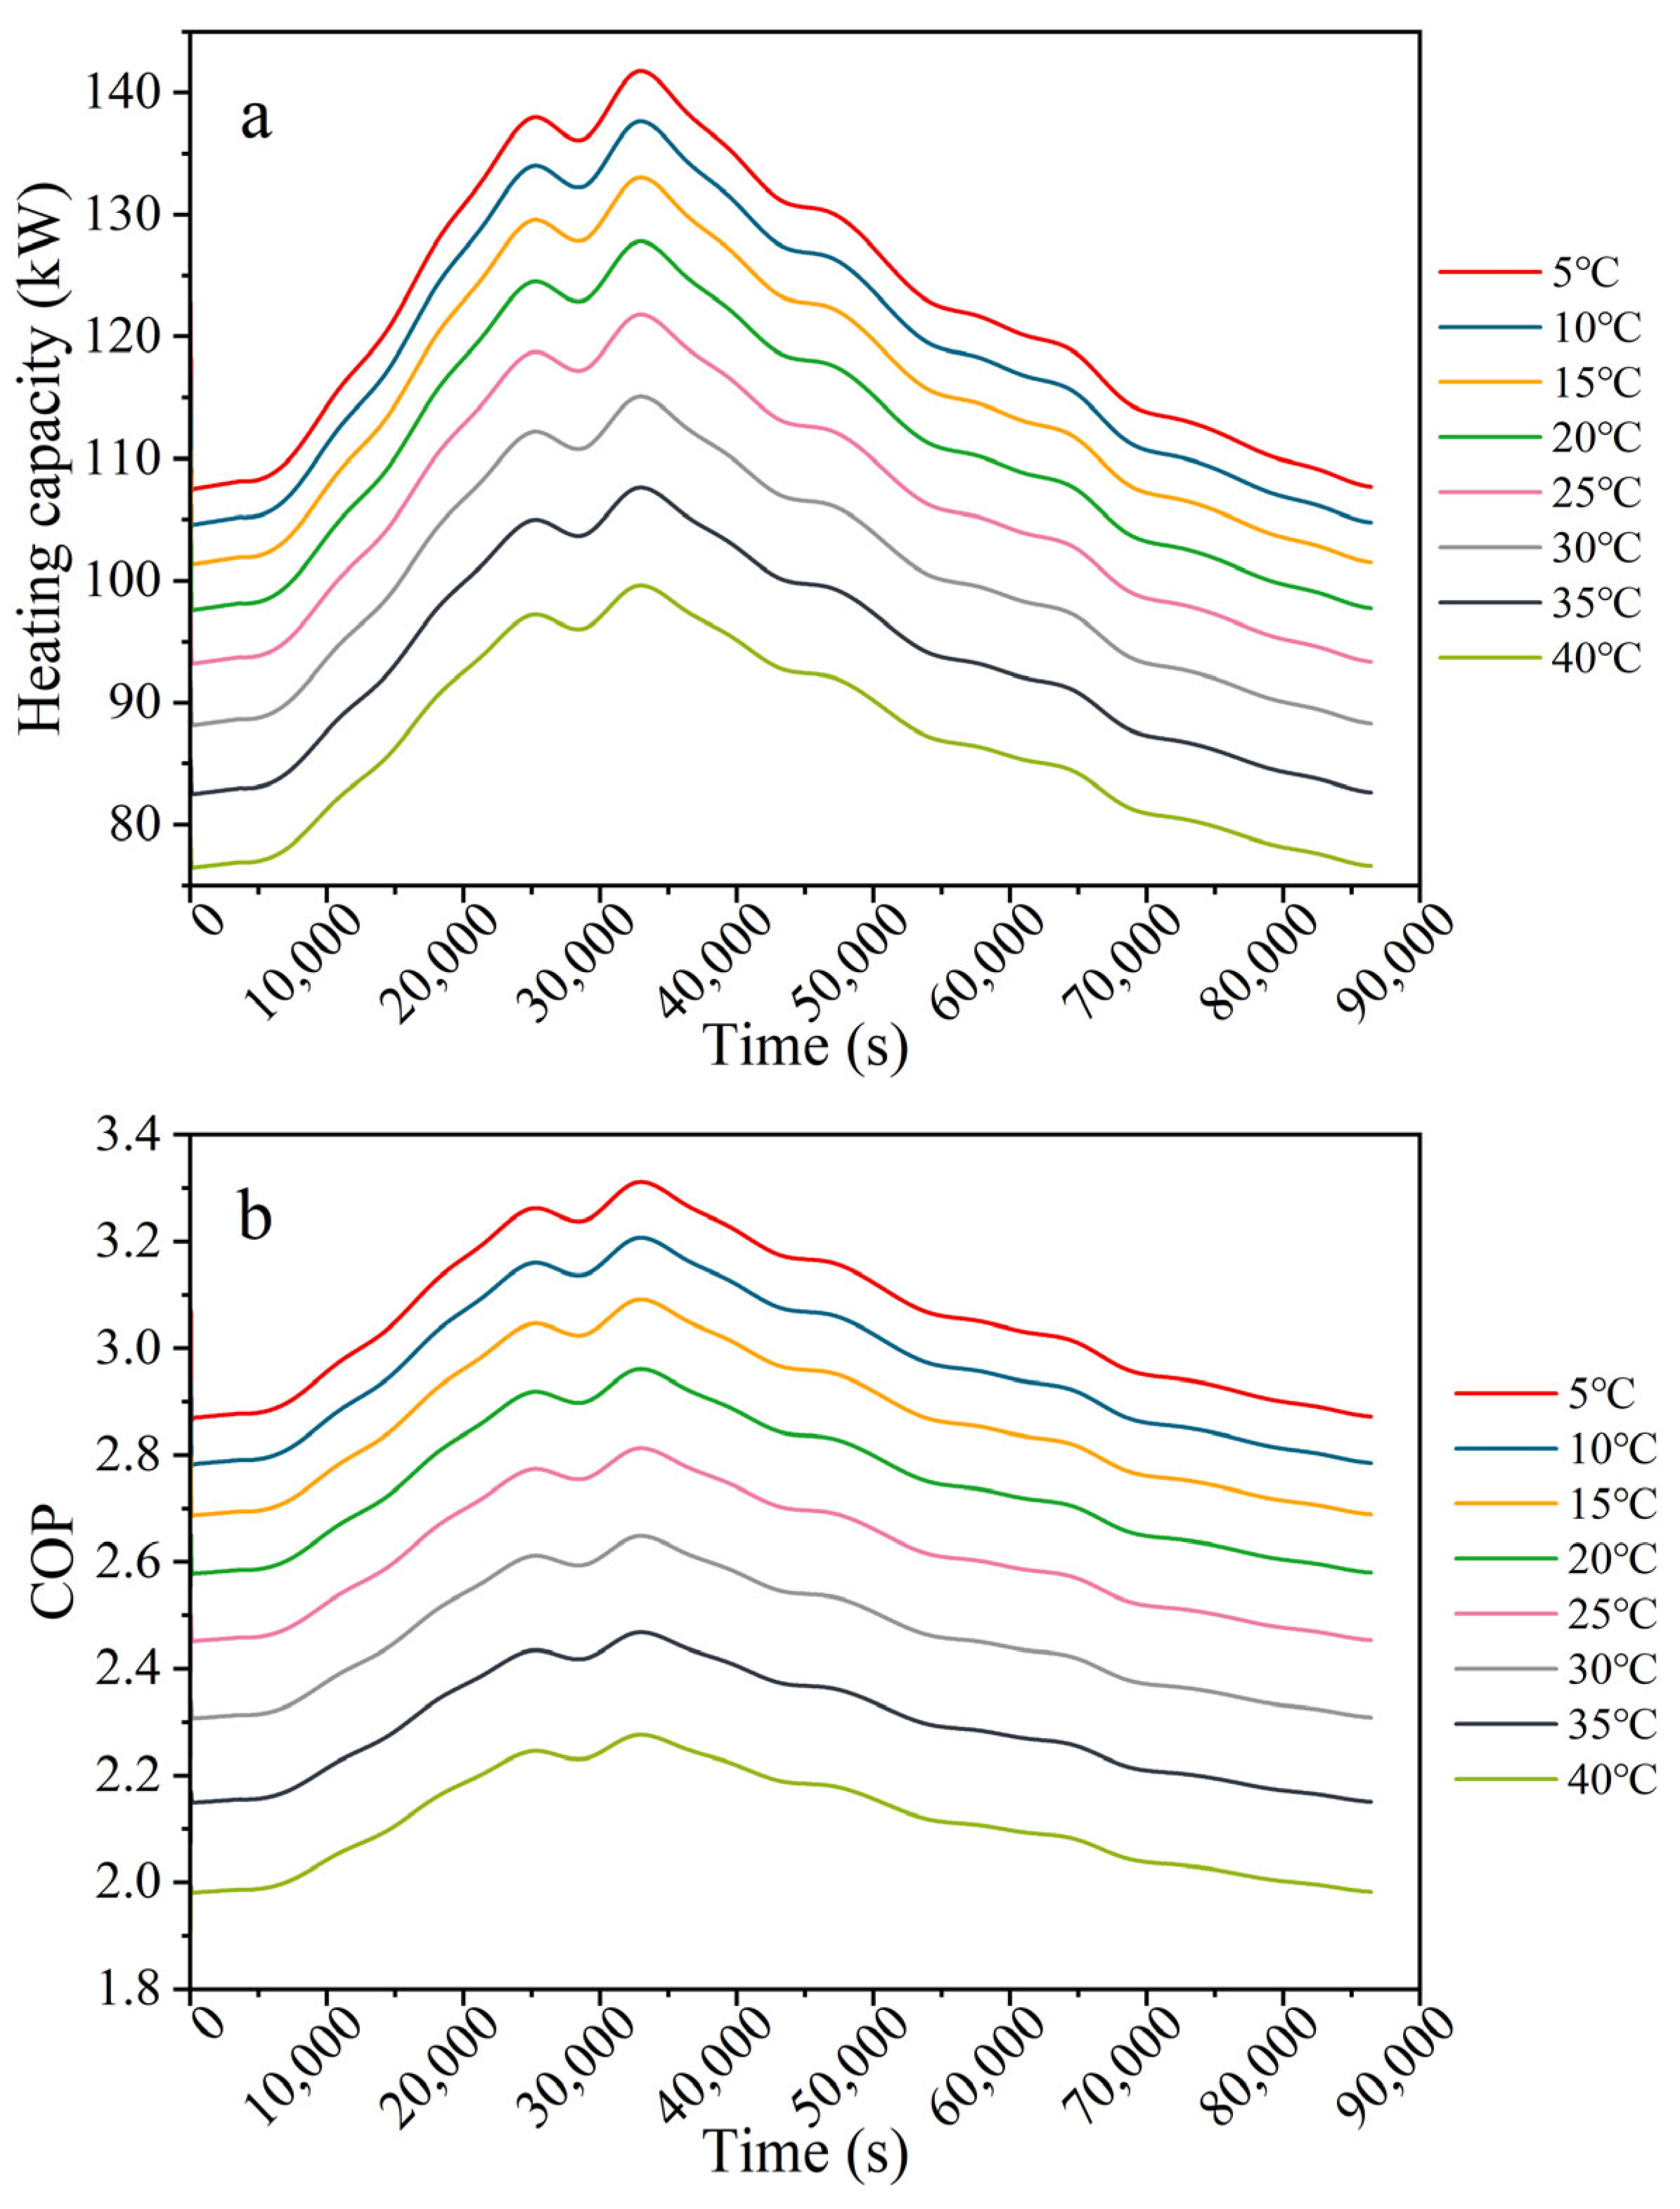
- Impact of inlet and outlet water temperatures under dynamic environmental conditions
5. Conclusions
- The heat pump system exhibits distinct dynamic response characteristics under varying ambient temperatures. Both the heating capacity and COP rise synchronously during temperature escalation phases before peaking and subsequently declining as temperatures drop.
- At the highest ambient temperature (2 °C), the optimal discharge pressure is 11.7 MPa. Compared with the optimal discharge pressure of 11.0 MPa at −11 °C, the performance has improved by nearly 13.3%.
- An elevated inlet water temperature reduces the gas cooler’s heat exchange temperature difference and weakens heat release efficiency. The inlet water temperature should be maintained within a reasonable range (below 25 °C) to ensure optimal system performance.
- The environmental temperature, discharge pressure, and water temperature exhibit temporal interactions that profoundly shape the system’s dynamic thermodynamic behavior and energy efficiency levels. Dynamic analysis surpasses static evaluations in identifying operational performance boundaries and regulation strategies during real-world operation.
Author Contributions
Funding
Data Availability Statement
Conflicts of Interest
Nomenclature
| A | heat transfer area (m2) |
| AD | expansion valve flow path cross-sectional area (m2) |
| c | specific heat capacity |
| CD | quality factor |
| h | specific enthalpy (kJ·kg−1) |
| HX | heat exchanger |
| k | heat transfer coefficient (kW/(m2·k)) |
| m | mass flow rate (kg·s−1) |
| N | rotary speed(rev∙min−1) |
| p | pressure (MPa) |
| Q | heating capacity (kW) |
| ref | refrigerant |
| T | temperature (°C) |
| V | volumetric flow rate (m3·s−1) |
| W | power consumption (kW) |
| COP | coefficient of performance |
| GWP | global warming potential |
| ODP | ozone depletion potential |
| ρ | density (kg∙m−3) |
| η | heat recovery effectiveness; efficiency |
| β | gas–liquid partition ratio |
| amb | ambient |
| c | compressor |
| d | discharge |
| exp | expansion |
| h | high pressure |
| is | isentropic |
| m | mechanical |
| opt | optimization |
| r | refrigerant |
| s | suction |
| v | volumetric |
| winter | period from December to February in Northern Hemisphere and from June to August in Southern Hemisphere |
References
- Mao, N.; Hao, J.Y.; Xu, Y.J.; Song, M.J.; Tang, J.F. A numerical study on non-uniform characteristics of spray falling heat transfer over horizontal tubes in an oily sewage source heat pump. Int. J. Heat Mass Transf. 2020, 154, 119679. [Google Scholar]
- Bistline, J.E.T.; Binsted, M.; Blanford, G.; Boyd, G.; Browning, M.; Cai, Y.; Edmonds, J.; Fawcett, A.A.; Fuhrman, J.; Gao, R.; et al. Policy Implications of Net-Zero Emissions: A Multi-Model Analysis of United States Emissions and Energy System Impacts. Energy Clim. Chang. 2025, 6, 100191. [Google Scholar] [CrossRef]
- BP’s Statistical Review of World Energy 2021. p. 34. Available online: https://www.bp.com/content/dam/bp/business-sites/en/global/corporate/pdfs/energy-economics/statistical-review/bp-stats-review-2021-full-report.pdf (accessed on 9 April 2025).
- Griffiths, S.; Sovacool, B.K.; Kim, J.; Bazilian, M.; Uratani, J.M. Decarbonizing the oil refining industry: A systematic review of sociotechnical systems, technological innovations, and policy options. Energy Res. Soc. Sci. 2022, 89, 102542. [Google Scholar] [CrossRef]
- Shahnazari, H.; Mhaskar, P.; House, J.M.; Salsbury, T.I. Heating, Ventilation and Air Conditioning Systems: Fault Detection and Isolation and Safe Parking. Comput. Chem. Eng. 2018, 108, 139–151. [Google Scholar] [CrossRef]
- Lian, H.K.; Li, Y.; Shu, G.; Gu, C. An Overview of Domestic Technologies for Waste Heat Utilization. Energy Conserv. Technol. 2011, 29, 123–128. [Google Scholar]
- Xu, G.; Zang, L.; Schwarz, P.; Yang, H. Achieving China’s Carbon Neutrality Goal by Economic Growth Rate Adjustment and Low-Carbon Energy Structure. Energy Policy 2023, 183, 113817. [Google Scholar] [CrossRef]
- Xie, H.Y.; Li, S.H.; Lv, J.; Huang, J.; Ma, S. Experimental Study on Operation of CO2 Tube-Fin Evaporator under Low Temperature Conditions. Energy Res. Inf. 2025, 41, 19–26. [Google Scholar]
- Guo, Y.; Wang, N.; Shao, S.; Huang, C.; Zhang, Z.; Li, X.; Wang, Y. A Review on Hybrid Physics and Data-Driven Modeling Methods Applied in Air Source Heat Pump Systems for Energy Efficiency Improvement. Renew. Sustain. Energy Rev. 2024, 204, 114804. [Google Scholar] [CrossRef]
- Vorushylo, I.; Keatley, P.; Shah, N.; Green, R.; Hewitt, N. How heat pumps and thermal energy storage can be used to manage wind power: A study of Ireland. Energy 2018, 157, 539–549. [Google Scholar] [CrossRef]
- Nagano, K.; Katsura, T.; Takeda, S. Development of a Design and Performance Prediction Tool for the Ground Source Heat Pump System. Appl. Therm. Eng. 2006, 26, 1578–1592. [Google Scholar] [CrossRef]
- Zhang, D.W.; Fang, C.L.; Qin, X.; Li, H.; Liu, H.; Wu, X.H. Performance study of transcritical CO2 heat pump integrated with ejector and latent thermal energy storage for space heating. Energy Convers. Manag. 2022, 268, 115979. [Google Scholar] [CrossRef]
- Heath, E.A. Amendment to the Montreal protocol on substances that deplete the ozone layer (Kigali amendment). Int. Leg. Mater. 2017, 56, 193–205. [Google Scholar] [CrossRef]
- Liu, Z.L.; You, X.K.; Zhang, H. Analysis of circulation characteristics of six categories and sixteen types of refrigerants in refrigeration cycles. Guangzhou Chem. 2024, 49, 60–63. [Google Scholar]
- Gai, X.S. Numerical Study on Adsorption/Desorption Performance of Molecular Sieve Heat Pipe Adsorption Bed Driven by Engine Waste Heat. Master’s Thesis, Beijing Jiaotong University, Beijing, China, 2022. [Google Scholar]
- Yang, Z.; Feng, B.; Ma, H.; Zhang, L.; Duan, C.; Liu, B.; Zhang, Y.; Chen, S.; Yang, Z. Analysis of lower GWP and flammable alternative refrigerants. Int. J. Refrig. 2021, 126, 12–22. [Google Scholar] [CrossRef]
- United Nations. Kyoto Protocol to the United Nations Framework Convention on Climate Change; United Nations: New York, NY, USA, 1998. [Google Scholar]
- Li, R.; Ye, F.; Zhang, J.; Wang, M.; Li, K. Theoretical analysis of three CO2/C3H8 (R744-R290) cascade refrigeration systems with precooling processes in low-temperature circuits. Appl. Therm. Eng. 2023, 234, 121238. [Google Scholar] [CrossRef]
- Fang, Y. Market Prospects of R290 Refrigerant for New Energy Vehicle Air Conditioning Systems. Automot. Knowl. 2025, 25, 16–18. [Google Scholar]
- Qin, X.; Zhang, F.; Zhang, D.W.; Gao, Z.; Tang, S.Z. Experimental and theoretical analysis of the optimal high pressure and peak performance coefficient in transcritical CO2 heat pump. Appl. Therm. Eng. 2022, 210, 118372. [Google Scholar] [CrossRef]
- Qin, X.; Wang, D.B.; Jin, Z.L.; Wang, J.L.; Zhang, G.J.; Li, H. A comprehensive investigation on the effect of internal heat exchanger based on a novel evaluation method in the transcritical CO2 heat pump system. Renew. Energy 2021, 178, 574–586. [Google Scholar] [CrossRef]
- Adamson, K.M.; Walmsley, T.G.; Carson, J.K.; Chen, Q.; Schlosser, F.; Kong, L.; Cleland, D.J. High-temperature and transcritical heat pump cycles and advancements: A review. Renew. Sustain. Energy Rev. 2022, 167, 112798. [Google Scholar] [CrossRef]
- Dang, X.B.; Guan, X.; Xie, M.M. Experimental Study on Solar-Assisted CO2 Heat Pump Water Heating System. Energy Eng. 2014, 39–41+72. [Google Scholar] [CrossRef]
- Li, Y.Y.; Cui, Y.; Song, Z.; Zhao, X.; Li, J.; Shen, C. Eco-Economic Performance and Application Potential of a Novel Dual-Source Heat Pump Heating System. Energy 2023, 283, 128478. [Google Scholar] [CrossRef]
- Wu, C.; Liu, F.; Li, X.; Wang, Z.; Xu, Z.; Zhao, W.; Yang, Y.; Wu, P.; Xu, C.; Wang, Y. Low-Temperature Air Source Heat Pump System for Heating in Severely Cold Area: Long-Term Applicability Evaluation. Build. Environ. 2022, 208, 108594. [Google Scholar] [CrossRef]
- Yang, L.X. Experimental Study on System Characteristics and Factors Affecting Water-Outlet Temperature of Transcritical CO2 Heat Pump. Master’s Thesis, Zhengzhou University, Zhengzhou, China, 2019. [Google Scholar]
- Long, J.; Zhu, J.; Wang, N.; Zhai, J.; Xu, T.; Liang, C.; Zhao, L. Data-driven robust operating optimization of energy-material coupled system in refineries under uncertainty. Expert Syst. Appl. 2025, 267, 126184. [Google Scholar] [CrossRef]
- Liu, D.L.; Wang, W.Q. Research on experiential teaching of building energy consumption simulation course. High. Educ. Build. 2018, 27, 148–153. [Google Scholar]
- Qin, X.; Duan, H.X.; Wang, D.B.; Shen, A.Q.; Liu, H.Z.; Wang, G.H. Research on a novel adaptive generalized predictive control based on transcritical CO2 heat pump. Appl. Therm. Eng. 2025, 265, 125650. [Google Scholar] [CrossRef]
- Qin, X.; Liu, H.D.; Meng, X.R.; Wei, X.L.; Zhao, L.H.; Yang, L.X. A study on the compressor frequency and optimal discharge pressure of the transcritical CO2 heat pump system. Int. J. Refrig. 2019, 99, 101–113. [Google Scholar] [CrossRef]
- Guo, Z.; Xu, Q.; Chen, J.; Wu, J. Formation mechanism and experimental verification of cold island effect in air-source heat pumps. Acta Energiae Solaris Sin. 2022, 43, 7–14. [Google Scholar]
- Wang, H.; Guo, D.; Li, L.; Chen, K. Error sources in petroleum product measurement and their control methods. Prod. Reliab. Rep. 2025, 120–121. [Google Scholar]
- Hafner, A.; Forsterling, S.; Banasiak, K. Multi-Ejector Concept for R744 Supermarket Refrigeration. Int. J. Refrig. 2014, 43, 1–13. [Google Scholar] [CrossRef]
- He, K.; Song, Y.; Xie, H.; Cao, F. Winter Driving Range Optimization of Electric Bus Based on CO2 Thermal Management System and Thermal Energy Cascade Utilization. Energy 2025, 323, 135668. [Google Scholar] [CrossRef]
- Dittus, F.W.; Boelter, L.M.K. Heat Transfer in Automobile Radiators of the Tubular Type. Int. Commun. Heat Mass Transf. 1985, 12, 3–22. [Google Scholar] [CrossRef]
- Sleicher, C.A.; Rouse, M.W. A Convenient Correlation for Heat Transfer to Constant and Variable Property Fluids in Turbulent Pipe Flow. Int. J. Heat Mass Transf. 1975, 18, 677–683. [Google Scholar] [CrossRef]
- Park, Y.-G.; Jacobi, A.M. The Air-Side Thermal-Hydraulic Performance of Flat-Tube Heat Exchangers with Louvered, Wavy, and Plain Fins under Dry and Wet Conditions. J. Heat Transf. 2009, 131, 061801. [Google Scholar] [CrossRef]
- Fang, X. A New Correlation of Flow Boiling Heat Transfer Coefficients for Carbon Dioxide. Int. J. Heat Mass Transf. 2013, 64, 802–807. [Google Scholar] [CrossRef]
- Wang, S.G. Theoretical and Experimental Investigation on Thermodynamic Performance and the Optimal Discharge Pressure of Air-Source Transcritical CO2 Heat Pump. Ph.D. Thesis, Xi’an Jiaotong University, Xi’an, China, 2013. [Google Scholar]
- China Meteorological Data Service Center. Meteorological Data. China Meteorological Administration. Available online: http://data.cma.cn (accessed on 9 April 2025).
- Tan, X.; Long, J.; Li, J.; Li, Z.; Jiang, H.; Liu, H. Dynamic Characteristics of Refrigerant Evaporation Temperature in Air-Water Heat Source Heat Pump. Appl. Therm. Eng. 2024, 247, 123128. [Google Scholar] [CrossRef]


| Equipment Name | Formula |
|---|---|
| Compressor [33,34] | |
| Gas coolers [35,36] | |
| Evaporator [37,38] | |
| Electronic expansion valve [34] | |
| Gas–liquid separator [39] |
| Measured Variable | Device | Measure Variable | Accuracy |
|---|---|---|---|
| Temperature | RTD sensors | −200~350 °C | ±0.3 °C |
| Pressure | Pressure sensors | 0~16 MPa | ±0.25% |
| Water flow rate | Flowmeter | 0~6 m3·h−1 | ±0.5% |
| CO2 volume flow | Flowmeter | 0~2.3 m3·h−1 | ±0.5% |
| Power consumption | Three-phase electrical parameter comprehensive measuring instrument (AN7931A, Qingdao Aino Electronic Instrument Co., Qingdao, China) | 0~55 kW | ±0.1% |
Disclaimer/Publisher’s Note: The statements, opinions and data contained in all publications are solely those of the individual author(s) and contributor(s) and not of MDPI and/or the editor(s). MDPI and/or the editor(s) disclaim responsibility for any injury to people or property resulting from any ideas, methods, instructions or products referred to in the content. |
© 2025 by the authors. Licensee MDPI, Basel, Switzerland. This article is an open access article distributed under the terms and conditions of the Creative Commons Attribution (CC BY) license (https://creativecommons.org/licenses/by/4.0/).
Share and Cite
Zhu, D.; Fang, C.; Wang, S.; Xue, Y.; Jiang, L.; Song, Y.; Cao, F. Comprehensive Performance and Economic Analyses of Transcritical CO2 Heat Pump Water Heater Suitable for Petroleum Processes and Heating Applications. Energies 2025, 18, 3070. https://doi.org/10.3390/en18123070
Zhu D, Fang C, Wang S, Xue Y, Jiang L, Song Y, Cao F. Comprehensive Performance and Economic Analyses of Transcritical CO2 Heat Pump Water Heater Suitable for Petroleum Processes and Heating Applications. Energies. 2025; 18(12):3070. https://doi.org/10.3390/en18123070
Chicago/Turabian StyleZhu, Dongxue, Chaohe Fang, Shejiao Wang, Yafei Xue, Liaoliang Jiang, Yulong Song, and Feng Cao. 2025. "Comprehensive Performance and Economic Analyses of Transcritical CO2 Heat Pump Water Heater Suitable for Petroleum Processes and Heating Applications" Energies 18, no. 12: 3070. https://doi.org/10.3390/en18123070
APA StyleZhu, D., Fang, C., Wang, S., Xue, Y., Jiang, L., Song, Y., & Cao, F. (2025). Comprehensive Performance and Economic Analyses of Transcritical CO2 Heat Pump Water Heater Suitable for Petroleum Processes and Heating Applications. Energies, 18(12), 3070. https://doi.org/10.3390/en18123070