Article

Optimization of Volumetric Fracturing Stages and Clusters in Continental Shale Oil Reservoirs Based on Geology-Engineering Integration

1
School of Mechanical Science and Engineering, Northeast Petroleum University, Daqing 163318, China
2
Oil Production Engineering Research Institute in Daqing Oilfield Co., Ltd., Daqing 163318, China
*
Author to whom correspondence should be addressed.
Energies 2025, 18(12), 3066; https://doi.org/10.3390/en18123066
Submission received: 24 April 2025 / Revised: 30 May 2025 / Accepted: 2 June 2025 / Published: 10 June 2025

Abstract

The exploration and development of shale oil offers significant potential as an alternative to address oil and gas supply. The complex geological conditions characterized by inter-lithology and strong heterogeneity pose substantial challenges in fracturing reconstruction. This paper established an integrated geoengineering model of Gulong shale in the Songliao Basin using multi-source data to accurately characterize the vertical and lateral heterogeneity of the reservoir. Based on the reconstruction economy, the compressibility evaluation of different reservoirs showed that the advantage of reconstruction was highest in the Q9 reservoir and lowest in the Q3 reservoir. Analysis of the fluctuation in the reservoir compressibility and lithology characteristics revealed limited fracture reconstruction volume in highly plastic reservoirs with elevated mudstone concentrations, which affected reconstruction efficacy. The number of clusters could be increased while the spacing between the clusters could be reduced in the lithologically brittle region. In areas characterized by strong lithology and plasticity, the number of clusters was appropriately decreased while the inter-cluster spacing increased. The research results allow local adjustments according to the logging curve, inform differentiated decisions on fracturing reconstruction, and support the efficient fracturing reconstruction of the Gulong shale oil reservoir.

1. Introduction

The efficient development of unconventional oil and gas resources is conducive to alleviating the energy crisis [1,2]. China’s recoverable shale oil resources rank first in the world, offering significant exploration and development potential. Many new discoveries in various basins in recent years have led to the establishment of three national continental shale oil demonstration zones, including Gulong shale in the Songliao Basin [3,4]. However, the geological conditions of continental shale oil, exemplified by Daqing Gulong shale, are complex and entail substantial development costs [5,6]. Therefore, it is imperative to enhance research on the essential core technologies of continental shale oil to improve oil and gas supply capacity.
Staged horizontal-well multi-cluster volume fracturing technology is essential for advancing shale oil development. Terrestrial shale oil reservoirs are generally characterized by high clay content, complex, diverse lithology, and strong heterogeneous distribution, resulting in notable issues such as poor reservoir reconstruction and unsatisfactory hydraulic fracturing yield [7,8]. The unique mechanical properties dictate that its development cannot simply replicate the existing fracturing technology. Therefore, many studies have focused on the heterogeneous mechanical characteristics and optimization of fracturing stage clusters. Core precision mapping indicates extreme horizontal fracture development in the Gulong shale of the Songliao Basin, featuring hundreds to thousands of fractures per meter, alongside the simultaneous development of multiple laminae, resulting in a highly complex fracture morphology in the near-wellbore areas [9,10]. The layered structure of shale results in significant anisotropy in its mechanical properties, which is mainly affected by the density and strength of the bedding. Since the mechanical properties of shale differ substantially along the parallel and vertical bedding plane [11,12], most researchers currently simplify the analysis by treating it as a transverse isotropic material; micro-detailed studies on the laboratory level have also been carried out [13,14]. Accurately characterizing continental shale reservoirs remains challenging due to field-scale multi-lithology and high-frequency interaction [15,16,17,18,19,20].
Physical model experiments and numerical simulation methods are used to examine the optimization of fracture clusters and the balanced propagation of multi-cluster cracks [21,22]. Due to the complex process, protracted duration, and substantial cost of conventional physical model experiments, as well as the inability to obtain the temporal and spatial variations in the mechanical field output [23,24,25,26], acoustic or optical monitoring techniques are usually required to determine crack propagation behavior [27,28,29,30,31], rendering detailed mechanical analysis challenging. Current numerical simulation methods include displacement discontinuity and finite element techniques [32,33,34]. Stress interference between fractures results in ineffective perforating clusters during the multi-cluster fracturing process in horizontal wells, with the spacing and number of perforation clusters representing the primary influencing factors [35,36]. The principle of limiting flow facilitates the balanced expansion of multiple fractures, promoting a cohesive cutting and fracturing process [37,38]. However, most existing studies assume that the reservoir is homogeneous or a simplified interlayer type [39,40], making it challenging to account for the significant heterogeneity in the reservoir. This is unsuitable for continental shale oil reservoirs, which leads to a continuous increase in fracturing costs, and the scale of fracture creation fails to meet expectations, necessitating the exploration of alternative research methodologies.
The current exploration and development of unconventional oil and gas resources has demonstrated the significance of integrating geology and engineering strategies to enhance production, consequently optimizing resource utilization and the associated economic benefits. It is a new technology in the field of geological research and is widely used [41,42,43,44,45,46,47]. A comprehensive, collaborative geological model is established by integrating multi-source data from seismic detection, drilling, fracturing, and flowback. This model incorporates multi-dimensional attributes such as structural characteristics, mechanical properties, fracture systems, and ground stress distribution to construct an integrated geological engineering platform that offers decision support for various stages of the development process and allows for the flexible adjustment of construction parameters according to actual conditions. Research is focusing on optimizing fracturing stage clusters via the geoengineered integration of continental shale oil reservoirs to promote efficient development.
This paper establishes an integrated geology-engineering model of Gulong shale using multi-source data to achieve vertical and lateral reservoir heterogeneity. The accuracy of the model is verified by comparing it with practical field applications. The compressibility is assessed by analyzing the economic viability of different oil reservoir reconstructions, while the design of the staged multi-cluster fractures at different intervals is optimized to facilitate fracturing reconstruction variability in different geological conditions. It provides support for the efficient fracturing reconstruction of Gulong shale oil reservoirs.

2. Establishment of the Integrated Geology-Engineering Model of the Gulong Shale
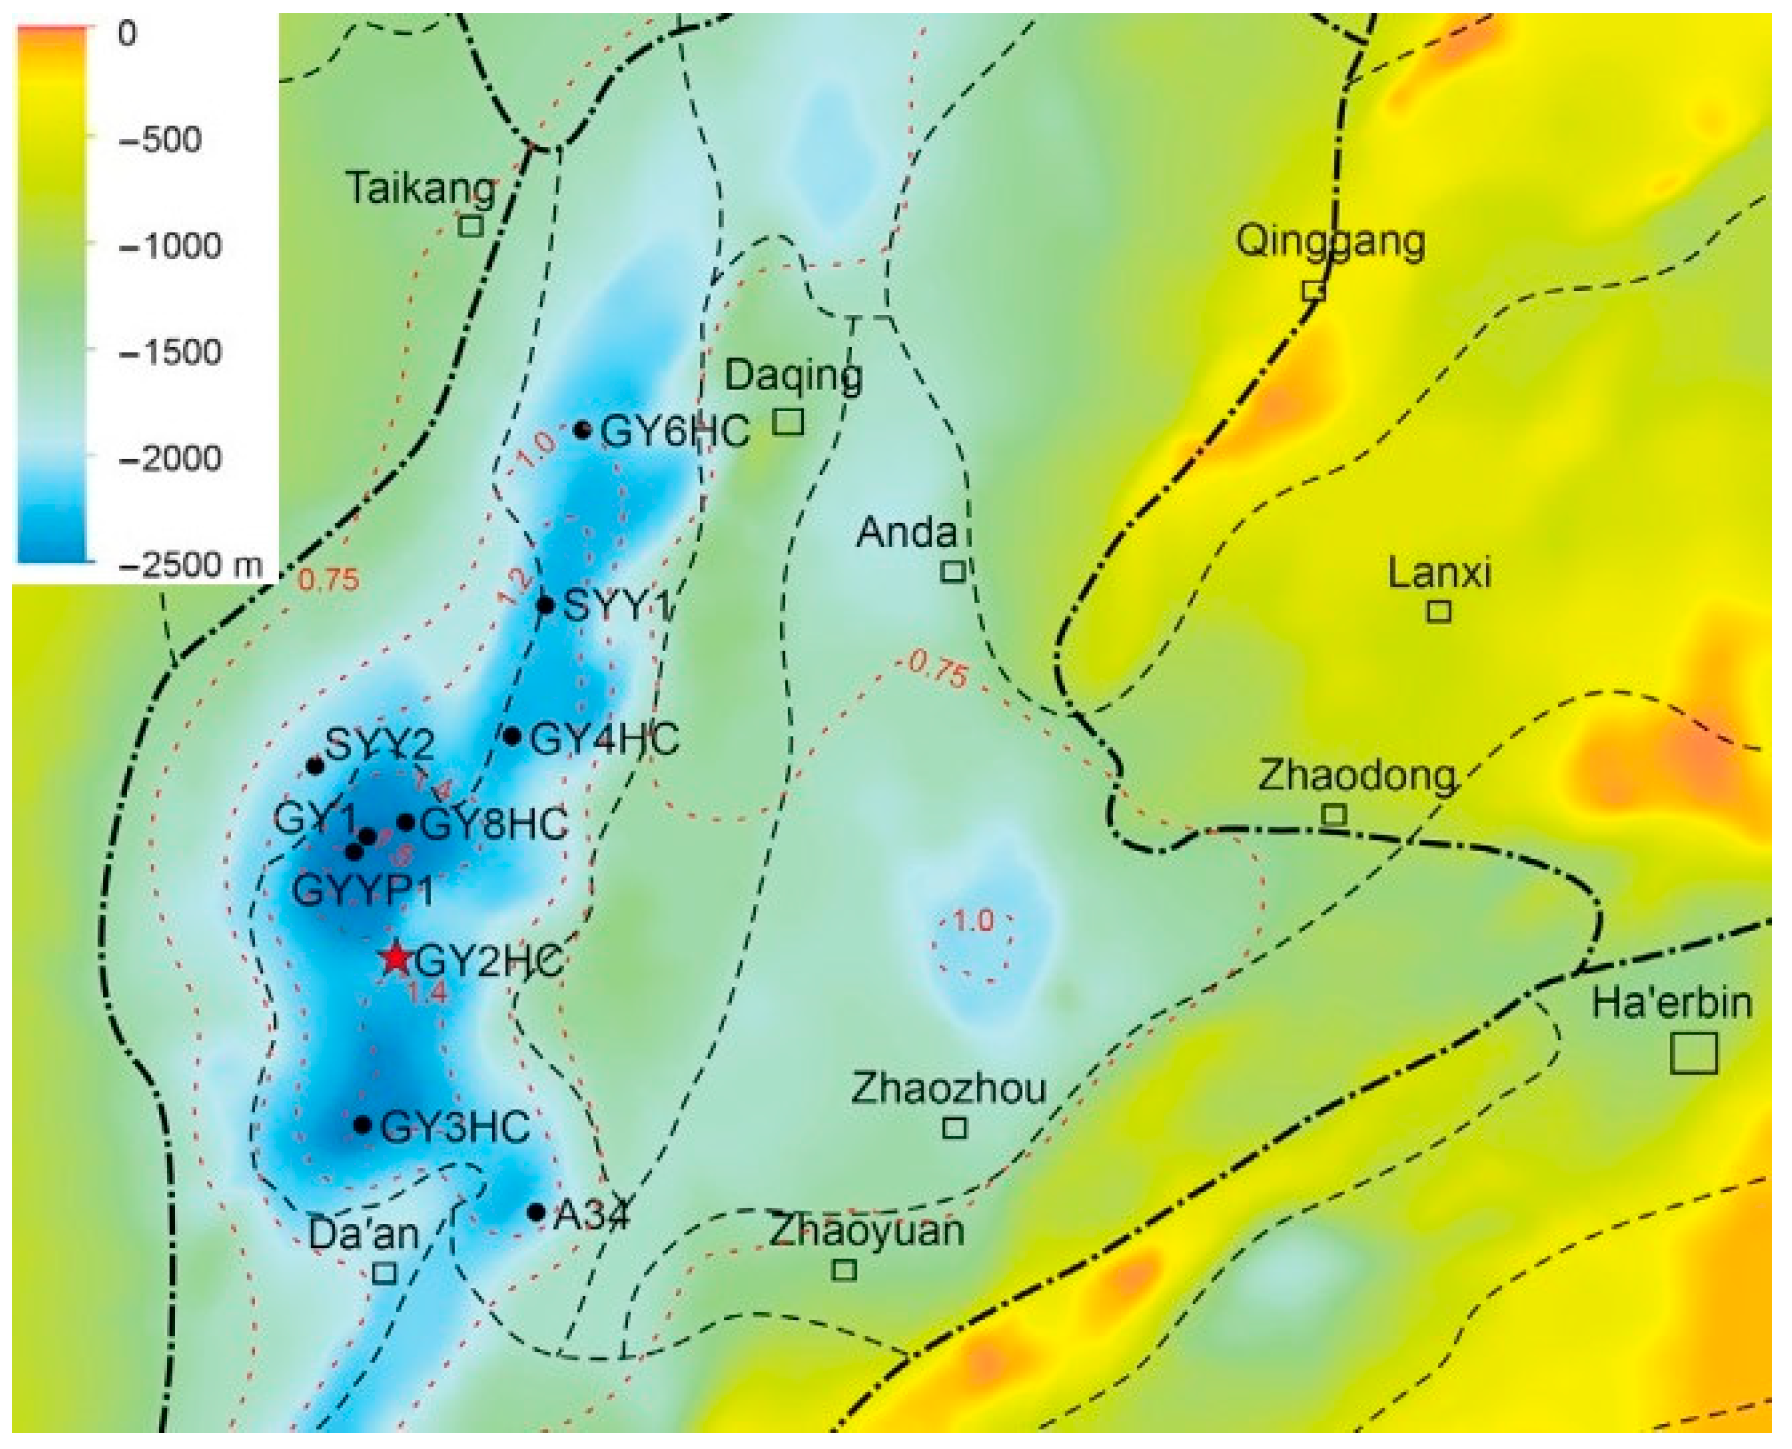
2.1. Study Area

The research block is located in the Paleosyncline zone within the second-order structural belt of the Qijia-Gulong Depression in the northern part of the Songliao Basin, as shown in Figure 1. The block has a monoclinal structural formation to the east. The formation mechanism is mainly controlled by the uneven uplift and subsidence of the crust during the tectonic movement. Under the control of the regional tectonic stress field, the reservoir acquires a certain degree of stratification, facilitating the lateral migration and accumulation of oil, gas, or fluids. The region comprises three principal formations: the northern fault, the western fault, and the eastern fault, and is densely interspersed with natural fractures. The heterogeneity and complexity of the reservoir have been improved. Shale oil was mainly present in the first and second members of the Qingshankou Formation, with east–west and north–south lengths of 4400 m and 6900 m, respectively, burial depths between 2400 m and 2540 m, porosity values of 6% to 10%, matrix permeabilities of 0.01 mD to 1 mD, and an average stress difference of 2.4 MPa (between vertical and horizontal). The reservoir layer was divided into nine sets (Q1–Q9) from bottom to top, comprising medium and high maturity [7,8,9].

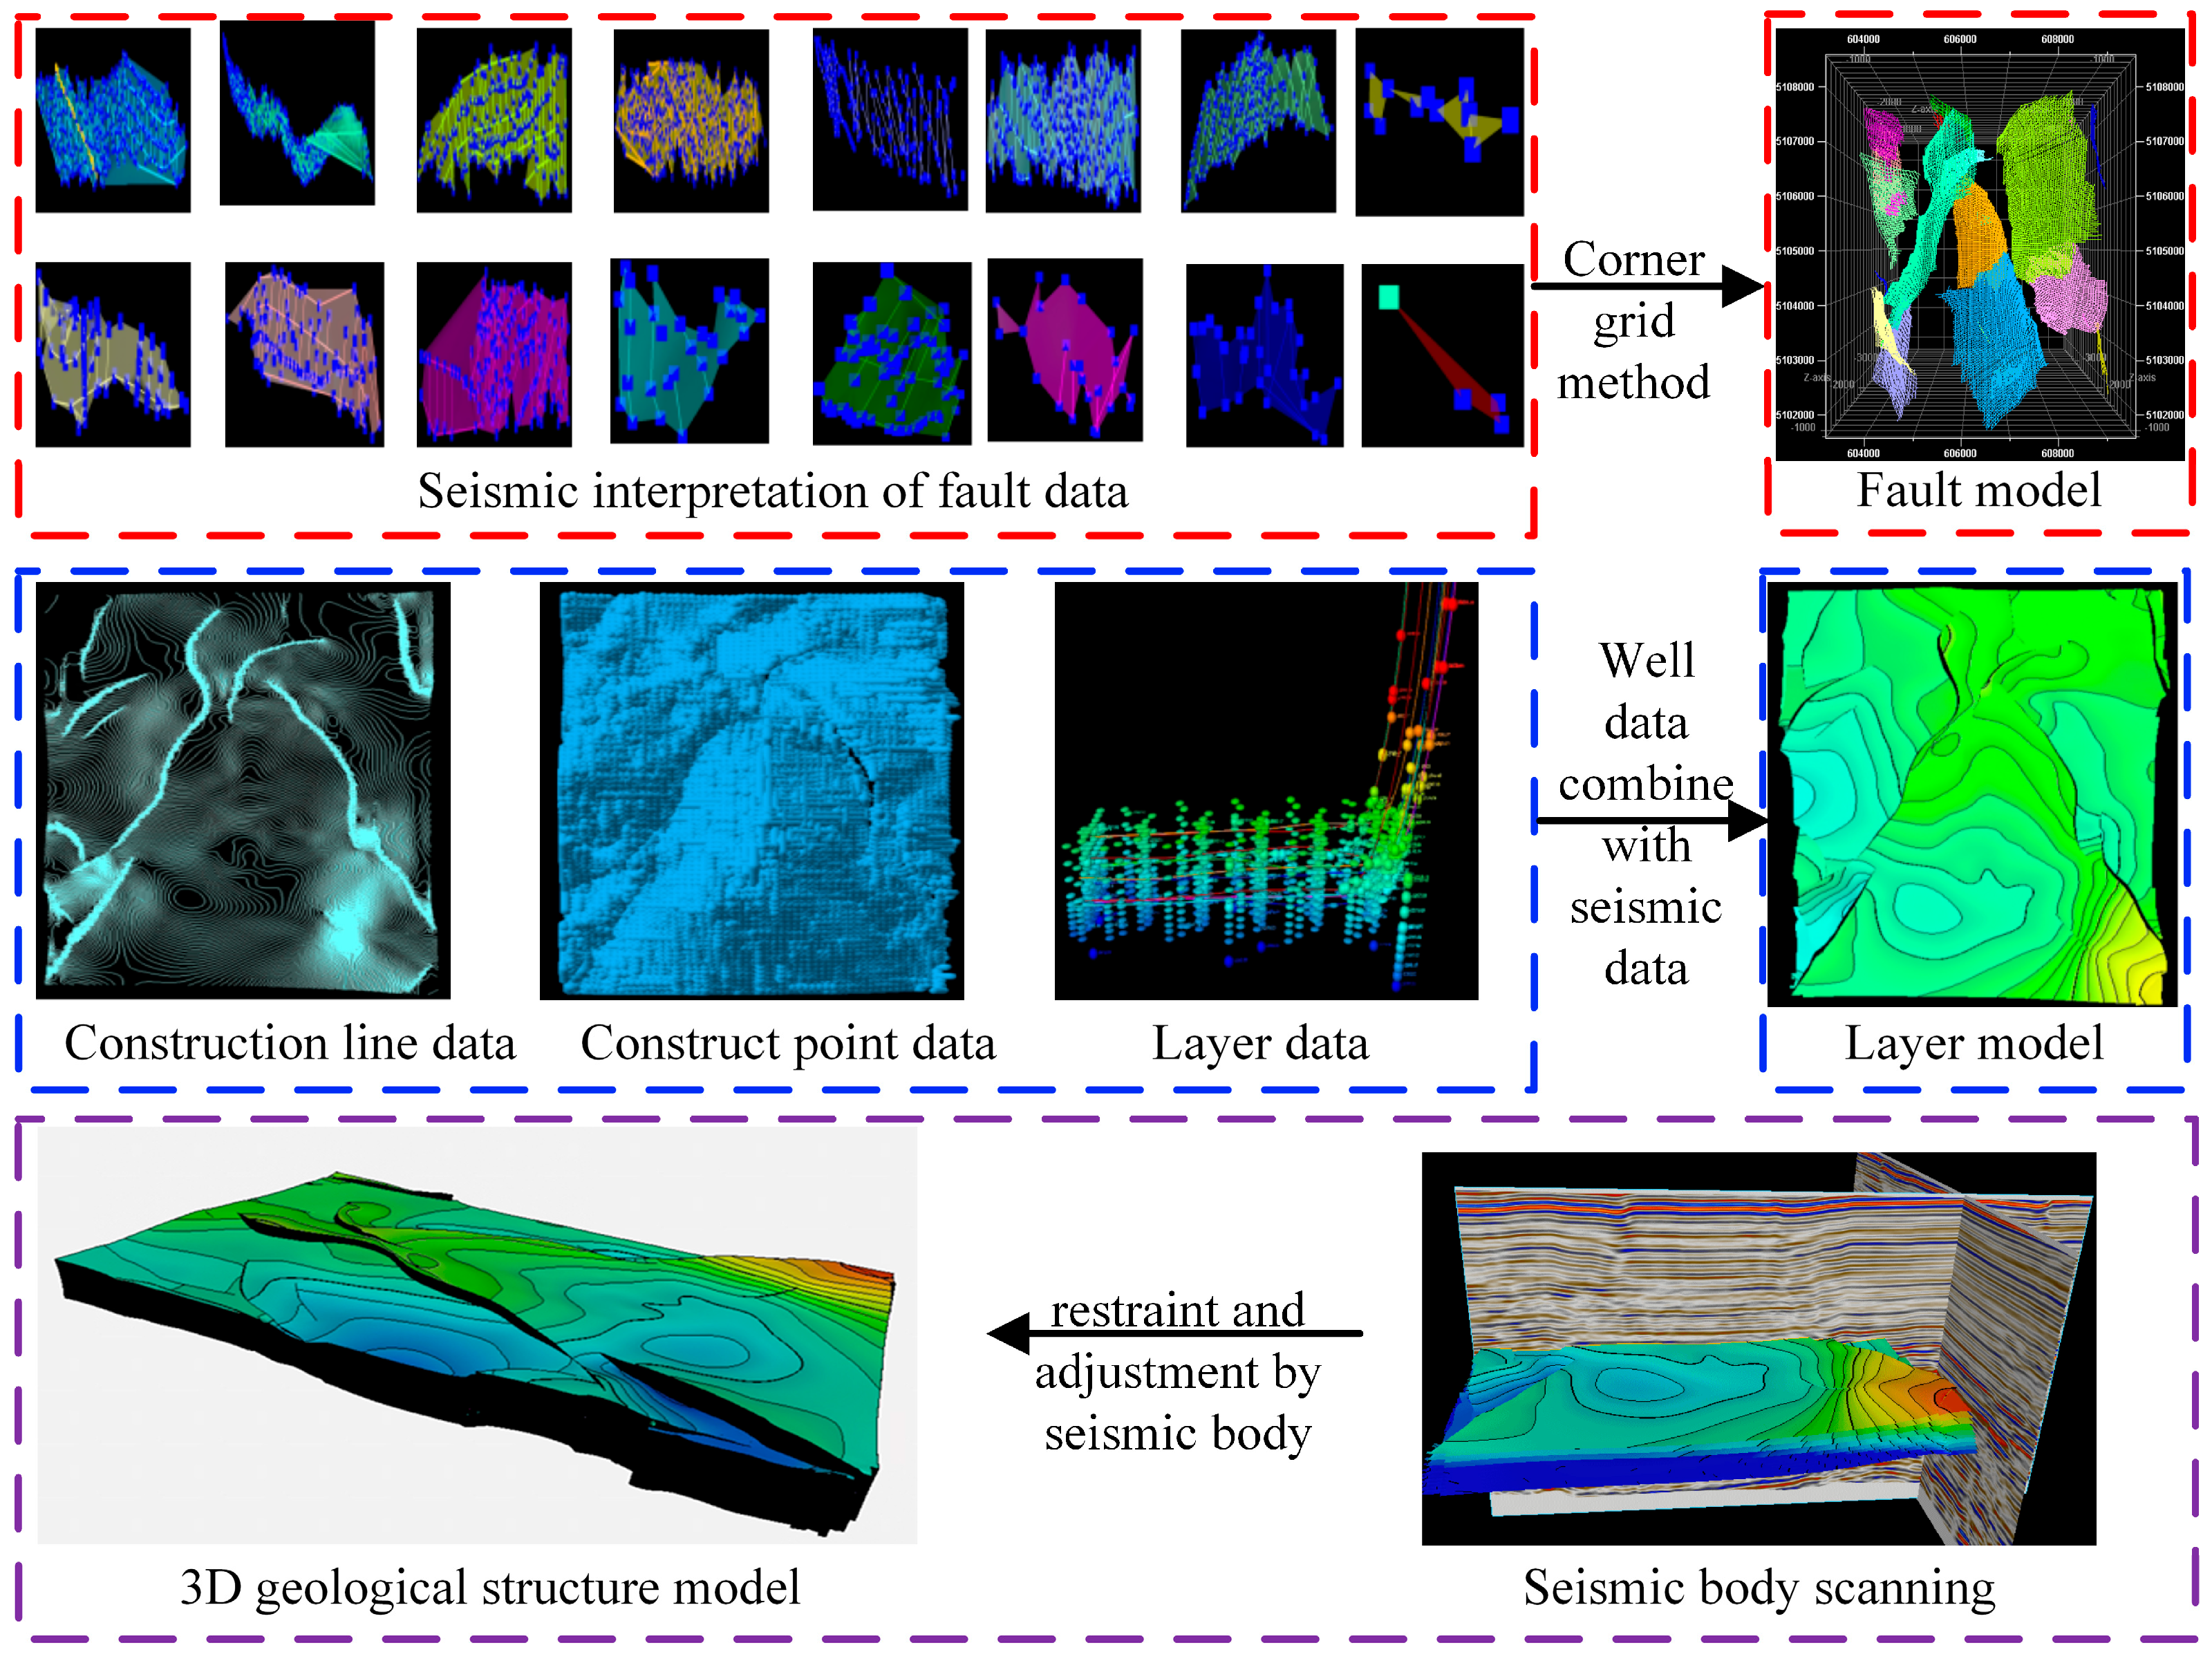
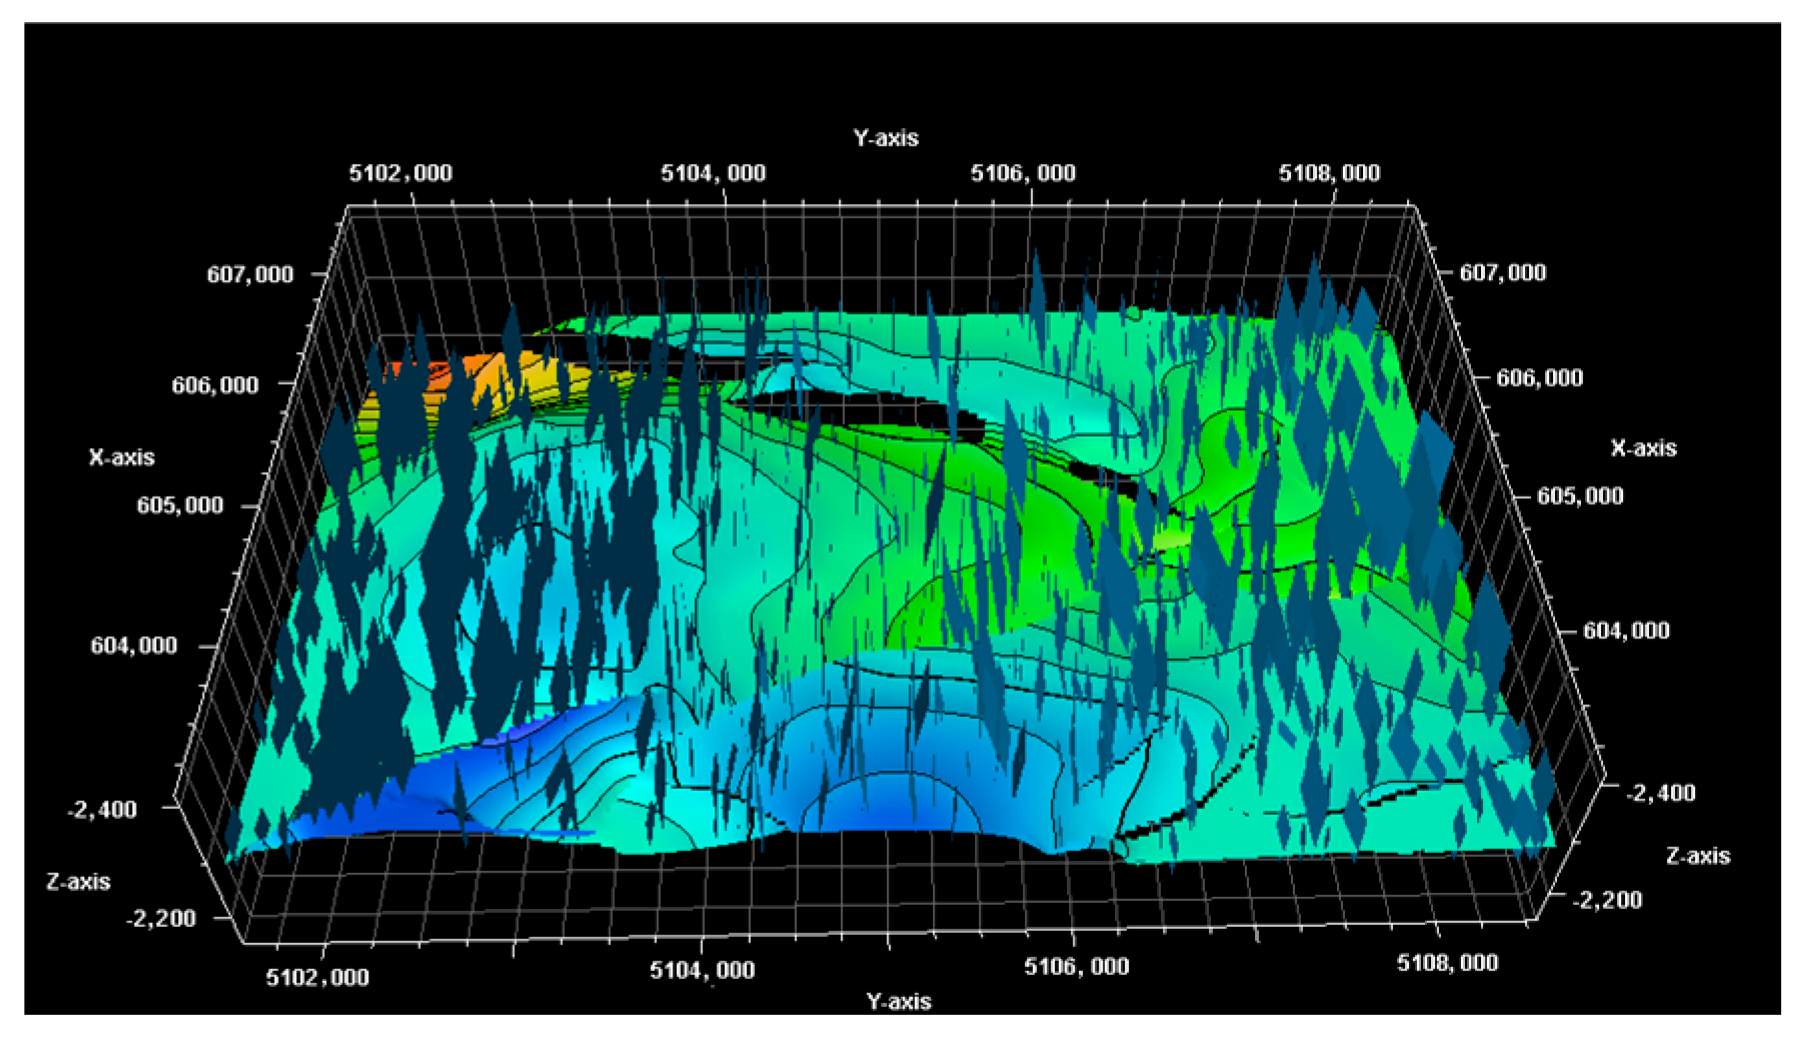
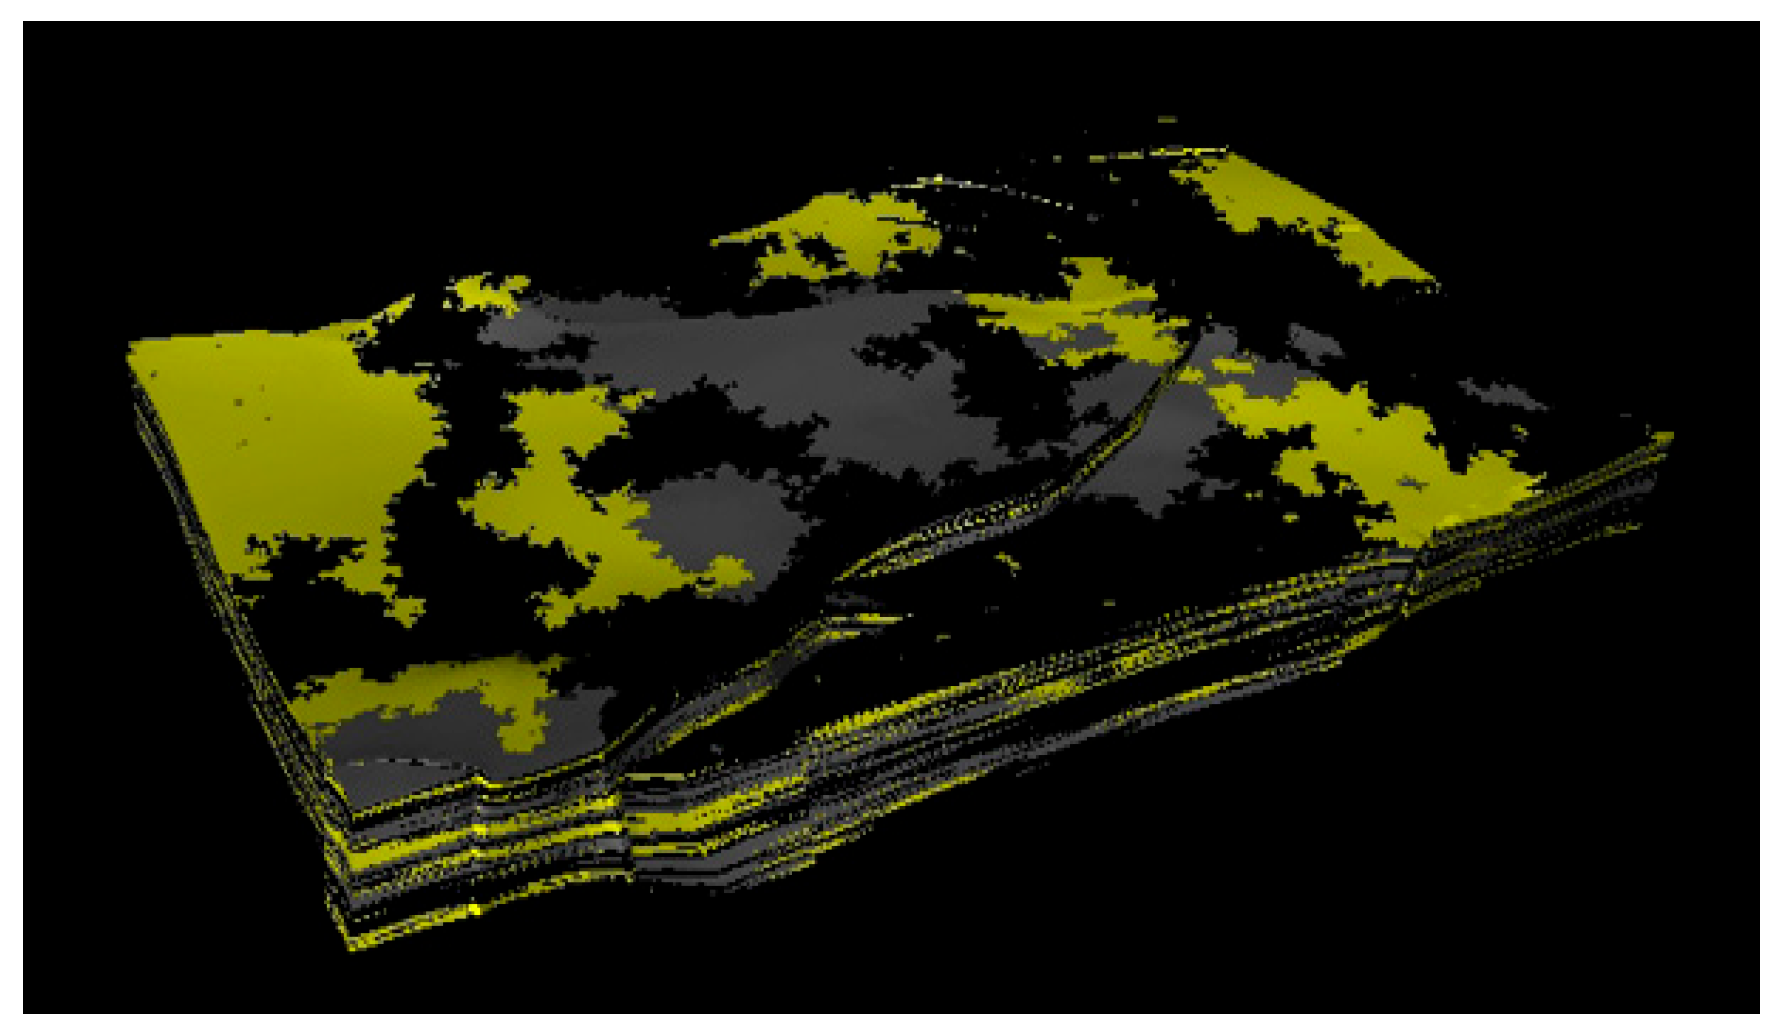
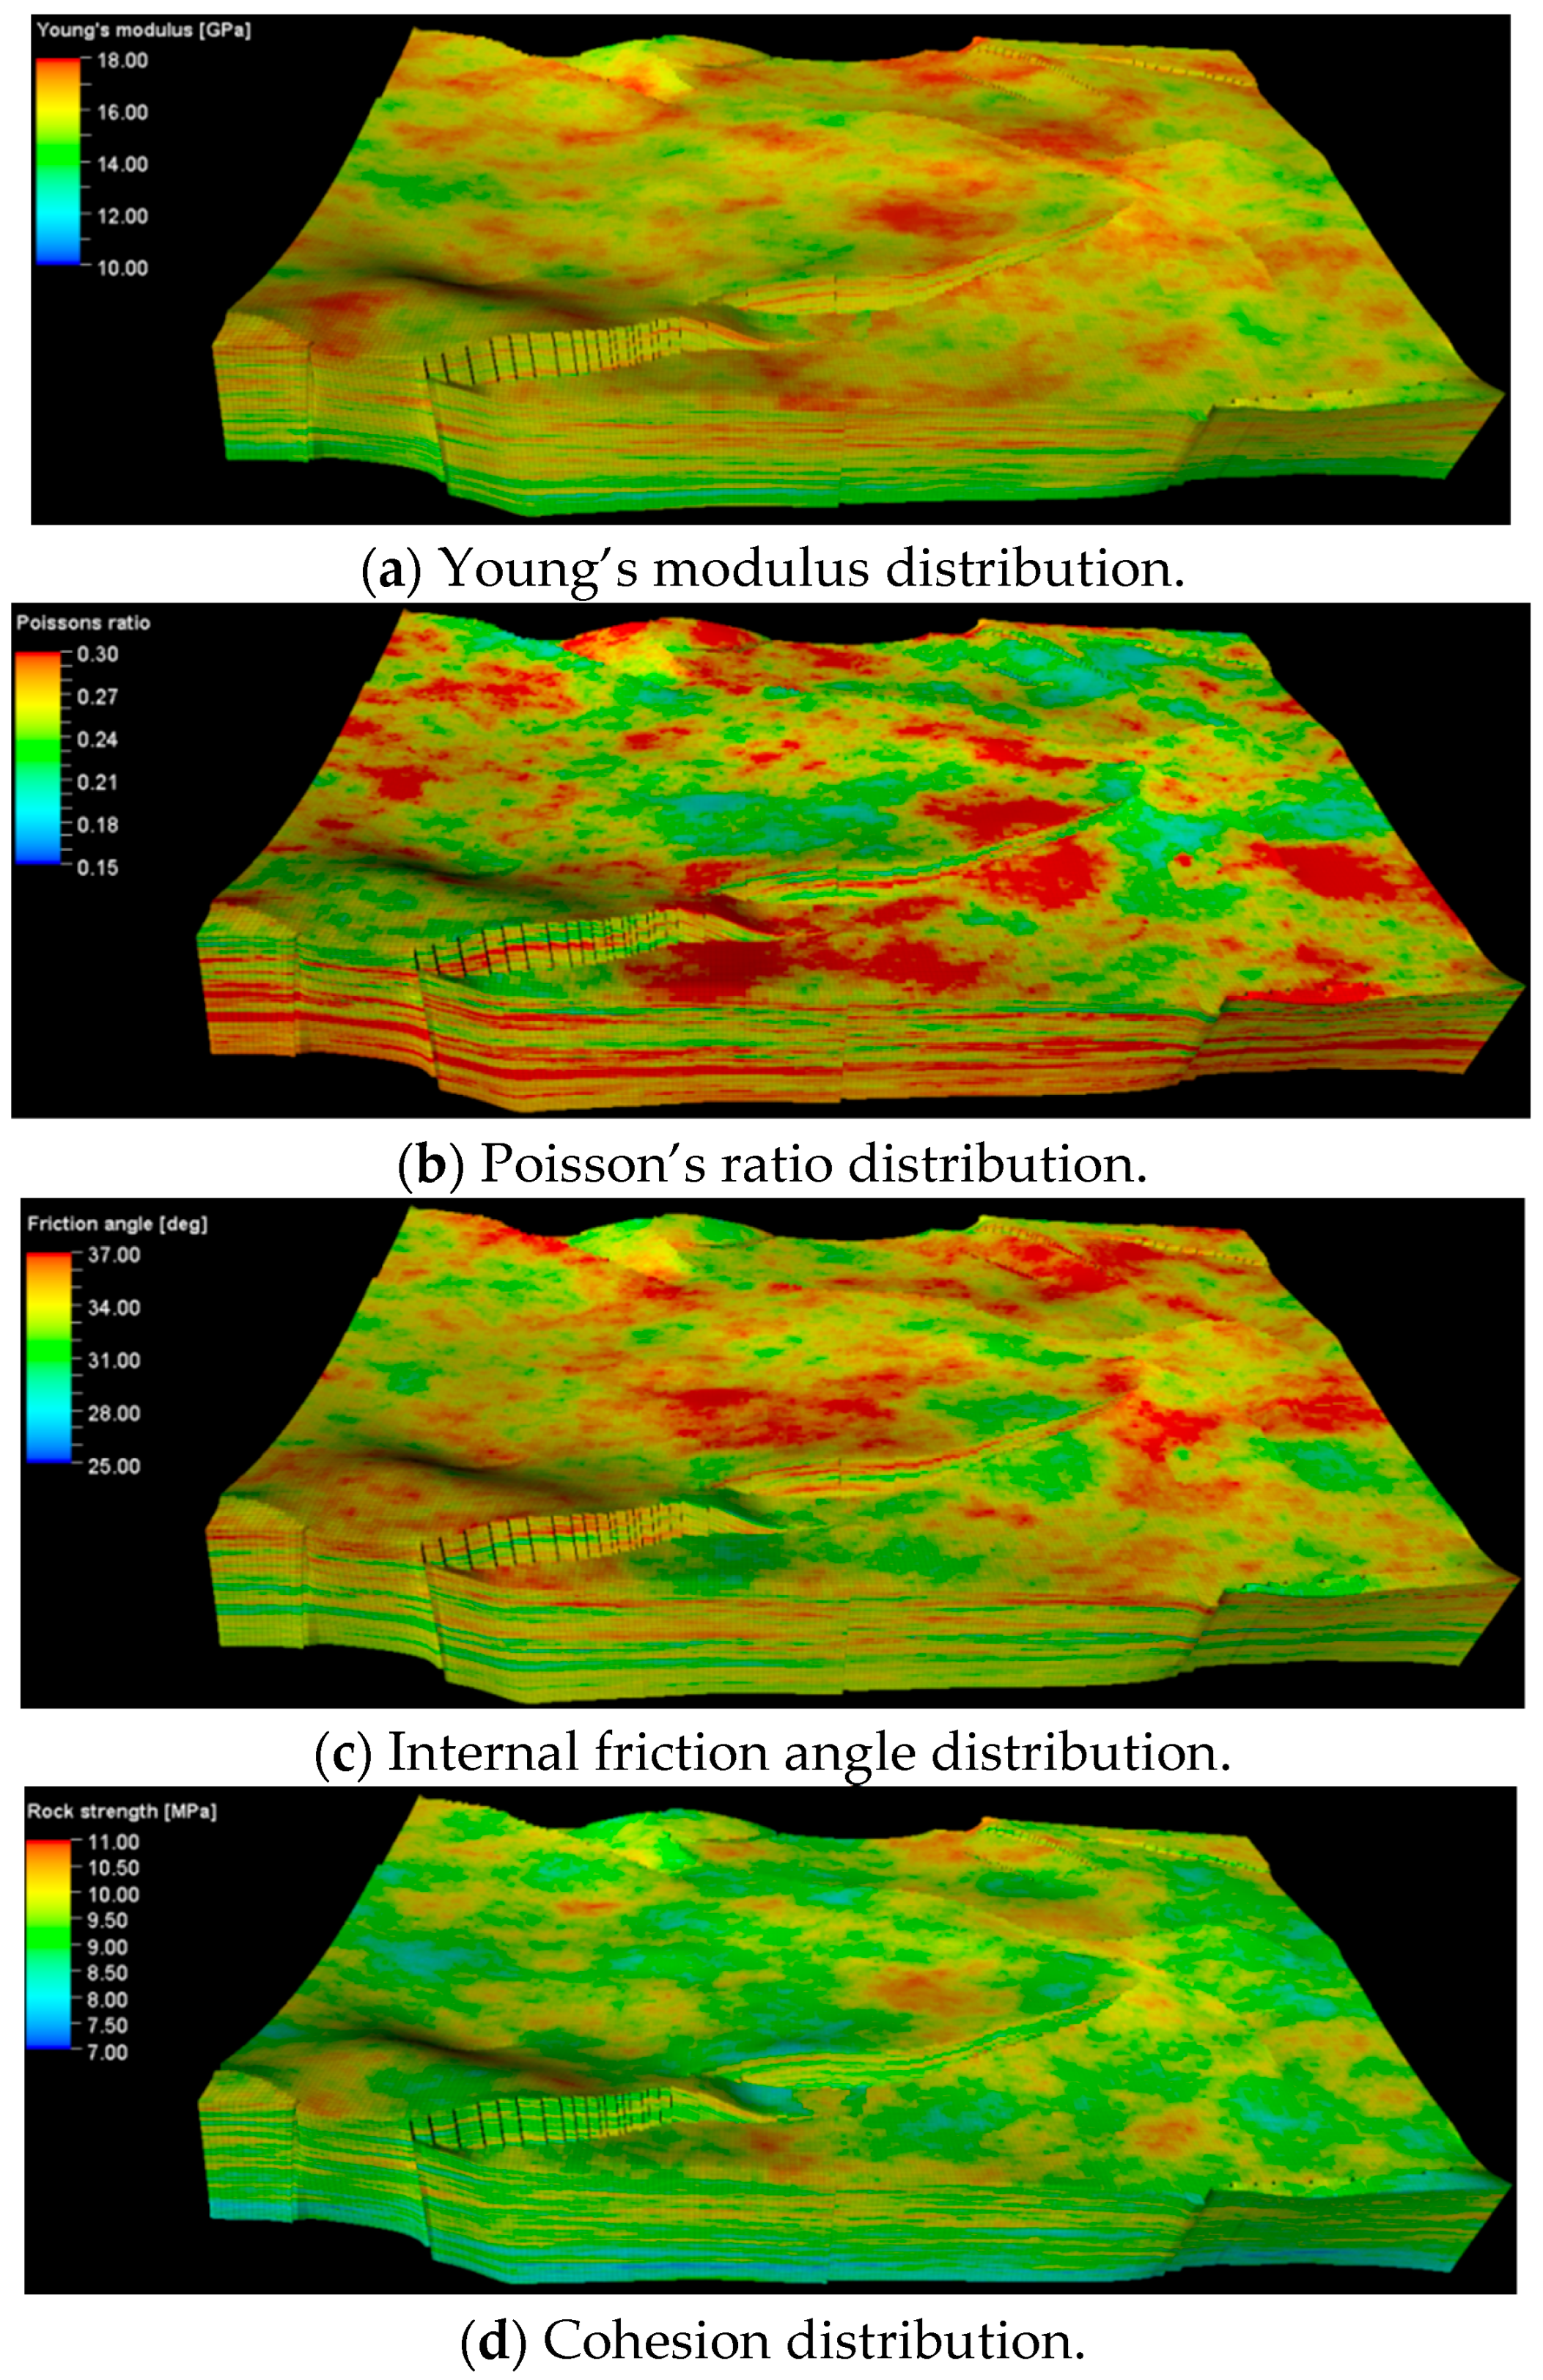
2.2. Establishment of Geology-Engineering Integration

Three-dimensional reservoir geological modeling integrates multi-source data information, including seismic data, logging data, and geological interpretation results. Firstly, data preprocessing is carried out. Unified coordinate transformation and standardization processing are performed on the data from different sources to eliminate the differences between the time domain and the depth domain and ensure the consistency of spatial positions. The collaborative Kriging interpolation method is adopted to achieve the collaborative constraints of multi-source data and improve the resolution of reservoir attribute modeling. The model reflects the actual situation of an underground reservoir, which has the advantages of improving spatial resolution, enhancing prediction ability, and improving decision quality. The stochastic modeling method focuses on the analysis of known well point data, combined with the geological statistical characteristics characterized by the variation function, and simulates the unknown reservoir space between Wells by random simulation algorithm. Based on the sequential Gaussian algorithm, logging data are used to reflect the lithology and physical property changes in the reservoir, including curves such as gamma, density, and porosity. Seismic inversion attribute bodies are adopted to guide the lateral trend. The structural model includes geometric boundary information such as faults and layers as hard constraints for simulating the spatial range. By establishing a statistical model of the attribute space, the attribute values are simulated point by point according to the random path. At each step, the conditional distribution is calculated based on the mutation function and adjacent data. During the simulation process, the trend surface constraint is introduced to control the large-scale distribution trend, especially suitable for complex areas with strong reservoir heterogeneity and discontinuous or insufficient geological data.
A sequential Gaussian simulation algorithm is a very effective technique in stochastic simulation, which is widely used to deal with data that needs to conform to Gaussian distribution or data scenarios that can be properly transformed to conform to Gaussian distribution. The core of the algorithm is to consider not only the existing sampling point data but also the spatial information around the simulated point so as to reflect the spatial distribution and correlation of variables more accurately and provide higher reliability and accuracy for the description of complex underground reservoirs. The function of variation provides the spatial dependency structure required for modeling sequential Gaussian simulations to quantify the spatial correlation and variability of variables, established by measuring the semi-variance of pairs of data points at different distances.
Sixteen basic faults were identified in the seismic interpretation of the Gulong shale target block. The corner grid method was used to precisely characterize the complex terrain and numerous faults in the study block to ensure that the grid structure accurately reflected the geological complexity. A reservoir range of 6.9 km × 4.4 km × 140 m was established, resulting in a total grid count of 37,837,800, which effectively prevented grid serration and enhanced the geological authenticity of the model. The layout of the fault model in the three-dimensional (3D) space was controlled using the spatial homing technique, which combined detailed fault polygon and well breakpoint information. Pillar gridding technology was employed to divide the work area into a precise 3D grid system, while structural lines, structural points, and stratified data were used for comprehensive seismic analysis. The geological layer model was accurately constructed using the sequential Gaussian simulation method, with seismic data serving as a crucial constraint on the trend surface, resulting in the establishment of the geological structure model for Gulong shale oil, as shown in Figure 2.
The fracture propagation in continental shale oil reservoirs was significantly affected by natural fractures and lithologic heterogeneity distribution, which directly impacted reservoir permeability and production efficiency [48,49,50]. Firstly, the key seismic attributes of the research block, including variance and chaos, are extracted to enhance the boundary characteristics and highlight the discontinuity information of cracks. Based on the ant-body tracking technology, the space radius of a single ant in a single search is set to 4 m, and the tracking trajectory deviation is set to within 15° to ensure the calculation efficiency and accuracy. Using multiple attribute fusion methods to complete the preliminary characterization of natural cracks, the ant body tracking results, as a reference, can accurately capture large cracks. Furthermore, the crack surface density modeling combined with co-kriging interpolation is used to capture tiny cracks, and the spatial distribution is estimated by using the spatial correlation between multiple variables. The fuzzy logic method is adopted to sort different seismic attribute categories, and the seismic attributes highly correlated with the crack surface density are selected and integrated into a neural network model. The best 50 predicted values of natural fracture surface density were selected for evaluation, and the accuracy of prediction was improved by arithmetic mean value; thus, the natural fracture modeling was completed, as shown in Figure 3. Sedimentary facies modeling essentially represented the core component of the lithology model. A sequential Gaussian algorithm was used to establish a sedimentary facies model for the study block after a thorough review of the acoustic and resistivity logging data. This algorithm can express the continuity and correlation of sedimentary facies in space and use the existing well data to impose fine constraints on the local area to ensure the local rationality of the modeling results. Essentially, it is a simulation method for continuous variables. When directly applied to categorical variables (such as mudstone and sandstone), it is necessary to first perform categorical coding or indicator function conversion to meet the simulation requirements, as shown in Figure 4.
Based on the sedimentary facies model, sequential Gaussian simulation technology was employed to construct a 3D reservoir model to examine physical properties, such as porosity, permeability, and saturation, as shown in Figure 5. First, the porosity model was constructed using phase-controlled sequential Gaussian simulation. The attribute data and lithologic distribution characteristics were thoroughly analyzed, enabling the accurate selection of the appropriate variation function type. The primary and secondary variation directions of the variation function were defined accordingly, after which the variational function was fitted to accurately determine values of the principal, secondary, and vertical variational ranges. The Petrel 2020 software was employed for random simulation to ensure the accuracy and reliability of the model.
The dipole acoustic logging data in the research block was utilized to evaluate the relationship between the time difference in the P-wave and S-wave. Then, conversion formulas were established for the time difference, dynamic and static Young’s moduli, and Poisson’s ratio. The seismic data of the study block and the sequential Gaussian simulation method were used to construct a 3D reservoir mechanics model to assess the distribution of Young’s modulus, Poisson’s ratio, and the tensile strength, which accurately characterized the transverse and longitudinal heterogeneity of the rock mechanics parameters of the Gulong shale reservoir, as shown in Figure 6.
The integrated geological and engineering model of Gulong shale established in this paper takes into account the heterogeneity of structure, layer, physical parameters, and mechanical parameters; has the characteristic of finely characterizing the reservoir; and has a more targeted fracturing design.

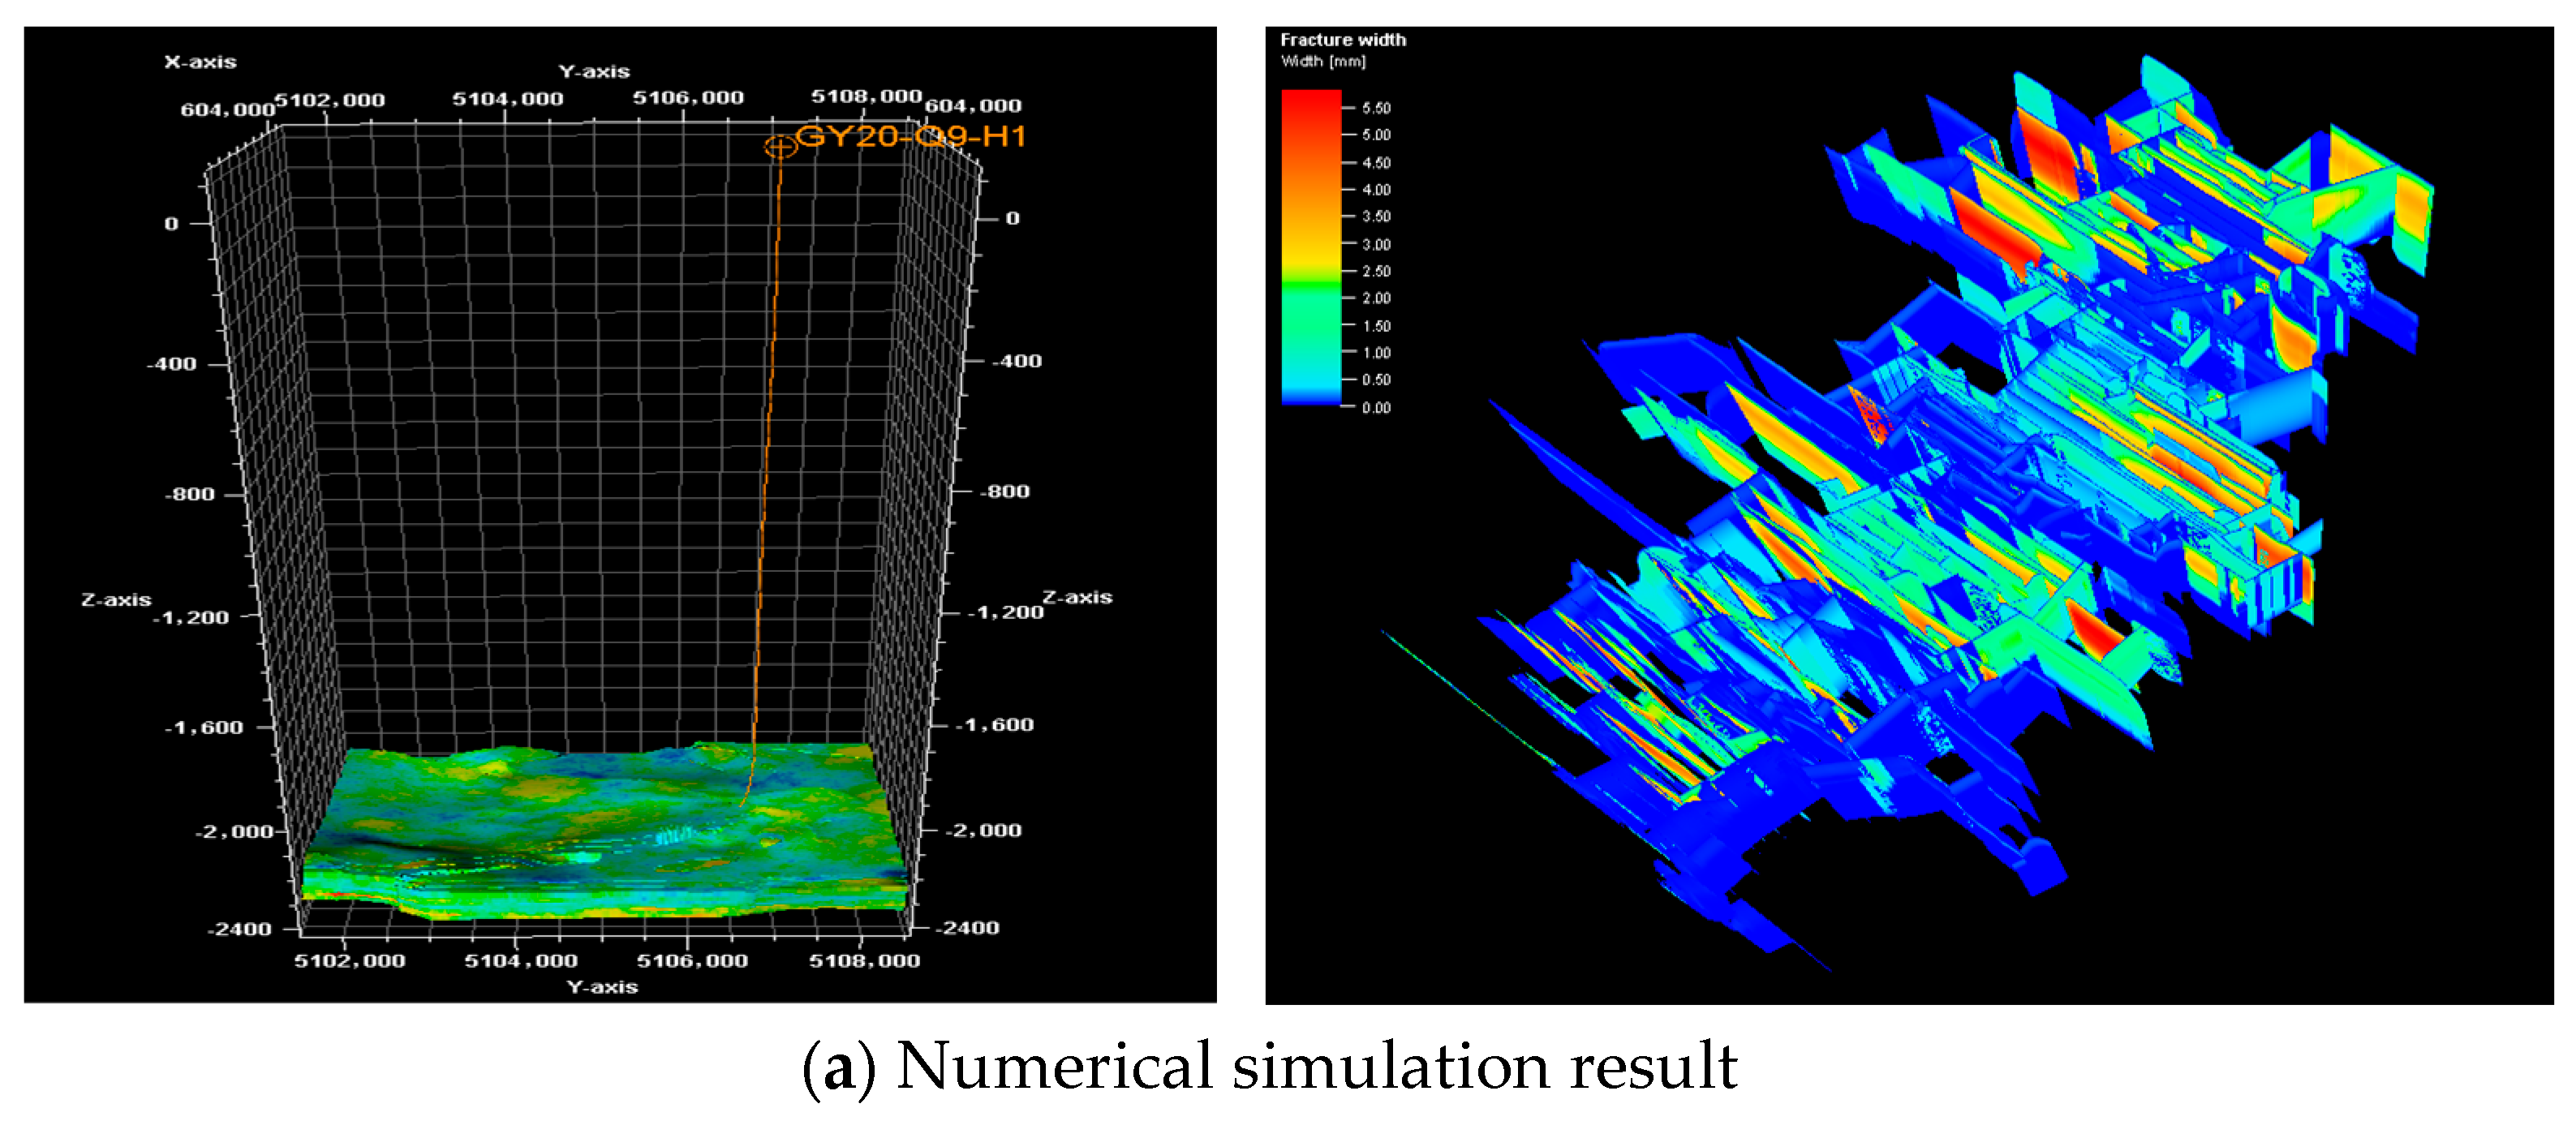
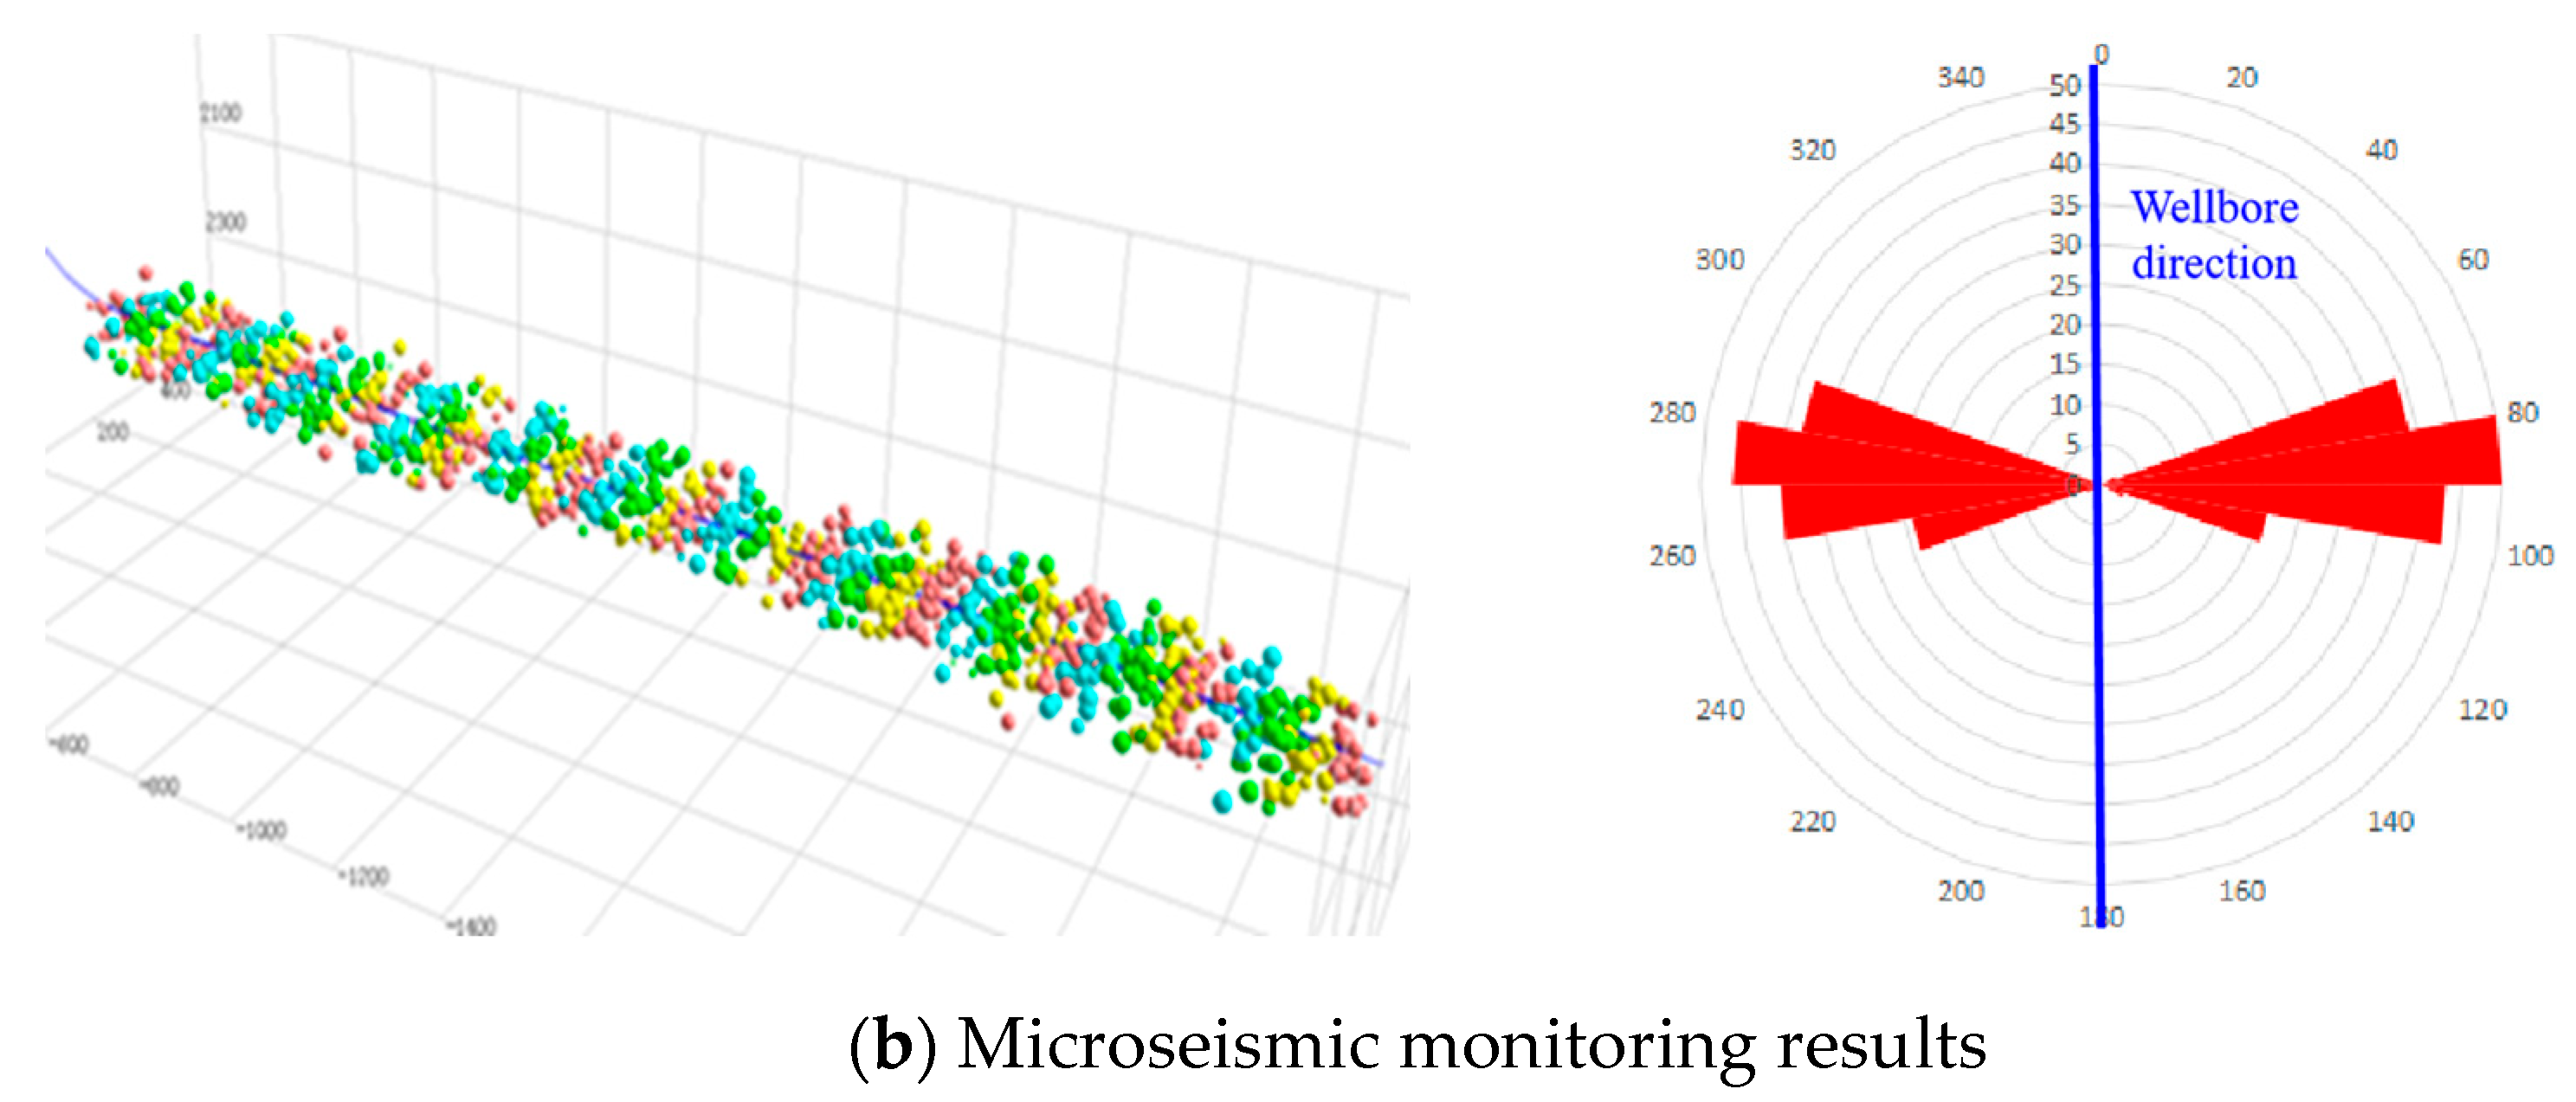
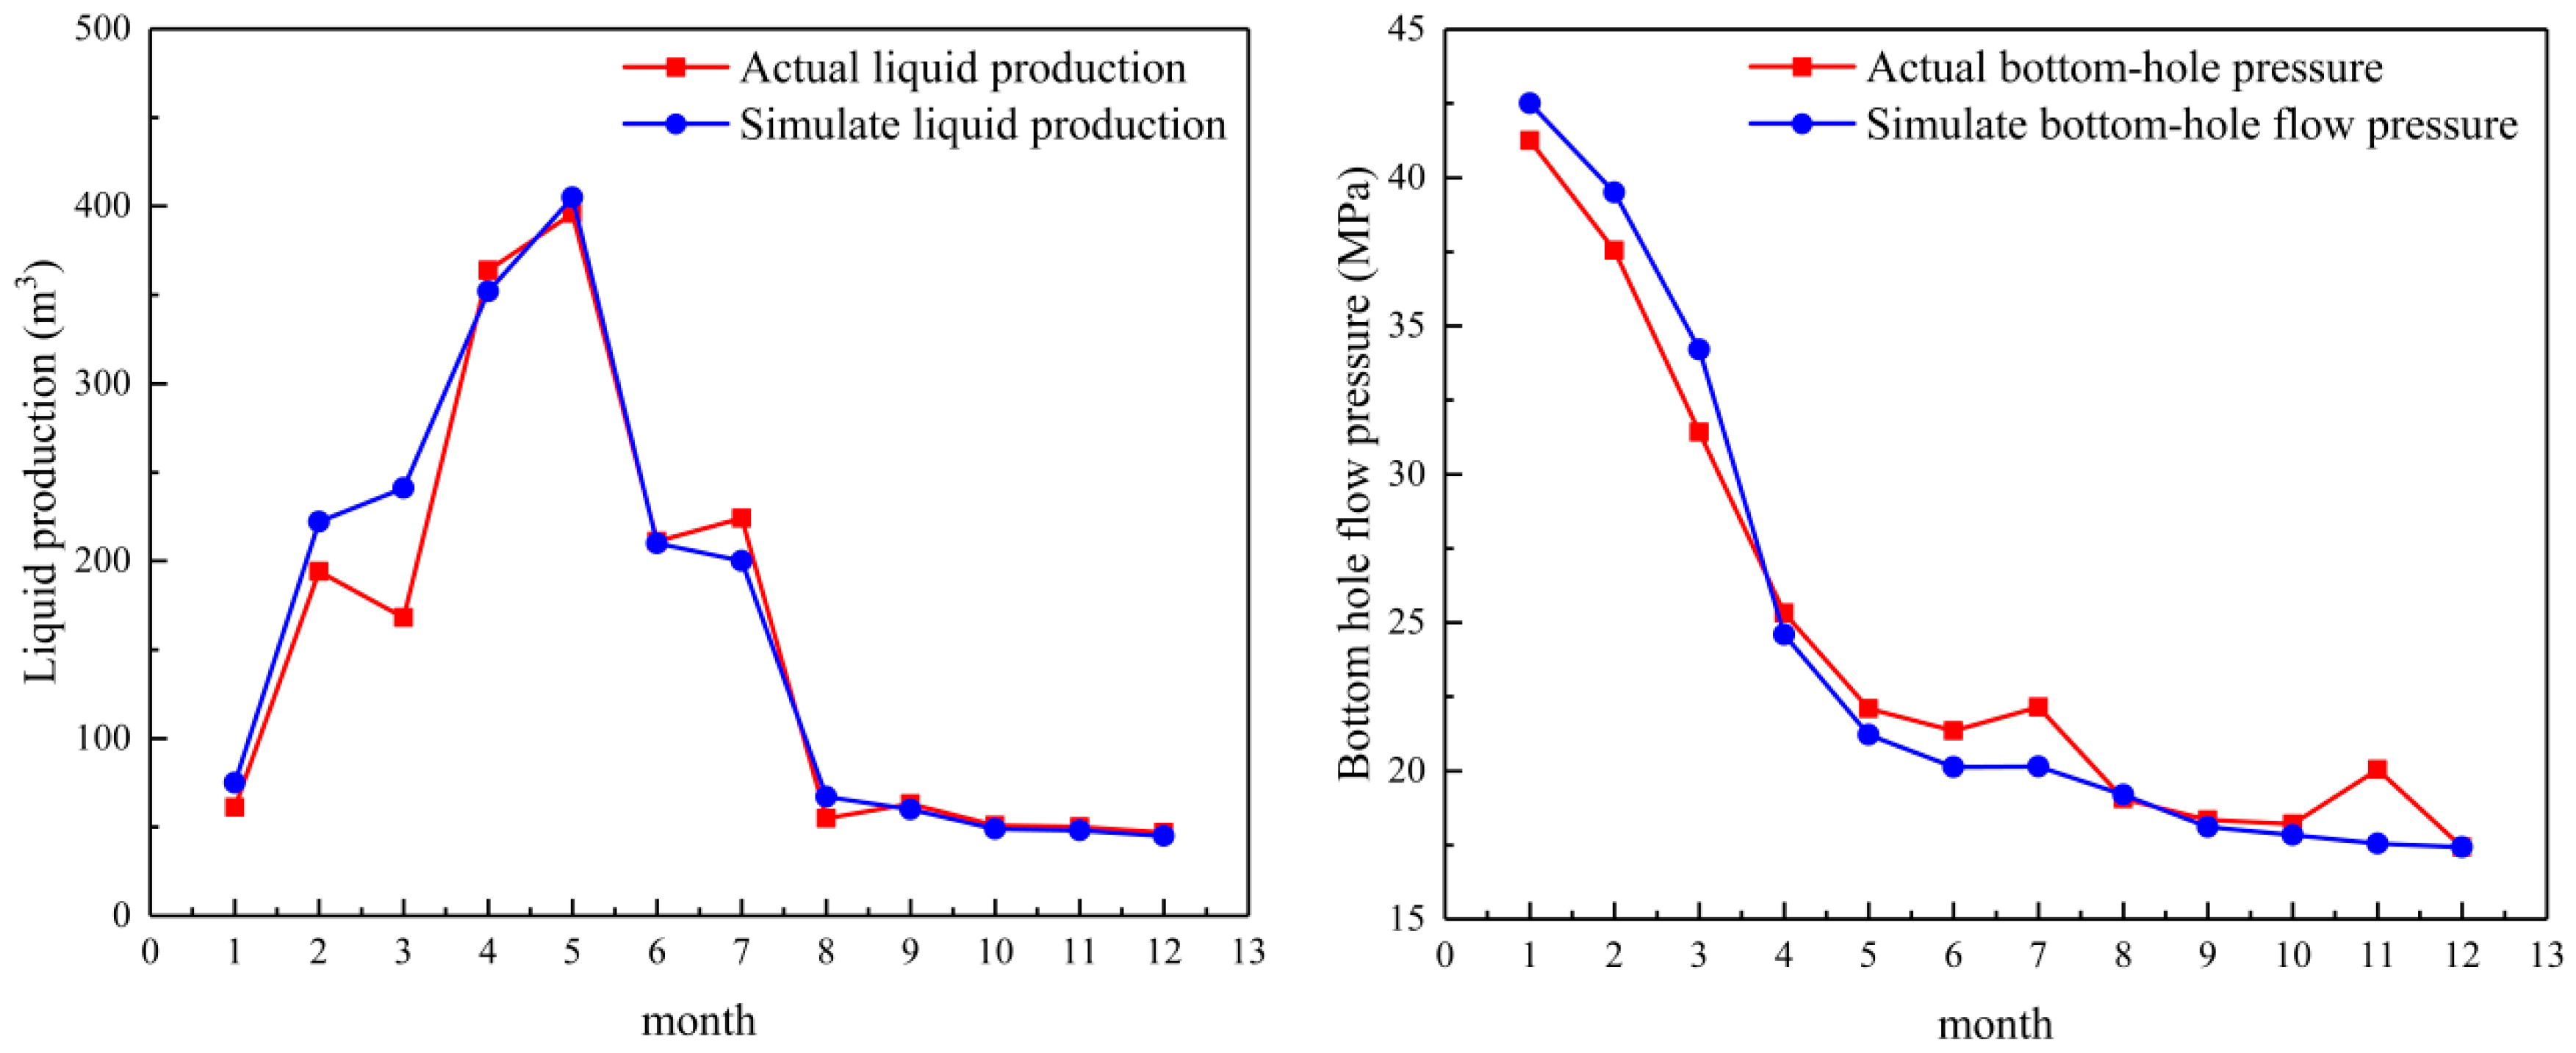
2.3. Model Verification

This paper examined horizontal well fracturing optimization using the integrated geology-engineering model of Gulong shale. Generalized Hooke’s law was used to calculate the reservoir rock deformation:
σ = C ε
where σ is the stress, MPa; C is the flexibility matrix; and ε is the strain.
For the plastic deformation that might occur when the external force of a rock exceeds the elastic limit, the Mohr–Coulomb criterion was used to describe the yield conditions and fracture behavior of the material:
τ = σ n tan φ + c
where τ is the shear stress, MPa; σn is the normal stress, MPa; φ is the angle of internal friction, °; and c is the cohesion, MPa.
The coupling effect between the fluid seepage, rock stress, and deformation should be considered during the fracturing and development of oil and gas reservoirs. The porous medium theory was adopted to describe this process:
σ eff = σ P pore
where σeff is the effective stress, MPa; σ is the total stress, MPa; and Ppore is the pore pressure, MPa.
Well (Q9-X) in the Gulong shale experimental area was selected to verify the fracturing model. The construction scheme was simulated according to the construction parameter curve provided on site, as shown in Figure 7.
The natural cracks and those resulting from fracturing interweaved to form a complex fracture network structure. The cracks were about 180 m long and 8 m high, with an opening of approximately 3 mm. Microseismic monitoring of the fracturing results of the exploratory wells in the target block indicated that the fracture network lengths ranged between 170 m and 200 m, with an average of 185 m. The fracture network heights ranged between 7 m and 10 m, with an average of 8.5 m. The azimuth of the fracture network ranged from NE73° to 100°, with an average of NE83°. The simulation results were mostly consistent with the microseismic monitoring results, which verified the accuracy of fracture morphology characterization.
The integrated geoengineering model was verified via multi-period historical fitting based on the expansion morphology of the hydraulic fractures. The historical fitting analysis was performed according to the fixed fluid production and bottomhole flow pressure. With the continuous development of oil and gas production, the amount of fluid produced in the reservoir and the bottom hole flow pressure fluctuates, and the verification of this can further explain the accuracy of the mechanical properties, seepage properties, and fracture scale of the model. The model was fitted with a one-year production history using the production data provided on site, as shown in Figure 8. The daily fluid production curve and bottomhole flow pressure derived from the model presented in this paper corresponded with the actual results. This confirmed that the model satisfied the expected requirements.
In addition, considering the heterogeneity of the reservoir layer, in order to fully illustrate the accuracy of the model, one well in different reservoir layers was selected for calculation and verification based on the data of the fractured Wells in the field. The results are summarized in Table 1. The simulation results are consistent with the actual results, which can prove the accuracy of the model.

3. Optimal Design of the Fracturing Stages and Clusters

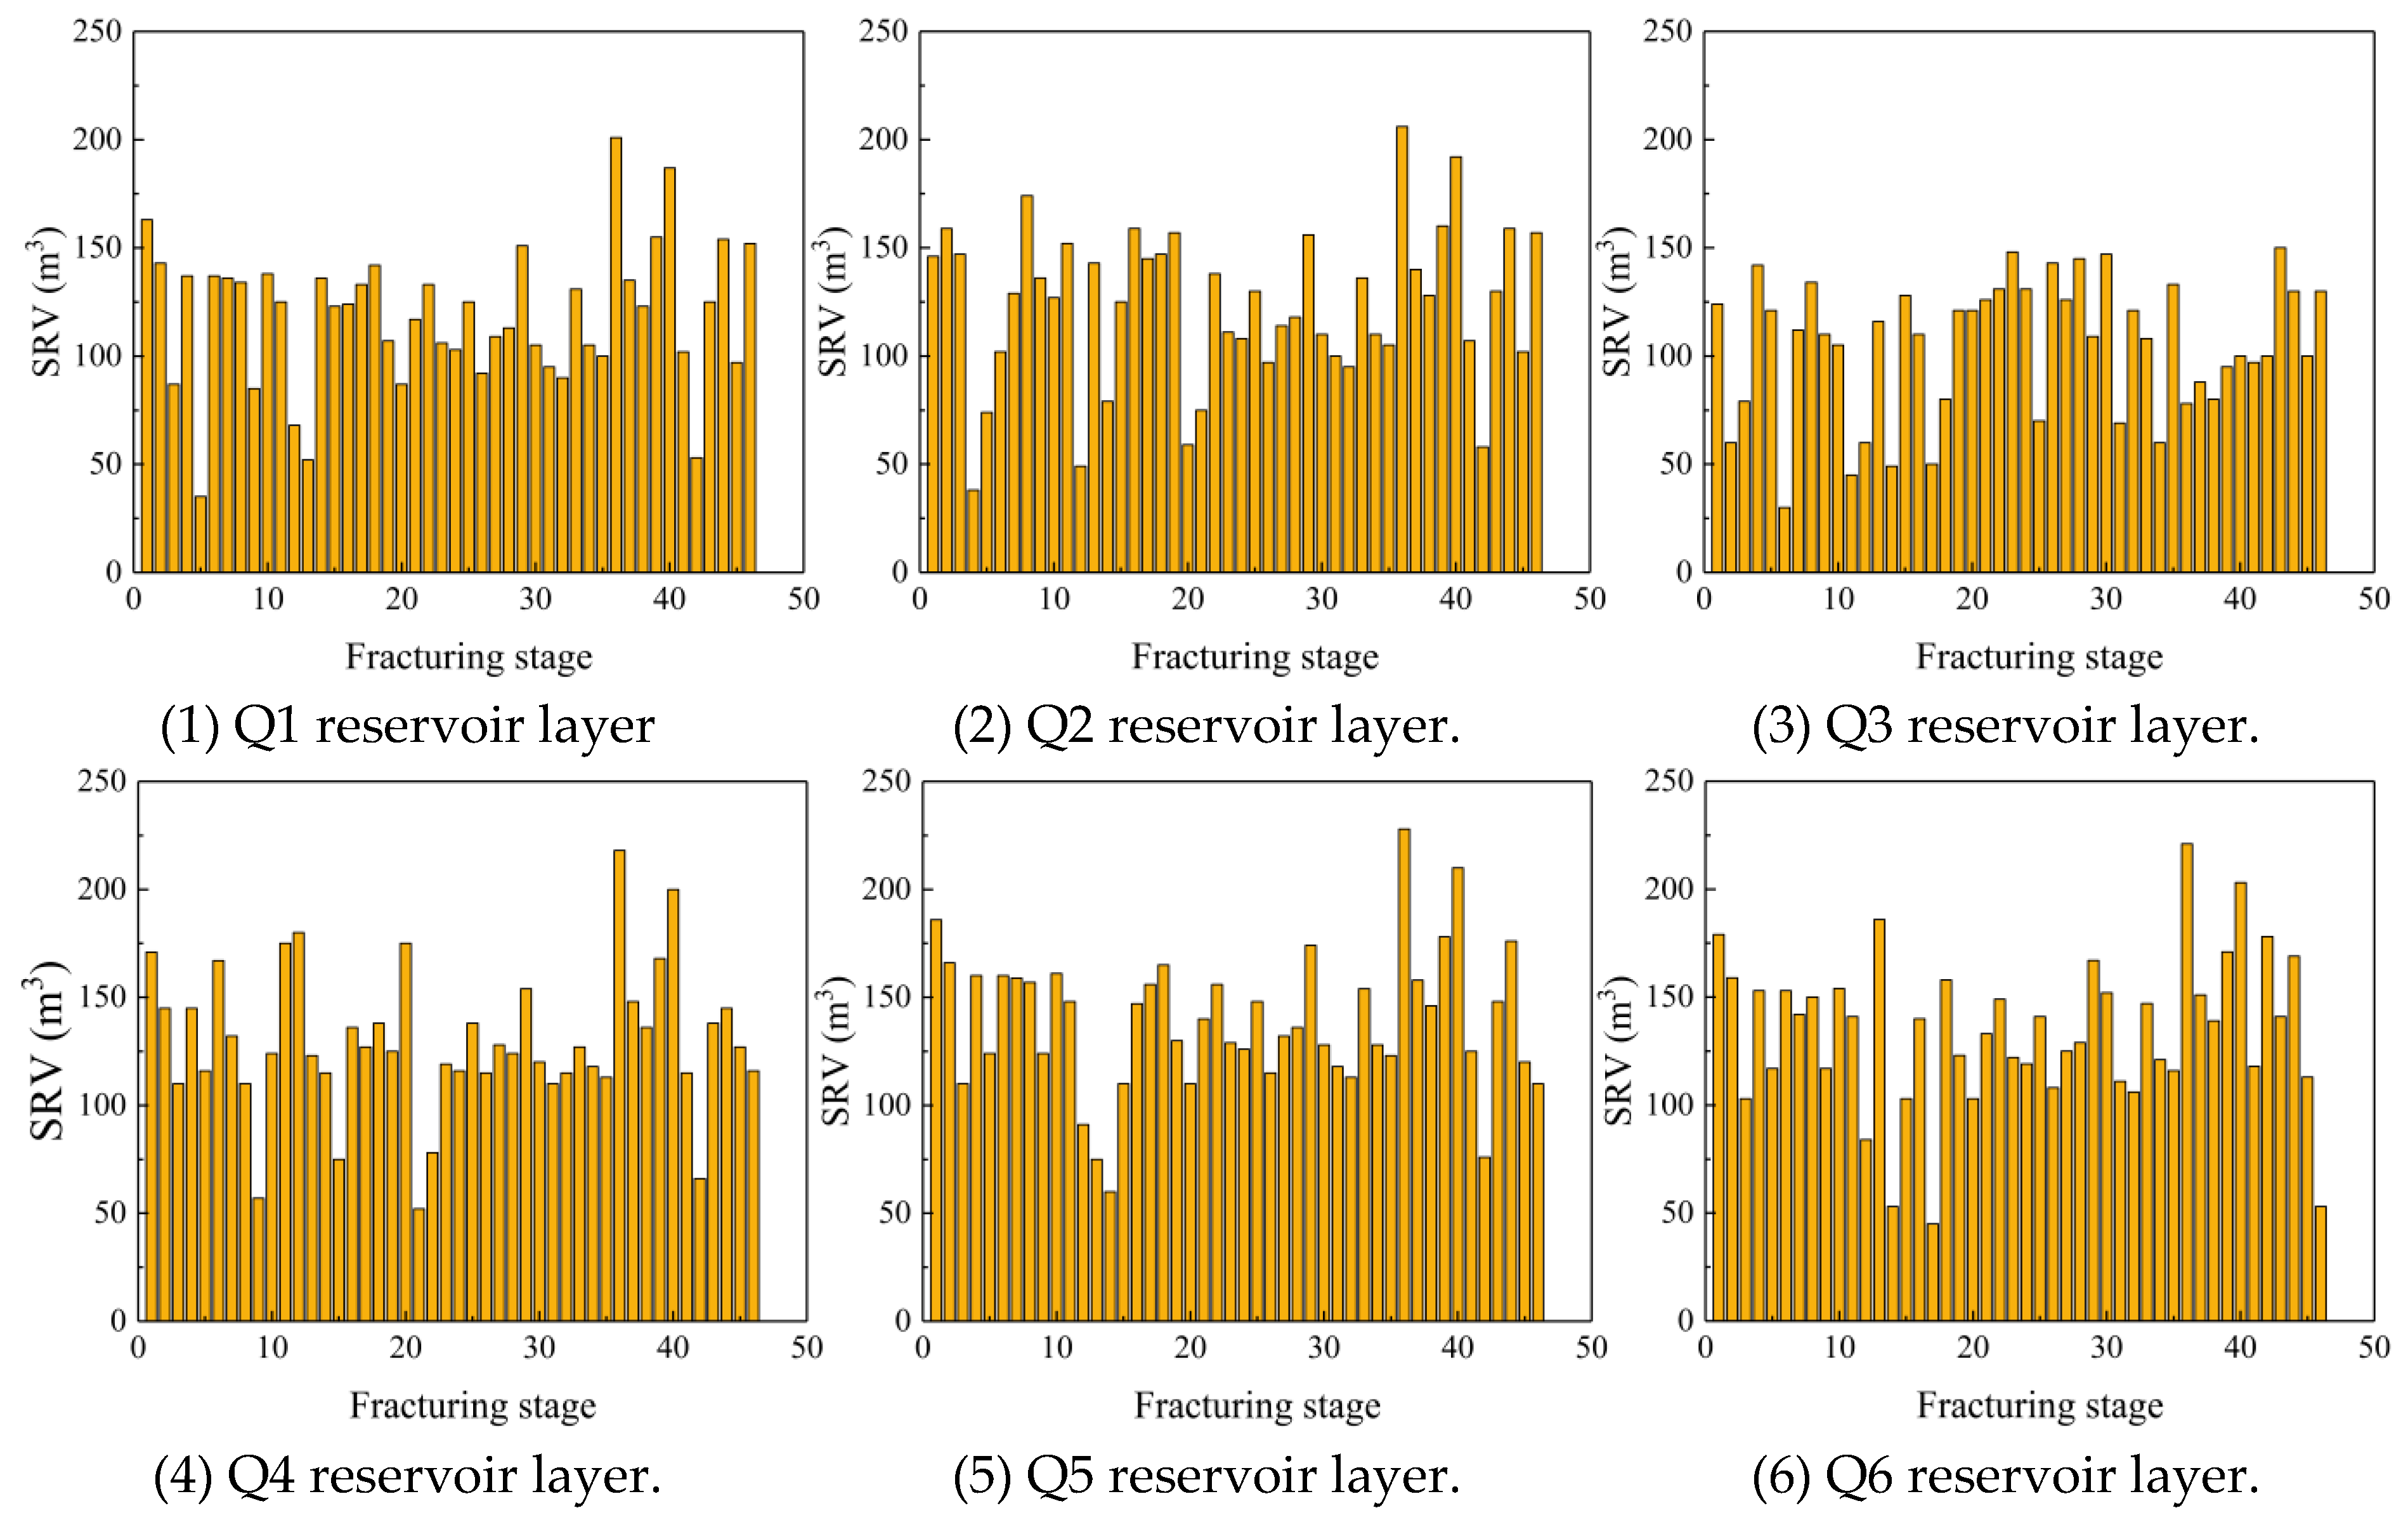
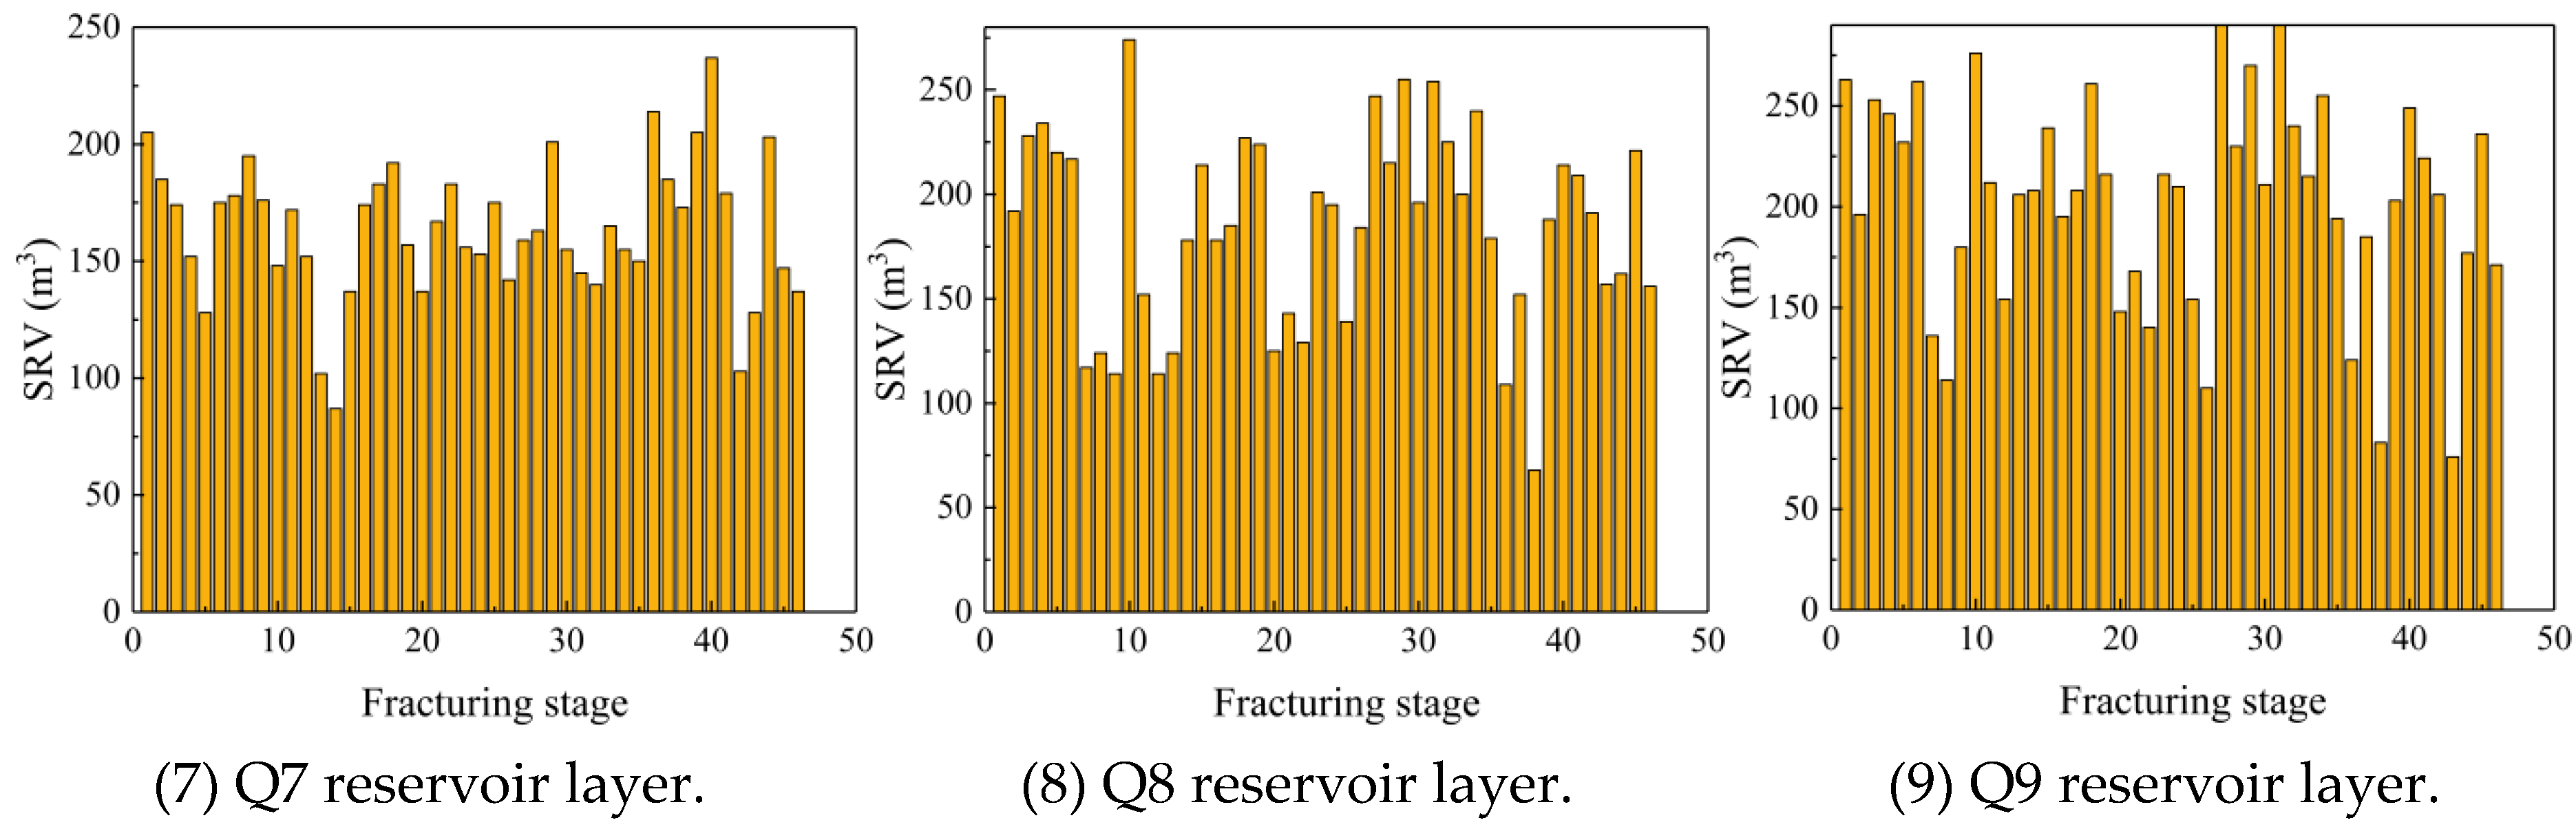
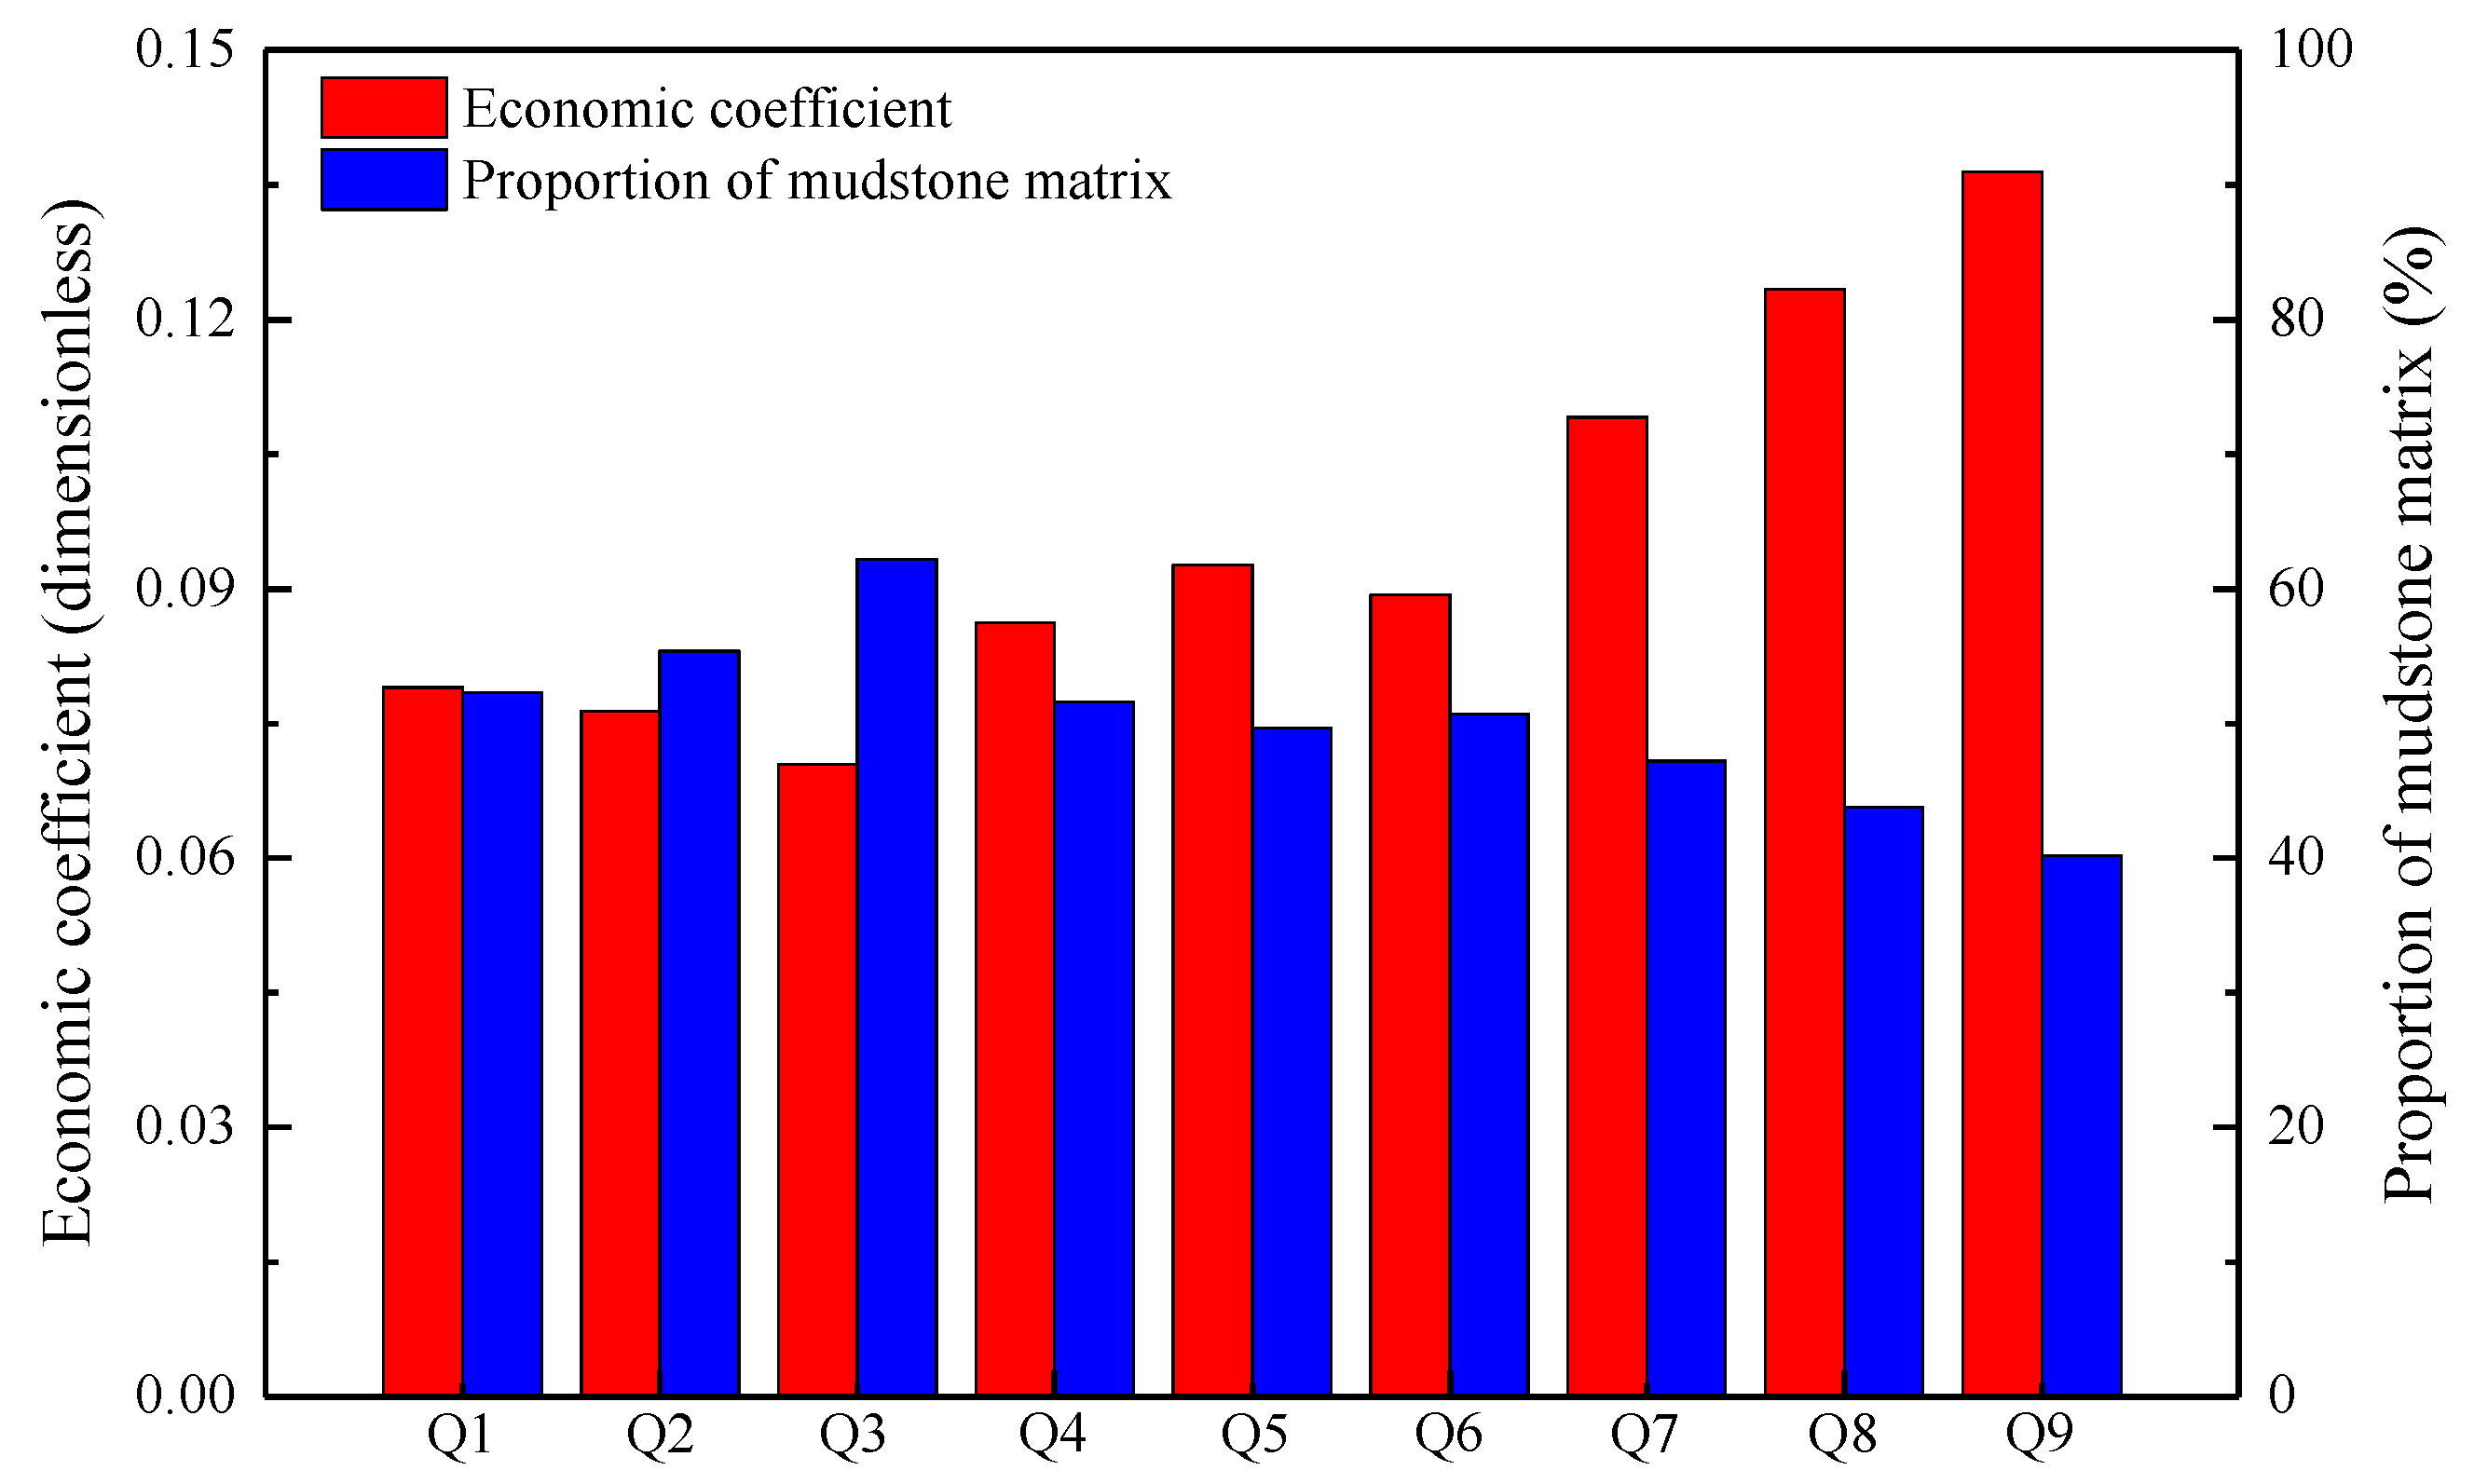
3.1. Evaluation of the Compressibility of the Different Reservoir Layers

To elucidate the distinct characteristics of each layer in the Gulong shale reservoir, specifically the impact of the vertical heterogeneity on fracturing efficacy, a four-cluster design scheme with 8 m spacing was employed for fracturing calculations across the entire well interval for all nine reservoirs, while maintaining a consistent fracturing interval length of 1500 m. The compressibility of the fracturing effect of different reservoirs was evaluated and compared in terms of economic factors. The stimulated reservoir volume (SRV) in the different reservoirs and segments showed that the Gulong shale reservoir exhibited both vertical and lateral heterogeneity, as shown in Figure 9.
The SRV directly reflected the local fracturing complexity and accessibility of the reservoir. Due to the need to pump a large amount of fracturing fluid in the fracturing process, the cost is mainly determined by the fracturing fluid volume, and the benefit is mainly determined by the reconstruction fracture volume. The economic coefficient was calculated according to the ratio of the foundation construction amount to the fractured volume, allowing for the assessment of the fracturing economy of the entire reservoir. For example, if the amount of fracturing fluid in the Q1 reservoir is 69,000 m3 and the reconstruction volume is 5451 m3, then the economic coefficient is 0.079, and the economic coefficient of different reservoirs is calculated successively. The Q7–Q9 layers in the upper section of the reservoir were most favorable, followed by the Q4–Q6 layers, which were of moderate quality, while the Q1–Q3 layers were the worst. In addition, minor fluctuations were evident in Q4, Q5, and Q6. The lithology characteristics of the sedimentary facies model indicated that the oil reservoir with a high mud content displayed significant plasticity, resulting in a limited fracture reconstruction volume, as shown in Figure 10.

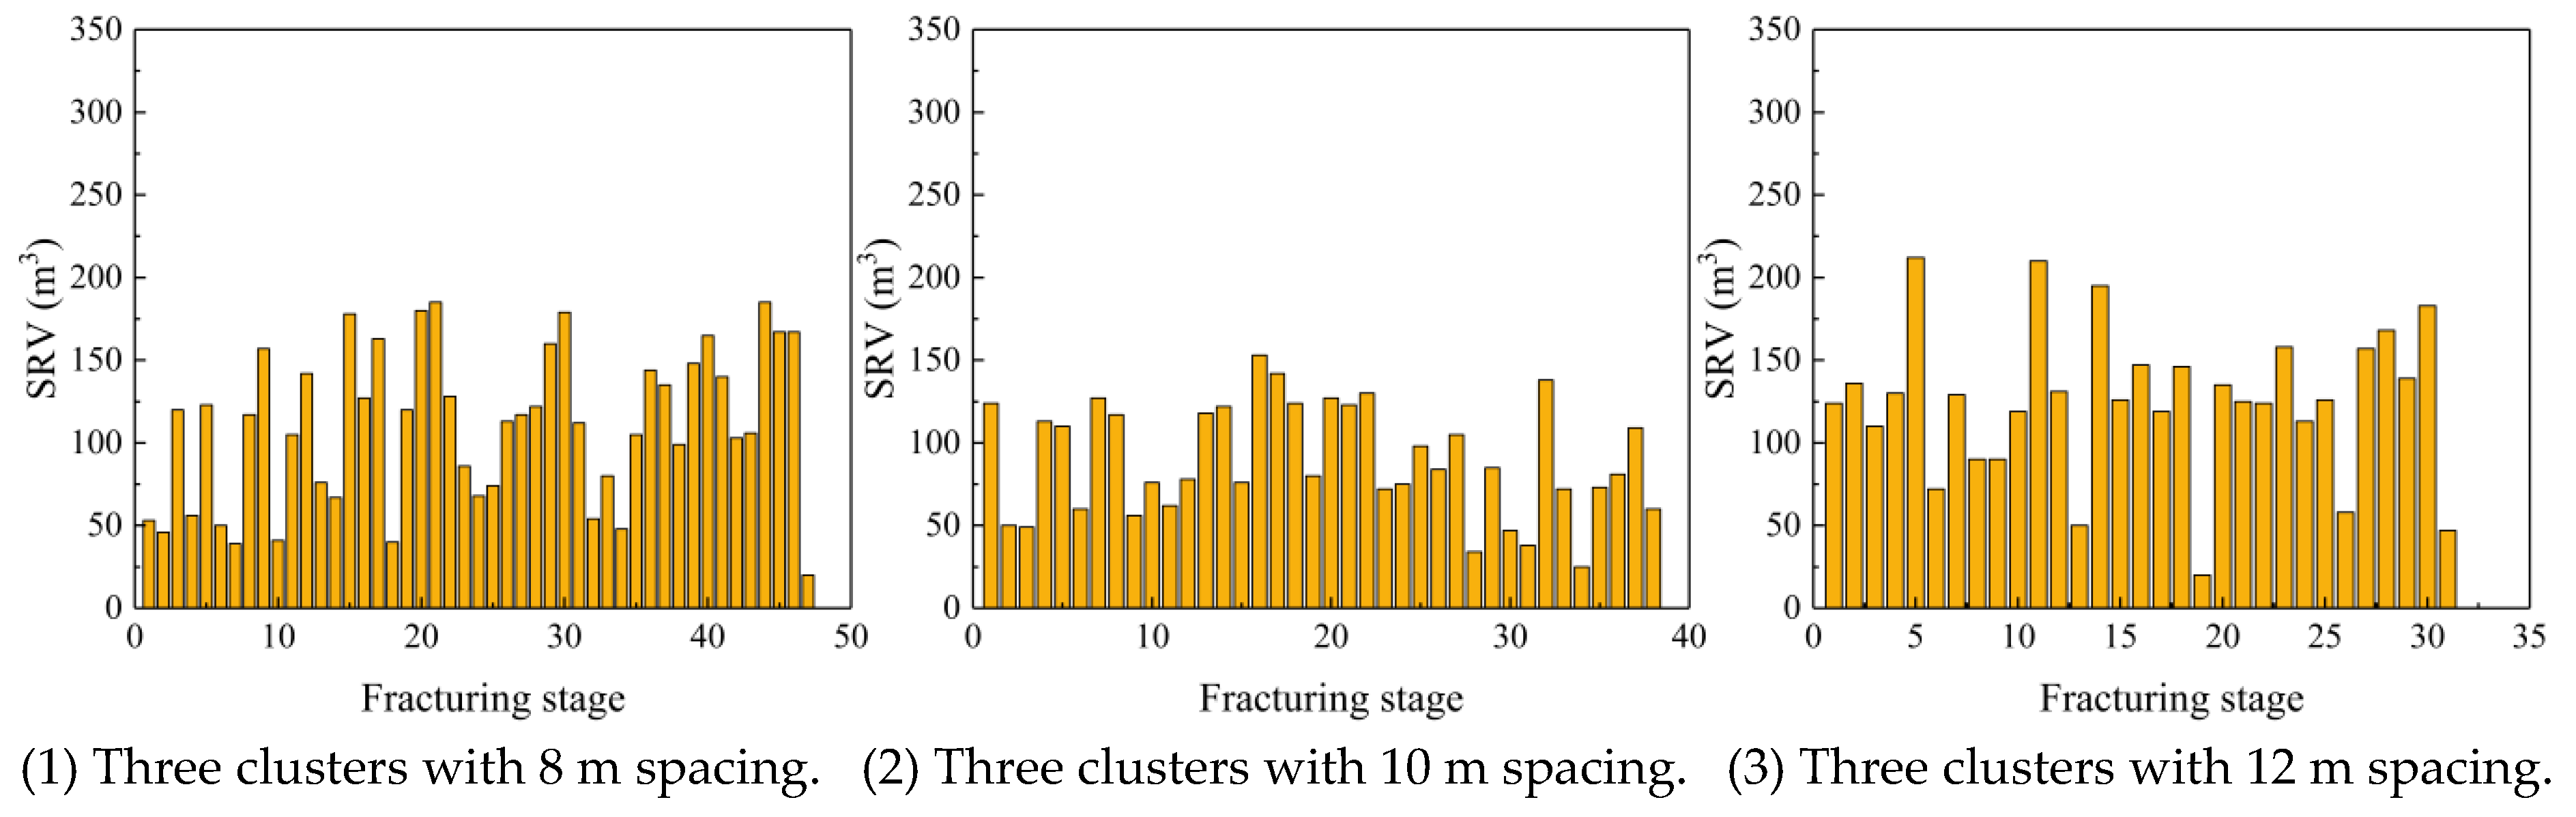
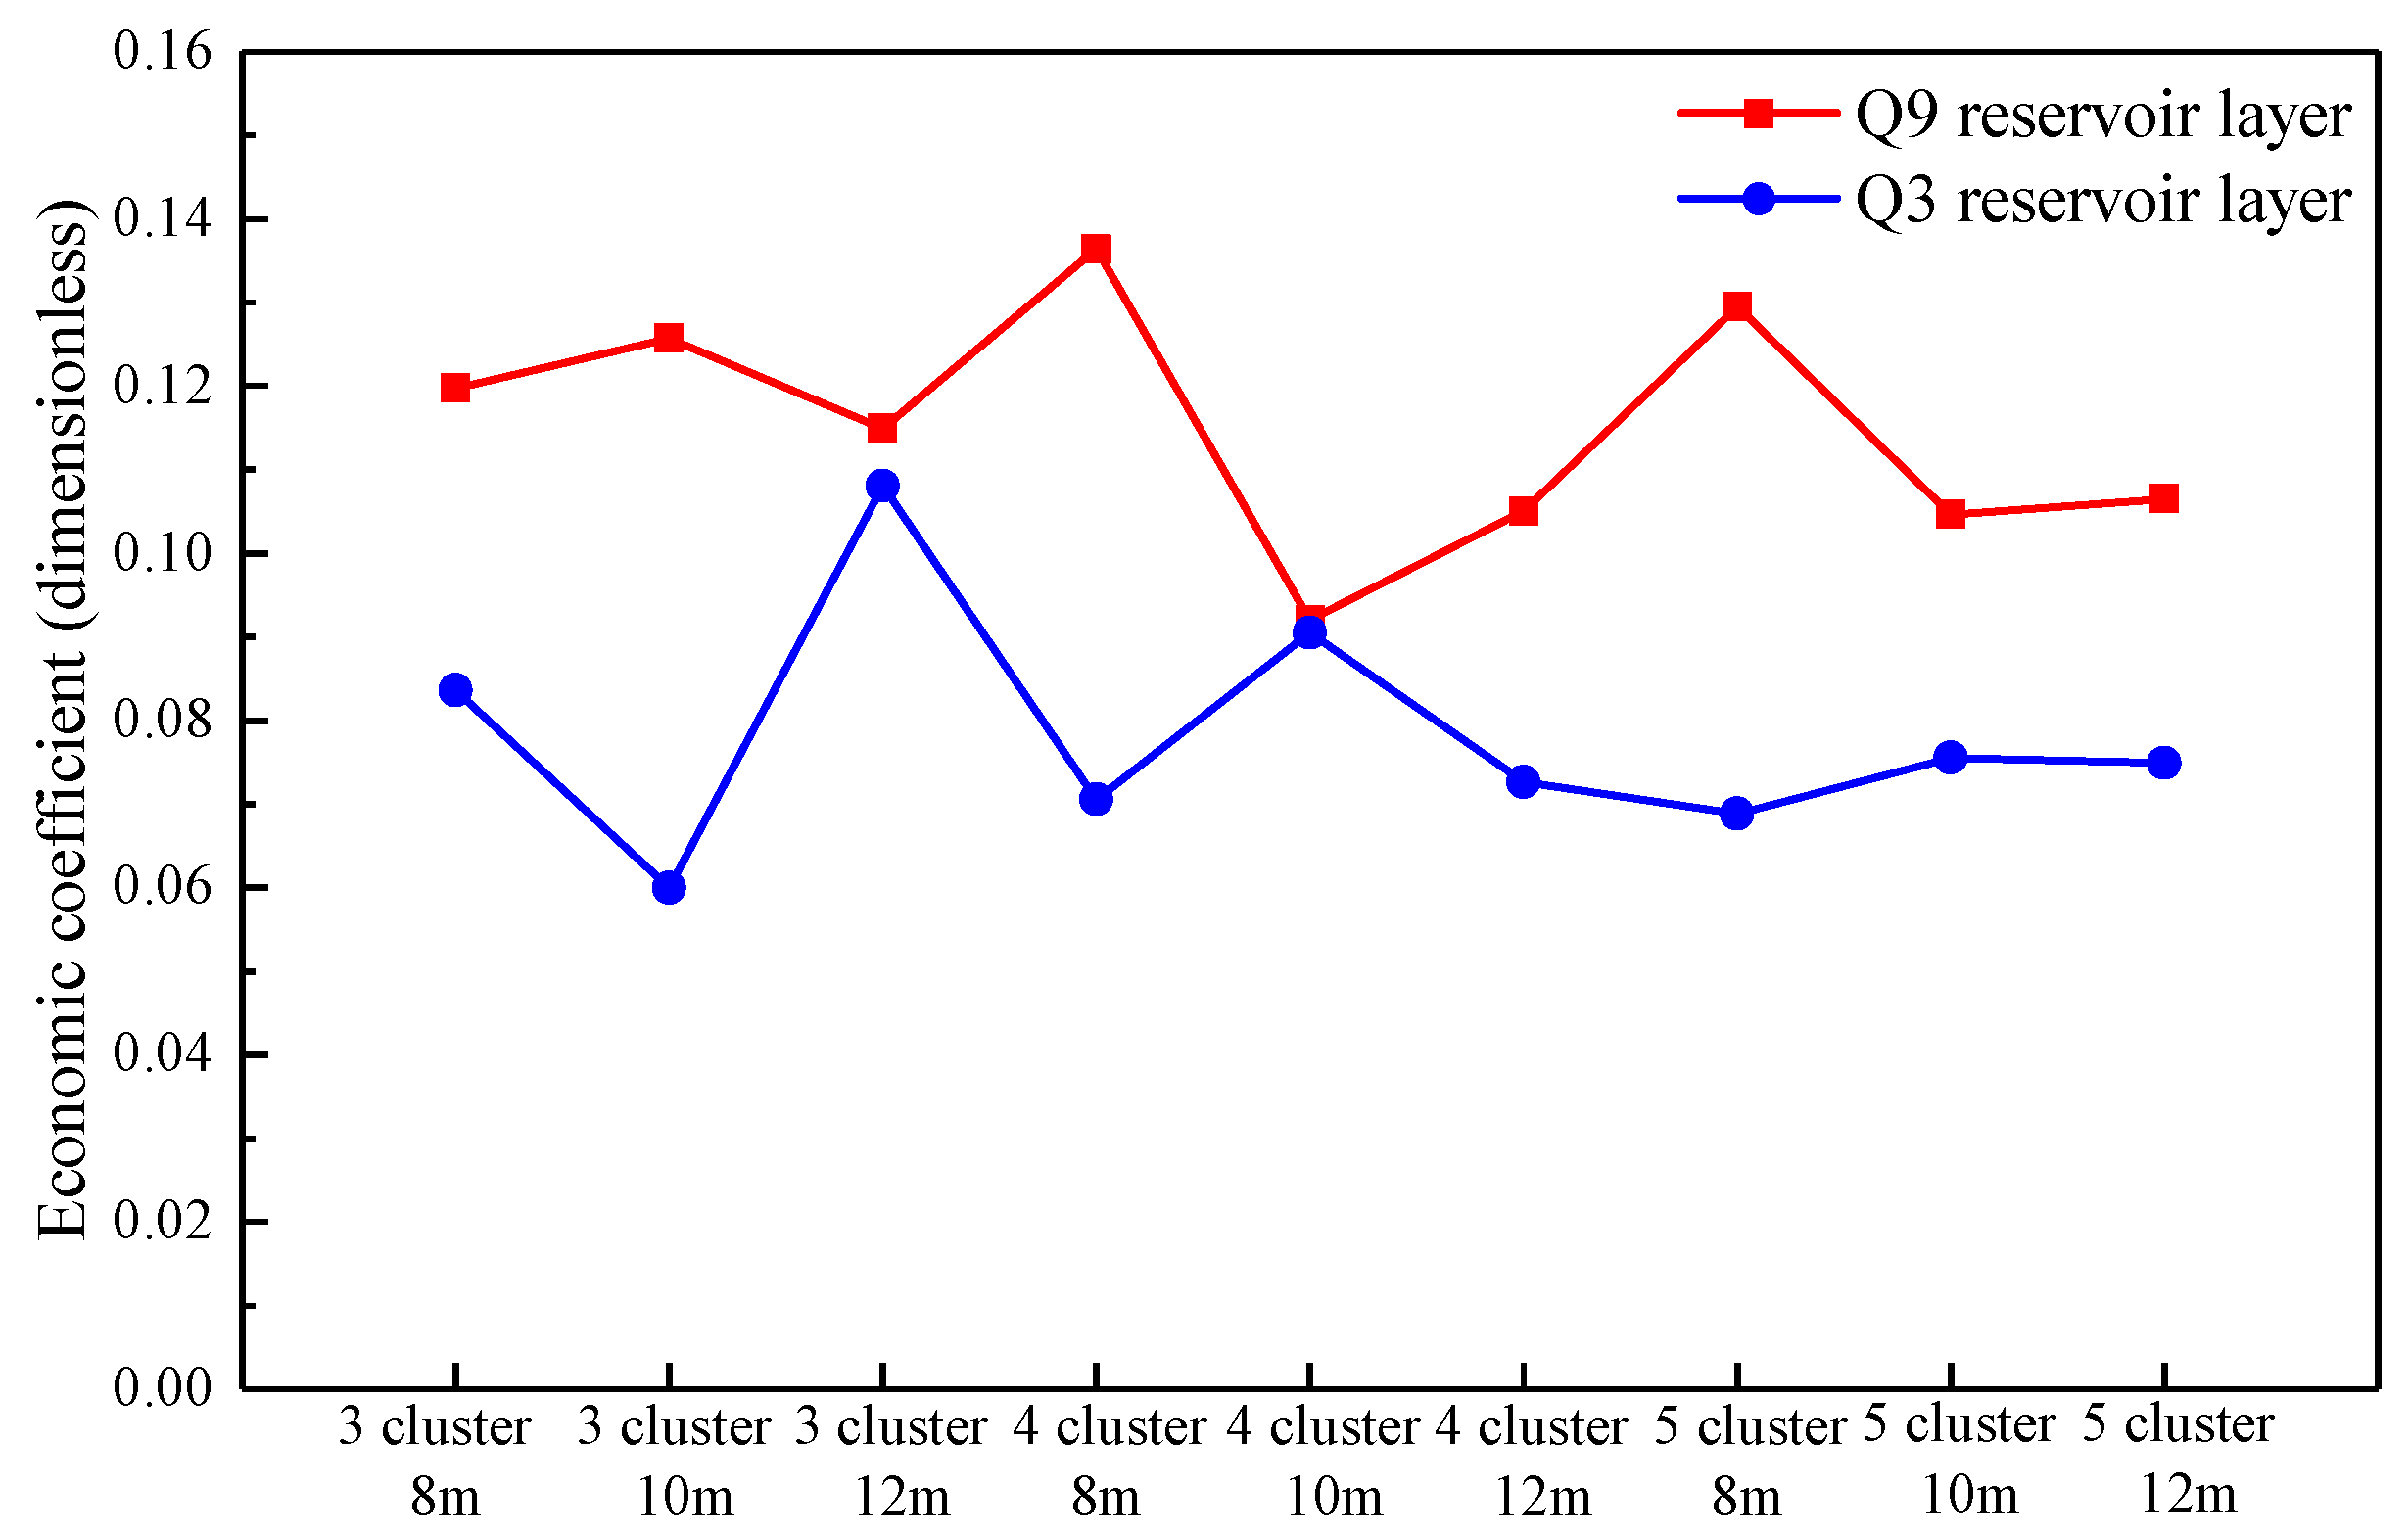
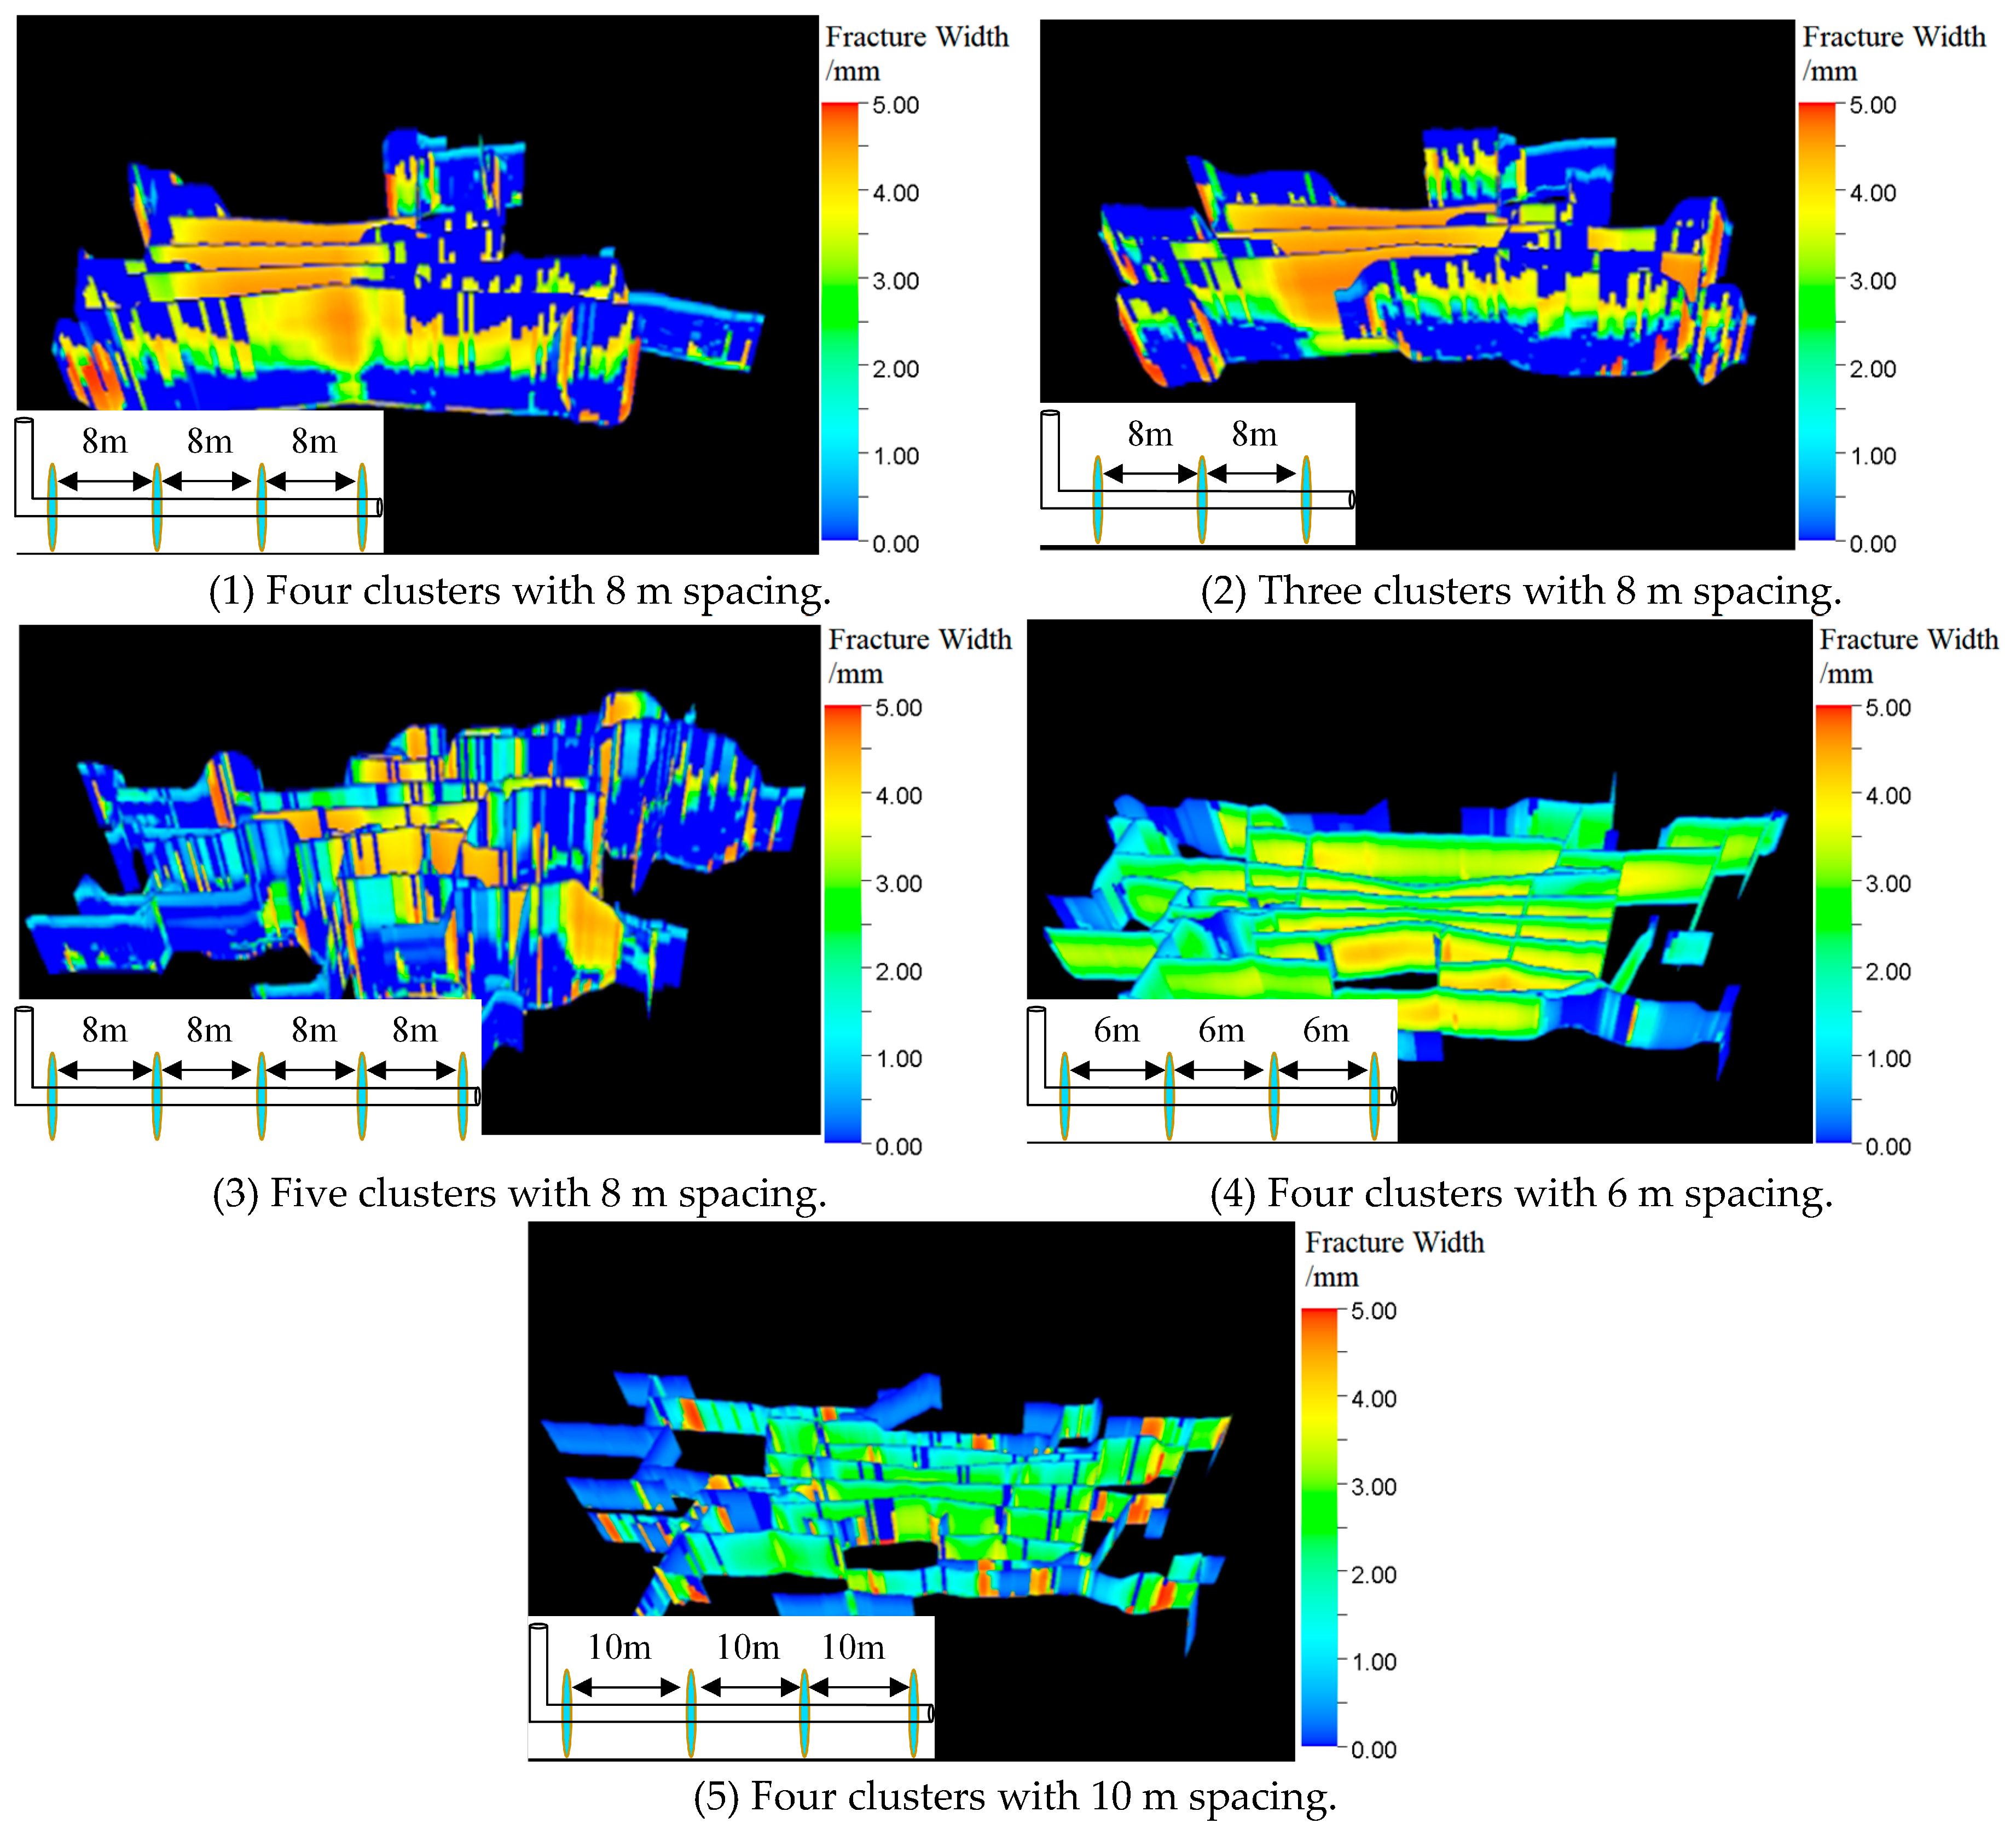
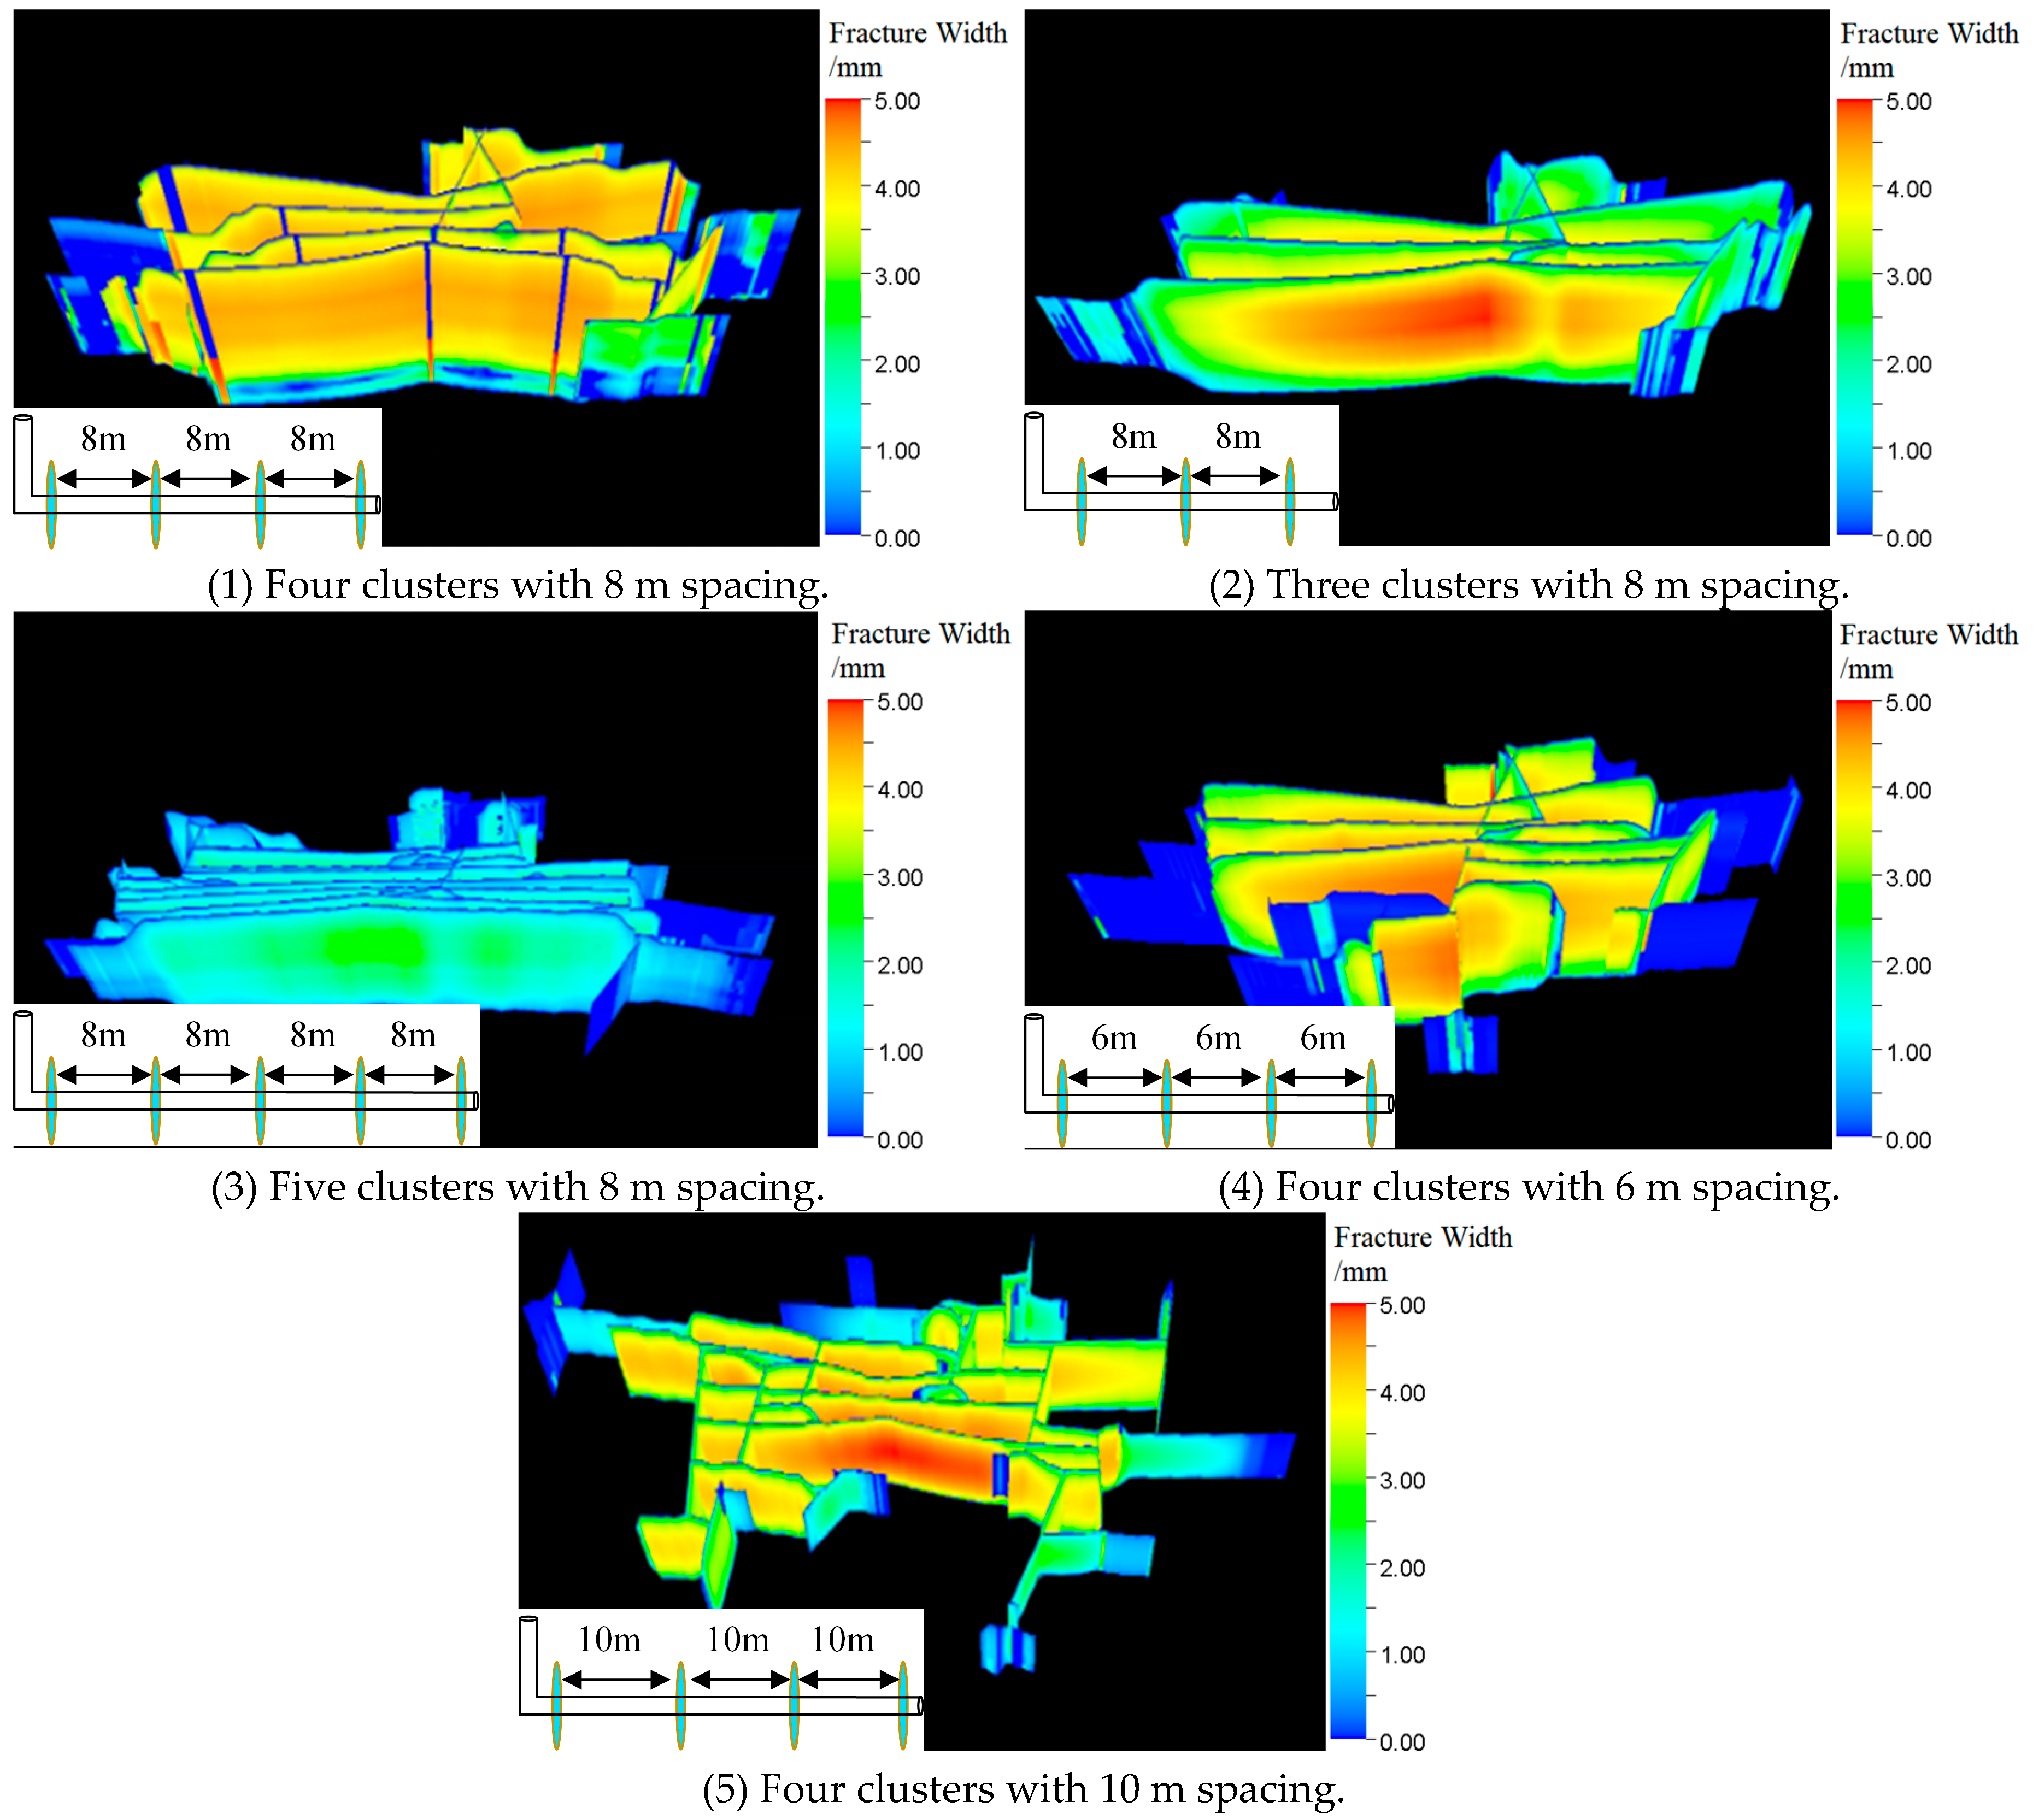
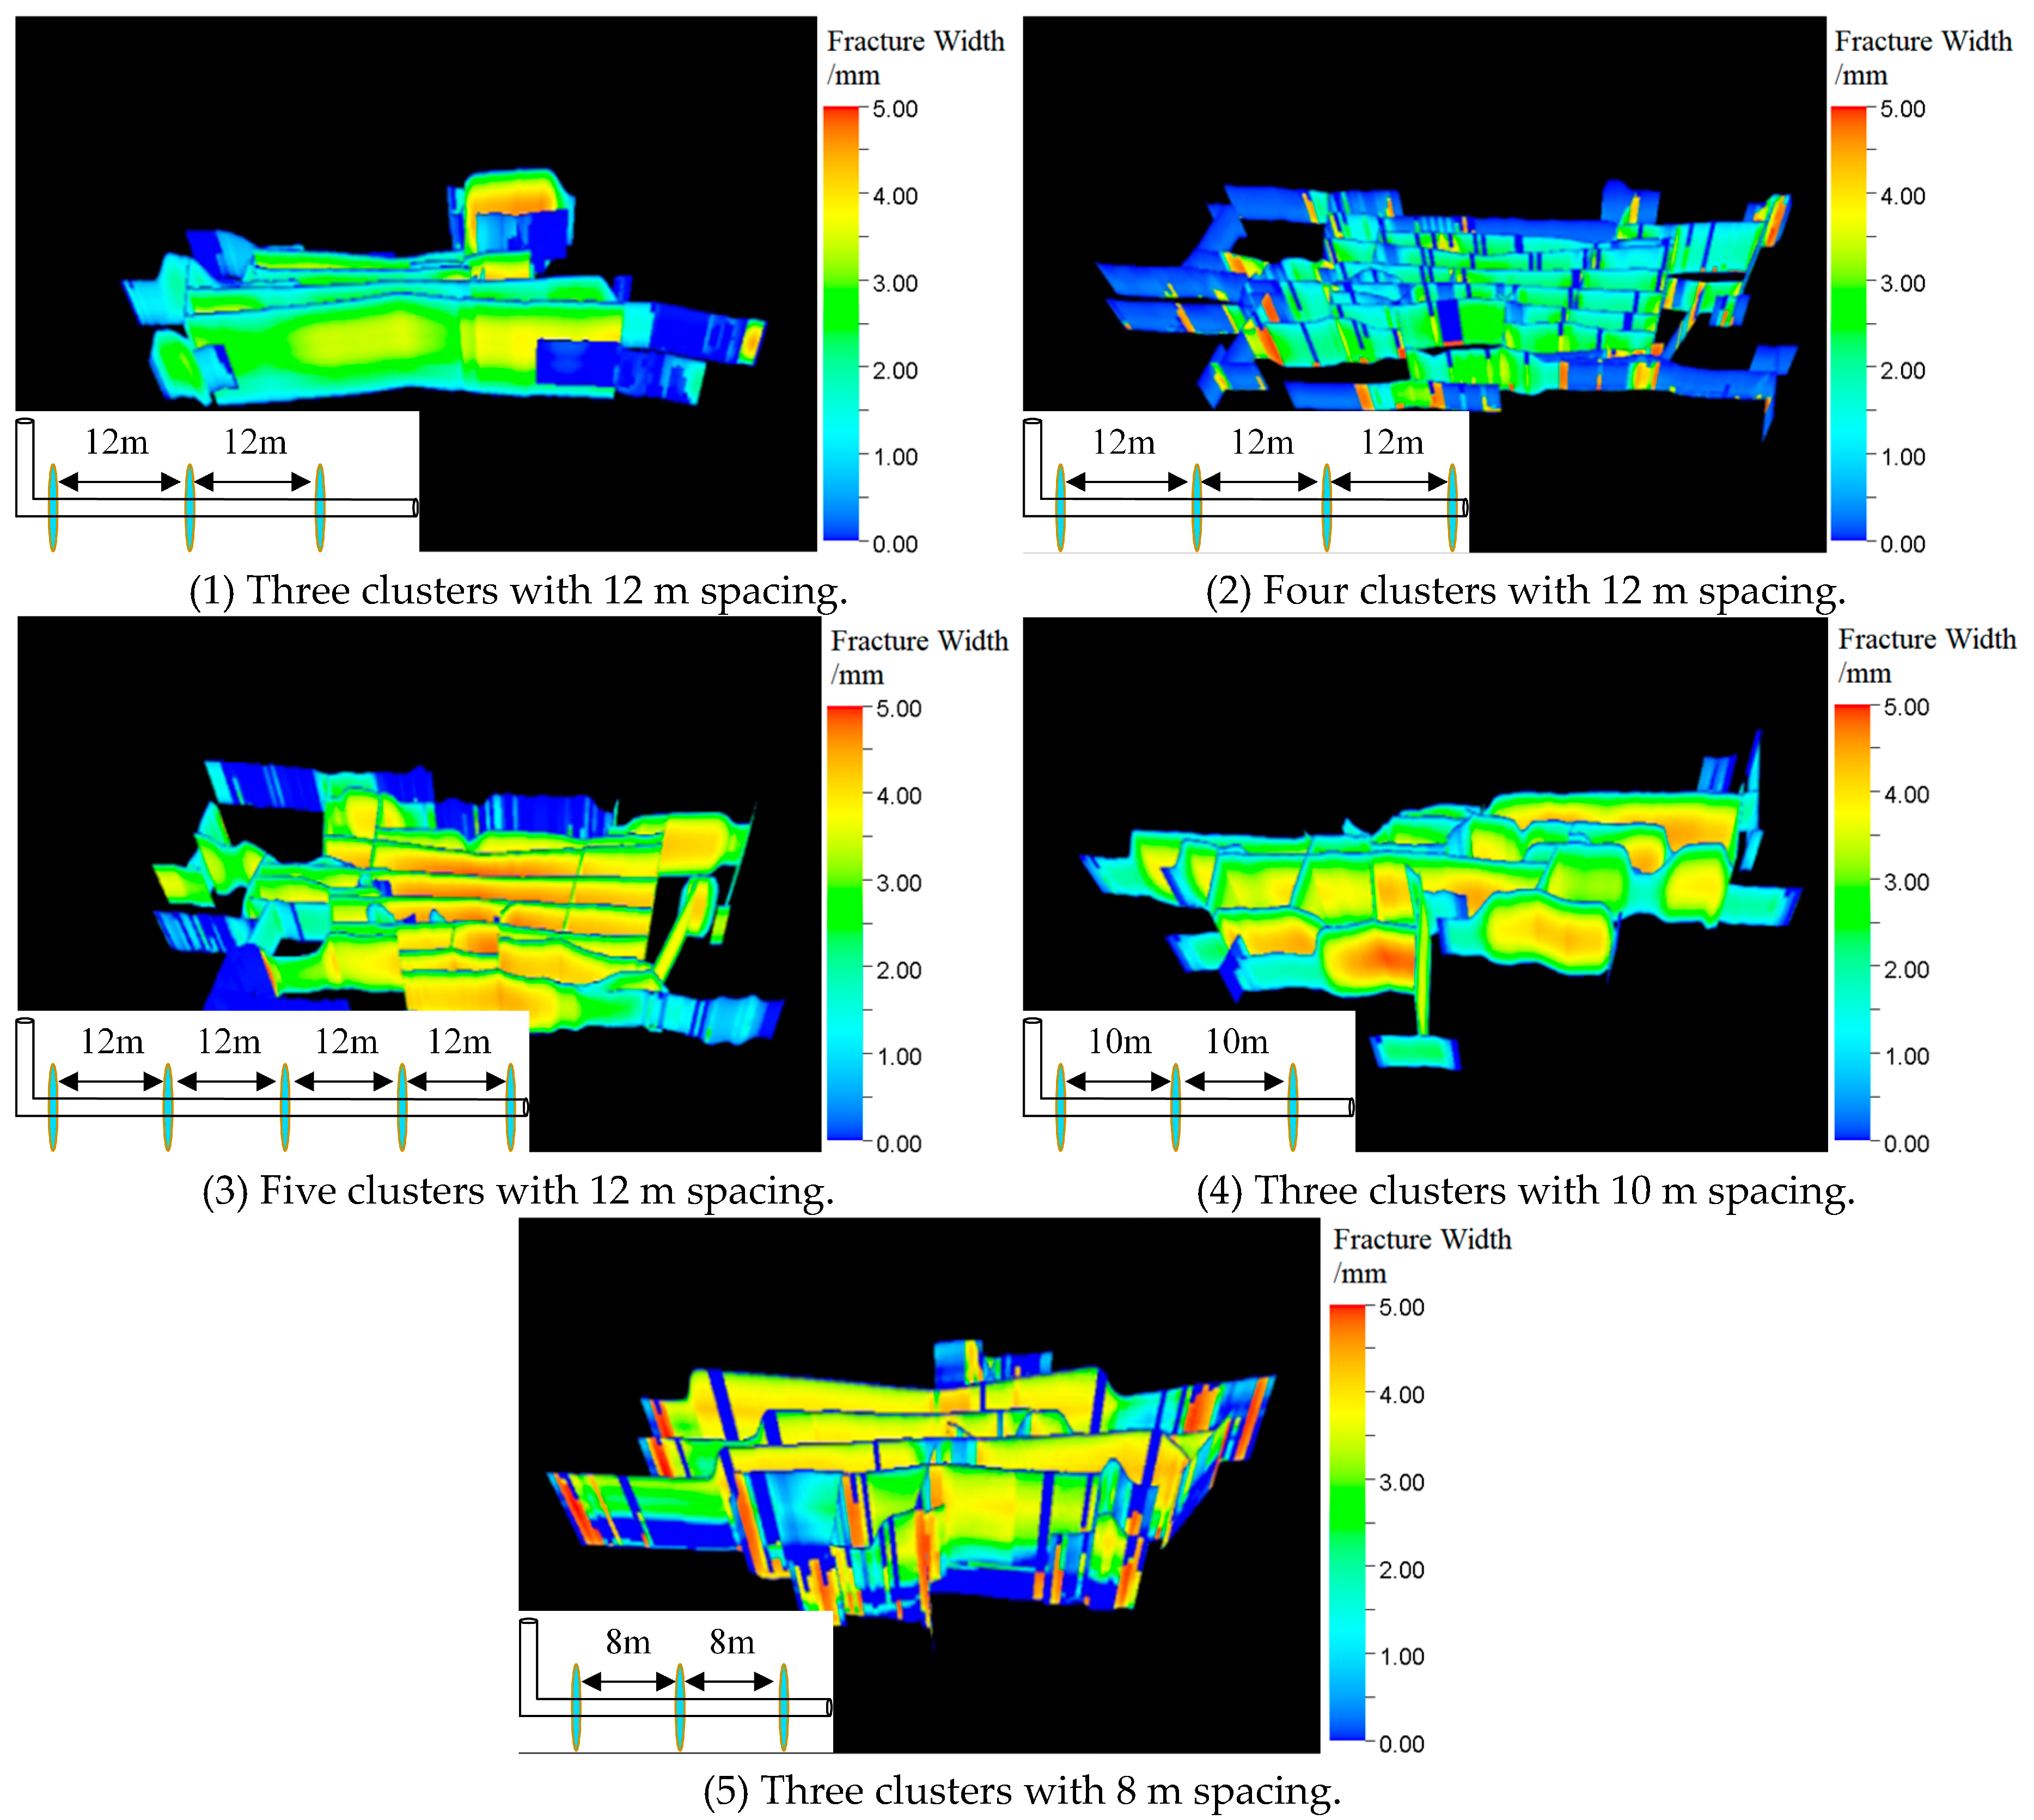
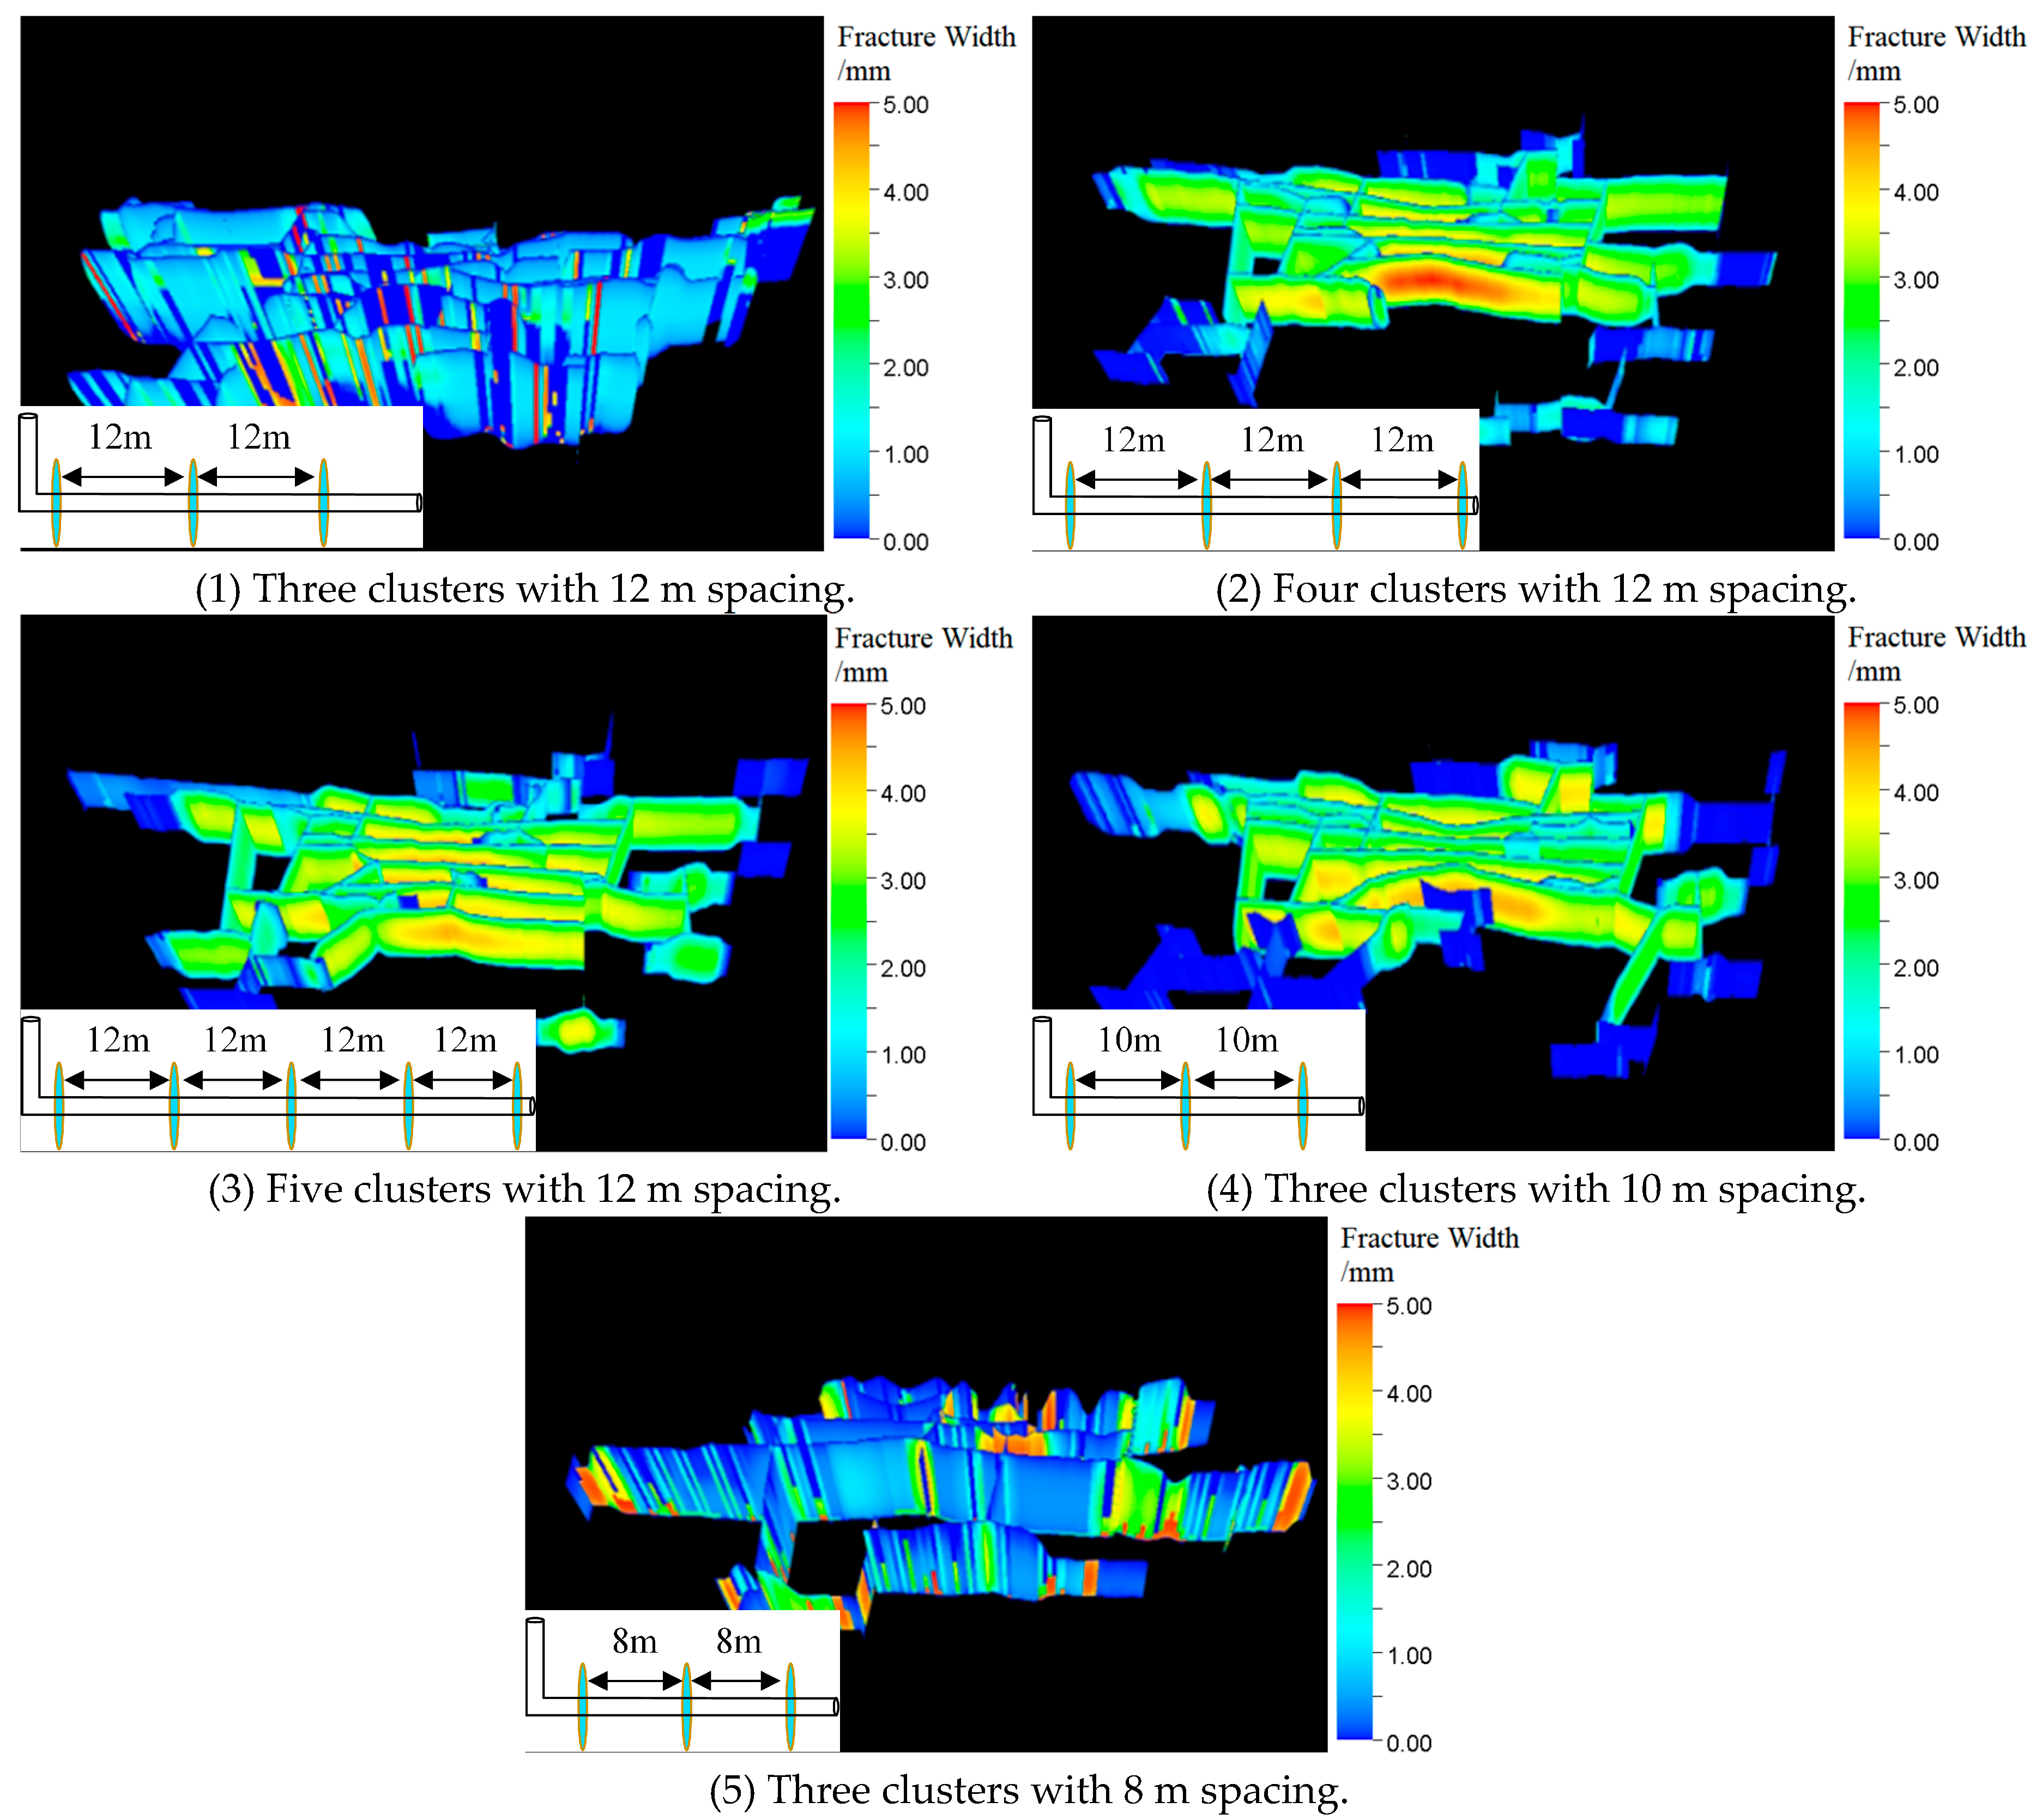
3.2. Differences and Optimization of the Fracturing in the Q9 and Q3 Reservoir Layers

The fracturing disparities among the different reservoir layers indicated that Q3 and Q9 were the most prominent. By analyzing the optimization in these two reservoirs, the variations in the fracturing cluster design across reservoirs exhibiting vertical heterogeneity could be examined and determined. Different cluster distribution schemes (three to five clusters with 8~12 m spacing) were designed and applied to the Q9 and Q3 reservoirs for fracturing simulation to ensure uniform pumping conditions (1500 m3 fluid volume and 120 m3 sand volume) for each stage and to explore the fracturing SRV results of the entire well under different cluster design schemes, as shown in Figure 10, Figure 11 and Figure 12.
The differences between the Q3 and Q9 reservoir layer reconstruction were analyzed by examining the fracturing reconstruction economy, as shown in Figure 13. At the same construction consumption, the overall fracturing reconstruction economic coeffcient of the Q9 reservoir layer exceeded that of Q3. The economic differences between the cluster designs of the two layers were assessed, revealing that Q9, characterized by substantial brittleness, displayed low expansion resistance; long, narrow fractures; and minimal stress interference between the various fractures. Therefore, the number of clusters could be appropriately increased while the spacing between them could be reduced. The calculations indicated that the ideal design for the full utilization of the Q9 reservoir involved four clusters with 8 m spacing. The significant plasticity of the Q3 reservoir facilitated wide, short fracture formation due to higher propagation resistance and obvious lateral development. This increased the stress interference between multiple fracture clusters, which restricted local inferior crack propagation and promoted the formation of ineffective perforation clusters. The number of clusters could be appropriately reduced while the cluster spacing was increased to promote the uniform, comprehensive expansion of multiple fracture clusters. The calculation results showed that the optimal design of the Q3 reservoir involved three clusters with 12 m spacing. Consistent with the optimization law of the on-site construction test, for continental shale, it is recommended to have fewer clusters within the section, with a cluster spacing of 5~15 m and a cluster number range of 3~5 [51,52].

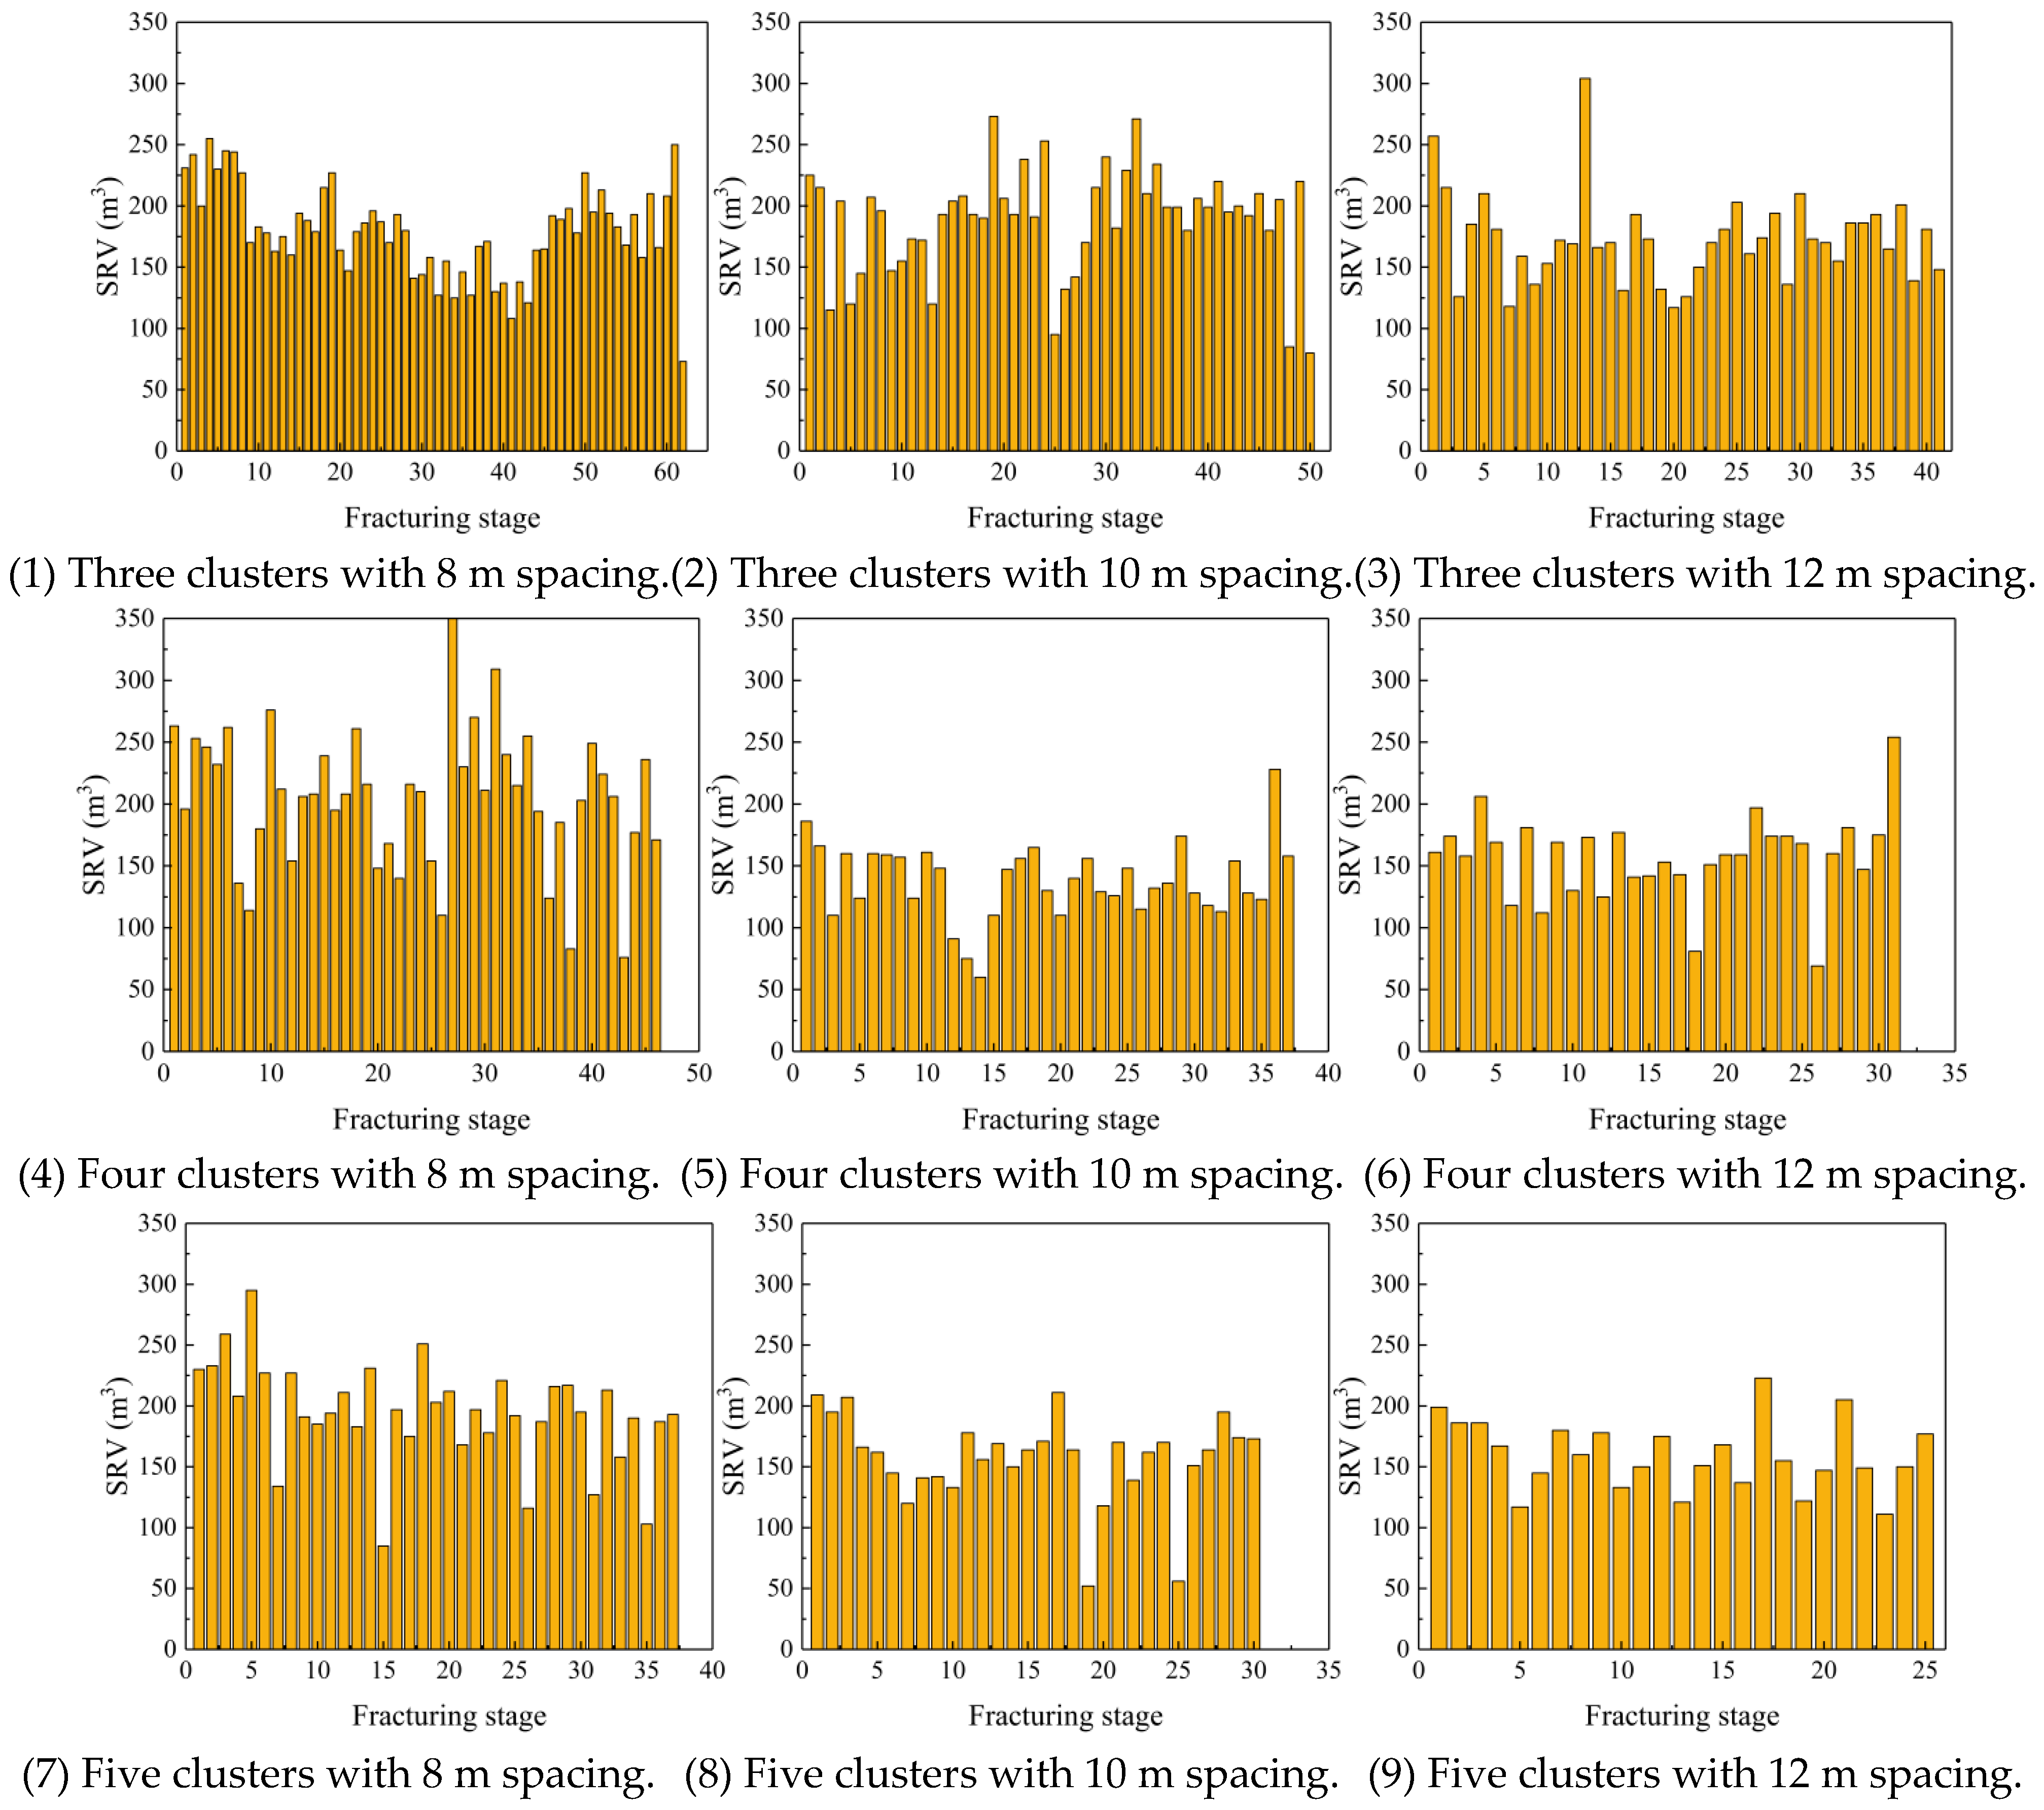
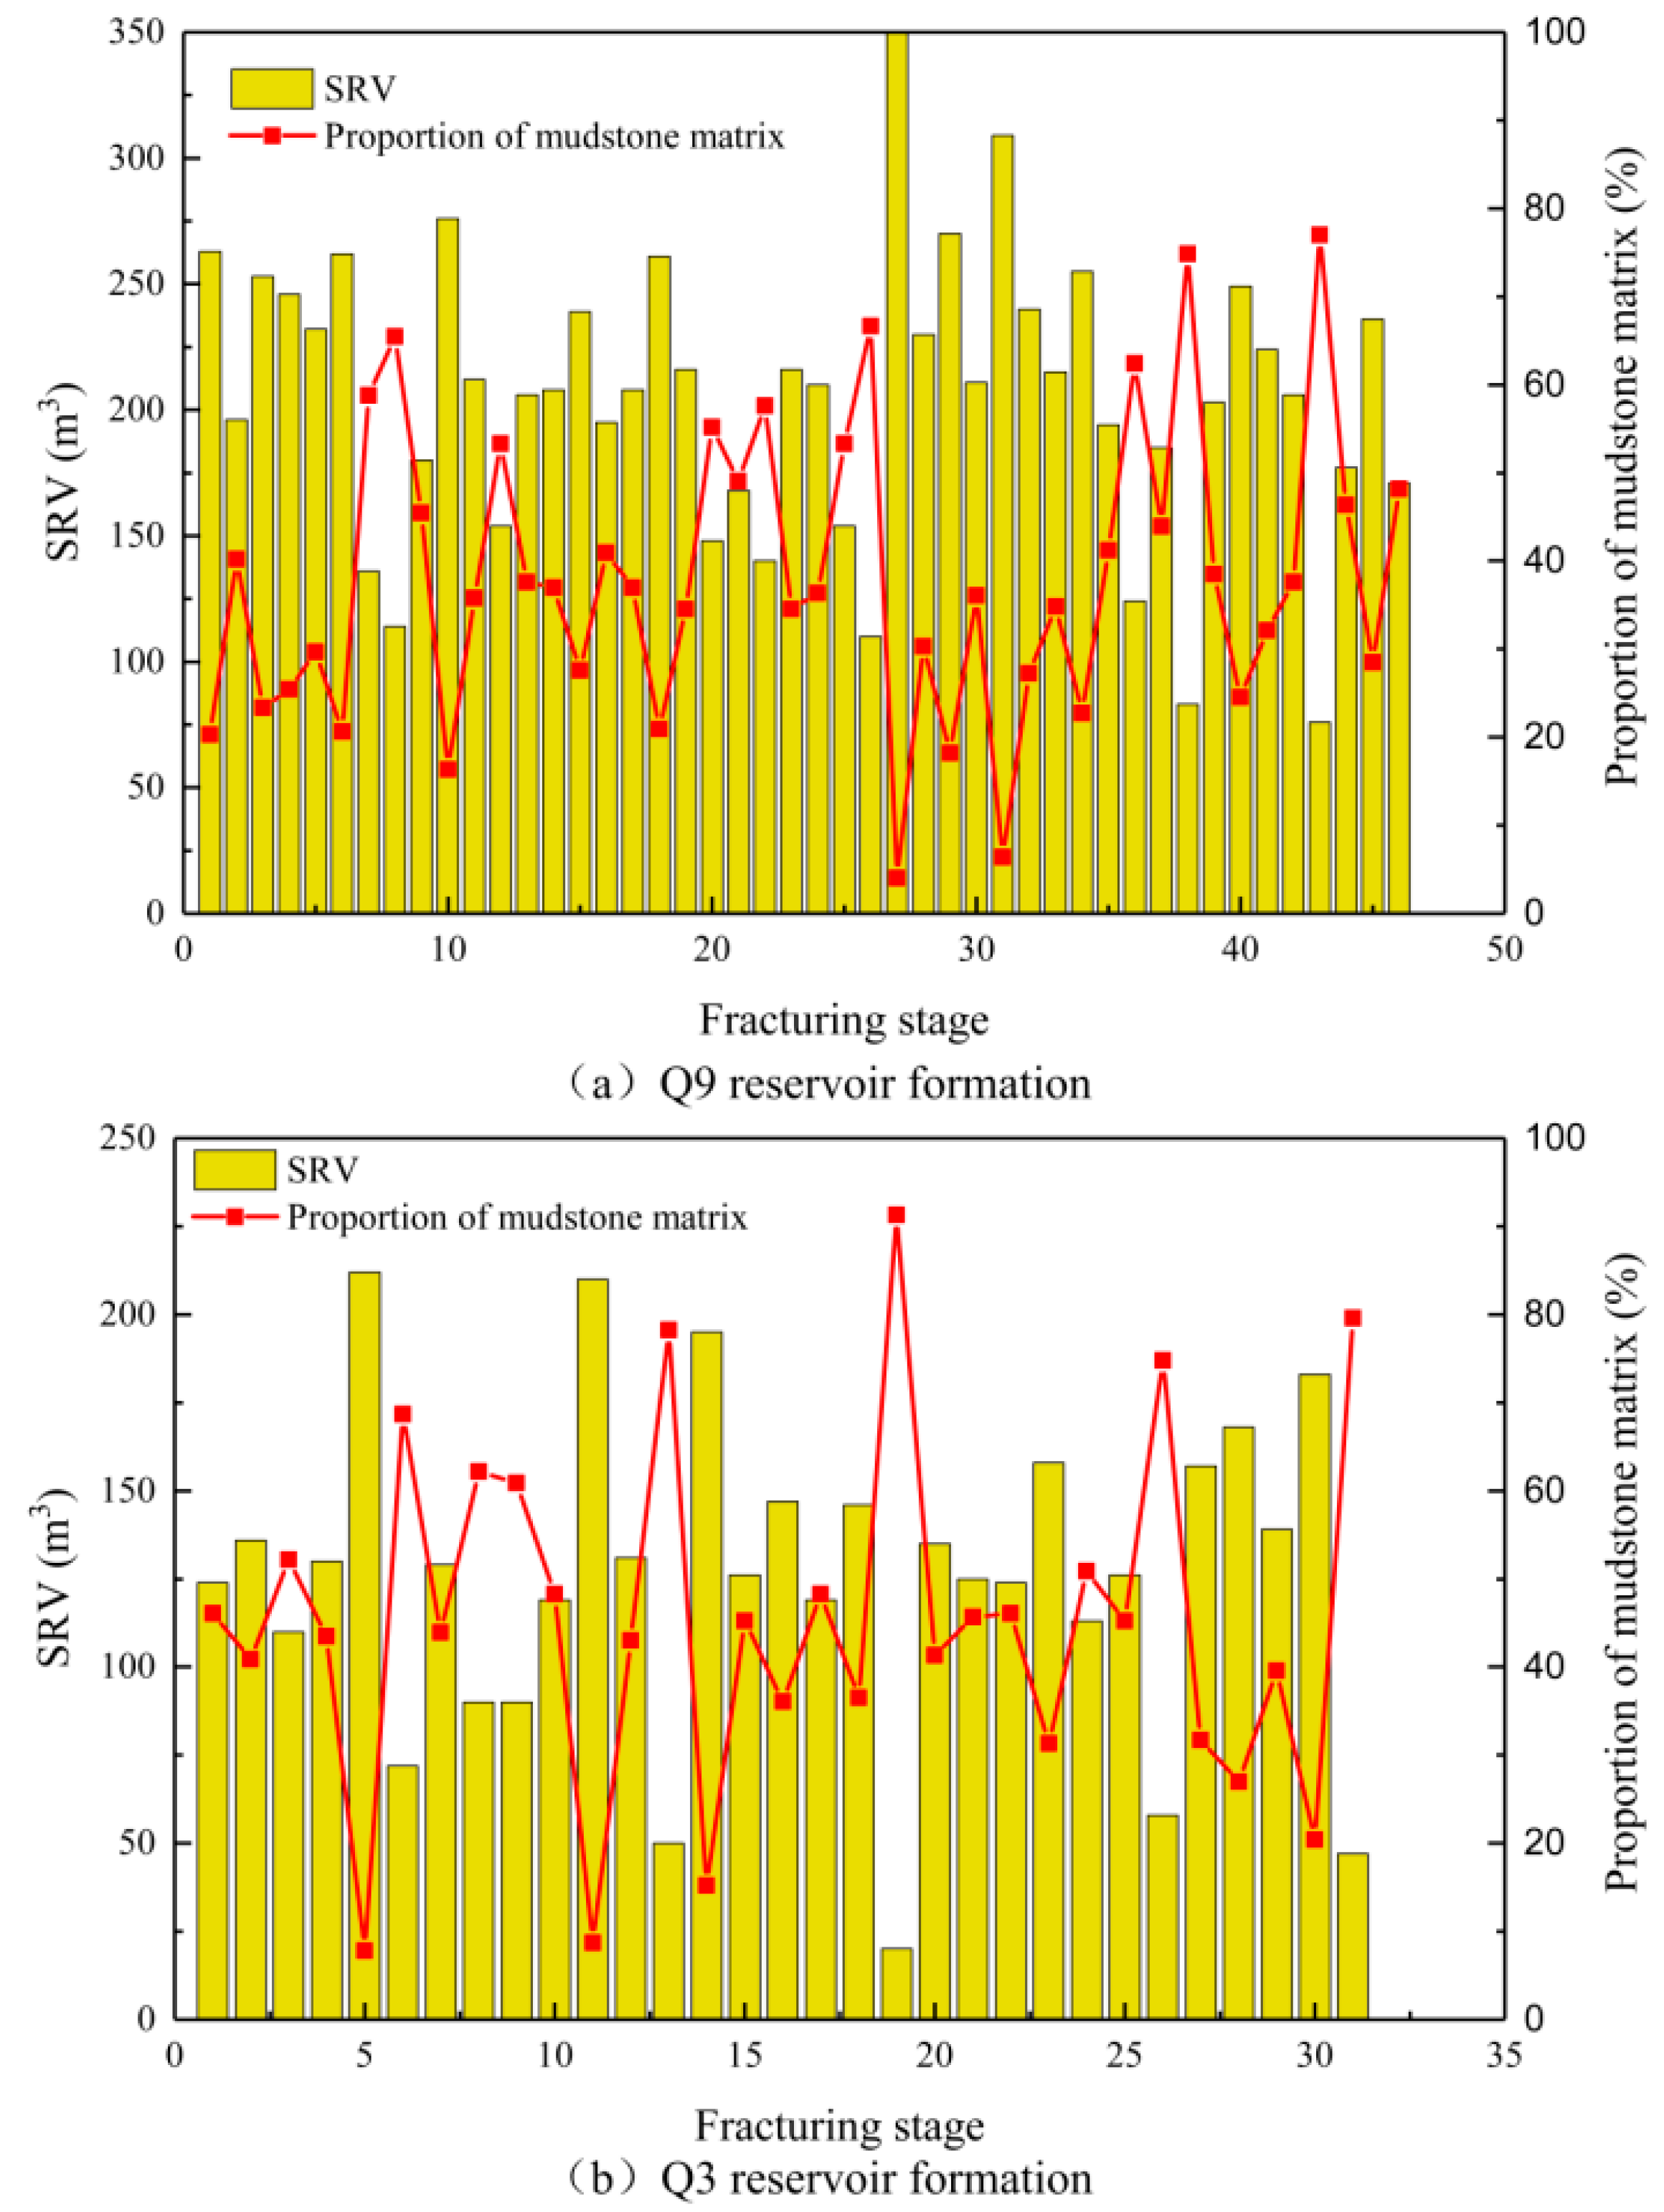
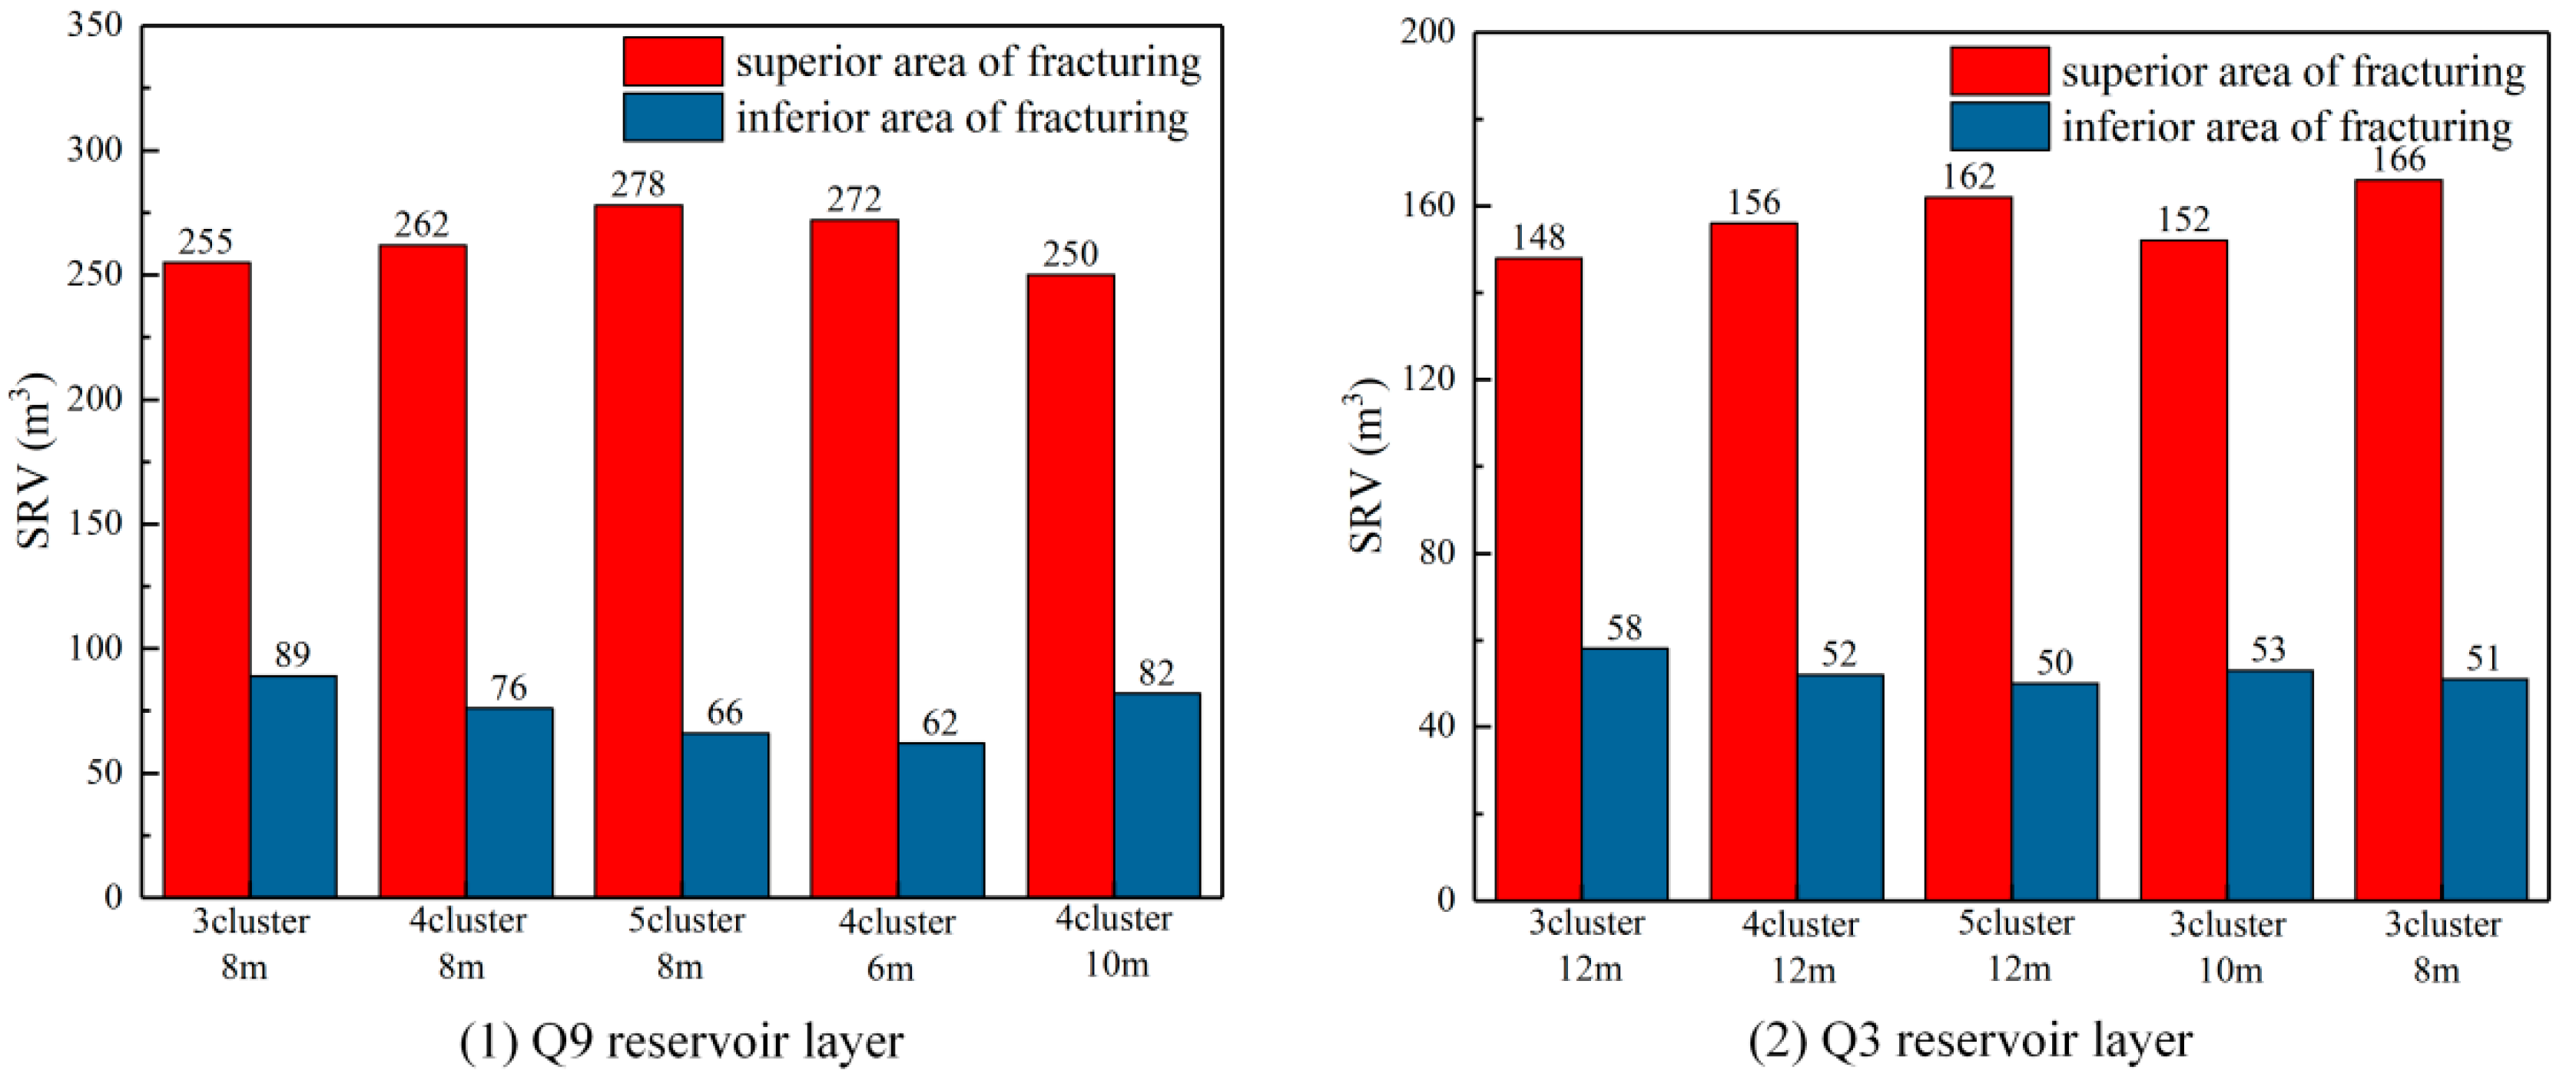
3.3. Differences and Optimization of the Superior and Inferior Fracturing Areas in the Reservoir Layers

The overall reconstruction of the entire well in the upper section showed that the optimal design for the Q3 and Q9 reservoir layers involved three clusters with 12 m spacing and four clusters with 8 m spacing, respectively. Taking the design of the optimal segment cluster as an example, the comparison of SRV and mud content between Q3 and Q9 reservoirs in the transverse whole well shows that the superior fracturing area is the brittle area with less mud content, while the inferior fracturing area is the plastic area with more mud content, as shown in Figure 14. The better reconstruction efficacy should be to form a larger stimulated reservoir volume through fracture propagation, which is represented by SRV. To clarify the influence of lateral heterogeneity in the reservoir on the reconstruction efficacy, the superior and inferior fracturing areas were selected from the SRV statistical diagram in the same fracturing operation conditions (1500 m3 fluid volume and 120 m3 sand volume). The superior and inferior fracturing areas of the Q9 oil layer are selected as Sections 34 and 9, respectively, and those of the Q3 oil layer are selected as Sections 23 and 26, respectively. The local optimization scheme was analyzed further by changing the cluster number and spacing for the local superior and inferior regions, as shown in Figure 15, Figure 16, Figure 17 and Figure 18.
As shown in Figure 19, increasing the cluster number and reducing the cluster spacing in the superior and inferior fracturing areas of Q9 and Q3 elevated and decreased the reconstructed volumes, respectively. Therefore, based on the optimal cluster design of the entire well section, localized adjustments could be implemented along the wellbore direction according to the logging curve. In regions characterized by significant lithological brittleness, the number of clusters should be appropriately increased, and the cluster spacing should be reduced. Conversely, in areas exhibiting pronounced lithological plasticity, the number of clusters should be decreased while the spacing between them should be expanded, consequently optimizing reservoir utilization via fracturing construction.

4. Conclusions

(1) Combined with seismic data and logging interpretation data of the study block, a 3D visualization geoengineering integrated model is established, which can truly reflect the geological characteristics of transverse and longitudinal heterogeneous distribution, which leads to the difference in fracture expansion scale in different oil formations and different wellbore perforation locations.
(2) Based on the overall reservoir fracturing economy evaluation, the upper Q7~Q9 reservoir is the best, the Q4~Q6 reservoir is the middle, the Q1~Q3 reservoir is the worst. Combined with the lithology characteristics, it can be seen that the reservoir with high shale content has strong plasticity, resulting in limited fracture reconstruction volume. Therefore, it is suggested to optimize the sweet spot according to the mud content, which is conducive to realizing efficient reconstruction.
(3) By analyzing the relationship between lithological differences and fracture propagation, a personalized fracturing design of “one strategy for each section” was proposed. Lithology was identified based on logging curves for local adjustments. For areas with strong lithological brittleness, the number of clusters can be appropriately increased and the cluster spacing reduced. For areas with strong lithological plasticity, the number of clusters can be appropriately reduced and the cluster spacing increased. This provides a new method for fracturing optimization for different heterogeneous reservoirs.

Author Contributions

Methodology, J.C.; Software, J.L., Z.G., X.J. and G.D.; Validation, J.C., M.C., Z.G. and G.D.; Formal analysis, X.J.; Resources, M.C.; Writing—original draft, J.L.; Writing—review & editing, J.L. All authors have read and agreed to the published version of the manuscript.

Funding

This research was funded by the Youth Fund Project of the National Natural Science Foundation of China (No. 52404027), the Joint Key Project of the National Natural Science Foundation (No. U24B2034), the General Program of the National Natural Science Foundation of China (No. 52274036), the Sponsored by CNPC Innovation Found (2024DQ02-0128), and the Postdoctoral fund of Heilongjiang Province (LBH-Z24098).

Data Availability Statement

The original contributions presented in the study are included in the article, further inquiries can be directed to the corresponding author.

Conflicts of Interest

Author Meng Cai was employed by the company Oil Production Engineering Research Institute in Daqing Oilfield Co., Ltd. The remaining authors declare that the research was conducted in the absence of any commercial or financial relationships that could be construed as a potential conflict of interest.

References

  1. Li, Q.; Wu, J.; Li, Q.; Zhou, X.; Li, Y.; Chi, P.; Han, Y.; Ansari, U.; Cheng, Y. Sediment Instability Caused by Gas Production from Hydrate-Bearing Sediment in Northern South China Sea by Horizontal Wellbore: Sensitivity Analysis. Nat. Resour. Res. 2025, 34, 1667–1699. [Google Scholar]
  2. Li, Q.; Li, Y.; Cheng, Y.; Li, Q.; Wang, F.; Wei, J.; Liu, Y.; Zhang, C.; Song, B.; Yan, C.; et al. Numerical simulation of fracture reorientation during hydraulic fracturing in perforated horizontal well in shale reservoirs. Energy Sources Part A Recovery Util. Environ. Eff. 2018, 40, 1807–1813. [Google Scholar] [CrossRef]
  3. Sun, L.; Zhu, R.; Zhang, T.; Cai, Y.; Feng, Z.; Bai, B.; Jiang, H.; Wang, B. Advances and trends of non-marine shale sedimentology: A case study from Gulong Shale of Daqing Oilfield, Songliao Basin, NE China. Pet. Explor. Dev. 2024, 51, 1367–1385. [Google Scholar] [CrossRef]
  4. Yuan, S.; Lei, Z.; Li, J.; Yao, Z.; Li, B.; Wang, R.; Liu, Y.; Wang, Q. Key theoretical and technical issues and countermeasures for effective development of Gulong shale oil, Daqing Oilfield, NE China. Pet. Explor. Dev. 2023, 50, 638–650. [Google Scholar] [CrossRef]
  5. Liu, H.; Huang, Y.; Cai, M.; Meng, S.; Tao, J. Practice and development suggestions of hydraulic fracturing technology in the Gulong shale oil reservoirs of Songliao Basin, NE China. Pet. Explor. Dev. 2023, 50, 688–698. [Google Scholar] [CrossRef]
  6. Wang, X.; Cui, B.; Feng, Z.; Shao, H.; Huo, Q.; Zhang, B.; Gao, B.; Zeng, H. In-situ hydrocarbon formation and accumulation mechanisms of micro- and nano-scale pore-fracture in Gulong shale, Songliao Basin, NE China. Pet. Explor. Dev. 2023, 50, 1269–1281. [Google Scholar] [CrossRef]
  7. Zhang, J.Y.; Zhu, R.K.; Wu, S.T.; Jiang, X.-H.; Liu, C.; Cai, Y.; Zhang, S.-R.; Zhang, T.-S. Microscopic oil occurrence in high-maturity lacustrine shales: Qingshankou Formation, Gulong Sag, Songliao Basin. Pet. Sci. 2023, 20, 2726–2746. [Google Scholar] [CrossRef]
  8. Meng, S.; Zhang, Z.; Xu, W.; Yu, H.; Wu, H.; Liu, H. A mixed phase-field model for fracture propagation behavior in Gulong shale with complex wavy bedding. J. Rock Mech. Geotech. Eng. 2025. [Google Scholar] [CrossRef]
  9. Han, Z.; Wang, G.; Wu, H.; Feng, Z.; Tian, H.; Xie, Y.; Wu, H. Lithofacies Characteristics of Gulong Shale and Its Influence on Reservoir Physical Properties. Energies 2024, 17, 779. [Google Scholar] [CrossRef]
  10. Meng, S.W.; Tao, J.P.; Li, T.J.; Li, D.-X.; Wang, S.-L.; Yang, L.; Liu, X.; Liang, L.-H.; Liu, H. Mechanical characteristics and reservoir stimulation mechanisms of the Gulong shale oil reservoirs, the northern Songliao Basin. Pet. Sci. 2024, 21, 2023–2036. [Google Scholar] [CrossRef]
  11. Sun, G.; Dong, W.; Zhang, X.; Zhong, J.; Sun, N. Study on Dolomite Thin Layers and Nodules in the Qingshankou Formation Shale Oil Reservoir of Gulong Sag. Energies 2023, 16, 3981. [Google Scholar] [CrossRef]
  12. Gu, M. Impact of anisotropy induced by shale lamination and natural fractures on reservoir development and operational designs. SPE Reserv. Eval. Eng. 2018, 21, 850–862. [Google Scholar] [CrossRef]
  13. Yan, W.; Wang, C.; Yin, S.; Wen, Z.; Zheng, J.; Fu, X.; Feng, Z.; Zhang, Z.; Zhu, J. A log-based method for fine-scale evaluation of lithofacies and its applications to the Gulong shale in the Songliao Basin, Northeast China. Energy Geosci. 2024, 5, 100291. [Google Scholar] [CrossRef]
  14. Alsuwaidi, E.S.; Xi, G.F.; Zimmerman, R.W. Mechanical characterization of Laffan and Nahr Umr anisotropic shales. J. Pet. Sci. Eng. 2021, 200, 108195. [Google Scholar] [CrossRef]
  15. Dong, Z.; Tian, S.; Xue, H.; Lu, S.; Liu, B.; Erastova, V.; Chen, G.; Zhang, Y. A novel method for automatic quantification of different pore types in shale based on SEM-EDS calibration. Mar. Pet. Geol. 2025, 173, 107278. [Google Scholar] [CrossRef]
  16. Dong, Z.; Tian, S.; Xue, H.; Lu, S.; Liu, B.; Erastova, V.; Wu, M.; Wu, R. Analysis of Pore Types in Lower Cretaceous Qingshankou Shale Influenced by Electric Heating. Energy Fuels 2024, 38, 20577–20590. [Google Scholar] [CrossRef]
  17. Liu, G.; Liu, G.; Shang, D.; Du, X. Characterization of brittleness index of gas shale and its influence on favorable block exploitation in southwest China. Front. Earth Sci. 2024, 12, 9378. [Google Scholar] [CrossRef]
  18. Shuoshi, W.; Zheng, G.; Ping, G.; Zhao, W. Comparative Laboratory Wettability Study of Sandstone, Tuff, and Shale Using 12-MHz NMR T1-T2 Fluid Typing: Insight of Shale. SPE J. 2024, 29, 4781–4803. [Google Scholar]
  19. Zhou, Y.; Guan, W.; Sun, Q.; Zou, X.; He, Z. Effect of multi-scale rough surfaces on oil-phase trapping in fractures: Pore-scale modeling accelerated by wavelet decomposition. Comput. Geotech. 2025, 179, 106951. [Google Scholar] [CrossRef]
  20. Gan, B.; Li, Z.; Huo, W.; Zhang, Y.; Li, Z.; Fan, R.; Zhang, H.; Xu, Y.; He, Y. Phase transitions of CH4 hydrates in mud-bearing sediments with oceanic laminar distribution: Mechanical response and stabilization-type evolution. Fuel 2025, 380, 133185. [Google Scholar] [CrossRef]
  21. Ren, Q.Q.; Li, L.F.; Wang, J.; Jiang, R.T.; Li, M.P.; Feng, J.W. Dynamic evolution mechanism of the fracturing fracture system—Enlightenments from hydraulic fracturing physical experiments and finite element numerical simulation. Pet. Sci. 2024, 21, 3839–3866. [Google Scholar] [CrossRef]
  22. Niu, Q.; Hu, M.; Chang, J.; Wang, W.; Yuan, W.; Wang, Q.; Zheng, Y.; Shang, S. Explosive fracturing mechanism in low-permeability sandstone-type uranium deposits considering different acidification reactions. Energy 2024, 312, 133676. [Google Scholar] [CrossRef]
  23. Dehghan, A.N.; Goshtasbi, K.; Ahangari, K.; Jin, Y. The effect of natural fracture dip and strike on hydraulic fracture propagation. Int. J. Rock Mech. Min. Sci. 2015, 75, 210–215. [Google Scholar] [CrossRef]
  24. Zhang, R.X.; Hou, B.; Han, H.F.; Fan, M.; Chen, M. Experimental investigation on fracture morphology in laminated shale formation by hydraulic fracturing. J. Pet. Sci. Eng. 2019, 177, 442–451. [Google Scholar] [CrossRef]
  25. Tan, P.; Pang, H.; Zhang, R.X.; Jin, Y.; Zhou, Y.; Kao, J.; Fan, M. Experimental investigation into hydraulic fracture geometry and proppant migration characteristics for southeastern Sichuan deep shale reservoirs. J. Pet. Sci. Eng. 2019, 184, 106517. [Google Scholar] [CrossRef]
  26. Huang, B.X.; Liu, J.W. Experimental investigation of the effect of bedding planes on hydraulic fracturing under true triaxial stress. Rock Mech. Rock Eng. 2017, 50, 2627–2643. [Google Scholar] [CrossRef]
  27. Li, M.; Zhou, F.; Sun, Z.; Dong, E.; Zhuang, X.; Yuan, L.; Wang, B. Experimental study on plugging performance and diverted fracture geometry during different temporary plugging and diverting fracturing in Jimusar shale. J. Pet. Sci. Eng. 2022, 215, 110580. [Google Scholar] [CrossRef]
  28. Li, J.; Wang, S.; Dong, K.; Meng, S.; Lu, Q.; Li, Z. Effects of in-situ temperature in deep reservoirs on shale fracture properties. Energy Rep. 2023, 9, 73–83. [Google Scholar] [CrossRef]
  29. Wang, Y.; Liu, D.Q.; Zhao, Z.H.; Wang, H.J. Investigation on the effect of confining pressure on the geomechanical and ultrasonic properties of black shale using ultrasonic transmission and post-test CT visualization. J. Pet. Sci. Eng. 2020, 185, 106630. [Google Scholar] [CrossRef]
  30. Li, J.; Xie, M.; Wang, S.; Meng, S.; Dong, K.; Lu, Q. Study on the influence of thermo-pressure coupling environment on the fracture properties of shale in deep reservoirs. Theor. Appl. Fract. Mech. 2024, 131, 104440. [Google Scholar] [CrossRef]
  31. Wei, M.D.; Dai, F.; Xu, N.W.; Zhao, T.; Xia, K.W. Experimental and numerical study on the fracture process zone and fracture toughness determination for ISRM-suggested semi-circular bend rock specimen. Eng. Fract. Mech. 2016, 154, 43–56. [Google Scholar] [CrossRef]
  32. Li, Y.; Wang, J.; Wang, D.; Guo, Z.; Tang, H.; Zhang, L. A 3D fully coupled numerical model for multi-cluster fracturing with perforation erosion. Geoenergy Sci. Eng. 2025, 250, 213805. [Google Scholar] [CrossRef]
  33. Suo, Y.; Li, Z.-H.; Fu, X.-F.; Zhang, C.-C.; Jia, Z.-J.; Peng, D.-Z.; He, W.-Y.; Pan, Z.-J. Comprehensive study of hydraulic fracturing in shale oil reservoirs comprising shale–sandstone transitions. Phys. Fluids 2024, 36, 077161. [Google Scholar] [CrossRef]
  34. Li, M.-H.; Zhou, F.-J.; Wang, B.; Hu, X.-D.; Wang, D.-B.; Zhuang, X.-Y.; Han, S.-B.; Huang, G.-P. Numerical simulation on the multiple planar fracture propagation with perforation plugging in horizontal wells. Pet. Sci. 2022, 19, 2253–2267. [Google Scholar] [CrossRef]
  35. Feng, M.J.; Li, H.L.; Liu, H.J.; Zhou, L.; Chen, J.; Ren, X. 3d numerical investigation of hydraulic fracture network propagation in a shale gas reservoir with natural and layered discontinuities under fully hydromechanical coupling. J. Porous Media 2021, 24, 51–75. [Google Scholar] [CrossRef]
  36. Zhang, H.; Chen, J.; Li, Z.; Hu, H.; Mei, Y. Numerical Simulation of Multi-cluster Fracturing Using the Triaxiality Dependent Cohesive Zone Model in a Shale Reservoir with Mineral Heterogeneity. Rock Mech. Rock Eng. 2023, 57, 1–25. [Google Scholar] [CrossRef]
  37. Chen, M.; Zhang, S.C.; Xu, Y. A numerical method for simulating planar 3D multi-fracture propagation in multi-stage fracturing of horizontal wells. Pet. Explor. Dev. 2020, 47, 171–183. [Google Scholar] [CrossRef]
  38. Cheng, Y. Mechanical interaction of multiple fractures-exploring impacts of the spacing/number of perforation clusters on horizontal shale-gas wells. SPE J. 2012, 17, 992–1001. [Google Scholar] [CrossRef]
  39. Zhu, H.Y.; Jin, X.C.; Guo, J.C.; An, F.C.; Wang, Y.H.; Lai, X. Coupled flow stress and damage modelling of interactions between hydraulic fractures and natural fractures in shale gas reservoirs. Oil Gas Coal Technol. 2016, 13, 359–390. [Google Scholar] [CrossRef]
  40. Zhang, F.; Wang, X.; Tang, M.; Du, X.; Xu, C.; Tang, J.; Damjanac, B. Numerical Investigation on Hydraulic Fracturing of Extreme Limited Entry Perforating in Plug-and-Perforation Completion of Shale Oil Reservoir in Changqing Oilfield, China. Rock Mech. Rock Eng. 2021, 54, 2925–2941. [Google Scholar] [CrossRef]
  41. Chen, H.; Liu, H.; Shen, C.; Xie, W.; Liu, T.; Zhang, J.; Lu, J.; Li, Z.; Peng, Y. Research on Geological-Engineering Integration Numerical Simulation Based on EUR Maximization Objective. Energies 2024, 17, 3644. [Google Scholar] [CrossRef]
  42. Tang, J.; Wang, X.; Du, X.; Xianfei, D.U.; Bing, M.A. Optimization of integrated geological-engineering design of volume fracturing with fan-shaped well pattern. Pet. Explor. Dev. 2023, 50, 971–978. [Google Scholar] [CrossRef]
  43. Zeng, J.; Li, W.; Fang, H.; Huang, X.; Wang, T.; Zhang, D.; Yuan, S. The hydraulic fracturing design technology and application of geological-engineering integration for tight gas in jinqiu gas field. Front. Energy Res. 2022, 1003660. [Google Scholar] [CrossRef]
  44. Liu, Y.; Ma, X.; Zhang, X.; Guo, W.; Kang, L.; Yu, R.; Sun, Y. 3D geological model-based hydraulic fracturing parameters optimization using geology-engineering integration of a shale gas reservoir: A case study. Energy Rep. 2022, 8, 10048–10060. [Google Scholar] [CrossRef]
  45. Bo, L.; Suoliang, C.; Sheng, Z.; Chen, Q.; Zhang, J.; Li, Y.; Liu, J. Coalbed methane gas content and its geological controls: Research based on seismic-geological integrated method. J. Nat. Gas Sci. Eng. 2022, 101, 104510. [Google Scholar]
  46. Ashraf, U.; Zhang, H.; Anees, A.; Zhang, X.; Duan, L. Assessment of lake-level variations to decipher geological controlling factors and depositional architecture of Lake Fuxian, Yunnan Plateau: Preliminary insights from geophysical data. Geomech. Geophys. Geo-Energy Geo-Resour. 2024, 10, 1–26. [Google Scholar] [CrossRef]
  47. Meng, L.; Zhang, X.; Jin, Y.; Yan, K.; Li, Z.; Fu, H.; Li, S. Prediction model and real-time diagnostics of hydraulic fracturing pressure for highly deviated wells in deep oil and gas reservoirs. Sci. Rep. 2025, 15, 3559. [Google Scholar] [CrossRef]
  48. Ashraf, U.; Zhang, H.; Anees, A.; Nasir Mangi, H.; Ali, M.; Ullah, Z.; Zhang, X. Application of Unconventional Seismic Attributes and Unsupervised Machine Learning for the Identification of Fault and Fracture Network. Appl. Sci. 2020, 10, 3864. [Google Scholar] [CrossRef]
  49. Cao, D.; Zeng, L.; Gomez-Rivas, E.; Gong, L.; Liu, G.; Lu, G.; Bons, P.D. Correction of linear fracture density and error analysis using underground borehole data. J. Struct. Geol. 2024, 184, 105152. [Google Scholar] [CrossRef]
  50. Ren, J.; Lun, Z.; Anzhu, X.; Ashraf, U.; Yin, J.; Song, H.; Su, N.; Du, B.; Anees, A. Sweet spots prediction through fracture genesis using multi-scale geological and geophysical data in the karst reservoirs of Cambrian Longwangmiao Carbonate Formation, Moxi-Gaoshiti area in Sichuan Basin, South China. J. Pet. Explor. Prod. Technol. 2022, 12, 1313–1328. [Google Scholar]
  51. Lei, Z.; Meng, S.; Peng, Y.; Tao, J.; Liu, Y.; Liu, H. Evaluation of the adaptability of CO2 pre-fracturing to Gulong shale oil reservoirs. Pet. Explor. Dev. 2025, 52, 1–11. [Google Scholar] [CrossRef]
  52. Wang, S. Optimization of fracturing construction parameters for Gulong Shale Oil with horizontal wells in Songliao Bain. Pet. Geol. Eng. 2023, 37, 94–99. [Google Scholar]
Figure 1. A map of shale oil exploration results of Songliao Basin [5].
Energies 18 03066 g001
Figure 2. The 3D model construction of the geological Gulong shale structure.
Energies 18 03066 g002
Figure 3. The natural fracture model.
Energies 18 03066 g003
Figure 4. The sedimentary facies model.
Energies 18 03066 g004
Figure 5. The 3D model of the physical reservoir properties.
Energies 18 03066 g005aEnergies 18 03066 g005b
Figure 6. The 3D reservoir mechanics model.
Energies 18 03066 g006
Figure 7. Fracturing model and field data validation.
Energies 18 03066 g007aEnergies 18 03066 g007b
Figure 8. The historical fitting curves of the daily fluid volume and bottomhole flow pressure.
Energies 18 03066 g008
Figure 9. The SRV results of all the fracturing stages in the different reservoirs.
Energies 18 03066 g009aEnergies 18 03066 g009b
Figure 10. A comparison between the fracturing economy values of the different reservoir layers.
Energies 18 03066 g010
Figure 11. The SRV results of the different cluster quantities and spacings in the Q9 reservoir layer.
Energies 18 03066 g011
Figure 12. The SRV results of the different cluster quantities and spacings in the Q3 reservoir layer.
Energies 18 03066 g012aEnergies 18 03066 g012b
Figure 13. Economic comparison between the Q9 and Q3 reservoirs in different fracturing designs.
Energies 18 03066 g013
Figure 14. Comparison of SRV and mudstone content in full-well fracturing stages.
Energies 18 03066 g014
Figure 15. The fracture morphology of a single stage in the superior fracturing area of the Q9 reservoir.
Energies 18 03066 g015
Figure 16. The fracture morphology of a single stage in the inferior fracturing area of the Q9 reservoir.
Energies 18 03066 g016
Figure 17. The fracture morphology of a single stage in the superior fracturing area of the Q3 reservoir.
Energies 18 03066 g017
Figure 18. The fracture morphology of a single stage in the inferior fracturing area of the Q3 reservoir.
Energies 18 03066 g018
Figure 19. The SRV results of the superior and inferior areas in the reservoir.
Energies 18 03066 g019
Table 1. Results of model verification.
WellAverage Fracture Length (Simulation)/mAverage Fracture Length (Actual)
/m
Average Fracture Height (Simulation)
/m
Average Fracture Height (Actual)
/m
Cumulative Fluid Production (Simulation)/m3Cumulative Fluid Production (Actual)/m3
Q9-X18018588.519371884
Q8-X1781817.68.219101871
Q6-X1611666.87.118121795
Q5-X1651727.27.718461811
Q3-X1401446.26.516541613
Disclaimer/Publisher’s Note: The statements, opinions and data contained in all publications are solely those of the individual author(s) and contributor(s) and not of MDPI and/or the editor(s). MDPI and/or the editor(s) disclaim responsibility for any injury to people or property resulting from any ideas, methods, instructions or products referred to in the content.

