Article

Reliability Assessment of Ecuador’s Power System: Metrics, Vulnerabilities, and Strategic Perspectives

by
Diego Peña
1,2,
Alexander Aguila Téllez
2,* and
Francisco Jurado
1
1
Department of Electrical Engineering, Universidad de Jaén, 23700 Jaén, Spain
2
GIREI Research Group, Electrical Engineering Department, Universidad Politécnica Salesiana, Quito 170525, Ecuador
*
Author to whom correspondence should be addressed.
Energies 2025, 18(12), 3059; https://doi.org/10.3390/en18123059
Submission received: 1 May 2025 / Revised: 30 May 2025 / Accepted: 5 June 2025 / Published: 10 June 2025

Abstract

Ecuador’s power system has experienced a significant decline in reliability due to its strong reliance on hydroelectric generation, which constituted 67.4% of the national energy mix in 2024. The severe drought of 2023–2024 severely diminished generation capacity, exposing critical vulnerabilities in the National Interconnected System. Under actual operating conditions, the system recorded a loss of load expectation (LOLE) of 91 days per year in 2024. Projections indicate that, without urgent corrective actions, energy deficits could exceed 250 days per year by 2029. Addressing these challenges demands a diversification of the energy matrix, integrating flexible generation sources, energy storage systems, and expanded deployment of solar and wind technologies. Achieving international reliability benchmarks (LOLE ≤ 0.1 days/year) will be essential to ensuring a secure and resilient electricity supply. This study underscores that, without strategic intervention, Ecuador may face prolonged energy crises, offering a cautionary outlook for power systems heavily dependent on climate-sensitive resources.

1. Introduction

Electric reliability has traditionally been evaluated through probabilistic metrics that estimate system performance under contingency conditions. These studies have evolved from classical indicators such as Loss of Load Expectation (LOLE) and Expected Energy Not Supplied (EENS) to more sophisticated approaches that incorporate aspects like operational flexibility, uncertainty associated with renewable generation, and the system’s adaptive capacity under dynamic scenarios. LOLE estimates the number of hours per year during which demand exceeds available generation (expressed in hours/year), while EENS quantifies the energy not delivered due to system failures or inadequacies (measured in MWh/year) [1,2].
Both LOLE and EENS have been widely applied in simulation studies of the Ecuadorian power grid, particularly in probabilistic contingency assessment scenarios. These analyses have been complemented by Monte Carlo techniques and stochastic models, allowing for a more accurate estimation of operational robustness under unexpected events or critical conditions [3]. Moreover, recent tools such as Failure Precursor Parameters (FPPs), which integrate multivariable analysis and physical modeling to anticipate failures, represent a significant advancement in preventive infrastructure monitoring [4]. Likewise, the implementation of optimized maintenance algorithms, such as the Mayfly algorithm—based on Lévy flights and chaotic search strategies—has opened new research avenues for proactive asset management in power systems [5]. While many of these approaches remain in experimental stages, their gradual integration could provide substantial improvements for systems with high levels of technological obsolescence and low operational efficiency, as is the case with the Ecuadorian system.
Given this context, the incorporation of advanced methodologies becomes especially critical. Various studies applied to Ecuador’s power system have shown that, although the Master Electrification Plan (PME) outlines structural improvements and infrastructure expansion, its long-term impact on reliability will depend on the effective adoption of predictive models and advanced simulation tools [3,6]. However, the 2023–2024 energy crisis exposed the limitations of such planning. During this period, a severe drought in the eastern region of the country drastically reduced hydroelectric generation, affecting strategic plants like Hidropaute and Sopladora, which operated below 50% of their capacity [7,8]. This was compounded by structural fissures in Coca Codo Sinclair, the country’s largest hydroelectric plant, compromising its safe operation [9,10,11].
Furthermore, the energy crisis coincided with a sustained increase in demand driven by demographic growth. Between 2010 and 2024, Ecuador’s population rose from 14.5 to 18.7 million inhabitants [12,
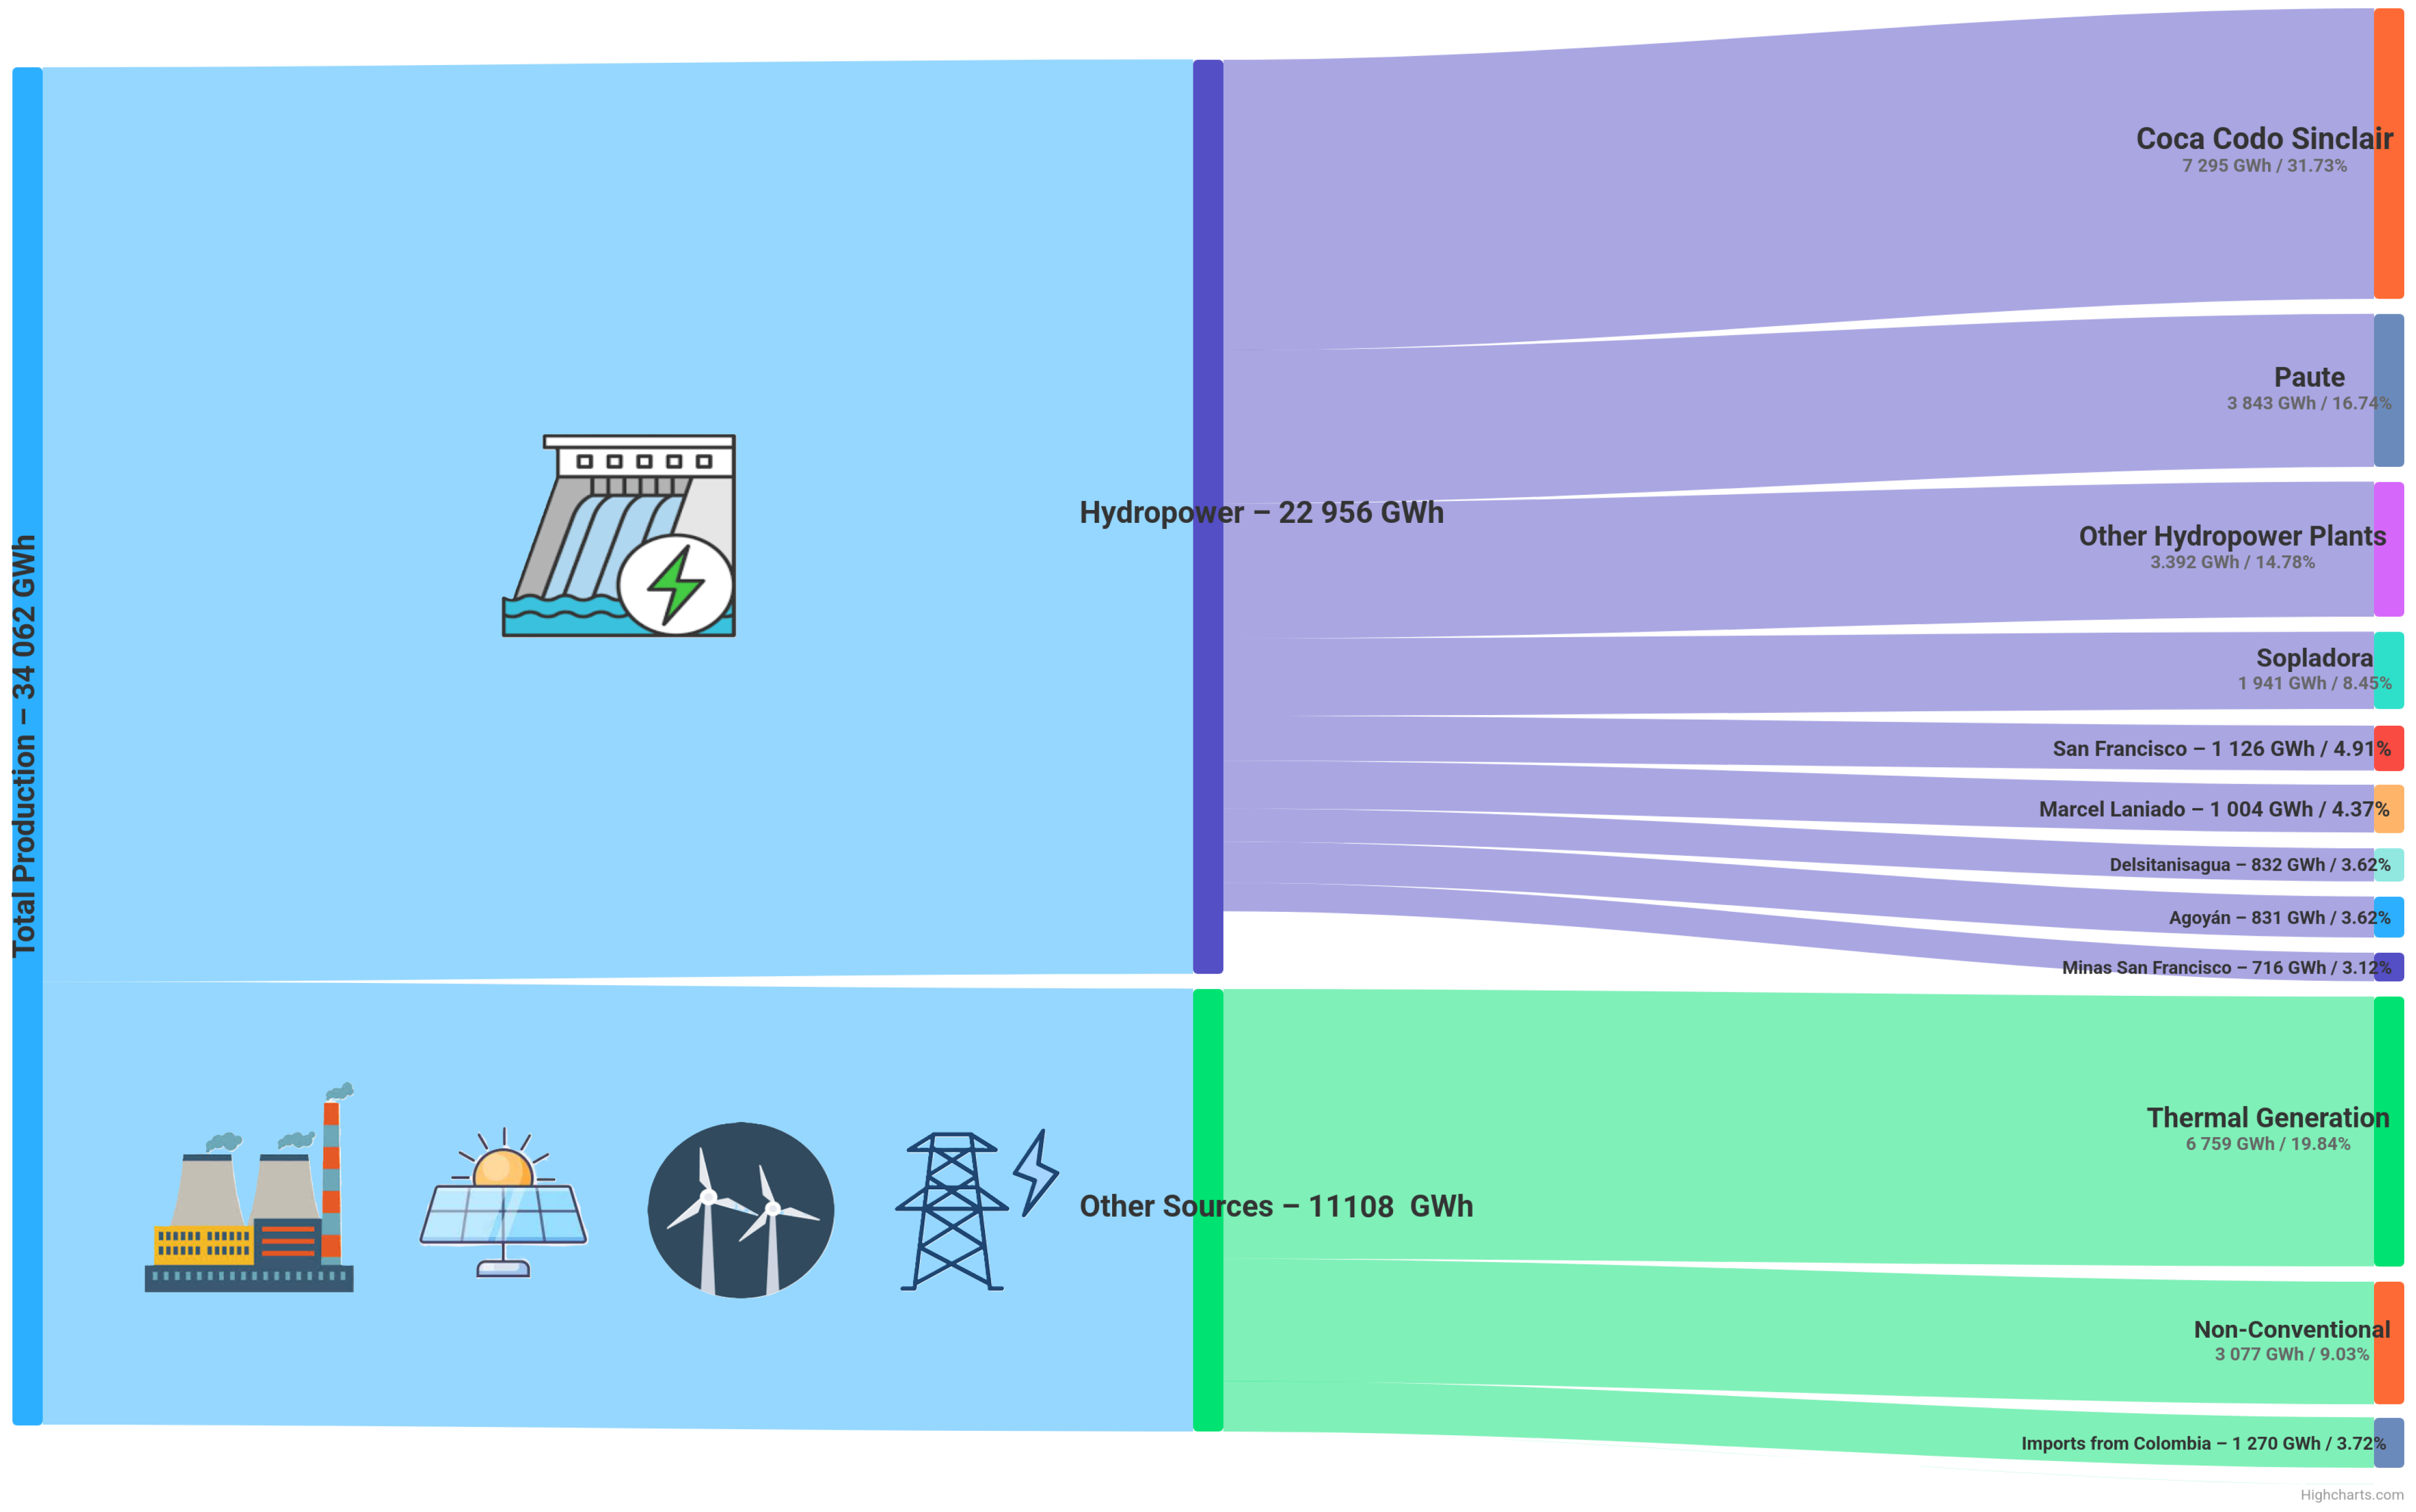
13], significantly increasing energy requirements, particularly in the residential and industrial sectors. In 2024, national electricity generation reached 34,062 GWh [14]; however, this was insufficient to meet the estimated peak-hour shortfall of 1600 MW [15]. This energy gap led to the implementation of power rationing of up to 14 h per day [16], causing widespread impacts on the population, agricultural production, industrial and commercial activity, and even institutional stability. Compounding this situation was the limited availability of thermal generation, which failed to provide effective backup for the hydroelectric shortfall. A notable case is the Termogas Machala plant, with an installed capacity of 230 MW, which contributed only 60 MW during the crisis due to a shortage of natural gas [17]. The supply of this resource was particularly critical, with just 21 million cubic feet available per day, compared to a demand of 95 million [18], making optimal use of the national thermal fleet unfeasible and further aggravating the collapse of the interconnected system.
Given the national system’s inability to meet growing demand, the interconnection with Colombia became a key tool to mitigate the energy deficit during 2024. Through this mechanism, Ecuador imported 1267 GWh and exported only 45.16 GWh, revealing its increasing reliance on external resources [19]. However, this measure is essentially temporary and financially costly, and does not represent a structural solution to the imbalance between national supply and demand. As an immediate response, the government enacted emergency measures that included contracts exceeding USD 230 million with companies such as Progen and Austral Technical Management for the deployment of mobile thermal generators: 50 MW in Quevedo, 100 MW in Salitral, and an additional 91 MW across various regions of the country. Additionally, a Turkish power-generating barge was leased in Las Esclusas at a high price of 14.37 cents per kWh, significantly above the national average [16,17,18]. While these decisions were palliative, they underscore the urgent need to adopt forward-looking energy planning that does not rely solely on external mechanisms or reactive crisis responses. Acknowledging this necessity, the government began promoting economic solutions and expanding renewable energy generation to overcome the energy crisis, optimize public resources, and attract private investment in the electric sector [20].
The reliability of electricity supply is a cornerstone of Ecuador’s socioeconomic development, directly influencing economic stability, industrial competitiveness, and quality of life. Ensuring continuous and efficient operation of the electric system is crucial; any failure can have serious economic and social consequences, highlighting the importance of implementing preventive strategies to maintain system stability [21,22]. In response to these challenges, this study presents a technical evaluation of the reliability of Ecuador’s electric system, emphasizing the analysis of its current infrastructure, identification of operational vulnerabilities, and proposal of strategic alternatives aimed at system strengthening. To this end, the recursive method was employed, which enables modeling of various combinations of system failures and analysis of performance under contingency conditions. This tool is particularly useful for anticipating critical scenarios and supporting decision-making in energy planning.
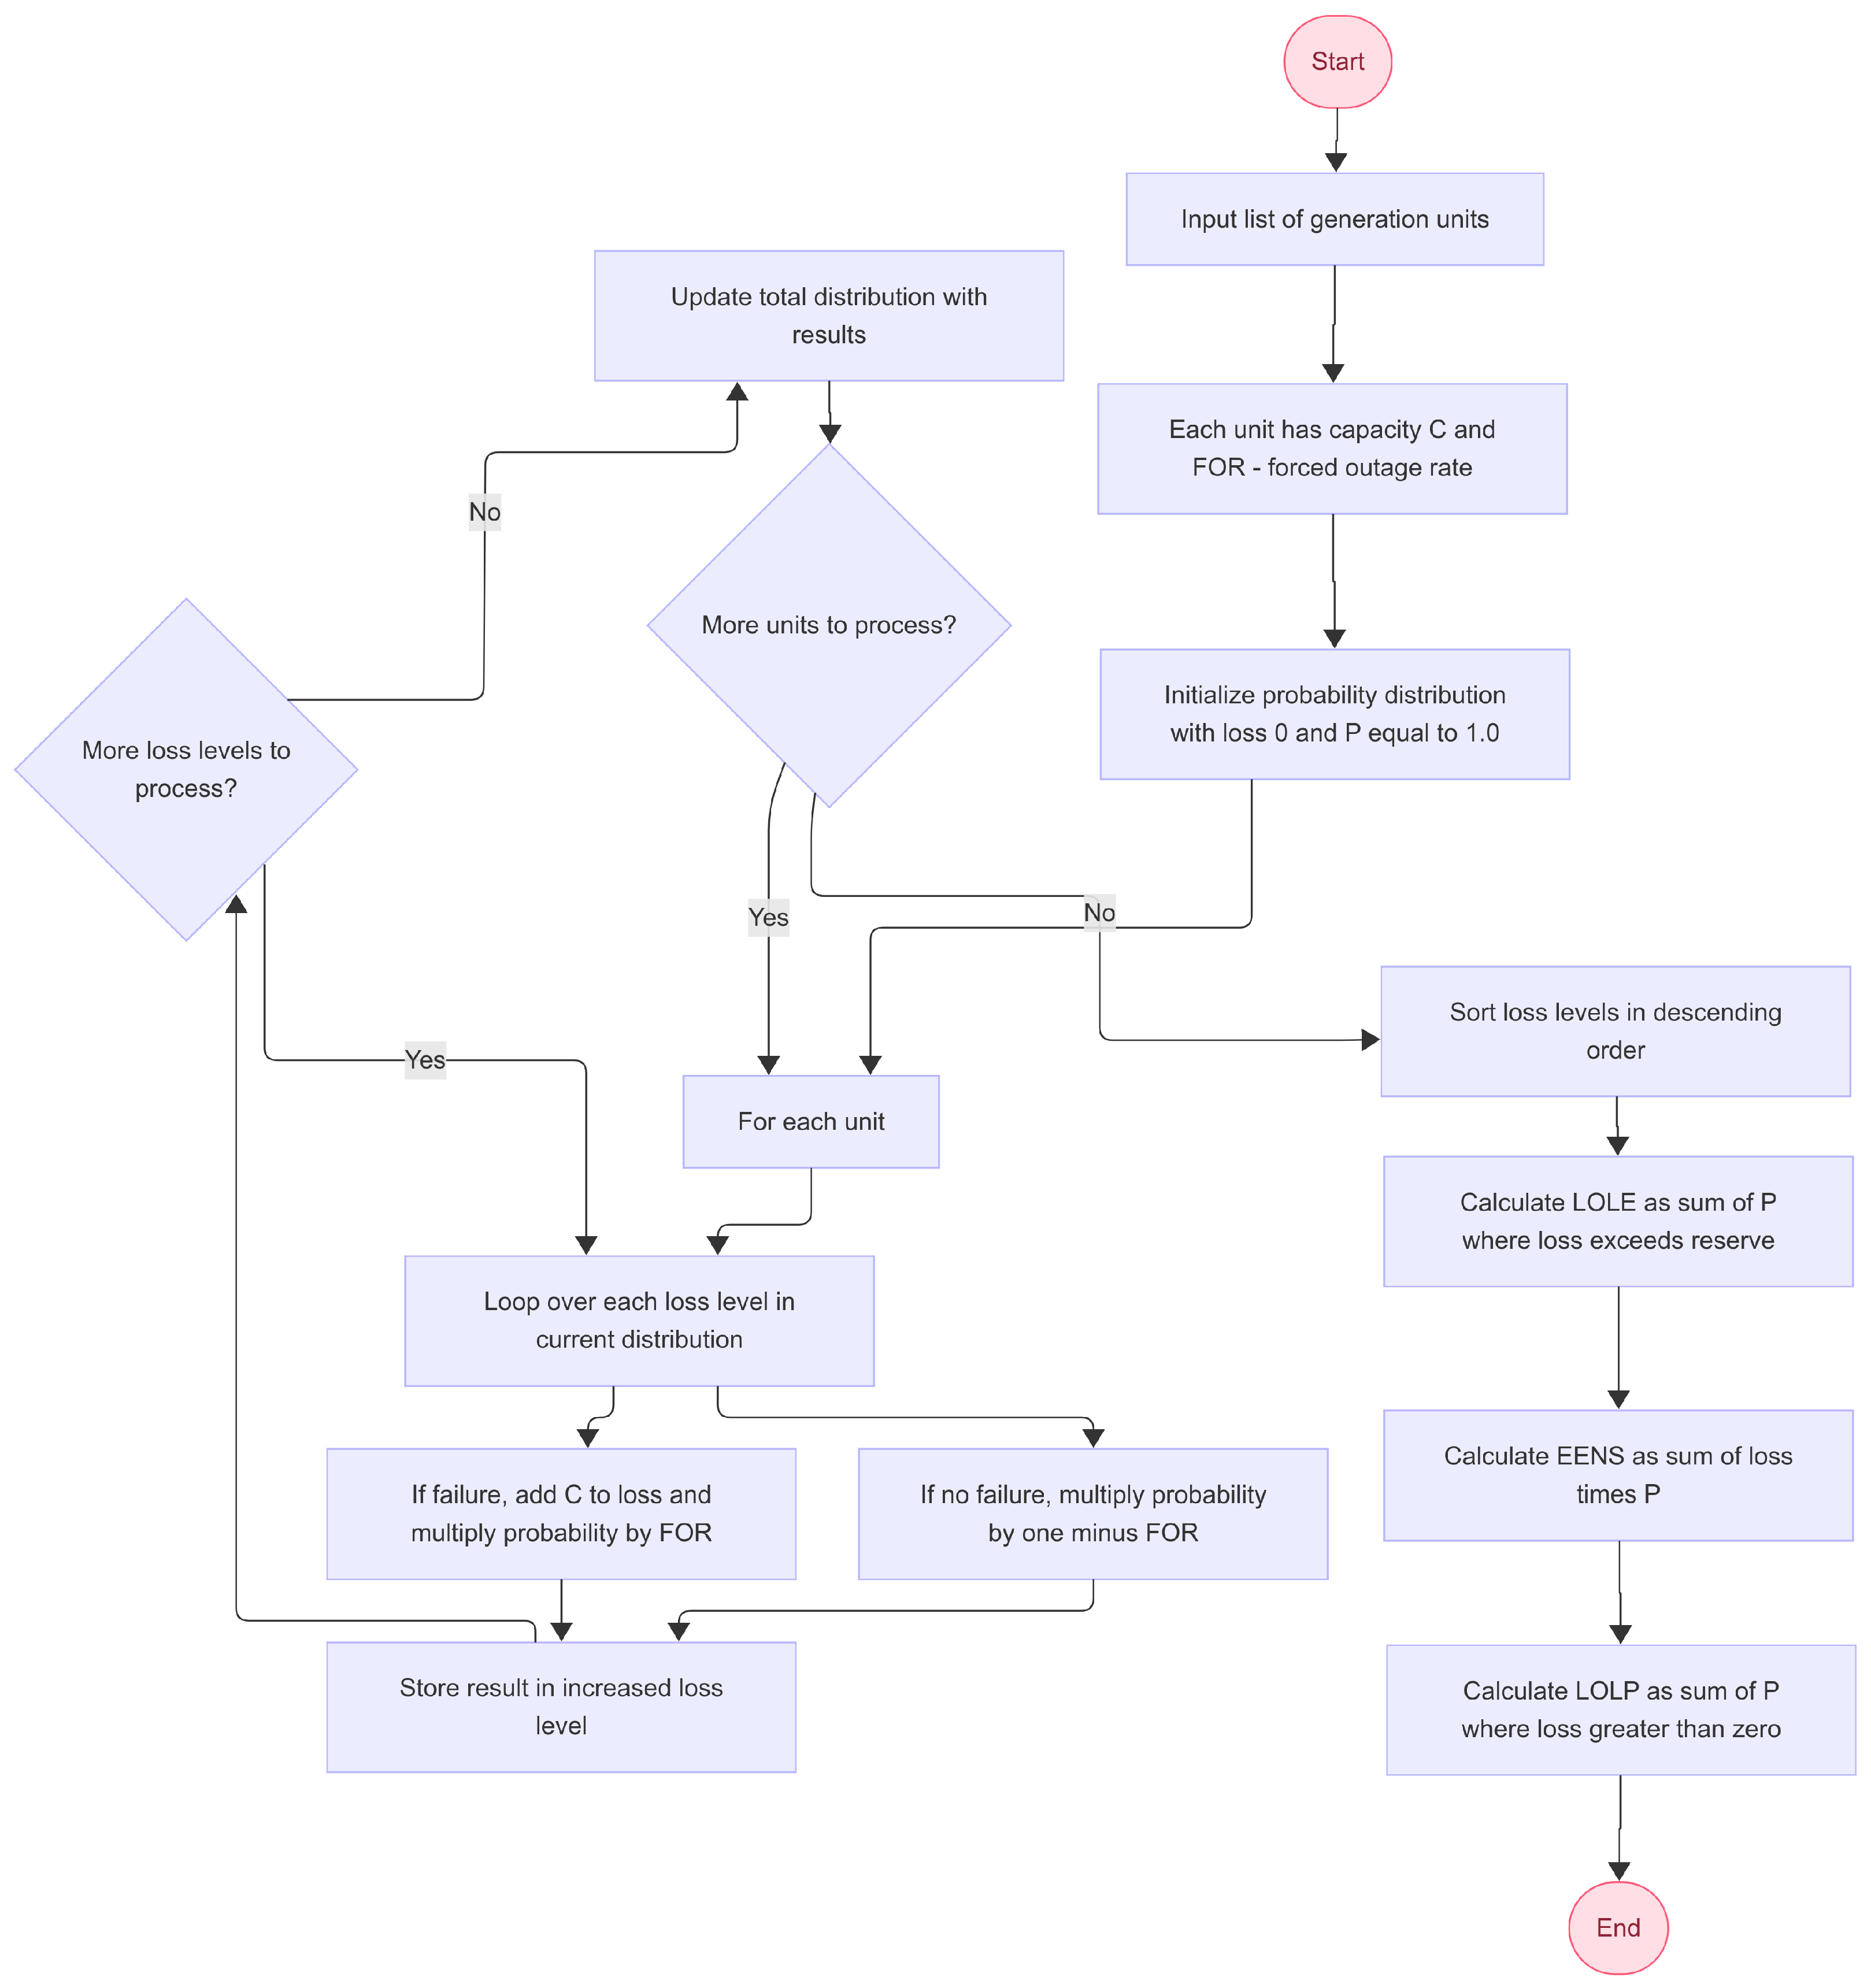
The main contribution of this study lies in the development of a reliability assessment methodology specifically designed for the structural and operational characteristics of SNI. The proposed model integrates real operational data, regional generation constraints, and realistic failure scenarios into a probabilistic framework that accurately captures system behavior under contingency conditions. A core innovation is the implementation of a recursive method capable of evaluating a configuration space derived to 369 generation units resulting in over 2 369 potential system states without resorting to approximation or truncation. This approach enables a high-resolution quantification of supply risk across diverse operational scenarios. By computing established reliability indices such as LOLE, EENS, and EIR, this study identifies structural vulnerabilities and proposes technically sound strategies to enhance system resilience. This work offers a replicable and scalable tool that bridges probabilistic reliability analysis with the specific challenges of Ecuador’s power system, contributing to more informed, forward-looking energy planning.
This study is structured into six sections: a contextual introduction to the problem, a description of the methodology used, the presentation and analysis of results, formulation of conclusions and recommendations, and finally, the bibliographic references supporting the development of the project.

2. Materials and Methods

2.1. Materials

For this study, a comprehensive database was compiled from multiple official sources, including the Master Electrification Plan 2023–2032 [23], the monthly and annual management reports of the National Electricity Operator (CENACE) [24,25], the Open Data portal of the Government of Ecuador [26], the Agency for Regulation and Control of Energy and Non-Renewable Natural Resources (ARCERNNR) [7], as well as technical publications such as the journal Panorama Eléctrico* [27,28,29].
In addition, reference guidelines from the North American Electric Reliability Corporation (NERC) [30] and other specialized repositories on Ecuador’s power sector were consulted. The information gathered focused exclusively on characterizing the national power generation system.
The generation system model was developed entirely in Python, which enabled efficient data manipulation and application of quantitative analysis techniques. The reliability assessment was based on probabilistic approaches using stochastic processes, recognized for their ability to dynamically represent state transitions in complex systems while accounting for variations in demand and resources.
To validate methodological consistency, the IEEE Reliability Test System (RTS) was used as a benchmark, a globally accepted standard for reliability studies. The model allowed for the computation of 3180 states without truncation or approximation, and its consistency was verified through comparison with published RTS results. Although the comparative data are not presented here, the validation process supports the model’s applicability to real-world scenarios. The following sections outline the concepts, assumptions, and technical considerations applied throughout the development of this research.
While a comparative analysis with alternative modeling approaches, such as discrete-time Markov state-space methods, was not conducted, this omission is methodologically justified. Recursive convolution algorithms such as the one employed in this study are recognized for their computational efficiency and ability to handle large-scale systems without resorting to state-space truncation. As demonstrated in foundational works by [31,32], Markov models, though mathematically rigorous, become impractical when modeling generation fleets with hundreds of units due to the exponential growth of state combinations. In the context of SNI, which comprises 369 generation units, the recursive approach enables a full-state evaluation with exact probabilities, preserving the granularity and accuracy of the results.
This methodological choice reflects a balance between theoretical robustness and computational feasibility. By avoiding approximation schemes, the proposed model captures a wider range of critical scenarios that may otherwise go undetected, enhancing the credibility of the reliability indices derived. Consequently, the absence of a comparative study does not undermine the validity of the results; rather, it highlights the necessity of using scalable and precise tools when addressing complex, real-world systems.

2.1.1. Characterization of the SNI Generation System

The reliability analysis is based on the operational structure of Ecuador’s National Interconnected System (SNI) during 2023–2024, in order to reflect real operating conditions. According to CENACE, the installed capacity was 7357.8 MW in 2023 and 7468.76 MW in 2024. However, for reliability purposes, the analysis considers effective power, which accounts for technical restrictions and actual availability conditions [14].
During this period, the SNI consisted of 139 power plants with a total effective capacity of 7177 MW, distributed across 369 active units (see Table A1 in the Appendix for further details). Table 1 presents the technological breakdown of the system in terms of effective capacity and number of units. A high concentration in hydroelectric generation is observed, accounting for over 70% of the installed capacity. This is followed by thermal generation, and to a lesser extent, non-conventional sources such as wind, photovoltaic, biomass, and biogas energy, which contribute to the diversification of the national energy matrix [25].
This technological configuration of the SNI aligns with the production patterns observed in 2024, in which hydropower maintained its predominant role, followed by thermal generation and non-conventional sources such as solar and wind. According to official data from the ARCERNNR [7], hydroelectric generation accounted for 67.4% of the national total, highlighting the system’s heavy reliance on a single energy source. While historically efficient, this concentration represents a structural vulnerability to extreme hydrological events, such as those recorded during the 2023–2024 energy crisis. Figure 1 summarizes this distribution through a Sankey diagram, emphasizing both the system’s dependency on hydropower and the gradual diversification toward complementary renewable sources.

2.1.2. Construction of the Daily Demand Curve

To represent the daily profile of electricity demand (Figure 2), an approximate method was used based on data published by the journal Panorama Eléctrico, which provides daily curves for selected months of the year only. Curves that were available for six months in each year (2023 and 2024) were collected and normalized in per unit (p.u.) with respect to their monthly maximum values [24,26,27,28,29].
Next, an average daily curve in p.u. was computed from the selected months, resulting in a representative curve that reflects the typical system behavior. This curve was then scaled using monthly peak demand values published by CENACE, enabling the construction of a complete daily series for all twelve months. The resulting curve is consistent and continuous, suitable for reliability assessments and energy simulations.

2.1.3. Data Preprocessing

A structured preprocessing stage was essential to prepare the technical input data for the probabilistic reliability model of the national generation fleet. Initially, operational records were filtered to exclude decommissioned units, ensuring that only actively available units for the 2023–2024 study horizon were retained.
A key challenge arose from units reporting non-integer capacity values, which substantially increased the state-space dimensionality and computational burden of the recursive algorithm. To address this, a group-based compensated rounding method was applied. Generation units were categorized by technology type and FOR, and within each group, capacities were adjusted to the nearest lower integer. The total rounding residual was then redistributed among group members, giving priority to those whose original capacities were closest to the next higher integer. This approach preserved the aggregate group capacity with minimal distortion while improving computational efficiency, without compromising the model’s fidelity. Similar methods have been endorsed in prior work on state-space reduction and deterministic reliability modeling [31].

2.2. Methods

2.2.1. System Reliability Parameters

In power systems, generation units are not continuously available due to unplanned outages or maintenance activities. To represent this behavior, two key parameters are used: availability (AV) and the forced outage rate (FOR) [19].
FOR is defined as the proportion of total time during which a unit is out of service due to unplanned causes. This metric is essential for evaluating the operational reliability of power systems.
Mathematically, it is expressed as
FOR = t 1 + t 2 + t 3 T t o t a l
where t 1 , t 2 , and t 3 represent the time intervals during which the unit was out of operation due to unexpected failures, and T t o t a l is the total observed time.
Availability refers to the proportion of total time during which a unit is operational and available to generate electricity. It is defined as
AV = t servicio T t o t a l
where t servicio is the effective time the unit was in operation.
Furthermore, the following fundamental relationship holds between availability and the forced outage rate:
AV + FOR = 1
This equation indicates that the sum of available time and outage time, expressed as proportions of the total time, must equal one. Therefore, any increase in the forced outage rate directly reduces the system’s availability. As illustrated in Figure 3, availability represents the proportion of time a unit is operational.
Due to the lack of verified data on the FOR of generation units in the Ecuadorian system, the GADS database from NERC was used as a reference. This database consolidates reliability statistics up to 2024 [33]. The period from 2018 to 2024 was considered to obtain a representative average by technology type and capacity range. FOR was applied to base-load units, and EFORd was used for cycling units. Table 2 presents the adopted values, classified by the technologies present in the SNI.

2.2.2. Probabilistic State Calculation

The generation loss estimation was performed using a recursive probabilistic model. The main steps of this method are illustrated in Figure 4, which summarizes the update of loss distributions and the calculation of reliability indices [34]:
P ( X ) = ( 1 FOR ) · P ( X ) + FOR · P ( X C )
where P ( X ) represents the probability of the preceding state, that is, before the unit with capacity C is added. When adding the first unit, two base states are defined:
P ( 0 ) = 1 FOR and P ( C ) = FOR
Additionally, the model assumes
P ( X C ) = 0 whenever X < C
The recursive logic for computing the loss probability distribution is presented in Algorithm 1, which was implemented in Python 3.10.12 to enable full state-space evaluation without approximation.
Algorithm 1: Probabilistic Capacity Outage Modeling
Energies 18 03059 i001

2.2.3. Reliability Indicator Calculation

The following indicators assess both the frequency and the energy impact of load loss events in the power system, providing essential criteria for planning under uncertainty:
  • LOLP (Loss of Load Probability): Probability that demand exceeds the available generation capacity [35].
    LOLP = P ( X > C L )
  • LOLE (Loss of Load Expectation): Expected number of periods with generation shortfalls [36,37].
    LOLE = i = 1 n P i ( C i L i )
    where P i is the probability of a loss in period i.
  • EENS (Expected Energy Not Supplied): Energy not delivered due to insufficient generation capacity, calculated from the expected power not supplied [38]:
    EPNS = ( P N S × P E N S ) [ MW / year ]
    where P N S denotes the power not supplied in a specific state, and P E N S represents the probability of that loss state occurring:
    EENS = EPNS × 8760 [ MWh / year ]
  • EIR (Energy Index of Reliability): Proportion of energy actually delivered relative to total demand [19].
    EIR = 1 E E N S p u
The selection of LOLP, LOLE, EENS, and EIR as reliability indicators is based on their established use in probabilistic adequacy studies and their alignment with international standards set by organizations such as IEEE and NERC. These indices are not only widely adopted in academic research but also used in real-world planning and regulatory evaluations. Together, they provide a balanced view of system reliability by addressing both the likelihood and the severity of generation shortfalls.
LOLP captures the probability that system demand will exceed available generation in any given period. LOLE extends this by estimating how often these events occur over time, usually measured in hours per year. EENS quantifies the total volume of energy that cannot be delivered due to capacity limitations, offering a clear metric for economic and operational impact. Finally, EIR expresses the proportion of energy served relative to total demand, allowing for straightforward benchmarking and performance comparison.
This combination of indicators ensures a comprehensive and technically sound evaluation of system adequacy, particularly under uncertain conditions such as variable demand or intermittent renewable supply.

3. Results

3.1. Analysis of the SNI for the Years 2023–2024

The methodology was applied to Ecuador’s national electrical system for the years 2023 and 2024, considering three different operational scenarios. These scenarios enabled an evaluation of system reliability under ideal, technical, and real operating conditions, based on the effective availability of generation.
To optimize simulation times, a structural simplification of the generation fleet was implemented. Units were categorized by technological type (hydroelectric, thermal, etc.), and their nominal capacities were rounded to the nearest integer. Any rounding residuals within each technological group were accumulated and, once a representative threshold was reached, an additional unit of the same type was incorporated. This strategy maintained the technical consistency of the model without compromising result accuracy.
The following scenarios were assessed:
  • Scenario 1 Optimistic: The total nominal capacity of all generating units was considered. In this case, the system showed negligible LOLE values (0.00001 days/year in 2023 and 0.00002 days/year in 2024), with no significant energy losses.
  • Scenario 2 Technical: Average annual unavailabilities were included. For 2023, installed capacity was 7357.8 MW with 1297.8 MW unavailable, resulting in 6060 MW of operational capacity. In 2024, installed capacity was 7468.76 MW, with 1517.57 MW unavailable, yielding 5951.19 MW of effective power. The technological mix was 44–45% hydro and 55–56% thermal. Under this scenario, the LOLE was 0.00011 days/year in 2023 and 0.75158 days/year in 2024, with respective EENS values of 0.0076 MWh and 83.1 MWh.
  • Scenario 3 Realistic: Actual generation data from operational reports were used. This case revealed a significant drop in reliability: LOLE was 75.31 days/year in 2023 and 90.71 days/year in 2024. The corresponding EENS values were 24,239 MWh and 16,351 MWh, respectively. However, the Energy Index of Reliability ( EIR ) remained above 98%, indicating acceptable operation despite critical vulnerabilities under peak demand conditions.
Table 3 summarizes the results for each scenario.

3.2. Evaluation of the Ecuadorian SNI for the 2025–2029 Period

An energy planning exercise was carried out for the period 2025–2029, focused exclusively on the national electricity generation system, with the aim of assessing its robustness and vulnerability under critical operating conditions. The analysis considered different scenarios for demand, availability, and technological expansion, enabling a comprehensive evaluation of the resilience of the generation fleet.
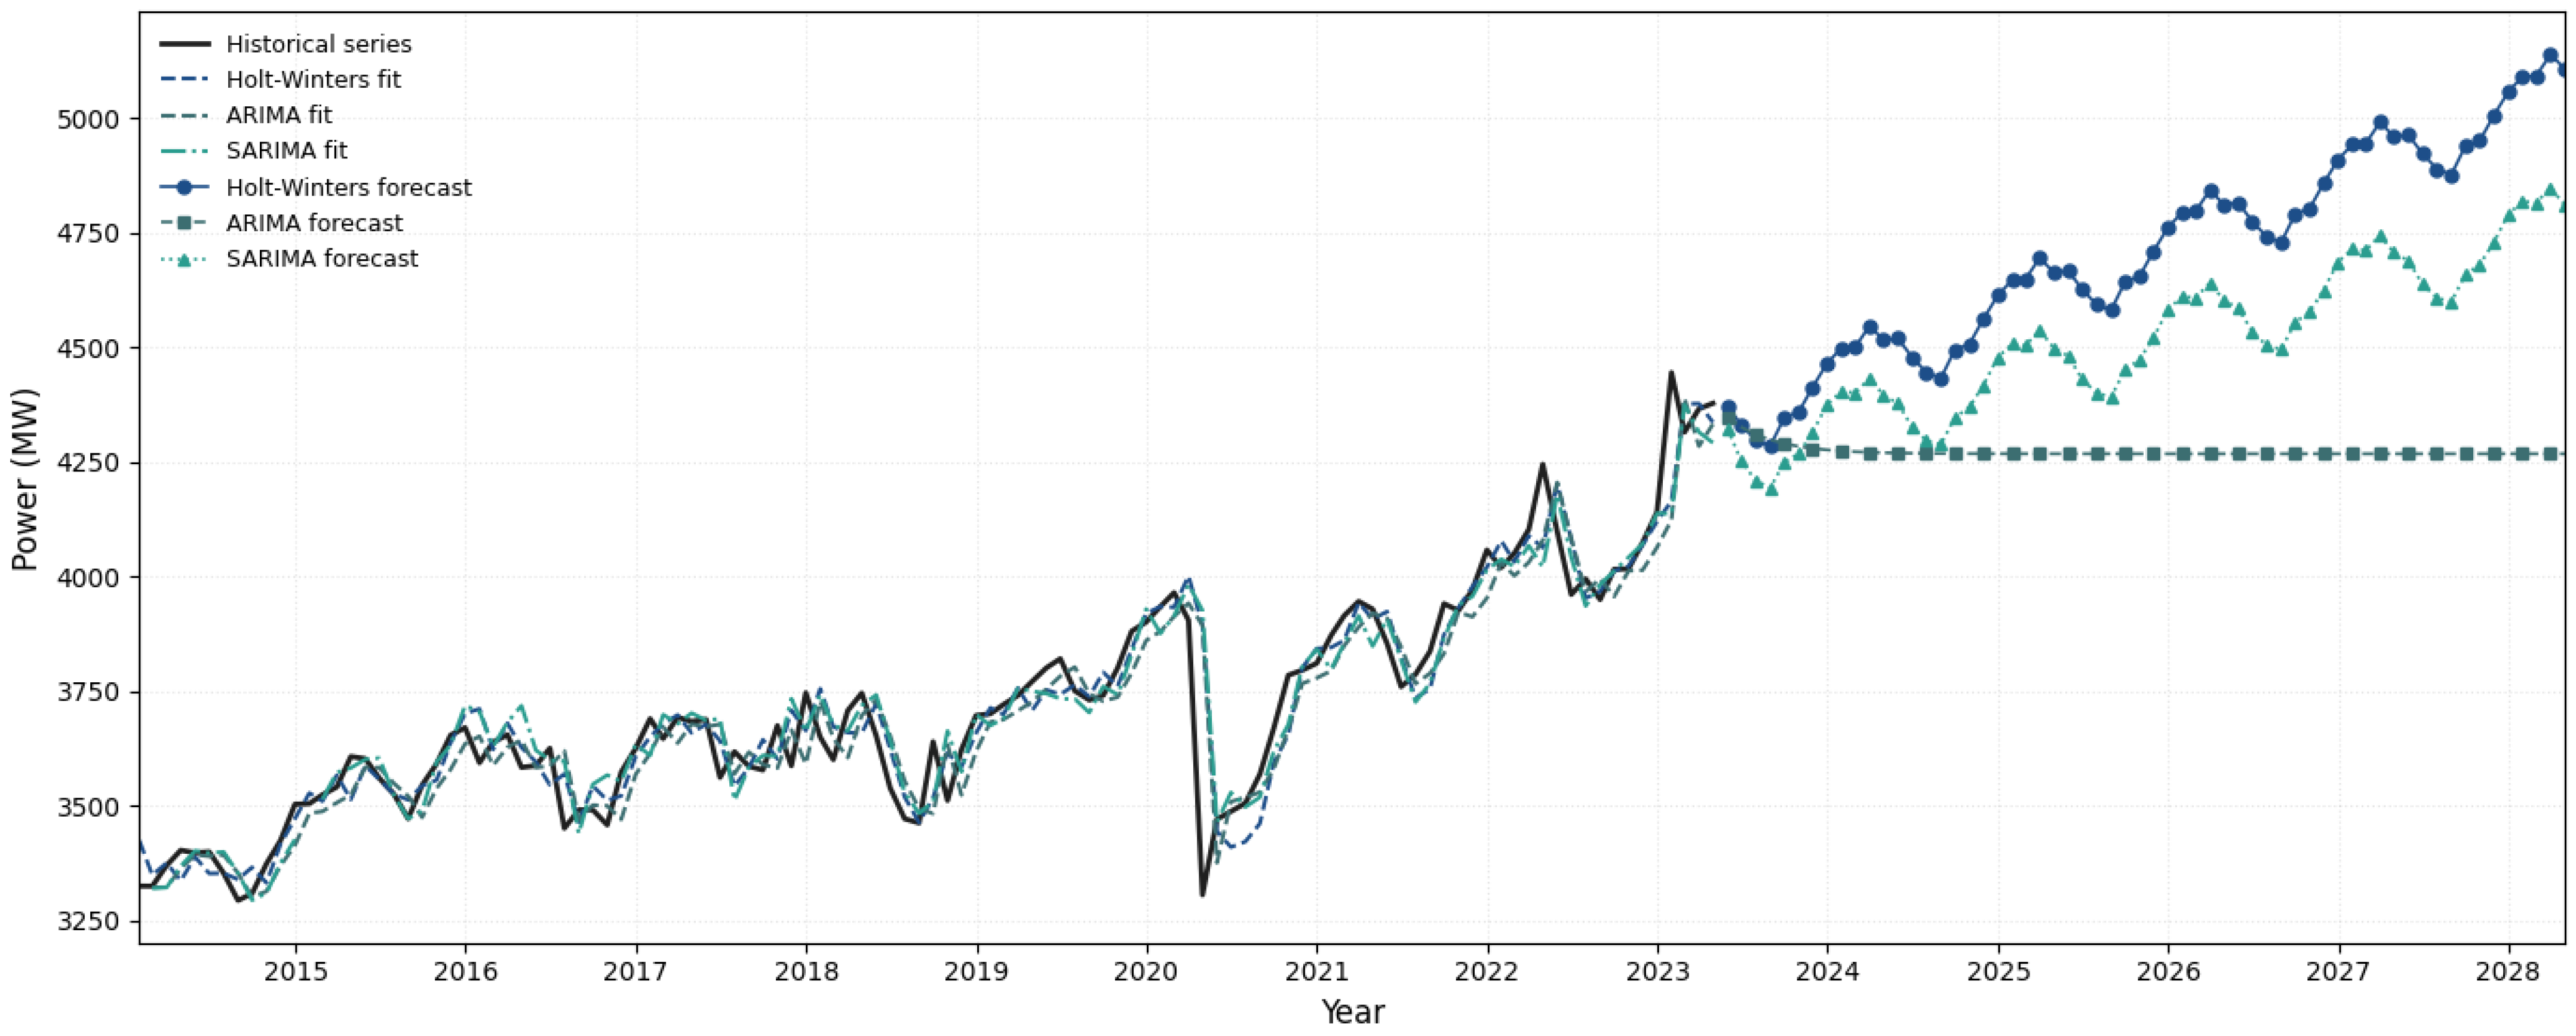
As a fundamental part of the process, an electric demand projection was developed up to 2029 using a historical data series covering the 2014–2024 period, gathered from official sources within the electricity sector. This dataset provided a reliable foundation for modeling the system’s future behavior.
The forecast was conducted using three time-series models widely recognized in the specialized literature: Holt–Winters, ARIMA, and SARIMA. These models were selected for their capacity to capture trends and seasonal patterns in historical data, enabling the generation of demand scenarios under uncertainty, as shown in Figure 5.
Table 4 shows the model validation results, highlighting that the Holt–Winters model achieved the highest accuracy, with a MAPE of 4.31%, outperforming the ARIMA (6.09%) and SARIMA (5.77%) models.
The Holt–Winters model was used for this analysis, selected due to its lowest validation error compared to other demand forecasting methods evaluated. Once the future behavior of the electrical system was estimated, its expected variability was modeled.
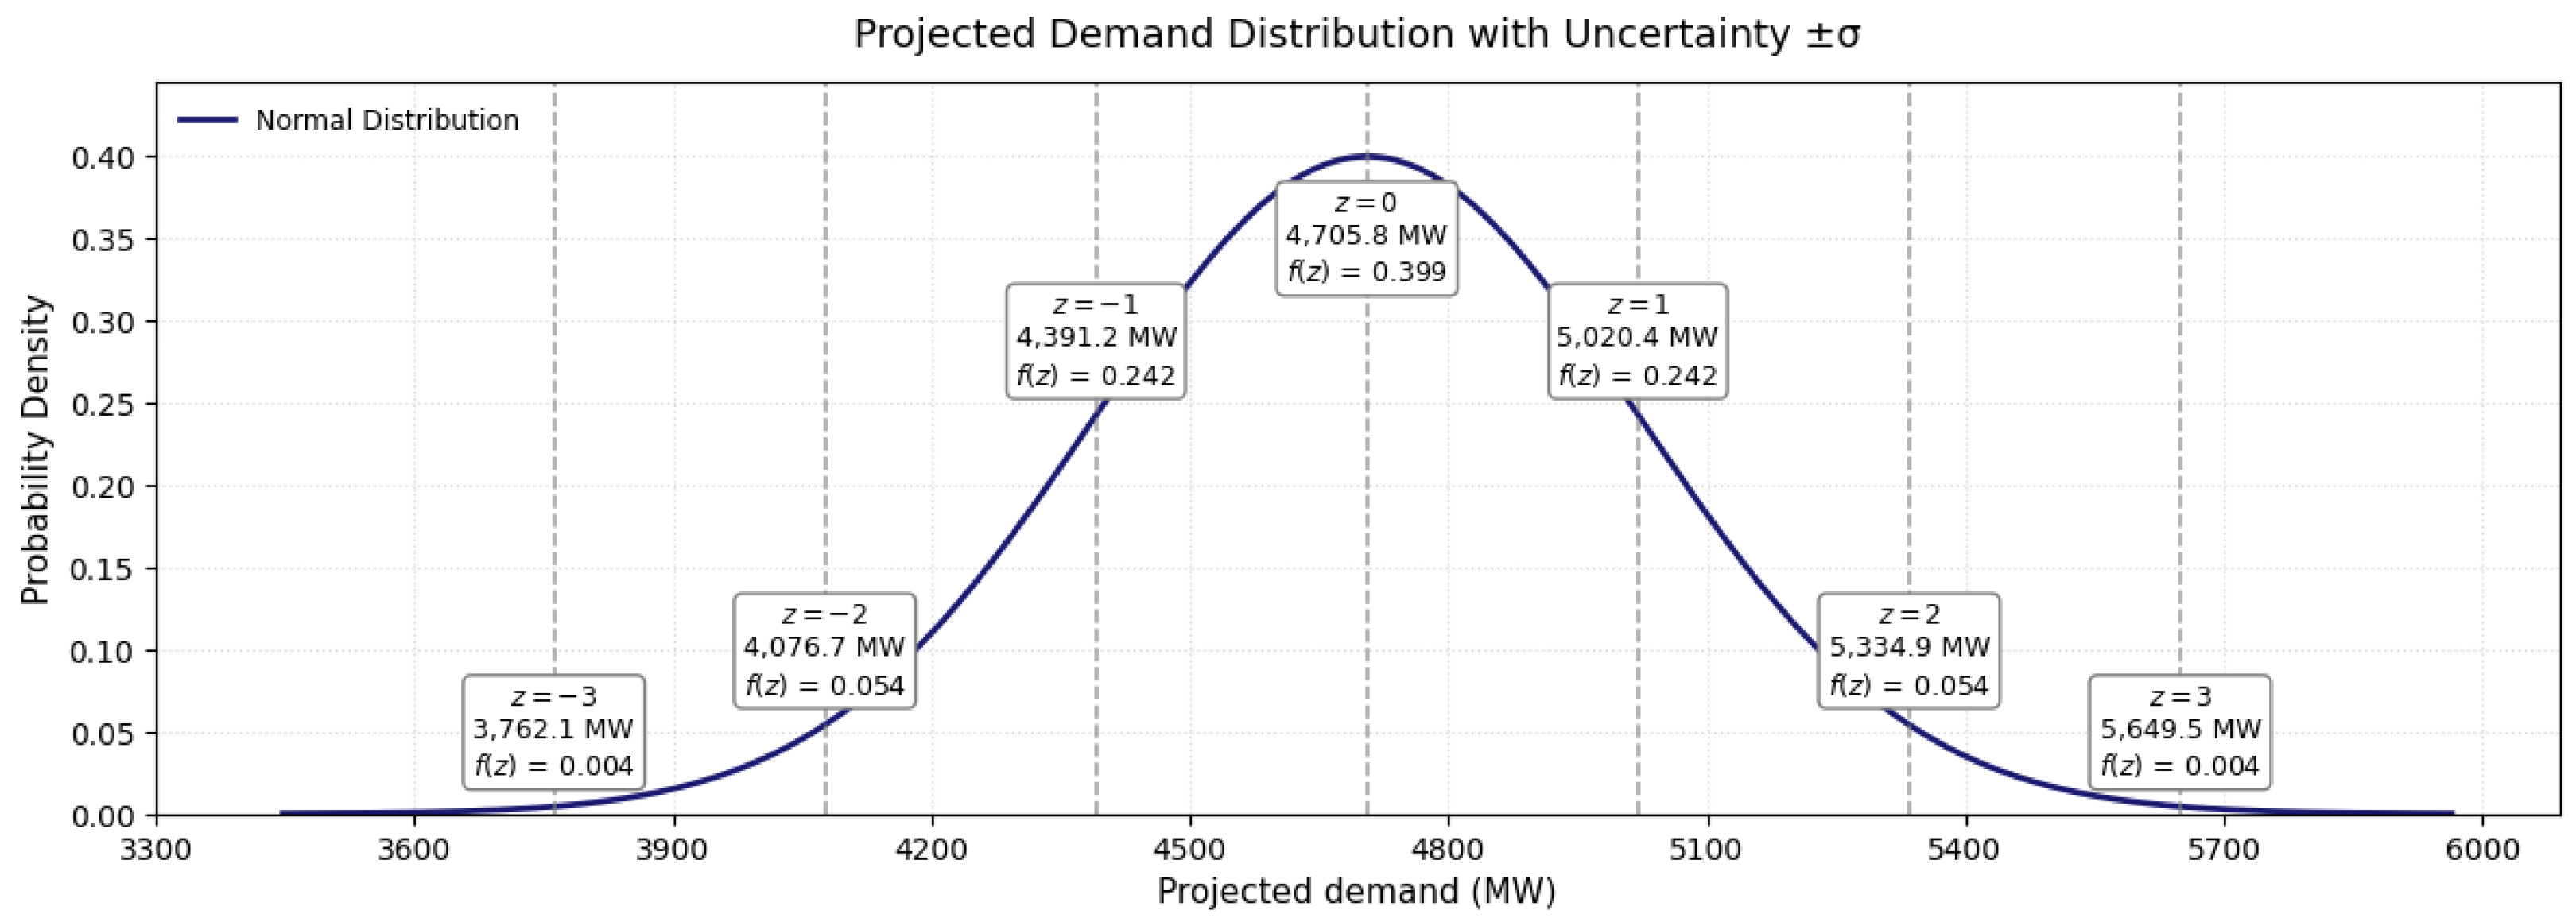
To this end, a normal distribution was used to represent demand uncertainty. The distribution curve was divided into seven discrete intervals, covering from 3 σ to + 3 σ , where each interval corresponds to a specific standard deviation range from the projected mean value. Each sigma level was assigned a probability of occurrence based on the area under the curve (see Figure 6):
  • ± 3 σ : 0.004;
  • ± 2 σ : 0.054;
  • ± 1 σ : 0.242;
  • 0 σ (mean value): 0.399.
LOLE was estimated for each of the scenarios defined by the sigma levels using the forecast generated by the Holt–Winters model. Each result was then weighted by its corresponding probability of occurrence, allowing the computation of an aggregated value that more realistically represents the risk of load loss by incorporating the statistical variability of demand.
This methodology captures a wide range of scenarios, from highly optimistic conditions to critical situations, thereby enhancing the robustness of the generation system’s reliability analysis.
Additionally, to assess the performance of the generation system under different operating conditions, three analysis scenarios were defined:
  • Scenario 1: This is considered an optimistic scenario following the progressive commissioning of new generation units according to the schedule established in the Master Electrification Plan (PME) for the 2024–2029 period. It assumes that all planned projects enter into operation on time, representing an ideal expansion path with the integration of renewable, thermal, and other complementary technologies.
Table 5 shows the additional capacity incorporated each year under this scenario.
This scenario projects a cumulative growth of over 3748 MW in six years, implying a significant increase in the national installed capacity and reserve margins, thereby strengthening the resilience of the power system against growing demand.
  • Scenario 2: This scenario was constructed based on historical technical data of the national power system during the 2018–2024 period. The average installed capacity over this interval was 7468 MW, with an average unavailability of 1368 MW, distributed as 48.37% for hydroelectric generation and 51.63% for thermal generation. As a result, the effective available capacity was estimated at approximately 6100 MW, which was used to characterize the system’s operational capability in this scenario.
  • Scenario 3: This scenario was built considering the maximum effective generation capacity recorded in 2024, which reached 5200 MW in April. This value represents the system’s highest operating point under real resource availability conditions, technical constraints, and existing operational parameters. The analysis of this scenario allows for assessing the system’s ability to meet demand under maximum operational stress, without assumptions of expansion or new infrastructure incorporation.
  • Scenario 4: The fourth scenario, considered critical, was based on the average effective capacity recorded during 2024, estimated at 4979 MW. This value reflects the typical system behavior under normal operating and availability conditions, providing an intermediate reference to evaluate demand coverage in standard operation throughout the year.
Table 6 presents the LOLE results obtained for each scenario analyzed during the 2025–2029 period.
Complementarily, 
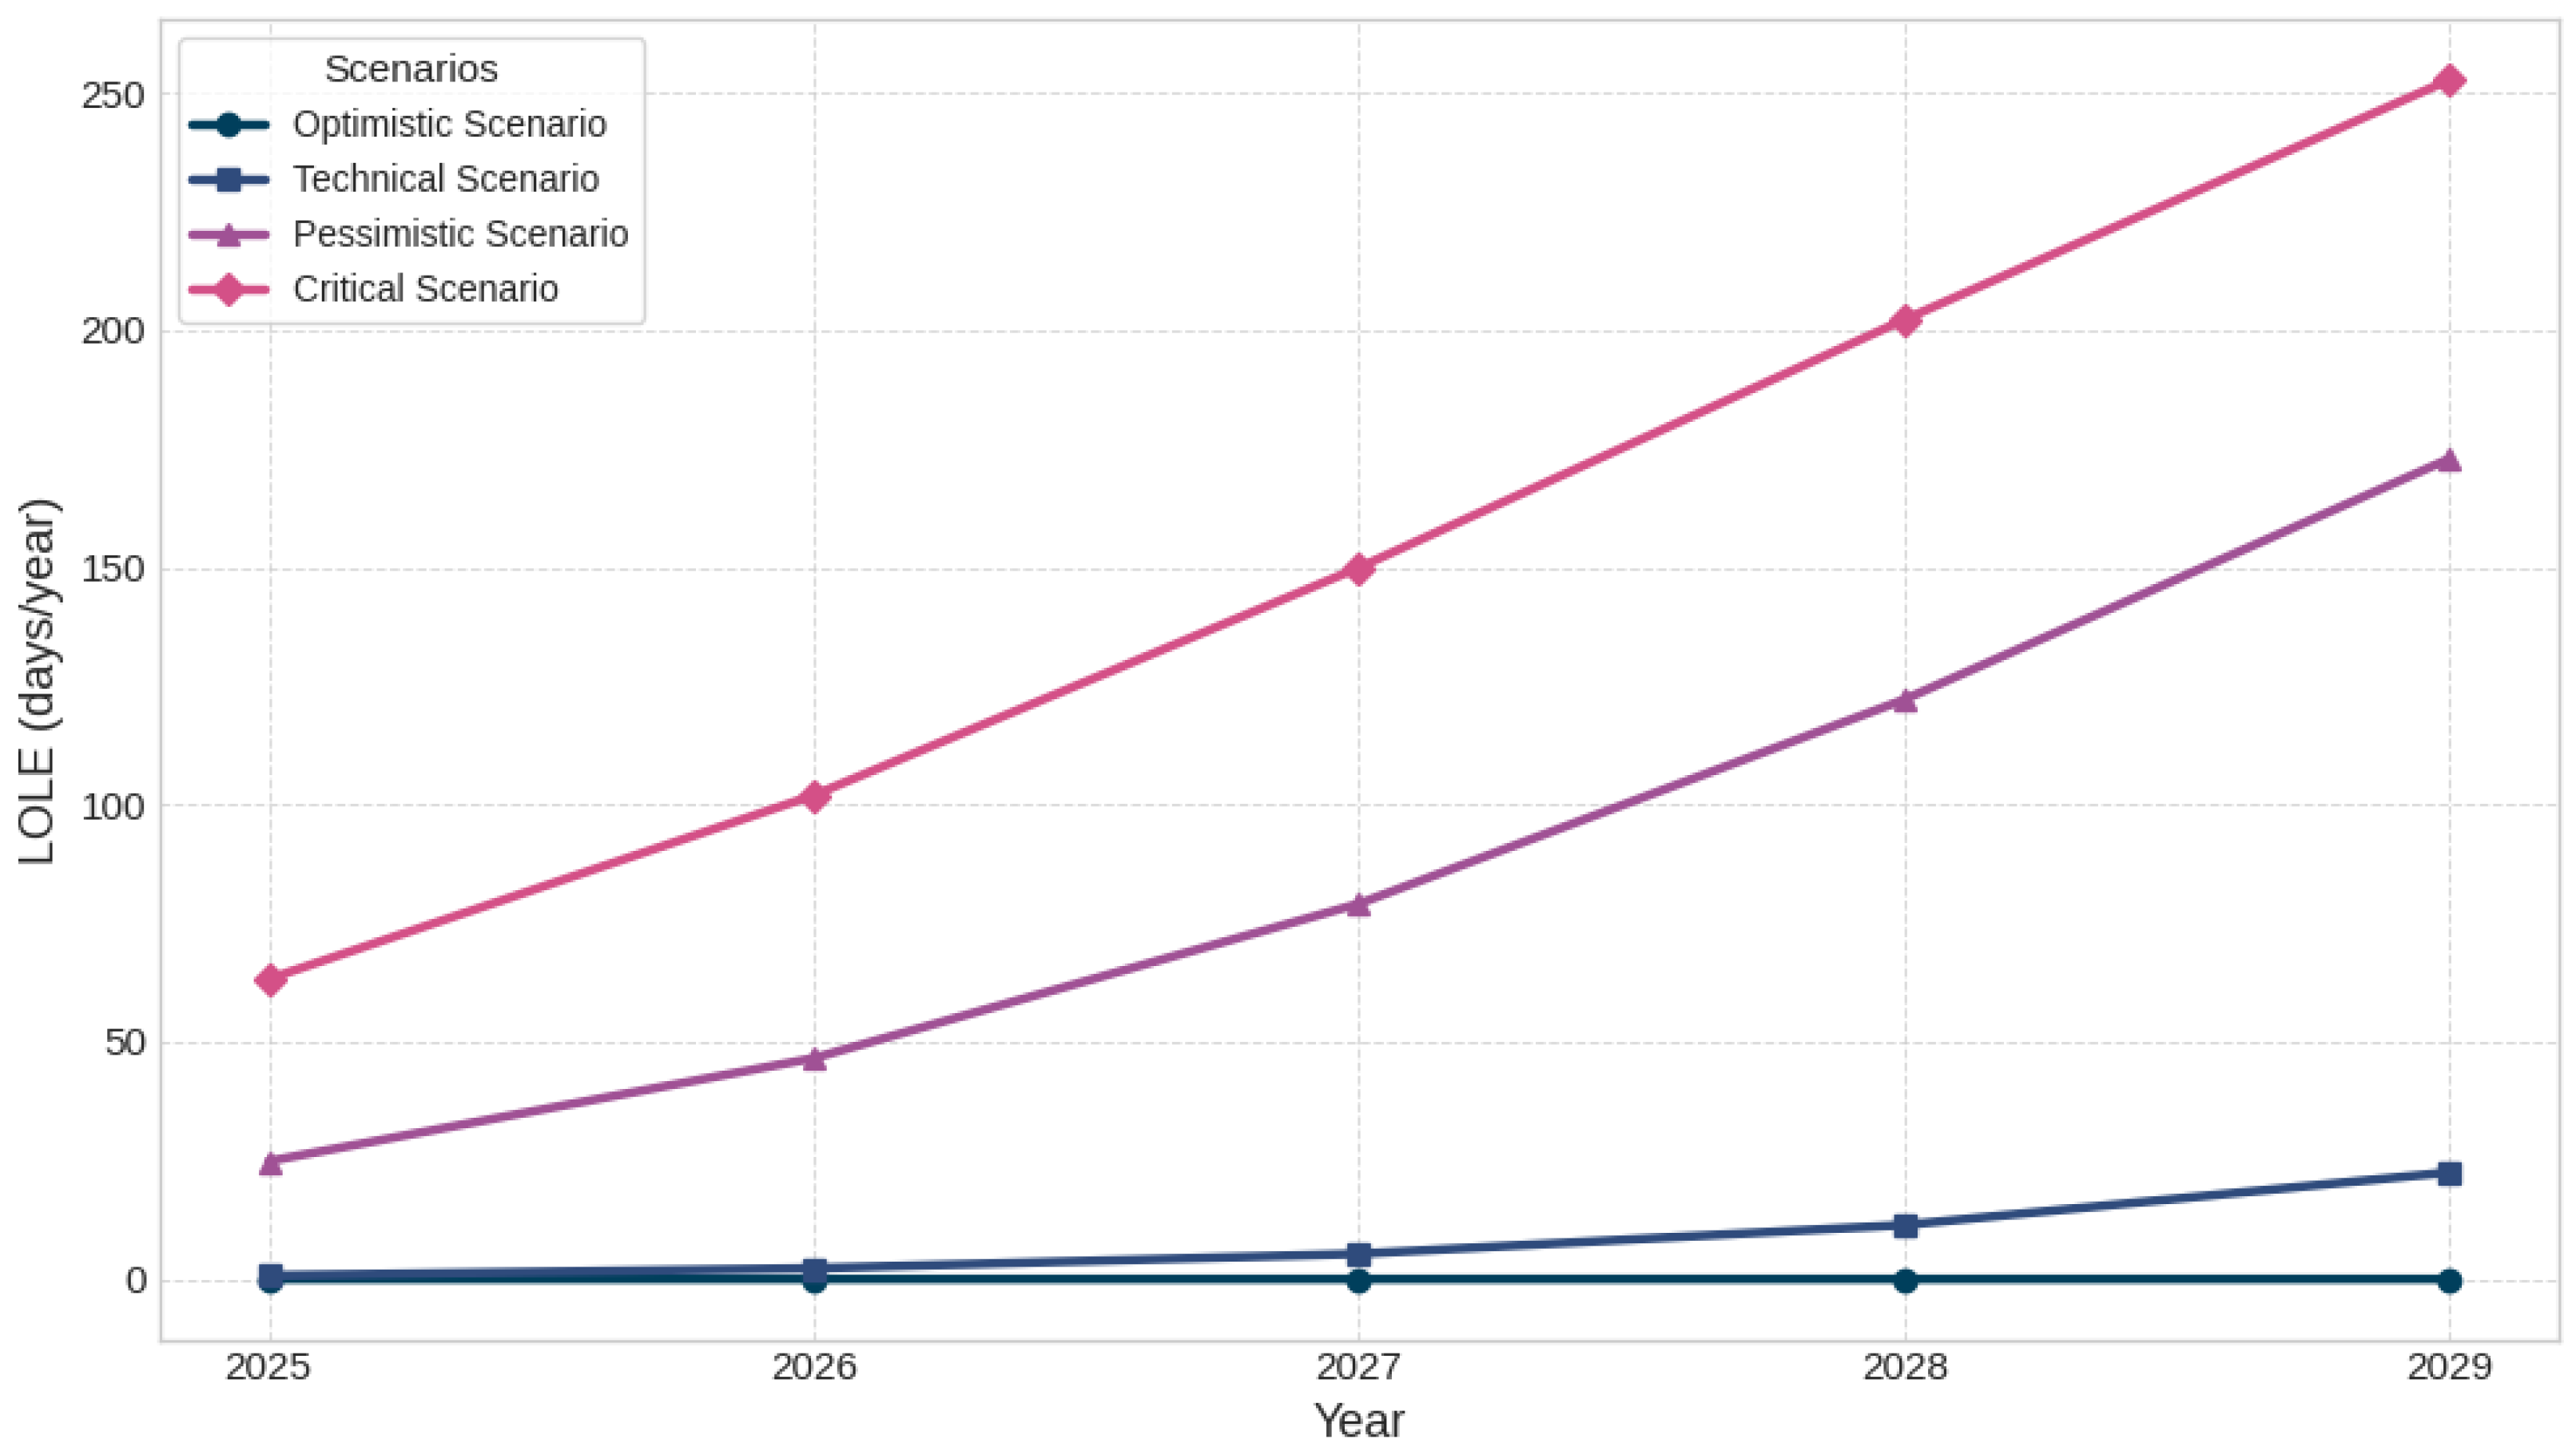
Figure 7 illustrates the comparative evolution of the weighted LOLE index for the scenarios considered over the same period.
The analysis of the LOLE results reveals an increasing trend in the risk of system unavailability as the projection horizon progresses. In Scenario 1, the system maintains high reliability levels, with LOLE values close to zero throughout the entire period. In Scenario 2, a moderate increase in risk is observed, reaching values that, although higher than those in the first scenario, are still considered operationally acceptable. However, in Scenarios 3 (Pessimistic) and 4 (Critical), the results show a significant deterioration in reliability, particularly from the year 2027 onward. By 2029, the LOLE in the Pessimistic Scenario rises to 173 days, while in the Critical Scenario it reaches 252 days—levels that would seriously compromise the continuity and stability of the electricity supply. These findings underscore the urgent need to implement infrastructure expansion and reinforcement strategies, as well as to optimize maintenance and operational policies to ensure a reliable and sustainable energy supply in the future.

4. Discussion

The reliability analysis of the National Interconnected System for the years 2023 and 2024 revealed significant contrasts between the evaluated scenarios. Under optimistic conditions, the system achieved exceptional reliability levels, with LOLE values close to zero (0.00005 days/year in 2023 and 0.000022 days/year in 2024) [39], far exceeding international reference standards. According to NERC criteria, the recommended LOLE for interconnected systems is 0.1 days/year, while countries like the United Kingdom and France apply even stricter standards of 2 to 3 h/year [40]. These benchmarks are particularly salient for Ecuador, whose hydro-thermal resource mix and demand profile closely mirror those of the referenced systems.
However, when more realistic scenarios were considered, namely the technical scenario and the real generation scenario, a substantial deterioration in reliability was evident. In the technical scenario, the LOLE for 2023 remained within acceptable limits (0.00011 days/year) but rose to 0.75158 days/year in 2024, significantly surpassing the recommended threshold. This surge stems from a decline in effective available capacity below the N-1 criterion and therefore signals a pronounced loss of resilience under operational contingencies.
The real-generation scenario, based on effectively recorded generation, showed critical LOLE values: 75 days/year in 2023 and 91 days/year in 2024. These results are patently incompatible with any internationally accepted reliability standard and reflect a situation in which the risk of load loss becomes frequent rather than exceptional. Although the ERI defined as the ratio of served energy to gross demand remained above 97%, such a headline figure can mask short, high-impact deficits; consequently, values ≥ 97% do not guarantee immunity from severe events during peak periods.
The forward-looking evaluation for the 2025–2029 period reinforces this concern. Even under optimistic conditions, the system could maintain adequate reliability levels; yet in the technical and real-generation scenarios, projected LOLE increases alarmingly, exceeding 250 days/year by 2029. This prospect underscores an urgent need for remedial intervention in the medium term.
When compared with international reference indices, it becomes clear that the Ecuadorian system would deviate significantly from the reliability standards expected of modern power systems. This situation could result in a higher likelihood of blackouts, increased operational costs, and adverse economic and social impacts for the country.
In this context, it becomes evident that strategies must be adopted to reverse the observed trend and strengthen the operational security of the system.
Reversing the projected decline in system reliability requires more than simply expanding installed capacity. It is essential to integrate technologies capable of delivering fast and flexible operational response.
Historically, hydroelectric plants have been the main source of dynamic support in the SNI, offering start-up times of <10 min, ramp rates above 5% min, and robust participation in primary and secondary frequency regulation [41].
In contrast, combined-cycle thermal plants exhibit slower flexibility, with start-up times between 2 and 6 h and ramp rates limited to 1–2% min. These characteristics reduce their effectiveness as contingency resources. Faster alternatives, such as open-cycle gas turbines or reciprocating internal combustion engines, can reach operating conditions within 5 to 20 min and provide steeper ramps, although they have lower thermal efficiency and higher operational costs [42,43,44].
Table 7 compares these technologies based on their suitability as flexible backup in the Ecuadorian power system.
These differences underscore the importance of considering operational flexibility when planning the future structure of generation capacities, especially in scenarios involving the replacement of hydroelectric resources.
Based on the findings, three mutually reinforcing strategic lines are advanced: (i) strengthening operational reserves, (ii) modernizing the existing fleet, and (iii) diversifying the energy mix.
Below is a brief description of each strategic line:
(i) Strengthen operational reserves: Deploy utility-scale BESS and fast-start gas turbines, while demand response programs reduce peaks and free reserves.
(ii) Modernize the existing fleet: Rehabilitating and repowering hydro and thermal units backed by predictive maintenance will restore the capacity without extensive greenfield investments.
(iii) Diversify the energy mix: Developing photovoltaic, wind, and other non-conventional renewables, complemented by energy storage, can reduce dependence on hydropower during severe hydrological stress.
However, due to their intermittent and non-dispatchable nature, these resources cannot be considered to be of firm capacity in system operations. Their large-scale integration increases the need for fast-response and regulation-capable backup resources to maintain system reliability. In scenarios with high renewable penetration and limited operating reserves, the absence of adequate compensation mechanisms can lead to a significant increase in the LOLE beyond internationally accepted thresholds [45].
In this context, BESSs play a critical role in mitigating short-term imbalances, smoothing generation ramps, and shifting energy to match demand profiles. It underscores BESSs as an effective solution to enhance operational flexibility in power systems with high shares of renewable generation.
According to international technical benchmarks, the capital cost of utility-scale BESS projects typically ranges from USD 1100 to 1500 per kW installed for 2–4 h lithium-ion systems, depending on storage duration and project-specific conditions [46,47]. As Ecuador currently lacks a domestic industrial base and structured financing mechanisms for energy storage, large-scale deployment will require instruments such as capacity auctions, ancillary-service markets, and availability-based contracts. These mechanisms will also be essential to attract foreign investment into flexibility- and reliability-focused infrastructure.
It is important to note that Ecuador does not possess a domestic industrial base for the manufacturing of advanced power-generation technologies, such as BESSs, gas turbines, or large-scale reciprocating engines. The procurement, installation, and maintenance of these assets rely entirely on international suppliers, creating a structural dependency that must be factored into long-term energy system planning.
This situation introduces significant operational and financial vulnerabilities related to the availability of spare parts, lead times, access to specialized technical support, and long-term maintenance agreements. Disruptions in external technology provision, whether caused by logistical, commercial, or geopolitical factors, may compromise the operational continuity of critical infrastructure, increase corrective-maintenance costs, and undermine system reliability, particularly during periods of high demand.
Therefore, any strategy for technological deployment should incorporate a dedicated risk assessment concerning this external dependency. Mitigation measures should include long-term maintenance contracts, a preventive inventory of essential components, and technology transfer mechanisms aimed at strengthening local capabilities in system operation and maintenance.
While thermal plants offer dispatchable power, their viability is limited by imported fuels and price volatility. Ecuador lacks commercial natural gas reserves and infrastructure; thus, diesel and LNG imports dominate during dry seasons [48]. In May 2025, WTI fluctuated between USD 57 and 62 per barrel, yet marginal diesel-fired generation costs remained above 220 USD/MWh versus 35–45 USD/MWh for hydropower [49,50]. Such volatility constrains the economic dispatch of thermal units during droughts, thereby amplifying LOLE risk.
The economic viability of Ecuador’s energy transition is constrained by a highly subsidized electricity market and dependence on imported fossil fuels. In 2022, direct subsidies exceeded USD 1 billion by about 1% of the GDP and could rise by 25–40% if tariff structures remain unchanged [51].
Thermal generation relies almost entirely on imported diesel and LNG, as the country lacks domestic gas reserves and infrastructure. Between 2021 and 2024, crude oil prices ranged from USD 70 to 120 per barrel, and LNG prices peaked at USD 30 per MMBtu. Under these conditions, marginal thermal generation costs surpassed USD 300/MWh, introducing significant financial and planning risk [50].
On the demand side, a 10% tariff increase may reduce electricity consumption by 2–5% among low-income households, deepening energy poverty. In industrial sectors, prices above USD 100/MWh erode profit margins and reduce competitiveness, especially in mining, agro-industry, and manufacturing [52].
Analyses by [53] emphasize that, without fiscal and social safeguards, the transition could produce regressive effects. To ensure economic feasibility, reliability-oriented tariff reform must blend targeted subsidies with rigorous fiscal-impact modeling, demand-elasticity analysis, volatility stress testing, and sectoral competitiveness reviews.
Another necessary action is to review and update the Master Electrification Plan 2023–2032.
Finally, it is proposed to institutionalize national reliability standards by formally adopting a LOLE threshold of ≤0.1 days/year as the benchmark referenced at the outset of this section. This will provide a clear technical framework for future planning, operation, and expansion of the national power system.
Together, these strategies would arrest the current deterioration, fortify the resilience of the SNI, and ensure that Ecuador secures a reliable and sustainable electricity supply amid growing demand and climatic uncertainty. Adopting an evidence-driven, socially equitable trajectory is therefore indispensable.

5. Conclusions

This study presents a comprehensive probabilistic methodology tailored to the structural and operational characteristics of SNI. The model employs a recursive convolution algorithm capable of evaluating the complete configuration space of 369 generation units, achieving exact results without relying on approximations or truncation. This approach allows for a high-resolution quantification of generation adequacy and system reliability across a wide range of operational scenarios.
The findings for the 2023–2024 period reveal significant reliability concerns. In 2024, the LOLE exceeds 90 days per year, far surpassing internationally accepted benchmarks. This critical outcome is largely attributed to the system’s strong dependence on hydroelectric resources, which, although efficient under normal conditions, expose the system to severe vulnerability during hydrological stress, as demonstrated during the 2023–2024 energy crisis.
Forward-looking projections through 2029 suggest a worsening reliability trajectory. Under business-as-usual conditions, LOLE values surpass 250 days per year, indicating a structural inadequacy in the system’s ability to meet demand. The EENS grows proportionally, while the EIR drops to levels indicative of systemic stress. These metrics collectively highlight the urgent need for structural interventions.
The analysis demonstrates that diversifying the energy matrix through increased deployment of non-conventional renewables, strengthening thermal reserve capacity, and incorporating energy storage solutions are essential strategies for enhancing system resilience. Furthermore, the formal adoption of national reliability criteria aligned with international standards such as those from IEEE or NERC would provide a necessary framework for guiding expansion planning and investment decisions.
The proposed methodology constitutes a scalable and replicable tool for probabilistic adequacy assessment under uncertainty, with applications beyond the Ecuadorian context. It bridges the gap between academic rigor and practical energy planning, offering critical insights for decision-makers. To ensure long-term energy security, Ecuador must prioritize an integrated approach that combines technical modernization, regulatory evolution, and strategic capacity reinforcement. Failure to address these challenges may result in chronic energy shortages with far-reaching socioeconomic consequences.

Author Contributions

Conceptualization, D.P.; methodology, A.A.T.; software, D.P.; validation, A.A.T. and F.J.; formal analysis, D.P.; investigation, D.P.; resources, D.P.; data curation, D.P.; writing—original draft preparation, D.P.; writing—review and editing, D.P.; visualization, D.P.; supervision, A.A.T.; project administration, A.A.T.; funding acquisition, F.J. All authors have read and agreed to the published version of the manuscript.

Funding

This research received no external funding.

Data Availability Statement

The data supporting the results of this study are available from publicly accessible sources cited throughout the manuscript. No new datasets were generated, and all analyses were conducted using data from official government and institutional reports.

Acknowledgments

The authors would like to thank the Universidad Politécnica Salesiana for providing access to its facilities, allowing the use of its equipment, and authorizing the technical staff to offer the necessary support for the experiments described in this article.

Conflicts of Interest

The authors declare no conflicts of interest.

Abbreviations

SNINational Interconnected System
LOLELoss of Load Expectation
LOLPLoss of Load Probability
EENSExpected Energy Not Supplied
EIREnergy Index of Reliability
EPNSExpected Power Not Supplied
BESSBattery Energy Storage System
LNGLiquefied Natural Gas
AVAvailability
FORForced Outage Rate
EFORdEquivalent Forced Outage Rate Demand
PMEMaster Electrification Plan
CENACENational Electricity Operator
ARCERNNRAgency for Regulation and Control of Energy and Non-Renewable Resources
NERCNorth American Electric Reliability Corporation
RTSIEEE Reliability Test System
IEEEInstitute of Electrical and Electronics Engineers
MWMegawatt
MWhMegawatt-hour
GWhGigawatt-hour
PVPhotovoltaic
GDPGross Domestic Product
MAPEMean Absolute Percentage Error
MAEMean Absolute Error
MSEMean Squared Error
ARIMAAutoregressive Integrated Moving Average
SARIMASeasonal ARIMA
FPPFailure Precursor Parameters

Appendix A

Appendix A.1

Table A1 presents the FOR associated with each generation unit currently operating in Ecuador. This index reflects the proportion of time during which each generation facility is unavailable due to unplanned outages or unforeseen maintenance. The data were collected from various institutional sources, considering the technology type, location, and operator of each facility. This information is essential for reliability analysis and for evaluating the operational risk of the national electric power system.
Table A1. FOR values of Ecuadorian generation units.
CompanyPower PlantFOR
CELEC-Coca Codo SinclairCoca Codo Sinclair0.10
CELEC-SurMolino0.10
CELEC-SurSopladora0.10
CELEC-SurMinas San Francisco0.10
CELEC-HidronaciónMarcel Laniado0.10
CELEC-HidroagoyánSan Francisco0.10
CELEC-GensurDelsitanisagua0.10
CELEC-SurMazar0.10
CELEC-HidroagoyánAgoyán0.10
CELEC-ElectroguayasGonzalo Zevallos (Vapor)0.16
CELEC-ElectroguayasTrinitaria0.14
CELEC-Termogas MachalaTermogas Machala I0.35
CELEC-TermomanabíJaramijó0.14
CELEC-TermoesmeraldasEsmeraldas I0.14
CELEC-Termogas MachalaTermogas Machala II0.35
ntervisa TradeVictoria II0.17
CNEL-GuayaquilAníbal Santos (Gas)0.17
CELEC-ElectroguayasEnrique García0.17
CELEC-TermoesmeraldasEsmeraldas II0.14
San CarlosSan Carlos0.15
CELEC-HidroagoyánPucará0.10
CELEC-ElectroguayasSanta Elena II0.16
CELEC-Coca Codo SinclairManduriacu0.10
HidroaltoDue0.10
CNEL-GuayaquilÁlvaro Tinajero0.17
CELEC-TermopichinchaSanta Rosa0.17
ElecaustroHuascachaca0.07
HidrosanbartoloHidrosanbartolo0.17
HidronormandíaHidronormandía0.17
CELEC-HidrotoapiSarapullo0.17
CELEC-TermopichinchaGuangopolo20.17
CELEC-TermopichinchaJivino III0.17
CELEC-HidronaciónBaba0.17
CELEC-TermopichinchaQuevedo II0.16
CELEC-ElectroguayasSanta Elena III0.16
E.E. QuitoCumbayá0.17
CELEC-TermomanabíMiraflores0.17
ElitEnergyPusuno0.17
HidroabanicoAbanico0.17
EcoelectricEcoelectric0.15
GenerocaGeneroca0.17
E.E. QuitoG. Hernández0.17
Fideicomiso Titularización PHSSabanilla0.17
E.E. QuitoNayón0.17
AgroazucarEcudos A-G0.15
EcuagesaTopo0.17
ElecaustroOcaña0.17
UNACEMSelva Alegre0.61
ElecaustroSaucay0.17
CELEC-TermopichinchaGuangopolo0.17
E.E. QuitoGuangopolo0.17
CNEL-GuayaquilAníbal Santos (Vapor)0.16
CELEC-ElectroguayasGonzalo Zevallos (Gas)0.17
HidrosigchosSigchos0.17
CELEC-TermomanabíManta II0.16
ElecaustroEl Descanso0.17
E.E. SurCatamayo0.16
CELEC-GensurVillonaco0.07
ElecaustroSaymirín0.17
EnermaxCalope0.17
EPMAPSRecuperadora0.17
HidrosibimbeSibimbe0.17
E.E. RiobambaAlao0.17
IPNEGALPalmira- Nanegal0.17
HidrosierraRio Verde Chico0.17
CELEC-TermopichinchaJivino II0.17
HidrovictoriaVictoria0.17
CELEC-TermoesmeraldasLa Propicia0.01
EPMAPSEl Carmen0.17
EPMAPSChalpi0.17
HidrotamboSan José de Tambo0.17
E.E. NorteAmbi0.17
CELEC-TermopichinchaCelso Castellanos0.17
CELEC-HidroazoguesAlazán0.17
EcoluzPapallacta0.17
San José de MinasSan José de Minas0.17
VicunhaVindobona0.17
GasgreenEl Inga0.01
CELEC-TermopichinchaJivino I0.16
E.E. CotopaxiIlluchi No.20.17
E.E. QuitoPasochoa0.17
E.E. CotopaxiIlluchi No.10.17
CELEC-TermopichinchaMacas0.16
CELEC-TermomanabíPedernales0.17
E.E. AmbatoLligua0.17
E.E. RiobambaRío Blanco0.17
E.E. AmbatoPenínsula0.17
E.E. NorteSan Miguel de Car0.17
PerlabíPerlabí0.17
E.E. SurCarlos Mora0.17
EcoluzLoreto0.17
GransolarSalinas0.50
I.M. MejíaLa Calera0.17
CELEC-TermopichinchaPayamino0.76
CELEC-TermopichinchaLoreto0.17
CELEC-TermopichinchaDayuma0.16
E.E. QuitoLos Chillos0.17
EMAC-BGPPichacay0.76
Moderna AlimentosGeppert0.17
E.E. NorteLa Playa0.17
HidroulbaUlba0.17
GransolarTren Salinas0.50
BrineforcorpBrineforcorp0.50
SolsantrosSolsantros0.50
SaracaysolSaracaysol0.50
SanersolSanersol0.50
San PedroSan Pedro0.50
GonzanergyGonzanergy0.50
SurenergySurenergy0.50
SolsantonioSolsantonio0.50
SolhuaquiSolhuaqui0.50
SolchacrasSolchacras0.50
ElectrisolElectrisol0.50
EpfotovoltaicaMulaló0.50
EpfotovoltaicaPastocalle0.50
CbsenergyEl Laurel0.17
ValsolarParagachi0.50
WildtecsaWildtecsa0.50
SansauSansau0.50
GenrenotecGenrenotec0.50
AltgenotecAltgenotec0.50
HidrosibimbeUravia0.17
HidrosibimbeCorazón0.17
ElecaustroGualaceo0.17
E.E. NorteBuenos Aires0.17
HidroimbaburaHidrocarolina0.17
SabiangosolarSabiango Solar0.50
Renova LojaRenova Loja0.50
LojaenergyLojaenergy0.50
SERMAA EPFábrica Imbabura0.17
EnersolEnersol0.50
HidrotavaloOtavalo II0.17
Municipio Cantón EspejoEspejo0.17
SERMAA EPAtuntaqui0.17
Agua y Gas de SillunchiSillunchi II0.17
EPMAPSNoroccidente0.17
ElectrocordovaElectrocórdova0.17
Agua y Gas de SillunchiSillunchi I0.17
Consejo Provincial De TungurahuaTiliví0.17

References

  1. Vinogradov, A.V.; Landsberg, A.A.; Bolshev, V.Y.; Golikov, I.O. Determination of Reliability Indicators for Electric Energy Storage Systems. In Proceedings of the 4th International Conference on Control Systems, Mathematical Modeling, Automation and Energy Efficiency, Lipetsk, Russian, 9–11 November 2022; IEEE: Piscataway, NJ, USA, 2022; pp. 852–857. [Google Scholar] [CrossRef]
  2. Khan, I.A.; Muyeen, S.M. (Eds.) Application of Power Electronics Converters in Smart Grids and Renewable Energy Systems; MDPI: Basel, Switzerland, 2022. [Google Scholar] [CrossRef]
  3. Alvarez, H.; Capaje, R.; Plazarte, J.; Urquizo, J. A Reliability Study of the Transmission Expansion Plan of Ecuador. In Proceedings of the LACCEI International Multi-Conference for Engineering, Education and Technology, Virtually, 27–31 July 2020; LACCEI: Boca Raton, FL, USA, 2020; pp. 1–9. [Google Scholar] [CrossRef]
  4. Liu, W.M.; Chen, C.; Xiao, K.W.; Yu, Y.; Zheng, W.; Feng, M.T.; Zhai, G.F. Reliability Prediction of Multi-Level Power Supply System Based on Failure Precursor Parameters. Microelectron. Reliab. 2025, 167, 115656. [Google Scholar] [CrossRef]
  5. Belagoune, S.; Zervoudakis, K.; Baadji, B.; Karim, A.; Bali, N. Reliability-Based Preventive Maintenance Scheduling in Power Generation Systems: A Lévy Flight and Chaotic Local Search-Based Discrete Mayfly Algorithm. Comput. Electr. Eng. 2025, 121, 109904. [Google Scholar] [CrossRef]
  6. Su, C.T.; Wong, J.J.; Fan, C.J. System and Load Points Reliability Evaluation for Electric Power Systems. In Proceedings of the 1st Annual IEEE Systems Conference, Honolulu, HI, USA, 9–13 April 2007; IEEE: Piscataway, NJ, USA, 2007; pp. 1–5. [Google Scholar]
  7. Agencia de Regulación y Control de Energía y Recursos Naturales No Renovables. Plan Maestro de Electrificación 2023–2032; ARCERNNR: Quito, Ecuador, 2023. [Google Scholar]
  8. Tapia, E. Lo Que se Sabe Sobre los Apagones que Comienzan el Viernes 27 de Octubre. PRIMICIAS. 2023. Available online: https://www.primicias.ec/noticias/economia/apagones-cortes-luz-cronograma-empresa-electrica/ (accessed on 29 April 2025).
  9. Miranda, B. Coca Codo Sinclair: Los Problemas de la Multimillonaria Represa que China Construyó en Ecuador. BBC News Mundo. 2019. Available online: https://www.bbc.com/mundo/noticias-america-latina-47144338 (accessed on 29 April 2025).
  10. Corporación Eléctrica del Ecuador. Central Coca Codo Sinclair, de CELEC EP, Superó su Récord de Producción Eléctrica Anual, Desde su Entrada en Operación en el 2016. CELEC. 2023. Available online: https://www.celec.gob.ec/noticias/central-coca-codo-sinclair-de-celec-ep-supero-su-record-de-produccion-electrica-anual-desde-su-entrada-en-operacion-en-el-2016/ (accessed on 29 April 2025).
  11. Diaz, M.; Briones, R.; Torres, A.; Junia, C. Panorama Eléctrico Edición 21-Marzo 2024. In Panorama Eléctrico; Agencia de Regulación y Control de Energía y Recursos Naturales No Renovables: Quito, Ecuador, 2024; Volume 21, pp. 1–44. Available online: https://controlelectrico.gob.ec/publicaciones-estadistica-del-sector-electrico/ (accessed on 29 April 2025).
  12. Instituto Nacional de Estadística y Censos. Presentación de Resultados Nacionales; INEC: Quito, Ecuador, 2022; pp. 1–62. Available online: https://censoecuador.gob.ec/https://ecuadorencifras.page.link/CensoEcuador2022 (accessed on 29 April 2025).
  13. Departamento de Asuntos Económicos y Sociales de las Naciones Unidas. Población de Ecuador. Worldometer. 2025. Available online: https://www.worldometers.info/world-population/ecuador-population/ (accessed on 29 April 2025).
  14. Medina, J. Informe Anual 2024; Operador Nacional de Electricidad-CENACE: Quito, Ecuador, 2024; pp. 1–220. Available online: https://www.cenace.gob.ec/wp-content/uploads/downloads/2025/04/Informe-Anual-CENACE-2024-vf-1-88_c.pdf (accessed on 29 April 2025).
  15. Ecuavisa. Crisis Eléctrica: El País Requiere un 40% Más de Energía para Suplir la Demanda; Ecuavisa: Quito, Ecuador, 2024; Available online: https://www.ecuavisa.com/noticias/ecuador/crisis-electrica-pais-requiere-40-mas-energia-para-suplir-demanda-MK8149860 (accessed on 29 April 2025).
  16. Mella, C. Ecuador Sufre Apagones de Hasta 14 Horas en Medio de una Grave Crisis EnergéTica; El País: Guayaquil, Ecuador, 2024; p. 1. Available online: https://elpais.com/america/2024-09-24/ecuador-sufre-apagones-de-hasta-14-horas-en-medio-de-una-grave-crisis-energetica.html (accessed on 29 April 2025).
  17. Vásconez, L. Lo que Debe Ocurrir para que las Termoeléctricas Solventen los Cortes de luz. El Comercio. 2024. Available online: https://www.elcomercio.com/actualidad/negocios/falta-inversion-gas-natural-termoelectricas-crisis-energetica-ecuador.html (accessed on 29 April 2025).
  18. Orozco, M. El Gas Natural Solo Alcanza para Termogas Machala y Bajo Alto; Primicias: Guayaquil, Ecuador, 2024; p. 1. Available online: https://www.primicias.ec/noticias/economia/gas-natural-ecuador-escasez-machala-industria/ (accessed on 29 April 2025).
  19. Al-Shaalan, A.M. Reliability Evaluation of Power Systems. In Reliability and Maintenance—An Overview of Cases; IntechOpen: London, UK, 2020; pp. 1–3. [Google Scholar] [CrossRef]
  20. Asamblea Nacional. Ley Orgánica para Impulsar la Iniciativa Privada en la Generación de Energías; Registro Oficial del Ecuador: Quito, Ecuador, 2024; pp. 1–16. Available online: https://esacc.corteconstitucional.gob.ec/storage/api/v (accessed on 29 April 2025).
  21. Kowal, K. Lifetime Reliability and Availability Simulation for the Electrical System of HTTR Coupled to the Electricity-Hydrogen Cogeneration Plant. Reliab. Eng. Syst. Saf. 2022, 223, 108468. [Google Scholar] [CrossRef]
  22. Salim, N.A.; Jasni, J.; Othman, M.M. Reliability Assessment by Sensitivity Analysis Due to Electrical Power Sequential Tripping for Energy Sustainability. Int. J. Electr. Power Energy Syst. 2021, 126, 106582. [Google Scholar] [CrossRef]
  23. Subgerencia de Planificación y Gestión Estratégica. Informe Ejecutivo de Gestión Diciembre 2024; Operador Nacional de Electricidad-CENACE: Quito, Ecuador, 2025; pp. 1–10. Available online: https://www.cenace.gob.ec/biblioteca/# (accessed on 29 April 2025).
  24. Chiles, A.; Junia, C.; Briones, R.; Torres, A. Panorama Eléctrico Edición 24-Septiembre; Agencia de Regulación y Control de Electricidad: Quito, Ecuador, 2024; pp. 1–103. [Google Scholar]
  25. Gestión Estratégica. Informe Ejecutivo de Gestión Diciembre 2023; Operador Nacional de Electricidad: Quito, Ecuador, 2024; pp. 1–10. Available online: https://www.cenace.gob.ec/biblioteca/# (accessed on 29 April 2025).
  26. Simbaña, L.; Vergara, V.; Vaca, M.; Maila, G. DATOS ABIERTOS. Catálogo de Datos Abiertos. 2025. Available online: http://datosabiertos.gob.ec/dataset/ (accessed on 29 April 2025).
  27. Diaz, M.; Porras, F.; Torres, A.; Cajamarca, D. Panorama Eléctrico Edición 20-Enero; Agencia de Regulación y Control de Energía y Recursos Naturales No Renovables: Quito, Ecuador, 2024; pp. 1–68. [Google Scholar]
  28. Torres, A.; Junia, C.; Salazar, O. Panorama Eléctrico Edición 25-Noviembre; Agencia de Regulación y Control de Electricidad: Quito, Ecuador, 2024; pp. 1–42. [Google Scholar]
  29. Cajamarca, D.; Torres, A.; Junia, C.; Briones, R. Panorama Eléctrico Edición 22-Mayo; Agencia de Regulación y Control de Energía y Recursos Naturales No Renovables: Quito, Ecuador, 2024; pp. 1–85. Available online: www.controlrecursosyenergia.gob.ec (accessed on 29 April 2025).
  30. North American Electric Reliability Corporation (NERC). 2018 Long-Term Reliability Assessment; NERC: Washington, DC, USA, 2018; pp. 1–151. [Google Scholar]
  31. Allan, R.; Billinton, R. The IEEE Reliability Test System—Extensions to and Evaluation of the Generating System. IEEE Trans. Power Syst. 1986, 1, 1–7. [Google Scholar] [CrossRef]
  32. Allan, R.; Billinton, R. IEEE Reliability Test System. IEEE Trans. Power Appar. Syst. 1979, PAS-98, 2047–2054. [Google Scholar]
  33. North American Electric Reliability Corporation (NERC). Generating Availability Data System (GADS), 2025. Available online: https://www.nerc.com/pa/RAPA/gads/Pages/GeneratingAvailabilityDataSystem-(GADS).aspx (accessed on 29 April 2025).
  34. Zapata, C.J. Confiabilidad de Sistemas Eléctricos de Potencia; Universidad Tecnológica de Pereira: Pereira, Colombia, 2011. [Google Scholar]
  35. Shirvani, M.; Memaripour, A.; Abdollahi, M.; Salimi, A. Calculation of Generation System Reliability Index: Expected Energy Not Served. Life Sci. J. 2012, 9, 3443–3448. [Google Scholar]
  36. SPP Staff. 2019 SPP Loss of Load Expectation Study Report; SPP Resource Adequacy Team: Little Rock, AR, USA, 2020. [Google Scholar]
  37. Hashemi-Dezaki, H.; Askarian-Abyaneh, H.; Haeri-Khiavi, H. Reliability Optimization of Electrical Distribution Systems Using Internal Loops to Minimize Energy Not-Supplied (ENS). J. Appl. Res. Technol. 2015, 13, 416–424. Available online: www.jart.ccadet.unam.mx (accessed on 29 April 2025). [CrossRef]
  38. Garip, S.; Özdemir, Ş.; Altın, N. Power System Reliability Assessment—A Review on Analysis and Evaluation Methods. J. Energy Syst. 2022, 6, 401–419. [Google Scholar] [CrossRef]
  39. Khatib, T.; Ibrahim, I.A.; Mohamed, A. A Review on Sizing Methodologies of Photovoltaic Array and Storage Battery in a Standalone Photovoltaic System. Energy Convers. Manag. 2016, 120, 430–448. [Google Scholar] [CrossRef]
  40. North American Electric Reliability Corporation (NERC). Reliability Standards for the Bulk Electric Systems of North America; NERC: Atlanta, GA, USA, 2024; pp. 1–3660. [Google Scholar]
  41. Ivanova, P.; Grebesh, E.; Mutule, A.; Linkevics, O. An Approach to Optimize the Cycling Operation of Conventional Combined Heat and Power Plants; Faculty of Power and Electrical Engineering, Riga Technical University: Riga, Latvia, 2017; pp. 127–140. [Google Scholar]
  42. Joshi, M.; Palchak, D.; Rehman, S.; Soonee, S.K.; Saxena, S.C.; Narasimhan, S.R. Ramping Up the Ramping Capability—India’s Power System Transition; USAID: Washington, DC, USA, 2020.
  43. Shankar, A.; Saxena, A.K.; Mazumdar, R. Pumped Storage Plants—Essential for India’s Energy Transition; The Energy and Resources Institute (TERI): New Delhi, India, 2023; Available online: https://www.teriin.org (accessed on 25 May 2025).
  44. Godoy, J.C.; Cajo, R.; Mesa Estrada, L.; Hamacher, T. Multi-criteria Analysis for Energy Planning in Ecuador: Enhancing Decision-Making through Comprehensive Evaluation. Renew. Energy 2025, 241, 122278. [Google Scholar] [CrossRef]
  45. Garbier, M.; Čorejová, T. Efficiency of Battery Systems from the Point of View of Economic Return. Prod. Eng. Arch. 2024, 30, 344–353. [Google Scholar] [CrossRef]
  46. Rey, S.O.; Romero, J.A.; Trilla Romero, L.; Filbà Martínez, À.; Sanchez Roger, X.; Qamar, M.A.; Domínguez-García, J.L.; Gevorkov, L. Powering the Future: A Comprehensive Review of Battery Energy Storage Systems. Energies 2023, 16, 6344. [Google Scholar] [CrossRef]
  47. Nazaralizadeh, S.; Banerjee, P.; Srivastava, A.K.; Famouri, P. Battery Energy Storage Systems: A Review of Energy Management Systems and Health Metrics. Energies 2024, 17, 1250. [Google Scholar] [CrossRef]
  48. Hyerczyk, J. Natural Gas, WTI Oil, Brent Oil Forecasts Bearish Market Today on Inventory Builds. FXEMPIRE, 5 May 2025, p. 1. Available online: https://www.fxempire.com/forecasts/article/natural-gas-wti-oil-brent-oil-forecasts-bearish-market-today-on-inventory-builds-1521053 (accessed on 26 May 2025).
  49. Alhan, D. Oil Prices Fall Amid Surprise Rise in US Crude Stocks, US-Iran Nuclear Talks. Energy Terminal, 5 May 2025, p. 1. Available online: https://www.aa.com.tr/en/energy/oil/oil-prices-fall-amid-surprise-rise-in-us-crude-stocks-us-iran-nuclear-talks/49238 (accessed on 26 May 2025).
  50. Icaza-Alvarez, D.; Jurado, F.; Flores, C.; Ortiz, G.R. Ecuadorian Electrical System: Current Status, Renewable Energy and Projections. Heliyon 2023, 9, e16010. [Google Scholar] [CrossRef] [PubMed]
  51. Ministerio de Economía y Finanzas. Subsidios Proforma Presupuestaria 2024; Ministerio de Economía y Finanzas: Ecuador, Quito, 2024; pp. 1–22. [Google Scholar]
  52. Pérez, V.; Páez, B.; Játiva, J.A.; Gallegos, J.D.; Paredes, A.; Escobar, E.; Egas, S. La Crisis del Sector Eléctrico; Universidad San Francisco de Quito: Quito, Ecuador, 2024; pp. 1–25. [Google Scholar]
  53. Soria, R.; Villamar, D.; Rochedo, P. Impacto Económico de la Transición Energética en Ecuador; Ministerio de Energía y Minas del Ecuador: Quito, Ecuador, 2024. [Google Scholar]
Figure 1. Participation of hydroelectric generation in national total production.
Energies 18 03059 g001
Figure 2. Daily electricity demand profile based on data from the electric power panorama.
Energies 18 03059 g002
Figure 3. Availability of time.
Energies 18 03059 g003
Figure 4. Flowchart of the proposed reliability assessment method.
Energies 18 03059 g004
Figure 5. Electric load forecast (2025–2029).
Energies 18 03059 g005
Figure 6. Demand Distribution with Uncertainty.
Energies 18 03059 g006
Figure 7. LOLE index comparison by scenario (2025–2029).
Energies 18 03059 g007
Table 1. SNI generation system.
Generation TypeEffective Capacity (MW)Number of Units
Biogas7.203
Biomass136.406
Wind66.5025
Hydropower5146.40162
Photovoltaic Solar23.6029
Thermal1796.80144
Total7177369
Source: Own elaboration based on data from the national electricity system.
Table 2. FOR and EFORd by plant type and capacity range (NERC classification).
Technology (EC)Plant Type (NERC)MW RangeFOREFORd
Steam Thermal (Turbovapor)Fossil Oil Primary1–990.16
100–1990.14
Gas Thermal (Turbogas)Gas Turbine1–190.76
20–490.61
>500.35
Combined Cycle ThermalCombined CycleAll0.01
Diesel Engine Thermal (MCI)DieselAll0.17
HydropowerHydro1–290.17
All0.098
PhotovoltaicPV (Photovoltaic)All0.50
WindWindAll0.07
BiomassBiomassAll0.15
Table 3. Reliability indicators by scenario.
YearScenarioLOLEEENSEIRCapacity
[-] [d/y] [MWh] [%] [MW]
202310.000050.000316100.007717
20.000110.00764699.956060
375.3124,329.6698.384890
202410.0000220.001605100.007717
20.7515883.099499.995951
390.7116,351.998.804818
Scenario 1: Optimistic. Scenario 2: Technical. Scenario 3: Realistic.
Table 4. Comparison of demand forecasting models.
ModelMSEMAEMAPE (%)
Holt–Winters94,026.68174.674.31
ARIMA111,198.02262.926.09
SARIMA102,397.78244.355.77
Table 5. Projected installed capacity by year and technology type according to the 2024–2029 Master Electrification Plan (PME).
YearHydraulicThermalPhotovoltaicWindBiomassGeothermalTotal (MW)
202420510036341
2025110400100610
20263241760509
202761100217110488
2028501300505090501590
2029250250
Own elaboration based on the 2024–2029 Master Electrification Plan (PME).
Table 6. LOLE results by year for the analyzed scenarios.
YearScenario 1 *Scenario 2 *Scenario 3 *Scenario 4 *
2025 2.99 × 10 5 0.746224.817763.2136
2026 3.08 × 10 6 2.274746.5442101.9286
2027 7.62 × 10 7 5.321679.0884149.9048
2028 5.34 × 10 11 11.3951122.0949202.1327
2029 4.92 × 10 11 22.4796172.8470252.6663
* All values express the LOLE index in days per year (d/year).
Table 7. Comparison of technologies applicable for flexible backup in the SNI.
TechnologyStart-Up TimeRamp Capability (%/min)Estimated Cost (USD/MWh)
Hydroelectric Plant<10 min>535–50
Combined-Cycle Gas Turbine2–6 h1–270–90
Open-Cycle Gas Turbine10–20 min5–10180–220
Reciprocating Engine5–15 min8–12130–170
Disclaimer/Publisher’s Note: The statements, opinions and data contained in all publications are solely those of the individual author(s) and contributor(s) and not of MDPI and/or the editor(s). MDPI and/or the editor(s) disclaim responsibility for any injury to people or property resulting from any ideas, methods, instructions or products referred to in the content.

