Article

Optimization and Analysis of Sensitive Areas for Look-Ahead Electromagnetic Logging-While-Drilling Based on Geometric Factors

1
CNOOC Key Laboratory of Well Logging and Directional Drilling, Langfang 065201, China
2
China Oilfield Services Limited, Beijing 101149, China
3
School of Geoscience and Technology, Southwest Petroleum University, Chengdu 610500, China
*
Author to whom correspondence should be addressed.
Energies 2025, 18(12), 3014; https://doi.org/10.3390/en18123014
Submission received: 11 April 2025 / Revised: 24 May 2025 / Accepted: 27 May 2025 / Published: 6 June 2025
(This article belongs to the Special Issue Advancements in Electromagnetic Technology for Electrical Engineering)

Abstract

Look-ahead electromagnetic (EM) logging-while-drilling (LWD) plays an indispensable role in the prediction of deep and ultra-deep reservoirs. Traditional electromagnetic logging-while-drilling (EMLWD) and ultra-deep EMLWD technologies exhibit certain limitations in the real-time detection of ahead-of-bit formations, making it challenging to meet precision drilling requirements under complex well conditions, with the development of petroleum and gas geology and exploration progress I n the direction of deep, ultra-deep, and complex reservoirs. As a new LWD technology, look-ahead EMLWD enables real-time identification of formation structures, fluid distributions, and interface positions ahead of the drill bit during the drilling process by leveraging the propagation characteristics of EM. This capability provides critical decision-making support for wellbore trajectory optimization, drilling risk assessment, and reservoir evaluation. Therefore, this paper conducts research on theoretical methodologies for look-ahead EMLWD. Leveraging the Born geometric factor theory, we derive the expression for the 3D geometric factor spatial signal and analyze the sensitivity of each component related to look-ahead. Building on this foundation, we establish the sensitivity expression for look-ahead operations and investigate the impact of various antenna configurations on its signal. The results indicate that the coaxial component (gzz) and coplanar components (gxx and gyy) are the primary contributors to look-ahead EMLWD. As frequency decreases and spacing increases, the sensitive region for look-ahead expands. Moreover, look-ahead detection sensitivity becomes increasingly concentrated in front of the drill bit, while the signal at the opposite end is attenuated by incorporating additional coils. Under identical formation conditions, compared with a single-transmitter single-receiver system, a single-transmitter double-receiver coil system exhibits a significantly stronger signal amplitude and more pronounced changes at the formation boundary. Additionally, this configuration enhances sensitivity and extends the sensitive distance in response to variations in formation resistivity.

1. Introduction

In recent years, the exploration and development of deep and ultra-deep oil and gas reservoirs have been increasingly intensified, with the amount of deep and ultra-deep well drilling steadily rising. Accurate prediction of formation characteristics ahead of the drill bit has emerged as a critical technological challenge for ensuring drilling safety and enhancing operational efficiency [1,2,3,4]. This challenge is particularly acute given the limitations of seismic exploration in ultra-deep formations, which suffers from low signal-to-noise ratios, reduced resolution, poor imaging accuracy, and unreliable reservoir prediction capabilities [5,6], ultimately leading to significant uncertainties in undrilled formation evaluation. Electromagnetic logging-while-drilling (EMLWD) has become a vital solution for real-time formation evaluation in deep drilling environments. This technology’s exceptional sensitivity to spatial electrical property distributions around the wellbore makes it particularly valuable for ahead-of-bit detection. Conventional implementation employs a coaxial single-transmitter double-receiver coil configuration, which is the industry standard architecture that measures induced electromotive forces at two receiver positions. Through sophisticated analysis of phase differences and amplitude ratios between these measurements, accurate formation resistivity inversion is achieved [7,8,9,10,11]. After decades of refinement, this methodology has evolved into the cornerstone of modern EMLWD systems. Leading commercial implementations include Schlumberger’s ARC system, Baker Hughes’ MPR technology, Halliburton’s EWR platform, and COSL’s ACPR solution [12,13]. These field-proven tools typically operate within 400 kHz-2 MHz frequency ranges using 0.4–1.2 m transmitter-receiver spacings. While this configuration delivers exceptional vertical resolution, its practical application is constrained by rapid signal attenuation, resulting in limited depth of investigation—a fundamental trade-off that continues to drive technological innovation in the field.
Significant advancements in electromagnetic logging-while-drilling (EMLWD) technology have substantially enhanced geosteering capabilities across diverse formation environments. Firstly, tilted or orthogonal coils have been incorporated to strengthen the tool’s capability to detect formation boundaries. These enhancements primarily leverage the azimuthal sensitivity of cross-component magnetic fields, enabling the logging tool to acquire azimuthal information about the geological structures around the borehole while measuring formation resistivity [6,14,15]. This allows for more precise identification of formation boundaries. Secondly, a modular design has been adopted, combined with operating frequencies ranging from 1 kHz to 100 kHz and long transmitter-receiver spacings of 5 m to 20 m [16]. This reduces electromagnetic wave attenuation in formations and increases signal penetration depth, extending the detection range to several tens of meters. Several representative electromagnetic LWD technologies for deep detection include Schlumberger’s Geosphere, Halliburton’s EarthStar, and Baker Hughes’ Visitrak [17,18,19]. These tools have broken through the depth limitations of traditional electromagnetic LWD, enabling oil and gas exploration and development teams to identify reservoir characteristics earlier during drilling, optimize well trajectories, and improve hydrocarbon zone penetration rates—thereby enhancing overall drilling efficiency. The technology demonstrates particular efficacy in horizontal and low-angle well applications, where precise formation evaluation is most critical for successful well placement.
Unlike ultra-deep EMLWD, which uses cross-components for horizontal wellbore inspection, look-ahead EMLWD utilizes coaxial and coplanar components to define a signal, providing resistivity information of formations ahead of the drill bit. As the demand for boundary detection ahead of the drill bit continues to rise, oil service companies have developed various look-ahead tools to enhance detection capabilities and optimize wellbore positioning [20,21,22,23]. Building upon this concept, Schlumberger and Halliburton have launched their Irisphere and BrightStar services, respectively, enabling the detection of formation features up to 30 m ahead of the drill bit [24]. Meanwhile, Schlumberger’s look-around-look-ahead (LALA) inversion workflow allows for detection of a reservoir top up to 20 m ahead, and has successfully identified abnormally high-pressure gas layers and accurately located casing wells, greatly demonstrating the application value of look-ahead EMLWD [25,26,27]. Furthermore, tools based on the boundary detection principle using an open-loop antenna, which is sensitive to resistivity anomalies induced by a magnetic dipole source, have been designed [28,29]. Theoretical studies suggest that it can achieve ultra-deep detection capabilities under very short spacing, providing new ideas for the development of geological guidance tools [30,31]. Despite these advancements, the response mechanism of look-ahead EMLWD still requires more theoretical support.
In our opinion, for vertical wells/low-angle wells, significant challenges remain in look-ahead detection while drilling: (1) current look-ahead detection tools have relatively homogeneous structures, with pre-drill contributions being substantially smaller than those from surrounding formations; (2) existing data processing methods are limited to 1D models, significantly constraining their applicability. So, we begin with the sensitivity of the full-component geometric factor space, study the 3D spatial distribution characteristics of each component, and optimize the sensitive components for look-ahead. Then, based on look-ahead EMLWD simulation, we establish a look-ahead sensitivity function to analyze the measurement principles and detection characteristics. This can further explore the influence of different antenna combinations on look-ahead sensitivity, ultimately achieving the study of the sensitivity response characteristics of look-ahead EMLWD signals. Through this research, it is hoped to clarify the look-ahead mechanism of EMLWD, develop a method for studying look-ahead sensitivity, and enrich theoretical research in this field.
This paper is organized as follows: Section 2 is based on the full-component spatial expression of the Born geometric factor; the geometric factor expression for look-ahead detection in electromagnetic logging-while-drilling (LWD) is derived, and the spatial distribution characteristics of look-ahead detection are analyzed. Section 3 first examines the look-ahead detection components and their spatial sensitivity distribution features. Subsequently, an optimized sensitivity expression for electromagnetic LWD look-ahead detection is defined. A quantitative discussion is presented on how signal combination methods enhance look-ahead detection signals, along with an analysis of the influence of frequency, transmitter-receiver spacing, and formation resistivity on the sensitivity of the combined signals.

2. Methods

In this section, we derive the 3D space expression of Born geometric factors and select the sensitivity components of look-ahead. The expression of look-ahead EMLWD based on geometric factor theory is also derived.

2.1. Born Geometric Factor

The analytical solution for EMLWD derived from Maxwell’s equations cannot intuitively reveal the contribution of formation parameters to the tool’s received signals. Therefore, to elucidate the origin of measurement signals in induction logging, the Doll geometric factor was introduced to quantitatively characterize the contribution of different formation zones to the received signal. The Doll geometric factor not only visually demonstrates the mapping relationship between induction logging signals and spatial formation electrical parameters but also provides a theoretical foundation for tool design, data processing, and inversion methodologies [32,33,34,35]. For a homogeneous medium, the expression of the Doll geometric factor is given as follows:
g D o l l = L 2 ρ 3 r R 3 r T 3
ρ = ( x x T ) 2 + ( y y T ) 2 r R = x x r 2 + y y r 2 + z z r 2 r T = x x t 2 + y y t 2 + z z t 2
Here, assuming the any point in the medium is r = x , y , z , the receiver is located at r R = x R , y R , z R , and the transmitter is at r T = x T , y T , z T ; the radial distance between the field point and the source point is ρ ; the distance between any point in the medium and the receiver is r R ; and r T denotes the distance between the source and the receiver.
When formation conductivity is high, electromagnetic energy experiences severe attenuation, and the skin effect significantly reduces the effective current transmission depth. Under these conditions, the Doll geometric factor demonstrates considerable deviation from actual responses because it fails to account for the skin effect’s modification of electromagnetic field distribution. To improve the accuracy of response formulations, the Born approximation method from quantum scattering theory was introduced. By establishing a wave equation incorporating skin effect, a Born approximation formula suitable for calculating resistivity responses in anisotropic formations was derived. Unlike the Doll geometric factor, which is limited to formations with infinite resistivity, the Born geometric factor is applicable to formations with any resistivity. Although its application is constrained in cases of high-contrast resistivity, the Born geometric factor remains a primary method for investigating signal origins [36]. The expression for the Born geometric factor is as follows:
σ ( z ) = σ b a ( z ) + + g B o r n ( z z , σ b ) [ σ ( z ) σ b ( z ) ] d z
Here, σ ( z ) represents heterogeneous formation conductivity (S/m); σ b ( z ) denotes background formation conductivity (S/m); σ b a ( z ) indicates apparent background conductivity when formation conductivity equals background conductivity (S/m); and g B o r n stands for the longitudinal Born geometric factor of background conductivity.
For a double-coil system, the expression of the two-dimensional Born geometric factor is given as follows:
g = L 2 ρ 3 r R 3 r T 3 ( 1 i k r T ) ( 1 i k r R ) e i k ( r T + r R )
Here, k 2 = i ω μ σ , ω represents the angular frequency of the tool.
For transversely isotropic formation models, the conductivity tensor is expressed as follows:
σ = σ h 0 0 0 σ h 0 0 0 σ v
To acquire comprehensive downhole measurements, modern electromagnetic logging-while-drilling (LWD) tools employ a multicomponent modular design. This configuration consists of transmitter and receiver coil systems aligned along the x, y, and z axes, with pairwise combinations enabling magnetic tensor measurements even in single-transmitter single-receiver mode. In the formation coordinate system, the Born geometric factor tensor g(x, y, z) is expressed as follows:
g = g x g y g z = λ b 2 G x x E x + λ b 2 G x y E y + G x z E z λ b 2 G y x E x + λ b 2 G y y E y + G y z E z λ b 2 G z x E x + λ b 2 G z y E y + G z z E z
where, λ b 2 G x x E x and λ b 2 G x y E y represent the relative contributions of horizontal conductivity, while G x z E z denotes the relative contribution of vertical conductivity. The geometric factor g expressions for different measurement components are as follows:
g = g x x g y x g z x g x y g y y g z y g x z g y z g z z
By applying coordinate transformation, the geometric factor in the tool coordinate system can be obtained as follows:
g ^ = g x x g x y g x z g y x g y y g y z g z x g z y g z z = cos α 0 sin α 0 1 0 sin α 0 cos α g cos α 0 sin α 0 1 0 sin α 0 cos α
Taking transmission in the x-direction as an example, the expression for the geometric factor of induction logging in cylindrical coordinates is given as follows:
g x x = L 2 ρ ρ 2 sin 2 ϕ + z z a l z z a + l r T 3 r R 3 e i k r R + r T 1 i k r T 1 i k r R g x y = L 2 ρ 3 sin ϕ cos ϕ r T 3 r R 3 e i k r R + r T 1 i k r T 1 i k r R g x z = L 2 ρ 2 z a + l z cos ϕ r T 3 r R 3 e i k r R + r T 1 i k r T 1 i k r R
When the formation conductivity is set to 1.0 S/m, the transmitter coil frequency is 20 kHz, and the spacing between the transmitter and receiver coils is 1 m (with the receiver coil positioned below the transmitter and their midpoint as the origin); the geometric factors for each component are shown in Figure 1. The red and blue surfaces represent isosurfaces with response point values of 0.015 and −0.015, respectively. In the following text, the meanings represented by the red and blue parts are the same as those in Figure 1.

2.2. Look-Ahead Geometric Factor for LWD

EMLWD typically utilizes the attenuation of signals received by the coil to predict formation boundary information. In different formation models, the absolute value of the received signal may vary significantly. By defining the amplitude ratio and phase difference, the errors caused by such variations can be effectively reduced:
A = 20 lg V 1 V 2 ϕ = a n g l e ( V 1 ) a n g l e ( V 2 )
Here, A and ϕ represent the amplitude ratio and phase difference, respectively, while V1 and V2 denote any two received signals. When an anomalous body is present, according to the Born perturbation principle, the signal in the medium can be considered as the sum of the background medium signal and the signal variation induced by the anomalous body. The signal variation caused by the anomalous body is expressed as follows:
δ E ( r ) = i ω μ V s d r δ σ ( r ) G ( r , r ) E ( r )
Here, G(r, r′) represents the Green’s function of the source to the anomalous body, and Vs is the volume of the conductivity anomalous body.
Since the electromagnetic wave received signal is in complex form, dividing V1 by V2 allows the establishment of an expression relating to the amplitude ratio and phase difference:
V 1 V 2 = | V 1 | e i ϕ 1 | V 2 | e i ϕ 2 = A e i Δ ϕ ln V 1 ln V 2 = ln A + i Δ ϕ
Taking the derivative of the right-hand side of the equation yields the while-drilling geometric factor:
S = δ ln A + i δ Δ ϕ = δ V 1 V 1 δ V 2 V 2
Sort to obtain the following:
δ ln A = Re V s d r δ σ ( r ) G ( r 1 , r ) E 1 ( r ) E b 1 V s d r δ σ ( r ) G ( r 2 , r ) E 2 ( r ) E b 2 δ Δ ϕ = Im V s d r δ σ ( r ) G ( r 1 , r ) E 1 ( r ) E b 1 V s d r δ σ ( r ) G ( r 2 , r ) E 2 ( r ) E b 2
The spatial sensitivity distribution of geometric factor components (gxx, gyy, and gzz) and look-ahead geometric factors are shown in Figure 2.

3. Results and Discussion

3.1. Geometric Factor Distribution Features

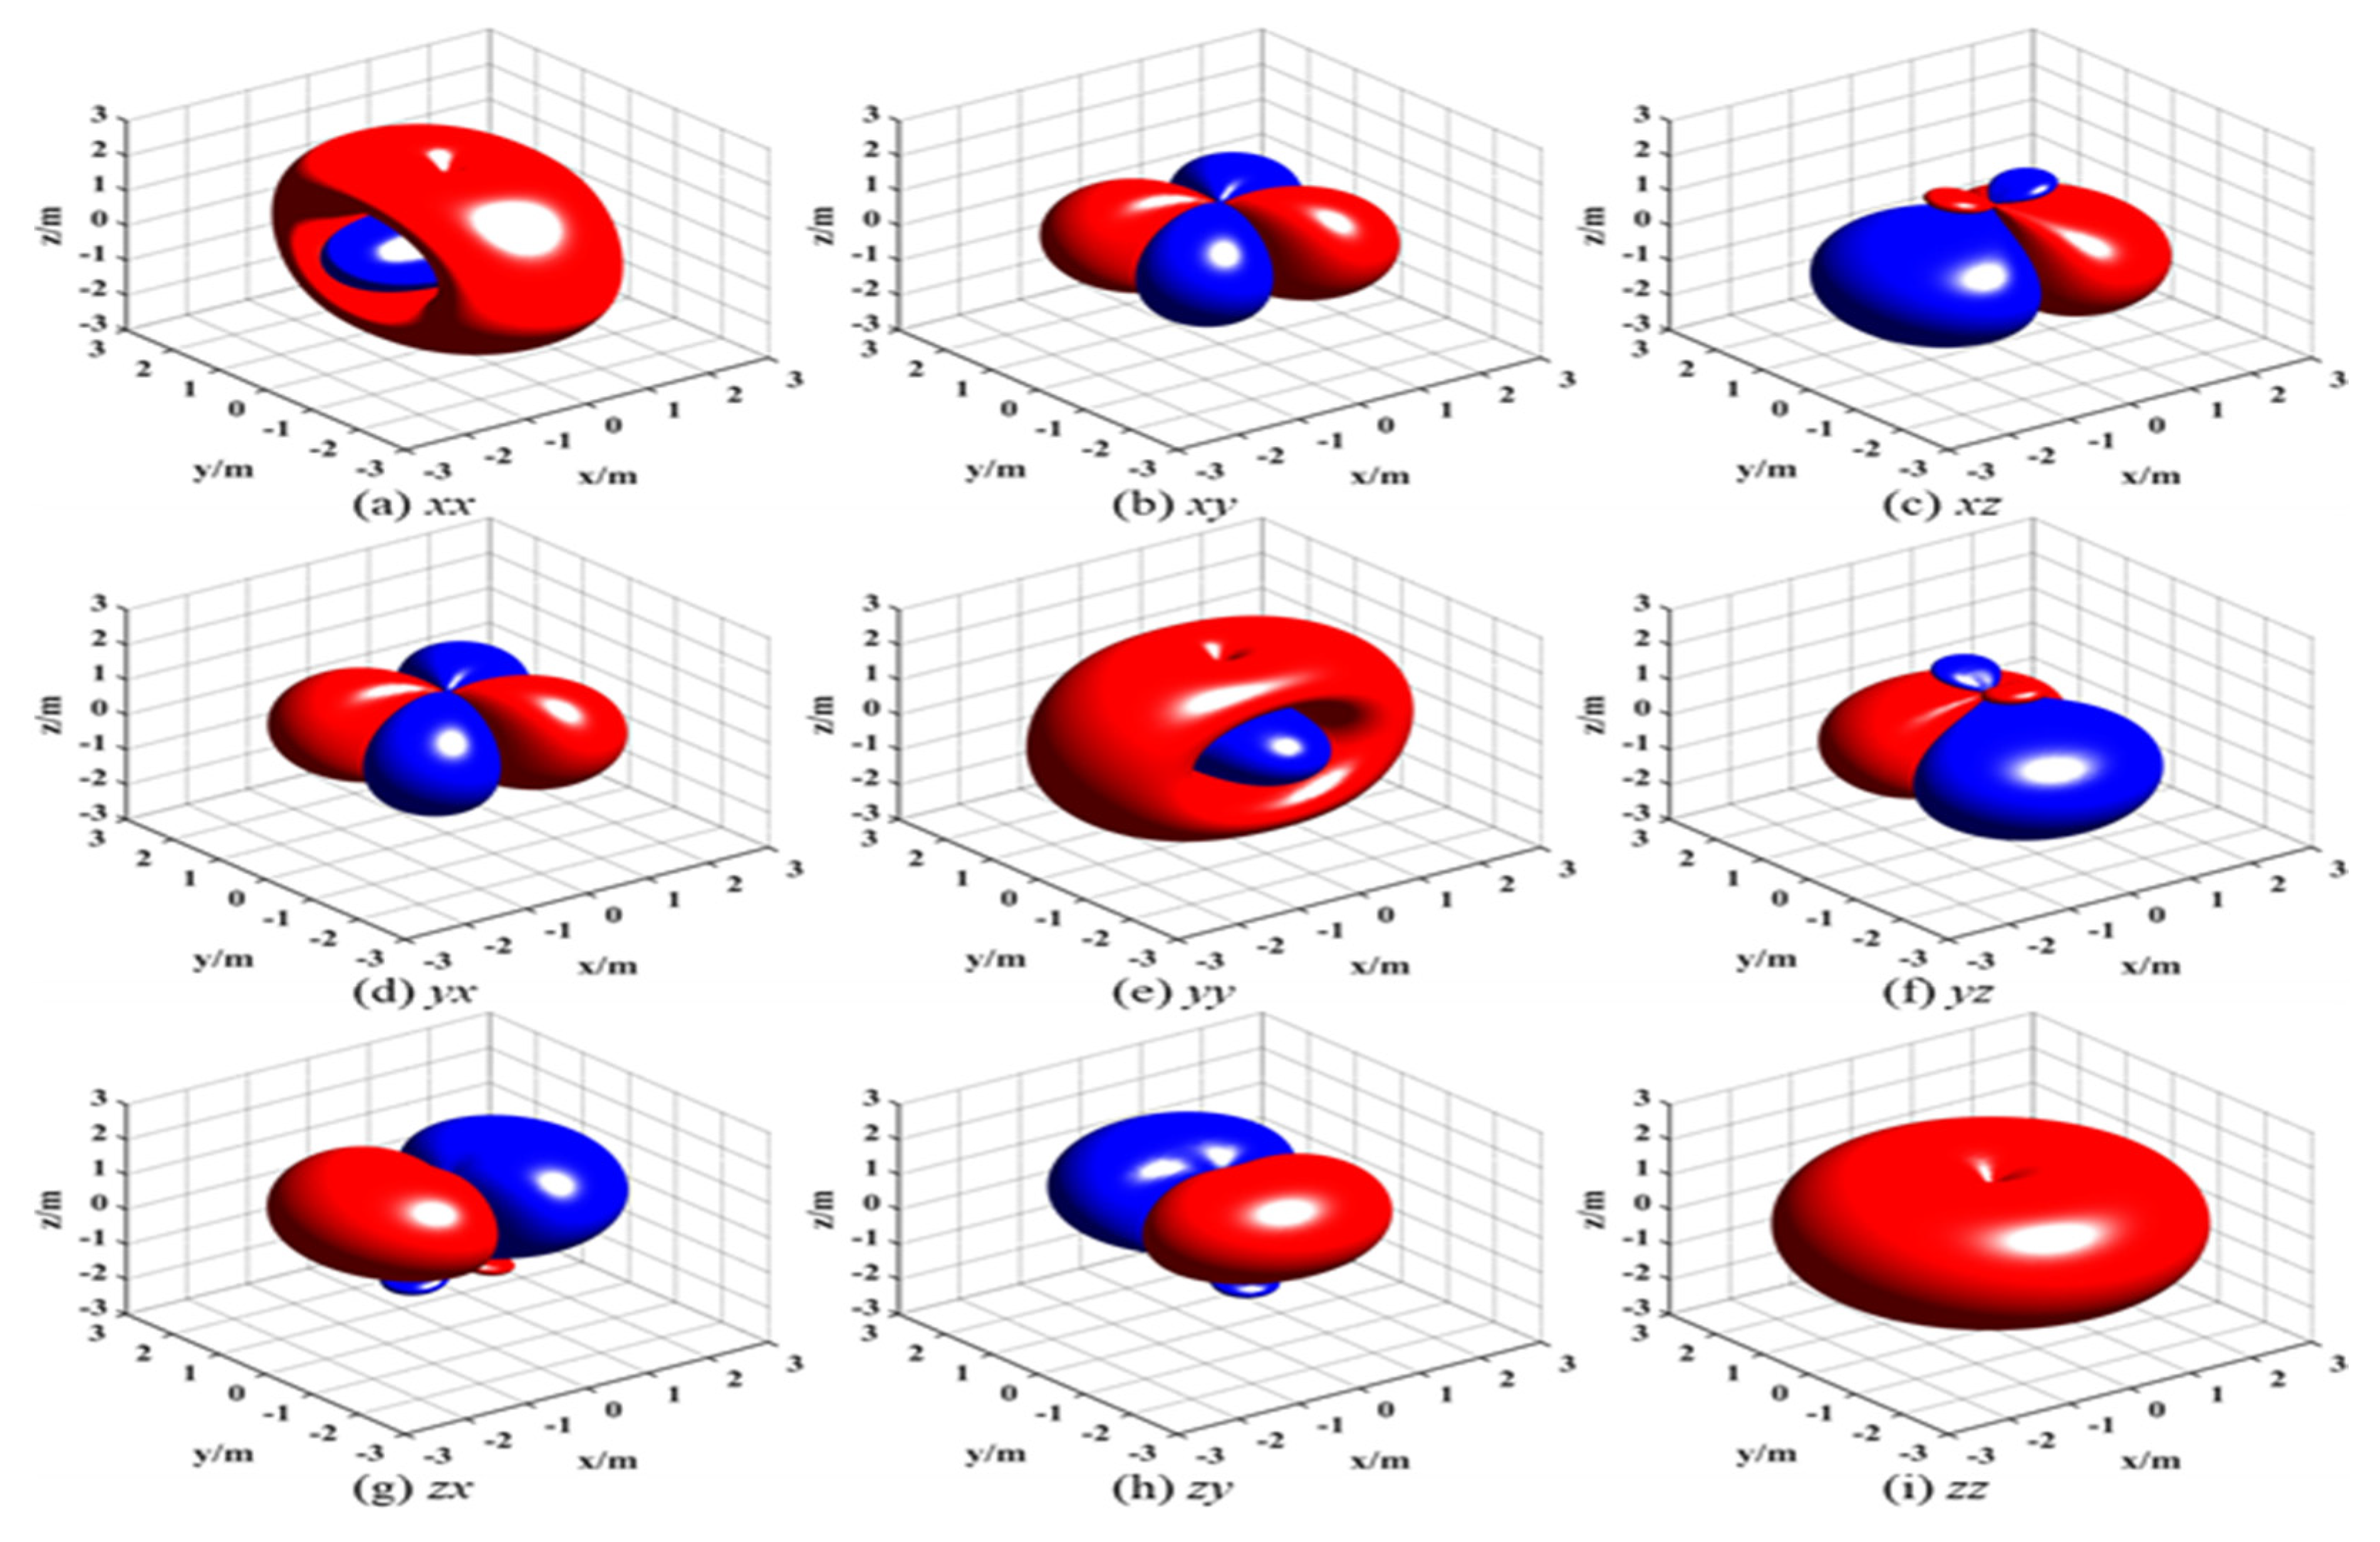
3.1.1. Component Geometric Factor

From the perspective of spatial sensitivity of the induced electromotive force components, the coaxial and coplanar components exhibit strong sensitivity to the spatial distribution of resistivity. When the resistivity of the formation ahead of the drill bit changes, the induced electromotive force responses vary correspondingly, making these components suitable as look-ahead sensitivity components. Further analysis of the spatial sensitivity of the coaxial and coplanar components under different source offsets and frequency conditions was conducted using geometric factors. The source spacings for the coil system were set to 0.5 m, 1 m, and 2 m, with operating frequencies of 20 kHz, 50 kHz, and 200 kHz, respectively.
The 3D spatial distribution of the geometric factors for the gxx, gyy, and gzz components under a source spacing of 1 m as the frequency varies is shown in Figure 3. It can be observed that the detection range of the geometric factors is significantly affected by frequency. As the frequency increases, the attenuation of each component accelerates, resulting in a markedly reduced detection range.
The variation trends of geometric factors under a frequency of 20 kHz and different source spacings are shown in Figure 4. As the spacing increases, the spatial sensitivity range of each component expands. Among them, the longitudinal sensitivity of the gxx and gyy components shows the most significant enhancement, while the radial sensitivity of the gzz component improves most prominently. In summary, operating frequency and spacing are critical parameters influencing the spatial sensitivity of each component. These parameters should be optimized based on practical requirements to enhance forward detection.

3.1.2. Look-Ahead Geometric Factor

To investigate the three-dimensional spatial distribution characteristics of the look-ahead geometric factor, a single-transmitter single-receiver coil configuration was adopted, with the transmitter and receiver positioned at (0, 0, −l m) and (0, 0, l m), respectively, where l = L/2, and the formation resistivity was set to 10 Ω·m. Simulations were conducted for spacings (L) of 4 m, 6 m, and 8 m, and operating frequencies of 12 kHz, 24 kHz, 48 kHz, and 96 kHz. The resulting geometric factor distributions, shown in Figure 5 and Figure 6, illustrate the variations with spacing and frequency. In these figures, the red and blue regions represent the contribution distributions for response points of 0.015 and −0.015, respectively.
Figure 5 demonstrates the influence of operating frequency on the look-ahead geometric factor distribution at a spacing of 8 m. It can be seen from the figure that the three-dimensional distribution of the look-ahead geometric factor decreases with an increase in the operating frequency, indicating that electromagnetic signal attenuation accelerates. The positive contribution of the sensitive region of look-ahead changes little under the influence of frequency, while the negative contribution changes greatly and decreases with an increase in frequency.
Figure 6 shows the effect of spacing at a fixed frequency of 12 kHz. As can be seen from the figure, with an increase in spacing, the positive contribution gradually increases, while the negative contribution decreases with the increase in spacing, and the difference between positive and negative contributions increases, making them more sensitive to the change of formation resistivity in front.
In summary, the selection of smaller frequency and larger spacing helps to enhance the sensitivity of the electromagnetic signal to forward formation resistivity.

3.2. Optimization of Sensitive Area

3.2.1. Optimization Method

According to the principle of electric field superposition, when multiple electric fields exist in space at the same time, their effect on a certain point is equal to the sum of the effects of each electric field. Therefore, with reference to the idea of “hardware focus”, the look-ahead sensitive area is optimized. The look-ahead geometric factor optimization expression of the single-transmitter double-receiver system is as follows:
S = 2 δ V z z 2 δ V z z 1 2 V b z z 2 V b z z 1 2 δ ( V x x 2 + V y y 2 ) δ ( V x x 1 + V y y 1 ) 2 ( V b x x 2 + V b y y 2 ) ( V b x x 1 + V b y y 1 )
The single-transmitter double-receiver system is defined as (T, R1, R2), and the change in the sensitive region of look-ahead EMLWD under different coil combinations is discussed. At a frequency of 24 kHz, changes in the look-ahead sensitive area under different systems are shown in Figure 7. The results show that the sensitive region is no longer symmetric about the origin z = 0 after signal coupling, and significant displacement in the sensitive region is concentrated at one end, which weakens the signal response at the other end. When each coil is closely spaced, the look-ahead sensitive region changes weakly with frequency. When the spacing increases, the look-ahead sensitive area weakens significantly with an increase in frequency, and an obvious distribution appears at the coupling of the coil to achieve the focusing effect.

3.2.2. Sensitivity Analysis

The sensitive region distribution of look-ahead based on geometric factors can directly describe the response characteristics of the electromagnetic signal in the formation medium, but it cannot quantitatively describe the specific numerical changes in the electromagnetic signal. Therefore, the sensitivity equations of amplitude ratio and phase difference near the formation interface are defined based on the look-ahead mode of ultra-deep electromagnetic logging-while-drilling, and the sensitivity changes are described quantitatively.
S A t t = 20 lg 2 V z z V x x + V y y D T B S P s = a n g l e 2 V z z a n g l e V x x + V y y D T B
We build a double layer formation model, which is shown as Figure 8, the upper high resistance strata is Rt, and the lower the low resistance strata is Rs. It is affected by various factors when the logging instrument with a single and double retracting coil system penetrates the formation vertically.
When the spacing between the transmitting T and R1 and R2 are set to 2 m and 4 m, respectively, the operating frequency is 12 kHz, as shown in Figure 9 for the amplitude ratio and phase difference in the high resistance formation under the conditions of the slope. The results show that the slope is at the maximum near the boundary, and the sensitivity is the strongest. As the tool moves away from the boundary, the slope decreases and the sensitivity decreases. Under the same DTB, the slope of the single-transmitter double-receiver system is always greater than that of the single-transmitter single-receiver system, and stronger in sensitivity. In order to further quantify the foresight enhancement distance, the DTB corresponding to the amplitude ratio of 0.2 and the phase difference of 0.01 were defined as the look-ahead sensitivity threshold value. The results show that for the single-transmitter single-receiver system, sensitivity to the front 2 m formation boundary is present when the spacing is 2 m, and sensitivity to the front exploration is increased to 4 m when the spacing increased to 4 m. When combined into a single-transmitter double-receiver system, the distance is about 5 m.
To systematically evaluate the performance of electromagnetic look-ahead detection, we conducted a series of numerical simulations examining three critical parameters: receiver spacing, operating frequency, and formation resistivity. The following sections present our key findings.
Initial investigations focused on optimizing receiver spacing in a single-transmitter double-receiver system. Simulations were conducted with formation resistivities of 0.1 Ω·m and 10 Ω·m at an operating frequency of 12 kHz. As shown in Figure 10, look-ahead sensitivity demonstrates a positive correlation with receiver spacing. The optimal configuration (R1, R2) = (10 m, 12 m) achieved a maximum detection sensitivity distance of 9 m, suggesting that while increased spacing enhances detection capability, practical limitations exist due to the observed diminishing returns.
Building upon these spatial configuration results, we subsequently examined frequency dependence using a fixed receiver spacing of (4 m, 6 m). Figure 11 reveals a non-monotonic relationship between frequency and sensitivity, with performance peaking at 12 kHz (maximum sensitivity distance: 7.5 m). This finding indicates that frequency selection represents a critical trade-off between signal penetration and resolution, with 12 kHz emerging as the optimal operating frequency for this configuration.
The influence of formation resistivity was then investigated while maintaining the optimal 12 kHz frequency and (4 m, 6 m) spacing in Figure 12.
Results demonstrate an inverse relationship between resistivity and sensitivity, with detection capability becoming marginal (>1000 Ω·m) and optimal performance occurring in lower resistivity formations (0.1–10 Ω·m range, sensitivity distance: 7.5 m). This establishes clear operational boundaries for effective detection.
Finally, when Rt remains constant at 10 Ω·m, we compared the performance of different system configurations in Figure 13. The analysis reveals that the single-transmitter double-receiver system maintains sensitivity up to 0.9 Ω·m formation resistivity compared to 0.5 Ω·m for single-receiver systems. Sensitivity to formation boundaries decreases with increasing low-resistivity formation resistivity, and the single-transmitter double-receiver configuration demonstrates significantly enhanced sensitivity compared to single-receiver systems.

4. Conclusions

In this paper, we utilized the Born geometric factor to analyze the sensitivity of look-ahead EMLWD and derived its quantitative expression of sensitivity. The sensitivity differences between the single-transmitter double-receiver coil system and the single-transmitter single-receiver coil system were compared and analyzed. The results showed that the look-ahead sensitivity of the single-transmitter double-receiver coil system increased by 30%.
We further systematically investigated the logging response characteristics of the combined coil system, providing a theoretical foundation for optimizing instrument parameter design. Our results demonstrate that when a high-resistivity formation (10 Ω·m) is adjacent to a low-resistivity formation, the look-ahead sensitivity diminishes as the resistivity of the low-resistivity zone increases. Notably, sensitivity stabilizes when the low-resistivity formation reaches 0.5 Ω·m, with no further changes observed. However, the combined coil system remains sensitive to resistivity variations within the 0.9 Ω·m range, highlighting its robust detection capability.
Future work will focus on refining the proposed methodology to further improve accuracy and adaptability. First, based on the existing single-transmitter double-receiver system, we will upgrade to a double-transmitter triple-receiver configuration. By increasing the number of coils and optimizing their spatial arrangements, we aim to enhance signal sensitivity. Next, to address complex formation environments, we will construct transversely isotropic (TI) formation models. Finally, in laboratory settings, we will validate whether the double-transmitter triple-receiver system achieves the expected 30% sensitivity improvement using physical models of inclined formations. Based on anisotropic response data, we will then optimize the coil spatial configuration or adjust the operating frequency range to ensure the instrument’s robustness in actual formation conditions.

Author Contributions

Conceptualization, Z.W. and X.L.; methodology, Z.W., X.Y., G.L., X.Z. and T.L.; validation, X.L.; formal analysis, X.L. and Y.Z.; investigation, X.L.; resources, G.L. and X.Y.; data curation, X.L.; writing—original draft preparation, X.L., G.L. and Y.Z.; writing—review and editing, G.L., X.L. and Z.W.; visualization, X.L.; supervision, Z.W.; project administration, X.Y., G.L., X.Z. and T.L.; funding acquisition, X.Y., G.L., X.Z. and T.L. All authors have read and agreed to the published version of the manuscript.

Funding

We are indebted to the financial support from the Foundation of CNOOC Key Laboratory of Well Logging and Directional Drilling (KJQZ-2024-1103), National Natural Science Foundation of China (42304140), Natural Science Foundation of Sichuan, China (2023NSFSC0771), China Postdoctoral Science Foundation (2022MD713806), and CNOOC Group Science and Technology Project (KJGG-2022-1402).

Data Availability Statement

The original contributions presented in the study are included in the article; further inquiries can be directed to the corresponding author.

Conflicts of Interest

Authors Guoyu Li, Xizhou Yue, Xiang Zhang, Tianlin Liu were employed by the company China Oilfield Services Limited, CNOOC. The remaining authors declare that the research was conducted in the absence of any commercial or financial relationships that could be construed as a potential conflict of interest.

References

  1. Su, Y.; Dou, X.; Gao, W.; Liu, K. Discussion and prospects of the development on measurement while drilling technology in oil and gas wells. Pet. Sci. Bull. 2023, 8, 535–554. [Google Scholar]
  2. Passey, Q.R. Overview of high-angle and horizontal well formation evaluation: Issues, learnings, and future directions. In Proceedings of the SPWLA 46th Annual Logging Symposium, New Orleans, LA, USA, 26–29 June 2005. [Google Scholar]
  3. Market, J.; Quirein, J.; Pitcher, J.; Hinz, D.; Buller, D.; Al-Dammad, C.; Spain, D.; Odumosu, T. Logging-while-drilling in unconventional shales. In Proceedings of the SPE Annual Technical Conference and Exhibition, Florence, Italy, 19–22 September 2010. [Google Scholar]
  4. Gremillion, J.; Flowers, M.; Tvrdy, N.; Okoro, M.; Newnam, Z. Selection of logging-while-drilling measurements for geosteering of horizontal wells in unconventional reservoirs. In Proceedings of the SPE/AAPG/SEG Unconventional Resources Technology, Denver, CO, USA, 22–24 July 2019. [Google Scholar]
  5. Li, Y. Ultra-deep oil and gas reservoir seismic prospecting technologies progress. Oil Geophys. Prospect. 2024, 59, 915–924. [Google Scholar]
  6. Bittar, M.S.; Klein, J.D.; Beste, R.; Hu, G.; Wu, M.; Pitcher, J.L.; Golla, C.; Althoff, G.D.; Sitka, M.; Minosyan, V.; et al. A new azimuthal deep-reading resistivity tool for geosteering and advanced formation evaluation. SPE Reserv. Eval. Eng. 2009, 12, 270–279. [Google Scholar] [CrossRef]
  7. Li, S.; Chen, J.; Binford, T.L. Using new LWD measurements to evaluate formation resistivity anisotropy at any dip angle. In Proceedings of the SPWLA 55th Annual Logging Symposium, Abu Dhabi, United Arab Emirates, 18–22 May 2014. [Google Scholar]
  8. Hu, X.; Fan, Y. Huber inversion for logging-while-drilling resistivity measurements in high angle and horizontal wells. Geophysics 2018, 83, D113–D125. [Google Scholar] [CrossRef]
  9. Bittar, M.; Wu, H.H.; Ma, J.; Griffing, M.; Lozinsky, C. First lwd fully triaxial co-located antenna sensors for real-time anisotropy and dip angle determination, yielding better look-ahead detection. In Proceedings of the SPWLA 61st Annual Logging Symposium, Virtual Online Webinar, 24–29 June 2020. [Google Scholar]
  10. Vetsak, A.; Jablonski, B. Increase exposed bitumen reserves by optimizing wellbore placement in oil sands with extra-deep azimuthal resistivity LWD service. In Proceedings of the SPE Thermal Well Integrity and Design Symposium, Banff, AB, Canada, 27–29 November 2018. [Google Scholar]
  11. Larsen, D.S.; Boesing, D.; Hartmann, A.; Martakov, S.; Mumtaz, A.; Skillings, J.; Vianna, A. Boundary detection ahead of the bit–A sensitivity study of extra deep azimuthal resistivity. In Proceedings of the Offshore Technology Conference Asia, Kuala Lumpur, Malaysia, 20–23 March 2018. [Google Scholar]
  12. Anderson, B.I.; Druskin, V.; Lee, F.; Luling, M.G.; Schoen, F.; Tabanou, J.; Wu, F.; Davydycheva, S.; Knizhnerman, L. Modeling 3D Effects on 2-MHz LWD Resistivity Logs. In Proceedings of the SPWLA Annual Logging Symposium, Houston, TX, USA, 15–18 June 1997. [Google Scholar]
  13. Halliburton Sperry-Sun. Electromagnetic Wave Resistivity (EWR) Sensor Manual; Halliburton Sperry-Sun: Dubai, United Arab Emirates, 2003. [Google Scholar]
  14. Li, Q.; Omeragic, D.; Chou, L.; Yang, L.; Duong, K. New directional electromagnetic tool for proactive geosteering and accurate formation evaluation while drilling. In Proceedings of the SPWLA 46th Annual Logging Symposium, New Orleans, LA, USA, 26–29 June 2005. [Google Scholar]
  15. Bell, C.; Hampson, J.; Eadsforth, P.; Chemali, R.; Helgesen, T.; Meyer, H.; Peveto, C.; Poppitt, A.; Randall, R.; Signorelli, J.; et al. Navigating and imaging in complex geology with azimuthal propagation resistivity while drilling. In Proceedings of the SPE Annual Technical Conference and Exhibition, San Antonio, TX, USA, 24–27 September 2006. [Google Scholar]
  16. Antonsen, F.; De Oliveira, M.E.T.; Hermanrud, K.; Luna, C.A.; Petersen, S.A.; Metcalfe, R.W.; Constable, M.V.; Alme, A.; Vee, T.; Salim, D.; et al. Ultra-deep LWD-resistivity is essential to map reservoir structure and fluid contacts in a two-branched horizontal producer. In Proceedings of the SPE Norway One Day Seminar, Bergen, Norway, 18 April 2018. [Google Scholar]
  17. Seydoux, J.; Legendre, E.; Mirto, E.; Dupuis, C.; Denichou, J.-M.; Bennett, N.; Kutiev, G.; Kuchenbecker, M.; Morriss, C.; Yang, L. Full 3D deep directional resistivity measurements optimize well placement and provide reservoir-scale imaging while drilling. In Proceedings of the SPWLA Annual Logging Symposium, Abu Dhabi, United Arab Emirates, 18–22 May 2014. [Google Scholar]
  18. Wu, H.H.; Golla, C.; Parker, T.; Clegg, N.; Monteilhet, L. A new ultra-deep azimuthal electromagnetic LWD sensor for reservoir insight. In Proceedings of the SPWLA Annual Logging Symposium, London, UK, 2–6 June 2018. [Google Scholar]
  19. Hartmann, A.; Vianna, A.; Maurer, H.-M.; Sviridov, M.; Martakov, S.; Lautenschläger, U.; Antonsen, F.; Olsen, P.A.; Constable, M.V. Verification testing of a new extra-deep azimuthal resistivity measurement. In Proceedings of the SPWLA Annual Logging Symposium, Abu Dhabi, United Arab Emirates, 18–22 May 2014. [Google Scholar]
  20. Li, K.; Gao, J.; Zhao, X. Tool design of look-ahead electromagnetic resistivity LWD for boundary identification in anisotropic formation. J. Pet. Sci. Eng. 2020, 184, 106537. [Google Scholar] [CrossRef]
  21. Hou, L.; Yang, H.; Zhao, P.; Yu, X.; Cui, Y. Development of looking forward and looking around technology while drilling. World Pet. Ind. 2020, 27, 35–41. [Google Scholar]
  22. Zhang, P.; Deng, S.; Hu, X.; Wang, L.; Yuan, X. Detection performance and sensitivity of logging-while-drilling extra-deep azimuthal resistivity measurement. Chin. J. Geophys. 2021, 64, 2210–2219. [Google Scholar]
  23. Qin, Z.; Tang, B.; Wu, D.; Luo, S.; Ma, X.; Huang, K.; Deng, C.; Yang, H.; Pan, H.; Wang, Z. A qualitative characteristic scheme and a fast distance prediction method of multi-probe azimuthal gamma-ray logging in geosteering. J. Pet. Sci. Eng. 2021, 199, 1–10. [Google Scholar] [CrossRef]
  24. Ma, J.; Riofrio, K.; Clegg, N.; Sinha, S.; Wu, H.-H.; Kotwicki, A.; Skorve, T.; Johansen, Y.B. Successful geostopping using a recently developed LWD look-ahead ultra-deep EM resistivity tool. In Proceedings of the ADIPEC, Abu Dhabi, United Arab Emirates, 31 October–3 November 2022. [Google Scholar]
  25. Upchurch, E.R.; Saleem, S.; Russell, K.; Viandante, M.G. Geo-stopping using deep directional resistivity LWD: A new method for well bore placement using below-the-bit resistivity mapping. In Proceedings of the SPE/IADC Drilling Conference and Exhibition, London, UK, 17–19 March 2015. [Google Scholar]
  26. Constable, M.V.; Antonsen, F.; Stalheim, S.O.; Eikenes, S.; Aarflot, H.; Haldorsen, K.; Digranes, G.; Seydoux, J.; Thiel, M.; Davydyche, A.; et al. Looking ahead of the bit while drilling: From vision to reality. In Proceedings of the SPWLA Annual Logging Symposium, Reykjavik, Iceland, 25–29 June 2016. [Google Scholar]
  27. Thiel, M.; Omeragic, D.; Seydoux, J. Enhancing the look-ahead-of-the-bit capabilities of deep-directional resistivity measurements while drilling. In Proceedings of the SPWLA Annual Logging Symposium, The Woodlands, TX, USA, 15–19 June 2019. [Google Scholar]
  28. Hagiwara, T. Detection sensitivity and new concept of deep reading look-ahead look-around geosteering tool. In Proceedings of the SEG International Exposition and Annual Meeting, Anaheim, CA, USA, 14–19 October 2018. [Google Scholar]
  29. Li, S. System and Methodology of Look Ahead and Look Around LWD Tool. U.S. Patent 10,605,073, 31 March 2020. [Google Scholar]
  30. Wang, L.; Li, S.; Fan, Y. An all-new ultradeep detection method based on hybrid dipole antennas in electromagnetic logging while drilling. IEEE Trans. Geosci. Remote Sens. 2019, 58, 2124–2134. [Google Scholar] [CrossRef]
  31. Wu, J.; Gao, Z. Parameter design and response research of ahead detection half-coil induction logging. In Proceedings of the 2022 4th International Conference on Intelligent Control, Measurement and Signal Processing (ICMSP), Hangzhou, China, 8–10 July 2022. [Google Scholar]
  32. Gianzero, S.; Anderson, B.I. A new look at skin effect. Log Anal. 1982, 23, 93–104. [Google Scholar]
  33. Moran, J.H. Induction logging-geometrical factors with skin effect. Log Anal. 1982, 23, 4–10. [Google Scholar]
  34. Zhang, G.J.; Zhang, Z.Q. Application of successive approximation method to the computation of the Green’s function in axisymmetric inhomogeneous media. IEEE Trans. Geosci. Remote Sens. 1998, 36, 732–737. [Google Scholar] [CrossRef]
  35. Howard, A.Q.; Chew, W.C.; Moldoveanu, M.C. A new correction to the Born approximation. IEEE Trans. Geosci. Remote Sens. 1990, 28, 394–399. [Google Scholar] [CrossRef]
  36. Barber, T.; Anderson, B.; Abubakar, A.; Broussard, T.; Chen, K.-C.; Davydycheva, S.; Druskin, V.; Habashy, T.; Homan, D.; Minerbo, G.; et al. Determining formation resistivity anisotropy in the presence of invasion. In Proceedings of the SPE Annual Technical Conference and Exhibition, Houston, TX, USA, 26–29 September 2004. [Google Scholar]
Figure 1. 3D spatial distribution of full-component geometric factors.
Energies 18 03014 g001
Figure 2. This figure shows the spatial distribution of look-ahead: (ad) are the 3D spatial distributions of gxx, gyy, gzz, and look-ahead geometric factors; (eh) are the 2D planar distributions of gxx, gyy, gzz, and look-ahead geometric factors, respectively.
Energies 18 03014 g002
Figure 3. Geometric factors of coplanar and coaxial components under different frequencies.
Energies 18 03014 g003
Figure 4. Geometric factors of coplanar and coaxial components under different spacings.
Energies 18 03014 g004
Figure 5. Look-ahead geometric factor distribution of frequency influence (spacing 8 m).
Energies 18 03014 g005
Figure 6. Look-ahead geometric factor distribution of spacing influence (frequency 12 kHz).
Energies 18 03014 g006
Figure 7. Look-ahead geometric factor distribution of different systems.
Energies 18 03014 g007
Figure 8. Model for the double layer formation.
Energies 18 03014 g008
Figure 9. Sensitivity to look-ahead near the boundary: (a) amplitude ratio; (b) phase difference.
Energies 18 03014 g009
Figure 10. Look-ahead sensitivity with spacing changing: (a) amplitude ratio; (b) phase difference.
Energies 18 03014 g010
Figure 11. Look-ahead sensitivity with frequency changing: (a) amplitude ratio; (b) phase difference.
Energies 18 03014 g011
Figure 12. Look-ahead sensitivity with resistivity changing: (a) amplitude ratio; (b) phase difference.
Energies 18 03014 g012
Figure 13. These pictures show look-ahead sensitivity with resistivity changing: (a,b) are the amplitude ratio and phase difference of a single receiver; (c,d) are the amplitude ratio and phase difference of a double receiver.
Energies 18 03014 g013
Disclaimer/Publisher’s Note: The statements, opinions and data contained in all publications are solely those of the individual author(s) and contributor(s) and not of MDPI and/or the editor(s). MDPI and/or the editor(s) disclaim responsibility for any injury to people or property resulting from any ideas, methods, instructions or products referred to in the content.

