Abstract
With carbon neutrality as a target and the increased penetration of renewable energy, the operational flexibility of power systems has begun to face challenges. In order to explicitly represent the operational flexibility of power systems, two types of flexibility indexes and corresponding models for their evaluation are established in this paper. One of the indexes is the supply–demand balance, which evaluates the adequacy of operational flexibility at the system level. The other is the availability of flexible resources, which comprehensively quantifies the flexibility of the power system from the perspectives of power generation, load, and energy storage. In the case study presented here, the proposed evaluation method is illustrated and validated based on a provincial power system in China. Next, the role of energy storage in enhancing flexibility is quantitatively analyzed using the proposed indexes. Then, the economic model reveals the nonlinear decline in the marginal benefit of investment in energy storage. Energy storage alone cannot fully meet the requirements for supply–demand balance in the power system, necessitating a comprehensive consideration of the available capacity for flexibility from the perspectives of generation, load, and energy storage. Analysis of a typical scenario shows that the provincial power system has 5000 MW of upward and downward flexibility in capacity. The numerical results highlight the critical importance of integrating flexibility across all components.
1. Introduction
1.1. Motivation
To meet the goals of carbon neutrality, power systems need to integrate renewable energy to replace conventional generators. However, with the continuous increase in the proportion of generated energy that is renewable, the risk of insufficient flexibility in power systems rises [1,2,3]. The flexibility of the power system is its capability to balance supply and demand by deploying flexible resources during load fluctuations.
The factors affecting flexibility in the power system can be specifically classified into those associated with power generation, load, and energy storage [4,5]. Conventional power sources have some ability to adjust power both upwards and downwards [6]. The load components can achieve load reduction through demand response [7]. As a high-quality flexibility resource, energy storage can enhance the flexibility of the power system [8].
Nevertheless, few studies have calculated the flexibility of a power system with and without the use of energy storage or quantitatively analyzed the contribution of energy storage to its flexibility. This is because the initial cost of investment in energy storage is high and because its utilization also incurs significant costs [9]. Moreover, whether a planned future increase in investment in energy storage can result in continued improvement in the flexibility of the power system remains to be investigated.
Currently, statistical probability is commonly used to represent the adequacy of a system’s flexibility [10]. However, the available capacity of flexibility-associated resources in the power system during load fluctuations has not been quantified. Therefore, it is essential to develop a method for the quantitative analysis of available capacity of flexibility-associated resources with regard to power generation, load, and energy storage, taking into account the ramping capabilities of power sources, load, and the characteristics of energy storage in the power system.
1.2. Literature Review
The definition of power-system flexibility has evolved from the operating reserve capacity to the capacity of the power system to accommodate load variations or to maintain stable and reliable operation at any time scale [11,12,13]. Although there are numerous definitions of power-system flexibility, all of them essentially encompass the capacity of the power system to balance supply and demand [14]. In this regard, scholars have carried out extensive discussions on power-system flexibility in terms of power generation [15], load [16], and energy storage [17]. Miri et al. [18] found that when the large-scale wind power in one power system is integrated with the flexible hydropower in another power system via grid expansion, the wind-curtailment rate decreases significantly. Zhang et al. [19] proposed an optimal configuration model for the coordination of multiple flexible resources. This model takes into account the Stackelberg game relationship between the flexibility-adjustment requirements and the capabilities of different links in the power system under different fluctuation scenarios, enabling efficient interaction among multiple resources. Chen et al. [20] incorporated flexible electric and thermal loads into power-system scheduling, enhancing the adaptability and operational flexibility of the power system. Wei et al. [21] found that flexible electric-vehicle charging and power-to-hydrogen loads constitute the largest share of flexible load demand, supporting regional power balance and the regulation of renewable energy sources. Takci et al. [22] analyzed the potential role of data centers in enhancing the flexibility of power systems. Li et al. [23] proposed an optimal scheduling model for a regional power system with seasonal pumped-storage hydropower and evaluated its potential contribution to the flexibility of the power system. Zhao et al. [24] proposed a method for the siting and sizing of energy-storage systems based on dynamic programming that improved the flexibility of the regional power system. Tiemann et al. [25] established a potential assessment model to characterize the multi-purpose flexibility of battery-based energy-storage systems.
In the quantitative evaluation of power-system flexibility, existing studies still fail to comprehensively consider all aspects of the power system. Qi et al. [26] proposed multi-dimensional quantitative indexes for evaluating the characteristics of flexibility related to supply–demand dynamics. An integrated optimization model was developed to coordinate the deployment of different flexible resources, including the expansion of power-line capacity, retrofitting of thermal power for flexibility, and energy storage, with operational uncertainties addressed through scenario-tree analysis. Zhang et al. [27] developed a region-based method for quantifying and visualizing the flexibility of distribution systems, taking into account the total dispatching budget and constraints on carbon emissions in the flexibility quantification. Xu et al. [28] conducted a case study focusing on centralized air-conditioning systems, using different operation strategies to participate in demand response programs, and quantified the flexibility potential of the load components.
The above-mentioned studies predominantly focus on assessing the contribution to the flexibility of the power system from a unidimensional perspective, specifically concentrating on either power generation, load, or energy storage in isolation. As a result of this single-aspect focus, these previous studies fall short in comprehensively quantifying the available capacity of flexibility-associated resources in the power system. A power system is a complex, interconnected network in which the flexibility contributions from generation, load, and energy storage are interdependent and mutually reinforcing. Failure to consider these elements in an integrated manner means that the true potential of the flexibility-associated resources remains unmeasured.
Furthermore, another significant limitation of the existing research is that the flexibility of energy storage is considered only at the planning level. When considering the planning stage, studies often aim to determine the optimal size, location, and type of energy-storage systems that could be installed in the power system to meet future flexibility requirements. While this is an important aspect, it ignores the supporting role of energy storage in maintaining the power system’s supply–demand balance during actual operation. In real-time operation of a power system, energy-storage systems play a crucial part in quickly responding to unexpected fluctuations in power generation or load demand.
Therefore, we propose corresponding solutions and conduct verification to make the power-system flexibility evaluation method more practical and effective. We assume that energy storage is a key factor in improving the supply–demand balance of power systems and conduct a sensitivity analysis on the improvement resulting from its configuration capacity. Meanwhile, we assume that power generation, load, and energy storage can all provide flexibility according to the needs of the power system and propose an applicable method for comprehensively quantifying the available capacity.
1.3. Contributions
In this paper, two types of flexibility-evaluation indices are established to assess the flexibility of a power system. Flexibility-evaluation index one is the supply–demand balance of the power system, which is used to evaluate the role of energy storage in enhancing flexibility during the operation of the power system. Flexibility-evaluation index two is the available capacity of flexibility-associated resources, which is used to quantify the range of upward and downward capacity of the power system during operation. The main contributions of this paper are as follows:
- (1)
- A flexibility-evaluation index system for the power system is established, and a quantitative method for evaluating the flexibility of the power system is proposed.
- (2)
- Through the supply–demand-balance score, the contribution of energy storage to the ability of the power system to maintain supply–demand balance during operation is quantified.
- (3)
- From power generation, load, and energy storage, the available capacity of flexibility-associated resources during the operation of the power system is comprehensively quantified.
2. Framework of Study
In this paper, two types of flexibility-evaluation indices are established to quantitatively assess the ability of the power system to ensure the balance between power supply and demand during load fluctuations. Flexibility-evaluation index one is the supply–demand balance of the power system. In the evaluation of this index, energy storage is regarded as a key factor influencing the flexibility of the power system. Based on three operating modes, namely the simulated state, the current state, and the future state, the changes in the supply–demand balance of the power system are evaluated under the following conditions: no contribution from energy storage, flexibility provided by the currently installed energy-storage capacity, and flexibility provided by the future energy-storage capacity. Through this flexibility-evaluation index, the contribution of energy storage to the flexibility of the power system can be effectively evaluated.
Flexibility-evaluation index two is the available capacity of flexibility-associated resources in the power system. Based on the scheduling results of a supply–demand-balance scenario, the available upward and downward flexibility capacities can be found from power generation, load, and energy storage; these values represent the ability of the system to cope with load fluctuations in each period of this scenario. Through this flexibility-evaluation index, the adequacy of the flexibility of the power system can be effectively evaluated. The evaluation framework for the flexibility of the power system in this paper is shown in Figure 1.
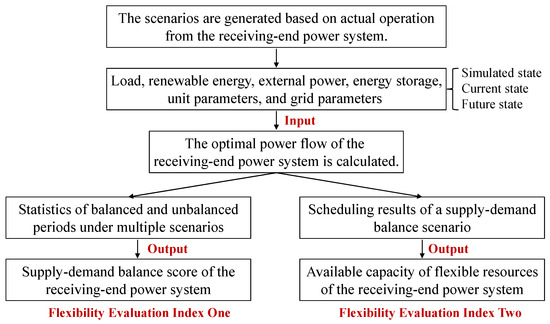
Figure 1.
The framework for evaluation of the power system’s flexibility.
3. Power-System Flexibility-Evaluation Indexes
3.1. System Supply–Demand Balance
The supply–demand balance of the power system is defined as the active power balance across operating time periods within a day under a specific scenario, subject to constraints such as those on power-system operation, generator-unit ramping, and transmission-line capacity. The calculation steps used to determine the supply–demand balance of a power system are shown in Figure 2.
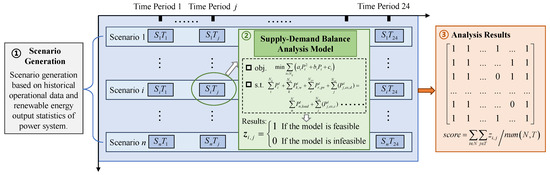
Figure 2.
The calculation of the supply–demand balance of the power system.
Step 1: The operational scenarios are generated based on boundary conditions such as load, renewable energy, external power, unit parameters, grid parameters, and energy storage.
Step 2: An analysis model for the supply–demand balance of a power system is established based on an optimal power-flow model. This model outputs the results of a supply–demand balance analysis for each time period. When this operation model finds a feasible solution, the output result is 1; when the solution is infeasible, the output result is 0.
Step 3: A result matrix for supply–demand balance analysis is established for the generated scenarios in all time periods. The supply–demand balance score is calculated; this is the ratio of the number of balanced time periods to the total number of time periods.
3.2. Available Capacity of Flexible Resources
The available capacity of flexible resources is defined as the upward and downward flexibility in power generation, load, and energy storage in a given scenario. The process for the calculation of the available capacity of flexible resources is illustrated in Figure 3.
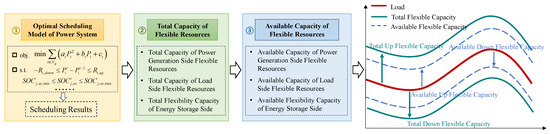
Figure 3.
The process for the calculation of the available capacity of flexible resources.
Step 1: An optimal scheduling model for the power system is established with the objective of minimizing generation costs, subject to constraints such as those on ramping and state of charge. The output is the scheduling results for the power system, including the generation schedule of conventional units, the state of charge of energy storage in each time period, and other relevant parameters.
Step 2: The theoretical total upward and downward flexibilities in power generation, load, and energy storage are calculated for each time period based on the scheduling results of the power system.
Step 3: The available capacity of flexibility-associated resources for power generation is calculated based on the operational status of conventional units. The available capacity of flexibility-associated resources on the load side is calculated based on the demand-response conditions. The available capacity of flexibility-associated resources on the energy-storage side is calculated based on the state of charge.
The available capacity of flexible resources is always less than their total capacity due to the operational conditions and physical constraints, as shown in Figure 3.
4. Model for the Calculation of a Flexibility-Evaluation Metric
4.1. Model for the Calculation of System Supply–Demand Balance
The assessment of supply–demand balance requires statistical results based on a large number of scenarios. Therefore, scenario generation is the first step. Scenario generation must incorporate load-distribution patterns and characteristics of renewable energy. For load, historical load data was selected as the baseline, and load-demand values were generated by adding normally distributed load fluctuations to the baseline load, as follows:
where is the load-demand value for scenario s, is the historical load, is the load fluctuation value following a normal distribution, is the mean of the fluctuation, and is the standard deviation of the fluctuation.
For renewable energy, a model was established based on the statistical characteristics of the historical data on renewable energy. Then, the uncertainty of renewable energy was simulated to generate power-generation data for renewable energy.
After scenario generation, the optimal power-flow model was used as the analysis model for supply–demand balance, as follows:
where Ng is the number of the conventional units; i is the index of the conventional unit; Pi,g is the scheduling generation; and ai,g, bi,g, and ci,g are the fuel-cost coefficients. The subscript g represents conventional units.
The constraints include those on power-system operation, generator operation, renewable-energy operation, and energy-storage operation.
Power-system operation constraints: This study focuses on the transmission of active power, assuming sufficient reactive power at the nodes. The power-system operation constraints are as follows:
where Nw is the number of wind-power stations, Npv is the number of photovoltaic power stations, Nes is the number of energy-storage power stations, and N is the number of load nodes. k is the index of wind power, r is the index of photovoltaic power, j is the index of energy storage, and n is the index of load nodes. and are the scheduling generations of the wind power and photovoltaic power. and are the discharging and charging power of energy storage. The subscripts w, pv, and es represent wind power, photovoltaic power, and energy storage, respectively. is the power of the branch, with and representing the minimum and maximum transmission powers of the branch, respectively.
Generator-operation constraints: During the operation of the conventional units, they are subject to constraints such as upper and lower output constraints and ramping-rate constraints, as follows:
where and are the minimum and maximum scheduling generation and and are the maximum ramping-down and ramping-up rates of the conventional units.
Renewable-energy operation constraints: The scheduling generation of renewable energy must be lower than the theoretical predicted value, as follows:
where and are the theoretical maximum values of the wind power and photovoltaic power, respectively.
Energy-storage operation constraints: The operation of energy storage is subject to mutual exclusivity between charging and discharging, charging and discharging power constraints, energy-conservation constraints, and state-of-charge (SOC) constraints. The energy-storage operation constraints are as shown:
where and are the charging and discharging statuses of the energy storage, such that 1 indicates charging or discharging and 0 indicates no operation. and are the maximum charging and discharging power values.
The SOC constraints are as shown:
where is the SOC of the energy storage, and are the charging and discharging efficiencies, and and are the minimum and maximum SOC values of the energy storage.
We have established a model for analysis of supply–demand balance with the objective function given by (3) and constraints defined by (4)–(15). Solving the power-system supply–demand balance for n scenarios yields the result . When the result is 1, it indicates that the power system meets the criterion of supply–demand balance; when the result is 0, it indicates that the power system fails to meet the criterion of supply–demand balance. The matrix of analysis results for supply–demand balance is as follows:
Finally, the supply–demand balance of the power system in this type of labeled scenario is scored via a calculation carried out as follows:
The essence of the supply–demand-balance score is the ratio of the number of periods with supply–demand balance to the total number of periods.
4.2. Model for the Calculation of Available Capacity
First, the optimal scheduling results are obtained based on the supply–demand-balance analysis model. Then, the total capacities of flexible resources are calculated. Finally, the available capacities of flexible resources are calculated. The specific calculation process is as follows:
Power-generation-side flexible resources:
where and are the total upward capacity and total downward capacity on power generation.
Load-side flexible resources:
where and are the total upward capacity and total downward capacity on the load components and and are the minimum and maximum loads after demand response.
Energy-storage-side flexible resources:
where and are the total upward capacity and total downward capacity of energy storage.
After the total capacities of flexible resources in power generation, load, and energy storage mentioned above have been integrated, the result is as follows:
where and are the total upward capacity and total downward capacity of the power system.
However, the available capacities on the generation side and energy-storage side are always less than the total capacity due to ramping rate and SOC constraints for conventional units and energy storage. The specific process for the calculation of the available capacity on the generation side is as follows:
where and are the available upward capacity and available downward capacity on the generation side. When the scheduled generation of conventional units reaches the technical upper limit or lower limit, it is impossible to adjust the generation at the maximum ramp rate.
On the load side, it is assumed that the actual adjustable power of each type of load fluctuates around the rated value and follows a normal distribution and that the fluctuations of various types of loads are independent of each other. Then, the actual flexibility capacity of the mth type of load node n at time t is a random variable satisfying the following equation:
where m is the index of the load category; is the actual flexibility capacity, which follows a normal distribution; and are the mean and variance parameters of the probability distribution; is the expected participation rate of demand response; is the total flexibility capacity; and is the volatility caused by fluctuations in user behavior. Assuming that the adjustable powers of various loads are independent of each other, the total flexibility capacity at node n is the sum of independent normal variables and follows a normal distribution, as follows:
where is the available flexibility capacity on node n and and are the total mean and variance. Therefore, the range of available flexibility capacity with the confidence level is as follows:
where and are the available upward capacity and available downward capacity on node n and is the critical value of the standard normal distribution. Therefore, the available capacity of flexible resources on the load side is as follows:
where and are the available upward capacity and available downward capacity on the load side. The specific process for the calculation of the available capacity on the energy-storage side is as follows:
where and are the available upward capacity and available downward capacity on the energy-storage side. is the installed capacity for energy storage. The continuous charging and discharging capacities of the energy-storage system are affected by the SOC. When the SOC is low, the energy-storage system cannot continuously charge and discharge at maximum power during the scheduled time periods. Conversely, when the SOC is high, the energy-storage system can only continuously charge and discharge at the maximum power within the scheduled time periods. Therefore, it is necessary to make a logical judgment on the flexibility of the energy-storage system and select the smaller value.
After the available capacities of flexible resources on the power-generation side, the load side, and the energy-storage side mentioned above have been integrated, the result is as follows:
where and are the available upward capacity and available downward capacity of the power system.
4.3. Discussion
The proposed framework is designed with applicability in mind. The core methodology, including analysis of supply–demand balance and quantification of flexibility, relies on fundamental power-system principles that are independent of grid size or structural complexity. For larger grids, the framework can be extended by incorporating additional nodes, zones, or regional flexibility-associated resources into the model.
Regarding the quantification of the improvement in supply–demand balance within a power system provided by energy storage, we selected the configuration capacity of electrochemical energy storage as the control parameter. This is because electrochemical energy storage accounts for more than 90% of new energy-storage systems, making it representative. For the comprehensive quantification of power systems’ flexibility capacity, we used the typical control parameters of conventional units, the probability distribution parameters of user behavior, and the operational parameters of electrochemical energy storage as standard inputs in the methodology. This is also intended to further enhance the applicability of the proposed method.
5. Case Study
The contribution of energy storage to power-system flexibility was evaluated based on an urban power system in Southwest China. We took the current power-source structure and installed capacity of the target province as the basis for the calculation of power-supply capacity. The power-source structure of the province mainly consists of thermal power, which provides a stable base-load power supply for the power system. Secondly, hydropower is also an important component of the power-source structure, which is beneficial when dealing with short-term load fluctuations and maintaining grid stability. Photovoltaic and wind power account for relatively small proportions of the power-source structure. Photovoltaic power and wind power are affected by intermittency and randomness, which result in fluctuations in power output. The load levels in 2024 served as the foundation for scenario selection, ensuring that the research scenarios were grounded in realistic conditions. During the quantitative assessment of balance in the supply and demand of power, the configuration of energy-storage capacity was identified as a key influencing factor, and a sensitivity analysis was conducted to explore its impact. The scores for power supply–demand balance were calculated using Equations (1)–(17). For the quantitative assessment of available flexibility capacity, we considered factors such as the shutdown rate of conventional units on the power-supply side and the demand-response speed on the load side. The flexibility in available capacity was evaluated using Equations (18)–(37). The time resolution did not affect the model accuracy or computational burden. Accurate calculations can be efficiently performed using typical scheduling-time resolutions of 24 or 96 intervals. Without loss of generality, 24 time intervals were used in this case study to present the solution results. The power-supply structure of this province is characterized by a high proportion of external power transmission, dense load distribution, and significant differences between peak and valley loads, making energy storage vital in improving flexibility. In addition, due to the limited flexibility in capacity of local power sources in the province, the degrees of flexibility in capacity provided by the power-supply side, load side, and energy-storage side are equally crucial for maintaining grid stability. We defined the mode where energy storage does not provide flexibility as the simulated state and the mode where energy storage provides flexibility as the current state.
First, we conducted a benchmark case analysis based on the RTS-24 system, simultaneously considering growth and fluctuations in load, and n scenarios were generated. Then, the maximum load day was selected for analysis. The numerical results are shown in Table 1 and Table 2.

Table 1.
Simulated State: Results of calculation of supply–demand balance in RTS-24 without energy storage providing flexibility (benchmark case).
Table 2.
Current Operational State: Results of calculation of supply–demand balance in RTS-24 with energy storage providing flexibility (benchmark case).
In the benchmark case, energy storage effectively improved the supply–demand balance of the power system, demonstrating the effectiveness of the proposed method in this paper. Then, we carried out flexibility evaluation based on the provincial power system. Two types of scenarios—typical scenarios and supply-guarantee scenarios—were tested for this power system. Subsequently, the supply–demand balance was calculated for both the simulated state and the current state. Finally, the variation in power-system balance that followed changes in installed energy-storage capacity was analyzed. The results of the numerical analysis of the power system’s supply–demand balance under typical scenarios are shown in Table 3 and Table 4.
Table 3.
Simulated State: Results of the calculation of supply–demand balance without energy storage providing flexibility in typical scenarios.
Table 4.
Current Operational State: Results of the calculation of supply–demand balance with energy storage providing flexibility in typical scenarios.
In typical scenarios, when the energy-storage system does not provide flexibility, the power system fails to achieve a supply–demand balance during some peak-load periods, as at 14:00. However, the power system can still reach a supply–demand-balance score of 99.92, indicating that the power system effectively maintains the supply–demand balance. With the current installed capacity for energy storage providing flexibility, the score increases to 99.99, demonstrating that energy storage can further enhance supply–demand balance. We also calculated the supply–demand balance of the power system under power-supply-guarantee scenarios, with the numerical results presented in Table 5 and Table 6.
Table 5.
Simulated State: Results of the calculation of supply–demand balance without energy storage providing flexibility in supply-guarantee scenarios.
Table 6.
Current Operational State: Results of the calculation of supply–demand balance with energy storage providing flexibility in supply-guarantee scenarios.
In the Figure 4, the scores representing the supply–demand balance are presented for two scenarios: one without energy storage providing flexibility (gray line) and the other with energy storage providing flexibility (red line). The most prominent trend is the significant improvement in the supply–demand-balance scores when energy storage is utilized; this is especially noticeable during certain time intervals.
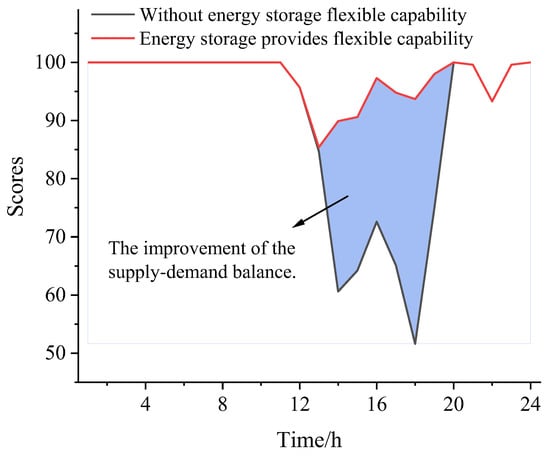
Figure 4.
The role of energy storage in enhancing the supply–demand balance of the power system.
During the period from 12:00–20:00 h, the scores for the scenario without energy storage flexibility experience a sharp decline. This is mainly due to the inherent inflexibility of the power system in this time frame. Without energy storage, the power system has limited means to adjust to sudden changes in load demand. As the load demand fluctuates, the power generation may not be able to respond promptly, leading to a deterioration in the supply–demand balance and thus to a decrease in the scores.
Conversely, when energy storage provides flexibility, the red line shows relatively stable performance during this period. Energy storage can act as a buffer. When the load demand increases suddenly, energy storage can release stored energy to supplement the power supply, reducing the gap between supply and demand. On the other hand, when load demand decreases, energy storage can absorb excess power, preventing over-generation. This two-way regulation mechanism helps maintain a more stable supply–demand balance, resulting in higher scores compared to the scenario without energy storage.
The blue-shaded area in the figure represents the improvement in the supply–demand balance resulting from energy storage. This area visually demonstrates the positive impact of energy storage on power-system flexibility. The larger the area, the more significant the improvement. The improvement is a result of energy storage’s ability to shift power generation and consumption in time, which effectively mitigates the impact of load fluctuations on the power system and enhances the overall stability and balance of the power system.
As it is an important element in the planning of the power system, the question of whether the role of energy storage in enhancing the flexibility of the power system results in a non-linear trend remained to be studied. We established a future state in which the installed capacity of the energy storage continues to grow. Then, we evaluated the flexibility of the power system in the above-mentioned power-supply-guarantee scenario. The results of the numerical analysis are shown in Figure 5.
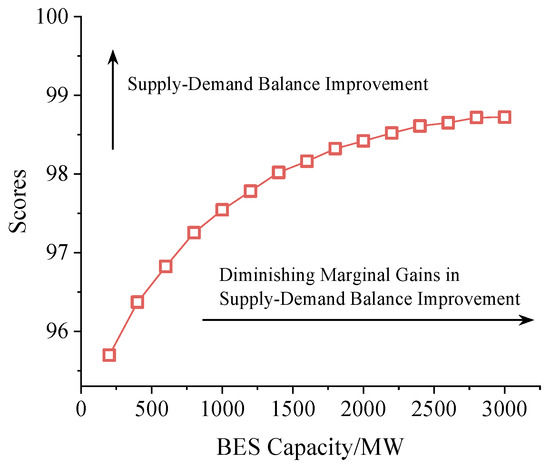
Figure 5.
The supply–demand balance of the power system under the future state of energy storage.
The upward-sloping curve in Figure 5 shows that as the energy-storage capacity increases, the scores for supply–demand balance improvement also increase. The larger energy-storage capacity provides more flexibility for the power system. However, as the capacity for energy storage increases, its marginal benefit begins to decline. Initially, when the energy-storage capacity is small, each additional unit of capacity can significantly enhance the system’s ability to balance supply and demand. However, as the capacity grows larger, the power system’s supply–demand balance gradually approaches an optimal state. At this point, adding more energy-storage capacity has a relatively smaller impact on further improving the balance. This is also related to the characteristics of the power system itself.
Based on the sensitivity analysis shown in Figure 5, we established an economic model characterizing the relationship between investment in energy storage and supply–demand balance. Through nonlinear fitting, an explicit function of this economic model with a confidence level greater than 95% was obtained. Its specific form is a logarithmic function, as shown in Equation (38), below:
where is the investment in energy storage and represents the marginal benefit of the logarithm of investment, with a value of 1.19. This indicates that the marginal benefit of investment in energy storage is positive but that the growth rate gradually slows down (consistent with the characteristics of logarithmic functions). is the basic score for supply–demand balance, with a value of 85.14. This means that the supply–demand balance score in this scenario is 85.14 without investment in energy storage. This economic model further demonstrates that the decline in the marginal benefit of investment in energy storage is significant.
Blindly increasing the installed capacity for energy storage will not yield satisfactory returns. Therefore, it is necessary to further enhance the supply–demand balance of the power system by exploring means of enhancing flexibility such as power-generation management, demand response, aggregation of distributed flexible resources, and vehicle-to-grid interactions.
Based on the above analysis, relying solely on the flexibility resulting from energy storage is insufficient. It is necessary to comprehensively quantify the available capacity of flexible resources in the power system. Through the methods of quantifying the total amount and available capacity of flexible resources introduced earlier, we calculated the total amount and available capacity of flexible resources in typical scenarios. The results of the numerical analysis are shown in Figure 6.
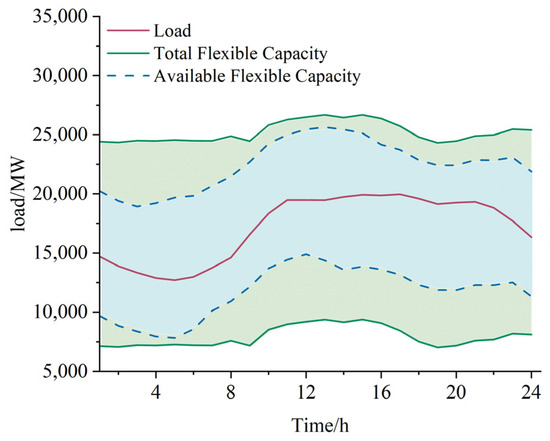
Figure 6.
The total amount and available capacities of flexible resources in typical scenarios.
The actual operational data for a specific day were selected as the basis of analysis to calculate the total capacity and available capacity of flexible resources. The red curve represents the load on that day. The green curve and its shaded area indicate the total capacity of flexible resources. However, as capacity is constrained by operational conditions, the available capacity is shown as the shaded area within the blue dash-dotted lines. The physical meaning of the available capacity of flexible resources is that when load-demand variations fall within this region, the power system can provide sufficient flexibility to maintain supply–demand balance. During the valley load periods, most of the units are operating at relatively low power levels and some of the energy-storage systems are already in the charging state. In these times, the downward flexibility of the power system is relatively small. Conversely, during periods of peak load, the upward flexibility is relatively small. In this scenario, the average available upward flexibility of the power system is 5305 MW, and the average available downward flexibility is 5475 MW. We assume that only thermal power and hydropower can provide flexibility in power generation. However, in reality, power can also be generated by flexible resources such as gas generators and biomass generators. Although their proportional contribution is small, they can still provide a certain degree of flexibility to the power system. In future research, we will incorporate flexible power sources such as gas generators and biomass generators to more comprehensively evaluate the flexibility of the power system. Additionally, compressed-air energy storage and hydrogen energy storage are gradually developing on a large scale, and they should be included as important element in future studies.
6. Conclusions
This paper establishes two types of indexes for the evaluation of power-system flexibility. The results of the numerical analysis of supply–demand balance show that the contribution of energy storage to power-system flexibility increases with increasing configuration capacity. The external characteristics of the economic model of investment in energy storage indicate that the marginal benefit of investment in energy storage gradually decreases. In addition, relying solely on the flexibility provided by energy storage cannot meet the requirements for supply–demand balance in the power system. The results of the numerical analysis of flexible available capacity show that the flexible available capacity of generation, load, and energy storage all play important roles in enabling the power system to cope with load fluctuations and maintain flexible adequacy and that the flexible available capacity provided by each aspect cannot be ignored.
Author Contributions
Conceptualization, F.G.; Methodology, F.G.; Validation, F.G.; Writing—original draft, F.G.; Writing—review and editing, H.L. and F.D. All authors have read and agreed to the published version of the manuscript.
Funding
This research was funded by Scientific and Technical Project of State Grid: Key technologies and applications for supply–demand risk identification and planning decision for provincial power systems with high share of renewable energy (1400-202324646A-3-2-ZN).
Data Availability Statement
The original contributions presented in the study are included in the article, further inquiries can be directed to the corresponding author.
Conflicts of Interest
Author Hujun Li and Fangzhao Deng was employed by the Economic Research Institute of State Grid Henan Electric Power Company. The remaining authors declare that the research was conducted in the absence of any commercial or financial relationships that could be construed as a potential conflict of interest.
Nomenclature
| P | Active power |
| i | Index of the conventional units |
| Ng | Number of the conventional units |
| k | Index of wind power |
| Nw | Number of wind power |
| r | Index of photovoltaic power |
| Npv | Number of photovoltaic power |
| j | Index of energy storage |
| Nes | Number of energy storage |
| n | Index of load nodes |
| N | Number of load nodes |
| R | Ramping-up rate of the conventional units |
| u | Charging and discharging status of the energy storage |
| SOC | State-of-charge of the energy storage |
| Charging and discharging efficiency of the energy storage | |
| z | Calculation result matrix of supply–demand balance |
References
- Lechl, M.; de Meer, H.; Fürmann, T. A stochastic flexibility calculus for uncertainty-aware energy flexibility management. Appl. Energy 2025, 379, 124907. [Google Scholar] [CrossRef]
- Zhang, G.; Li, F.; Wang, S.; Yin, C. Robust low-carbon energy and reserve scheduling considering operational risk and flexibility improvement. Energy 2023, 284, 129332. [Google Scholar] [CrossRef]
- Adewuyi, O.B.; Aki, H. Optimal planning for high renewable energy integration considering demand response, uncertainties, and operational performance flexibility. Energy 2024, 313, 134021. [Google Scholar] [CrossRef]
- Li, Q.; Zhou, Y.; Wei, F.; Li, S.; Wang, Z.; Li, J.; Zhou, G.; Liu, J.; Yan, P.; Yu, D. Multi-time scale scheduling for virtual power plants: Integrating the flexibility of power generation and multi-user loads while considering the capacity degradation of energy storage systems. Appl. Energy 2024, 362, 122980. [Google Scholar] [CrossRef]
- Yasuda, Y.; Carlini, E.M.; Estanqueiro, A.; Eriksen, P.B.; Flynn, D.; Herre, L.F.; Hodge, B.-M.; Holttinen, H.; Koivisto, M.J.; Gómez-Lózaro, E.; et al. Flexibility chart 2.0: An accessible visual tool to evaluate flexibility resources in power systems. Renew. Sustain. Energy Rev. 2023, 174, 113116. [Google Scholar] [CrossRef]
- Saberi, L.; Alizadeh, M.-I.; Parsa Moghaddam, M. Optimal scheduling of flexible ramp product and emerging flexible resources considering short-term variability impacts in power system with high RESs penetration: A novel robust UC approach. Int. J. Electr. Power Energy Syst. 2022, 142, 108279. [Google Scholar] [CrossRef]
- Cheng, T.; Tan, Z.; Zhong, H. Exploiting Flexibility of Integrated Demand Response to Alleviate Power Flow Violation During Line Tripping Contingency. J. Mod. Power Syst. Clean Energy 2023, 11, 1971–1981. [Google Scholar] [CrossRef]
- Flores-Quiroz, A.; Strunz, K. A distributed computing framework for multi-stage stochastic planning of renewable power systems with energy storage as flexibility option. Appl. Energy 2021, 291, 116736. [Google Scholar] [CrossRef]
- Farah, S.; Andresen, G.B. Investment-based optimisation of energy storage design parameters in a grid-connected hybrid renewable energy system. Appl. Energy 2024, 355, 122384. [Google Scholar] [CrossRef]
- Lu, Z.; Li, H.; Qiao, Y. Probabilistic Flexibility Evaluation for Power System Planning Considering Its Association with Renewable Power Curtailment. IEEE Trans. Power Syst. 2018, 33, 3285–3295. [Google Scholar] [CrossRef]
- Lannoye, E.; Flynn, D.; O’Malley, M. Evaluation of Power System Flexibility. IEEE Trans. Power Syst. 2012, 27, 922–931. [Google Scholar] [CrossRef]
- Nosair, H.; Bouffard, F. Reconstructing Operating Reserve: Flexibility for Sustainable Power Systems. IEEE Trans. Sustain. Energy 2015, 6, 1624–1637. [Google Scholar] [CrossRef]
- Lannoye, E.; Flynn, D.; O’Malley, M. Transmission, Variable Generation, and Power System Flexibility. IEEE Trans. Power Syst. 2015, 30, 57–66. [Google Scholar] [CrossRef]
- Li, J.; Yu, Z.; Mu, G.; Li, B.; Zhou, J.; Yan, G.; Zhu, X.; Li, C. An assessment methodology for the flexibility capacity of new power system based on two-stage robust optimization. Appl. Energy 2024, 376, 124291. [Google Scholar] [CrossRef]
- Neetzow, P. The effects of power system flexibility on the efficient transition to renewable generation. Appl. Energy 2021, 283, 116278. [Google Scholar] [CrossRef]
- Wang, J.; Qiu, D.; Wang, Y.; Ye, Y.; Strbac, G. Investigating the impact of demand-side flexibility on market-driven generation planning toward a fully decarbonized power system. Energy 2025, 324, 135692. [Google Scholar] [CrossRef]
- Ma, B.; Li, P. Optimal flexible power allocation energy management strategy for hybrid energy storage system with genetic algorithm based model predictive control. Energy 2025, 324, 135958. [Google Scholar] [CrossRef]
- Miri, M.; Monroe, J.; Knittel, T.; McPherson, M. Integrated planning and operation of power systems: Flexibility in high penetration of wind and solar. Renew. Sustain. Energy Transit. 2025, 7, 100106. [Google Scholar] [CrossRef]
- Zhang, T.; Wu, Y. Collaborative allocation model and balanced interaction strategy of multi flexible resources in the new power system based on Stackelberg game theory. Renew. Energy 2024, 220, 119714. [Google Scholar]
- Chen, N.; Gao, J.; Gao, L.; Yang, S.; Chen, S. Economic dispatch of integrated energy systems taking into account the participation of flexible loads and concentrated solar power plants. Energy 2025, 320, 135222. [Google Scholar] [CrossRef]
- Wei, H.; Zhang, N.; Du, E.; Jiang, H.; Zhuo, Z.; Davidson, M.R.; Li, W.; Wang, P.; Xiao, J.; Kang, C. Emerging Demand-side Flexible Resources Accelerate China’s Power System Transition towards Carbon Neutrality. iScience 2025, 25, 112372. [Google Scholar] [CrossRef]
- Takci, M.T.; Qadrdan, M.; Summers, J.; Gustafsson, J. Data centres as a source of flexibility for power systems. Energy Rep. 2025, 13, 3661–3671. [Google Scholar] [CrossRef]
- Li, P.; Zhao, Z.; Li, J.; Liu, Z.; Liu, Y.; Mahmud, M.A.; Sun, Y.; Chen, D. Unlocking potential contribution of seasonal pumped storage to ensure the flexibility of power systems with high proportion of renewable energy sources. Renew. Energy 2023, 218, 119280. [Google Scholar] [CrossRef]
- Zhao, Y.; Bi, Y.; Xu, Y.; Gao, Y.; Hu, S.; Guo, Y.; Yang, J. Dynamic programming-based energy storage siting and sizing: Application to enhance flexibility of large-scale power system. J. Energy Storage 2025, 106, 114734. [Google Scholar] [CrossRef]
- Tiemann, P.H.; Nebel-Wenner, M.; Holly, S.; Frost, E.; Nieße, A. Amplify: Multi-purpose flexibility model to pool battery energy storage systems. Appl. Energy 2025, 381, 125063. [Google Scholar] [CrossRef]
- Qi, Z.; Guo, S.; Zhao, H. Research on quantitative evaluation and optimal allocation of electricity system flexibility. Energy 2025, 320, 135443. [Google Scholar] [CrossRef]
- Zhang, S.; Ge, S.; Liu, H.; Zhao, B.; Ni, C.; Hou, G.; Wang, C. Region-based flexibility quantification in distribution systems: An analytical approach considering spatio-temporal coupling. Appl. Energy 2024, 355, 122175. [Google Scholar] [CrossRef]
- Xu, R.; Liu, X.; Liu, X.; Zhang, T. Quantifying the energy flexibility potential of a centralized air-conditioning system: A field test study of hub airports. Energy 2024, 298, 131313. [Google Scholar] [CrossRef]
Disclaimer/Publisher’s Note: The statements, opinions and data contained in all publications are solely those of the individual author(s) and contributor(s) and not of MDPI and/or the editor(s). MDPI and/or the editor(s) disclaim responsibility for any injury to people or property resulting from any ideas, methods, instructions or products referred to in the content. |
© 2025 by the authors. Licensee MDPI, Basel, Switzerland. This article is an open access article distributed under the terms and conditions of the Creative Commons Attribution (CC BY) license (https://creativecommons.org/licenses/by/4.0/).