Article

Techno-Economic Enhancement of Distribution Network by Optimal DG Allocation Along with Network Reconfiguration Considering Different Load Models and Levels

1
Department of Electrical Engineering, Nirma University, Ahmedabad 382481, Gujarat, India
2
Department of Electrical & Electronics Engineering Technology, University of Johannesburg, Johannesburg 2006, South Africa
*
Author to whom correspondence should be addressed.
Energies 2025, 18(12), 3005; https://doi.org/10.3390/en18123005
Submission received: 6 May 2025 / Revised: 30 May 2025 / Accepted: 3 June 2025 / Published: 6 June 2025
(This article belongs to the Section F2: Distributed Energy System)

Abstract

:
Distributed generation (DG) within the electrical distribution network (DN) has witnessed significant expansion globally, attributed to both technological advancements and environmental benefits. However, uncoordinated integration of DG in suboptimal locations can negatively influence the operational efficacy through issues such as increased power losses, voltage fluctuations, and protection coordination issues of the DN. Consequently, the optimal allocation of DG represents a critical element of consideration. Furthermore, the integration of network reconfiguration (NR) alongside DG units has the potential to significantly enhance system performance with only the existing infrastructure. Therefore, this work focuses on improving DN performance with optimal DG integration along with NR. The considered objectives are minimization of active power loss (APL) and cost of annual energy loss (CAEL). CAEL minimization by DG allocation and NR under multiple load models is addressed for the first time in this study. The efficacy of the employed hiking optimization algorithm (HOA) is illustrated through its application to the IEEE 33-Bus DN under various scenarios of DG operational power factors (PFs). A comparative analysis between the HOA and other reported methodologies is presented. Additionally, the results obtained for CAEL in case 6 (DG allocation with NR) are approximately 22.3% better that the best reported results of CAEL without NR, thereby affirming the usefulness of integrating the NR during DG allocation.

1. Introduction

The DN embodies a vital component of the power system, commissioned to transfer electrical energy from high-voltage transmission lines to consumers. Owing to its structural attributes, for instance, low voltage levels and high current, the DN encounters substantial power losses, mainly in the form of thermal energy due to the resistance encountered by the current flow. These losses represent an important factor responsible for reduced overall system efficiency. Transmission losses account for around 30% of the aggregate power losses, whereas the DN contributes to the remaining 70% of cumulative losses in the power network. Therefore, power loss minimization in DN is vital to enhance economic feasibility and diminishing environmental effects. From a technical viewpoint, power losses can also have a substantial impact on the system voltage profile and may impact it during heavy-load conditions [1,2].
To overcome the mentioned problems, a number of methods have been proposed by researchers in the literature, like reconfiguration of networks, the installation of DG, integrating capacitors, and so on [3,4,5,6,7]. In NR, the topological configuration of the network is revamped by changing the operational status of switches (open and closed); this adjustment leads to a reduction in power losses while improving the voltage profile (VP) [2].
Another method that has been widely utilized to enhance DN performance is the establishment of a connection to a localized power source. The presence of a localized source of power supply enables power delivery to nearby loads, thereby decreasing the losses [8]. DG is one of the several recognized means that facilitate electricity production either far or near to the load. The scope of DG encompasses a diverse set of technologies, extending from traditional fossil fuel-powered generation to renewable energy-based generation sources such as small hydro turbines, wind turbines (WTs), photovoltaic (PV) cells, and hybrid configurations [9]. Traditional DG systems powered by fossil fuels are characterized by finite energy resources, higher emissions, and greater operational reliability compared to renewable sources. In contrast, renewable DGs are more sustainable, produce little to no emissions, but are inherently intermittent and dependent on weather conditions. Furthermore, DG can be categorized in accordance with its power ratings. At the same time, the successful implementation of DG units involves thorough and precise planning regarding their integration into grid infrastructures to realize the expected advantages while mitigating potential risks [10]. Hence, the task of deciding the optimal locations and capacities for DG installations has become a major challenge, as mentioned in various research studies.
Researchers have implemented a variety of methodologies, encompassing analytical, numerical, and optimization-based strategies for resolving this problem. In [11,12], novel analytical approaches were proposed to ascertain the most suitable location and capacity of a DG within a DN. The loss sensitivity factor (LSF)-based concept was suggested in [13] to ascertain the optimal positioning of WT and PV systems in conjunction with energy storage systems (ESSs), with the objective of minimization of power losses in an IEEE 33-bus DN. Although analytical techniques are characterized by their simplicity and reduced computational demands, they face difficulties when addressing complex scenarios that involve many control variables or extensive search domains [14].
Moreover, various researchers have endorsed numerical methodologies; for example, in [15], a mixed-integer linear programming (MILP) strategy was advocated, and in [16], dynamic programming was introduced to strategically position and determine the appropriate capacities of DG units, aiming to reduce network losses and enhance the VP. Additionally, it is important to mention that metaheuristic techniques have been widely employed for the complex problem of optimal DG integration due to their efficacy in managing high-dimensional search spaces [17]. An improved version of the salp swarm algorithm, by adding a new update equation for the leader and followers, was proposed in [18] for addressing the challenge of optimal DG placement within the different radial DNs. The proposed improvement increases the exploration potential and avoids premature convergence. The multi-objective grey wolf optimization (MOGWO) framework is presented in [14] to optimally allocate multiple DG units within the DN. Furthermore, various operational PF scenarios for DGs are considered.
An innovative optimization technique that integrates chaos, self-adaptive compensation of bats, and the Doppler effect into the bat algorithm (BA) was presented in [17] for optimal DG allocation. In [19], a parameter-free metaheuristic algorithm, referred to as the student psychology-based optimization (SPBO) algorithm, was employed for the strategic allocation of various types of distributed generators (DGs) and distribution static compensators (DSTATCOMs) within a radial DN. Additionally, various indexes were incorporated to address multiple technical, economic, and environmental dimensions. In [20], an innovative optimization algorithm that amalgamates a golden search-based flower pollination algorithm with fitness–distance balance (FDB) was proposed for the optimal distribution of DGs. A range of different sized DGs, along with a range of load types, were also effectively utilized. In [21], using the adaptive genetic algorithm (AGA), the simultaneous optimal allocation of DGs and on-load tap changers (OLTCs) was used to minimize power loss within DNs. Furthermore, two novel variants of the AGA, characterized by adaptively varying the crossover and mutation probabilities, were introduced in this study. In [22], a moth search optimization method was proposed to effectively deploy DGs and shunt capacitors (SCs), while concurrently optimizing the tap positions of existing OLTCs. In [23], the authors presented an adaptive fuzzy-based campus placement-based optimization algorithm to address single- and multi-objective optimization problems. This technique was applied to the optimal integration of distributed energy resources (DERs), DSTATCOMs, and battery energy storage systems (BESSs). In [24], a computational methodology was designed to enhance power losses and voltage profiles within steady-state scenarios through the reconfiguration of the distribution network, alongside the identification of the optimal placement of DGs. The Whale Optimization Algorithm (WOA) is employed due to its effectiveness in navigating the large, nonlinear, and nonconvex combinatorial search space associated with the problem. In [25], a multi-objective strategy based on Pareto optimality was utilized for the optimal placement and sizing of both DGs and CBs using the non-dominated sorting genetic algorithm-II (NSGA-II). It was demonstrated that integrating DGs and CBs into the DN can significantly enhance its performance by delivering technical, economic, and environmental advantages. In [26], an improved symbiotic organism search (ISOS) algorithm was introduced, and utilized for the simultaneous optimization of NR and DG. The simple quadratic interpolation strategy was combined with a traditional SOS that enhanced the search process. In [27], the authors presented an improved equilibrium optimization algorithm (IEOA) combined with a proposed recycling strategy for configuring power distribution networks with optimal allocation of multiple distributed generators. The recycling strategy was augmented to explore the solution space more effectively during iterations. The considered objectives were decreasing the total APL and improving the VP.
From the literature review, it is observed that most researchers have considered only constant-power models while performing simultaneous optimization of DG allocation and NR. However, the consideration of various load models, like constant power (CP), constant current (CI), constant impedance (CZ), and ZIP (impedance, current, and power), offers further realistic representations of practical loads; yet, these have remained underexplored in the literature. In view of the above-mentioned discussion, in this work, simultaneous optimization of DG and NR with consideration of various load models is explored. Another observation from the literature review is that the most common objective for the DG allocation problem is power loss minimization under the single-loading scenario. Further, the researchers who have focused on minimizing the cost associated with loss (CAEL) under multiple loading scenarios have not included NR in their formulation. Therefore, this work also focuses on CAEL minimization with optimal DG integration and NR. The main contributions of the proposed work are as follows:
  • The objective of minimizing CAEL is considered for the first time for solving the simultaneous DG allocation and NR problem with multiple load models.
  • This work incorporates a variety of PFs, like the zero power factor (ZPF), unity power factor (UPF), and optimal power factor (OPF), under multiple load models (CP, CI, CZ, and ZIP).
  • The investigation entails a comprehensive comparison of several cases with multiple loading scenarios to assess the efficacy of the proposed strategies.
  • The HOA methodology is employed for the first time for the strategic planning of DG units with NR in an IEEE 33-Bus DN. The HOA effectively balances exploration and exploitation through adaptive movement strategies. It can be applied to both continuous and discrete optimization problems and even hybrid ones like DG allocation with network reconfiguration.
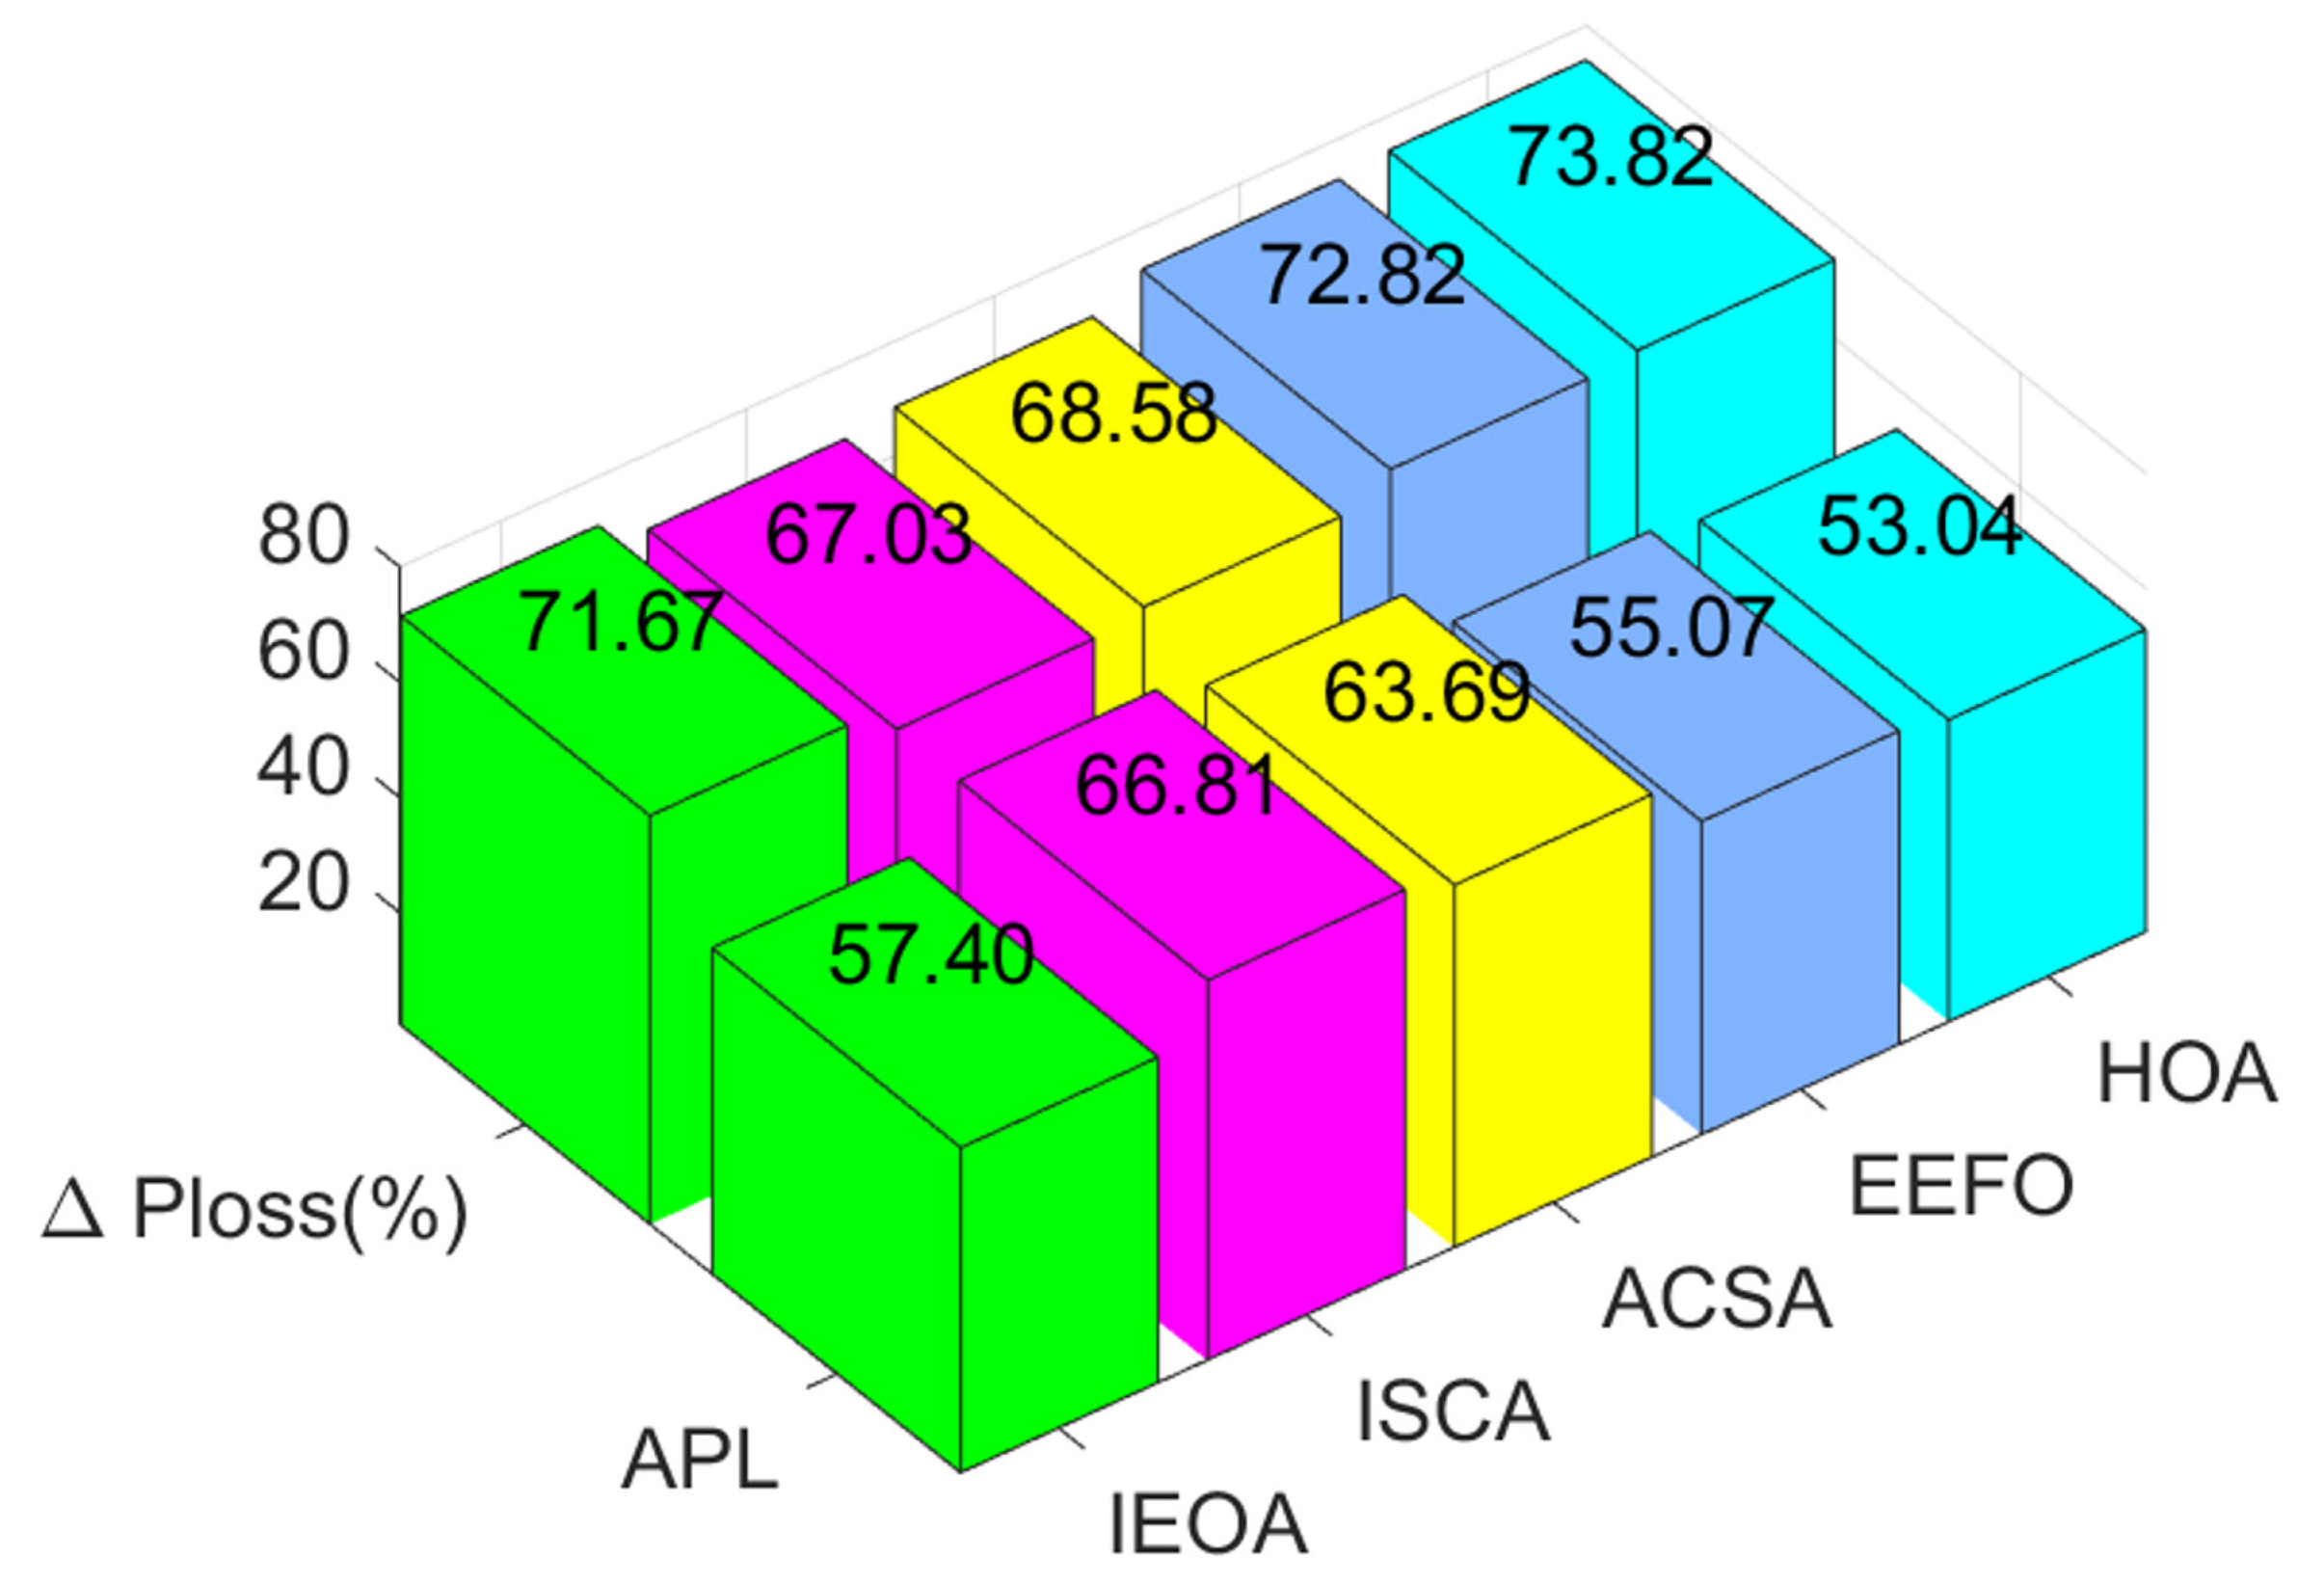
  • The suitability of the HOA for the optimal DG allocation problem is examined through a comparative analysis between the HOA and other contemporary methods like the IEOA, improved sine cosine algorithm (ISCA), and electric eel foraging optimization (EEFO), as reported in the literature.

2. Mathematical Formulation

A brief discussion on the considered objective functions, constraints (equality and inequality), load model, and DG modeling is presented below.

2.1. Objective Functions

2.1.1. APL Minimization

The most explored objective function for DG allocation is APL minimization, mathematically expressed as follows:
m i n F 1 = k = 1 N b | I k | 2 R k
where N b is the number of lines, and | I k | and R k are the current magnitude and resistance of the kth line.

2.1.2. CAEL Minimization

The load demand changes with time, and hence the APL in the network also changes. Further, the electricity price also varies with time depending upon the load level. As a result, minimizing the APL for a single load level does not ensure the minimum cost for the annual energy loss. Hence, in this work, instead of focusing only on the APL, the minimization of the CAEL with different load levels is also explored. Mathematically, the CAEL can be expressed as follows:
m i n F 2 = l = 1 N l T l P l k = 1 N b | I k l | 2 R k
where N l is the number of load levels, and T l and P l represent the number of hours and electricity price corresponding to the lth load level. Further, | I k l | denotes the current magnitude in the kth branch at the lth load level.

2.2. Constraints

2.2.1. Power Balance

In a DN, the sum of the power injected by the DG and substation must be equal to the sum of the power demand and loss. This forms the power balance equations, expressed as follows:
P S + i = 1 N D G P D G , i = P D + P l o s s
Q S + i = 1 N D G Q D G , i = Q D + Q l o s s
where P S ( P D G , i ) and Q S ( Q D G , i ) denote the active and reactive power injected by the substation (ith DG). Similarly, P D ( P l o s s ) and Q D ( Q l o s s ) represent the active and reactive power demand (loss) of the system. N D G represents the number of DGs.

2.2.2. Bus Voltage

The bus voltages must be maintained within the permissible limit of 1.05 pu (max) to 0.95 pu (min).
V m i n V b V m a x b = 1 , 2 , , n
where n represents the total number of buses.

2.2.3. DG Size and Power Factor

The limits on the size of a DG and its operating power factor are expressed as follows:
P D G , i m i n P D G , i P D G , i m a x i = 1 , 2 , , N D G
P F D G , i m i n P F D G , i P F D G , i m a x i = 1 , 2 , , N D G
where, for the ith DG, P D G , i m i n and P D G , i m a x represent the minimum and maximum power generation and P F D G , i m i n and P F D G , i m a x represent the limits for the PF, respectively.

2.2.4. DG Location

A DG cannot be located at the substation bus and two DGs cannot have the same location. Mathematically, this can be expressed as follows:
2 L D G , i L D G , j n
where L D G , i represents the location of the ith DG.

2.2.5. Radial Topology

In this study, the advantage of considering NR along with the optimal allocation of DG is also explored. However, ensuring the radial topology of the network after reconfiguration is essential to operate with a simple protective scheme. Here, a graph theory-based function is utilized for checking the radiality of the reconfigured DN, and mathematically it can be expressed as follows:
d e t [ B B I M ] = 1 o r 1 T o p o l o g y r a d i a l
d e t [ B B I M ] = 0 T o p o l o g y n o t r a d i a l
where [ B B I M ] is the branch–bus incidence matrix.

2.3. Load Modeling

The following equations are used for evaluating the active ( P d ) and reactive ( Q d ) power demand at a particular bus under different load models.
P d = P 0 C Z V b V n 2 + C C V b V n + C P
Q d = Q 0 C Z V b V n 2 + C C V b V n + C P
where P 0 and Q 0 are the active and reactive power demand at nominal voltage. V n denotes the nominal voltage (1 p.u.) and V b denotes the actual bus voltage. The load coefficients C Z , C C , and C P represent the share of the CZ, CI, and CP loads, respectively.

2.4. DG Modeling

Here, a DG (with anticipated output power) is considered as a source having the ability to inject both real and reactive power. The DG’s power is modeled as negative demand at the bus where it is located, and mathematically it is expressed as follows:
P d , n e t k = P d k P D G k
Q d , n e t k = P d k P D G k tan ( cos 1 ( P F D G k ) )
where P d , n e t k and Q d , n e t k represent the real and reactive power demand at the kth bus after compensation of DG power, wherein P d k and Q d k denote the same without compensation. P D G k is the real power injection by the DG located at the kth bus and P F D G k is the associated PF.

3. HOA Algorithm

The HOA [28], a global optimization algorithm inspired by hiking activity, was proposed by S. O. Oladejo et al. The HOA mimics the attributes of hikers aiming to attain the peak of a mountain in a group. As a member of the metaheuristic family, the HOA starts from random positions in the search space (similar to mountainous territory). Subsequently, the position of each solution is updated based on Tobler’s hiking function to drive the solution towards the global optimum (like a hiker’s tendency to achieve the peak of a mountain). During the update process, the sweep factor ( α ) and elevation angle ( θ ) shift the search behavior from exploration to exploitation with the iteration count. The major steps of the HOA are discussed below.
Step 1: 
Initialization
For initializing the hiker with a random position in the search space, the following equation is used:
β i j = ϕ j m i n + δ j ( ϕ j m a x ϕ j m i n )
where β i j is the jth dimension of the ith hiker and δ j is a uniformly distributed number ranging between 0 and 1. ϕ j m a x and ϕ j m i n are the upper bound and lower bound of the jth decision variable, respectively.
Step 2: 
Velocity Evaluation
The HOA’s mathematical foundation is derived from Waldo Tobler’s hiking function. The exponential function to determine the hiker’s speed is as follows:
W i , t = 6 e 3.5 | S i , t + 0.05 |
where S i , t and W i , t are the terrain slope and velocity of the ith hiker at the tth iteration, respectively. S i , t can be defined as follows:
S i , t = d y d x = tan θ i , t
While hiking, the d x and d y denote the distance covered by the hiker in the horizontal and vertical dimensions, respectively. Accordingly, θ i , t for the ith hiker is updated in the tth iteration; it ranges between 0 and 50 . It is worth mentioning that a higher value of θ i , t drags the HOA into the exploration phase, while a lower value tends towards the exploitation phase.
Step 3: 
Update
The updated velocity of hiker i, utilizing group social thinking and individual cognitive abilities, can be determined using the following equation:
W i , t = W i , t 1 + γ i , t ( β b e s t α i , t β i , t )
Here, γ i , t is a uniformly distributed number range between 0 and 1. Similarly, α i , t varies between 1 and 3, and its value decreases with the iteration count to shift the search mechanism from exploration to exploitation. β i , t and β b e s t are the positions of the ith hiker and lead hiker in the tth iteration, respectively.
The updated position of hiker i based on the updated velocity is evaluated as follows:
β i , t + 1 = β i , t + W i , t

4. Results and Discussion

This section presents a discussion on the results attained by applying the HOA technique for optimal DG allocation and the NR problem at various PFs with different load models. For the HOA, a population size of 30 and 500 iterations are used, with the selection details presented at the end of the section. The details about the load levels (low—L, normal—N, and peak—P) and other related load multiplying factors, duration, and energy price were taken from [22] and are given in Table 1. Whereas the load models and DG-related information were taken from [1]. An IEEE 33-bus radial DN (5 tie switches and 32 sectionalizing switches), as described in [29], was used to validate the usefulness of the adopted algorithm. Moreover, six different cases are simulated considering different objective functions, various PFs, and multiple loading levels. The details about the cases are presented below in Table 2.

4.1. Base Case: System Analysis Without DG and NR

The base case scenario offers a standard to assess the DN performance in the absence of DG units. The obtained results under the base case are presented in Table 3.

4.2. Case 1: Minimization of Power Loss at the ZPF Considering Different Load Models

This case concentrates on the optimization of the DG allocation while simultaneously evaluating the effects of NR through the HOA technique across various load models. Here, the DG is operating at the ZPF. The findings illustrated in Table 4 indicate significant improvements in DN performance when contrasted with the base case. For instance, case 1 exhibits a remarkable 54.31% reduction in APL and a 48.31% reduction in reactive power loss (RPL) for the CP load model. It also offers a notable decrease in APL of 50.48%, 47.33%, and 48.23% for the CI, CZ, and ZIP load models, respectively. In addition, a substantial decrease in RPL of 44.84%, 40.41%, and 42.37% for the CI, CZ, and ZIP load models, respectively, is achieved. In addition, the application of the HOA results in considerable declines in bus voltage deviation (BVD) of 51.57% for CP, 49.84% for CI, 46.61% for CZ, and 48.20% for ZIP models, thereby emphasizing its efficacy in enhancing the network’s technical performance in terms of reliability and stability.
Furthermore, the performance of the HOA surpasses that of alternative optimization methodologies such as ant colony algorithm (ACA) [30], binary particle swarm optimization (BPSO) [31], and electric eel foraging optimization (EEFO) [1], as depicted in Figure 1.

4.3. Case 2: Minimization of Power Loss at the UPF Considering Different Load Models

Here, the emphasis transitions to DG deployment at the UPF. Due to the fact that the DG is operating at the UPF, active power support is received, and hence case 2 yields superior results, as outlined in Table 5. It accomplishes lower APL, RPL, and BVD in comparison to the base case and case 1. From Table 5, it can be observed that compared to the base case and case 1, case 2 exhibits a remarkable reduction in APL (ranging from 68 to 74%) and RPL (ranging from 63 to 70%) across all the load models. Additionally, the adoption of the HOA methodology results in significant reductions in the BVD of 72.33% for CP, 70.16% for CI, 67.72% for CZ, and 65.58% for the ZIP model, thereby highlighting its efficacy in strengthening the network’s technical performance.
Moreover, in Figure 2 the performance of the HOA surpasses that of the alternative optimization methodologies, including the improved EOA (IEOA) [27], improved sine cosine algorithm (ISCA) [31], and adaptive cuckoo search algorithm (ACSA) [32], in terms of obtaining a better global optimization value of APL.

4.4. Case 3: Minimization of Power Loss at the OPF with Consideration of Different Load Models

In this instance, the primary objective is to optimize the deployment of DG units at the OPF. As a result of the DG operating at the OPF, both active and reactive power support is received, and hence case 3 yields superior results, as outlined in Table 6. Specifically, case 3 demonstrates a minimum 93.84% decrease in the APL and a 92.31% decrease in the RPL relative to the base case. The detailed information about the reduction in the APL and RPL for the individual load model for cases 1–3 is presented in Figure 3 and Figure 4. Similar to cases 1–2, significant reductions in the BVD for all the ZIP models is also achieved in case 3. Furthermore, case 3 displays substantial enhancements in the VP as compared to cases 1–2, as shown in Figure 5.
For the reason discussed in Section 1, in this study, the CAEL is also considered as the crucial objective. Thus, several cases (case 4–6) with distinct scenarios are presented for accommodating different loading patterns and corresponding price effects.

4.5. Case 4: CAEL Minimization at the ZPF Considering Both Different Load Models and Load Levels

This case concentrates on CAEL minimization while simultaneously optimizing distribution NR along with the location and size of the DG units (functioning at the ZPF) across different load models and load levels. The obtained results using the HOA technique for various performance parameters (APL, CAEL, and Vmin) are presented in Table 7. As can be seen, case 4 offers a CAEL of 86,759.06 for CP, 79,391.2 for CI, 74,403.96 for CZ, and 77,018.28 for the ZIP load model.

4.6. Case 5: CAEL Minimization at the UPF Considering Both Different Load Models and Load Levels

In case 5, the emphasis shifts to optimizing DG installation at the UPF under multiple load levels. The decision variables and performance parameters corresponding to the optimized solution by the HOA are shown in Table 8. It achieves a lower APL and CAEL in comparison to case 4, as active power support is received due to the use of the UPF.

4.7. Case 6: CAEL Minimization at the OPF Considering Both Different Load Models and Load Levels

Here, the primary objective is to optimize the deployment of DG units at the OPF under multiple load levels. The results obtained through the HOA are shown in Table 9. It realizes reduced APL and CAEL in comparison to cases 4–5, because of achieving both active and reactive power support.
As outlined in Table 10, the result obtained for CAEL (without NR) utilizing the Dynamic Node Priority List Genetic Algorithm (DNPL-GA) [33] is USD 18,033, with the Corrected Moth Search Optimization (CMSO) it is USD 16,906 [22], and via the Multi-Agent Sine-Cosine Algorithm (MA-SCA) [34] it is USD 13,961. However, a substantial decrease in the CAEL (DG allocation with NR), which stands at USD 10,837.91 (approximately 22.3% better than the best reported results of CAEL without NR) is achieved due to the incorporation of NR within the optimization framework, thereby affirming the usefulness of incorporating the NR during DG allocation.

5. Parameter Sensitivity Analysis

In this section, the selection of the population size and maximum iteration count through a parameter sensitivity analysis is presented. Here, five combinations, varying population size from 10 to 50 and iteration count from 300 to 1500, are created keeping the number of function evaluations the same to ensure a more or less equal execution time. For each combination, 25 independent trial runs are made for the CP load model and the statistical results for case 1 (AEL minimization) and case 4 (CAEL minimization) are presented in Table 11. The observations in the table clearly reveal the dominant performance of the third combination (Comb3) as it achieves the minimum value in all aspects for both the cases. To show that the difference between the results of Comb3 and the other combinations are statistically significant, Wilcoxon’s test [34] (with 5% significance level) was performed and the results are presented in Table 12. The p-value reported in the table for each combination are less than 0.05, which clearly indicates that the results obtained from Comb3 are statistically significantly better than the others. Based on this analysis, Comb3, i.e., the population size of 30 and iteration count of 500, is considered for all the other cases.

6. Conclusions

In this study, the HOA is applied for the simultaneous optimization of DG allocation and NR in a DN. The APL and CAEL are optimized, and various aspects like ZIP load modeling and multiple load levels with associated different electricity prices are considered to showcase the work’s practicality in the real world. In toto, six cases have been simulated and implemented on a standard IEEE 33-bus DN. The superior search capability of the HOA is confirmed through a comparative analysis with results from other well-established algorithms presented in the state-of-the-art literature. For instance, the APL in case 2 for CP loading is 53.04 kW, and an average improvement of 7.70 kW (14.52%) is found compared to four other reported methods. Additionally, other technical performance parameters like RPL, BVD, and minimum voltage are also found to be superior in the case of the HOA. Further, the need to consider NR along with DG while optimizing the CAEL is justified, as a significant reduction of USD 16,384 (33%) is found in case 5 compared to reported values of CAEL without NR. In future work, a multi-objective framework for DG allocation, which combines technical and economic objectives, could be studied, and the effect of seasonality could also be included in the load modeling.

Author Contributions

Conceptualization, C.D.P., G.S. and P.N.B.; methodology, C.D.P., T.K.T. and S.S.S.; software, C.D.P. and S.S.S.; validation, C.D.P., T.K.T. and G.S.; formal analysis, C.D.P., T.K.T., S.S.S., G.S. and P.N.B.; writing—original draft preparation, T.K.T. and S.S.S.; writing—review and editing, P.N.B., G.S. and C.D.P. All authors have read and agreed to the published version of the manuscript.

Funding

This research received no external funding.

Data Availability Statement

The references for the data are mentioned in the article.

Conflicts of Interest

The authors declare no conflicts of interest.

Abbreviations

The following abbreviations are used in this manuscript:
DGDistributed generation
DNDistribution network
NRNetwork reconfiguration
APLActive power loss
CAELCost of annual energy loss
HOAHiking optimization algorithm
PFPower factor
VPVoltage profile
WTWind turbine
PVPhotovoltaic
LSFLoss sensitivity factor
ESSEnergy storage system
MILPMixed-integer linear programming
MOGWOMulti-objective grey wolf optimization
BABat algorithm
DSTATCOMDistribution static compensator
OLTCOn-load tap changer
SCShunt capacitor
DERsDistributed energy resources
SOSSymbiotic organism search
EOAEquilibrium optimization algorithm
CPConstant power
CIConstant current
CZConstant impedance
ZPFZero power factor
UPFUnity power factor
OPFOptimal power factor
BVDBus voltage deviation
ACAAnt colony algorithm
BPSOBinary particle swarm optimization
EEFOElectric eel foraging optimization
IEOAImproved equilibrium optimization algorithm
ISCAImproved sine cosine algorithm
ACSAAdaptive cuckoo search algorithm
DNPL-GA   Dynamic Node Priority List Genetic Algorithm
CMSOCorrected Moth Search Optimization
MA-SCAMulti-Agent Sine-Cosine Algorithm
WOAWhale Optimization Algorithm
NSGANon-dominated sorting genetic algorithm

References

  1. Maurya, P.; Tiwari, P.; Pratap, A. Electric eel foraging optimization algorithm for distribution network reconfiguration with distributed generation for power system performance enhancement considerations different load models. Comput. Electr. Eng. 2024, 119, 109531. [Google Scholar] [CrossRef]
  2. Badran, O.; Mekhilef, S.; Mokhlis, H.; Dahalan, W. Optimal reconfiguration of distribution system connected with distributed generations: A review of different methodologies. Renew. Sustain. Energy Rev. 2017, 73, 854–867. [Google Scholar] [CrossRef]
  3. Kandasamy, M.; Thangavel, R.; Arumugam, T.; Jayaram, J.; Kim, W.; Geem, Z. Performance enhancement of radial power distribution networks using network reconfiguration and optimal planning of solar photovoltaic- based distributed generation and shunt capacitors. Sustainability 2022, 14, 11480. [Google Scholar]
  4. Jayabarathi, T.; Raghunathan, T.; Mithulananthan, N.; Cherukuri, S.; Loknath Sai, G. Enhancement of distribution system performance with reconfiguration, distributed generation and capacitor bank deployment. Heliyon 2024, 10, e26343. [Google Scholar] [CrossRef]
  5. Gao, H.; Wang, R.; He, S.; Wang, L.; Liu, J.; Chen, Z. A Cloud-Edge Collaboration Solution for Distribution Network Reconfiguration Using Multi-Agent Deep Reinforcement Learning. IEEE Trans. Power Syst. 2024, 39, 3867–3879. [Google Scholar] [CrossRef]
  6. Kashyap, M.; Kansal, S.; Verma, R. Sizing and allocation of DGs in a passive distribution network under various loading scenarios. Electr. Power Syst. Res. 2022, 209, 108046. [Google Scholar] [CrossRef]
  7. Iyer, A.; Patel, C. Optimal placement of distributed energy resources and shunt capacitors with consideration of existing on-line tap changer using honey badger optimization. In Proceedings of the 2023 Third International Conference on Advances in Electrical, Computing, Communication and Sustainable Technologies (ICAECT), Bhilai, India, 5–6 January 2023; pp. 1–6. [Google Scholar]
  8. Nematollahi, A.; Rahiminejad, A.; Vahidi, B. A novel multi-objective optimization algorithm based on Lightning Attachment Procedure Optimization algorithm. Appl. Soft Comput. 2019, 75, 404–427. [Google Scholar] [CrossRef]
  9. Adegoke, S.; Sun, Y.; Adegoke, A.; Ojeniyi, D. Optimal placement of distributed generation to minimize power loss and improve voltage stability. Heliyon 2024, 10, e39298. [Google Scholar] [CrossRef]
  10. Saxena, V.; Manna, S.; Rajput, S.; Kumar, P.; Sharma, B.; Alsharif, M.; Kim, M. Navigating the complexities of distributed generation: Integration, challenges, and solutions. Energy Rep. 2024, 12, 3302–3322. [Google Scholar] [CrossRef]
  11. Azad, S.; Amiri, M.; Heris, M.; Mosallanejad, A.; Ameli, M. A novel analytical approach for optimal placement and sizing of distributed generations in radial electrical energy distribution systems. Sustainability 2021, 13, 10224. [Google Scholar] [CrossRef]
  12. Prakash, P.; Meena, D.; Malik, H.; Alotaibi, M.; Khan, I. A novel analytical approach for optimal integration of renewable energy sources in distribution systems. Energies 2022, 15, 1341. [Google Scholar] [CrossRef]
  13. Wu, X.; Yang, C.; Han, G.; Ye, Z.; Hu, Y. Energy loss reduction for distribution networks with energy storage systems via loss sensitive factor method. Energies 2022, 15, 5453. [Google Scholar] [CrossRef]
  14. Bendriss, B.; Sayah, S.; Hamouda, A. Efficient multi-objective optimization approach for solving optimal DG placement and sizing problem in distribution systems. J. Eng. Res. 2024. [Google Scholar] [CrossRef]
  15. Pareja, G.; Luis, A.; López-Lezama Jesús, M.; Gómez Carmona, O. A mixed-integer linear programming model for the simultaneous optimal distribution network reconfiguration and optimal placement of distributed generation. Energies 2022, 15, 3063. [Google Scholar] [CrossRef]
  16. El-Ela, A.; El-Sehiemy, R.; Shaheen, A.; Ellien, A. Optimal allocation of distributed generation units correlated with fault current limiter sites in distribution systems. IEEE Syst. J. 2020, 15, 2148–2155. [Google Scholar] [CrossRef]
  17. Khenissi, I.; Guesmi, T.; Alshammari, B.; Alqunun, K.; Almalaq, A.; Alturki, M.; Neji, R. A hybrid chaotic bat algorithm for optimal placement and sizing of dg units in radial distribution networks. Energy Rep. 2024, 12, 1723–1741. [Google Scholar] [CrossRef]
  18. Neda, O. Optimal amalgamation of DG units in radial distribution system for techno-economic study by improved SSA: Practical case study. Electr. Power Syst. Res. 2025, 241, 111365. [Google Scholar] [CrossRef]
  19. Dash, S.; Mishra, S.; Abdelaziz, A.; Hong, J.; Geem, Z. Optimal planning of multitype DGs and D-STATCOMs in power distribution network using an efficient parameter free metaheuristic algorithm. Energies 2022, 15, 3433. [Google Scholar] [CrossRef]
  20. Ramshanker, A.; Isaac, J.; Jeyeraj, B.; Swaminathan, J.; Kuppan, R. Optimal DG placement in power systems using a modified flower pollination algorithm. Energies 2022, 15, 8516. [Google Scholar] [CrossRef]
  21. Ganguly, S.; Samajpati, D. Distributed generation allocation with on-load tap changer on radial distribution networks using adaptive genetic algorithm. Appl. Soft Comput. 2017, 59, 45–67. [Google Scholar] [CrossRef]
  22. Singh, P.; Bishnoi, S.; Meena, N. Moth search optimization for optimal DERs integration in conjunction to OLTC tap operations in distribution systems. IEEE Syst. J. 2019, 14, 880–888. [Google Scholar] [CrossRef]
  23. Sunil, A.; Venkaiah, C. Multi-objective adaptive fuzzy campus placement based optimization algorithm for optimal integration of DERs and DSTATCOMs. J. Energy Storage 2024, 75, 109682. [Google Scholar] [CrossRef]
  24. Mahdavi, E.; Asadpour, S.; Macedo, L.; Romero, R. Reconfiguration of Distribution Networks with Simultaneous Allocation of Distributed Generation Using the Whale Optimization Algorithm. Energies 2023, 16, 4560. [Google Scholar] [CrossRef]
  25. Prasad, K.; Kollu, R.; Ramkumar, A.; Ramesh, A. A multi-objective strategy for optimal DG and capacitors placement to improve technical, economic, and environmental benefits. Int. J. Electr. Power Energy Syst. 2025, 165, 110491. [Google Scholar] [CrossRef]
  26. Huy, T. Enhancing distribution system performance via distributed generation placement and reconfiguration based on improved symbiotic organisms search. J. Control Sci. Eng. 2023, 2023, 6081991. [Google Scholar] [CrossRef]
  27. Shaheen, A.; Elsayed, A.; El-Sehiemy, R.; Abdelaziz, A. Equilibrium optimization algorithm for network reconfiguration and distributed generation allocation in power systems. Appl. Soft Comput. 2021, 98, 106867. [Google Scholar] [CrossRef]
  28. Oladejo, S.; Ekwe, S.; Mirjalili, S. The Hiking Optimization Algorithm: A novel human-based metaheuristic approach. Knowl.-Based Syst. 2024, 296, 111880. [Google Scholar] [CrossRef]
  29. Huy, T.; Van Tran, T.; Vo, D.; Nguyen, H. An improved metaheuristic method for simultaneous network reconfiguration and distributed generation allocation. Alex. Eng. J. 2022, 61, 8069–8088. [Google Scholar] [CrossRef]
  30. Kasaei, M.; Gandomkar, M. Loss reduction in distribution network using simultaneous capacitor placement and reconfiguration with ant colony algorithm. In Proceedings of the 2010 Asia-Pacific Power And Energy Engineering Conference, Chengdu, China, 28–31 March 2010; pp. 1–4. [Google Scholar]
  31. Raut, U.; Mishra, S. An improved sine–cosine algorithm for simultaneous network reconfiguration and DG allocation in power distribution systems. Appl. Soft Comput. 2020, 92, 106293. [Google Scholar] [CrossRef]
  32. Nguyen, T.; Truong, A.; Phung, T. A novel method based on adaptive cuckoo search for optimal network reconfiguration and distributed generation allocation in distribution network. Int. J. Electr. Power Energy Syst. 2016, 78, 801–815. [Google Scholar] [CrossRef]
  33. Meena, N.; Swarnkar, A.; Gupta, N.; Niazi, K. Optimal integration of DERs in coordination with existing VRs in distribution networks. IET Gener. Transm. Distrib. 2018, 12, 2520–2529. [Google Scholar] [CrossRef]
  34. Patel, C.; Tailor, T. Multi-agent based sine–cosine algorithm for optimal integration of DERs with consideration of existing OLTC in distribution networks. Appl. Soft Comput. 2022, 117, 108387. [Google Scholar] [CrossRef]
Figure 1. Comparison of results obtained by different algorithms for CP load (case 1).
Energies 18 03005 g001
Figure 2. Comparison of results obtained by different algorithms for CP load (case 2).
Energies 18 03005 g002
Figure 3. Reduction in APL for the individual load model.
Energies 18 03005 g003
Figure 4. Reduction in RPL for the individual load model.
Energies 18 03005 g004
Figure 5. Voltage profile of each of the buses of IEEE 33-bus DN with CP load model.
Energies 18 03005 g005
Table 1. Description of different load levels and associated energy price.
Load LevelMultiplying FactorDuration (H)Energy Price (USD/MWh)
Low (L)0.5200055
Normal (N)1.0526072
Peak (P)1.61500120
Table 2. Information about different cases.
Case No.ObjectivePower FactorLoad ModelLoading Scenario
1Power loss minimizationZPFCP, CI, CZ, ZIPNormal
2Power loss minimizationUPFCP, CI, CZ, ZIPNormal
3Power loss minimizationOPFCP, CI, CZ, ZIPNormal
4CAEL minimizationZPFCP, CI, CZ, ZIPLow, normal, high
5CAEL minimizationUPFCP, CI, CZ, ZIPLow, normal, high
6CAEL minimizationOPFCP, CI, CZ, ZIPLow, normal, high
Table 3. Results under base case for different load models.
Load Model P loss (MW) Q loss (MVAr)BVD
CP202.66135.11.7009
CI176.6117.51.5847
CZ156.9104.21.4907
ZIP162.61081.5184
Table 4. Results under case 1 for different load models.
CPCICZZIP
Open switch9, 14, 37, 32, 714, 37, 9, 7, 369, 37, 14, 7, 327, 14, 9, 36, 37
DG location30, 8, 2424, 22, 308, 24, 3030, 24, 12
DG size (kVAr)962.85, 445.62, 523.94509.03, 463.64, 981.67391.58, 501.36, 925.93969.09, 506.04, 339.59
APL (kW)92.5987.4682.6484.17
RPL (kVAr)69.8364.8162.0962.24
BVD (pu)0.82380.79450.79580.7864
Vmin (pu)0.95950.95980.96100.9604
Table 5. Results under case 2 for different load models.
CPCICZZIP
Open switch14, 27, 9, 31, 714, 28, 31, 7, 99, 14, 7, 27, 317, 14, 27, 30, 9
DG location12, 25, 1833, 12, 2518, 22, 2525, 18, 12
DG size (kW)568.59, 1445.65, 642.61615.95, 571.45, 1365.37590.10, 733.32, 1378.061245.70, 776.81, 558.50
APL (kW)53.0451.4949.7049.67
RPL (kVAr)40.3238.8937.9238.61
BVD (pu)0.47050.47280.48110.5073
Vmin (pu)0.97660.97690.97660.9705
Table 6. Results under case 3 for different load models.
CPCICZZIP
Open switch13, 33, 21, 17, 2625, 36, 21, 11, 335, 11, 26, 15, 3513, 35, 20, 23, 15
DG location30, 24, 924, 30, 1525, 32, 832, 8, 25
DG size (kW)1090.00, 897.64, 1065.23980.75, 1011.96, 940.991122.05, 747.43, 1122.98745.60, 1190.64, 1149.23
DG OPF0.7255, 0.8997, 0.90420.9129, 0.7000, 0.90470.8062, 0.7967, 0.90240.8001, 0.8915, 0.8207
APL (kW)9.8110.489.678.92
RPL (kVAr)7.938.808.017.12
BVD (pu)0.10560.10960.10710.0895
Vmin (pu)0.99340.99270.98740.9920
Table 7. Results under case 4 for different load models and load levels.
CPCICZZIP
Open switch9, 7, 14, 36, 3732, 7, 14, 37, 97, 9, 28, 14, 3610, 37, 7, 14, 36
DG location31, 30, 930, 32, 931, 16, 2533, 16, 30
DG size (kVAr)[105.38, 422.90, 170.98] L; [211.60, 852.08, 349.83] N; [1291.87, 591.04, 616.37] P[386.61, 100.00, 185.89] L; [864.22, 138.32, 370.02] N; [943.61, 641.76, 884.36] P[258.47, 117.88, 390.85] L; [502.58, 226.15, 777.83] N; [1059.75, 344.49, 1002.88] P[100.00, 123.97, 419.89] L; [142.00, 239.64, 886.57] N; [842.98, 473.03, 1119.36] P
APL (kW)23.34 L, 96.38 N, 264.95 P22.62 L, 90.55 N, 236.73 P22.34 L, 87.00 N, 216.65 P22.44 L, 88.10 N, 228.81 P
CAEL (USD)86,759.0679,391.274,403.9677,018.28
Vmin (pu)0.98 L, 0.96 N, 0.95 P0.98 L, 0.96 N, 0.95 P0.98 L, 0.95 N, 0.95 P0.98 L, 0.96 N, 0.95 P
Table 8. Results under case 5 for different load models and load levels.
CPCICZZIP
Open switch28, 11, 33, 34, 3133, 11, 30, 14, 2831, 11, 33, 34, 2834, 11, 28, 33, 31
DG location30, 33, 268, 33, 2529, 33, 718, 29, 8
DG size (kW)[518.69, 351.09, 488.43] L; [1046.26, 704.18, 984.97] N; [1224.25, 1034.16, 1456.59] P[481.89, 265.99, 627.98] L; [967.73, 529.32, 1254.05] N; [1308.18, 906.66, 1499.48] P[554.63, 348.74, 489.11] L; [1099.69, 685.88, 974.36] N; [1485.48, 1048.61, 1180.88] P[357.95, 571.58, 414.77] L; [710.51, 1130.57, 828.0] N; [1105.99, 1500.0, 1109.01] P
APL (kW)13.35 L, 54.70 N, 151.54 P13.13 L, 52.65 N, 136.63 P12.32 N, 48.62 L, 126.25 P12.47 L, 49.47 N, 128.36 P
CAEL (USD)49,461.3845,976.8442,495.2543,211.8
Vmin (pu)0.99 L, 0.97 N, 0.95 P0.99 L, 0.97 N, 0.95 P0.99 L, 0.98 N, 0.96 P0.99 L, 0.98 N, 0.96 P
Table 9. Results under case 6 for different load models and load levels.
CPCICZZIP
Open switch27, 35, 14, 33, 1535, 33, 26, 13, 1611, 15, 27, 13, 3333, 35, 10, 37, 32
DG location25, 9, 3232, 29, 932, 25, 830, 25, 15
DG size (kW)[604.13, 455.80, 323.36] L; [1102.24, 916.34, 752.80] N; [1496.75, 1019.16, 1199.09] P[309.08, 558.42, 477.24] L; [615.21, 1095.03, 957.73] N; [891.28, 1486.31, 1337.40] P[369.71, 541.68, 474.80] L; [739.21, 1088.25, 952.04] N; [1072.57, 1499.95, 1142.49] P[478.83, 423.54, 455.71] L; [955.48, 845.95, 908.74] N; [1415.81, 923.61, 1375.58] P
DG OPF[0.86, 0.90, 0.70] L; [0.80, 0.90, 0.80] N; [0.75, 0.82, 0.80] P[0.82, 0.78, 0.90] L; [0.82, 0.77, 0.90] N; [0.81, 0.70, 0.88] P[0.80, 0.80, 0.90] L; [0.79, 0.80, 0.90] N; [0.76, 0.76, 0.84] P[0.71, 0.90, 0.90] L; [0.70, 0.90, 0.90] N; [0.70, 0.81, 0.88] P
APL (kW)2.77 L, 10.87 N, 35.64 P2.75 L, 10.97 N, 32.43 P2.56 L, 10.21 N, 31.24P 2.73 L, 10.87 N, 32.56 P
CAEL (USD)10,837.9110,294.229770.61210,277.72
Vmin (pu)1.00 L, 0.99 N, 0.98 P1.00 L, 0.99 N, 0.99 P1.00 L, 0.99 N, 0.99 P1.00 L, 0.99 N, 0.99 P
Table 10. Comparison of CAEL (USD) obtained by different algorithms for CP load.
DNPL-GACMSOMASCAHOA
Case 568,75364,82063,96549,461.38
Case 618,03316,90613,96110,837.9
Table 11. Statistical analysis for five combinations of population size and iteration count.
Comb1 Npop = 10 Niter = 1500Comb2 Npop = 20 Niter = 750Comb3 Npop = 30 Niter = 500Comb4 Npop = 40 Niter = 375Comb5 Npop = 50 Niter = 300
Case 1Best95.0894.1392.5993.3094.91
Worst107.89102.4796.88100.38101.10
Average99.4997.7994.8697.0097.13
Standard deviation3.4562.1691.1891.9801.792
Case 4Best90,068.4188,399.4586,759.0688,739.6389,895.84
Worst101,368.35100,388.4790,150.7597,217.1198,384.57
Average93,802.9892,610.8988,636.5691,303.8393,696.51
Standard deviation3379.803344.561079.502517.442700.61
Table 12. p-value for Wilcoxon’s test.
Comb3 vs.Comb1Comb2Comb4Comb5
Case 13.05 × 10−67.54 × 10−67.93 × 10−61.92 × 10−4
Case 44.13 × 10−64.22 × 10−64.22× 10−64.14 × 10−6
Disclaimer/Publisher’s Note: The statements, opinions and data contained in all publications are solely those of the individual author(s) and contributor(s) and not of MDPI and/or the editor(s). MDPI and/or the editor(s) disclaim responsibility for any injury to people or property resulting from any ideas, methods, instructions or products referred to in the content.

