Article

Experimental Investigation of the Influence of Climatic Conditions and Vehicle Dynamics on the Thermal Management System of a Fuel Cell Electric Vehicle

1
System Engineering Vehicle Concepts, Robert Bosch GmbH, 71701 Schwieberdingen, Germany
2
Institute for Vehicle Concepts, German Aerospace Center (DLR), 70569 Stuttgart, Germany
*
Author to whom correspondence should be addressed.
Energies 2025, 18(11), 2995; https://doi.org/10.3390/en18112995
Submission received: 14 April 2025 / Revised: 22 May 2025 / Accepted: 24 May 2025 / Published: 5 June 2025
(This article belongs to the Section J: Thermal Management)

Abstract

:
In this study, the cooling performance of fuel cell electric vehicles (FCEVs) with regard to thermal derating is investigated. Particularly in hot climate conditions, low operating temperature of the fuel cell stack and hence low temperature difference to the environment can result in thermal derating of the fuel cell stack. Experimental investigations on a production vehicle with a fuel cell drive (Hyundai Nexo) are conducted to analyze the influence of climatic boundary conditions and a dynamic driving scenario on the thermal management system of the vehicle. Therefore, a new method based on energy balances is introduced to indirectly measure the average cooling air velocity at the cooling module. The results indicate that the two high-power radiator fans effectively maintain a high cooling airflow between a vehicle speed of approximately 30 and 100 k m / h , leading to efficient heat rejection at the cooling module largely independent of vehicle speed. Furthermore, this study reveals that the efficiency of the fuel cell system is notably affected by ambient air temperature, attributed to the load on the electric air compressor (EAC) as well as on cooling system components like cooling pump and radiator fans. However, at the stack level, balance of plant (BoP) components demonstrate the ability to ensure ambient temperature-independent performance, likely due to reliable humidification control up to 45 °C. Additionally, a new method for determining thermal derating of FCEVs on roller dynamometer tests is presented. A real-world uphill drive under ambient temperatures exceeding 40 °C demonstrates derating occurring in 6.3% of the time, although a worst case with an aged stack and high payload is not investigated in this study. Finally, a time constant of 50 s is found to be suitable to correlate the average fuel cell stack power with a coolant temperature at the stack inlet, which gives information on the thermal inertia of the system observed and can be used for future simulation studies.

1. Introduction

Stricter global legislation regarding CO2, particulate, and NOx emissions from motor vehicles call for drive types that, in contrast to internal combustion engines, can be operated largely free of pollutants [1,2,3]. To this end, green hydrogen, which is generated from the overproduction of electricity from renewable energies, could be used as an energy source in the vehicle. Using a fuel cell, the hydrogen can be converted into electricity on board of a vehicle. The electricity produced can then be used to power electric motors with a high degree of efficiency, simultaneously almost exclusively emitting air and water. In these fuel cell electric vehicles, the hydrogen is stored in hydrogen tanks, which have a high gravimetric and volumetric energy density compared to batteries [4]. This results in an advantage over battery electric vehicles (BEV) wherever a large amount of energy has to be stored in the vehicle; for example, use-cases with high total weight or where large distances need to be overcome without the possibility to recharge. Following the introduction of series-produced passenger cars such as the Hyundai Nexo [5] and the Toyota Mirai [6], which demonstrate the maturity of the technology, other vehicles such as the Honda CR-V [7] or Opel Movano [8] are about to enter the market.
Due to its quick-start capability and high durability, polymer electrolyte membrane fuel cells (PEMFCs) are typically used for vehicles, which convert hydrogen into electric power for the drive system. The central component of the PEMFC is a synthetic membrane that is impermeable to electrons but conducts protons oxidized from hydrogen. In addition, catalytic materials are applied to the electrodes of the PEMFC to accelerate the desired cell reaction and thus increase cell efficiency. However, in addition to the low availability of green hydrogen and a currently limited supply infrastructure, there are also challenges regarding the thermal management of FCEV: The chemical stability of the described components, as well as the membrane humidification to maintain the proton transport mechanisms and hence efficient operation of the cell, are strongly temperature-dependent. Depending on the pressure level, state of health and efficiency suffer from excessive temperatures outside the usual temperature window of 65–80 °C in relation to the coolant outlet temperature at the stack. To protect these components and the functionality of the fuel cell stack, the operating temperature must therefore be controlled and limited. For this purpose, liquid coolant is usually passed between the bipolar plates of each cell, which electrically couples the individual cells of the stack together. Due to the low material thickness of the cells coming with short heat transfer paths from the reaction layer to the coolant, and due to limited possibilities to directly measure the temperature within the cells of the stack, the coolant temperature is used as the representative operating temperature. However, since the heat is generated in the reaction zone near the catalyst, the actual temperature in the solid material must be higher than the coolant temperature.
One challenge of the thermal management system is the operation of the fuel cell system in regions where sub-zero ambient temperatures occur since the water within the system can be present in its solid form, impeding the operation of the stack until a certain operating temperature is exceeded. In order to overcome this challenge, recent research focuses on two strategies, either avoiding ice formation [9] or actively supporting the heat-up procedure [10].
Another challenge is the possible overheating of the fuel cell stack when operating the vehicle in hot climate zones: compared to combustion engines, which have to dissipate a similar amount of heat via the cooling water, the maximum cooling water temperature is reduced by roughly 30 °C at the outlet of the fuel cell stack. Following the heat exchanger equation for cross-flow heat exchangers, the heat flow that can be dissipated from the cooling water to the environment is determined by the inlet temperature differential Δ T i n (ITD), as described in Equation (1):
Q ˙ = Φ · w ˙ m i n · Δ T i n .
with the operation characteristic Φ for cross-flow heat exchangers and the minimum heat capacity flow w ˙ m i n of the two fluids. Therefore, the reduced cooling water temperature at the radiator inlet in vehicles with a fuel cell drive results in a lower dissipatable heat flow. In order to still be able to dissipate sufficient heat from the system, the cooling surfaces or the heat transfer factor needs to be increased. This is not possible for vehicles based on the current platforms without considerable effort or changes to the overall vehicle design. If the heat dissipated by the vehicle radiator is no longer sufficient to compensate for the heat production of the stack, there is a risk of the stack overheating, resulting in accelerated aging or reduced efficiency, as described above. This is particularly to be expected at operating points like uphill driving, where high ambient temperatures occur in addition to high wheel power and low air volume flow. In this case, monitoring of the stack reduces the electrical power produced by the stack and thus leads to a shift to more efficient operating points with lower heat dissipation rates, known as thermal derating. The full rated power of the drivetrain is no longer available to the driver of the vehicle, resulting in reduced acceleration and maximum velocity if the hybridization battery cannot compensate for the lack of electrical power. If one considers not only the short-term deviation from the usual vehicle performance—which means losses in driving function and also in safety when overtaking—but also long-lasting power reductions due to the temperature limits, which have an influence on the payload-distance of a vehicle in a specific time, this problem represents a major challenge in the commercial introduction of fuel cell drives.
Though thermal management of FCEVs in general [11,12] and cooling of the fuel cell stack in detail [13,14,15,16,17,18] are the subject of the current research, few specific studies exist on the cooling performance of a FCEV cooling module: Lee et al. conducted an evaluation of the cooling performance of the stack radiator in a fuel cell vehicle under real-world driving conditions at an ambient temperature of 35 °C [19]. Their study involved the use of 12 anemometers positioned downstream of the stack radiator, though details regarding the specific measurement technique were not provided. The presented graphs illustrate the relationship between vehicle driving speed and frontal air velocity; however, additional data on the corresponding fan speed could further enhance the interpretation. Furthermore, the heat rejection rates of the stack radiator were derived from simulations, although the results for maximum coolant flow rates were not explicitly shown. Gong et al. investigated the flow and heat transfer characteristics of two fuel cell vehicles, Roewe 950 and Toyota Mirai, with focus on the intake grilles and opening angle of the radiator fins [20]. The boundary conditions of their 3D computational model included high ambient temperatures of between 300 K and 320 K , whereas the coolant flow rates varied between 45.6 L / min and 76 L / min . A comparison with experimental results were not provided. Doppler et al. presented a methodology for sizing heat exchangers for fuel cell trucks, also including the influence of the ambient temperature [21]. Their work is based on stationary calculations as well as dynamic simulations, though comparison with experimental investigations was not given.
Regarding the experimental investigation of the fuel cell system of FCEVs, Di Pierro et al. characterized the Hyundai Nexo for three different dynamic drive cycles [22]. Their study focused on the electrical powertrain behavior in order to deliver validation data for vehicle modeling. Investigation of the thermal management system is left open for future studies. The same research group also points out the problem of assessing how FCEVs perform under various real-world operating conditions, with special focus on the energy consumption and efficiency [23]. They also provided a new formulation of overall efficiency of FCEVs, including different energy sources as an extension to the Society of Automotive Engineers (SAE) vehicle efficiency method and applying the method in comparison to BEVs. Dynamic tests were performed in the laboratory as well as on the road with ambient temperatures of up to 35 °C. The influence of ambient temperature was evaluated on a vehicle system level, not providing the detailed information necessary to model the effects of climatic conditions on the fuel cell system or cooling system. Sery and Leduc studied different methods for measuring hydrogen consumption of the Hyundai Nexo on various mission profiles on a chassis dynamometer [24]. Their study considered different steady states regarding fuel cell stack and systempower but did not consider varying boundary conditions like change in ambient temperature. Lohse-Busch et al. studied stack and system efficiency at up to 35 °C ambient temperature with a solar loading of 850 W / m 2 [25]. For these conditions, a reduction in stack power was observed depending on road grade and cooling conditions. The vehicle used was a Toyota Mirai of the 1st generation, which is not state-of-the-art anymore. Wang et al. studied the environmental adaptability of a Hyundai Nexo in cold start and high-temperature scenarios [26]. They provided a heat balance analysis for two continuous hill-climbs with 40 °C ambient temperature and compared the results with a vehicle simulation model. The same research group also considered dynamic drive cycles for FCEV tests, though they did not focus on high-temperature conditions [27,28].
In addition to experimental studies, models of both the fuel cell system and thermal management of FCEVs are often used in order to make predictions for thermal limitations. Haraldsson and Alvfors studied the effects of ambient conditions on the FCEV efficiency up to a temperature of 40 °C using a vehicle model in ADVISOR [29]. They found an influence of ambient air temperature and relative humidity on vehicle performance as well as high altitude. Liu et al. investigated the influence of ambient temperatures on the stack performance using a simulation model [30]. They found that a higher working temperature would benefit peak power output and efficiency. The results on the fuel cell system or at vehicle level were not shown. Anselma et al. studied the optimal thermal management strategy used in FCEVs, including detailed modeling of single BoP components [31]. An ambient temperature of 40 °C was taken into account when analyzing WLTCs that were run several times in succession.
Thermal derating of FCEV in particular is rarely considered in scientific publications. Gilles and Peissner included a limit for thermal derating in the thermal management strategy of their overall vehicle model [32]. The focus of the work was on the derivation of thermally demanding load cases for FCEV based on fleet data. Hahn et al. set up a model predictive control (MPC)-based fuel cell model with a detailed air system in order to show the ability of the MPC to maintain stable operation while realizing a thermal derating strategy [33]. They assumed a maximum temperature limit of 80 °C, after which thermal derating was applied.
In order to overcome the limitations of the cooling module radiator, spray cooling has been the focus of research in the last years: while Wagenblast et al. [34] and Lee et al. [35] studied radiator spray cooling for a FCEV truck, Park et al. [36] tested spray cooling in a climate chamber heated up to 45 °C ambient temperature with the aim of reducing the effect of thermal derating for a passenger car with fuel cell drive. Furthermore, Souby et al. [37] focused on the general performance of spray cooling while Prakabaran et al. [38] investigated intermittent spray cooling in contrast to continuous spray cooling with regard to application in FCEVs.
To summarize the above studies, the influence of ambient temperature on the efficiency of the fuel cell systems used in vehicles needs to be further explored experimentally. Moreover, the issue of thermal derating of FCEVs is solely addressed in simulation studies, yet the strategy employed remains unspecified. The objective of this study is to address this research gap of lacking experimental data regarding thermal derating and specifically contribute to the field in the following manner:
  • Identification of the heat rejection of the cooling module of a series-produced fuel cell vehicle as a function of vehicle speed;
  • Determination of the effect of ambient air temperature on the fuel cell system and stack performance of a FCEV;
  • Examination of the derating strategy of series-production vehicle;
  • Description of the occurrence of derating during a dynamic driving cycle on a chassis dynamometer.
For this purpose, a new method for determining the average cooling air velocity at the vehicle radiator is introduced, which is not found in the literature in this form. Similarly, the influence of the ambient temperature on the efficiency of the fuel cell stack and system for a production vehicle has not yet been investigated at the vehicle level. A method for detecting thermal derating of an FCEV on a chassis dynamometer adds to the novelty of this study and can be used in future extended studies aiming to answer the research question of whether and to what extent there are limits to the use of FCEVs in hot climate conditions due to limitations of the thermal management system.

2. Materials and Methods

In order to investigate the thermal system with regard to the aforementioned objectives, a fuel cell series-production vehicle is to be examined in roller dynamometer tests. The experimental setup is described in the following.

2.1. Roller Dynamometer with Climate Control

To be able to precisely specify climatic boundary conditions, the test vehicle was operated on a thermally insulated roller test bench with climate control and an air blower, LTG Fahrtwind-Simulator type VQF 500/1250 (sourced from LTG Aktiengesellschaft, Stuttgart, Germany), at the DLR (German Aerospace Center) Institute of Vehicle Concepts. The safety system and design of the test facility allows for the analysis of vehicles with hydrogen powertrains [39]. The air blower was positioned in front of the vehicle in accordance with the WLTP [40] in order to reproduce the airflow of a dynamic road test due to fast response time in fan–follows–dyno operation. The air blower can reproduce airflow speeds of between 20 and 130 k m / h , covering the maximum speed limits of most countries in the world, which was positioned centrally in front of the vehicle, as shown in Figure 1. The airflow speed is directly linked to the roller speed, but an offset can be set to take wind into account in a simplified manner.
A warm-up procedure was performed in the beginning of each measurement day in order to stabilize friction losses of the dynamometer. In contrast to road driving, a boundary layer forms in the test chamber due to the relative speed between the moving air and the ground, which has an influence on the flow around the vehicle. Since the boundary layer increases with increasing distance from the air blower and only the front of the vehicle is considered in the subsequent investigations, the influence of this effect is expected to be low. The ambient pressure could not be controlled but was recorded during experiments for the location in Stuttgart-Vaihingen at 455 m above sea level, with an average of 950 Pa . Derating of the fuel cell due to insufficient compressor output as a result of low ambient pressure can therefore be ruled out in the tests described below. Temperature and humidity sensors are located inside the chamber and used to regulate the climatic boundary conditions. In addition, the air blower is equipped with a temperature sensor near the outlet grille, which is referred to below as the ambient temperature. The forces transmitted from the front wheels to the rollers to overcome driving resistances, as well as the angular speed of the rollers to derive vehicle speed, are determined on the test bench. The total wheel power at the contact points between wheels and rollers, which is recorded by the roller dynamometer, is derived from the averaging of the vehicle speed v v e h and the sum of the individual forces F w h e e l , t o t a l as shown in Equation (2):
P w h e e l = v v e h · F w h e e l , t o t a l .

2.2. Test Vehicle

In order to demonstrate the real limits of the thermal system of fuel cell vehicles at the current state-of-the-art, a series-production vehicle, the Hyundai Nexo, was examined. At the start of the measurement campaign, the vehicle had been driven 31,365 k m on public road and chassis dynamometer in total, which is 19.5% of the mileage estimated by Hyundai under the warranty [41]. Therefore, the fuel cell system can be expected to be aged to a certain extent, but far from end-of-life status. At the time of the measurement, the average cell voltage was 0.86 V at idle load and 0.68 V at full load, respectively. The overall driving resistance in the plane is given by the coefficients found by Di Pierro et al. [22] as well as Sery and Leduc [24], as shown in Equation (1):
F R = 187.7 N + 0.9190 N k m / h · v v e h + 0.04037 N ( k m / h ) 2 · v v e h 2 .
For the vehicle mass, a weight of 2030 k g was assumed [22,24], which was used to calculate the gradient-dependent resistance in the dynamometer control.
In contrast to the high-pressure fuel cell system of the Toyota Mirai, the Hyundai Nexo has a low-pressure cathode operation with a range from 0.97 to 1.78 bar during the studies, requiring a humidifier to ensure that the stack is not dried out during high-temperature operation with high cathode airflow. On the anode side, the system is equipped with a jet pump; thus, a recirculation blower is not required. A DC/DC converter connects the high-voltage bus with the 1.56 k W h lithium-ion hybridization battery. This means that the high-voltage bus follows the voltage level of the fuel cell.
The thermal system of the Hyundai Nexo consists of a high-temperature (HT) and a low-temperature (LT) coolant circuit as well as a refrigeration circuit for cooling the passenger compartment. The hybridization battery is connected to the refrigerant circuit via a chiller in order to maintain the operating limits at high ambient temperatures. Air heat exchangers are housed in the front of the vehicle as heat sinks. The LT-radiator and air conditioning condenser are arranged next to each other in front of the HT radiator in the direction of flow. The entire condenser radiator fan module (CRFM) also includes two fans with a measured maximum electrical power consumption of 1.73 k W each, which support the flow of cooling air at low vehicle speeds. The air compressor and an intercooler for the cathode air, the traction motor, and the associated high-performance electronics are connected within the medium-temperature circuit. The high-temperature cooling layout, including the instrumentation used in this study, is depicted in Figure 2.
The high-temperature liquid cooling circuit for the fuel cell stack also includes a high-voltage cooling pump for circulating the coolant, an ion-exchanger for keeping the conductivity of the deionized coolant below short circuit conditions, an equalizing tank to counteract pressure dynamics, a heater core to make use of the excess heat of the fuel cell to heat up the passenger cabin, and a cold start device (CSD) for the fuel cell stack and the HT radiator. In addition, a coolant temperature valve (CTV) and a coolant bypass valve (CBV) are used to control the flow distribution during different states of the high-temperature circuit.

2.3. Instrumentation and Derived Variables

The measurement sensors and their position used for this study are described in this section. More detailed information on the measured signals is given in Appendix A.1. The vehicle was equipped with three temperature sensors in the HT coolant circuit positioned between the cooling pump and coolant bypass valve, as well as upstream and downstream of the stack radiator, as shown in Figure 2. An additional nine temperature sensors were positioned within the cooling airflow upstream and downstream of the stack radiator each to measure the temperature change over the stack radiator for nine air paths in a 3 × 3 pattern. A liquid turbine flow meter was positioned downstream of the stack radiator since the installation space allowed for a run-in distance necessary for the measurement principle. The measurement range of the flow meter was between 25 and 250 L / min . The voltage of the high-voltage bus was recorded, as well as the current of the stack cooling pump, one cooling fan, the CSD, the EAC, and the fuel cell stack. The current flowing from the high-voltage bus to the inverter of the traction motor was not measured directly using a current clamp meter since for safety reasons, the electrical insulation should be retained. The electrical consumption of the inverter could be calculated using an energy balance for the high-voltage bus. Electrical signals were measured with a sample rate of 50 Hz , while the remaining signals were measured with 10 Hz .
In order to determine the net power of a fuel cell system, vehicle simulations often consider a single characteristic line for fuel cell system efficiency. There are different definitions of fuel cell system efficiency, mainly dependent on the system design and recording of fuel consumption. In this study, the fuel consumed is calculated based on the current-based method, as explained by Sery et al. [24]. The cooling components are considered to be part of the fuel cell system, leading to the following definitions for fuel cell system and stack efficiency:
P n e t , s y s = P f c P B o P ,
P B o P = P E A C + P f a n s + P p u m p + P C S D ,
η n e t , s y s = P n e t , s y s m ˙ H 2 , c ,
η v o l t a g e , f c = P f c m ˙ H 2 , c
with the gross electrical power output of the stack P f c , net electrical power of the fuel cell system P n e t , s y s , and consumed mass flow of hydrogen m ˙ H 2 , c .
The proportion of heat that transfers from the fuel cell to the coolant is defined as follows:
Q ˙ f c , c o o l a n t = V ˙ H T , c o o l a n t ρ c o o l a n t c p , c o o l a n t ( T c o o l a n t , s t a c k o u t T c o o l a n t , s t a c k i n )
in which V ˙ H T , c o o l a n t is the measured coolant volume flow, ρ c o o l a n t is the density, and c p , c o o l a n t is the heat capacity of the coolant. Based on the examined boundary conditions of hot climate zones, it was assumed that no coolant is flowing over the CSD. This was confirmed for all observed operating points considering the CBV signal.
The heat flow from the coolant to the radiator, which is equal to the heat flow to the ambient air in stationary operating points, is analogously calculated with Equation (9):
Q ˙ H T , r a d = V ˙ H T , c o o l a n t ρ c o o l a n t c p , c o o l a n t ( T c o o l a n t , r a d o u t T c o o l a n t , r a d i n )
A critical parameter for evaluating the heat dissipation at the high-temperature radiator is the local velocity or massflow of the cooling air, respectively. Due to the higher heat capacity flow and higher heat transfer coefficient for liquids compared to gaseous fluids, the air mass flow is often the limiting factor for heat transfer at an automotive radiator. Describing the turbulent cooling airflow in the underhood of a vehicle is often the main challenge to describing the heat dissipation, since the radiator performance itself can often be described by a validated similarity theory model considering the air mass flow as input. The measurement of cooling airflow is not trivial: several anemometers exist with different advantages and disadvantages. Turbines are suitable for getting the average airflow of a specific area, though they have a high space requirement and are invasive to a certain degree. More point-wise probes like a pitot pipe can provide more local information on the flow while not being to invasive due to probe size, though they are very sensitive to changes in the local air pressure within the turbulent underhood flow. A method offering a compromise between invasive and only local behavior is based on an energy balance over the radiator walls, as explained in Appendix A.2. This method has the advantages of simple implementation as well as the use of low-cost measurement equipment while offering information on the local distribution of airflow. Compared to the method for overall radiator heat rejection described above, this method requires an assumption for the temperature distribution along the liquid cooling channels. For this study, the latter approach is used, assuming a linearized temperature distribution along the liquid cooling channels, since the coolant is expected to have smaller temperature changes based on the larger heat capacity flow when compared to the cooling air.

2.4. Driving Maneuvers

Different driving maneuvers were carried out within the study: the following analyses of fuel cell and cooling module performance are based on stationary measurements ranging from 25 to 45 °C ambient temperature, 30 to 130 k m / h vehicle speed, and 0 to 25 deg road gradient in order to provoke thermally critical situations at different speeds. Humidity of the ambient air was set to 30% and kept constant during measurements. In order to avoid damage to the fuel cell system, the control strategy of the thermal system as well as the powertrain was not changed for the measurements. Hence, the investigation of steady operation points was a challenge due to the limited control over the system. Stationary operating points were defined as a time window of 20 s , where the change in coolant temperature at the fuel cell outlet was less than 1 K .
Since stationary operating points do not occur in real driving operation, a dynamic hill-climb was also simulated on the roller dynamometer. This is intended to demonstrate realistic vehicle behavior, particularly with regard to energy management. The driving cycle under consideration represents an uphill drive with an elevated ambient temperature, whereby no additional load was assumed apart from a driver weighing 70 k g . The speed–time profile was determined from a simplified in-house vehicle simulation in which a driver model, driving resistance, gradient of the route, e-machine power, and speed limits were considered.

3. Results and Analysis

If the heat rejection at the radiator balances the heat flow from the stack to the cooling water, the condition for a stationary operating temperature of the fuel cell stack is fulfilled. If the inlet temperature of the cooling water at the stack increases due to insufficient heat rejection at the radiator, as shown in Equation (1), the heat transferred from the stack to the cooling water is reduced, and the stack heats up. When the temperature of the fuel cell increases, degradation processes also increase. In order to avoid damage to the fuel cell, the fuel cell control unit reduces the power output of the fuel cell, called thermal derating. In the following, the maximum heat rejection of the HT-radiator as the largest heat sink is described, as well as the influence of ambient conditions on the fuel cell stack acting as the largest heat source within the vehicle system. All error bars presented show the repeatability error based on one standard deviation. The evaluation of thermal derating during a real driving scenario is described in the final subsection.

3.1. Cooling Module

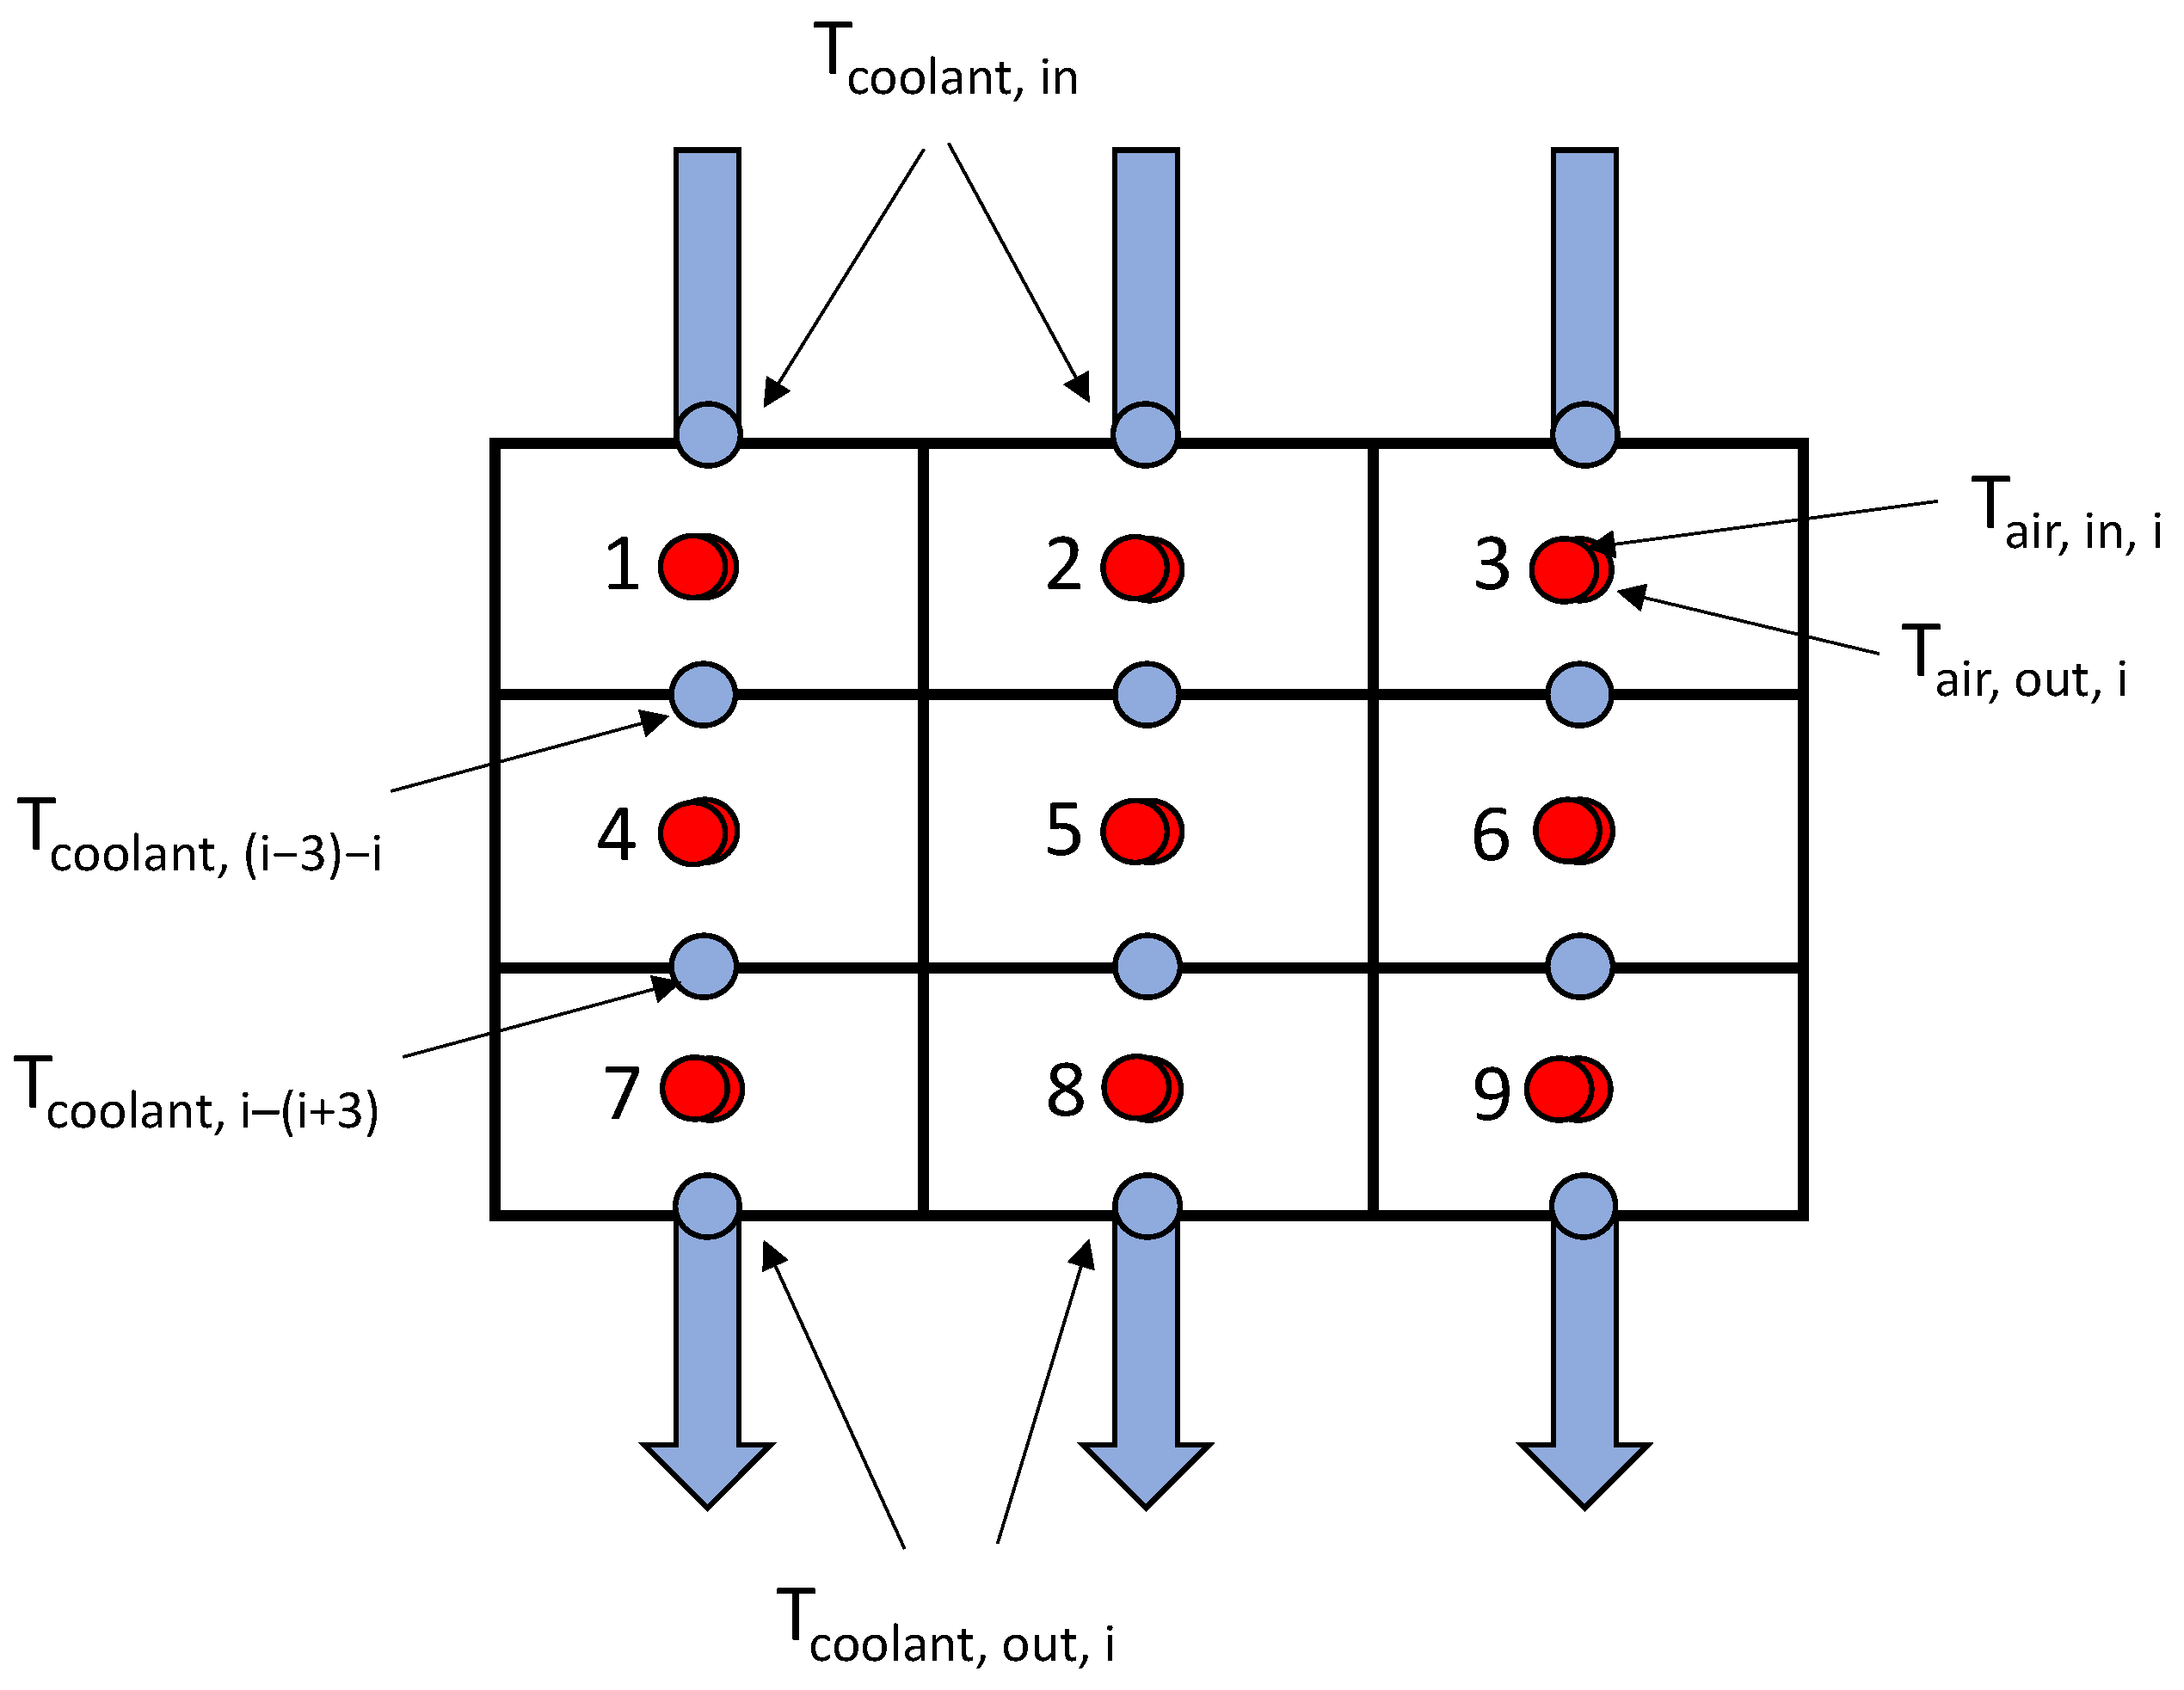
At a stationary operating point, the heat absorbed by the cooling air corresponds to the heat of the fuel cell removed by the coolant. The corresponding energy balance is defined as follows:
Q ˙ H T , r a d = Q ˙ f c , c o o l a n t .
Combining Equations (8) and (9) with Equation (10), it can be seen that due to the lower heat capacity flow of the cooling air, the temperature change in the cooling air is significantly higher than for the liquid coolant, hence reducing the available heat transfer rate at the radiator according to Equation (
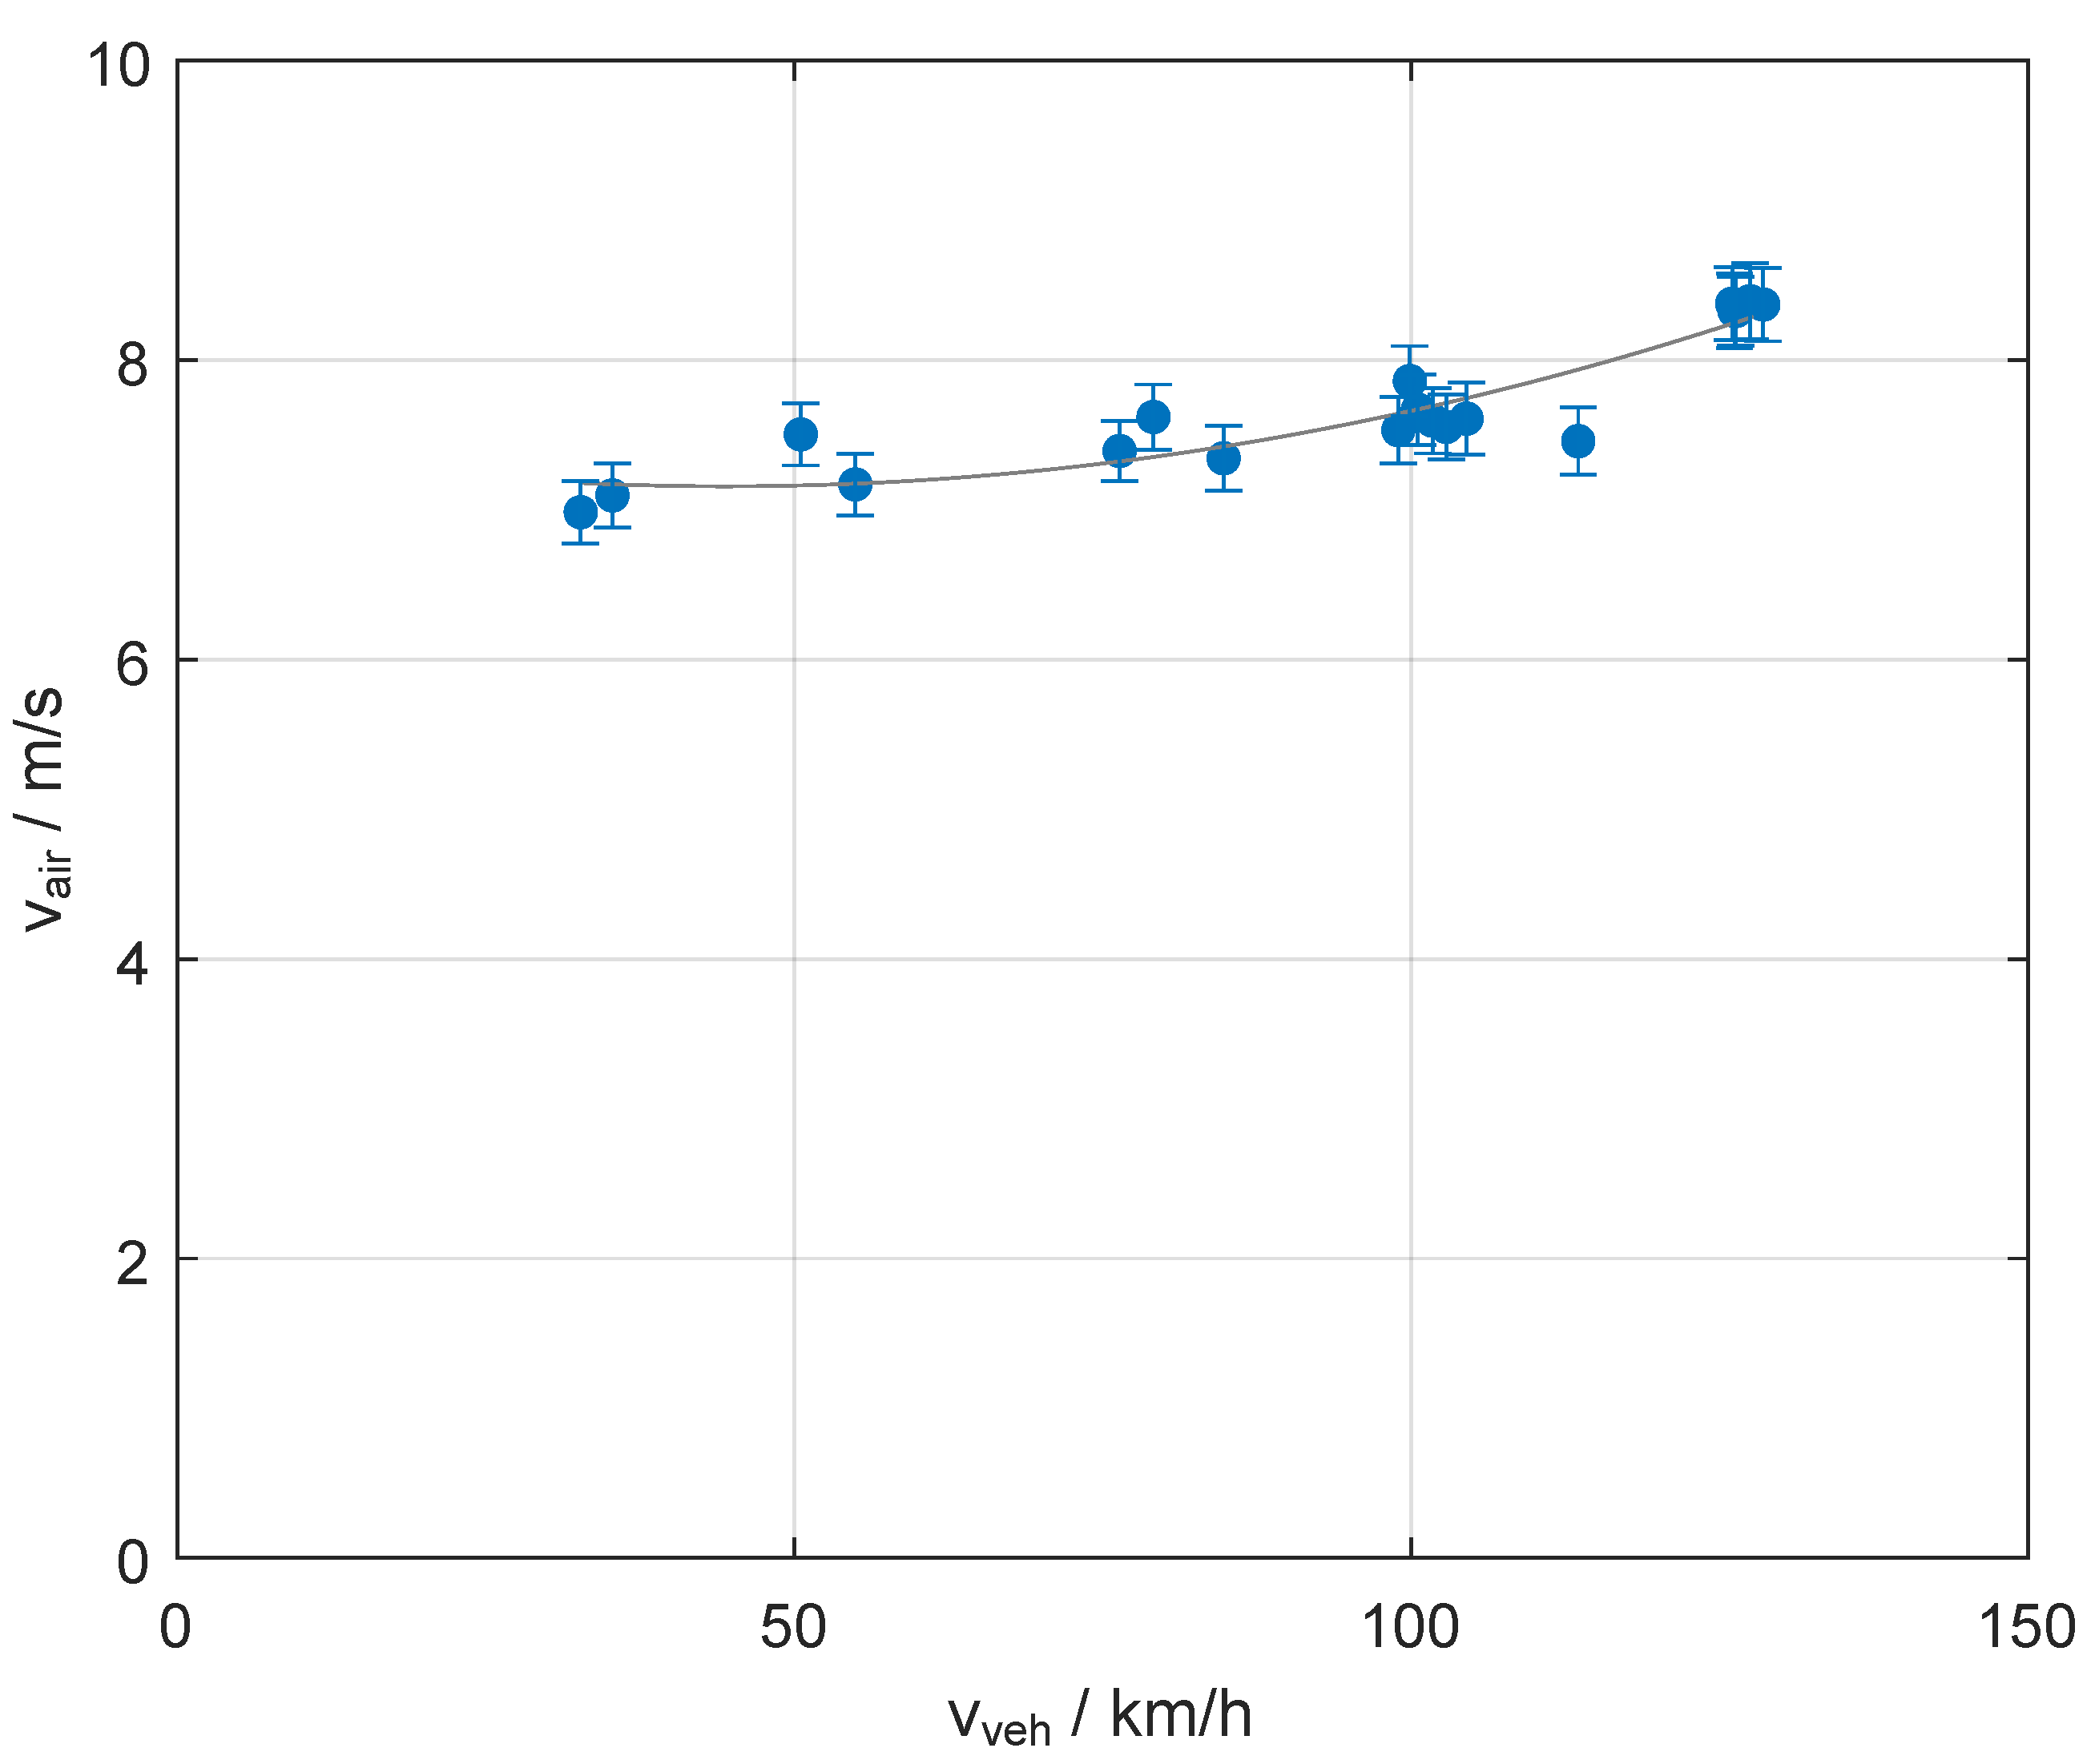
1). The heat capacity flow of the cooling air can be increased by increasing the cooling air velocity through the cooling module. In Figure 3, the mean velocity of the cooling air flowing through the HT-radiator is shown, depending on the vehicle speed. The entire cooling module consists of an LT-radiator, refrigerant condenser, HT-radiator, and two high-voltage cooling fans of 1.73 k W electrical power each.
The two radiator fans were at a maximum speed of 4200 rpm for the operating points presented. The cooling air velocity based on an energy balance at the radiator walls was averaged over a minimum time window of 20 s , for which a constant operating point of the vehicle was observed. Vehicle speeds lower than 30 k m / h were not examined since they are not expected to be critical for the thermal management system, and wind speeds lower than 20 k m / h cannot be provided. Between 30 and 130 k m / h , the dependency of the cooling air velocity from the vehicle speed is expected to be a quadratic relationship. However, the increase in cooling air velocity is very limited with increasing vehicle speed and therefore could also be linearized in the range from 30 to 100 k m / h . This observation is in contradiction with other studies, e.g., from Gilles and Peissner, where the driving speed is expected to largely contribute to the cooling air velocity [32]. The underlying reason for these contrasting observations probably lies in the high-voltage fans, which are expected to have a large influence on the cooling airflow compared to typical 12 V radiator fans with electrical power consumption significantly lower than 1 k W .
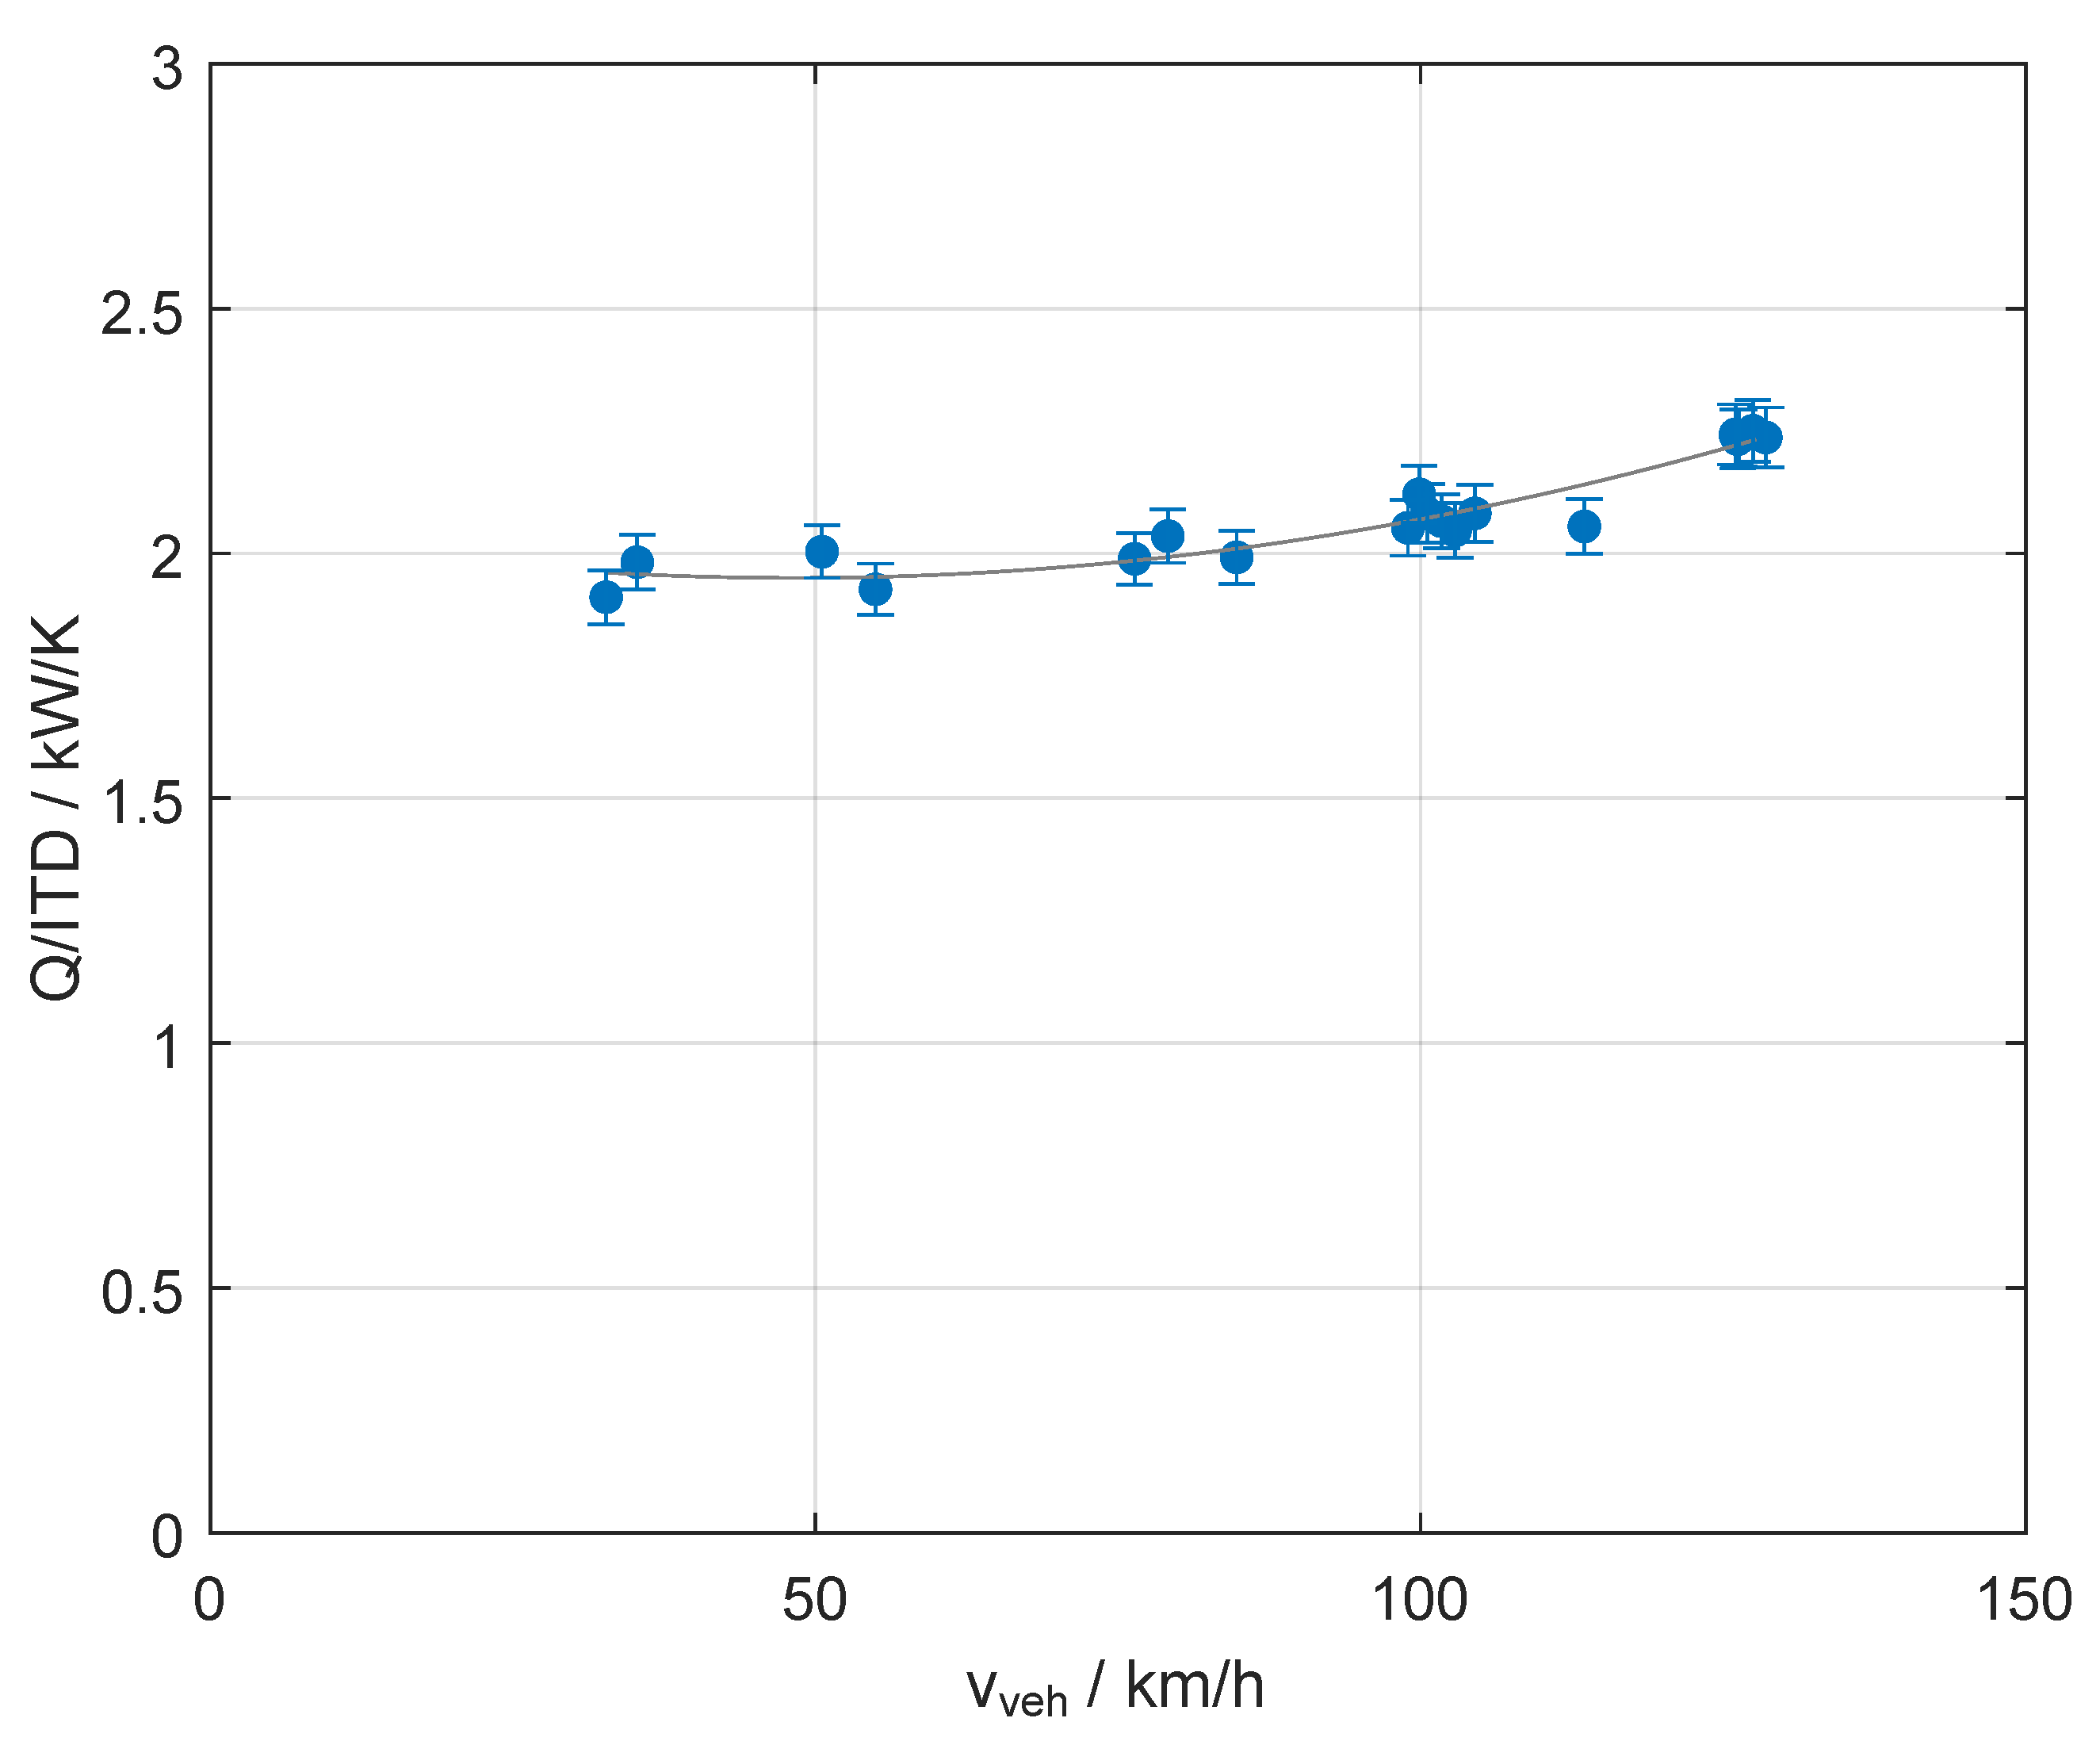
The influence of the predominantly speed-independent cooling airflow is also reflected in the heat rejection of the cooling module in relation to the inlet temperature differential, as shown in Figure 4. Considering ITD allows the maximum heat transferred to the environment to be analyzed independently of ambient temperature and preheating effects by the LT-radiator and condenser. In addition to operation at maximum fan speeds, the operating points shown have been determined at maximum coolant flow to ensure that the maximum heat rejection for each distinct vehicle speed is determined.
Similar to Figure 3, the heat transfer at the radiator is mainly independent from the vehicle speed in a range from 30 to 100 k m / h . For vehicle speeds exceeding 100 k m / h , an increase in heat rejection can be observed. In this operating range, the influence of the driving speed on the cooling airflow also increases. In addition to the findings described above, the results could also be used to validate an underhood flow model as, e.g., a 1D-model described by Navaneeth et al. [42].
Compared to the literature [19], the results shown here indicate that the installation of high-power fans is beneficial in terms of heat rejection over a large range of vehicle speeds with a heat rejection per inlet temperature differential of approximately 2 k W / K . The installation of even more powerful fans might additionally increase the cooling capability, though the higher cost of fans as well as nonlinear flow resistances should be considered for this decision.
The results found can also help to predict the system behavior in driving conditions not investigated in this paper. In stop-and-go traffic, for example, the cooling air volume flow must be provided by the fans alone due to the low vehicle speed. If one extrapolates a constant value of around 2 k W / K for low speeds to standstill, the air inlet temperature could rise to 60 °C without causing the stack to heat up when assuming a heat production lower than 10 k W for idle power and a stack outlet temperature of 65 °C.

3.2. Fuel Cell System

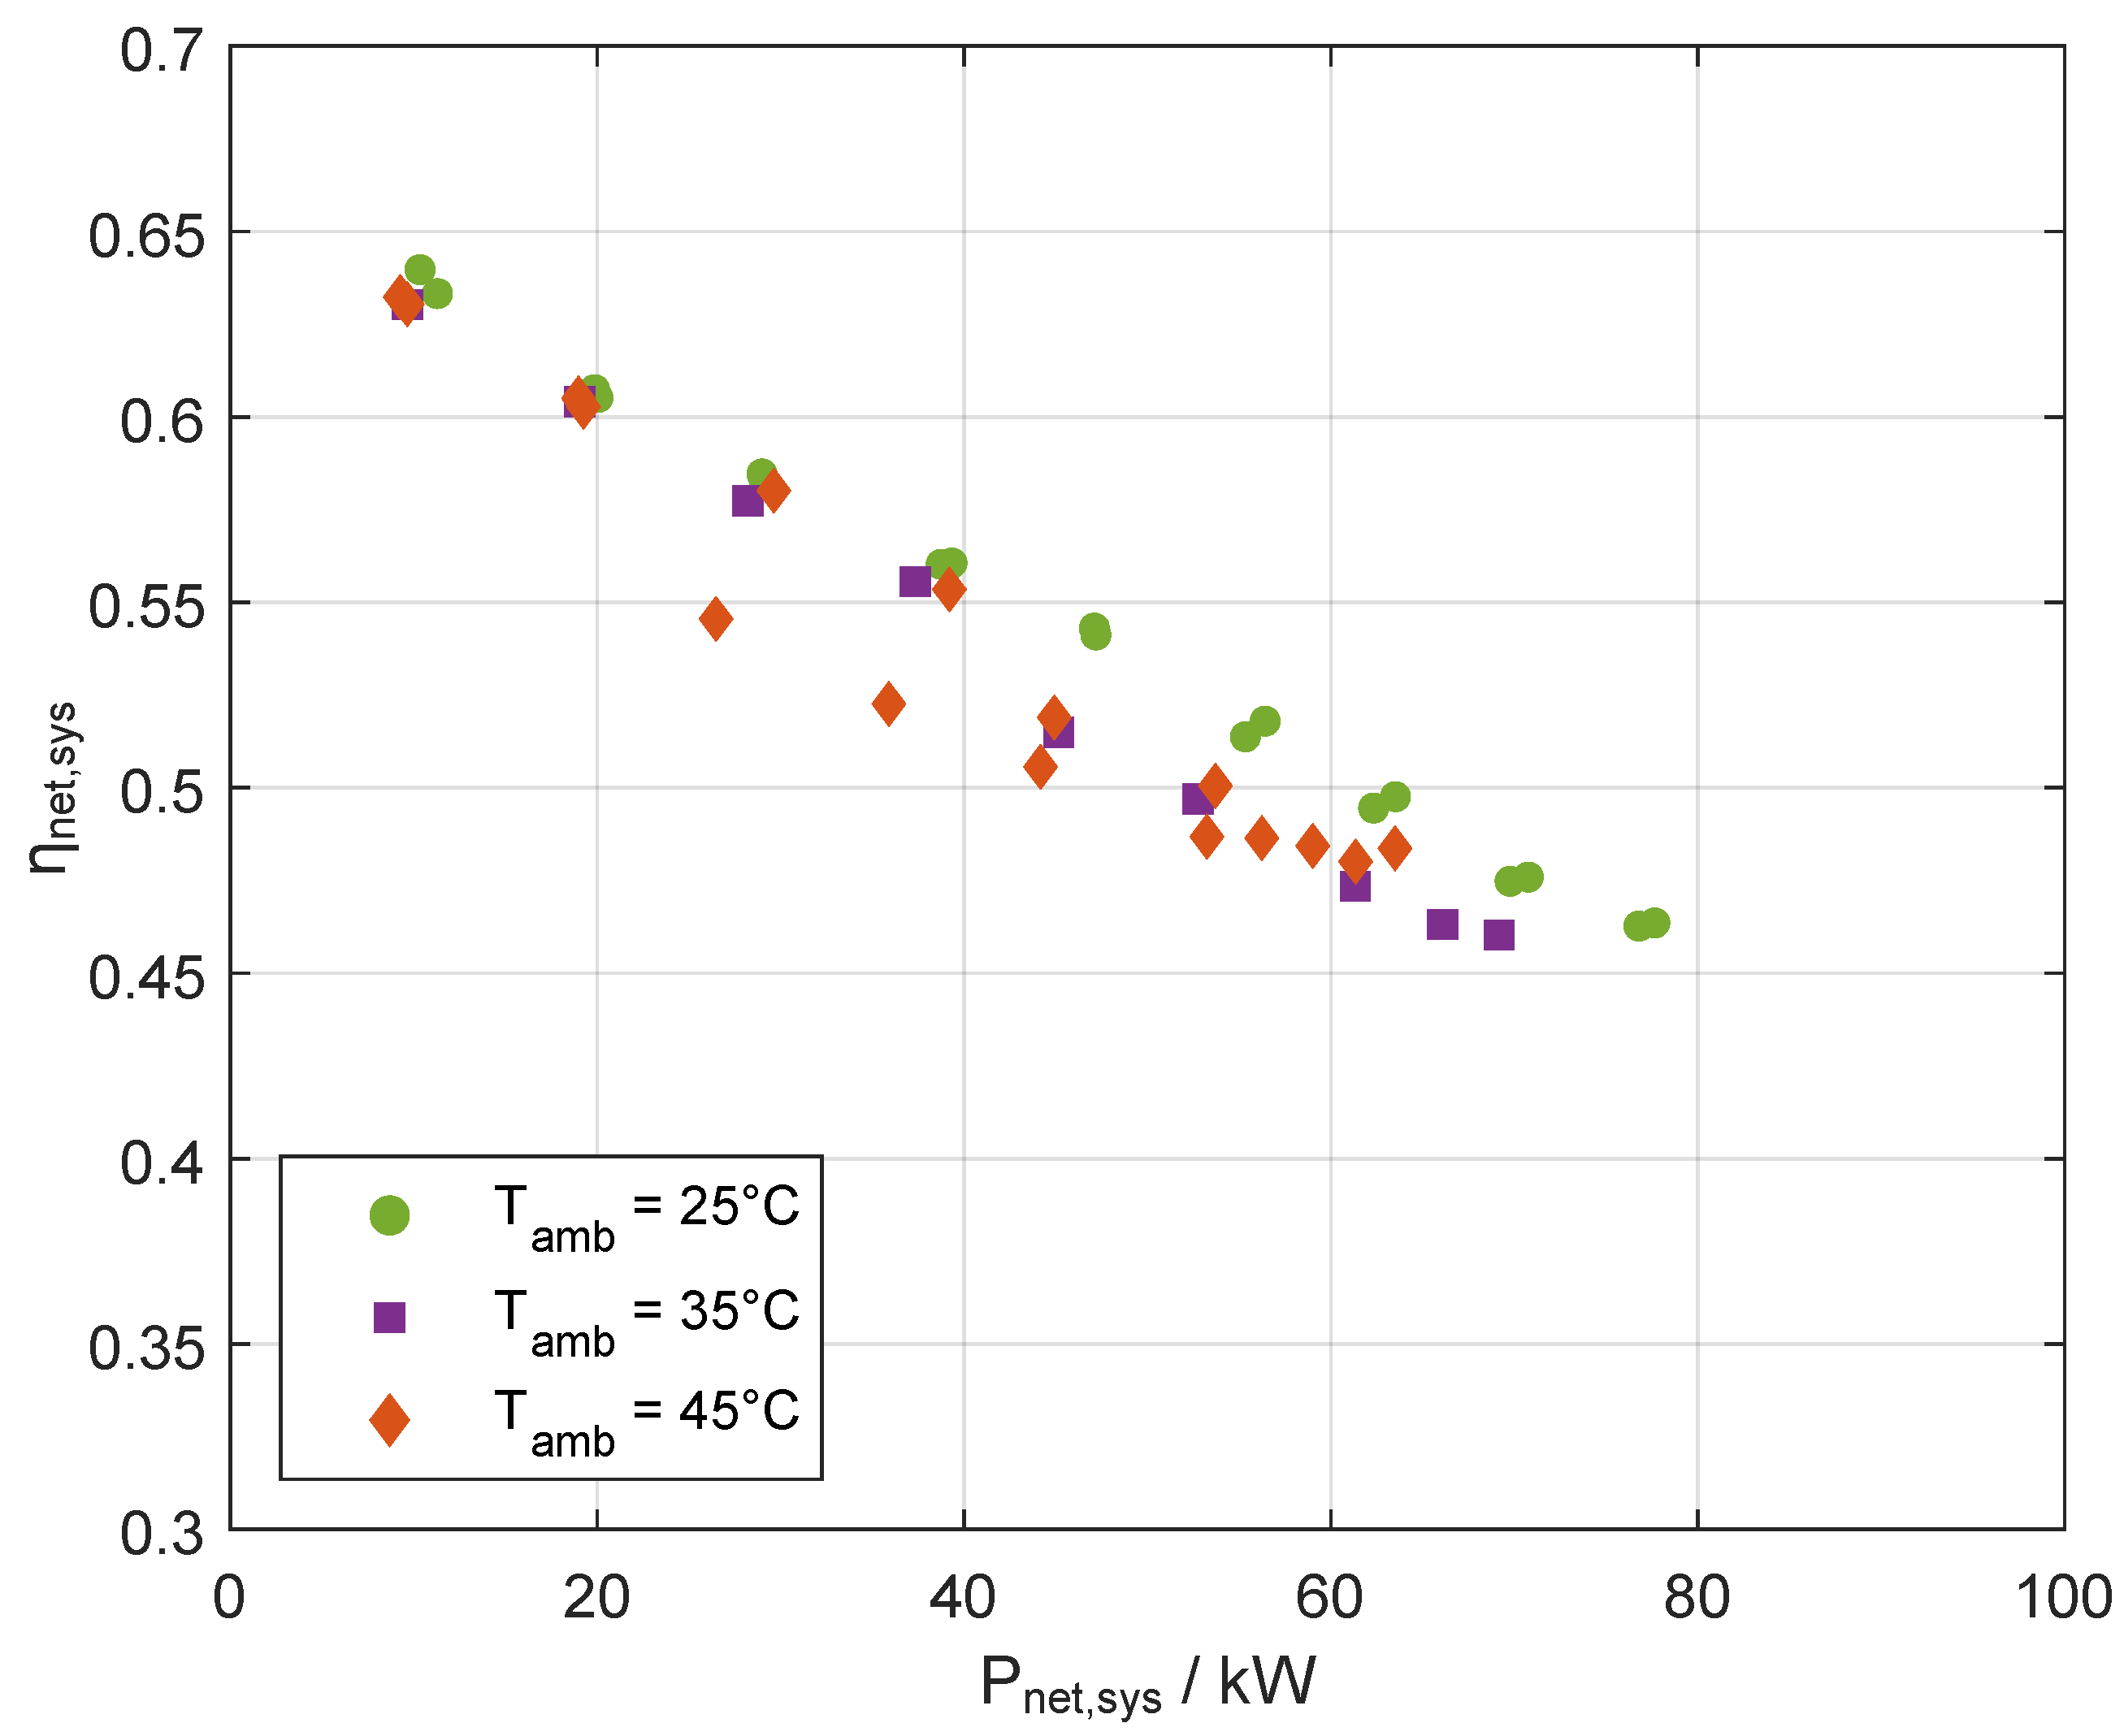
In the following, the fuel cell stack is examined, as it is the largest heat source of the thermal management system of an FCEV. In Figure 5, the system efficiency, as defined in Equation (6), dependent on the ambient temperature, is plotted against the net electrical power output of the system.
An effect of the ambient temperature can be observed, though a clear trend with increasing ambient temperatures is not recognizable. An ambient air temperature of 25 °C seems to be best in terms of efficiency over the whole range, indicating that higher temperatures than that are not beneficial for fuel consumption. In general, efficiency differences up to 5% occur. The differences observed result from the power consumption of the EAC and the components of the HT cooling system: at high ambient temperatures, the air density and thus the mass flow conveyed by the EAC decreases. However, in order to supply the cathode side of the reaction layer with sufficient air for the reaction, the EAC must be operated at a higher load operating point, which leads to higher auxiliary consumption in the fuel cell system. On the other hand, the coolant temperature increases with increasing ambient temperature, resulting in the multi-level controllers demanding higher electrical power consumption of cooling pump P p u m p and fans P f a n s in order to increase heat transfer. According to Equation (5), the power of BoP P B o P increases, resulting in a lower system efficiency. System efficiencies can therefore only be inadequately described by a single characteristic curve, especially during dynamic operation and under changing ambient conditions.
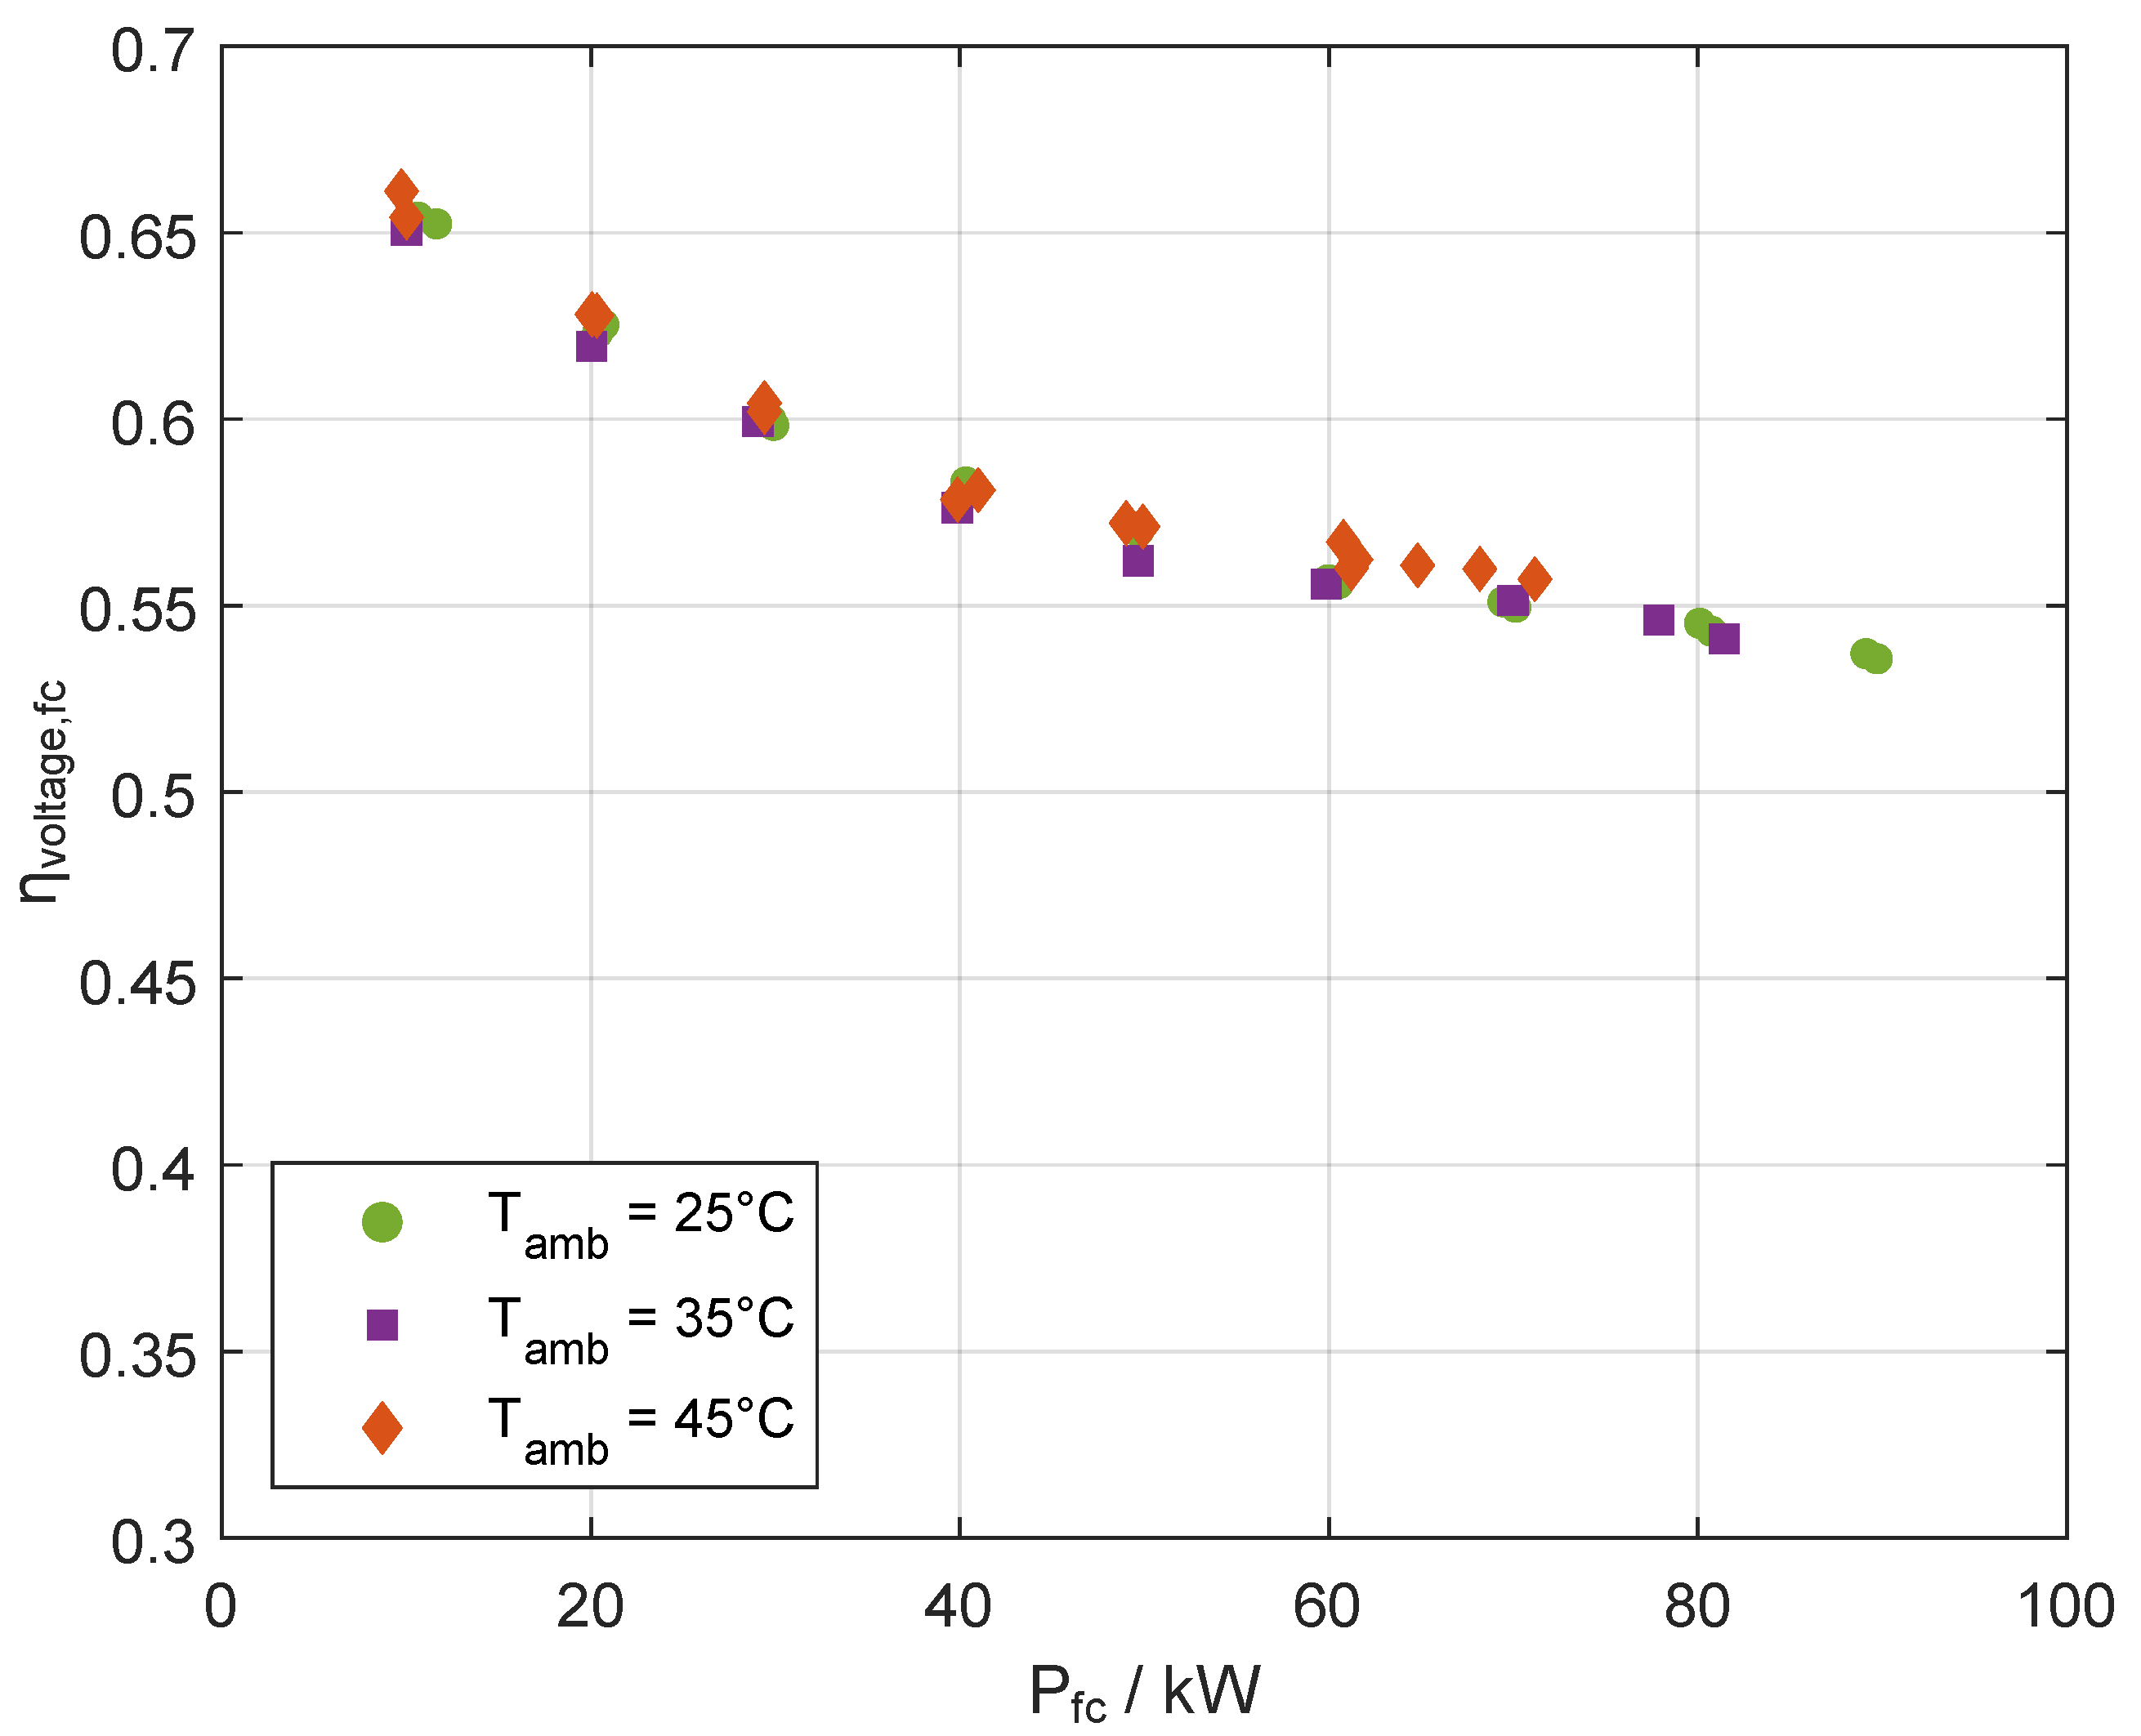
The voltage efficiency of the stack depending on the stack power is shown in Figure 6 for the different ambient temperatures as well in a similar presentation as in Figure 5. In contrast to the effects on system efficiency, it can be seen that a single characteristic curve is formed across the stationary points examined, regardless of the ambient temperature. This indicates that the BoP components are capable of delivering the same inlet conditions for the stack within the observed high ambient temperature conditions resulting in differences in stack efficiency with less that 1.5%. Humidification of the membranes of the single fuel cells seems to be of no concern for the observed operating points. Additionally, the maximum electrical power output could not be maintained constant for higher ambient temperatures. This implies a connection between ambient temperature and derating of the fuel cell, resulting in a maximum of 72 k W electrical power output at 45 °C ambient air temperature.
Since the efficiencies shown in Figure 5 and 
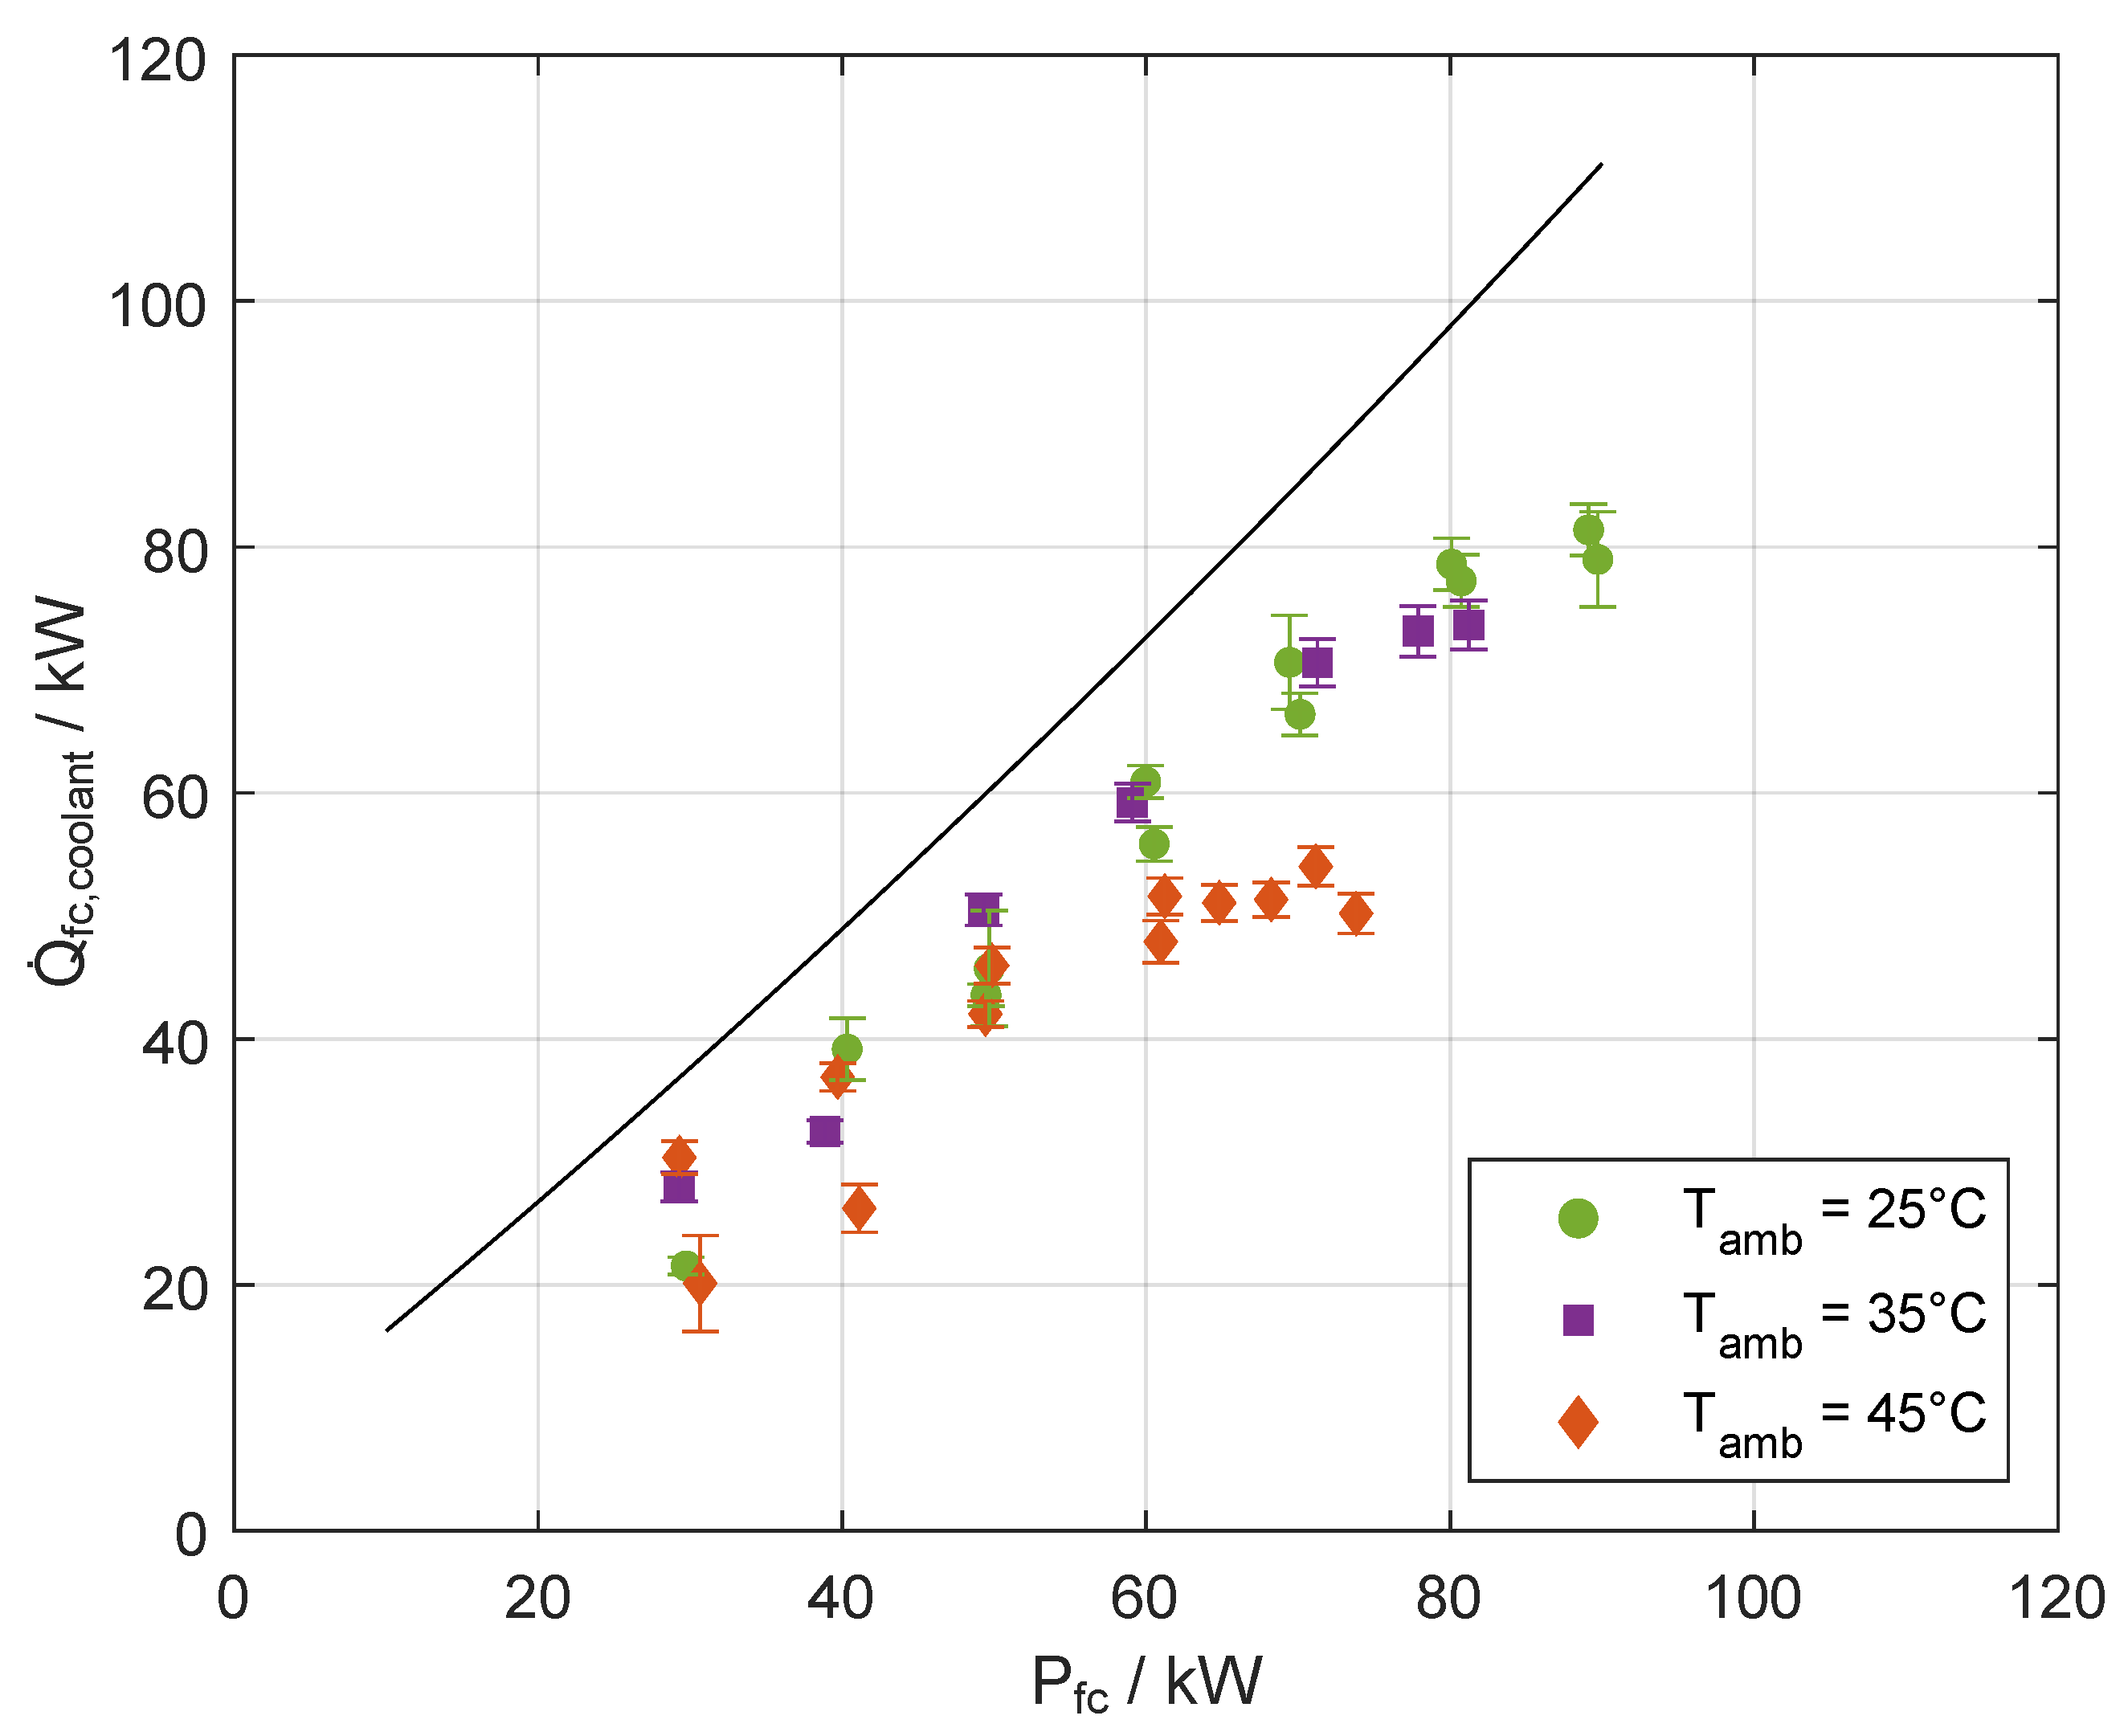
Figure 6 are based on the lower heating value (LHV), the overall heat production and the heat transferred to the HT cooling system cannot be derived directly from the presented data. In order to describe the absolute heat produced as well as the proportion dissipated by the HT cooling circuit, the actual heat transferred from the stack to the coolant is shown in Figure 7 together with the theoretical maximum heat produced within the stack. Related data are given in Appendix A.3.
The theoretical maximum is based on the maximum electrical current flow observed dependent on fuel cell stack power and the higher heating value (HHV) of hydrogen, as described in Equation (11):
Q ˙ f c , c o o l a n t , m a x = I f c , m a x U H H V n c e l l s P f c .
where U H H V is the equivalent potential of a single cell corresponding to the HHV and n c e l l s = 436 is the number of active fuel cells within the stack. It is assumed that all product water is liquid so that the entire energy stored in the chemical connection of the hydrogen molecule could be released as heat to the cooling system. No heat loss through heat sinks other than the cooling channels within the stack is presumed for the theoretical limit value. The actual heat transferred to the coolant is determined using Equation (8). Since the coolant volume flow for some operating points with stack power lower than 40 k W were not in the range of the volume flow sensor, the corresponding heat flows could not be reliably determined.
As expected, the observed heat flows to the coolant are lower than the theoretical maximum of the generated heat. However, it was shown in Figure 6 that the stack efficiency—and therefore stack heat production—is independent of the ambient temperature and stack power output, as the heat flow from the stack to the coolant is scattered: the further the observed operating points are below the theoretical maximum, the more heat is dissipated by other cooling mechanisms within the stack, e.g., by evaporation of water within the stack or increase of cathode air enthalpy along the flow path. Heat transfer up to 80 k W was observed for stack power close to 90 k W .
Summarizing the results above, a significant effect of ambient temperature on the fuel cell system efficiency was found, though the ambient temperature has no significant effect on the stack efficiency between 25 and 45 °C, probably due to significant humidification of the cell membranes within the stack. The results found here can help in modeling a FCEV with a thermal management system by indicating that for the temperature ranges observed, the use of a blackbox model for stack efficiency is sufficient, though the power consumption of the BoP components have to be modeled dependent on the ambient air temperature.

3.3. Thermal Derating

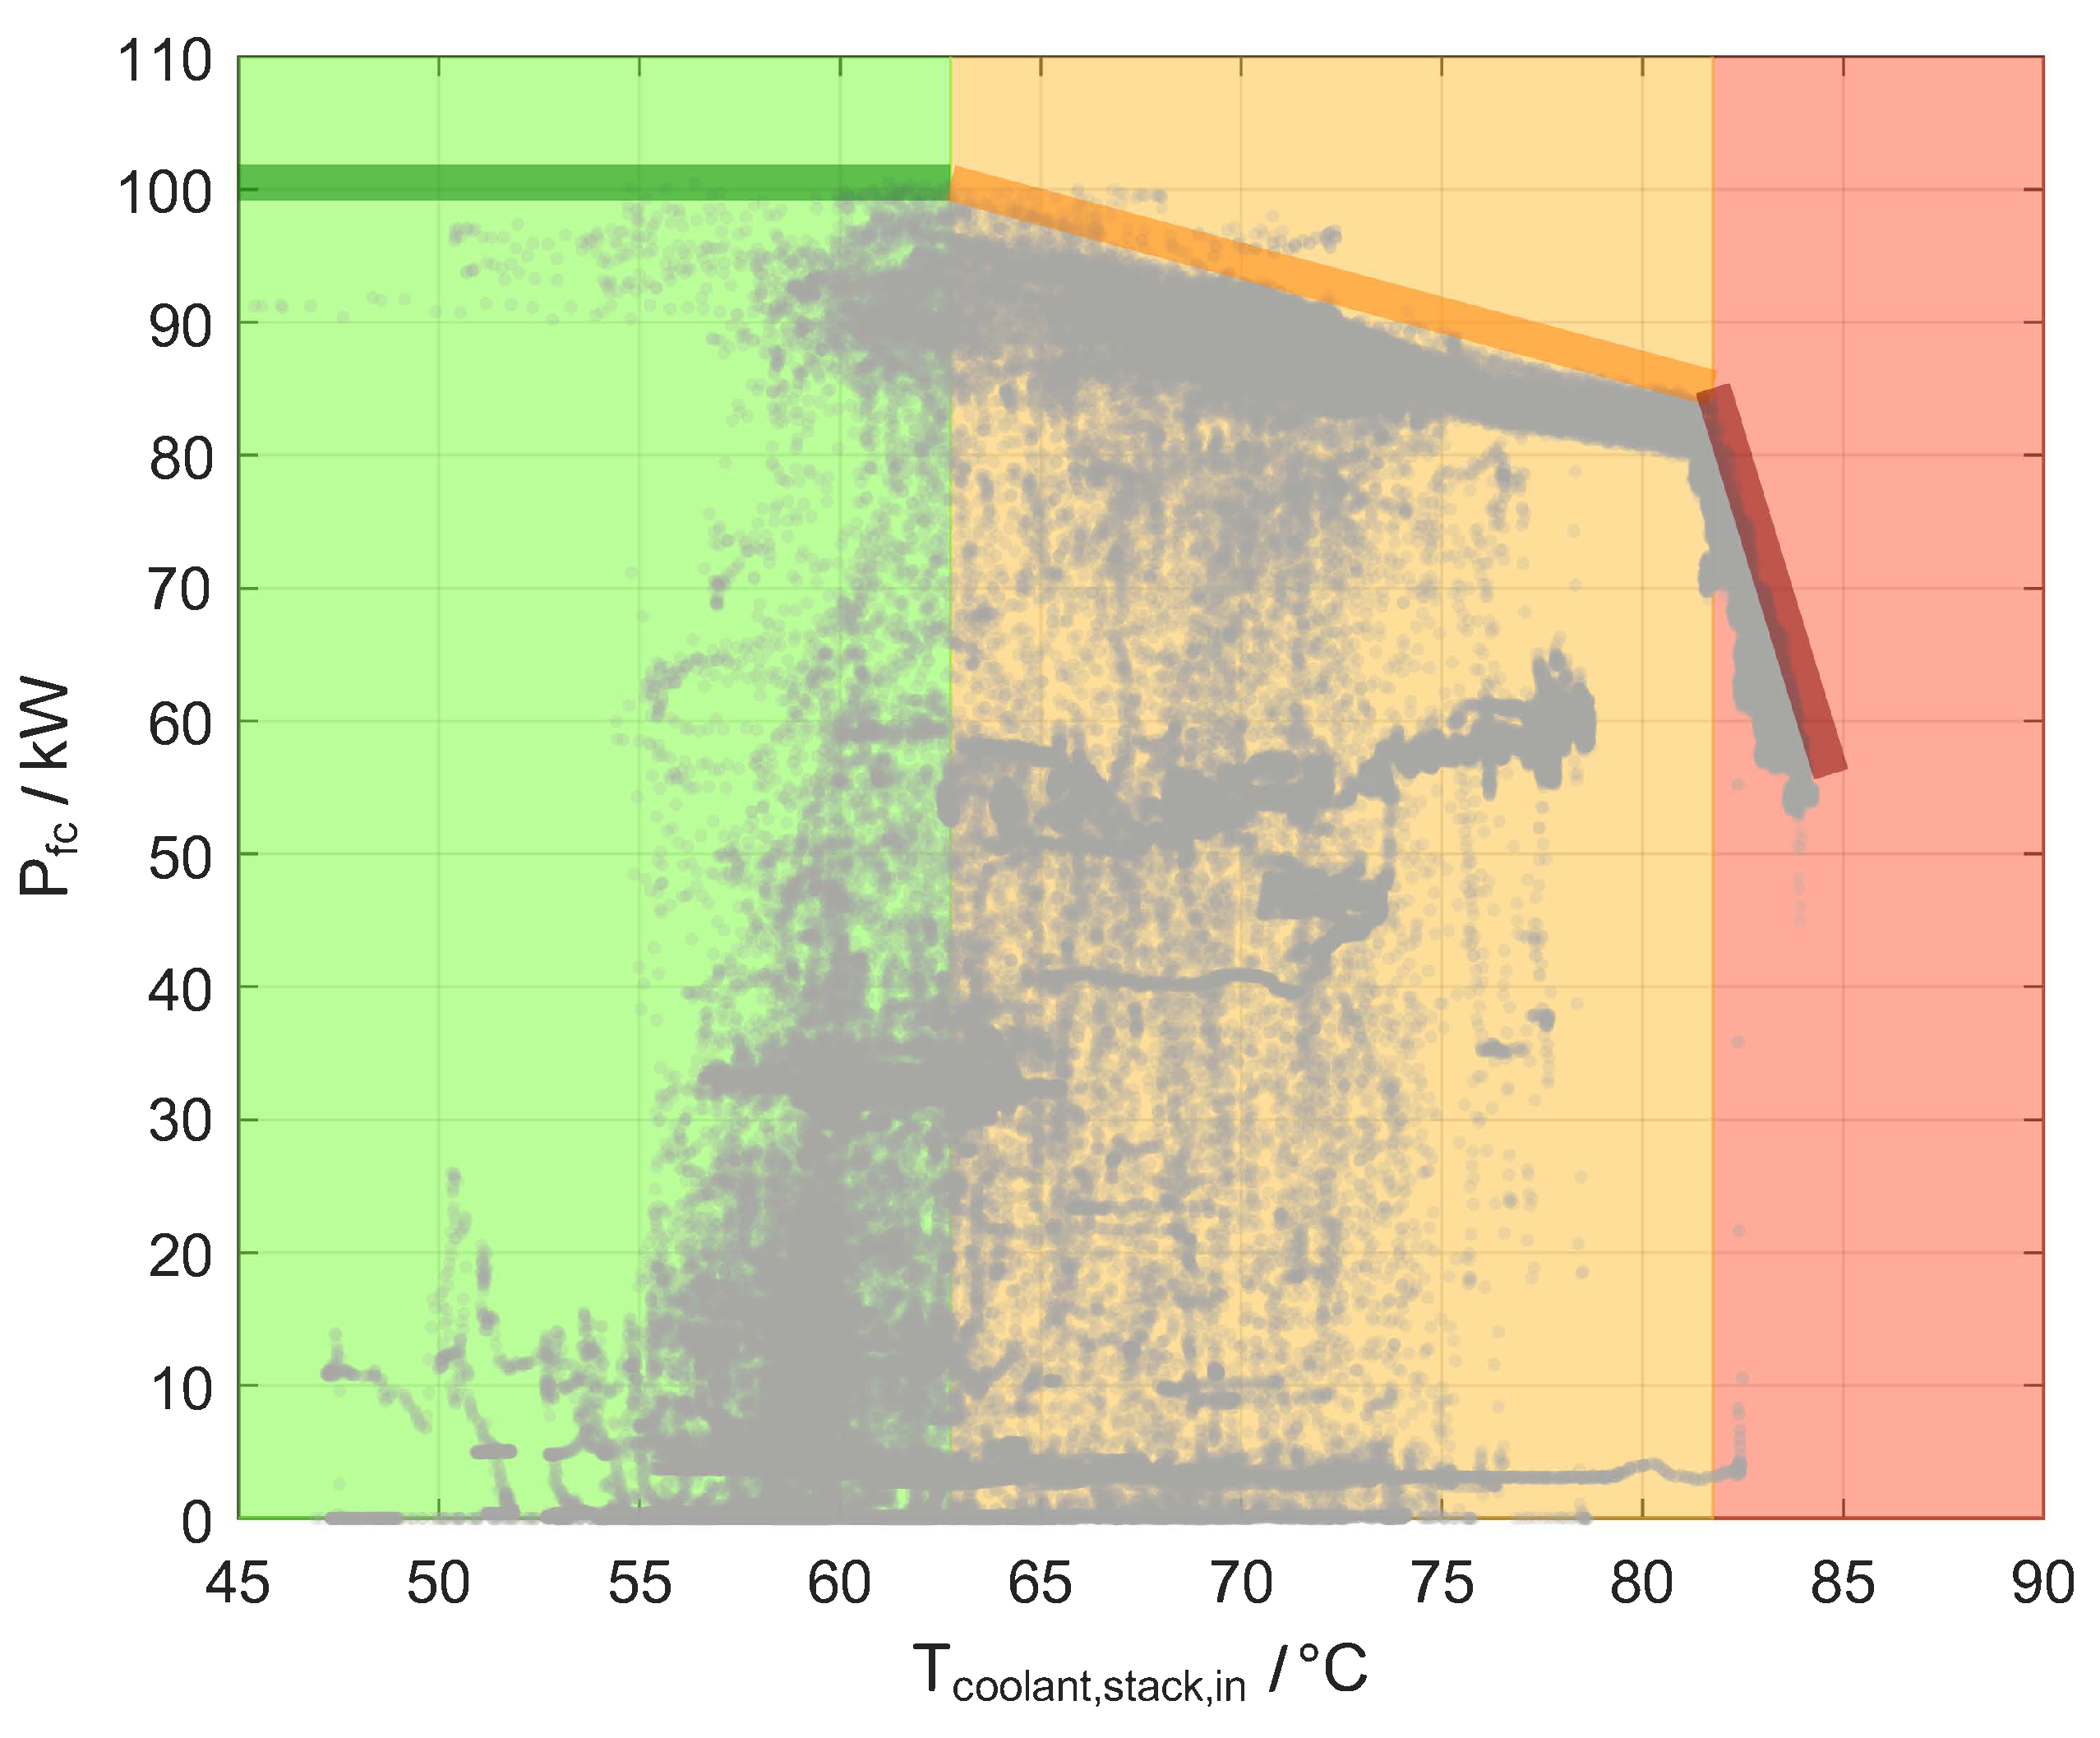
If the waste heat from the fuel cell exceeds the heat that can be dissipated from the vehicle radiator, the thermal masses of the cooling system, such as the coolant, heat up. As a result, the coolant enters the stack at a higher temperature, and the coolant can dissipate less heat from the reactive catalyst layer due to the low temperature difference to the solid components of the cells, assuming that the massflow of the coolant cannot be increased any further. The coolant temperature at the stack inlet is therefore a relevant parameter to control overheating of the stack. In Figure 8, the coolant temperature at the stack inlet is shown over the operating points of the fuel cell, represented by the gross stack power for all stationary and dynamic measurements performed.
For some operating points, the stack power can overcome the rated power of 95 k W but never exceed 100 k W . It can be seen that no operating points fall within the area of high fuel cell outputs with simultaneously high inlet temperatures. This indicates that the control unit intervenes to reduce the current density and thus the waste heat if the stack overheats. In addition, two boundary lines can be identified at the boundary between the operating area and the area to be avoided. These boundary lines can be used to identify three temperature ranges: in the green marked range of up to 62.75 °C, the maximum stack power is available. In the orange marked range from 62.75 °C to 81.75 °C, there is a moderate reduction in fuel cell power. The maximum power of the stack is no longer permanently available. in the red marked range from an inlet temperature of 81.75 °C, massive thermal derating can be observed. The illustration reveals that thermal derating is taken into account in the operating strategy of the vehicle.
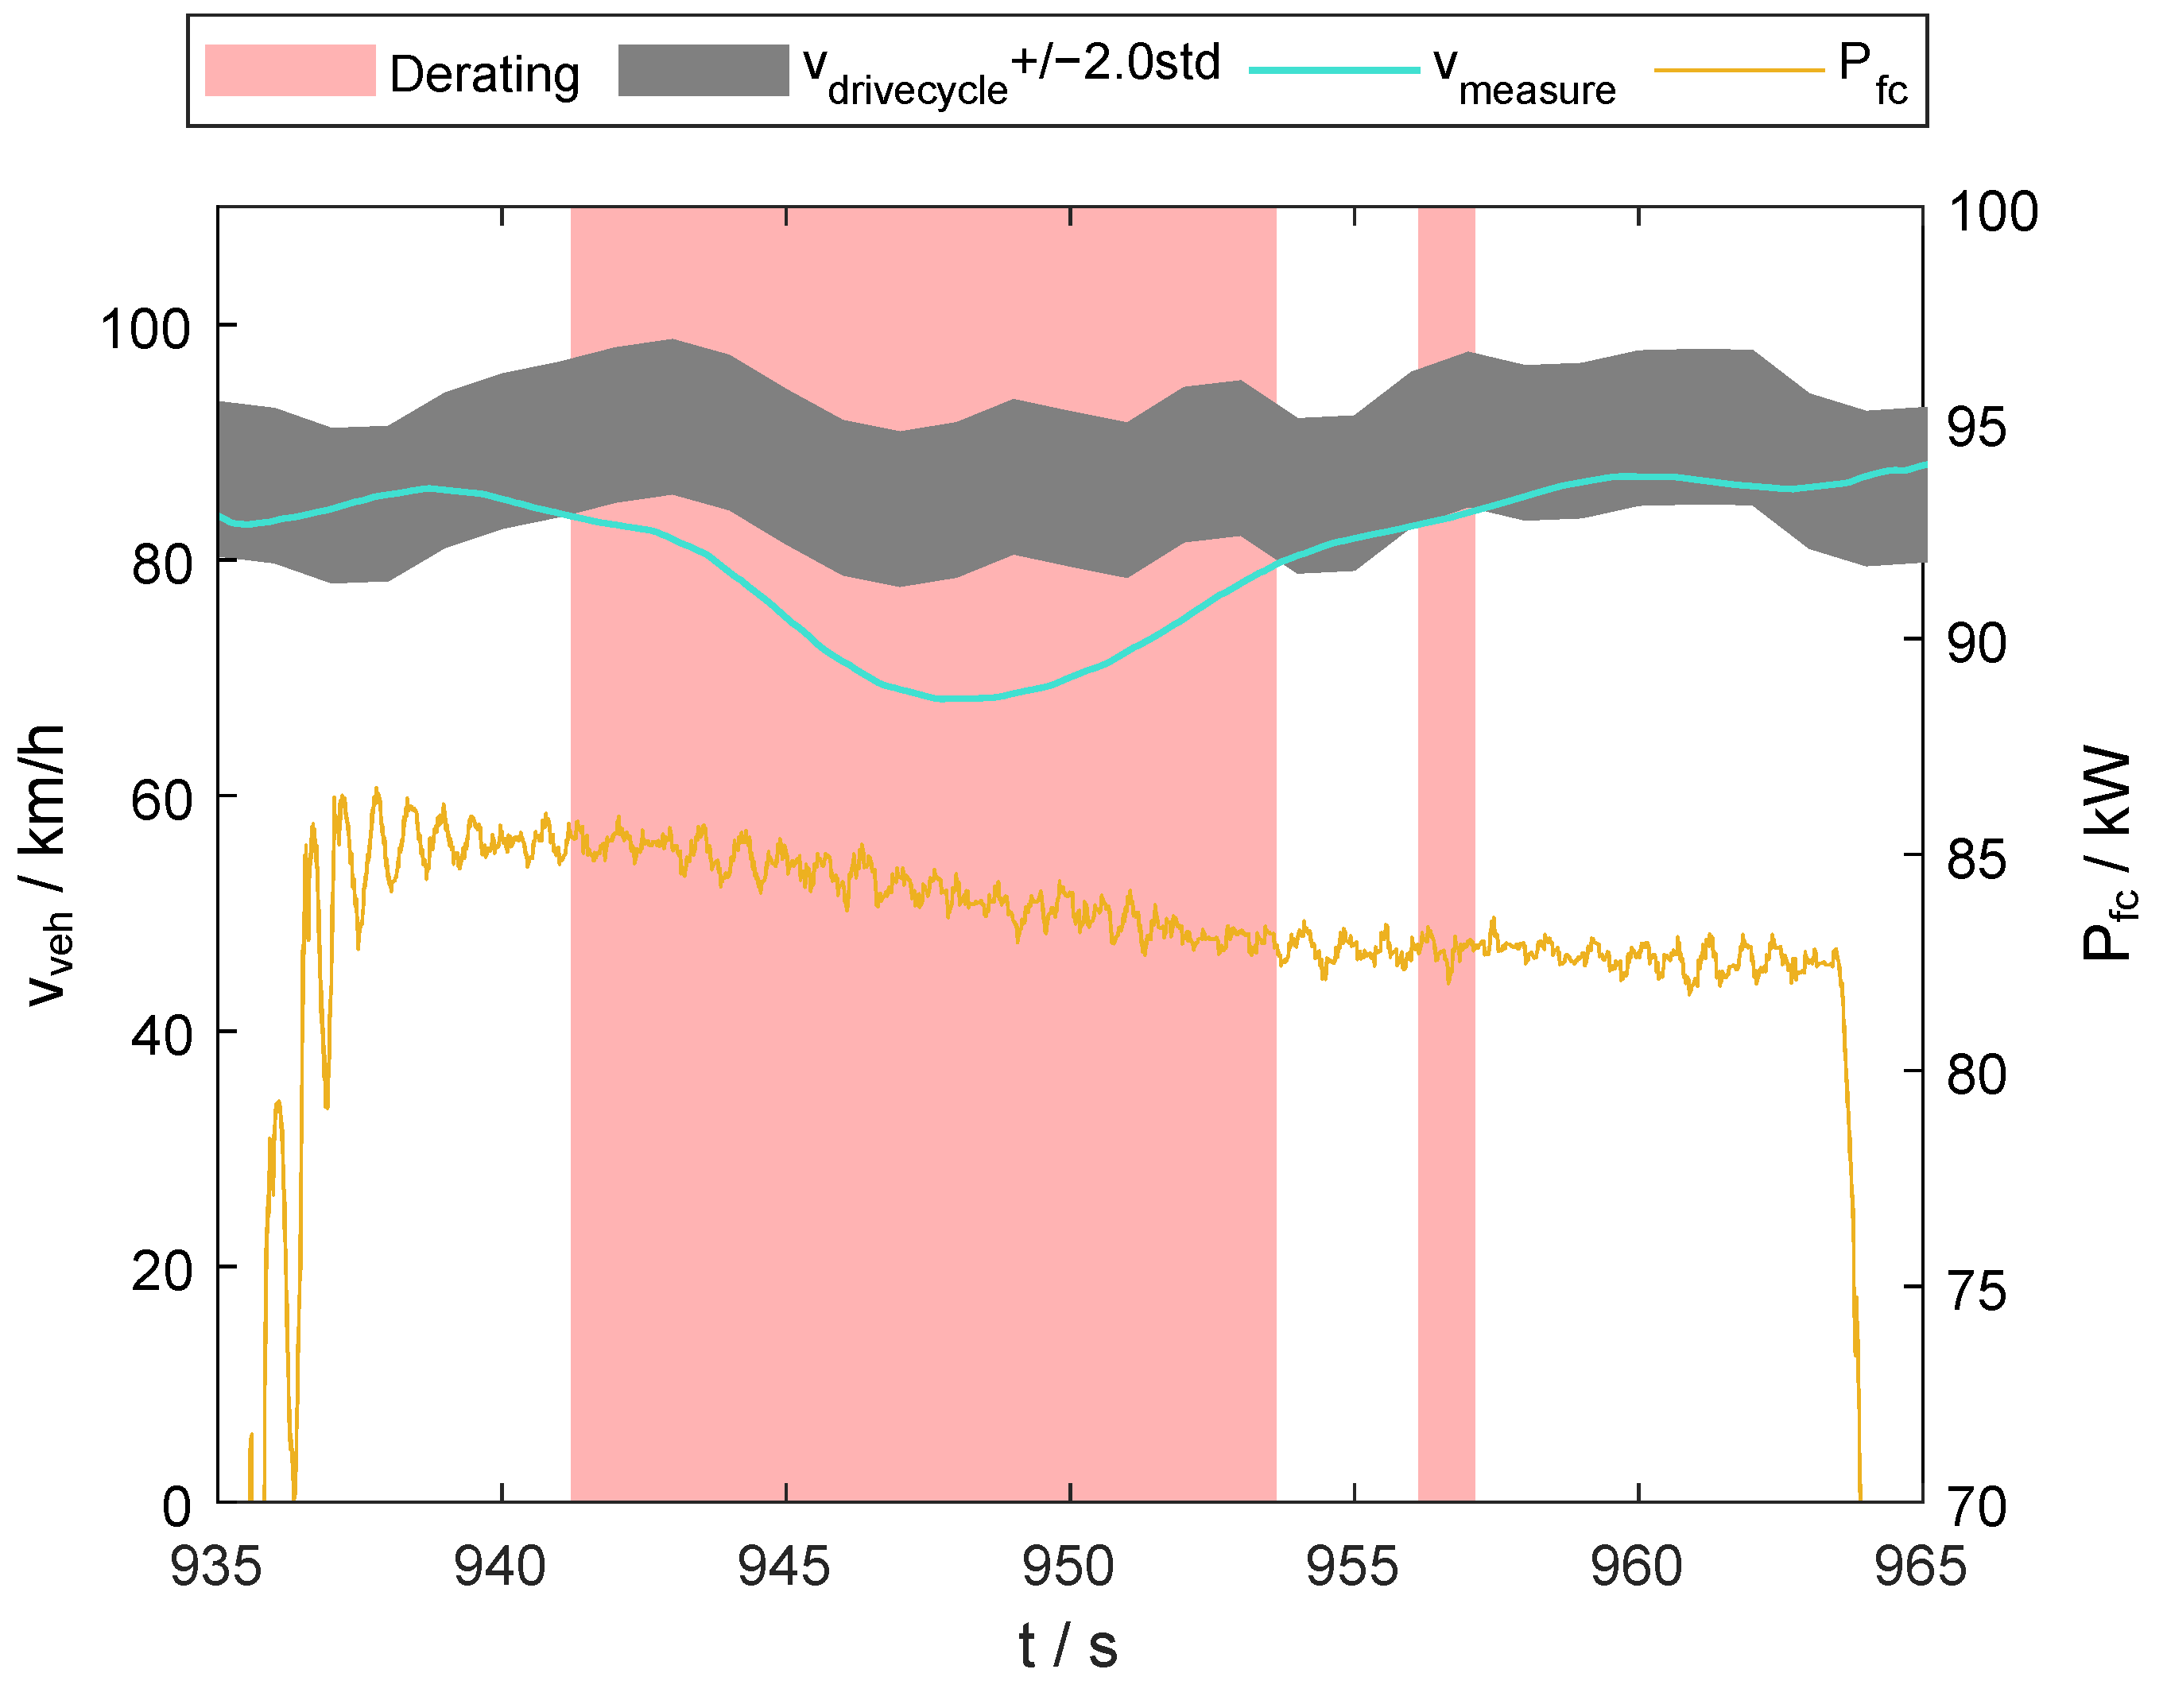
The effect of thermal derating on vehicle speed will be investigated below, as vehicle speed, together with acceleration, is the quantity most likely to be perceived by the driver. For this purpose, a real hill climb was followed on the chassis dynamometer at an average ambient temperature of 40.85 °C with only the weight of 70 kg of the driver as an additional load. Due to the measurement setup including a human driver, there are deviations between the target speed from the simulation v d r i v e c y c l e and the actual speed during the roller dynamometer test v m e a s u r e . In order to clearly separate thermal derating from this influence, the standard deviation between the target speed v d r i v e c y c l e and the measured speed v m e a s u r e was determined as a reference. The areas in which the measured speed was 2.0 standard deviations below the target speed—therefore representing a significantly greater deviation than the typical error caused by the driver—were assigned to thermal derating, as shown in Figure 9.
In addition, the ranges were compared with the fuel cell power in order to be able to attribute the reduction in speed directly to the reduction or limitation of the fuel cell power and thus rule out other causes. At the selected time period in Figure 9, it can also be seen that a short period between two areas marked with derating was not reliably recognized as derating, although the fuel cell power was limited. Reducing the threshold from 2.0 to 1.2 standard deviations, for example, could remedy this situation, but this would result in more errors originating from the driver being recognized as derating. Therefore, 2.0 standard deviations were set as the threshold value, as all events could be clearly assigned to thermal derating. The following considerations are therefore best-case considerations.
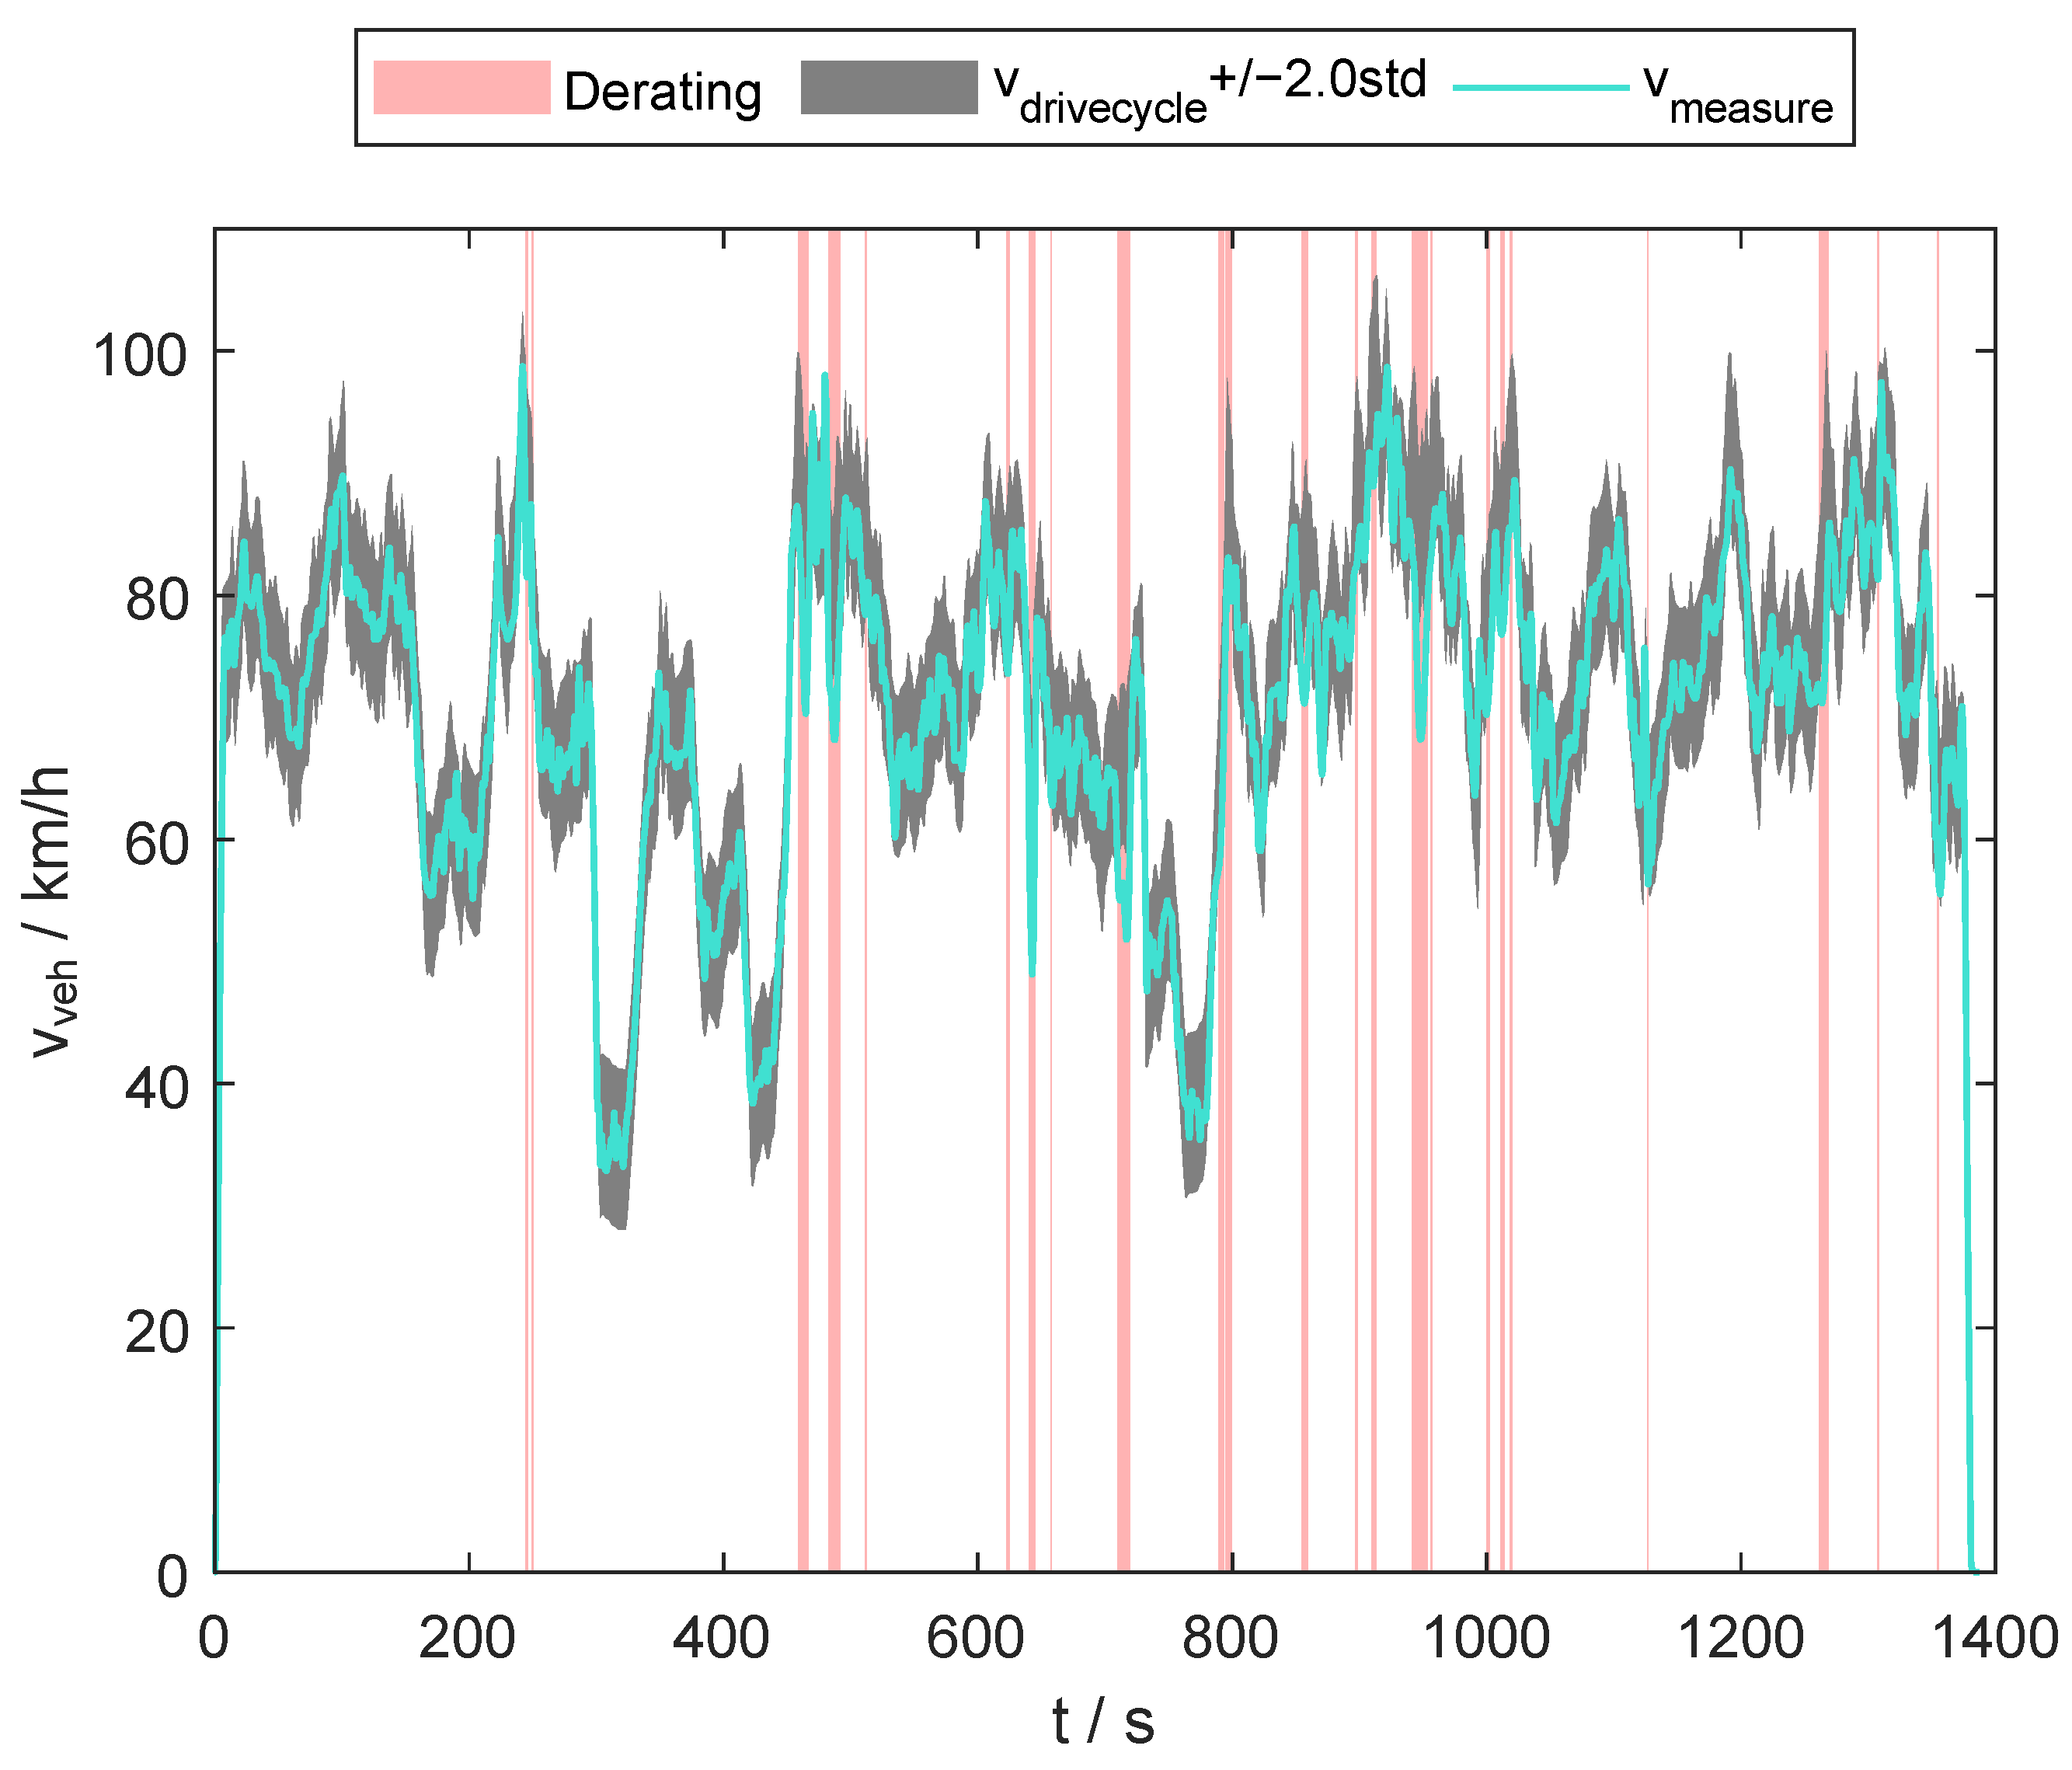
In Figure 10, the derating events are shown for the whole uphill climb.
It can be seen that there are a few derating events in the beginning when the coolant temperature is not already heated up. Derating often occurs at points where the vehicle has to accelerate out of a low speed hairpin bend on a serpentine road. With a journey time of 1382 s , the vehicle was 94.9 s in thermal derating, equivalent to 6.3% of the time. The average driving speed during the 27.61 k m long trip was 69.5 k m / h , which is a reduction of 3.4% compared to the target of 71.9 k m / h .
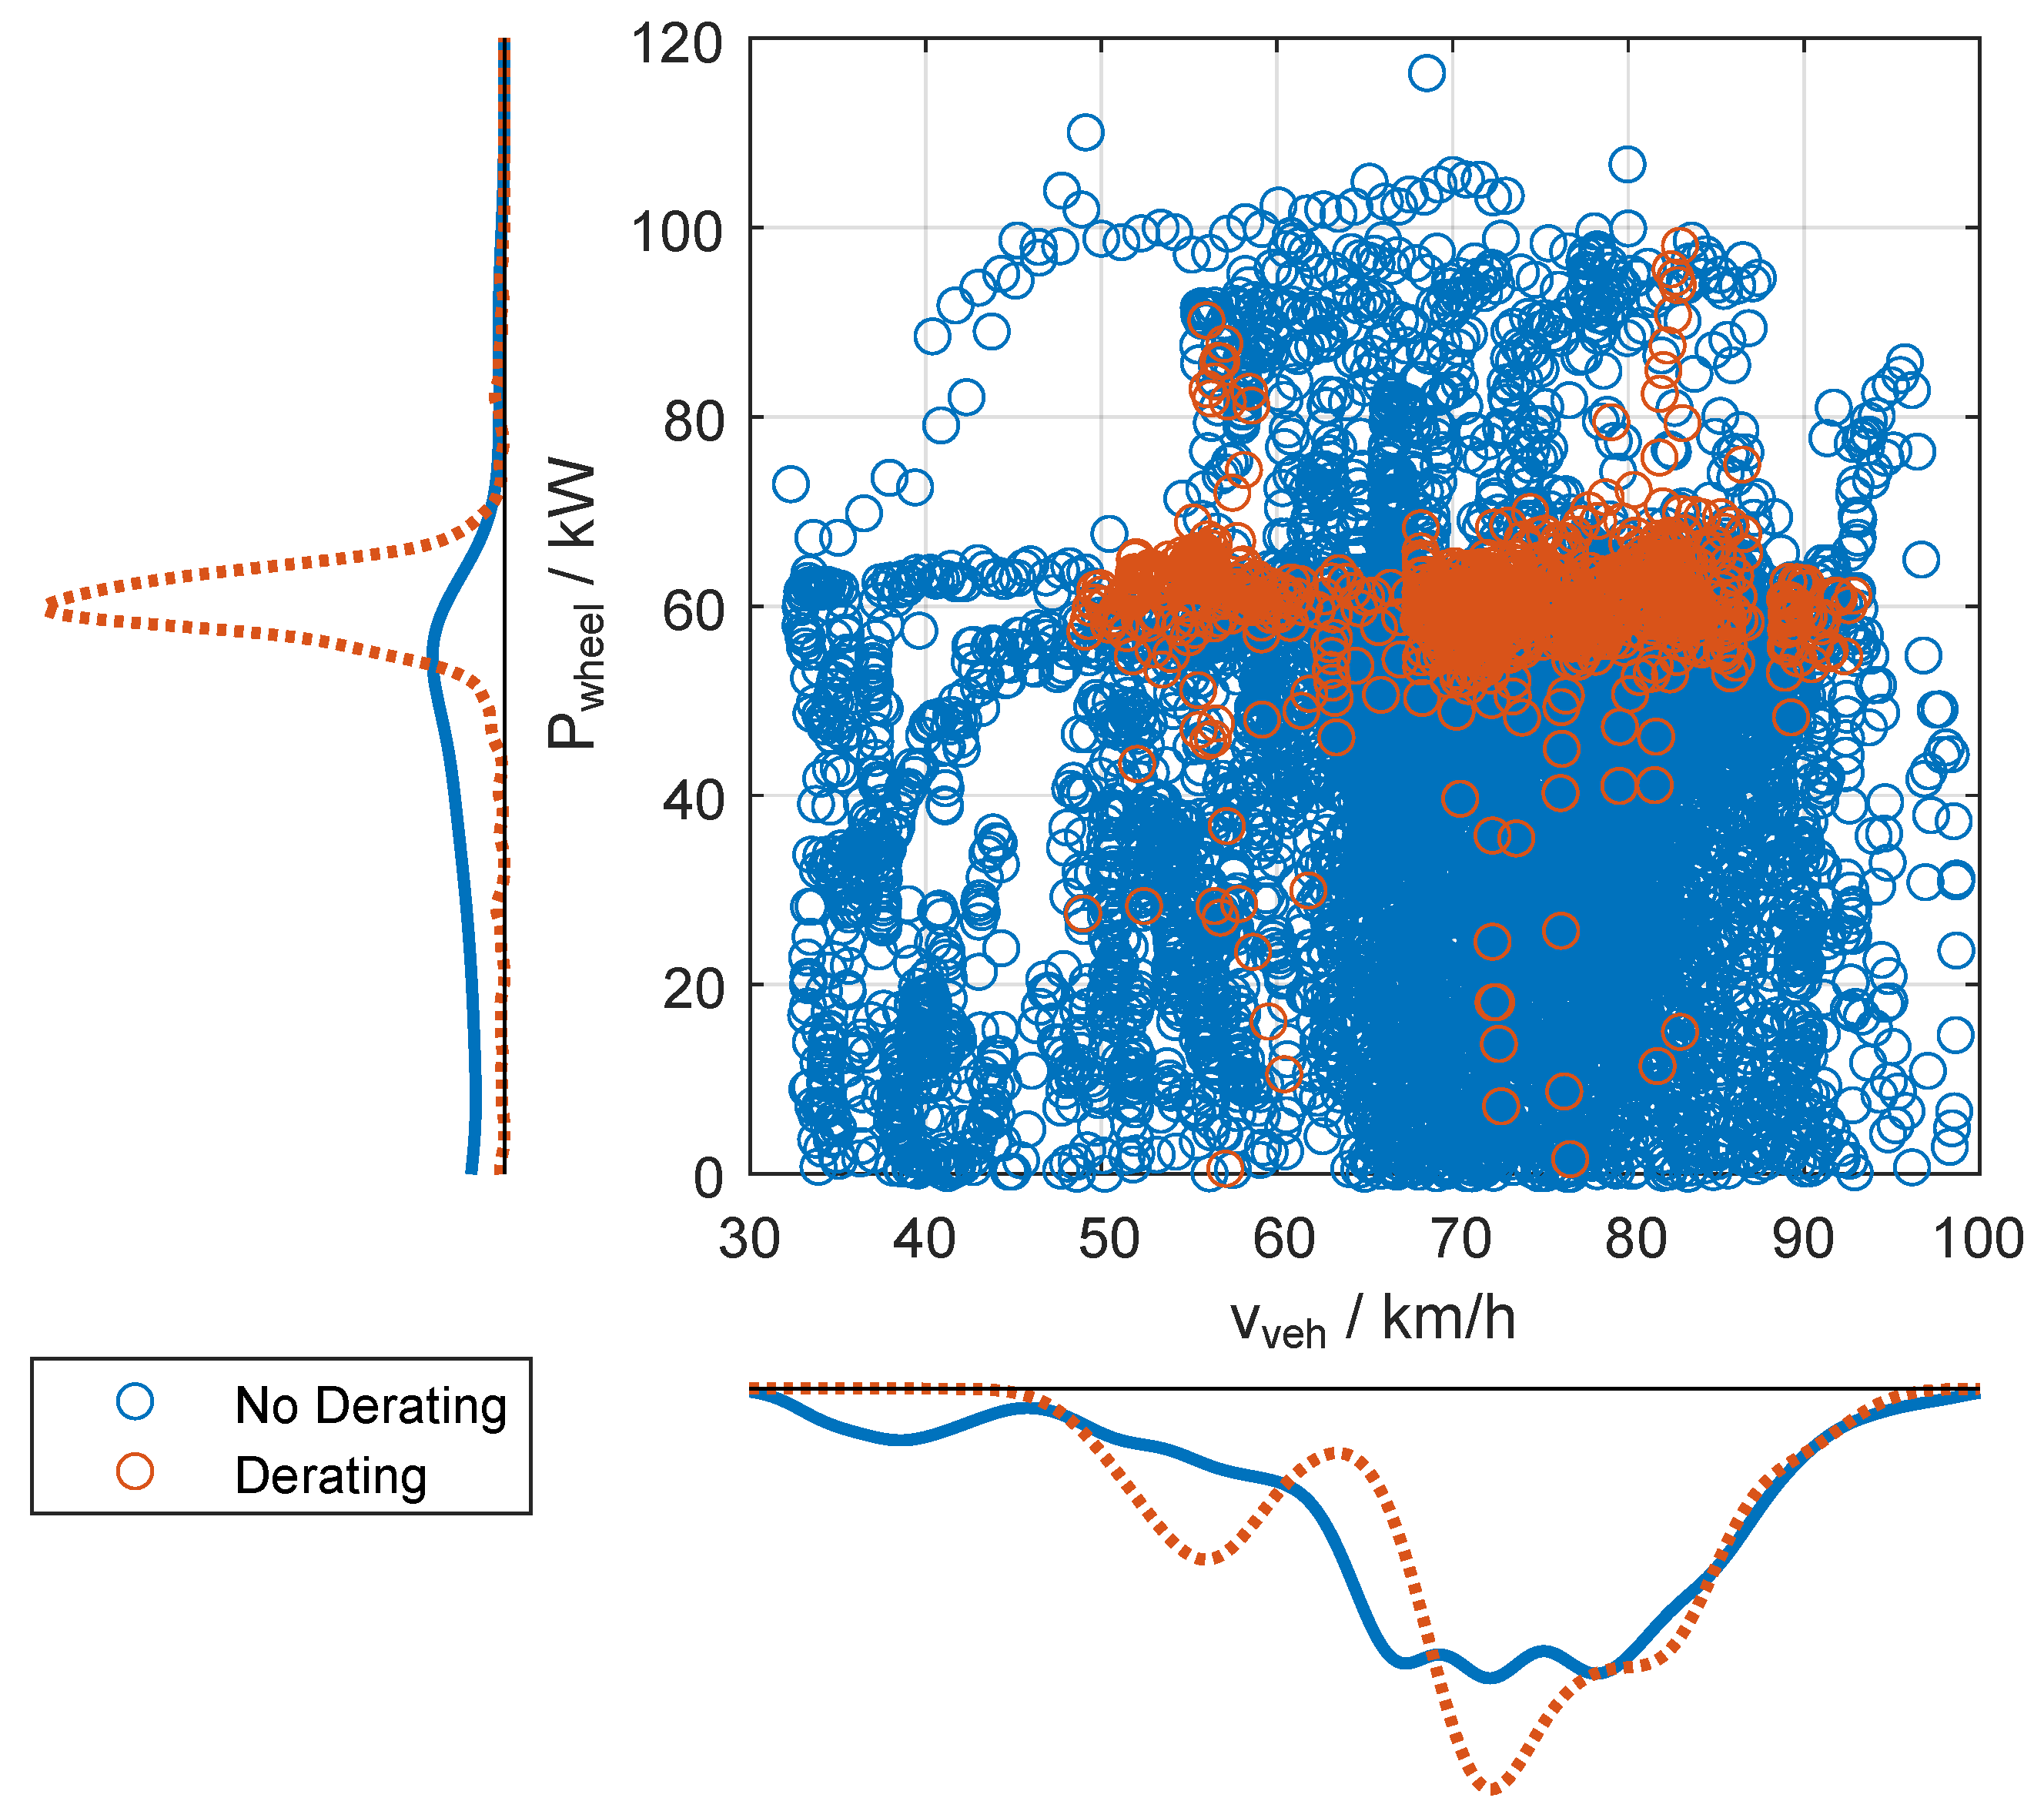
To find out which driving conditions cause derating in particular, the power transmitted from the wheels to the roller dynamometer is plotted against the vehicle speed for all operating points with and without derating in Figure 11. The histograms for the distribution of wheel power and vehicle speed reveal the range in which the operating points with derating differ from the set of points without derating.
Vehicle speeds lower than 30 k m / h are not shown since they only occur during the initial start up and final stop of the vehicle and do not contribute to derating events. It can be seen that no derating occurs below 50 km/h. Isolated events that lead to the indication of derating at wheel power below 50 k W are due to the definition of thermal derating in this work, which allows for classification as derating even if the driver reduces the wheel power. However, those operating points are scarce and do not contribute much to the overall derating, as shown in the histogram for the wheel power. Above 50 km/h, derating appears to be largely independent of the vehicle speed. This is also consistent with the findings from Figure 2, which show that the heat that can be dissipated at the vehicle radiator is largely independent of the vehicle speed due to the powerful design of the radiator fans.
Two areas in which derating occurs can be identified at 90 k W wheel power. The basic distribution of wheel power with and without thermal derating reveals that most operating points are in the range of around 60 k W . The fact that derating occurs to a large extent at wheel outputs that are significantly below the maximum e-machine output of 120 k W and the maximum stack output of 95 k W is likely due to the fact that short power peaks not only cause a significant increase in temperature but also gradual heating of the thermal masses involved due to permanently high wheel loads, which lead to temperatures that should be avoided during fuel cell operation.
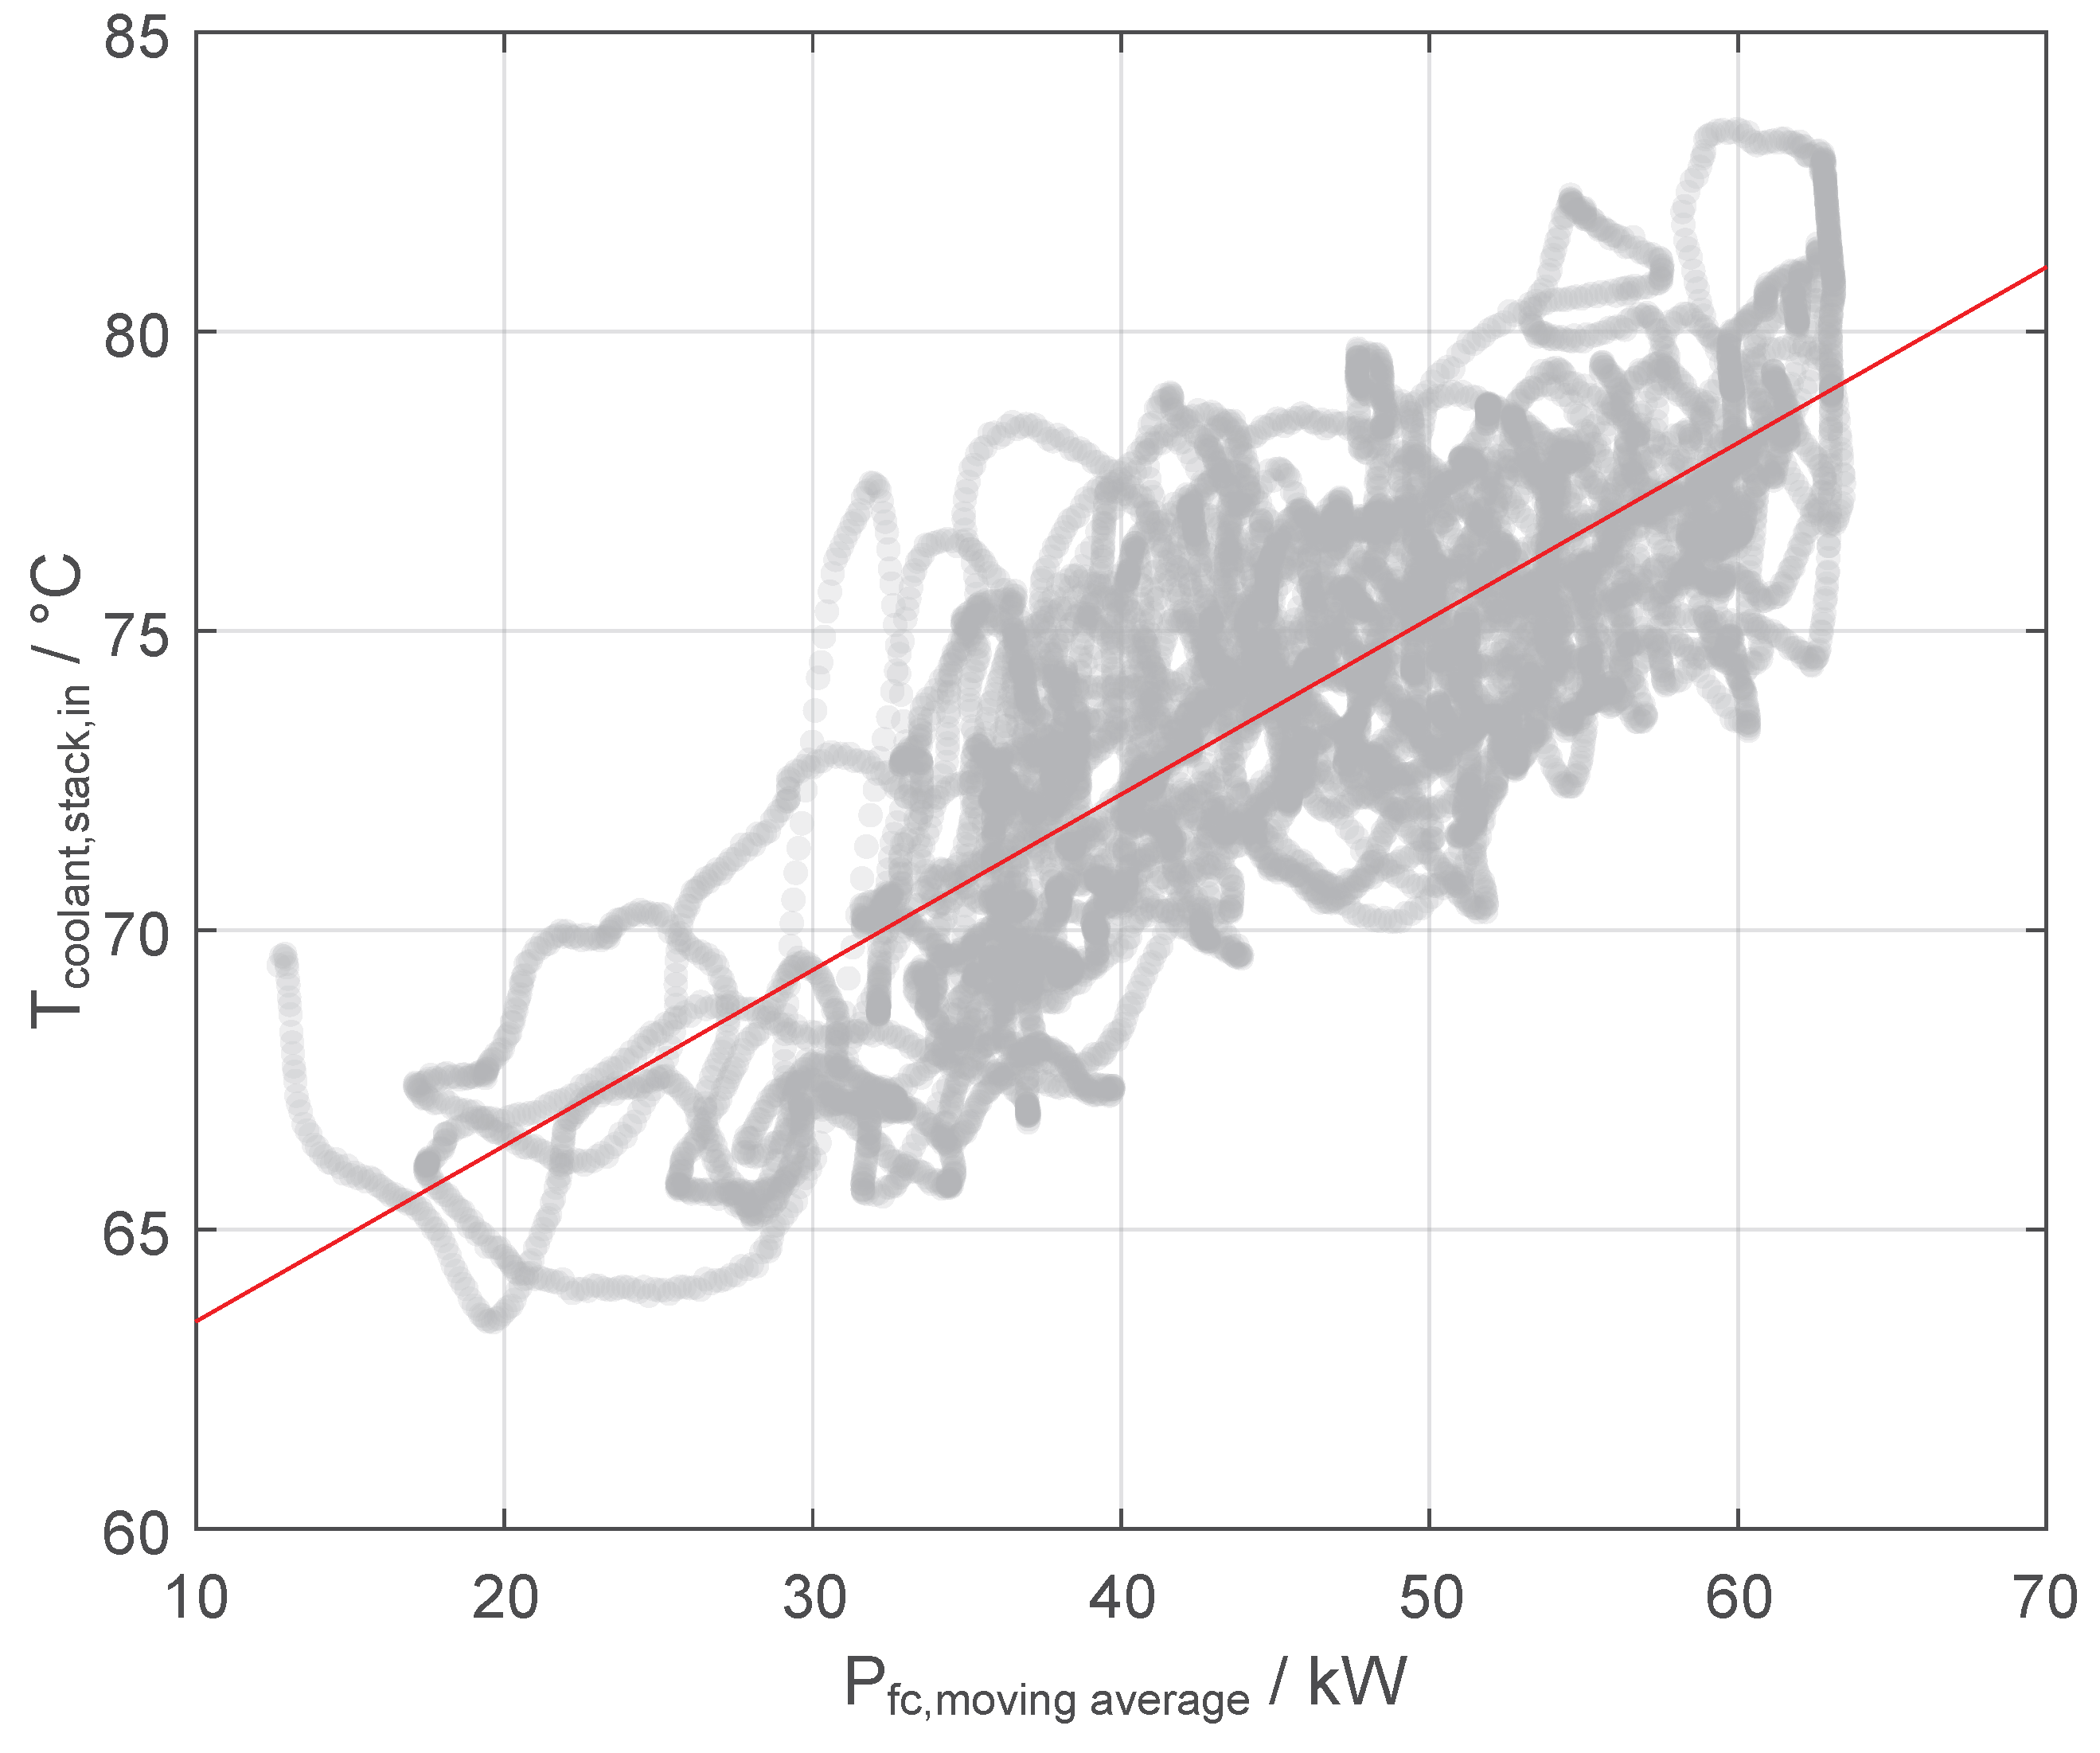
In order to examine the relationship between the coolant temperature at the stack inlet and a longer phase of high fuel cell power output, the correlation between the temperature and a moving average of the fuel cell stack power P f c , m o v i n g a v e r a g e was investigated. For this purpose, the correlation was examined for different time windows of the moving average from 10 to 200 s in 5 s steps. The highest correlation was found for a time window of 50 s . The corresponding distribution is shown in Figure 12.
Compared to the correlation with the immediate stack power, the correlation coefficient between stack power and coolant temperature could be increased from 0.30 to 0.79. The result supports the previously made assumption that long-term operation at high fuel cell power can lead to high coolant temperatures and thus is more likely to result in derating, which can be critical in addition to power peaks at nominal power. The time window found coincides very well with the findings of Gilles and Peissner [32], who also found an observation period of 50 s for the load integral they introduced, which provided the best correlation between load integral and coolant temperatures.
To summarize, it can be stated that thermal derating occurs to a significant extent for a production vehicle with fuel cell drive, even during a demanding driving cycle. However, we did not investigate a worst case with a fully aged stack or full load. High accelerations increase the coolant temperature at the stack inlet, resulting in the fuel cell stack power to be reduced with either a moderate or more severe approach depending on the temperature level. The comparison of target and measured vehicle speed was found to be a suitable indicator to determine thermal derating for roller dynamometer tests assuming a uncertainty band of two standard deviations. Furthermore, it was shown that the thermal time constants of the investigated fuel cell system were on the order of 50 s .

4. Conclusions

In this study, the influence of climatic conditions with a focus on ambient temperature and driving conditions on the thermal management system of an FCEV was investigated with a focus on thermal derating of the fuel cell stack. Using an energy-based approach as a compromise between locally resolved and overall averaged airflows, the cooling air speed and the resulting maximum waste heat at the vehicle radiator were determined depending on the vehicle speed. It was found that the high-voltage radiator fans as part of the cooling module were powerful enough in supporting the cooling airflow. This results in the heat transfer at the HT-radiator being largely independent of the vehicle speed between 30 and 100 k m / h . Even more powerful fans might help to extend the thermal limits of FCEVs, though cost and effectiveness should be balanced carefully.
The effect of ambient temperature ranging from 25 to 45 °C was insignificant for the fuel cell stack efficiency, likely due to sufficient humidification of the fuel cell membranes. However, with regard to the overall fuel cell system, an efficiency difference of up to 5% was found. Thermal modeling of the overall system should therefore consider simulating the influence of ambient temperature on electrical consumption of the EAC, cooling pump, and radiator fans, which significantly contribute to the parasitic consumption of the BoP at high ambient temperatures.
The coolant temperature at the stack inlet was identified as a critical parameter for thermal derating of the system. While moderate derating was specified by the vehicle control system in the range of 66 to 82 °C inlet temperature, above 82 °C, the available fuel cell stack power is severely restricted, resulting in reduced transport performance or even safety issues.
A new criteria for determining thermal derating on roller dynamometer tests was successfully introduced and in good accordance with reduction of the fuel cell stack power as a result of the derating strategy. For the driving cycle investigated, which simulates a challenging uphill drive at high ambient temperatures, thermal derating of FCEVs has been demonstrated experimentally and found to occur 6.3% of the duration of the driving cycle, though a worst-case with aged stack or maximum payload has not been considered.
It has been shown that thermal derating is largely independent of the vehicle speed and tends to occur at moderate wheel powers of around 60 k W , where the duration over which the power is demanded is very relevant here. Time constants found with 50 s for relating average fuel cell stack power and coolant inlet temperature are in accordance with the literature and might help to tune the thermal masses of a fuel cell stack model that could be used to predict thermal derating.

5. Limitations and Future Work

Though the results for the average cooling air speed are in a plausible range, the presented indirect measurement method of cooling air speed is subject to multiplication of errors based on the usage of multiple sensor signals. In contrast to pitot pipes, rapid local pressure fluctuations that occur due to the expected turbulent flow at high vehicle speeds—and hence air velocity fluctuations—cannot be sufficiently detected due to the thermal inertia of the temperature sensors. In addition, the method only detects local air velocities and is based on simplifying assumptions regarding the spatial inhomogeneities of the cooling air velocity. Therefore, future studies might benefit from adding more temperature sensor positions and additionally comparing the energy-based method introduced in this study with a more established method with a larger detection area, e.g., axial turbine anemometers, to be able to estimate the measurement errors based on local inhomogeneities in the turbulent flow. In addition, thermocouples placed within the radiator piping can help to check whether the assumption of an approximately linear change in cooling water temperature in flow direction is appropriate. Finally, the range of investigated vehicle speeds should be extended to a larger range, starting from 0 k m / h , in order to be able to confirm the observations for very low vehicle speeds.
In addition to the ambient temperature, the ambient air humidity also has a major influence on the thermal system of an FCEV. Therefore, studies on fuel cell stack and system efficiency should be extended to include humidity variations that reach into the limits of the ambient conditions in the real world. Humidity sensors in the supply and exhaust gas from the anode and cathode side could also provide more information about the humidification of the cell membranes in the studies described here.
The results shown regarding the occurrence of thermal derating during a dynamic drive cycle are strongly dependent on the driving cycle under consideration, the fuel cell system design, and the vehicle payload. Investigations with maximum payload as well as other challenging driving maneuvers should be considered to study the significance of derating in even more extreme cases and, e.g., confirm the performance of the thermal management system in stop-and-go traffic with even lower velocities than those presented in this study.
Disturbances like system vibrations in general or nonlinear friction were not considered during the dynamic drive cycle. In order to validate the relevance of derating, real street tests should be performed to also evaluate the influence of those disturbances on the results found. Due to the lower stack efficiency and therefore higher heat production, a fuel cell stack in end-of-life condition will be considered in future studies. Future studies should also consider ambient air pressure influences on the investigated low-pressure system as well as studying a high-pressure system, e.g., that used in the Toyota Mirai, to evaluate the performance of the two different fuel cell system designs. For a more general consideration of the relevance of thermal derating in FCEVs, it is recommended to use vehicle simulation models due to there flexibility and cost. The results shown here and future planned experimental studies can help to accurately describe the relevant variables in a FCEV thermal management model in order to predict thermal derating under challenging driving conditions.

Author Contributions

Conceptualization, Y.H. and F.H.; methodology, Y.H.; formal analysis, Y.H.; investigation, Y.H.; resources, M.S. and F.H.; data curation, Y.H.; writing—original draft preparation, Y.H.; writing—review and editing, R.L. and M.S.; visualization, Y.H.; supervision, R.L. and M.S.; project administration, M.S. All authors have read and agreed to the published version of the manuscript.

Funding

This research received no external funding.

Data Availability Statement

The raw data supporting the conclusions of this article will be made available by the authors on request.

Conflicts of Interest

The authors Yannick Heynen and Ralf Liedtke were employed by the company Robert Bosch GmbH. The authors Michael Schier and Florian Heckert were employed by the German Aerospace Center.

Abbreviations

The following abbreviations are used in this manuscript:
BEVBattery electric vehicle
BoPBalance of plant
CBVCoolant bypass valve
CRFMCondenser radiator fan module
CSDCold start device
CTVCoolant temperature valve
EACElectric air compressor
FCEVFuel cell electric vehicle
HHVHigher heating value
HTHigh-temperature
ITDInlet temperature differential
LHVLower heating value
LTLow-temperature
MPCModel predictive control
PEMFCPolymer electrolyte membrane fuel cell
SAESociety of Automotive Engineers
WLTPWorldwide harmonized light vehicles test procedure

Appendix A

Appendix A.1. Overview Measurement Signals

An overview of the measurement signals used is given in Table A1. The upper part of the table contains quantities that are measured by the instruments that are part of the test chamber measuring system, and the lower part of the table contains the quantities measured directly at the vehicle. Information given for the roller is valid for all four rollers, though only the front wheels are relevant for the vehicle used. Type K thermocouples were used for all temperature signals relating directly to the vehicle.
Table A1. Measurement signals and sensors used in this study.
QuantityPositionTest Bench/SensorAccuracy
Ambient air temperatureTest chamberC4.7 GC, Galltec Mess- und Regeltechnik GmbH, Bondorf, Germany≤±0.2  K
Ambient air humdityTest chamberC4.7 GC, Galltec Mess- und Regeltechnik GmbH, Bondorf, Germany≤±2%
Driving resistanceRollerECDM-48L, AIP GmbH & CO. KG, Haldenwang, Germany≤±5.8  N
Vehicle speedRollerECDM-48L, AIP GmbH & CO. KG, Haldenwang, Germany≤±0.04  k m / h
Mean wind speedBlowerVQF 500/1250/22kW E3895, LTG Aktiengesellschaft, Stuttgart, Germany≤±1.2  k m / h
Voltagehigh-voltage busimc CANSAS HVCI8, imc Test & Measurement GmbH, Berlin, Germany≤±0.5  V
Elec. currentCooling pump, cooling fan, EACLEM HTB 50-P, LEM Intern. SA, Meyrin, Switzerland≤±0.5  A
 CSDLEM HAL 100-S, LEM Intern. SA, Meyrin, Switzerland≤±1  A
 Fuel cell stackLEM HTR 300-SB, LEM Intern. SA, Meyrin, Switzerland≤±6  A
Volume flowHT coolantFTB-930-P, OMEGA Engineering, Deckenpfronn, Germany≤±1.25  L / min
Temperaturesee Figure 2Electronic Sensor thermocouple type K class 1≤±1.5  K

Appendix A.2. Air Velocity Calculation Based on Energy Balance

In order to determine the locally averaged velocity v a i r , the energy balance is solved for each of the nine quadrants (index i) shown in Figure A1:
Δ H c o o l a n t , i = Δ H a i r , i = Q ˙ H T , r a d , i ,
with the enthalpy change for the coolant side as follows:
Δ H c o o l a n t , i = V ˙ c o o l a n t 3 · ρ c o o l a n t · c p , c o o l a n t · ( T c o o l a n t , ( i 3 ) i T c o o l a n t , i ( i + 3 ) ) ,
and the enthalpy change on the air side as follows:
Δ H a i r , i = v a i r , i · A 9 · ρ a i r · c p , a i r · ( T a i r , i n , i T a i r , o u t , i ) .
Q ˙ H T , r a d is the locally transfered heat of the HT-radiator in the nine quadrants each.
These equations can be solved for v a i r , i if all coolant temperatures have been determined. The air temperatures T a i r , i n , i and T a i r , i n , o u t are determined by the use of nine thermocouples upstream and downstream of the HT-radiator each. Each pair of thermocouples were positioned along the same fins of the HT-radiator.
Figure A1. Subdivision of radiator flow field and naming of interface variables for energy balances.
Energies 18 02995 g0a1
In order to determine the cooling air velocity on the basis of an energy balance around the two radiator fluids, some assumptions must be made in general:
  • Homogeneous distribution of coolant temperatures and air temperatures for each of the nine quadrants shown in Figure A1;
  • Air flow near the HT radiator is rectified by the radiator fins, resulting in laminar flow in the main flow direction;
  • Total coolant mass flow is evenly distributed over three flow paths, which are a simplified representation of the real piping system, m ˙ c o o l a n t = 3   ·   m ˙ c o o l a n t , i ;
  • Ratio of the air temperatures at the outlet equals the ratio of coolant temperatures at the outlet, e.g., T c o o l a n t , o u t , 8 T c o o l a n t , o u t , 7 = T a i r , o u t , 8 T a i r , o u t , 7 ;
  • Linear change in coolant temperatures in the direction of coolant flow paths due to a low-temperature change from inlet to outlet as a result of higher heat capacity flow on the coolant side.
The coolant outlet temperatures for each of the three flow paths T c o o l a n t , o u t , i can be estimated using the third assumption and the measured overall outlet temperature after mixing T c o o l a n t , o u t using an energy balance for the mixing point of the three flow paths and dividing by c p , c o o l a n t :
m ˙ c o o l a n t · T c o o l a n t , o u t = m ˙ c o o l a n t 3 · ( T c o o l a n t , o u t , 7 + T c o o l a n t , o u t , 8 + T c o o l a n t , o u t , 9 ) ,
resulting in
T c o o l a n t , o u t , 7 = T c o o l a n t , o u t · ( 3 1 + T a i r , o u t , 8 + T a i r , o u t , 9 T a i r , o u t , 7 ) ,
and analogously for T c o o l a n t , o u t , 8 and T c o o l a n t , o u t , 9 . Based on the fourth assumption, the coolant temperatures at the interfaces of the quadrants can be determined using linear interpolation.
The overall air velocity v a i r is determined using the arithmetic mean of all locally averaged air velocities v a i r , i . By using the arithmetic mean, the overall air velocity errors in the locally averaged air velocities are reduced, which are expected originate from the assumptions described above, e.g., representative positioning of the temperature sensor for each quadrant or linear temperature distribution along the flow path of the coolant.

Appendix A.3. Data on Thermal Power at Heat Exchanger

The heat rejection is calculated based on Equation (9). The inlet temperature differential is the difference between coolant temperature at the inlet of the HT-radiator and the average temperature of the nine temperature sensors positioned between the HT- and LT-radiator, as shown in Figure 2.
Table A2. Vehicle speed, heat rejection, and inlet temperature differential used for Figure 6.
Measurement IndexVehicle Speed (km/h)Heat Rejection (K)Inlet Temperature Differential (°C)
179.1186.6242.56
250.5387.7943.82
3127.4587.9239.07
4126.3087.0138.92
5126.0187.6539.08
6126.1987.2139.05
7113.5361.4029.87
884.8062.3631.31
935.2758.6529.59
10128.5291.3040.82
11102.8557.3027.99
1276.3758.1529.23
1354.9556.4729.31
1432.7056.2529.44
15104.4858.5528.12
16101.7257.4727.82
17100.5357.2127.48
1898.9554.8726.73
1999.8856.4026.59

References

  1. Clean Air Act, 42 U.S.C §7401 et seq (1970). Available online: https://www.epa.gov/laws-regulations/summary-clean-air-act (accessed on 23 May 2025).
  2. Regulation (EC) No 715/2007 of the European Parliament and of the Council of 20 June 2007 on Type Approval of Motor Vehicles with Respect to Emissions from Light Passenger and Commercial Vehicles (Euro 6), Official JOURNAL of the European Union, L 171/1. 2007. Available online: https://eur-lex.europa.eu/eli/reg/2007/715/oj/eng (accessed on 23 May 2025).
  3. GB 18352.6-2016; China VI Emission Standards. Ministry of Ecology and Environment of the People’s Republic of China: Beijing, China, 2016.
  4. Zuettel, A.; Remhof, A.; Borgschulte, A.; Friedrichs, O. Hydrogen: The Future Energy Carrier. Philos. Trans. R. Soc. A Math. Phys. Eng. Sci. 2010, 368, 3329–3342. [Google Scholar] [CrossRef] [PubMed]
  5. Hyundai Motor Deutschland GmbH. Hyundai Nexo. Available online: https://www.hyundai.com/de/de/modelle/nexo.html (accessed on 2 February 2025).
  6. Mirai. Toyota Motor Sales. 2024. Available online: https://www.toyota.com/mirai/ (accessed on 2 February 2025).
  7. American Honda Motor Company. CR-V e:FCEV. 2025. Available online: https://automobiles.honda.com/cr-v-fcev (accessed on 2 February 2025).
  8. Stellantis Germany GmbH. Opel Movano HYDROGEN: “Für ein noch stärkeres Kundenangebot!”. Available online: https://www.media.stellantis.com/de-de/opel/press/opel-movano-hydrogen-fuer-ein-noch-staerkeres-kundenangebot (accessed on 22 May 2025).
  9. Schmitz, M.; Matthiesen, F.; Dirkes, S.; Pischinger, S. Predicting Liquid Water Condensation in PEM Fuel Cells by Coupling CFD with 1D Models. Energies 2024, 17, 1259. [Google Scholar] [CrossRef]
  10. Arslan, S.; Barış, O.; Erol, A.F. Enhancing Cold Start Efficiency: Model Based Performance Analysis of an Integrated Thermal System for Fuel Cell Battery Powertrain with Waste Heat Recovery. In Proceedings of the 2024 IEEE 99th Vehicular Technology Conference (VTC2024-Spring), Singapore, 24–27 June 2024; Institute of Electrical and Electronics Engineers: Piscataway, NJ, USA, 2024. [Google Scholar] [CrossRef]
  11. Najmi, A.-U.-H.; Wahab, A.; Prakash, R.; Schopen, O.; Esch, T.; Shabani, B. Thermal Management of Fuel Cell-Battery Electric Vehicles: Challenges and Solutions. Appl. Energy 2025, 387, 125635. [Google Scholar] [CrossRef]
  12. Johansson, M.; Eriksson, L. Model-Based Design and Evaluation of State-of-the-Art Thermal Management Systems for Electrified Trucks. Energies 2025, 18, 673. [Google Scholar] [CrossRef]
  13. Cornet, M.; Tardy, E.; Poirot-Crouvezier, J.-P.; Bultel, Y. Impact of Coolant Operation on Performance and Heterogeneities in Large Proton Exchange Membrane Fuel Cells: A Review. Energies 2025, 18, 111. [Google Scholar] [CrossRef]
  14. Farzi, M.S.; Thampatty, K.C.S. Design of an Effective Thermal Management System for Fuel Cell Electric Vehicles (FCEV) Using Ansys/CFD. In Proceedings of the 2024 International Conference on Futuristic Technologies in Control Systems & Renewable Energy (ICFCR), Malappuram, India, 25–26 September 2024; Institute of Electrical and Electronics Engineers: Piscataway, NJ, USA, 2024. [Google Scholar] [CrossRef]
  15. Pardhi, S.; Schmid, R.; El Baghdadi, M.; Hegazy, O. Lifetime Powertrain Optimization of a Fuel Cell Electric Truck Including Components’ Ageing, Cooling Requirements and Tractor Packaging Constraints. Int. J. Hydrogen Energy 2024, 100, 832–852. [Google Scholar] [CrossRef]
  16. Lee, S.; Hong, J.K.; Lee, D.; Kang, B.; Kim, M.S. Two-Phase Stack Cooling System Coupled with Air Conditioning System in Fuel Cell Electric Vehicles. Appl. Energy 2024, 372, 1233811. [Google Scholar] [CrossRef]
  17. Souby, M.M.; Maher, H.; Salman, M.; Ahmad, H.; Kim, S.C. PEMFC Cooling with Hybrid Nanofluids at Different Mixture Ratios: A Critical Assessment of Thermal–Hydraulic Performance. Int. J. Hydrogen Energy 2025, 102, 386–399. [Google Scholar] [CrossRef]
  18. Jung, G.; Kim, J.; Choi, H.; Lee, H. Multi-Objective Optimization of an Offset Strip Fin Heat Exchanger Applied to Fuel Cell Electric Vehicles for Cooperative Cooling. Appl. Therm. Eng. 2025, 268, 125832. [Google Scholar] [CrossRef]
  19. Lee, H.-S.; Cho, C.-W.; Seo, J.-H.; Lee, M.-Y. Cooling Performance Characteristics of the Stack Thermal Management System for Fuel Cell Electric Vehicles under Actual Driving Conditions. Energies 2016, 9, 320. [Google Scholar] [CrossRef]
  20. Gong, C.; Shen, J.; Yu, Y.; Wang, K.; Tu, Z. Heat Dissipation Characteristic in the Intake Grille and Radiator of a Fuel Cell Vehicle. Int. J. Green Energy 2020, 17, 591–601. [Google Scholar] [CrossRef]
  21. Doppler, C.; Lindner-Rabl, B. Fuel Cell Trucks: Thermal Challenges in Heat Exchanger Layout. Energies 2023, 16, 4024. [Google Scholar] [CrossRef]
  22. Di Pierro, G.; Tansini, A.; Fontaras, G.; Bonato, C. Experimental Assessment of Powertrain Components and Energy Flow Analysis of a Fuel Cell Electric Vehicle (FCEV); Society of Automotive Engineers: Technical Paper 2022-37-0011; SAE International: Warrendale, PA, USA, 2022. [Google Scholar] [CrossRef]
  23. Di Pierro, G.; Bitsanis, E.; Tansini, A.; Bonato, C.; Martini, G.; Fontaras, G. Fuel Cell Electric Vehicle Characterisation under Laboratory and In-use Operation. Energy Rep. 2024, 11, 611–623. [Google Scholar] [CrossRef]
  24. Sery, J.; Leduc, P. Fuel Cell Behavior and Energy Balance on Board a Hyundai Nexo. Int. J. Engine Res. 2022, 23, 709–720. [Google Scholar] [CrossRef]
  25. Lohse-Busch, H.; Stutenberg, K.; Duoba, M.; Liu, X.; Elgowainy, A.; Wang, M.; Wallner, T.; Richard, B.; Christenson, M. Automotive Fuel Cell Stack and System Efficiency and Fuel Consumption Based on Vehicle Testing on a Chassis Dynamometer at Minus 18 °C to Positive 35 °C Temperatures. Int. J. Hydrogen Energy 2020, 45, 861–872. [Google Scholar] [CrossRef]
  26. Wang, W.; Qu, F.; Li, W.; Sun, L. Simulation and Testing Research on Thermodynamic Performance of Fuel Cell Vehicles. In Proceedings of the 2022 IEEE 10th Joint International Information Technology and Artificial Intelligence Conference (ITAIC), Chongqing, China, 17–19 June 2022; Institute of Electrical and Electronics Engineers: Chongqing, China, 2022; pp. 2116–2120. [Google Scholar] [CrossRef]
  27. Wang, W.; Qu, F.; Li, W. Research on Energy Flow Test of Typical Fuel Cell Vehicle. In Proceedings of the 2021 IEEE 5th Advanced Information Technology, Electronic and Automation Control Conference (IAEAC), Chongqing, China, 12–14 March 2021; Institute of Electrical and Electronics Engineers: Chongqing, China, 2021; pp. 1729–1734. [Google Scholar] [CrossRef]
  28. Wang, W.; Qu, F.; Li, W.; Wang, G.; Zeng, F. Modeling and Simulation Analysis of a Typical Fuel Cell Vehicle. In Proceedings of the 2021 IEEE 5th Information Technology, Networking, Electronic and Automation Control Conference (ITNEC), Xi’an, China, 15–17 October 2021; Institute of Electrical and Electronics Engineers: Xi’an, China, 2021; pp. 877–883. [Google Scholar] [CrossRef]
  29. Haraldsson, K.; Alvfors, P. Effects of Ambient Conditions on Fuel Cell Vehicle Performance. J. Power Sources 2005, 145, 298–306. [Google Scholar] [CrossRef]
  30. Liu, W.; Peng, Z.; Kim, B.; Gao, B.; Pei, Y. Development of a PEMFC Dynamic Model and the Application to the Analysis of Fuel Cell Vehicle Performance. In IOP Conference Series: Materials Science and Engineering, Proceedings of the 2019 4th International Conference on Energy Materials and Applications, Beijing, China, 11–13 May 2019; IOP: Bristol, UK, 2019; Volume 628, p. 012006. [Google Scholar] [CrossRef]
  31. Anselma, P.G.; Luciani, S.; Tonoli, A. Dynamic Programming for Thermal Management of Automotive Fuel Cell Systems: Investigating Hydrogen Saving Potential. IEEE Access 2023, 11, 48080–48098. [Google Scholar] [CrossRef]
  32. Gilles, T.; Peissner, S. A Method for the Estimation of Cooling System and Driving Performance for Fuel Cell Vehicles Based on Customer Fleet Data. Soc. Automot. Eng. Int. J. Electrified Veh. 2021, 11, 203–212. [Google Scholar] [CrossRef]
  33. Hahn, S.; Braun, J.; Kemmer, H.; Reuss, H.-C. Adaptive Operation Strategy of a Polymer Electrolyte Membrane Fuel Cell Air System Based on Model Predictive Control. Int. J. Hydrogen Energy 2021, 46, 17306–17321. [Google Scholar] [CrossRef]
  34. Wagenblast, M.; Pollak, M.; Trägner, J.; Heinke, S.; Tegethoff, W.; Köhler, J.; Swoboda, J. Design and Analysis of a Spray Cooling System for a Heavy-Duty Fuel Cell Truck; Society of Automotive Engineers: Warrendale, PA, USA, 2022. [Google Scholar] [CrossRef]
  35. Lee, D.K.; Kim, D.S.; Byun, H.S.; Kang, H.S.; Shin, Y.H.; Lee, H.S. Maximizing FCEV Stack Cooling Performance: Developing a Performance Prediction Model Based on Machine Learning for Evaporative Cooling Radiator; Society of Automotive Engineers: Technical Paper; SAE International: Warrendale, PA, USA, 2024. [Google Scholar] [CrossRef]
  36. Park, U.J.; Kwon, S.B.; Choi, K.J.; Lee, G.W.; Oh, D.S. A Preliminary Study on the Evaporative Cooling System for FCEV; ociety of Automotive Engineers: Technical Paper 2024-01-2406; SAE International: Warrendale, PA, USA, 2024; Technical Paper 2024-01-2406. [Google Scholar] [CrossRef]
  37. Souby, M.M.; Prabakaran, R.; Kim, S.C. Nozzle Spray-Cooling Coupled PEMFC Stack Radiator: Thermal-Hydraulic Performance and Integrated Correlations. Energy 2025, 321, 135517. [Google Scholar] [CrossRef]
  38. Prabakaran, R.; Souby, M.M.; Liu, J.; Kim, S.C. Improving Fuel Cell Vehicle Efficiency: Exploring Dynamic Cooling Strategies for Stack Radiators with Intermittent Spray Cooling. eTransportation 2025, 23, 100384. [Google Scholar] [CrossRef]
  39. Institute of Vehicle Concepts, German Aerospace Center. Four-Engine All-Wheel Roller Rig with Climate Control and Exhaust Analysis. Available online: https://www.dlr.de/en/fk/research-and-transfer/research-infrastructure/four-engine-all-wheel-roller-rig-with-climate-control-and-exhaust-analysis (accessed on 2 February 2025).
  40. UN Global Technical Regulation No. 15 (Worldwide Harmonized Light Vehicles Test Procedure), ECE/TRANS/180/Add.15. 2021. Available online: https://unece.org/sites/default/files/2022-06/ECE-TRANS-180a15am6e.pdf (accessed on 23 May 2025).
  41. Hyundai Motor America. Nexo Fuel Cell. 2023. Available online: https://www.hyundaiusa.com/us/en/vehicles/nexo (accessed on 8 May 2025).
  42. Navaneeth, P.V.; Prasad, S.A.N.; Sankar, M.L. Predictive under Hood Thermal Management Model. Society of Automotive Engineers: Technical Paper 2024-26-0272; SAE International: Warrendale, PA, USA, 2024. [Google Scholar] [CrossRef]
Figure 1. Roller dynamometer test facility with climate control and air blower at the DLR (German Aerospace Center) Institute of Vehicle Concepts.
Energies 18 02995 g001
Figure 2. Hyundai Nexo stack cooling system with sensors used. CBV: coolant bypass valve; CRFM: condenser radiator fan module; CSD: cold start device; CTV: coolant temperature valve; Hx: heat exchanger.
Energies 18 02995 g002
Figure 3. Mean cooling air velocity v a i r through HT-radiator depending on vehicle speed v v e h at maximum fan speed (4200 rpm) with 2nd-order polynomial fit.
Energies 18 02995 g003
Figure 4. Heat exchanger performance capability Q / I T D depending on vehicle speed v v e h with 2nd-order polynomial fit.
Energies 18 02995 g004
Figure 5. Fuel cell system efficiency η n e t , s y s related to lower heating value as a function of fuel cell system power P n e t , s y s for different ambient temperatures. Mean standard deviation: 0.0066.
Energies 18 02995 g005
Figure 6. Voltage efficiency stack η v o l t a g e , f c related to lower heating value as a function of fuel cell stack power P f c for different ambient temperatures. Mean standard deviation: 0.0017.
Energies 18 02995 g006
Figure 7. Actual heat transferred from stack to coolant Q ˙ f c , c o o l a n t and theoretical maximum heat produced Q ˙ f c , c o o l a n t , m a x depending on fuel cell stack power P f c .
Energies 18 02995 g007
Figure 8. Distribution of fuel cell stack power P f c and coolant temperature at stack inlet T c o o l a n t , s t a c k , i n , with ranges of coolant temperatures at stack inlet T c o o l a n t , s t a c k , i n for which no (green), moderate (orange) and massive (red) thermal derating occurs.
Energies 18 02995 g008
Figure 9. Details of the method for determining thermal derating.
Energies 18 02995 g009
Figure 10. Time series plot for ideal vehicle speed and measurement results for identification of thermal derating events.
Energies 18 02995 g010
Figure 11. Distribution of derated operating points for vehicle speed v v e h and wheel power P w h e e l , as defined in Equation (2).
Energies 18 02995 g011
Figure 12. Distribution of the moving average of the fuel cell stack power P f c , m o v i n g a v e r a g e (time window 50 s ) and coolant temperature at stack inlet T c o o l a n t , s t a c k , i n (grey) with linear trend line (red).
Energies 18 02995 g012
Disclaimer/Publisher’s Note: The statements, opinions and data contained in all publications are solely those of the individual author(s) and contributor(s) and not of MDPI and/or the editor(s). MDPI and/or the editor(s) disclaim responsibility for any injury to people or property resulting from any ideas, methods, instructions or products referred to in the content.

