Article

Techno-Economic Analysis and Optimization of the Hybrid System for a Research Campus—Case Study Center for Research, Innovation, and Technology Transfer in Cuenca-Ecuador

by
Daniel Icaza-Alvarez
* and
David Borge-Diez
Department of Electrical, Systems and Automation Engineering, University of León, 24071 León, Spain
*
Author to whom correspondence should be addressed.
Energies 2025, 18(11), 2746; https://doi.org/10.3390/en18112746
Submission received: 28 March 2025 / Revised: 26 April 2025 / Accepted: 21 May 2025 / Published: 26 May 2025

Abstract

:
Energy development based on renewable energy has gained widespread acceptance in society, especially in recent years. Among the initiatives currently being promoted are those promoted by higher education institutions that utilize available space on their campuses by configuring energy systems to incorporate renewable generation technologies. This study conducts a techno-economic analysis of a hybrid energy system that combines photovoltaic systems, wind turbines, hydrokinetic turbines, batteries, and fuel generators for the Center for Research, Innovation, and Technology Transfer of the Universidad Católica de Cuenca (UCACUE) in southern Ecuador. Using data collected on site, particularly from the CIITT campus meteorological station and recorded on the RESMUCC platform, the size of each renewable system configuration is optimized based on the three proposed energy control algorithms. The designs of the different configurations developed using the Homer Pro tool are then compared in terms of costs and energy generated. The results show that the system, which includes photovoltaic systems, wind turbines, hydrokinetic turbines, and fuel-powered generators, has the lowest cost, at USD 0.33/kWh.

1. Introduction

Climate change has become a primary global concern in recent years. Average temperatures are rising annually, and an increasing number of people are affected by disasters, climate-sensitive diseases, and other health conditions [1]. In the Americas, 67% of healthcare facilities are located in disaster-prone areas [2]. In the last decade, 24 million people were left without access to medical care for months due to infrastructure damage [3]. At the end of 2024, a historic drought affected the entire Americas, exacerbated by inadequate management and maintenance of the healthcare system [4]. Ecuador, Cuba, and Venezuela are the countries that experienced the most complications [5].
Focusing on Ecuador, it was identified that the country has high ecological biodiversity and fragile ecosystems, which are unique in the world, especially in the Galapagos Islands and the Amazon [6]. The resulting droughts have affected the same wetlands in the Andes mountain range that serve as sources of water supply [7]. These effects led to a significant reduction in river flows, and since Ecuador is highly dependent on hydroelectric power generation, it was urgent to rationalize its electricity service [8]. These decisions, which included power outages of up to 14 h, caused a series of difficulties and discomfort for citizens [9]. Unfortunately, the lack of sound decisions in recent years, particularly due to the underutilization of diversified energy sources with significant budgets, has led to a downward spiral into this energy crisis [10]. In 2025, the electricity service normalized thanks to the return of rain [11,12]. However, several institutions have taken the crisis as a lesson and are seeking solutions to prevent the ghosts of blackouts from returning [13,14,15]. For this reason, their campuses have begun to invest in renewable energy [16]. Among the technologies most leveraged is solar photovoltaic, which is easily implemented in areas that often go unnoticed, such as rooftops. This case study examines a hybrid system designed to harness the energy potential available on campus, which has ample space and can leverage existing infrastructure.
Renewable energy sources (RESs) are being utilized to great advantage, partly thanks to the reduction in operating costs, which are more affordable for businesses and citizens in general [17]. They are considered promising and very useful, especially for properties located in communities without access to the grid or seeking to secure their energy service [18]. Positive experiences in different parts of the world are generating confidence in renewable energy technologies [19,20,21]. Additionally, supportive policies have led to greater participation in renewable energy sources [22]. Over the last decade, Ecuador’s generation capacity has shown steady growth, increasing from 6500 MW in 2013 to 8254 MW in 2023, but its pace is slower compared to other countries in the region [23]. Renewable energy has been the primary driver of this growth, particularly hydropower, which remains the most dominant source [24]. This analysis suggests a continued commitment to the expansion and diversification of renewable energy, although non-renewable energy remains a crucial component of the country’s energy mix [25]. One of the technologies currently gaining traction is hydrokinetic turbines (HKTs) [26]. These utilize open water channels and offer tailored solutions to electricity needs [27]. Combined with other technologies such as solar and wind, they become more attractive and increase reliability [28]. Fossil fuel-based technologies remain useful as long as there are no 100% renewable energy development plans. Diesel or gasoline generators continue to play a crucial role, especially if the equipment has already been purchased [29]. After their useful life is reached, the most appropriate option is to replace them with renewable energy systems, which could involve expanding the installation of wind, solar, or hydrokinetic technologies, as appropriate [30]. The possibility of including another source, such as biomass, geothermal, or another renewable energy source, can also be analyzed [31].

1.1. Context and Motivation

Cuenca is known as the Athens of Ecuador, a city with a network of universities and higher education centers that are both nationally and internationally recognized. For this reason, the Plenary Session of the National Assembly declared it the “Ciudad Universitaria de la República del Ecuador” in 2011. With this recognition, the Master Plan for Sustainable Development of the University City of Cuenca was created and implemented through the local administration, the productive sectors, the public, and, primarily, the higher education institutions. The goal is to create a city of knowledge, culture, and science, while also developing a regional scientific and technological policy with national reach.
At the same time, Cuenca enjoys a privileged geographical position, welcoming its friendly people. A large number of North Americans have settled in this city due to its high standard of living. Among other benefits, it also welcomes students from different provinces, especially those surrounding, making it a destination and study option within the country. However, it is understood that declaring it a university city goes beyond mere recognition to achieve more significant objectives. These initiatives aim to position the city of Cuenca as not only a national but also an international destination, welcoming citizens from around the world to study in the city [32,33,34]. This entails improving the academic infrastructure of the city’s university campuses. This will enable the proposed objectives to be achieved and provide students arriving in the town from various destinations with quality education.
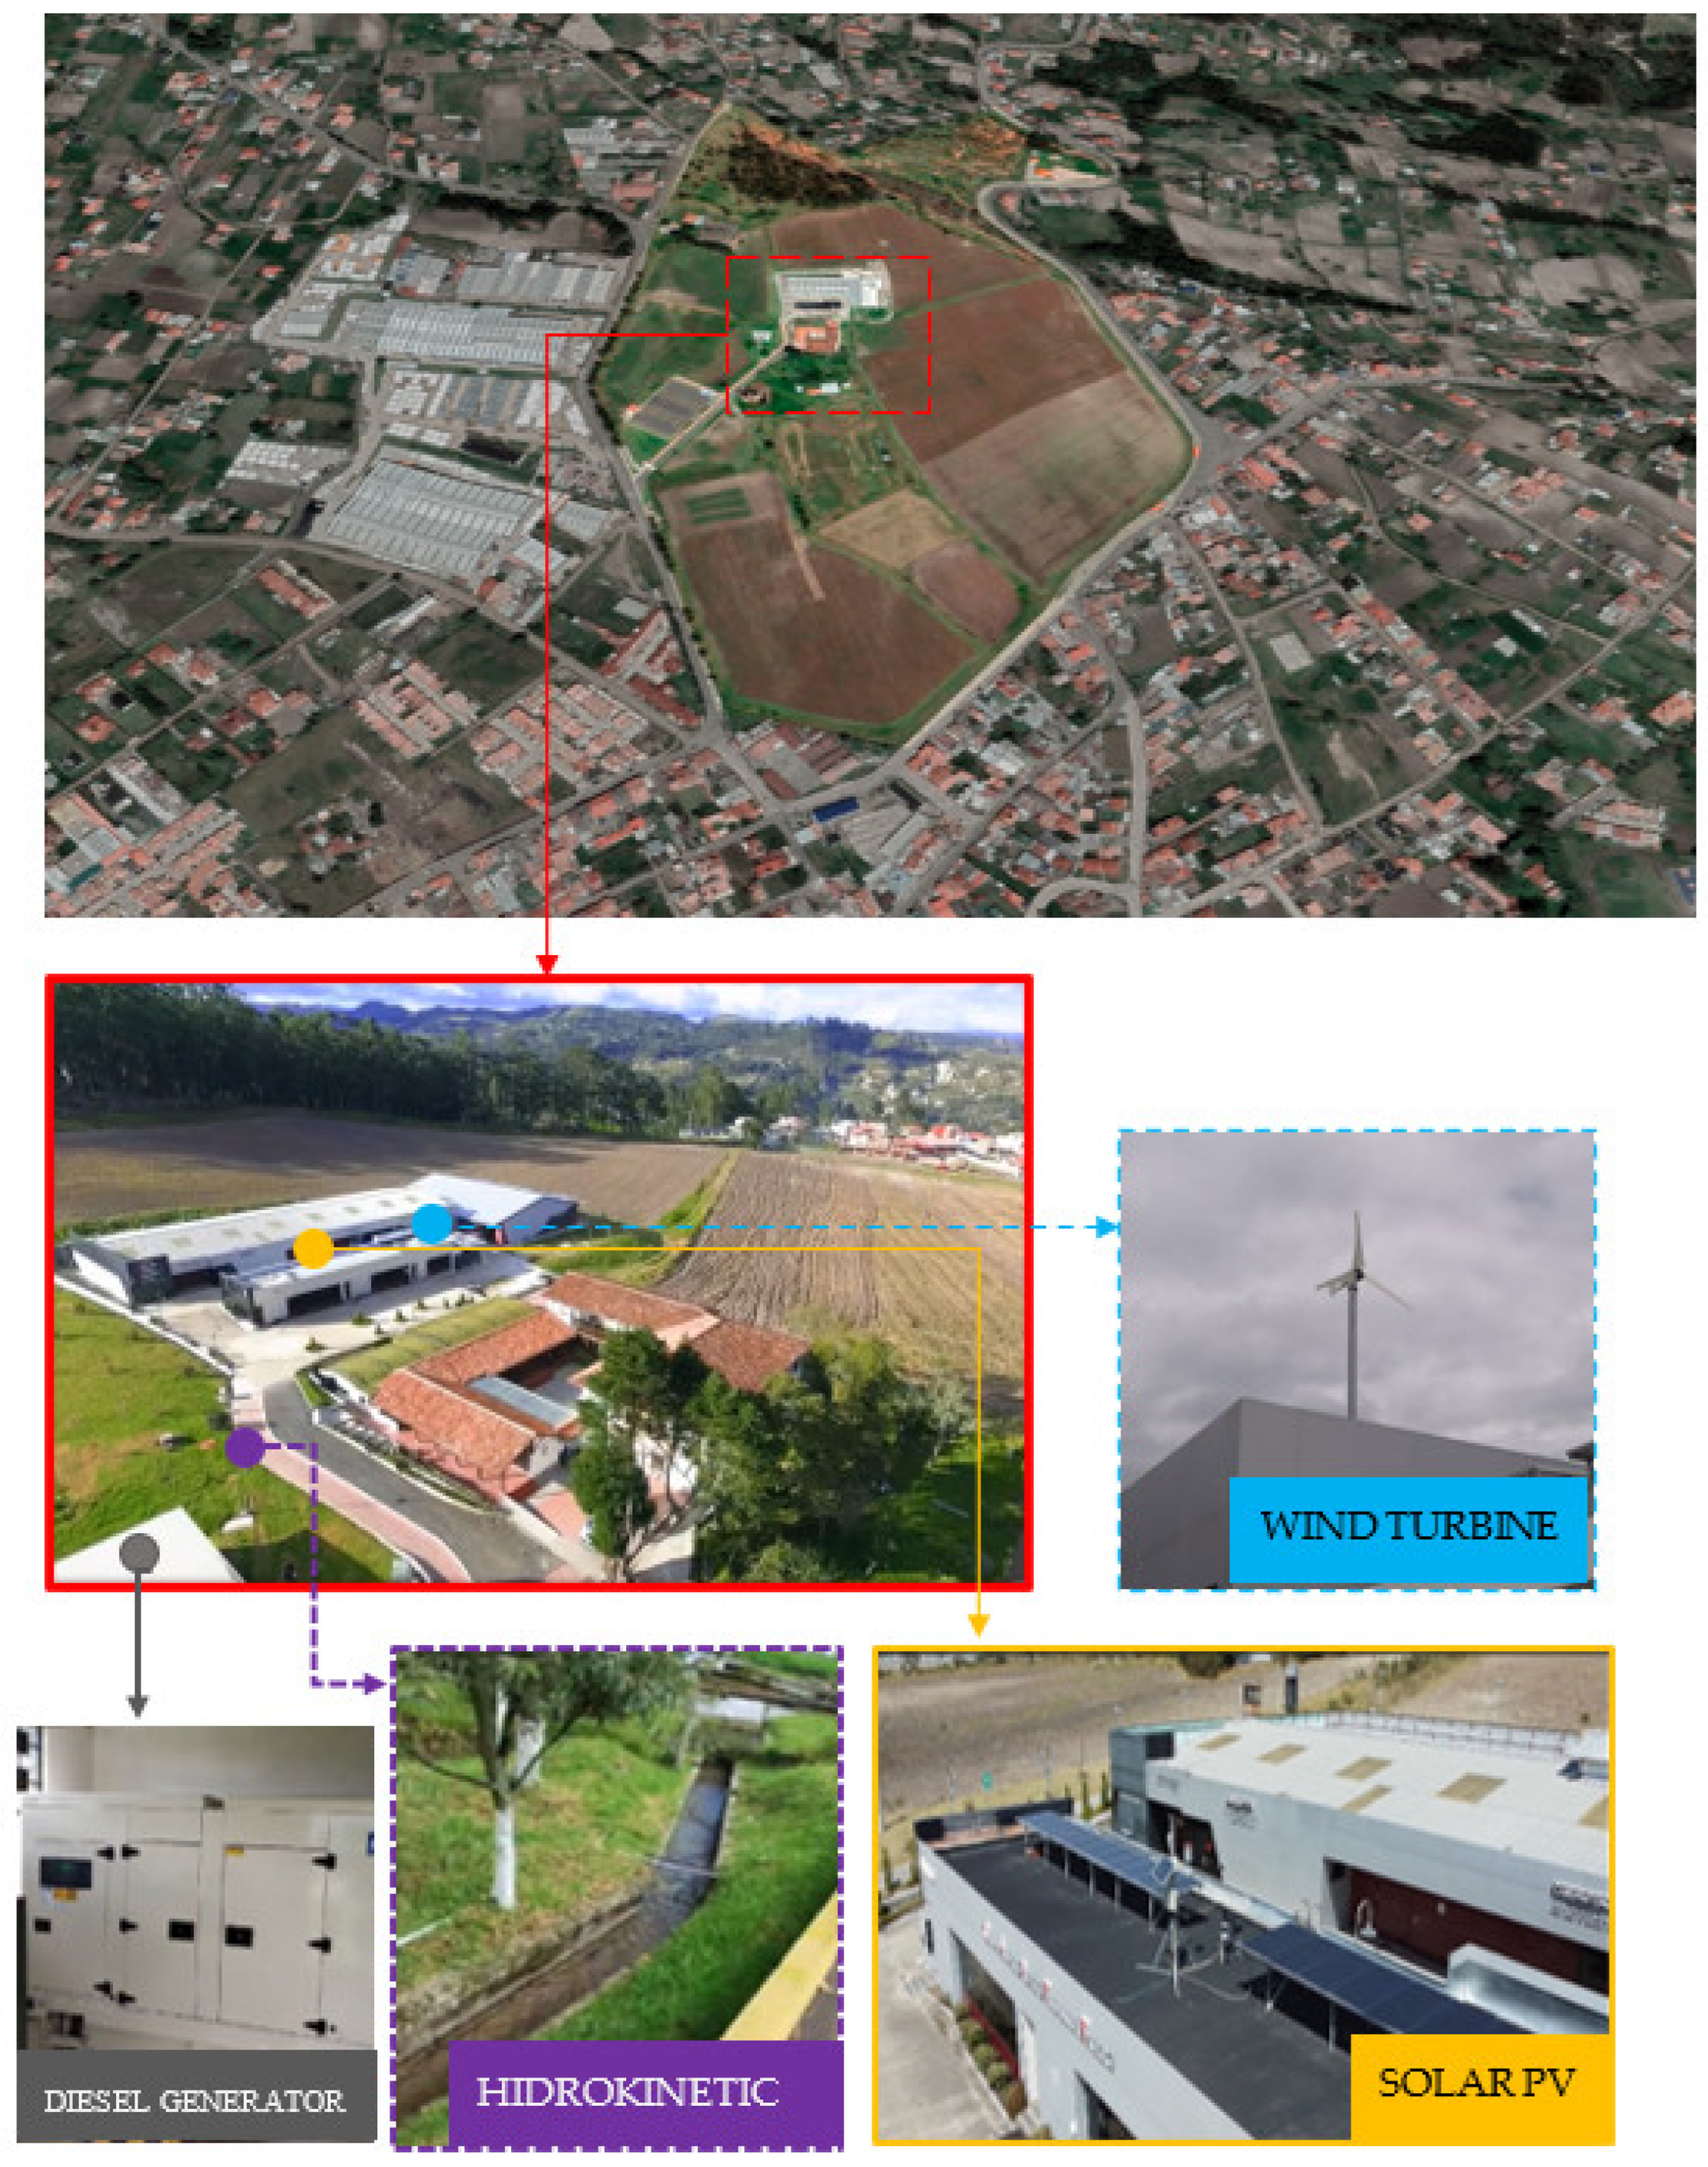
The Universidad Católica de Cuenca is one of the institutions taking this new plan into account, implementing the Plan Estratégico de Desarrollo Institucional (PEDI) 2026–2030. This represents a significant institutional change in several areas, one of which is infrastructure. Among the institution’s strengths is the CIITT campus (Figure 1), which primarily houses the Estancia Miracielos house, 28 laboratories that are increasingly expanding, and natural spaces used for agricultural production, guided ecological tours, and scientific research related to the environment.

1.2. Facility Location

The CIITT campus, where this research is focused, spans approximately 21 hectares and is situated in Ricaurte Parish, one of the largest peri-urban parishes in the city of Cuenca. This spacious campus, as shown in Figure 1, is distinguished by its views of both the city and rural areas. It features interesting renewable energy resources such as solar and wind energy and open water channels that crisscross the property, which can also be better utilized to produce energy using small hydrokinetic turbines.

1.3. Background and Literature Review

Renewable energy consumption in the electricity, heating, and transportation sectors is expected to increase by nearly 60% between 2024 and 2030, according to a report released by the International Energy Agency (IEA) [35]. Global renewable energy capacity is projected to increase by more than 5520 GW during the 2024–2030 period, 2.6-times the deployment rate over the past six years (2017–2023) [36]. These rising consumption levels are prompting several researchers to reconsider, and it is believed that currently operating fossil fuel-based generation systems can continue to operate until their useful life is reached and replaced by renewable energy, including wind and solar photovoltaic (PV) power [37]. Renewable energy systems that have begun operating in various isolated or grid-connected settings have not initially ruled out the use of diesel or gasoline generators. Instead, they have integrated and operate together to form hybrid systems [38]. In the future, 100% renewable energy systems are expected to be adopted, leading to an increase in the size of renewable power plants.
The renewable energy industry is undergoing substantial changes, considering that in some countries, it is just beginning to take shape, and the future of these technologies is much more promising in the medium and long term [39]. This is very encouraging for those who have placed their trust in renewables as a solution to the environmental problems caused by fossil fuel-based energy systems [40,41]. Much more rigorous efforts are still required, especially in promoting and building public confidence, to avoid the purchase of generators that run on combustion and also need a continuous supply of fuel [42,43,44]. In many situations, this fuel must be purchased in cities and then transported to rural areas [45]. Furthermore, the installation of renewable energy systems is not complicated, and they offer greater security within buildings and homes [46]. Due to these advantages, their deployment in both urban and rural areas has increased significantly, offering various types of solutions, including those for remote locations outside cities [47,48,49].
Various energy system research studies emphasize the importance of creating hybrid systems, leveraging the geographic conditions and renewable energy potential available at each site [50,51,52]. These diverse forms of exploitation are typically found through solar panels and wind turbines [53]. Recently, interesting applications have been discovered that utilize water currents in open channels [54]. Within this same range of renewable energies, there are other technically exploited systems, such as ground heat, organic solid waste, and ocean waves [55]. These are found in specific locations; in many cases, they are not present in high proportions, but by forming hybrid systems, they further diversify the designed system and complement each other more effectively [56]. Some authors emphasize the importance of utilizing pre-installed diesel or gasoline generators to prevent institutions from incurring high initial investments [57,58,59]. Other authors recommend replacing these assets with a renewable energy system after their useful life has expired [29,60,61]. Service continuity should not be compromised in any way; therefore, one of the most viable options is to utilize storage systems, typically employing batteries, which are currently available on the market [62,63,64]. Recent studies also address the need to optimize energy resources, avoiding oversizing hybrid systems, which can, therefore, impact the economics [58,65,66]. In general terms, this research focuses on modeling hybrid systems that incorporate renewable energy sources and a diesel generator for the CIITT campus of the Universidad Católica de Cuenca. The aim is to make better use of available energy resources and integrate the diesel generator installed on site. In this review, we assess the literature presented. Among the various works are those presented by Pujari Harish Kumar et al. [67], who presented a pre-feasibility analysis of a hybrid system for Billerhalli village, Karnataka, India. They also established a structured methodology to guide the planning and design of an optimized hybrid energy system. They used Homer Pro software (Version 3.16.2) to model and analyze various hybridization scenarios. The optimal configuration included a wind turbine, electrolyzer, hydrogen storage tank, power converter, and an LL1500-W battery. This setup achieved a net present cost of USD 5.21 million and delivered a competitive levelized cost of energy at USD 0.25 per kWh. Among the evaluated alternatives, the optimized hybrid system demonstrated superior cost-effectiveness and environmental performance, positioning it as the most sustainable and economically viable solution. Loiy Al-Ghussain et al. [68] evaluated an integrated energy storage system within a hybrid configuration comprising photovoltaic (PV), wind, and biomass sources. Integrating storage units into hybrid systems enables the redistribution of excess electricity to meet demand during periods of shortfall. The case study was conducted at the Middle East Technical University, Northern Cyprus Campus. The proposed system consisted of 2 MW of wind, 1.79 MW of PV and 0.92 MW of biomass, supported by a 24.39 MWh pumped hydro storage system and 148.64 kWh of battery storage. The configuration achieved impressive energy efficiencies of 99.59% and 98.86%, respectively, with a levelized cost of electricity (LCOE) of USD 0.1626/kWh. Simulation results demonstrated a remarkably high system runtime, approaching 99%. In a separate study, Md. Mustafizur Rahman et al. [69] presented a schematic of a renewable energy system for an isolated community. The case study focused on Sandy Lake, Ontario, where greenhouse gas (GHG) abatement costs were calculated for seven different scenarios.
Yanda Huo et al. [70] presented a lightweight data-driven scheduling method for hybrid energy storage systems. Case studies demonstrated that the proposed method offers the lowest average electricity cost. Furthermore, the maximum 5 min fluctuation is reduced by more than 50% thanks to the energy storage system (ESS). In this regard, Ning Zhang et al. [67] presented an analysis of the regional energy market based on price equalization using a hierarchical reinforcement learning algorithm. By implementing the trading process, the market operator can equalize various types of energy using conversion devices, thereby increasing the equalization efficiency. A multi-energy trading market model was defined that avoids user information disclosure and guarantees user autonomy in trading.
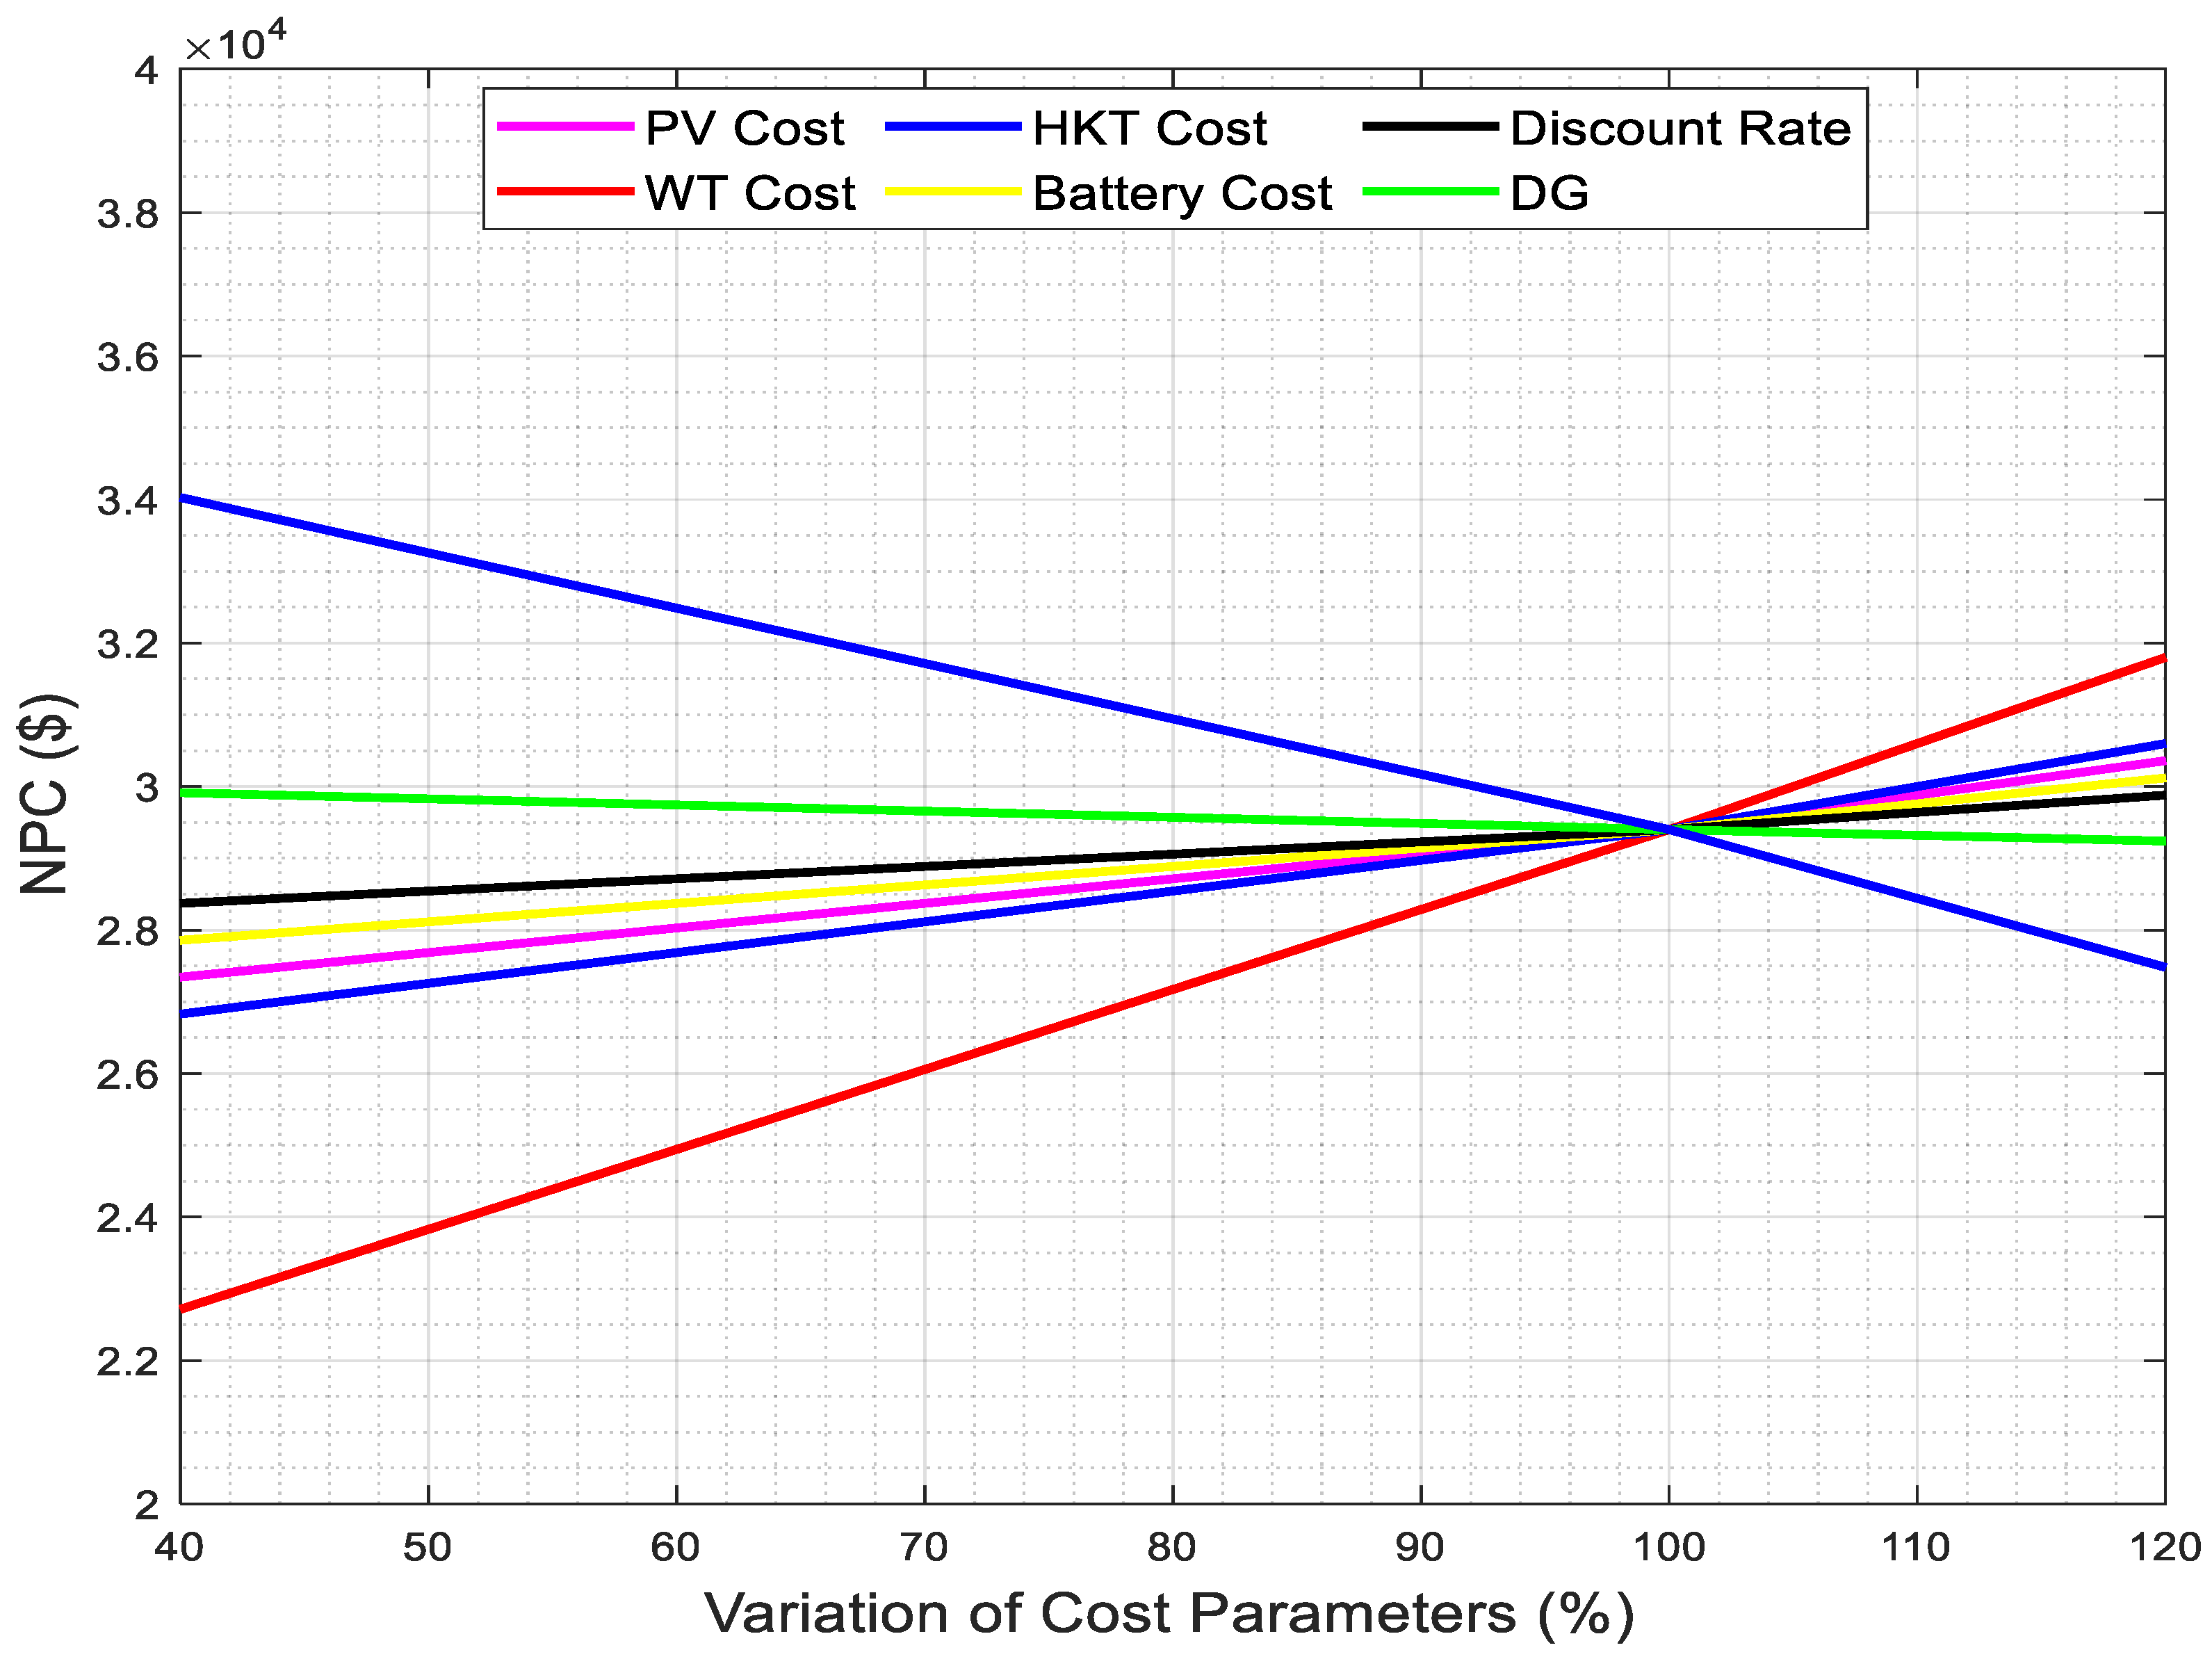
Some studies in Ecuador are recognized in the international scientific community. Antonio Cano et al. [38] presented a survey conducted in the city of Cuenca, which involved an energy analysis and techno-economic evaluation of a hybrid system with a biomass gasifier. The fluctuation in capital costs leads to an increase in both the Net Present Cost (NPC) and the Cost of Energy (COE) of the system. Specifically, the rising prices of biomass and photovoltaic generators are the main contributors to this escalation, resulting in NPC increases of approximately USD 90,000 and USD 130,000, respectively, under the deterministic case (DC). The rise in COE is USD 0.15/kWh for the biomass price and USD 0.08/kWh for the photovoltaic system. Luis A. Pesantes et al. [71] presented an optimal design for a hybrid microgrid in isolated communities in Ecuador. By running a k-means clustering algorithm on a meteorological dataset from the Cerrito de los Morreños community in the Gulf of Guayaquil, the hourly representative values become input parameters in the proposed optimization model. The method for optimal hybrid microgrid design is analyzed in six scenarios. A mathematical programming language (AMPL) was employed to solve the proposed optimization model. The results indicate that in scenarios where 100% of the load demand is met—excluding the fully renewable energy scenario—the total microgrid cost increases by over 16% compared to scenarios with restricted generator set operation. Additionally, in designs constrained by power capacity, the total cost of the microgrid under the load-shedding scenario is reduced by more than 27% when compared to the equivalent scenario without load shedding. Danny Ochoa and Sergio Martínez [72] presented a novel investigation involving the modeling of a hybrid wind/diesel power system for frequency control studies on San Cristóbal island. The authors highlighted that certain technical characteristics, such as the small capacity of conventional generators, a high share of wind energy, low overall energy demand, and the lack of energy storage systems, can compromise system operation and control due to a limited stability margin. They observed that during the windiest season of 2015, the island experienced multiple blackouts triggered by the activation of frequency protection relays in the generating units, although the exact causes remain unclear. To address this, they developed a MATLAB/Simulink®-R2024b based analysis tool designed to simulate the dynamic behavior of key system variables under power contingencies. This tool facilitates the identification of potential causes of frequency-related events in systems with similar configurations. Federico Córdova-González et al. [73] conducted an analysis on the deployment of distributed renewable energy generation systems in the Marianza-Cuenca community, a region highly vulnerable to landslides. This study presents an option for providing energy solutions to geologically at-risk regions. It has been shown that renewable energy systems can be helpful options for providing electricity to homes that people are reluctant to abandon despite the imminent danger. The renewable energy system is integrated with the local public electrical grid; however, in the event of an emergency, the grid is automatically disconnected for safety reasons, allowing the hybrid system—supported by a battery backup—to operate independently.

2. Methodology

The scientific methodology used in the analysis of the hybrid system composed of a photovoltaic system, wind turbine, hydrokinetic turbine, and diesel generator at the CIITT campus of the Universidad Católica de Cuenca led to an acceptable approach that allows for the integration of all available energy sources with the best integration options and associated costs. This study aims to leverage the renewable energy sources available on the research campus, while also utilizing the diesel generator as needed until its useful life expires. To conduct this research effectively, the Homer Pro design tool was utilized, enabling the assessment of the hybrid system’s performance and, in critical scenarios, its ability to be supported by a battery bank. The objective is to ensure uninterrupted electrical service on the CIITT campus, which is essential for the daily operation of the research. Social and economic aspects are also analyzed, with corresponding results for the study area.
In the methodological analysis of this research, the Homer Pro version 3.16.2 design tool is employed, as recommended by several academics and researchers for its effectiveness and excellent features. This tool features a continuously updated information structure for equipment currently on the market, enabling simulations under various conditions. Homer Pro includes catalogs with equipment details and parameters, the same ones currently available on the market. This is precisely one of the strengths of using this tool, in addition to providing a wide range of options. It is also possible to establish direct links with MATLAB to display the main results in a more organized visual format with more customized graphic styles. It also allows for calibrations or optimizations according to the researcher’s presentation interests and the identified constraints. This tool is also handy for conducting economic studies subsequent to the hybrid system design or for determining the most optimal condition that links the technical and financial aspects. The scheme presented below in Figure 2 represents the methodological analysis of this study.
This study is organized as follows: Section 1 provides an introduction and a literature review. Section 2 presents the methodology. Section 3 designs the hybrid system, which comprises a photovoltaic, wind, hydrokinetic, and diesel generator. Section 4 details the modeling and simulation of the proposed hybrid system, followed by the presentation of results in Section 5. Finally, Section 6 outlines the main conclusions of this study.

3. Wind/PV/Hydrokinetic/Diesel Generator System

Figure 3 presents a hybrid system comprising renewable energy sources (wind, PV and hydrokinetic) and non-renewable energy sources (a diesel generator). The renewable energy initially contribute 24-volt direct current to the system, and then, through an inverter, the power is distributed to the buildings comprising the CIITT in alternating current. The analysis in this study is isolated; therefore, the sizes of the equipment containing the hybrid system are specified.
The lithium battery’s charging and discharging process is controlled by a charging and discharging control system. Figure 3 details the energy sources used to form the hybrid system, which has high potential to become a benchmark for higher education institutions in the city of Cuenca.

3.1. Demand Profile

It is important in electrification studies to consider the energy demand at the site under analysis. In the case of CIITT, the total load previously determined in the previous research provided in reference [74] was evaluated, and its general data were entered into the Homer Pro design tool. Hourly demand data specific to the sector were utilized and input into the Homer Pro tool, as illustrated in Figure 4. The highest demand is recorded during the weekday between 8:00 and 17:00, as researchers commonly work during these hours. However, attention should not be paid to the rest of the day, when some activities are also carried out but which require lower energy consumption. The highest consumption peaks are recorded during the hours around noon, with values reaching 9 kW. This demand behavior leads to the prediction that the size of the storage system will not be significant but will be required to guarantee the autonomy of the energy system. Should demand increase or the hybrid system fail to produce enough power for unusual reasons, the backup system will immediately intervene. Even the diesel generator, which has been operating for several years, will be essential to provide sufficient power to the research center.
Figure 5 illustrates the annual power demand in relation to daylight hours. Figure 5a displays a yearly spectrogram of daily demand behavior, while Figure 5b presents the seasonal profile in monthly box plots, illustrating a peak power of 17.8 kW in February and March.

3.2. Hybrid System Modeling for CIITT

The hybrid system consists of four sources, three of which are renewable and one is fuel-based. The renewable sources consist of a wind turbine (WT), a hydrokinetic turbine (HKT), and a photovoltaic (PV) turbine, and the non-renewable source is a diesel generator (DG), forming an autonomous system for the research center with lithium battery backup.

3.2.1. Photovoltaic Solar Panels

The research center already has a photovoltaic system that primarily powers the renewable energy laboratory. However, in this case, it is appropriate to utilize the roofs of buildings and surrounding spaces outside the area that includes the Miracielos ranch, considered a heritage site. Solar energy in higher education institutions in the city of Cuenca is regarded for its internal technological transformation processes, and the CIITT campus is part of that development. In this research, it is considered one of the primary sources of energy supply that will complement the other sources that make up the hybrid system. The interest lies primarily in the fact that these sites enjoy significant levels of solar radiation, in addition to the ease of installing solar modules and their potential for on-site expansion. The internal plans and projects of the Universidad Católica de Cuenca are focused on transforming several of its campuses into sustainable ones that contribute to the country’s and the world’s energy transition.
The photovoltaic module considered in this study is monocrystalline, 9-bushbar, 166 mm cells, 24 V, 230 Wp. It is suitable for installation on building roofs, even in open spaces, and is considered both interesting and valuable in current implementations. It is easily connected to other equipment, such as modern inverters and charge controllers, and adequate ventilation levels are provided in current spaces. The technical details are presented in Table 1. Solar radiation is relatively high at the site throughout the day but especially during midday. The output power of the photovoltaic solar system is presented below in Equation (1):
P p v = f p v × Y p v × I T I S             [ W ]
Y P V represents the nominal capacity of the PV panel array, while f P V denotes the progressive loss factor, which accounts for factors such as power losses due to conductor length, splice or terminal inefficiencies, and surface soiling of the panels. I S is considered a reference irradiance value of 1000 W/m2, representing optimal solar conditions, whereas I T refers to the total incident solar radiation on the panel surface, measured in Wh/m2.
The temperature to which the solar panels are exposed must be considered and can be determined using Equation (2):
T C = G S   N O C T 25 1000 + T a m b             [ ° C ]
G S denotes the global solar irradiance measured in W/m2, while T a m b refers to the ambient temperature expressed in degrees Celsius (°C). NOCT is the normalized temperature of the cell that is considered with global radiation of 1000 W/m2, and it is a reference ambient temperature at 25 °C.

3.2.2. Hydrokinetic Turbine

This energy source is designed to harness the available energy potential of the open canal that runs through the property where this research is focused. The selected turbine is the 5 kW Smart monofloat. It is a reasonably inexpensive, commercially available, and easy-to-install unit, allowing for its installation along the canal without affecting the local flora and fauna. With this integration, the hybrid system can be well complemented, and the energy supply is expected to be uninterrupted. Its compact size is watertight and requires no cumbersome maintenance. The operating voltage is harmonized to 24-volt DC.
The electrical output power provided by the hydrokinetic turbine is evaluated via Equation (3), where ρ W in kg/m3 is the density of the water, v is the speed of the water flow in m/s, the A is the area of the HKT in m2, ( C p , h ) the combined efficiency of the HKT generator, ɳ H K T is the efficiency of the HKT generator.
P H K T = 1 2 × ρ W × A ×   v 3 × C p , h   × ɳ H K T ×   t             [ W ]
To obtain the water velocity profile, measurements were taken in half of the 75 cm wide open channel. The maximum velocity is 3.8 m/s, and the average is 3.3 m/s. These velocities are adequate, despite the narrow channel. The hydrokinetic turbine can be easily installed, and in the future, a cascade of turbines can be established in suitable locations. The hydrokinetic turbine was selected to ensure market availability and is included in the equipment catalog in the Homer Pro tool. Its characteristics are detailed in Table 2.
The energy generated during the year is determined by Equation (4):
E = t = 1 t = 8760 h P t × t             [ J ]

3.2.3. Wind Turbine

The PWT produced by the wind turbine can be evaluated with Equation (5).
P W T ( t ) = 1 2 C p ( λ , β ) ρ a A v w 3             [ W ]
The power production depends on the wind speed (vW). R is the turbine radius. The relation λ defined as λ = m/v, ωm is the velocity angle of the turbine shaft. Cp is the Betz coefficient in relation to angle β and λ. ρ a is air density.
The power output P W T a b of the wind turbine is a function of wind speed, as shown in Equation (6), detailed by reference [75]:
P W T a v t =   0   i f   v w < v i   1 2 C p λ , β ρ a A v 3 t   i f   V i   v w     v r   P w r   i f   v r < v w < v c   0   i f   v w > v c
The minimum speed is vi and the cutting speed is vc. Turbine operation with a speed higher than the rated wind speed is vr.
The minimum wind speed required for turbine operation is denoted as vᵢ, while vc represents the cut-out speed. The turbine operates at optimal performance when wind speeds exceed the rated wind speed, vr.
If the wind speed exceeds 20 m/s, the wind turbine stops for safety.
Table 3 presents the specifications of the wind turbine.

3.2.4. Diesel Generator

DG must contribute to meeting the energy demand at the research center. The output power is given by Equation (7). DG’s characteristics are shown in Table 4.
E D G = P D G × η D G × t

3.2.5. Batteries

The backup system is made up of lithium batteries. The purpose is to increase the reliability of electrical service at the research center, where power outages are unacceptable since experiments are at stake that, in many cases, are carried out over several months, even years. The most relevant equipment data are identified in Table 5 below.
The hybrid system’s battery bank must operate continuously for the system’s 25-year lifespan. It is recommended that the batteries be replaced three times during this period. The battery bank N b a t is determined using Equation (8).
N b a t = c e l l L i f e H S × L i f e b t p u , y e a r T b a t l i f e
  • L i f e H S Useful life of the entire hybrid system.
  • T b a t l i f e : Period of time until the battery bank is replaced.
  • L i f e b t p u , y e a r Battery life during last year.
The energy backup systems operate in two modes, charge and discharge, which can be determined by the mathematical relationships (9) and (10), as recommended in reference [76]. The backup system, consisting of a battery bank, is directly linked to the energy generation system.
E b a t is the battery capacity. ɳ c b a t and ɳ d b a t are the battery charge and discharge efficiencies, respectively. The SOC (T) is the state of charge of the battery at time t.
S O C T = S O C t 1 + E b a t t   × ɳ c b a t P b a t × 100
S O C T = S O C t 1 + E b a t t   × ɳ d b a t P b a t × 100
Energy generation and consumption is calculated as a function of time:
  • P P V T + P H K T T + P W T T + P D G T > P D E M A N D T The total power generation of the hybrid system exceeds the load demand.
  • P P V T + P H K T T + P W T T + P D G T = P D E M A N D T The battery is totally stable and does not change.
In this case, the battery is 100% charged in time (T) and given by Equation (11);
E b a t T E b a t T 1 · 1 τ + P P V T + P H K T T + P W T T + P D G T P l T n i n v n b c
where:
  • n b c : Charge efficiency of the battery bank.
  • n i n v : Efficiency of the inverter.
  • E b a t T and E b a t T 1   : Battery charge amounts at times T − 1 and T.
  • P l T : Energy received by the demand in a specific hour.
  • τ : Hourly self-release rate.
  • P P V T : Power generated by PV.
  • P W T T : Power generated by wind turbine.
  • P H K T T : Power generated by HKT.
  • P D G T : Power generated by DG.
  • P P V   T + P H K T T + P W T T + P D G T < P D E M A N D T In this scenario, the load demand surpasses the total power output of the hybrid system. At this point, the battery begins discharging its stored energy, as represented in Equation (12) [77].
E b a t T E b a t T 1 · 1 τ + P l T n i n v P P V T + P H K T T + P W T T + P D G T n b f
n b f : Battery discharge efficiency.

3.2.6. Inverter

Equation (13) defines the maximum DC-to-AC conversion capacity of the power inverter ( P i n v t ), which is influenced by the inverter’s efficiency [78].
P o t = P i ( t ) η i n v  
The input power to the inverter, P i t , is supplied by the renewable energy system. In this study, the inverter operates with an efficiency of 95%.

3.2.7. Hybrid System Power

The total power obtained from the hybrid system configuration is defined in Equation (14):
P t o t a l t = p v = 1 S n P P V t + W T = 1 S o P W T t + w = 1 S t P H K T t + w = 1 S r P D G t    
S n , S o , S t , S r are the total number of PV modules, wind turbines, hydrokinetic turbines and diesel generators, respectively.

3.3. Techno-Economic Analysis

The hydrokinetic and wind turbine systems are designed to be integrated into the existing solar photovoltaic system and diesel generator for optimal configuration. The purpose of this section is to include the Net Present Cost (NPC) of the hybrid system’s equipment in the analysis, aiming to minimize it as much as possible. To determine the Total Annual Cost (TAC), we calculate it using Equation (15):
T A C = C a c a p + i = 1 n C 0 & M , i + C f + i = 1 n C R , i
Contemplating a scheme of minimized costs M i n M t P p v D t , P p v A t , P w t t , P B a t t , P h k t t , P D G t , each contribution is evaluated based on its specific constraints using Equation (16).
M i n M t P p v D t , P p v A t , P w t , P B a t t , P h k t t , M D G t = M i n M p v D t , M p v A t , M w t t , M B a t t , M h k t t M D G t
where M t is the cost of the hybrid system.
M p v D t , M p v A t , M w t , M B a t t , M h k t t ,   M D G t Parameters related to the individual costs of each technology and their complementary components required for the integrated operation of the hybrid system.
The total cost of the hybrid system is assessed using the (NPC) parameter, calculated through Equations (17) and (18).
M N P C = M a n n , T o t C R F i , R p r o j  
C R F i , R p r o j corresponds to the capital recovery factor with an interest rate of 1%, M a n n , T o t is the total annual cost in USD/year, M N P C is the net current cost, and R t h is the lifetime of the project in years, see Equation (18).
C R F I , N = I 1 + I N 1 + I N 1  
  • N = Number of periods (years).
  • I = Interest rate.
The (COE) is evaluated using Equation (19):
C O E = M a n n , T o t M s t o r a g e E t h e r m a l E p r i m A C + E p r i m e D C + E d e f + E g r i d s a l e s

4. Modeling and Simulation

The hybrid system design is required to ensure continuous electrical service to CIITT, a high-performance center for scientific research and the subject of important scientific developments. Based on meteorological measurements taken at the research center and available on the RESMUCC platform of the Universidad Católica de Cuenca, the data are entered into the Homer Pro tool to perform the respective analyses and obtain the results in terms of electrical power, as presented in Figure 6.

4.1. Data Entry

The profiles detailed below provide data that serve as input to the Homer Pro model, which is essential for the simulation process, including wind speed, solar radiation, and water kinetics [79,80].

4.1.1. Wind Speed

Wind energy is one of the most promising renewable energy sources, and several countries consider it a suitable option during their energy transition processes. Several countries’ roadmaps for 2050 include ambitious targets for wind energy production. At the micro and small scales, several applications, such as [31,81,82], exist, including wind energy systems that, by forming hybrid systems, have achieved notable results in electrification processes.
Figure 7 shows the hourly wind speed profile for a calendar year on the CIITT campus.

4.1.2. Solar Radiation

Figure 8 shows the hourly solar radiation profile over one year on the CIITT campus. Radiation levels consistently exceed 510 W/m2 and, in specific periods, reach significantly higher levels of around 640 W/m2.

4.1.3. River Speed

In Cuenca and its surrounding areas, 95,000 of the 308,600 hectares in this canton are water recharge areas. Approximately 4200 bodies of water have been identified in these locations. The Tomebamba, Yanuncay, Machángara, and Tarqui rivers flow into these areas, flowing through the city. The city owns sixty percent of the water recharge areas. However, the most significant wealth lies within the 28,544 hectares of Cajas National Park (CNP). This reserve is located 35 min northwest of the city of Cuenca and contains 786 lagoons. The national park is the core zone of the million hectares that comprise the UNESCO-declared Biosphere Reserve.
The Ricaurte area, where the CIITT is located, has open canals that can be used for energy generation at specific points. The key benefit of incorporating these hydrokinetic turbines is that they generate no pollution. Installing these turbines requires a small space on the canal bank, and their placement is not difficult. This study aims to promote the responsible and virtuous use of renewable natural resources, with the goal of determining the technological feasibility. Figure 9 below shows the annual velocities recorded in the open canal.

4.2. Total Equipment Defined

The equipment was selected based on the Homer Pro database. In addition, market availability was compared, considering not only the low cost but also the quality and recognition in other parts of the world. Once the primary input data were entered, simulations of the hybrid system were performed to identify its operation under different conditions. The analysis also involved identifying potential power shortages to the load at specific times. Runs in the tool revealed that the hybrid system provides sufficient power to the load; in exceptional cases of shortages, the battery backup system would be activated. The equipment sizing is complete when the designer is confident that the results meet the study’s conditions and expectations.
The equipment that will be used in the hybrid system is summarized in Table 6. Existing equipment, such as the solar panels and diesel generator, has been assessed according to its current state, considering it is not new but in good condition. The remaining equipment is considered modern and completely new.

5. Results and Analysis

To determine whether the hybrid system is adequately designed and provides power continuity from generation to load, corresponding simulations are performed. Runs in the Homer Pro tool will enable the establishment of optimal system design options. This includes resizing the equipment while maintaining the robustness of the overall system and avoiding excessive cost increases. Several sizing options and units required by the source are presented; ultimately, the designer selects the most optimal one that aligns with the future perspectives of the center under analysis. It is essential to note that new lines of analysis may be developed in the future, and the project’s perspective may evolve. In this sense, a new appraisal can be performed and the study updated without implying that the previously implemented equipment will be unused. An energy balance is performed for two seasons of the year, considered crucial due to the potential for severe winters or drought. The analysis, presented by source seasonally, is shown in Figure 10 and is organized based on load demand. The analysis consists of comparing hourly electricity production based on demand. This systematic assessment can be considered an interesting way to optimize the energy resources and equipment required to ensure the whole operation of the hybrid system. The partial power generated by each type of technology and the load demand are identified in the balance. The integrated energy system, including its sources and load, is presented in Figure 10a,b. The monthly generation system evaluation by source is presented in Figure 10c. Solar energy is expected to be a primary source in the energy mix, consistently exceeding 15 kW, complemented by wind, hydrokinetic, and distributed generation (DG). HKT technology contributes in smaller proportions, around 5 kW, but exhibits less fluctuation, and its production is continuous, covering 24 h a day. Wind and hydrokinetic energies complement photovoltaic solar energy very well. The analyses developed have also considered evaluating the system operating solely with renewable energies, that is, without the current diesel generator. It can be observed that sufficient power can be supplied to the load, although it is very close to the admissible limits. Service to the center can be guaranteed when the backup system is available.
The current photovoltaic solar energy system located on the CIITT grounds is of great importance and may expand in the future. Various authors, such as [79,80], recommend the implementation of PV systems due to their ease of installation and the ability to form hybrid systems with other technologies. Another advantage is that, from an economic perspective, this technology tends to reduce its production costs, leading to greater access to electrification projects for different economic strata. The CIITT has ample space that can be better utilized. These spaces include, in addition to solar PV, other technologies such as wind, hydrokinetic, and a DG, which requires the design of a very interesting hybrid system.
The Homer Pro tool allows for a techno-economic analysis of the hybrid system. This is the tool’s purpose. It includes an evaluation of the nominal cash flow. This tool displays the initial investment required, equipment direction, operation and maintenance costs, and the year in which the system is expected to reach profitability. The graphical representation is shown using vertical bars from point 0 downwards; these represent cash flows or investments, while the ascending ones represent revenue. The first descending bar corresponds to the initial investment requirement, which typically represents a fairly high amount relative to the other items; in this case, it is USD 38,000. The subsequent bars also include outflows for operations and maintenance. The project is planned for 25 years according to Figure 11. In the final year, a positive amount is generated, i.e., the first cash inflow after having overcome a series of financial disbursements.
The costs associated with this study vary over the 25 years. Variations in the capital cost of each piece of equipment vary for the NPC, as represented in Figure 12. A price variation of 40% to 120% relative to current values was considered for the different components. The importance of keeping the system operational depends on the availability of sufficient funds to keep it operational over time but, above all, on the high levels of solar photovoltaic power production. WT tends to vary significantly in price compared to other technologies. HKT technology also tends to vary and should be kept in mind. Meanwhile, BAT is one of the technologies with the least variation. Photovoltaic modules are less sensitive to the NPC.
The amount of energy generated by each source, the efficiency of each system, the excess energy, and the CO2 emissions emitted were determined. Three dispatch scenarios were evaluated: load cycle, combined dispatch, and load shadowing. We noted that the system consisting of WT-HKT-DG generated the most NPC, while the least effective was the combined dispatch, as shown in Figure 13. Meanwhile, the one that produced the most significant excess energy was the one composed of all WT-PV-HKT-DG sources, reaching a maximum of 90%, as shown in Figure 14. The combination that made the least CO2 emissions was the one composed of renewable energy sources, PV-HKT-WT, as shown in Figure 15.
Figure 13, Figure 14, Figure 15 and Figure 16 present the scenarios (a) to (h) according to the combination of generation technologies that make up hybrid systems from 2 to 4 technologies and determine their NPC, Energy Excess and CO2.
Data are collected using instruments integrated into the CIITT campus meteorological station, including thermometers, anemometers, rain gauges, and pyranometers, among others. Measurements are recorded at intervals ranging from seconds to an hour; in this case, they are measured hourly, depending on the parameter. Data are stored in automatic recorders and displayed on the CIITT center’s RESMUCC platform. The instruments are regularly calibrated to maintain their accuracy.
The NPC, the TAC, and the EOC are key economic indicators used to assess the viability and profitability of energy projects, especially those related to renewable energy. The NPC is a financial measure that calculates the present value of all costs and benefits associated with a project over its useful life, discounting the time value of money. A negative NPC indicates that the project does not recover the initial investment. On the other hand, the TAC represents the equivalent annual cost of the project, considering the initial investment, operation and maintenance costs, and other relevant expenses, distributed throughout its useful life. This indicator allows for a standardized comparison of projects with different durations and cost structures. Finally, the EOC expresses the cost per unit of energy generated (usually in USD/kWh) over the entire life of the system. This indicator allows for comparing different energy technologies based on their economic efficiency. Together, these three indicators offer a comprehensive view of the costs associated with a project, facilitating informed financial decision making.
Similar systems have already been developed within the Cuenca canton and applied to airplane-shaped buildings. The initial energy supply was using solar photovoltaic energy, which required the development of a fairly large battery bank, as production was unavailable at night and the energy needs during these hours are as presented in reference [83]. The energy system subsequently included an additional source, such as wind power, presented in reference [81]. In this case, energy production increased, and, above all, a large portion of the production was achieved at night, although this was not sufficient to eliminate the need for a battery backup system. This system is technically more reliable, although it tends to increase economically. In a third phase, open channel water currents are harnessed and a hydrokinetic turbine is installed, thus fully guaranteeing electrical service. It is even possible to obtain surplus energy that is used to externally illuminate the paths adjacent to the airplane-shaped ecological building, as presented in reference [82]. These experiences provide the basis for this study to be implemented, considering the energy potential available on the CIITT campus.

6. Conclusions

The design of hybrid systems combining renewable and non-renewable energies is currently highly beneficial for rural electrification, particularly in applications where ensuring continuous electrical service is of utmost importance. Institutions such as the Universidad Católica de Cuenca are always committed to providing society with professionals who have received excellent academic training; therefore, it has laboratories and centers equipped with top-level technology. In this sense, the services provided must be guaranteed with comfortable and adequate infrastructure, including electrical services. The intended service must be harmonious with the environment; therefore, a significant portion of this service is designed to provide energy through a hybrid system that utilizes three renewable energy sources and one non-renewable energy source. Currently installed at the center, the system will be exclusively powered by the renewable energy system after its useful life has expired. It will operate in the future, fully guaranteeing electrical service to the load. The PV-WT-HKT-DG renewable sources were effectively integrated. A battery bank is available for eventual operation without DG, or the sources together may not fully supply energy to the load at some point during the day, which may increase in the future due to possible laboratory expansions or additional equipment in existing ones. This study used actual electrical demand data and energy profiles measured by the CIITT meteorological station, most of which are available on the RESMUCC open platform. These data were entered into the design in Homer Pro for analysis and to obtain the most relevant results in terms of power to supply the load. Optimization is achieved by selecting commercially available equipment with parameters defined on site. Three energy control systems are included, and the most appropriate options are presented to ensure regular operation under different conditions.
It is also recognized that the lowest COE is achieved thanks to the combination of different sources in the last two scenarios, namely PV-WT-HKT-DG and PV-WT-HKT. The exact COE value is USD 0.33/kWh for the LF control.
Using CC and LF controls, the PV-WT-HKT system is more economical considering that after a certain period of time, the DG will reach the end of its useful life. Consequently, the hybrid system, using 100% renewable technologies, will meet its objective of supplying the Center’s full load. By having battery backup systems, energy service to the laboratory complex will be guaranteed. The LF control produces significant savings when operating the HKT, as it serves both day and night. Considering that its power levels are not as high, they are sufficient to operate in conjunction with the other renewable energy systems and maintain the battery charge above 40%. This creates a positive impact both technically and economically. Furthermore, by operating the hybrid system with entirely renewable sources, the system becomes completely sustainable and produces no CO2 emissions.
The battery state of charge should ideally be above 40% and not fall below this level; it should not drop to 0 V under any circumstances. Because the SOC is low, the overall system cost tends to be low, but it requires a significant increase in renewable energy penetration, which is not technically feasible.
Simulations under different operating conditions were conducted using Homer Pro with 10 min periods, which have proven to be quite accurate. Suppose the system, as presented for the CIITT location, does not lead to implementation in the short term. In that case, it is recommended to reevaluate the impact of economic and technical factors, to achieve a substantial benefit.
New locations for the future within the CIITT campus must be planned. It is appropriate to integrate the energy component in a much more precise and comprehensive manner. Renewable energy potential is a strength that is not easy to find on any campus; therefore, it must be better leveraged.
As future work, it is recommended to conduct an analysis of this case study with grid connection and identify the strengths and weaknesses that may arise under these other conditions, knowing that there are significant benefits enacted in the ORGANIC LAW TO PROMOTE PRIVATE INITIATIVES IN ENERGY GENERATION, RATED AS URGENT IN ECONOMIC MATTERS [84], No. 673, issued on 28 October 2024.

Author Contributions

Data curation, D.I.-A. and D.B.-D.; formal analysis, D.I.-A. and D.B.-D.; writing—original draft, D.I.-A.; writing—review and editing, D.I.-A. and D.B.-D. All authors have read and agreed to the published version of the manuscript.

Funding

This research received no external funding.

Data Availability Statement

The original, unprocessed, unfiltered measurements are available at: https://weatherresmucc.vercel.app/ (accessed on 14 March 2025). Data measured by the Universidad Católica de Cuenca network of meteorological stations are available in open access and will gradually be integrated into this platform so that researchers from around the world can access and generate new knowledge. You can contact Daniel Icaza Alvarez to conduct collaborative research by email: dicazaa@ucacue.edu.ec or diaelectrico@hotmail.com.

Acknowledgments

We would like to thank the Universidad Católica de Cuenca for its contribution to the internationalization of knowledge.

Conflicts of Interest

The authors declare no conflicts of interest.

Nomenclature

AMPLA mathematical programming language
BESSBattery Energy Storage System
CCCycle Charging
CDCombined Dispatch
COECost of Energy
CO2Carbon dioxide
CIITTCentro de Investigación, Innovación y Transferencia Tecnológica
CNPCajas National Park
CRFCapital recovery factor
DGDiesel generator
GHGGreenhouse gas
HKTHydrokinetic
IEAInternational Energy Agency
LFLoad Following
NPCNet Present Cost
O&MOperation and Maintenance
PVPhotovoltaic
RERenewable energy
RESRenewable Energy Sources
SOCState of Charge
TACTotal Annual Cost
TESThermal energy storage
UNUnited Nations
WTWind turbine

References

  1. Wang, W.; Downey, J. Becoming Cosmopolitan? Comparing Climate Change Coverage in Newspapers Across Countries. J. Pract. 2025, 19, 379–407. [Google Scholar] [CrossRef]
  2. Desde México, Pasando por Ecuador y Hasta Argentina, Así se Vive la Crisis Eléctrica en la Region. Available online: https://www.primicias.ec/economia/crisis-electrica-cortes-luz-ecuador-america-latina-sequia-81663/ (accessed on 14 March 2025).
  3. Ullah, W.; Dong, H.; Shah, A.A.; Xu, C.; Alotaibi, B.A. Unveiling the Multi-Dimensional Vulnerabilities of Flood-Affected Communities in Khyber Pakhtunkhwa, Pakistan. Water 2025, 17, 198. [Google Scholar] [CrossRef]
  4. Borah, G. Urban Water Stress: Climate Change Implications for Water Supply in Cities. Water Conserv. Sci. Eng. 2025, 10, 20. [Google Scholar] [CrossRef]
  5. Chapter 12: Central and South America. Available online: https://www.ipcc.ch/report/ar6/wg2/chapter/chapter-12/ (accessed on 14 March 2025).
  6. Swing, K.; Chaves, J.; de la Torre, S.; Sempertegui, L.; Hearn, A.; Encalada, A.; Suarez, E.; Rivas, G. Outcomes of Ecuador’s Rights of Nature for Nature’s Sake. Adv. Environ. Eng. Res. 2022, 3, 035. [Google Scholar] [CrossRef]
  7. Matovelle, C.; Mudarra, M.; Andreo, B. Efficiency analysis of irrigation ditches over different land uses in the Andean region of Ecuador: Implication for nature-based water management strategies. Environ. Earth Sci. 2025, 84, 107. [Google Scholar] [CrossRef]
  8. Ecuador’s Energy Crisis Calls for Urgent Reform—Global Business Outlook 2025. Available online: https://globalbusinessoutlook.com/magazine/industry/ecuadors-energy-crisis-calls-for-urgent-reform/ (accessed on 14 March 2025).
  9. Ecuador Expands Power Cuts to 14 Hours a Day Due to Drought. Available online: https://apnews.com/article/ecuador-power-cuts-drought-59690c310e7c30136aad2ac7a75a043e (accessed on 14 March 2025).
  10. Escamilla-García, P.E.; Fernández-Rodríguez, E.; Jiménez-Castañeda, M.E.; Jiménez-González, C.O.; Morales-Castro, J.A. A Review of the Progress and Potential of Energy Generation from Renewable Sources in Latin America. Lat. Am. Res. Rev. 2023, 58, 383–402. [Google Scholar] [CrossRef]
  11. Changing Climate Overwhelms Ecuador’s Hydroelectric System, Highlighting Need for New Energy Strategies—CuencaHighLife. Available online: https://cuencahighlife.com/changing-climate-overwhelms-ecuadors-hydroelectric-system-highlighting-need-for-new-energy-strategies/ (accessed on 14 March 2025).
  12. Servicio de Energía Electrica Opera con Normalidad. Available online: https://www.celec.gob.ec/gensur/noticias/servicio-de-energia-electrica-opera-con-normalidad/ (accessed on 14 March 2025).
  13. CIITT, Nexo Entre Academia, Investigación y la Sociedad. Available online: https://www.elmercurio.com.ec/cuenca/2024/01/22/patrocinado-ciitt-universidad-catolica-cuenca-investigacion-academia/ (accessed on 14 March 2025).
  14. Nutri Utiliza Energía Solar Para Crear Sus Productos—Diario el Mercurio. Available online: https://www.elmercurio.com.ec/actualidad/2022/04/29/nutri-utiliza-energia-solar-para-crear-sus-productos/ (accessed on 14 March 2025).
  15. Universidad del Azuay Logra Autonomía Energética Con Sistema Fotovoltaico—Prensa. Available online: https://www.uazuay.edu.ec/prensa/universidad-del-azuay-logra-autonomia-energetica-con-sistema-fotovoltaico (accessed on 14 March 2025).
  16. Inicio. Available online: https://ciitt.ucacue.edu.ec/ (accessed on 25 February 2025).
  17. Duflou, J.R.; Sutherland, J.W.; Dornfeld, D.; Herrmann, C.; Jeswiet, J.; Kara, S.; Hauschild, M.; Kellens, K. Towards energy and resource efficient manufacturing: A processes and systems approach. CIRP Ann. 2012, 61, 587–609. [Google Scholar] [CrossRef]
  18. Terlouw, T.; Gabrielli, P.; AlSkaif, T.; Bauer, C.; McKenna, R.; Mazzotti, M. Optimal economic and environmental design of multi-energy systems. Appl. Energy 2023, 347, 121374. [Google Scholar] [CrossRef]
  19. Hassan, Q.; Viktor, P.; Al-Musawi, T.J.; Mahmood Ali, B.; Algburi, S.; Alzoubi, H.M.; Khudhair Al-Jiboory, A.; Zuhair Sameen, A.; Salman, H.M.; Jaszczur, M. The renewable energy role in the global energy Transformations. Renew. Energy Focus 2024, 48, 100545. [Google Scholar] [CrossRef]
  20. Barrett, G.; Crowley, F. Offshore renewable energy SMEs’ innovation interactions across the triple helix: A management as practice perspective. J. Technol. Transf. 2025. [Google Scholar] [CrossRef]
  21. Saleem, S.; Zhang, Y. Impact of knowledge and trust on households’ solar energy consumption behavior: Do social influence and gender matter? Energy 2024, 293, 130719. [Google Scholar] [CrossRef]
  22. Mendez Duran, J.H. Evolución de las energías renovables en España y Ecuador: Un análisis comparativo de datos recientes y tendencias anteriores. REINCISOL Rev. Investig. Cient. Soc. 2025, 4, 358–381. [Google Scholar] [CrossRef]
  23. 75 Ecuador—Electric Power and Renewable Energy. Available online: https://www.trade.gov/country-commercial-guides/ecuador-electric-power-and-renewable-energy (accessed on 14 March 2025).
  24. Naranjo-Silva, S. A hydropower development perspective in Ecuador: Past, present, and future. La Granja 2024, 39, 63–77. [Google Scholar] [CrossRef]
  25. Icaza Álvarez, D.O. Planificación Energética Inteligente a Largo Plazo Integrando Sistemas de Energías Renovables Para Cubrir la Demanda Eléctrica Futura del Ecuador (Long Term Intelligent Energy Planning Integrating Renewable Energy Systems to Cover Ecuador’s Future Electricity Demand). Ph.D. Thesis, University of León, León, Spain, 2023. [Google Scholar] [CrossRef]
  26. Mohamed, O.S.; Melani, P.F.; Soraperra, G.; Brighenti, A.; Ferrara, G.; Betti, V.; Balduzzi, F.; Bianchini, A. Development of a computationally efficient CFD model for vertical-axis hydrokinetic turbines: A critical assessment. Ocean Eng. 2025, 324, 120692. [Google Scholar] [CrossRef]
  27. Ibrahim, W.I.; Mohamed, M.R.; Ismail, R.M.T.R.; Leung, P.K.; Xing, W.W.; Shah, A.A. Hydrokinetic energy harnessing technologies: A review. Energy Rep. 2021, 7, 2021–2042. [Google Scholar] [CrossRef]
  28. Icaza, D.; Borge-Diez, D. Technical and economic design of a novel hybrid system photovoltaic/wind/hydrokinetic to supply a group of sustainable buildings in the shape of airplanes. Heliyon 2023, 9, e14137. [Google Scholar] [CrossRef]
  29. Arévalo, P.; Jurado, F. Performance analysis of a PV/HKT/WT/DG hybrid autonomous grid. Electr. Eng. 2021, 103, 227–244. [Google Scholar] [CrossRef]
  30. Ammari, C.; Belatrache, D.; Touhami, B.; Makhloufi, S. Sizing, optimization, control and energy management of hybrid renewable energy system—A review. Energy Built Environ. 2022, 3, 399–411. [Google Scholar] [CrossRef]
  31. Al-Shetwi, A.Q.; Atawi, I.E.; Abuelrub, A.; Hannan, M.A. Techno-economic assessment and optimal design of hybrid power generation-based renewable energy systems. Technol. Soc. 2023, 75, 102352. [Google Scholar] [CrossRef]
  32. Sucozhanay, D.; Arcentales, R.; Siguenza-Guzman, L. Leading Change: A Multiple-Case Study of Leadership Practices in Latin American Universities. In Proceedings of the 12th International Technology, Education and Development Conference (INTED2018 Proceedings), Valencia, Spain, 5–7 March 2018; pp. 7503–7509. [Google Scholar] [CrossRef]
  33. Mora, E.A. La investigación científica en las universidades ecuatorianas. Rev. An. 2015, 57, 61–72. [Google Scholar]
  34. Collazo, C.A.R.; Rodríguez, Y.H.; Campoverde, D.A.; Suárez, J.B.; Calle, T.T. Habilidades científico investigativas de docentes de la Universidad Católica de Cuenca, Ecuador. Panor. Cuba Salud 2017, 12, 33–39. [Google Scholar]
  35. Global Overview—Renewables 2024—Analysis. Available online: https://www.iea.org/reports/renewables-2024/global-overview (accessed on 17 February 2025).
  36. Electricity—Renewables 2024—Analysis. Available online: https://www.iea.org/reports/renewables-2024/electricity (accessed on 14 January 2025).
  37. Wang, Y.; Wang, R.; Tanaka, K.; Ciais, P.; Penuelas, J.; Balkanski, Y.; Sardans, J.; Hauglustaine, D.; Cao, J.; Chen, J.; et al. Global spatiotemporal optimization of photovoltaic and wind power to achieve the Paris Agreement targets. Nat. Commun. 2025, 16, 2127. [Google Scholar] [CrossRef] [PubMed]
  38. Cano, A.; Arévalo, P.; Jurado, F. Energy analysis and techno-economic assessment of a hybrid PV/HKT/BAT system using biomass gasifier: Cuenca-Ecuador case study. Energy 2020, 202, 117727. [Google Scholar] [CrossRef]
  39. Icaza-Alvarez, D.; Jurado, F.; Østergaard, P.A.; Tostado-Véliz, M.; Flores, C. Cornerstones for greater participation of smart renewable energy on clustered islands: The case of Guayas in Ecuador towards 2050. Energy Rep. 2025, 13, 1350–1368. [Google Scholar] [CrossRef]
  40. Breyer, C.; Khalili, S.; Bogdanov, D.; Ram, M.; Oyewo, A.S.; Aghahosseini, A.; Gulagi, A.; Solomon, A.A.; Keiner, D.; Lopez, G.; et al. On the History and Future of 100% Renewable Energy Systems Research. IEEE Access 2022, 10, 78176–78218. [Google Scholar] [CrossRef]
  41. Lund, P.D. Fast market penetration of energy technologies in retrospect with application to clean energy futures. Appl. Energy 2010, 87, 3575–3583. [Google Scholar] [CrossRef]
  42. Pérez, A.V.; Gámez, M.R.; Briones, V.F.V.; Viteri, C.G.V.; Molina, L.A.V. Sustainable Development Seen From Environmental Training in University Linkage. Int. J. Life Sci. 2018, 2, 12–20. [Google Scholar] [CrossRef]
  43. Araujo, G.; Robalino-López, A.; Tapia, N. Energy foresight: Exploration of CO2 reduction policy scenario for Ecuador during 2016–2030. Energetika 2019, 65, 51–70. [Google Scholar] [CrossRef]
  44. González, R.; Ajanovic, A. The Future of Clean Energy: Integrating Solar and Wind Power for Sustainable Global Energy Solutions. Clean Energy Technol. 2025, 1, 165–173. [Google Scholar]
  45. Achakulwisut, P.; Erickson, P.; Guivarch, C.; Schaeffer, R.; Brutschin, E.; Pye, S. Global fossil fuel reduction pathways under different climate mitigation strategies and ambitions. Nat. Commun. 2023, 14, 5425. [Google Scholar] [CrossRef]
  46. Tissaoui, K.; Zaghdoudi, T. Against a background of energy uncertainty and climate change, is there a substitution effect between fossil fuels in OECD countries? Energy 2025, 320, 135271. [Google Scholar] [CrossRef]
  47. Icaza, D.; Chacho, P.; Ramirez, D.; Peñaloza, J.; Mejía, H.; Romero, S. Telecommunication System for the Monitoring of Tourist Hotels Type Airplane and Heritage Monuments Supplied by Solar Energy. In Proceedings of the 2019 IEEE CHILEAN Conference on Electrical, Electronics Engineering, Information and Communication Technologies (CHILECON), Valparaiso, Chile, 13–27 November 2019; pp. 1–8. [Google Scholar]
  48. Mejía-Nova, F.; Icaza, D.; Cárdenas-Herrera, L.; Galindo, S.P.; Mejía-Cárdenas, C. Organic Constructions and Airplane-type Hostels in Isolated Places Supplied with Solar Energy: Case Study Arequipa-Peru. In Proceedings of the 2020 8th International Conference on Smart Grid (icSmartGrid), Paris, France, 17–19 June 2020; pp. 48–55. [Google Scholar]
  49. Cárdenas-Herrera, L.; Icaza, D.; Mejía-Nova, F.; Ayaqui, R.; Mejía-Cárdenas, C. Snake Hunting System Supplied with Solar Energy in the Ecuadorial Forest for Strictly Curative Purposes, Promoting Ancestral Knowledge, Natural Medicine and Indigenous Cultural Products from Rural Areas. Case Study: Peru. In Proceedings of the 2020 8th International Conference on Smart Grid (icSmartGrid), Paris, France, 17–19 June 2020; pp. 176–182. [Google Scholar]
  50. Sharma, M.; Nijhawan, P.; Sinha, A. Techno-economic comparative analysis of hybrid renewable energy systems with and without battery energy storage system. Int. J. Green Energy 2024, 21, 116–142. [Google Scholar] [CrossRef]
  51. Khare, V.; Khare, C.J.; Bhuiyan, M.A. Design, optimization, and data analysis of solar-tidal hybrid renewable energy system for Hurawalhi, Maldives. Clean. Energy Syst. 2023, 6, 100088. [Google Scholar] [CrossRef]
  52. Soliman, M.S.; Belkhier, Y.; Ullah, N.; Achour, A.; Alharbi, Y.M.; Al Alahmadi, A.A.; Abeida, H.; Khraisat, Y.S.H. Supervisory energy management of a hybrid battery/PV/tidal/wind sources integrated in DC-microgrid energy storage system. Energy Rep. 2021, 7, 7728–7740. [Google Scholar] [CrossRef]
  53. Sanda, M.G.; Emam, M.; Ookawara, S.; Hassan, H. Techno-enviro-economic evaluation of on-grid and off-grid hybrid photovoltaics and vertical axis wind turbines system with battery storage for street lighting application. J. Clean. Prod. 2025, 491, 144866. [Google Scholar] [CrossRef]
  54. Kusakana, K.; Vermaak, H.J.; Numbi, B.P. Optimal Operation Control of Hydrokineticbased Hybrid Systems. In Renewable Energy in the Service of Mankind Vol I: Selected Topics from the World Renewable Energy Congress WREC 2014; Sayigh, A., Ed.; Springer International Publishing: Cham, Switzerland, 2015; pp. 291–303. ISBN 978-3-319-17777-9. [Google Scholar]
  55. Rani, L.; Jangra, N.; Thapa, K.; Srivastav, A.L.; van Hullebusch, E.D.; Puri, V. Chapter 15—Advancing the frontier: Hybrid renewable energy technologies for sustainable power generation. In Computer Vision and Machine Intelligence for Renewable Energy Systems; Dubey, A.K., Srivastav, A.L., Kumar, A., Pati, U.C., García Márquez, F.P., García-Díaz, V., Eds.; Advances in Intelligent Energy Systems; Elsevier: Amsterdam, The Netherlands, 2025; pp. 295–304. ISBN 978-0-443-28947-7. [Google Scholar]
  56. Kulchitskiy, A.R. Review of types of diversification of electric power generation and their impact on ensuring “climate neutrality” of anthropogenic activity. Future Energy 2025, 4, 1–11. Available online: https://fupubco.com/fuen/article/view/273 (accessed on 14 March 2025). [CrossRef]
  57. Mohamed, R.G.; Hassan, A.A.; Abdel Aleem, S.H.E. A modified energy management strategy for PV/diesel hybrid system to reduce diesel consumption based on artificial protozoa optimizer. Sci. Rep. 2025, 15, 4440. [Google Scholar] [CrossRef]
  58. Chen, T.; Wang, M.; Babaei, R.; Safa, M.E.; Shojaei, A.A. Technoeconomic Analysis and Optimization of Hybrid Solar-Wind-Hydrodiesel Renewable Energy Systems Using Two Dispatch Strategies. Int. J. Photoenergy 2023, 2023, 3101876. [Google Scholar] [CrossRef]
  59. Hossain, M.; Mekhilef, S.; Olatomiwa, L. Performance evaluation of a stand-alone PV-wind-diesel-battery hybrid system feasible for a large resort center in South China Sea, Malaysia. Sustain. Cities Soc. 2017, 28, 358–366. [Google Scholar] [CrossRef]
  60. Rahman Mitul, M.T.; Mondol, N.; Reza, M.N.; Roy, S.; Islam, M.N. Enhance the efficiency of solar modules and produce electricity from waste heat using thermoelectric generators (TEGs): A comprehensive practical work. Heliyon 2025, 11, e42869. [Google Scholar] [CrossRef]
  61. Ramesh, M.; Saini, R.P. Effect of different batteries and diesel generator on the performance of a stand-alone hybrid renewable energy system. Energy Sources Part Recovery Util. Environ. Eff. 2024, 46, 7983–8005. [Google Scholar] [CrossRef]
  62. Tharani, K.; Dahiya, R. Choice of battery energy storage for a hybrid renewable energy system. Turk. J. Electr. Eng. Comput. Sci. 2018, 26, 666–676. [Google Scholar] [CrossRef]
  63. Babatunde, O.; Denwigwe, I.; Oyebode, O.; Ighravwe, D.; Ohiaeri, A.; Babatunde, D. Assessing the use of hybrid renewable energy system with battery storage for power generation in a University in Nigeria. Environ. Sci. Pollut. Res. 2022, 29, 4291–4310. [Google Scholar] [CrossRef] [PubMed]
  64. Yang, Y.; Bremner, S.; Menictas, C.; Kay, M. Battery energy storage system size determination in renewable energy systems: A review. Renew. Sustain. Energy Rev. 2018, 91, 109–125. [Google Scholar] [CrossRef]
  65. Abdin, A.F.; Caunhye, A.; Zio, E.; Cardin, M.-A. Optimizing generation expansion planning with operational uncertainty: A multistage adaptive robust approach. Appl. Energy 2022, 306, 118032. [Google Scholar] [CrossRef]
  66. Roldán-Porta, C.; Roldán-Blay, C.; Dasí-Crespo, D.; Escrivá-Escrivá, G. Optimising a Biogas and Photovoltaic Hybrid System for Sustainable Power Supply in Rural Areas. Appl. Sci. 2023, 13, 2155. [Google Scholar] [CrossRef]
  67. Zhang, N.; Yan, J.; Hu, C.; Sun, Q.; Yang, L.; Gao, D.W.; Guerrero, J.M.; Li, Y. Price-Matching-Based Regional Energy Market With Hierarchical Reinforcement Learning Algorithm. IEEE Trans. Ind. Inform. 2024, 20, 11103–11114. [Google Scholar] [CrossRef]
  68. Al-Ghussain, L.; Darwish Ahmad, A.; Abubaker, A.M.; Mohamed, M.A. An integrated photovoltaic/wind/biomass and hybrid energy storage systems towards 100% renewable energy microgrids in university campuses. Sustain. Energy Technol. Assess. 2021, 46, 101273. [Google Scholar] [CrossRef]
  69. Rahman, M.M.; Khan, M.M.-U.-H.; Ullah, M.A.; Zhang, X.; Kumar, A. A hybrid renewable energy system for a North American off-grid community. Energy 2016, 97, 151–160. [Google Scholar] [CrossRef]
  70. Huo, Y.; Yang, J.; Qu, J.; Zhang, C.; Zhou, L.; Zhao, W.; Jiang, H.; Wu, Z.; Dai, J.; Duan, W.; et al. Lightweight Data-driven Planning Method of Hybrid Energy Storage Systems in the New Power System. IEEE Trans. Ind. Appl. 2025, 61, 4792–4800. [Google Scholar] [CrossRef]
  71. Pesantes, L.A.; Hidalgo-León, R.; Rengifo, J.; Torres, M.; Aragundi, J.; Cordova-Garcia, J.; Ugarte, L.F. Optimal Design of Hybrid Microgrid in Isolated Communities of Ecuador. J. Mod. Power Syst. Clean Energy 2024, 12, 488–499. [Google Scholar] [CrossRef]
  72. Ochoa, D.; Martinez, S. Modeling an Isolated Hybrid Wind-Diesel Power System for Performing Frequency Control Studies. A Case of Study: San Cristobal Island, Galapagos–Ecuador. IEEE Lat. Am. Trans. 2019, 17, 775–787. [Google Scholar] [CrossRef]
  73. Córdova-González, F.; García Meléndez, E.; Ferrer Juliá, M.; Icaza, D. Analysis for the Implementation of Distributed Renewable Energy Generation Systems for Areas of High Vulnerability Due to Hillside Movements: Case Study of Marianza-Cuenca, Ecuador. Energies 2024, 17, 1633. [Google Scholar] [CrossRef]
  74. Beltrán Crespo, H.P.; Morales Ortega, J.A. Aplicación del Método Estadístico para el Análisis y Pronóstico de Perfiles de Consumo de Energía Eléctrica. Caso de Estudio CIITT en la UCACUE. Bachelor’s Thesis, Universidad Católica de Cuenca, Cuenca, Ecuador, 2023. [Google Scholar]
  75. Ourahou, M.; Ayrir, W.; EL Hassouni, B.; Haddi, A. Review on smart grid control and reliability in presence of renewable energies: Challenges and prospects. Math. Comput. Simul. 2020, 167, 19–31. [Google Scholar] [CrossRef]
  76. Hua, L.-G.; Bilal, M.; Hafeez, G.; Ali, S.; Alghamdi, B.; Alsafran, A.S.; Kraiem, H. An energy-efficient system with demand response, distributed generation, and storage batteries for energy optimization in smart grids. J. Energy Storage 2025, 117, 115491. [Google Scholar] [CrossRef]
  77. Xu, X.; Hu, W.; Cao, D.; Huang, Q.; Chen, C.; Chen, Z. Optimized sizing of a standalone PV-wind-hydropower station with pumped-storage installation hybrid energy system. Renew. Energy 2020, 147, 1418–1431. [Google Scholar] [CrossRef]
  78. Blanco Charro, C.; Reigosa, D.D.; Briz, F.; Guerrero, J.M. Strategies for the Connection of Distributed Power Generation Units to Distorted Networks. IEEE Trans. Ind. Appl. 2015, 51, 4111–4120. [Google Scholar] [CrossRef]
  79. Regulating Innovation and Competition in Emerging Technology Markets: The Effects of Utility Participation in the Market for Remote Photovoltaic Systems—ProQuest. Available online: https://www.proquest.com/openview/0e650b687799460552cac949d23b48cf/1?cbl=18750&diss=y&pq-origsite=gscholar (accessed on 24 March 2025).
  80. Bergougui, B.; Murshed, S.M.; Shahbaz, M.; Zambrano-Monserrate, M.A.; Samour, A.; Aldawsari, M.I. Towards secure energy systems: Examining asymmetric impact of energy transition, environmental technology and digitalization on Chinese city-level energy security. Renew. Energy 2025, 238, 121883. [Google Scholar] [CrossRef]
  81. Icaza, D.; Espinoza, J.R.; Valarezo, D. Scenarios of Operation of an Energy Production System of a Hybrid WT/PV System of a Bioecological Infrastructure. In Proceedings of the 2021 9th International Conference on Smart Grid (icSmartGrid), Setubal, Portugal, 29 June–1 July 2021; pp. 306–311. [Google Scholar]
  82. Icaza-Alvarez, D.; Jurado, F.; Tostado-Véliz, M.; Arevalo, P. Design to include a wind turbine and socio-techno-economic analysis of an isolated airplane-type organic building based on a photovoltaic/hydrokinetic/battery. Energy Convers. Manag. X 2022, 14, 100202. [Google Scholar] [CrossRef]
  83. Icaza, D.; Flores-Vázquez, C.; Cobos-Torres, J.-C.; Galindo, S.P. Organic Constructions and Airplane Type Hostels in Isolated Places Supplied with Solar Energy. In Applied Technologies: First International Conference, ICAT 2019, Quito, Ecuador, 3–5 December 2019, Proceedings, Part III; Botto-Tobar, M., Zambrano Vizuete, M., Torres-Carrión, P., Montes León, S., Pizarro Vásquez, G., Durakovic, B., Eds.; Springer International Publishing: Cham, Switzerland, 2020; pp. 231–243. [Google Scholar]
  84. Tinoco, V.Z. Ley Orgánica Para Impulsar la Iniciativa Privada en la Generación de Energías Calificada Como Urgente en Materia Económica. 2024. Available online: https://strapi.lexis.com.ec/uploads/2e7635a9_e4a9_447f_afd2_c655d7f7c358_2bea1bee3c.pdf (accessed on 14 March 2025).
Figure 1. Overview of the CIITT Campus of the Universidad Católica de Cuenca and its available energy sources, the subject of analysis in this study.
Energies 18 02746 g001
Figure 2. Methodological framework for analyzing the hybrid system for the CIITT campus of the Universidad Católica de Cuenca in Ecuador.
Energies 18 02746 g002
Figure 3. Hybrid System Design in Homer Pro Version 3.16.2.
Energies 18 02746 g003
Figure 4. Energy demand profile in CIITT campus in Cuenca, Ecuador.
Energies 18 02746 g004
Figure 5. CIITT load profile. (a) Spectrogram of annual power demand. (b) Seasonal profile.
Energies 18 02746 g005
Figure 6. Hybrid system design process flowchart supported by Homer Pro.
Energies 18 02746 g006
Figure 7. Wind speed profile on the CIITT campus.
Energies 18 02746 g007
Figure 8. Annual solar radiation profile in the CIITT campus.
Energies 18 02746 g008
Figure 9. Annual assessment of water velocity in the open channel at the CIITT Campus.
Energies 18 02746 g009
Figure 10. Integration of energy sources. (a) Integration of energy sources in the first days of January. (b) Integration of energy sources in July. (c) Monthly power evaluation by generation source.
Energies 18 02746 g010aEnergies 18 02746 g010b
Figure 11. Cash flow [73].
Energies 18 02746 g011
Figure 12. NPC considering different technologies.
Energies 18 02746 g012
Figure 13. NPC of the hybrid system in different scenarios.
Energies 18 02746 g013
Figure 14. Excess energy produced by hybrid system.
Energies 18 02746 g014
Figure 15. CO2 emissions in different scenarios.
Energies 18 02746 g015
Figure 16. COE determined based on the different combinations.
Energies 18 02746 g016
Table 1. PV solar panel parameters.
PV ModelRS7E-230M
Max power230 Wp
ManufactoryRESUN SOLAR
Control boxIP67
Open circuit24.10 VDC
Sc current 11.99 A
Dimensions (mm)1560 × 700 × 35 mm
Number of cells (4 × 9.5 bushbars)36 Cells
Capital CostUSD 250/200 Wp
Replacement costUSD 250/200 Wp
O&M CostUSD 0
Derating factor0.7
Slope15 degrees
Lifetime25 years
Table 2. HKT parameters.
ModelSmart monofloat 5 kW
Country of originChina
ManufacturerSmart hydro power
DimensionsWidth: 1600 mm, length: 3130 mm, height: 2010 mm
Weight (kg)380 kg.
Number of rotor blades3
Rotor φ1000 mm
Capital cost (USD)12,450
Replacement cost (USD)12,450
O&M (USD/year)450
Max. Power output2.83 m/s-5 kW
Table 3. Wind turbine specifications.
ManufacturerPika Energy
ModelG3 Wind Turbine
Cut-in wind speed3 m/s
Capacity5 kW
Blades3
Rotor diameter3 m
Capital (USD)3000
O&M (USD/y)500
Replacement (USD)3000
Table 4. DG characteristics.
Capacity10 kW
FuelDiesel
Fuel intercept0.480 L/h
Fuel slope0.286 L/h/kW
Table 5. Battery characteristics.
ModelKinetic Bat
Nominal Capacity (kWh)4
Nominal Voltaje (V)12
Maximum Capacity (Ah)38
Capacity Ratio0.403
Efficiency (%)85
Rate Constant (1/h)2.77
Max Charge Current (A)56
Max discharge Current (A)76
Replacement (USD)700
Cost of capital (USD)700
O&M (USD/y)15
Table 6. Total pieces of equipment in the hybrid system.
EquipmentPower (kW)Unit Value (Dollars)Total Value
Regulator123002300
Solar panel81805000
Battery742012,000
Diesel generator1070007000
HKT turbine522004400
Inverter4535003500
Wind turbine1.530006000
Subtotal40,200
Discount2200
Total (USD)38,000
Disclaimer/Publisher’s Note: The statements, opinions and data contained in all publications are solely those of the individual author(s) and contributor(s) and not of MDPI and/or the editor(s). MDPI and/or the editor(s) disclaim responsibility for any injury to people or property resulting from any ideas, methods, instructions or products referred to in the content.

