1. Introduction
Electric machines are increasingly replacing conventional internal combustion engines in various modes of transport. This allows for a reduction in the negative environmental impact of transport and the maintenance costs of these machines. However, despite the high quality of materials and design methods, electric machines are susceptible to a variety of failures, the consequences of which can include reduced functionality or even complete failure. According to statistics [
1,
2], bearings are the most frequently damaged component. Bearing damage can be caused by improper handling during storage, transport, and assembly, leading to damage to the contact surfaces, reducing their useful life. Bearing operating time is also important, as wear and tear causes gradual deterioration of components, leading to deformation and, in the worst case, to further damage. Meanwhile, lubricant contamination and high humidity can cause rust and splinters, further accelerating wear [
3,
4]. The importance of a precise diagnosis in these conditions cannot be overstated, as early detection and intervention prevent the development of failure.
Rolling bearing monitoring data can be collected based on temperature [
5], sound [
6], vibration [
7], and current [
8]. Temperature monitoring, while useful for indicating abnormal heat generation, can be slow to detect early-stage faults and can be influenced by various factors. Sound monitoring can identify unusual noises that are indicative of wear, but it is susceptible to environmental noise, making it difficult to isolate bearing faults. Machine vibration analysis is one of the most widely used diagnostic techniques. Vibration monitoring is highly effective in detecting bearing faults, but requires the installation of additional sensors. The vibration signal is also sensitive to interference from the engine itself and the drive system, such as changing working conditions or mechanical resonance. In the context of electromobility, vibrations generated by the movement of vehicles themselves can significantly affect the accuracy of the data collected. Therefore, the use of stator current as a diagnostic signal is becoming a very attractive issue [
8,
9,
10]. The current signal has higher robustness to environmental influences, which could make it more reliable in many applications. In addition, current measurements in drive systems are used for control, which makes the installation of additional sensors unnecessary.
Recently, a growing number of rolling bearing diagnostic systems based on deep neural networks (DNNs) have been observed [
11,
12,
13], among which convolutional neural networks (CNNs) are particularly effective for signal or image analysis [
14,
15,
16]. However, solutions that incorporate CNNs are often connected to mechanical vibration signals as input information [
17,
18]. CNNs allow the use of a larger number of input signals (in the case of vibrations, for example, vibrations in the X, Y, and Z axes), which translate into the ability to correlate this information with each other through the network and increase its accuracy. These solutions achieve high efficiencies, but the signals are collected in an isolated environment, and do not consider the influence of external factors on the collected data. Furthermore, the mechanical nature of bearing damage is well reproduced in vibrations, which, combined with the isolated measurement environment, translates into the aforementioned high efficiencies. However, these solutions are not feasible for application in real systems because of the aforementioned environmental interference problems.
An analysis of the literature shows that acoustic signals are also widely used in mechanical fault diagnostics [
19,
20]. The limitations of these solutions include significant problems with environmental interference (similar to vibration), but also with the use of data preprocessing, which increases the operating time of the system and requires stationary operation of the facility. In addition, it is difficult to collect correlated acoustic signals, each of which introduces relevant information about the object tested. These problems make it nearly impossible to use these solutions in real-world applications. The approach proposed in this article is based on CNN’s direct analysis of the stator current in the task of diagnosing bearing failures. Unlike the approach based on the use of preliminary signal analysis [
21], this study focuses on the direct use of raw information on phase currents. Therefore, it is possible to significantly shorten the time required to detect faults and assess their type, as well as reduce the required computing power of the master system. CNNs are sufficiently sensitive, and are involved in solutions that present the use of stator current in the bearing damage classification process, such as that presented in [
22]. The problem with the solution presented in this study is the use of a significantly expanded neural network structure and zero-padding, which can lead to the loss of information located at the edges of the processed matrices. Additionally, two separate networks are used for the two phases of current, which involves the loss of information contained in the third phase of current and deprives the network of its ability to infer from the correlated data.
The use of current signals as diagnostic signals in bearing diagnostics is still a topic of research and discussion, because of the lack of satisfactory solutions in this field. This article presents an implementation of CNNs in the problem of bearing diagnostics using stator current as a diagnostic signal, with studies on the influence of input information and noise on the accuracy of the presented solution to ensure its performance under real conditions. Minimizing the number of network parameters is particularly important for practical implementation of deep structures. When analyzing structured data (multidimensional matrices), a significant number of parameters constitute the connections of the input layer. Therefore, this study analyzed the impact of the size of the input matrix on the effectiveness of fault detection and classification. Additionally, to analyze the generalizability of the network, tests were conducted considering the noise of the input samples. This research allowed us to confirm the accuracy of the technique used for the direct processing of phase current signals in the diagnosis of bearing damage.
The idea presented in this article is a new approach to rolling bearing damage diagnostics, due to the following:
Use of an easily measurable current signal as a diagnostic signal—this solution allows for precise monitoring of the system status without the need for additional sensors.
Analysis of the impact of additional noise on the performance of the network, testing the resistance of the network to disturbances, and assessing the reliability of the diagnostic signal under harsh operating conditions.
Classification of different degrees of damage allows for not only identification of the types of damage, but also their degree, which allows for a more detailed assessment of the condition of the components.
A maximum of 600 samples were used to perform bearing diagnostics, and this was reduced to only 100 samples in the testing process, without reducing the accuracy of the diagnostic algorithm’s performance.
2. The Impact of Bearing Damage on the Phase Current Signal
Owing to the use of diagnostic information preserved in phase current samples in the investigation, the first stage of the investigation analyzed the quantitative impact of defects on changes in measured signals. Classic symptom extraction techniques based on spectral analysis allow for easy determination of the participation of disturbances resulting from defects. Owing to the natural application of mechanical defects in vibration signals and difficulties in phase current diagnostics, the impact of failure on the quality of information preserved in these signals has been combined (
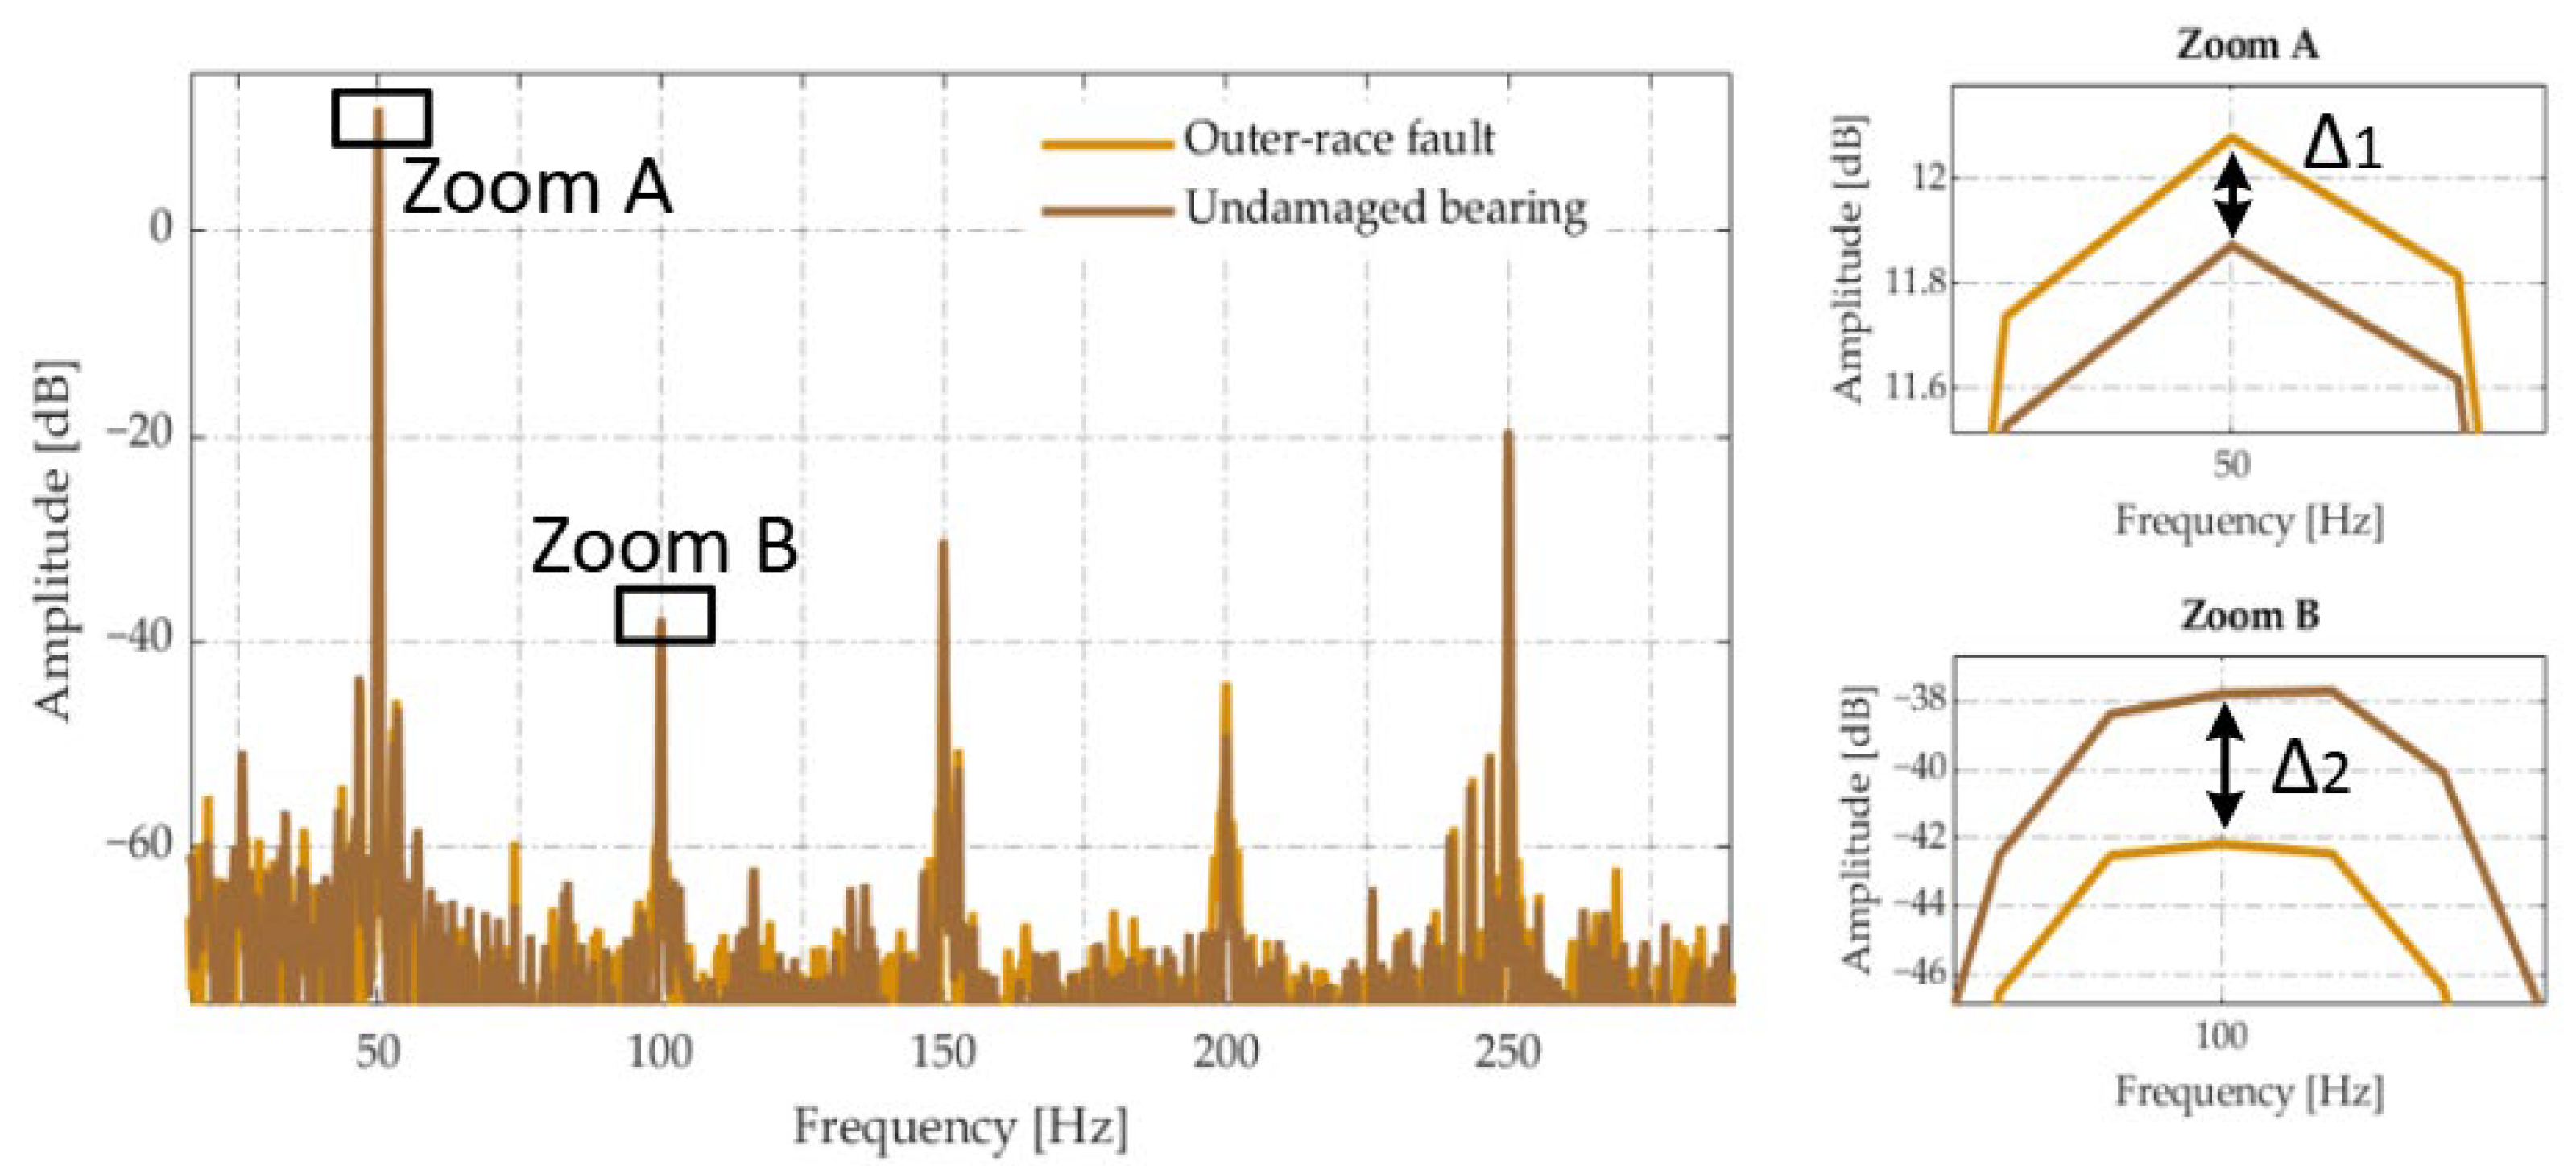
Table 1). The comparison of the spectral analysis was aimed at showing the limitations of the base technique in the FFT analysis of phase currents (
Figure 1).
An analysis of the vibration spectrum obtained in [
14,
23,
24] shows that the effect of bearing damage on the measured signal is significant. Bearing faults directly affect the mechanical vibration signal, but also indirectly affect the stator current through changes in the electromagnetic field. However, because of the different natures of these signals, the visible changes in the current caused by this damage are less evident, as shown in
Figure 1. The measurements were performed at a load of half the nominal load and a rotational speed of 1450 rpm. Moreover, changes in the spectrum at the fundamental frequency and its second harmonic may result from changes in machine load. This fact constitutes a difficulty for diagnostics using the FFT of phase currents, because the differences in spectrum amplitudes caused by a defect and the operating conditions of the originating machine are distinguishable. To compare the impact of bearing damage on vibration and current signals, the difference in amplitude was measured for the four types of damage and the undamaged case (
Table 1). The presented data correspond to a torque load (
TL) set to half of the nominal torque load (
TLN), and a frequency of the voltage supply (
fs) equal to 50 Hz.
The difference was obtained by measuring the amplitude of the frequency fs and its harmonics for damaged and undamaged bearings, and then calculating the relationship between the difference in these amplitudes and the amplitude of the undamaged bearing (Δ0).
The results presented show that bearing damage affects vibration and current signals to different extents. In some cases, the difference in amplitudes for certain frequencies is several times greater for the vibration signal. The mean changes for all faults were also calculated, showing the extent to which they affect the diagnostic signal. It can be seen that for vibrations, this average ranges from 21.31% to 60.82%, while for the current signal, it is much lower, from 1.24% to 9.23%. The current signal value is directly affected by the operating conditions of the drive, such as changes in supply frequency, speed, and load. Therefore, with low current values and a minor impact of bearing damage on this signal, damage symptoms may not be noticeable. All these factors make the detection of this type of fault from a current signal a demanding issue.
Therefore, effective detection and classification of rolling bearing damage, including the initial stage of the defect, using FFT analysis of phase currents cannot be used in practice for drive systems. Moreover, the requirements for spectral analysis, which limit the ability to assess damage in transient states, constitute a disadvantage of the classical approach. Currently, in drive systems used in industry, electric vehicles, or aviation applications, it is not possible to ensure steady drive operation. This is due to the constant influence of external conditions, which negatively affect the extraction of symptoms. Therefore, an alternative is to use static analysis of a small vector of samples using the latest artificial intelligence techniques. Deep convolutional networks allow one to skip the symptom extraction stage by using automatic digital filtering of input information with filters adapted to the training process. This approach allows for high precision, while shortening the data acquisition time.
3. Description of the Test Bench
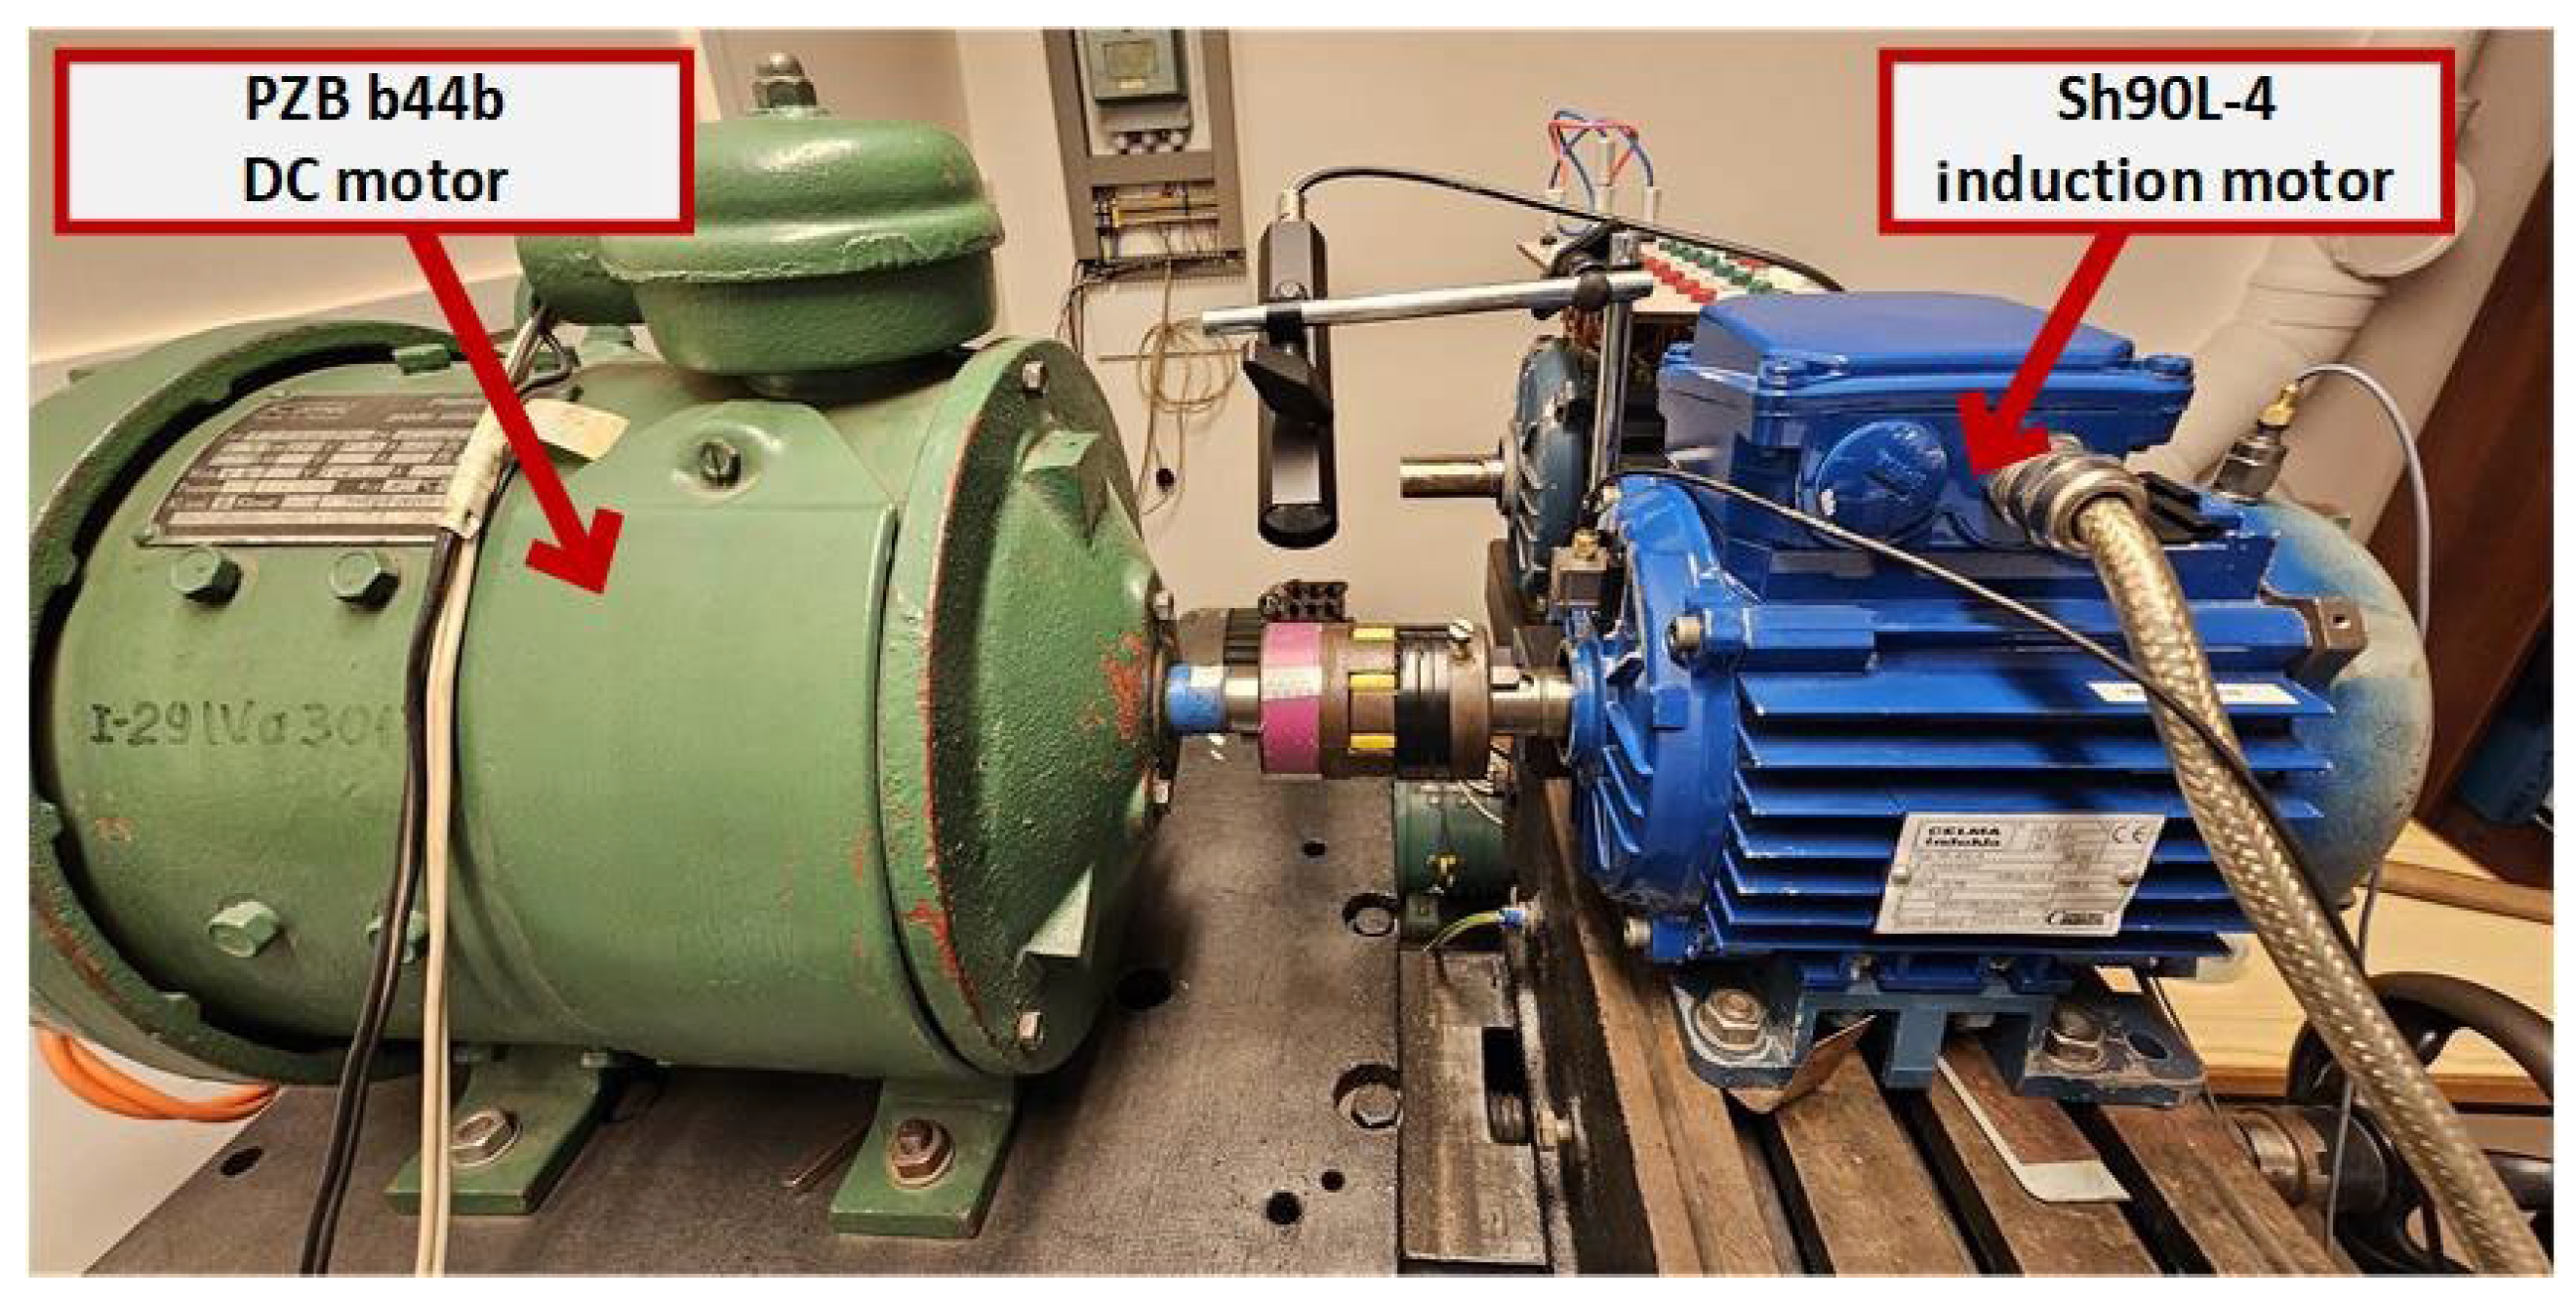
The experimental stand consisted of a 1.5 kW Sh90L-4 induction motor (Celma Indukta, Cieszyn, Poland), mechanically coupled with a PZB b44b DC motor (Komel, Poland), which was treated as an adjustable mechanical load (
Figure 2). A change in load torque in the range from 0 to nominal, with a step of 20%, was achieved via control of the arm current under a constant excitation current of the DC motor. The induction motor was fed from the industrial voltage converter. Stator currents in three phases were measured with the use of LA 25-NP (LEM International SA, Meyrin, Switzerland) current transducers. The data acquisition system operated with a sampling frequency of 10 kHz using a PXIe-4492 card (National Instruments, Austin, TX, USA). The signal processing application (spectral analysis) application and symptom fault extraction system were developed in LabVIEW 2021 and MATLAB 2024b environments, respectively.
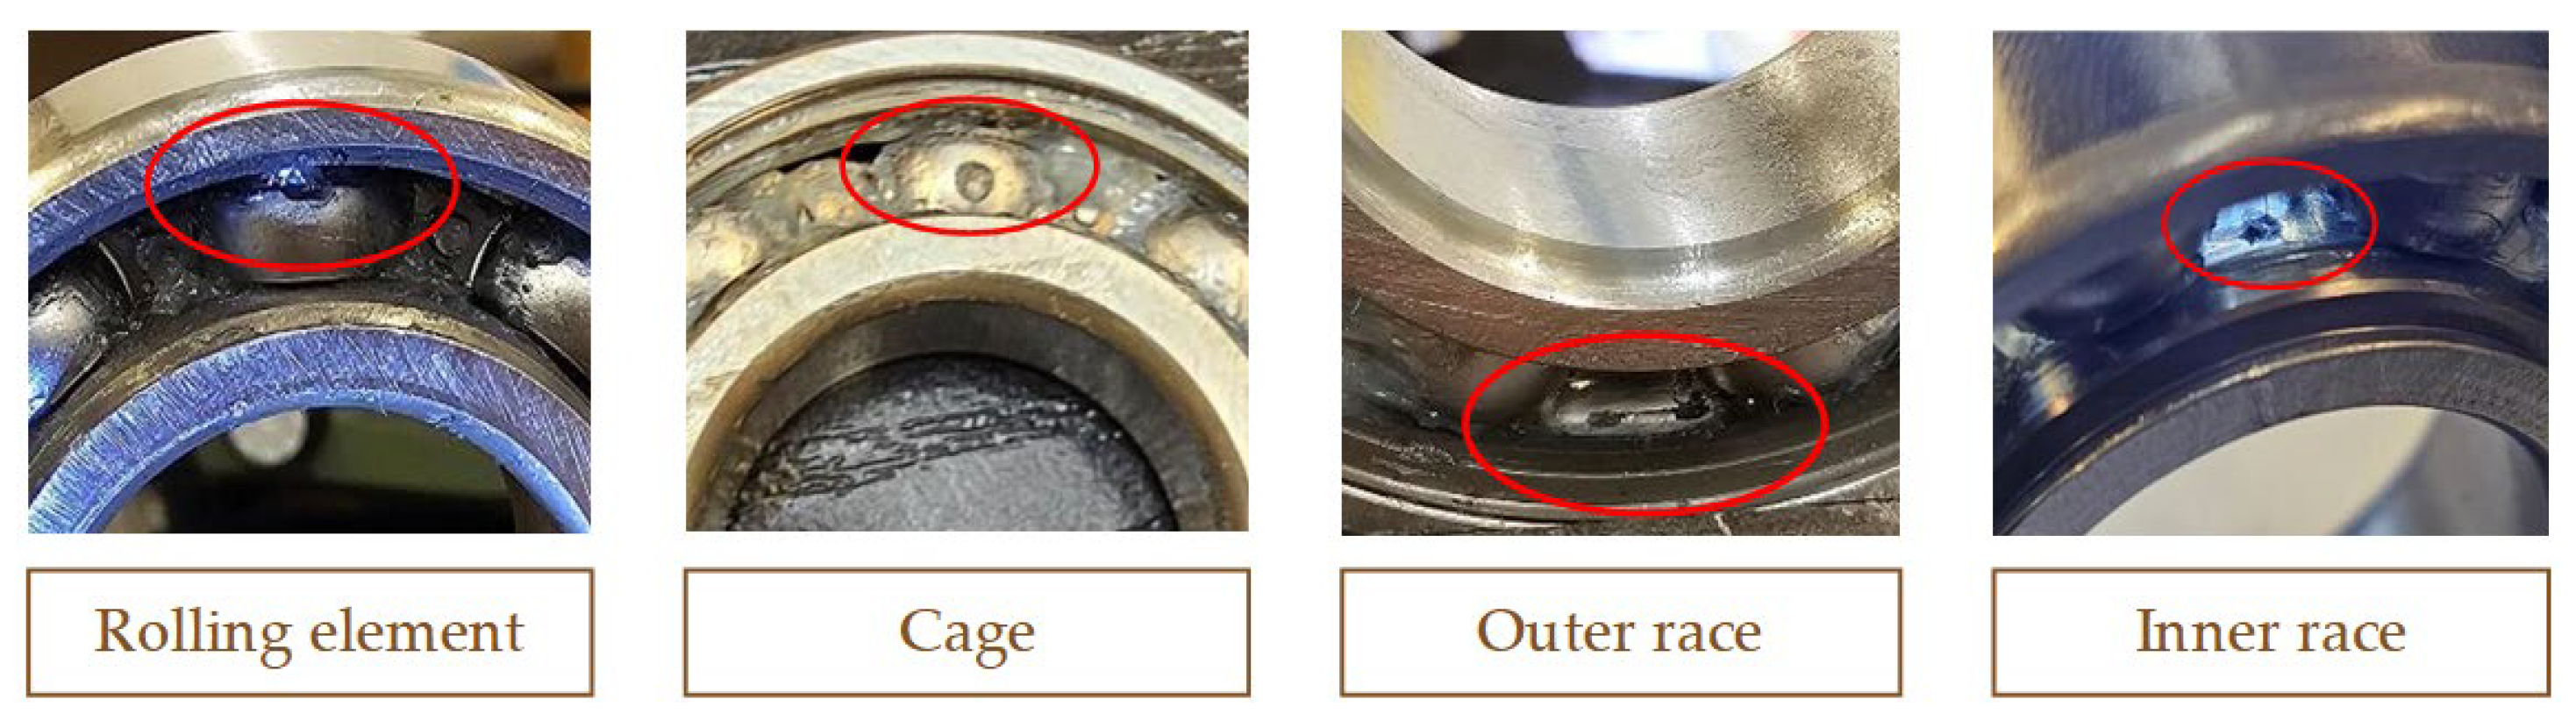
Two 6205-Z type bearings (AB SKF, Gothenburg, Sweden) (
Table 2) were mounted in the induction motor during the tests. Damaged bearings were mounted on the counter-drive side. Each of the damaged bearings had a different type of mutilation (
Figure 3). In the cases of the faulty inner and outer race, different levels of bearing damage were tested—four levels for the outer race and five for the inner race. A detailed description of the damage is provided in
Appendix A.
4. Convolutional Neural Network
The operation of the CNN is based on the processing of the original signal and the direct extraction of the information contained therein. The whole process is based on various mathematical mechanisms. First, characteristic features of the information are found and extracted using a convolution operation. The characteristics are retrieved on the basis of the nature of the input information, including the basic relationship between its samples or the shape of the waveform. The number of these features is often very large, which requires appropriate filtering of which features are most relevant to detection. The most important features are selected through the combination of layers. The collected features are considered in the appropriate window and, depending on the type of action selected, are appropriately translated into a new representative feature. For features to have the ability to fit non-linear data, non-linear activation functions such as ReLU or hyperbolic tangent are used. This allows the collection of appropriate features to reflect complex data representations with non-linear relationships. In this way, meaningful features are extracted in terms of diagnostic problems, which are then assigned to the available categories using the perceptron. Each piece of information is given an appropriate weight in relation to each category, indicating its direct relationship to that particular category. To avoid over-reliance of classes on single features, dropout is used, which forces the representation to rely on a larger number of extracted features.
An analysis of the literature shows that the use of convolutional filters and vector network input is characterized by high efficiency in the classification of sequential data [
25,
26]. However, the problem with such a solution is the severely limited ability to contextually link data. The more information that must be linked, the larger the filter, which translates into a subsequent worse interpretability of the output of such a filter. The problem with 1D data is the lack of a structure that introduces spatial connection of the data; therefore, the dependencies in the convolutional filter cover neurons located in the immediate vicinity. Therefore, transforming the signal from 1D to 2D and using such filters and grouping are more efficient [
27,
28]. Turning a vector into an array simultaneously makes the filter attentive to the local arrangement of the data, but also depends on decomposition to a more global distribution. Due to this decomposition, the filter and pooling results are also more meaningful, and can be more easily adapted to the characteristics of the signal under study.
Adding new channels of data to a signal, such as operating on three phases of current instead of one, makes it possible not only to draw conclusions based on the characteristics of the signal itself, but also based on the relationships between signals. This is made possible by the use of a convolutional layer with increased depth (3D filters), where, in addition to the aforementioned local analysis of the signal and a somewhat broader one depending on the dimensions of the matrix being created, there is a correlation between the behavior of different data channels, opening up the possibility of correlating information coming from similar sources. The use of filters and pooling with a higher number of dimensions does not adversely affect the computational efficiency of the model because of the simplicity of the convolution operation, and it introduces the possibility of determining the relationship between multiple signal features, which greatly contributes to the accuracy of network performance.
Another aspect of creating a DNN is depth. As the depth of the network increases, its ability to present increasingly complex data also increases. This feature positively or negatively affects the model, depending on the nature of the data. An increase in the depth of the DNN increases its representational ability, allowing it to present more complex data. Simultaneously, the model’s ability to adapt to these data also increases, increasing the risk of overfitting. The problem with creating increasingly deep networks is the trade-off between the representational capacity of the network and the risk of overfitting [
29]. The answer to this problem is the increasing use of parallel structured networks [
30,
31]. This involves the use of several parallel branches with feature extraction, from which the results are subsequently summed and processed further. This allows the network to break into shallower branches, and each branch can be adapted to look for different features. This allows for the use of parallel calculations and prevents overfitting (owing to the use of shallower branches).
4.1. CNN Structure Description
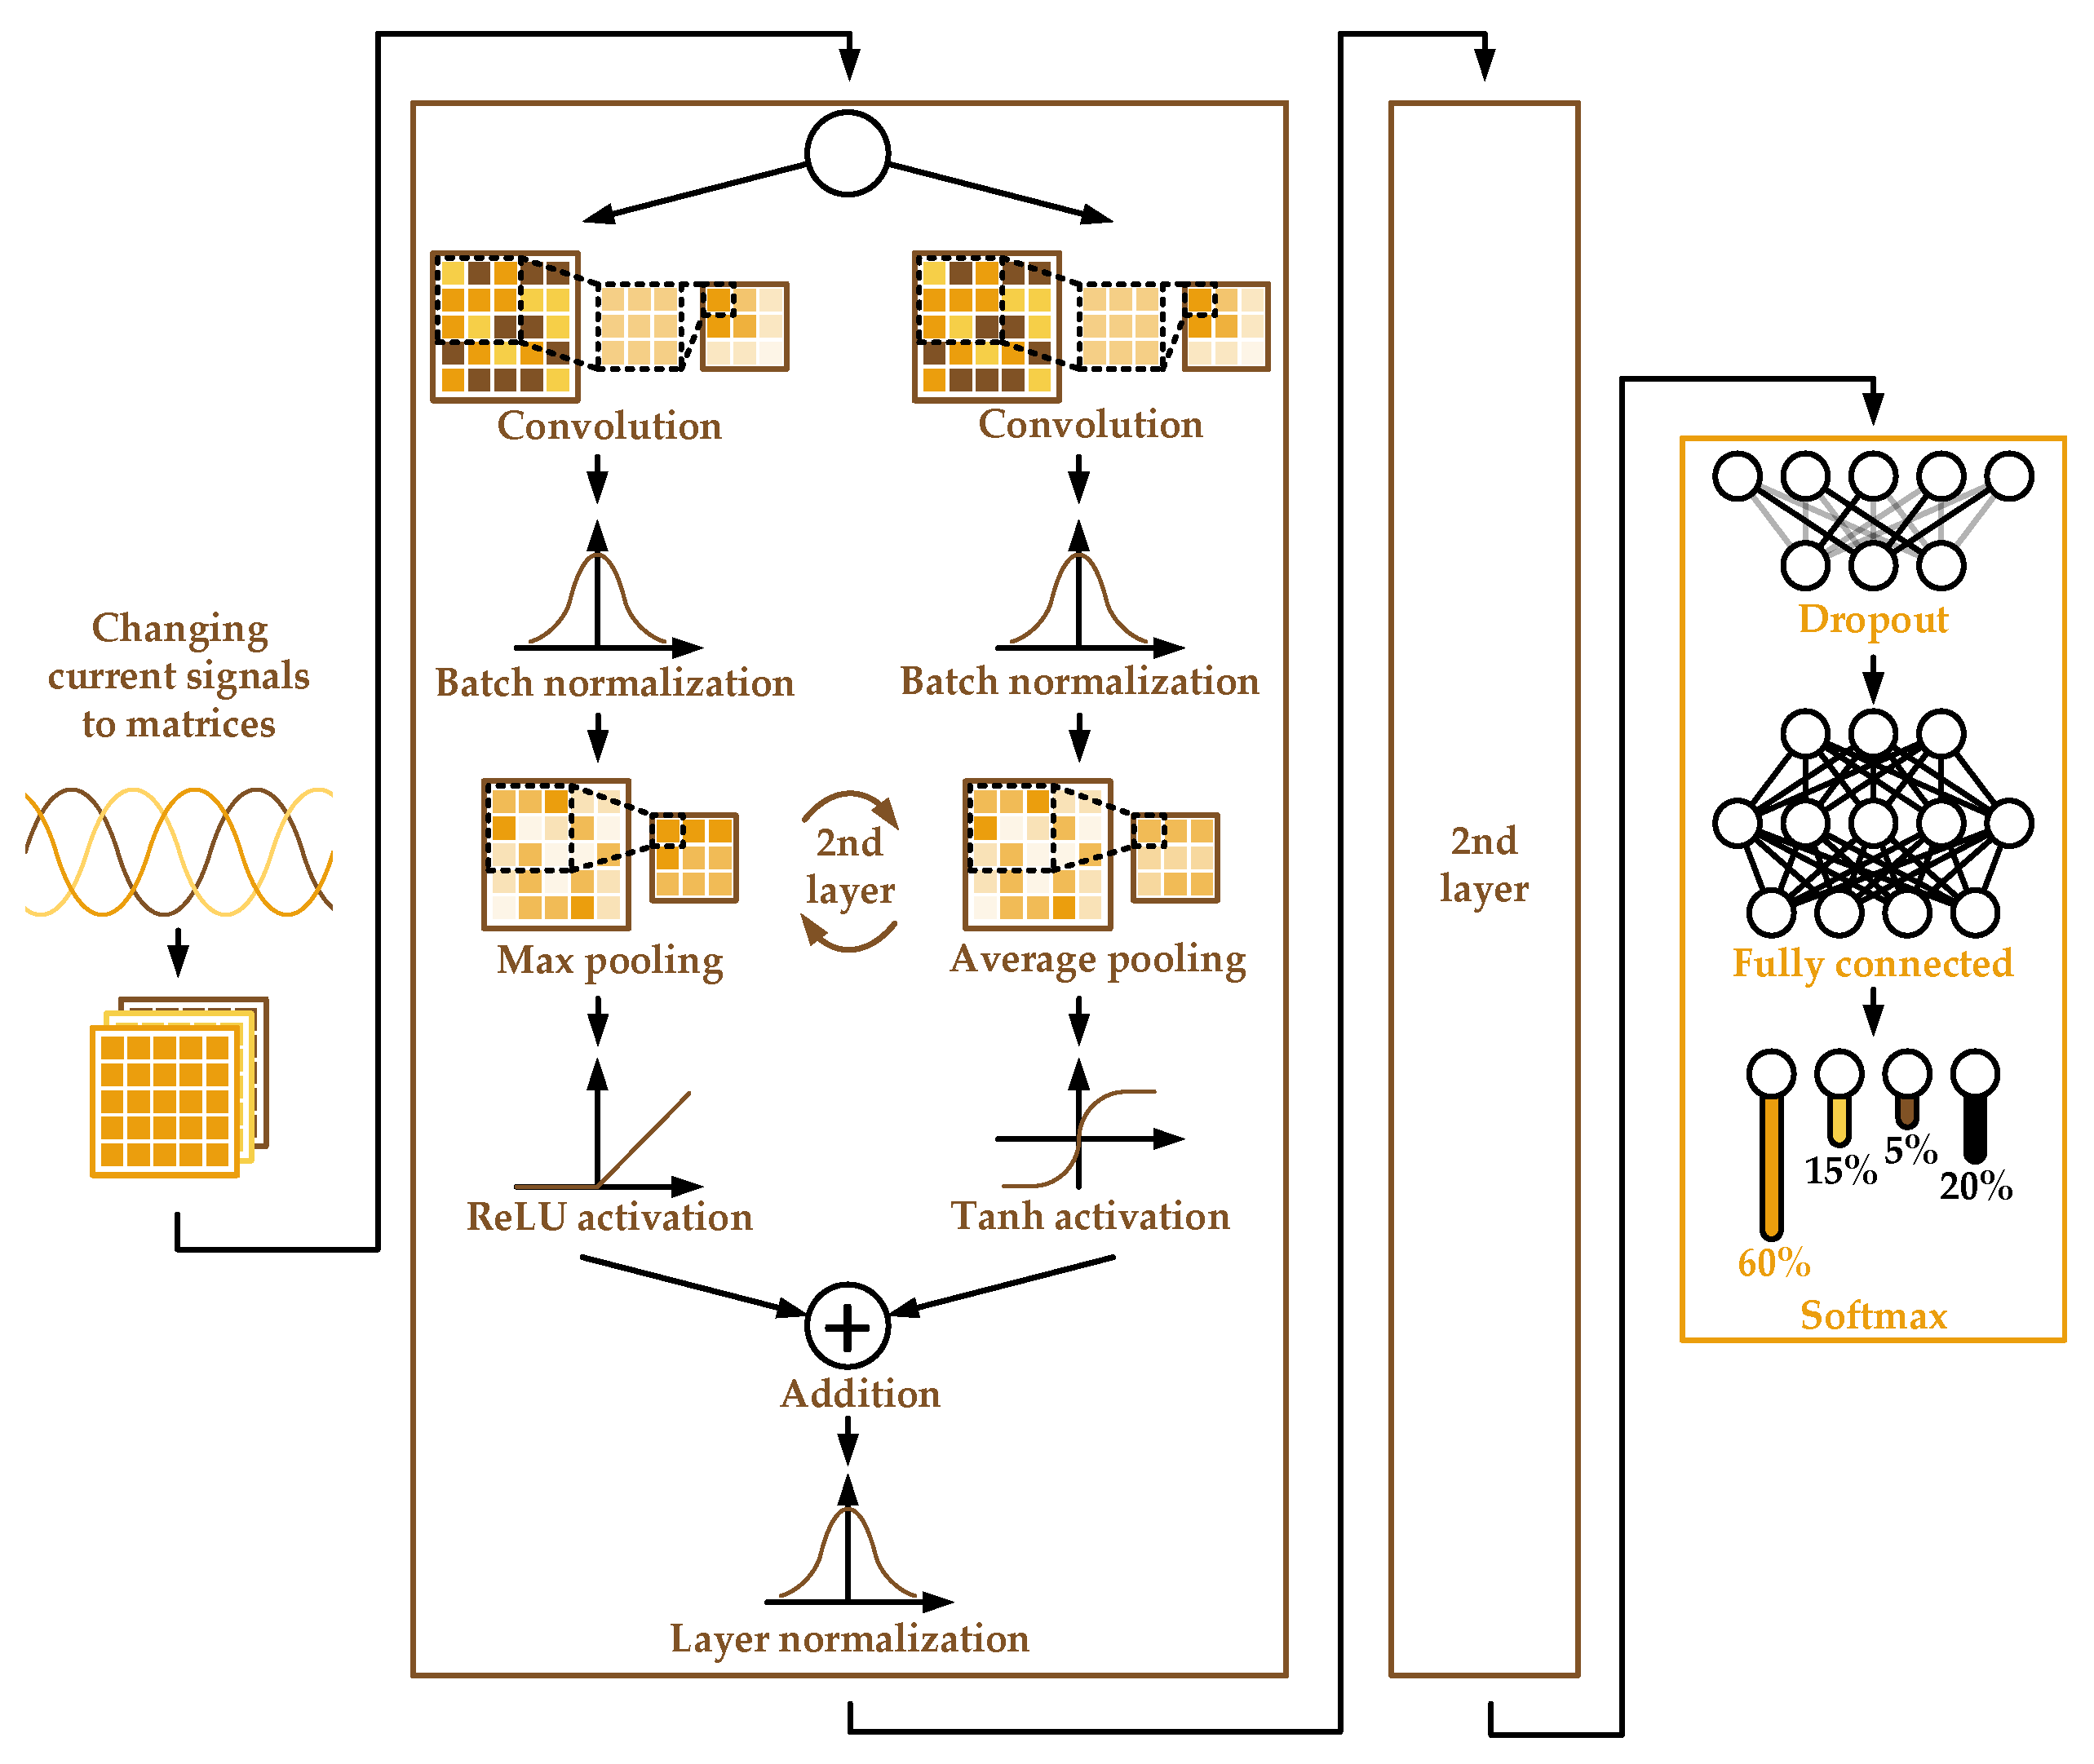
The CNN used was constructed from two layers of parallel feature extractors, each with two branches, similar in structure (
Figure 4). The differences are in the activation functions used and the functions in the pooling layer, where at the first layer, one branch has the “max” function in the pooling layer and the “ReLU” activation function, and the other branch has the “average” function in the pooling layer and the “tanh” activation function. The second layer has swapped functions of the pooling layers. Each of these functions has different advantages, so using them in different branches and combining them later is intended to bring out the benefits of all the functions used.
Using the “max” function in the pooling layer allows one to focus on the most important features found by the convolution filters, unfortunately introducing a loss of information (no other value, except the maximum, affects the output information). Using the “average” function preserves the context of the occurrence of features in a given window, but can lead to blurring of the feature map, ultimately making it difficult to classify the signal appropriately. For the activation function, on the other hand, the use of “ReLU” is associated with simplicity of computation and reduction of the vanishing gradient problem, but can lead to zeroing of neurons (if they become stuck on the negative side of the function). The “tanh” function, on the other hand, is bounded in the interval (−1, 1), resulting in a normalized output. In addition, the waveform of the function is smooth, introducing smooth gradient changes, which are useful for capturing subtle patterns in the given data. However, it is prone to gradient fading and computationally complex. The use of feature fusion through an additional layer allows the extracted information to be combined, leading to a more confident classification. The network is completed similarly to serial CNNs, through a dropout layer (supporting generalized data representation) and a fully connected layer with the softmax activation function (ultimately responsible for classifying the data by assigning class membership probabilities to a given point).
4.2. Propagation of Information Through the Network
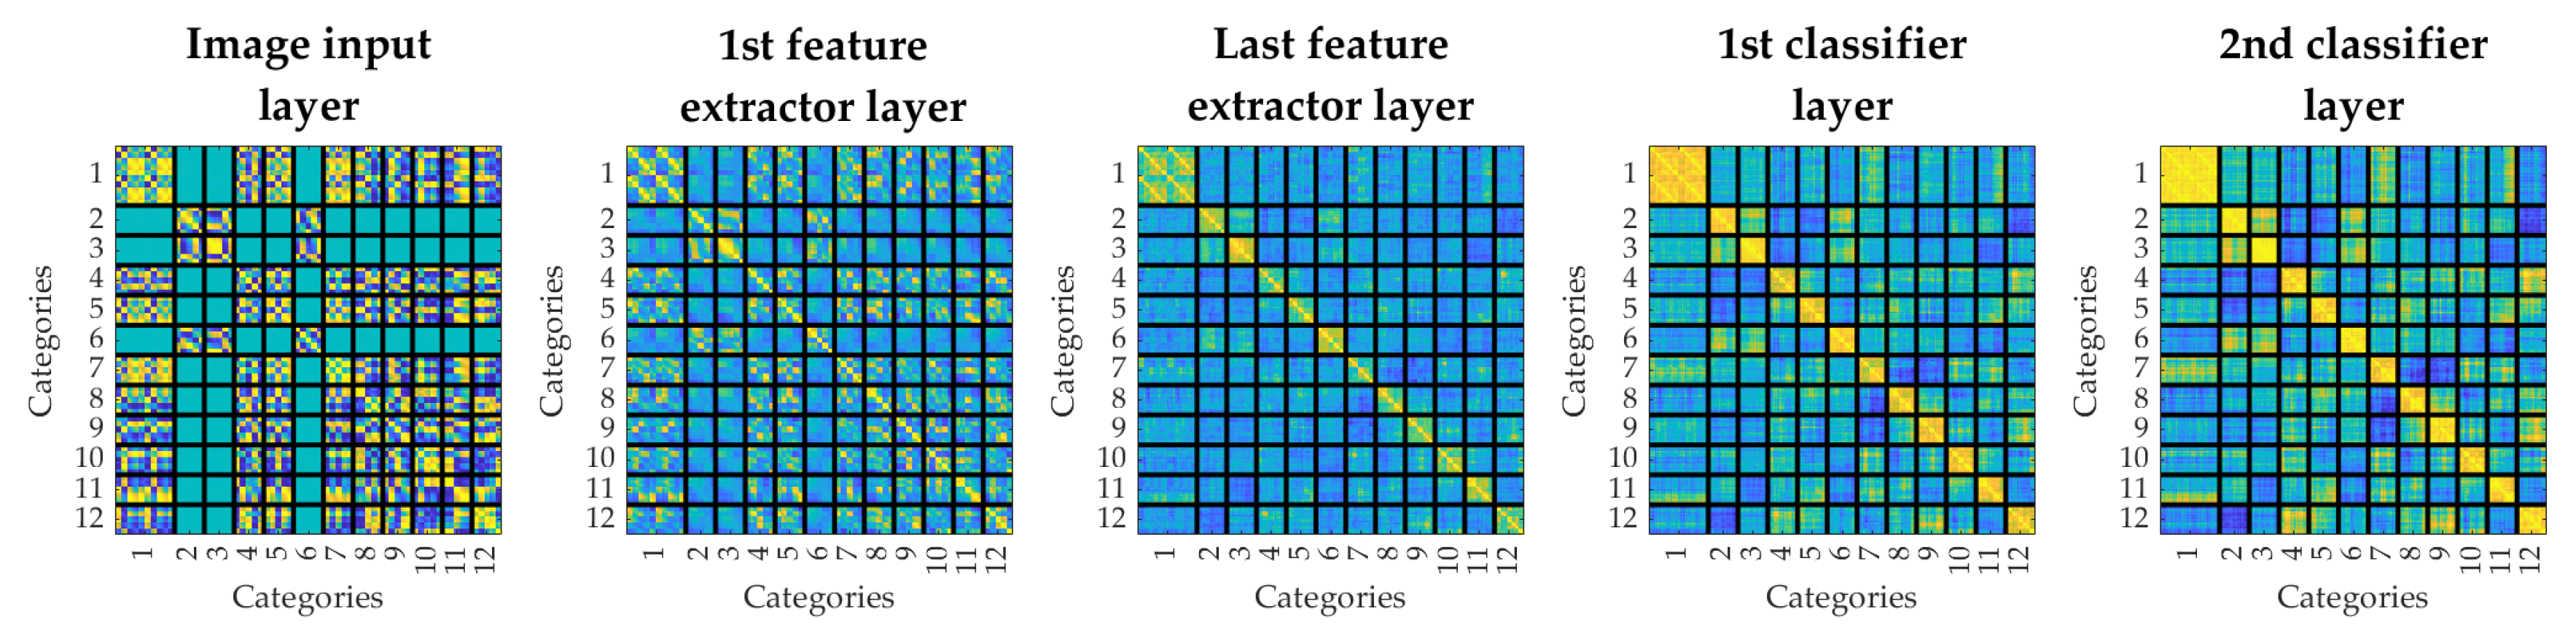
To demonstrate the formation of features along the successive layers of the network, it was decided to study the correlation of features extracted after the input, additive, and fully connected layers. The sample results obtained for the Net-500 network are shown in
Figure 5 and
Figure 6.
In the first layer, a completely random correlation between images is observed, which results from the lack of definition of the superior features of common elements of the input package. However, moving through the CNN structure, the automatic extraction of fault features results in a higher correlation between images of the same category. The observed behavior indicates a good fit of the selected structure to the problem of bearing diagnostics based on current signals. As can be seen in
Figure 5, after the second additive layer, distinct groups of images belonging to the corresponding classes can be observed. The fully connected layers then use this to give the final network responses.
4.3. CNN Structure Optimization for Input Information
A study of the impact of input information on network performance was carried out, selecting the appropriate parameters for all the layers represented in the structure.
The input data were changed from 100 to 600 samples, and the response time and accuracy were analyzed for each structure. The parameters used for each model created are presented in
Appendix B. Since the lowest recorded accuracy of the network’s performance was 99.3%, and no dependence on the size of the input information was noted, it was decided to pay special attention to the importance of the reduction in information on the memory needed to store this information, its acquisition time, and the network’s response time. The results are summarized in
Table 3.
5. Experimental Verification of the Diagnostic System
During the neural network training process, validation was performed to verify CNN precision using data outside the scope of the learning dataset. Furthermore, after training ended, an accuracy analysis was performed for another dataset, which was different from the training data packets. The sizes of the datasets for each network and process are shown in
Table 4. The numbers of samples representing each damage category in each dataset were similar. During the verification of the system, the measured data input was fed with noise of different magnitudes for a neural network robustness check.
5.1. Analysis of the CNN Response in Steady States
The results presented in
Table 4 confirm the high precision of the system for detecting and classifying bearing damage based on the information contained in the phase current signals. The effectiveness of the convolutional network is almost the same for the set of training data used in the process of adapting the network weights, the validation data used in tests during the training process, and the testing data, which constituted a separate set of data. In addition, the developed data packages contained current samples for the full range of motor loads. Taking into account the fact that only 500 samples of phase current signals were used, detection and classification were possible for a data acquisition time of 50 ms (
Table 3). This fact is an undoubted advantage of the proposed diagnostic approach.
5.2. Analysis of the Generalization Ability of the CNN-Based Bearing Fault Diagnostic System
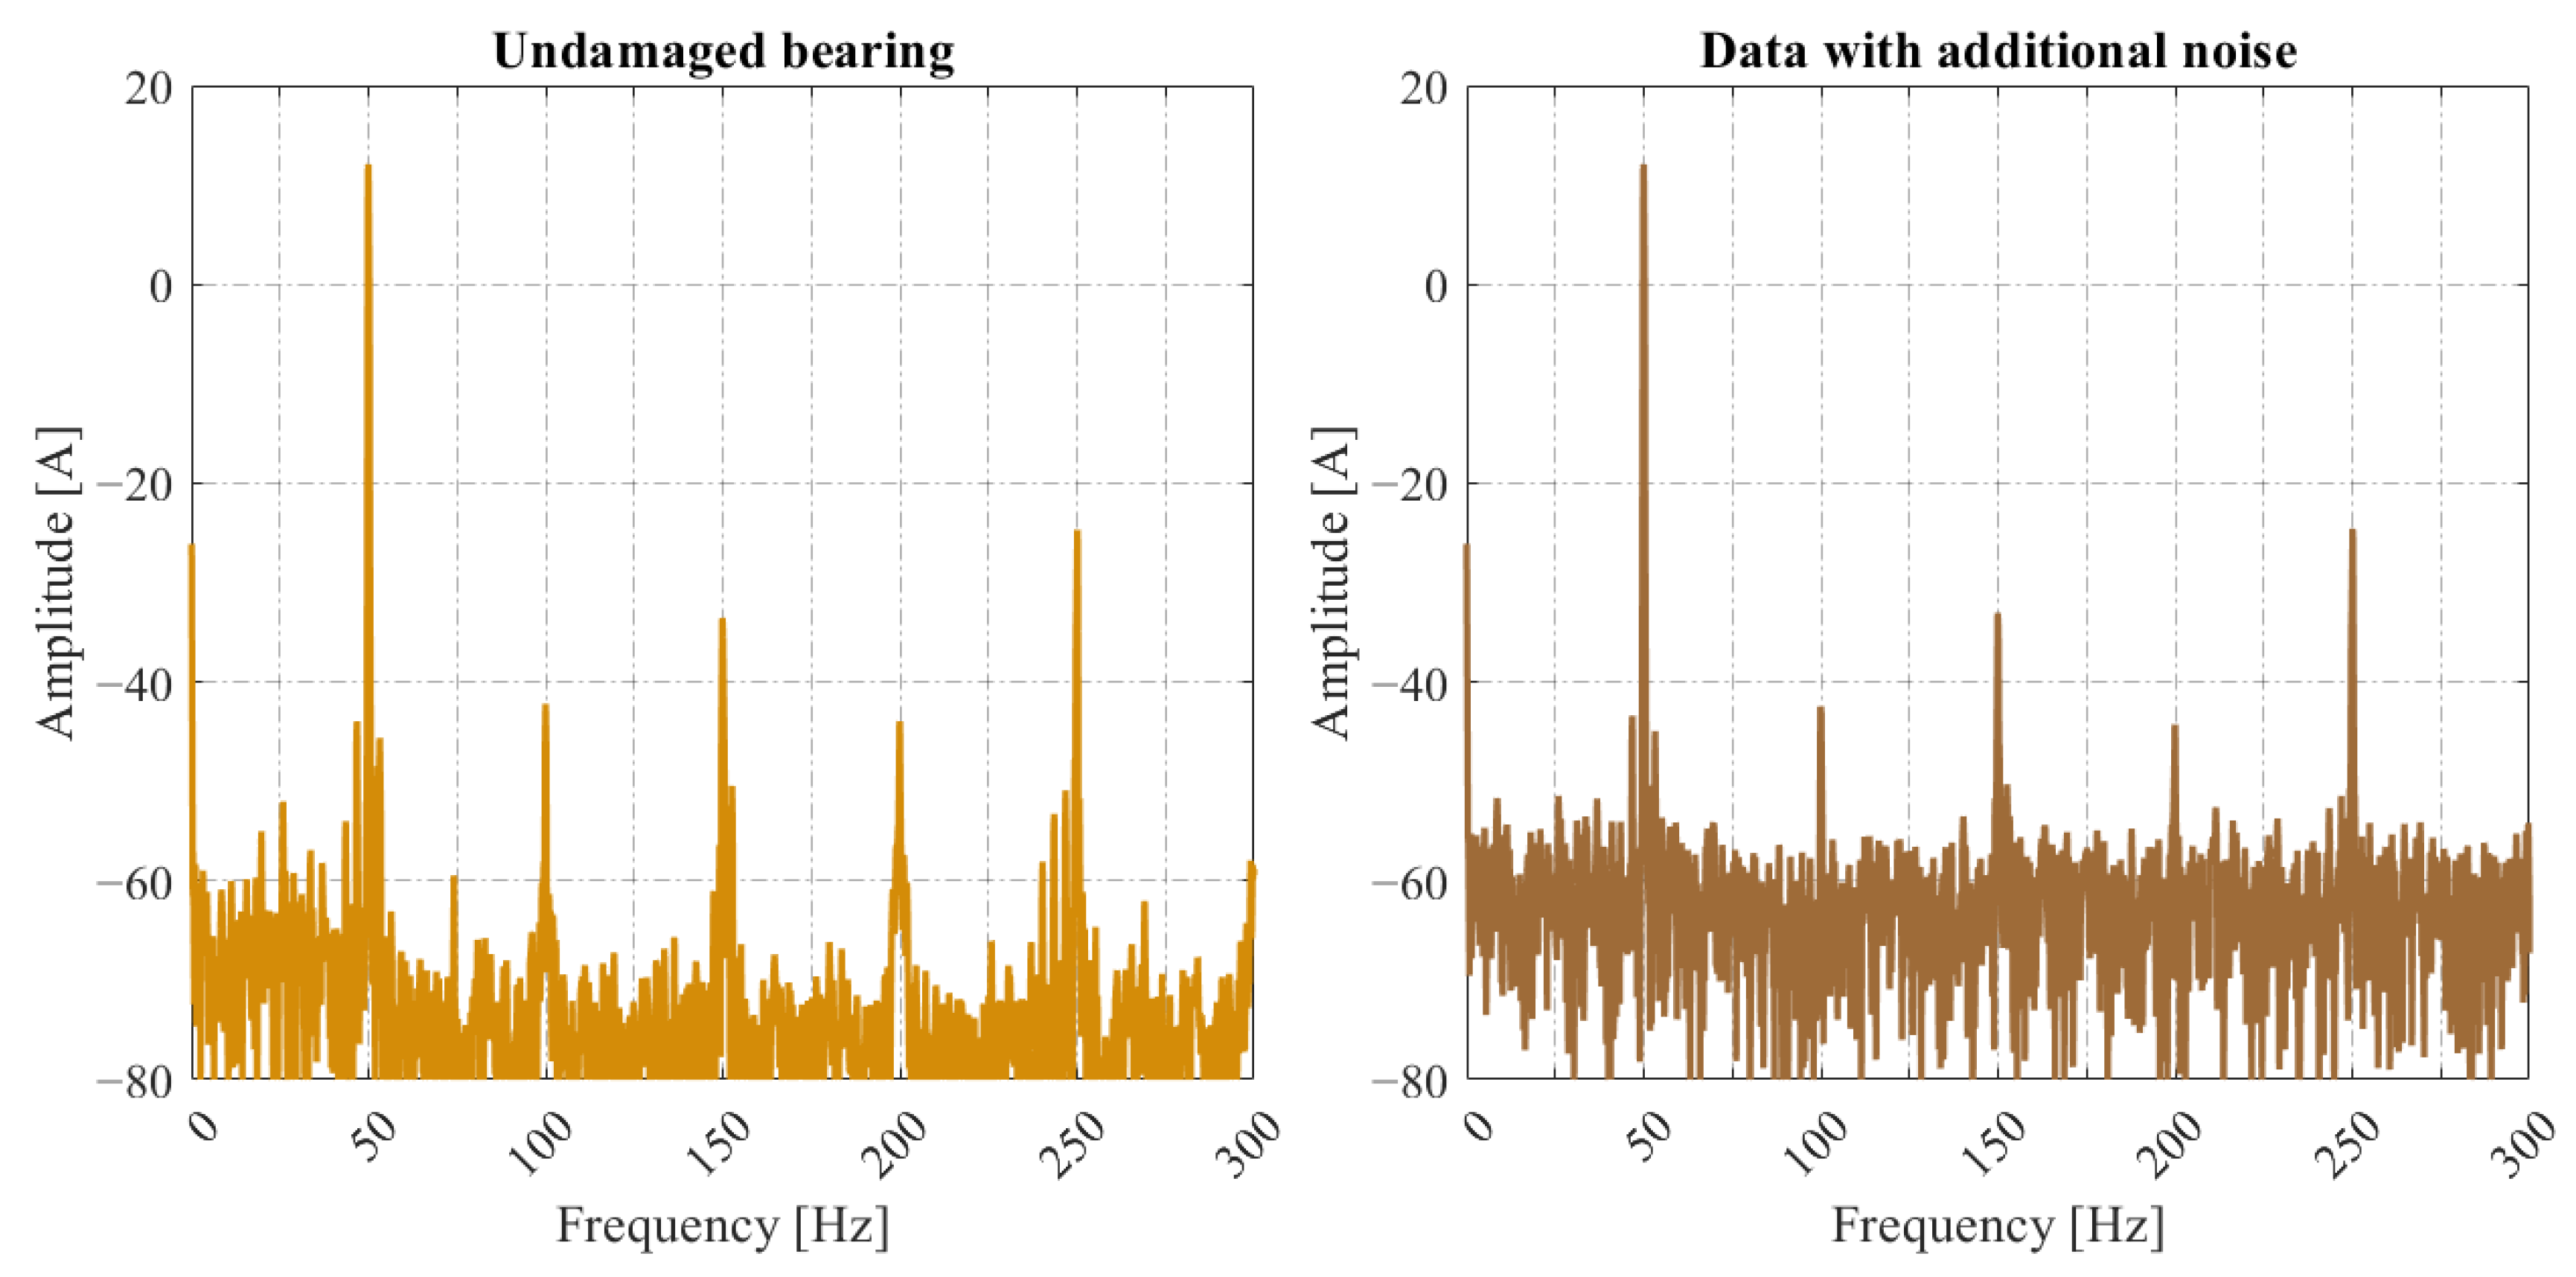
The use of developed diagnostic systems requires the neural structure to maintain a high degree of resistance to input information interference. Simulation of the disturbances was performed on the basis of the white noise added to the measured phase current signals. The implemented disruption was characterized by uniform energy across the frequency band, and its amplitude was characterized by a normal distribution. Changes in the signal spectrum during the application of an additional 10 dB noise level are presented in
Figure 7.
As can be seen in
Figure 7, the influence of noise becomes visible during the spectral analysis of the diagnostic signal. Due to the influence of the spectrum components, the diagnosis of defects is difficult. To check the resistance of the CNN structures developed to additional disturbances in the input signals, in further stages of research, the impact of the artificial noise level on the precision of the deep network was analyzed. To test the robustness of the network to this type of disturbance, noise was added to the signals in the range of 2.5 to 22.5 dB.
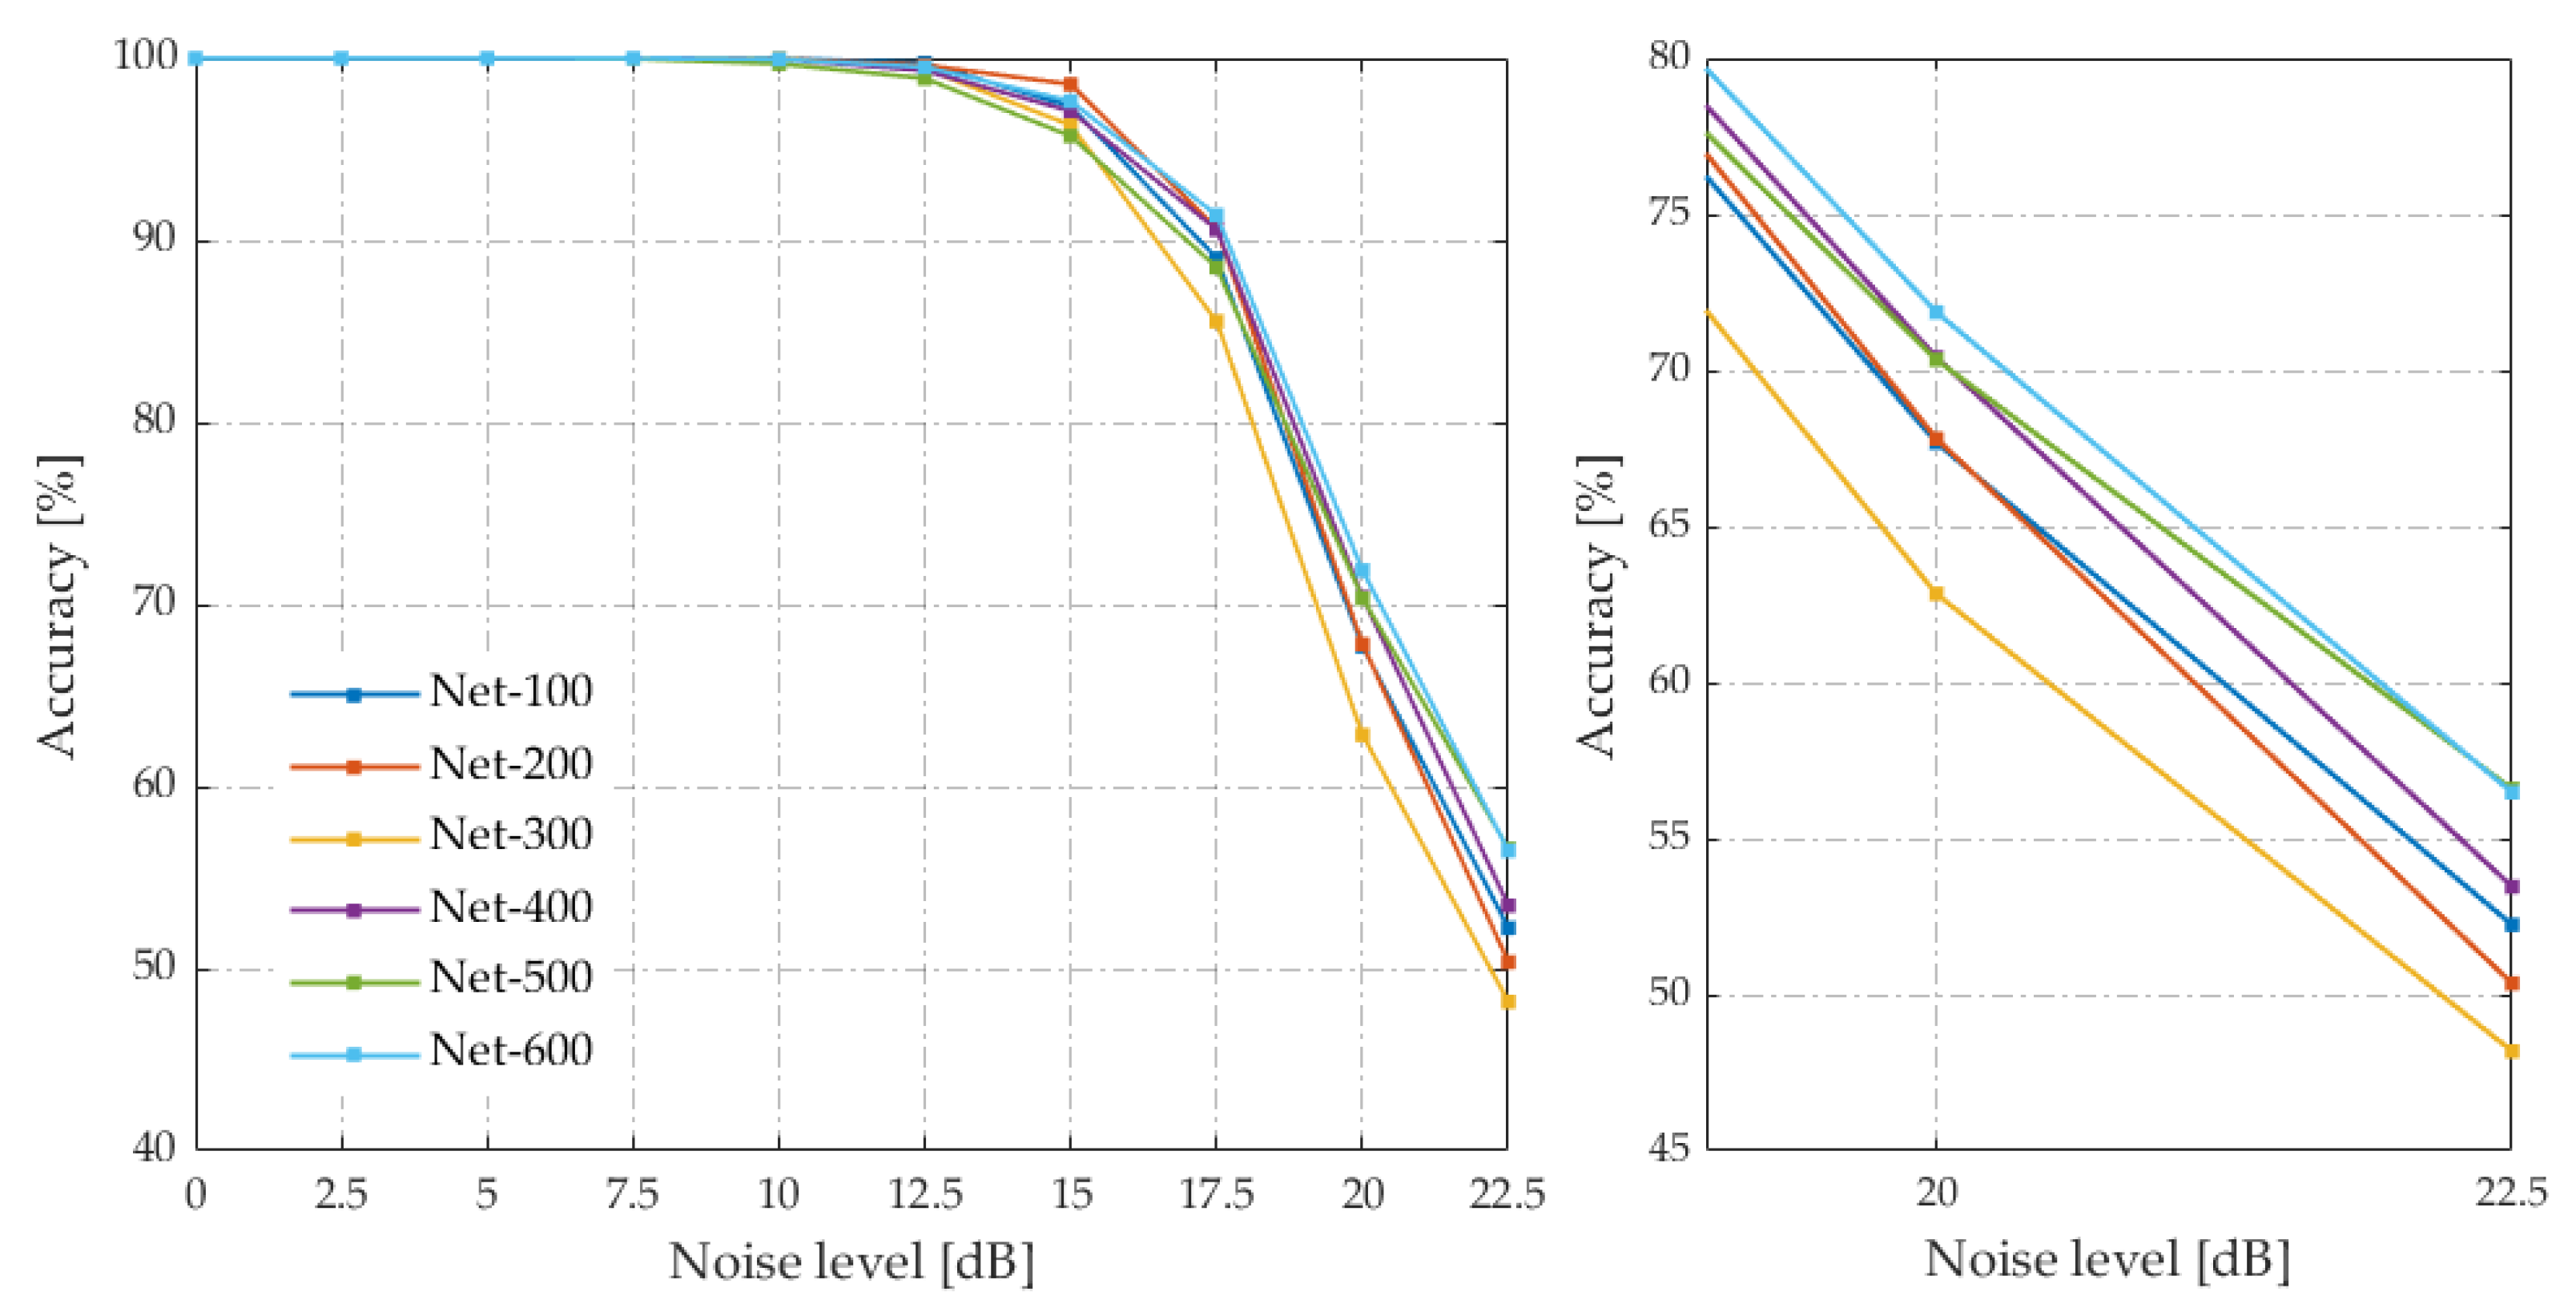
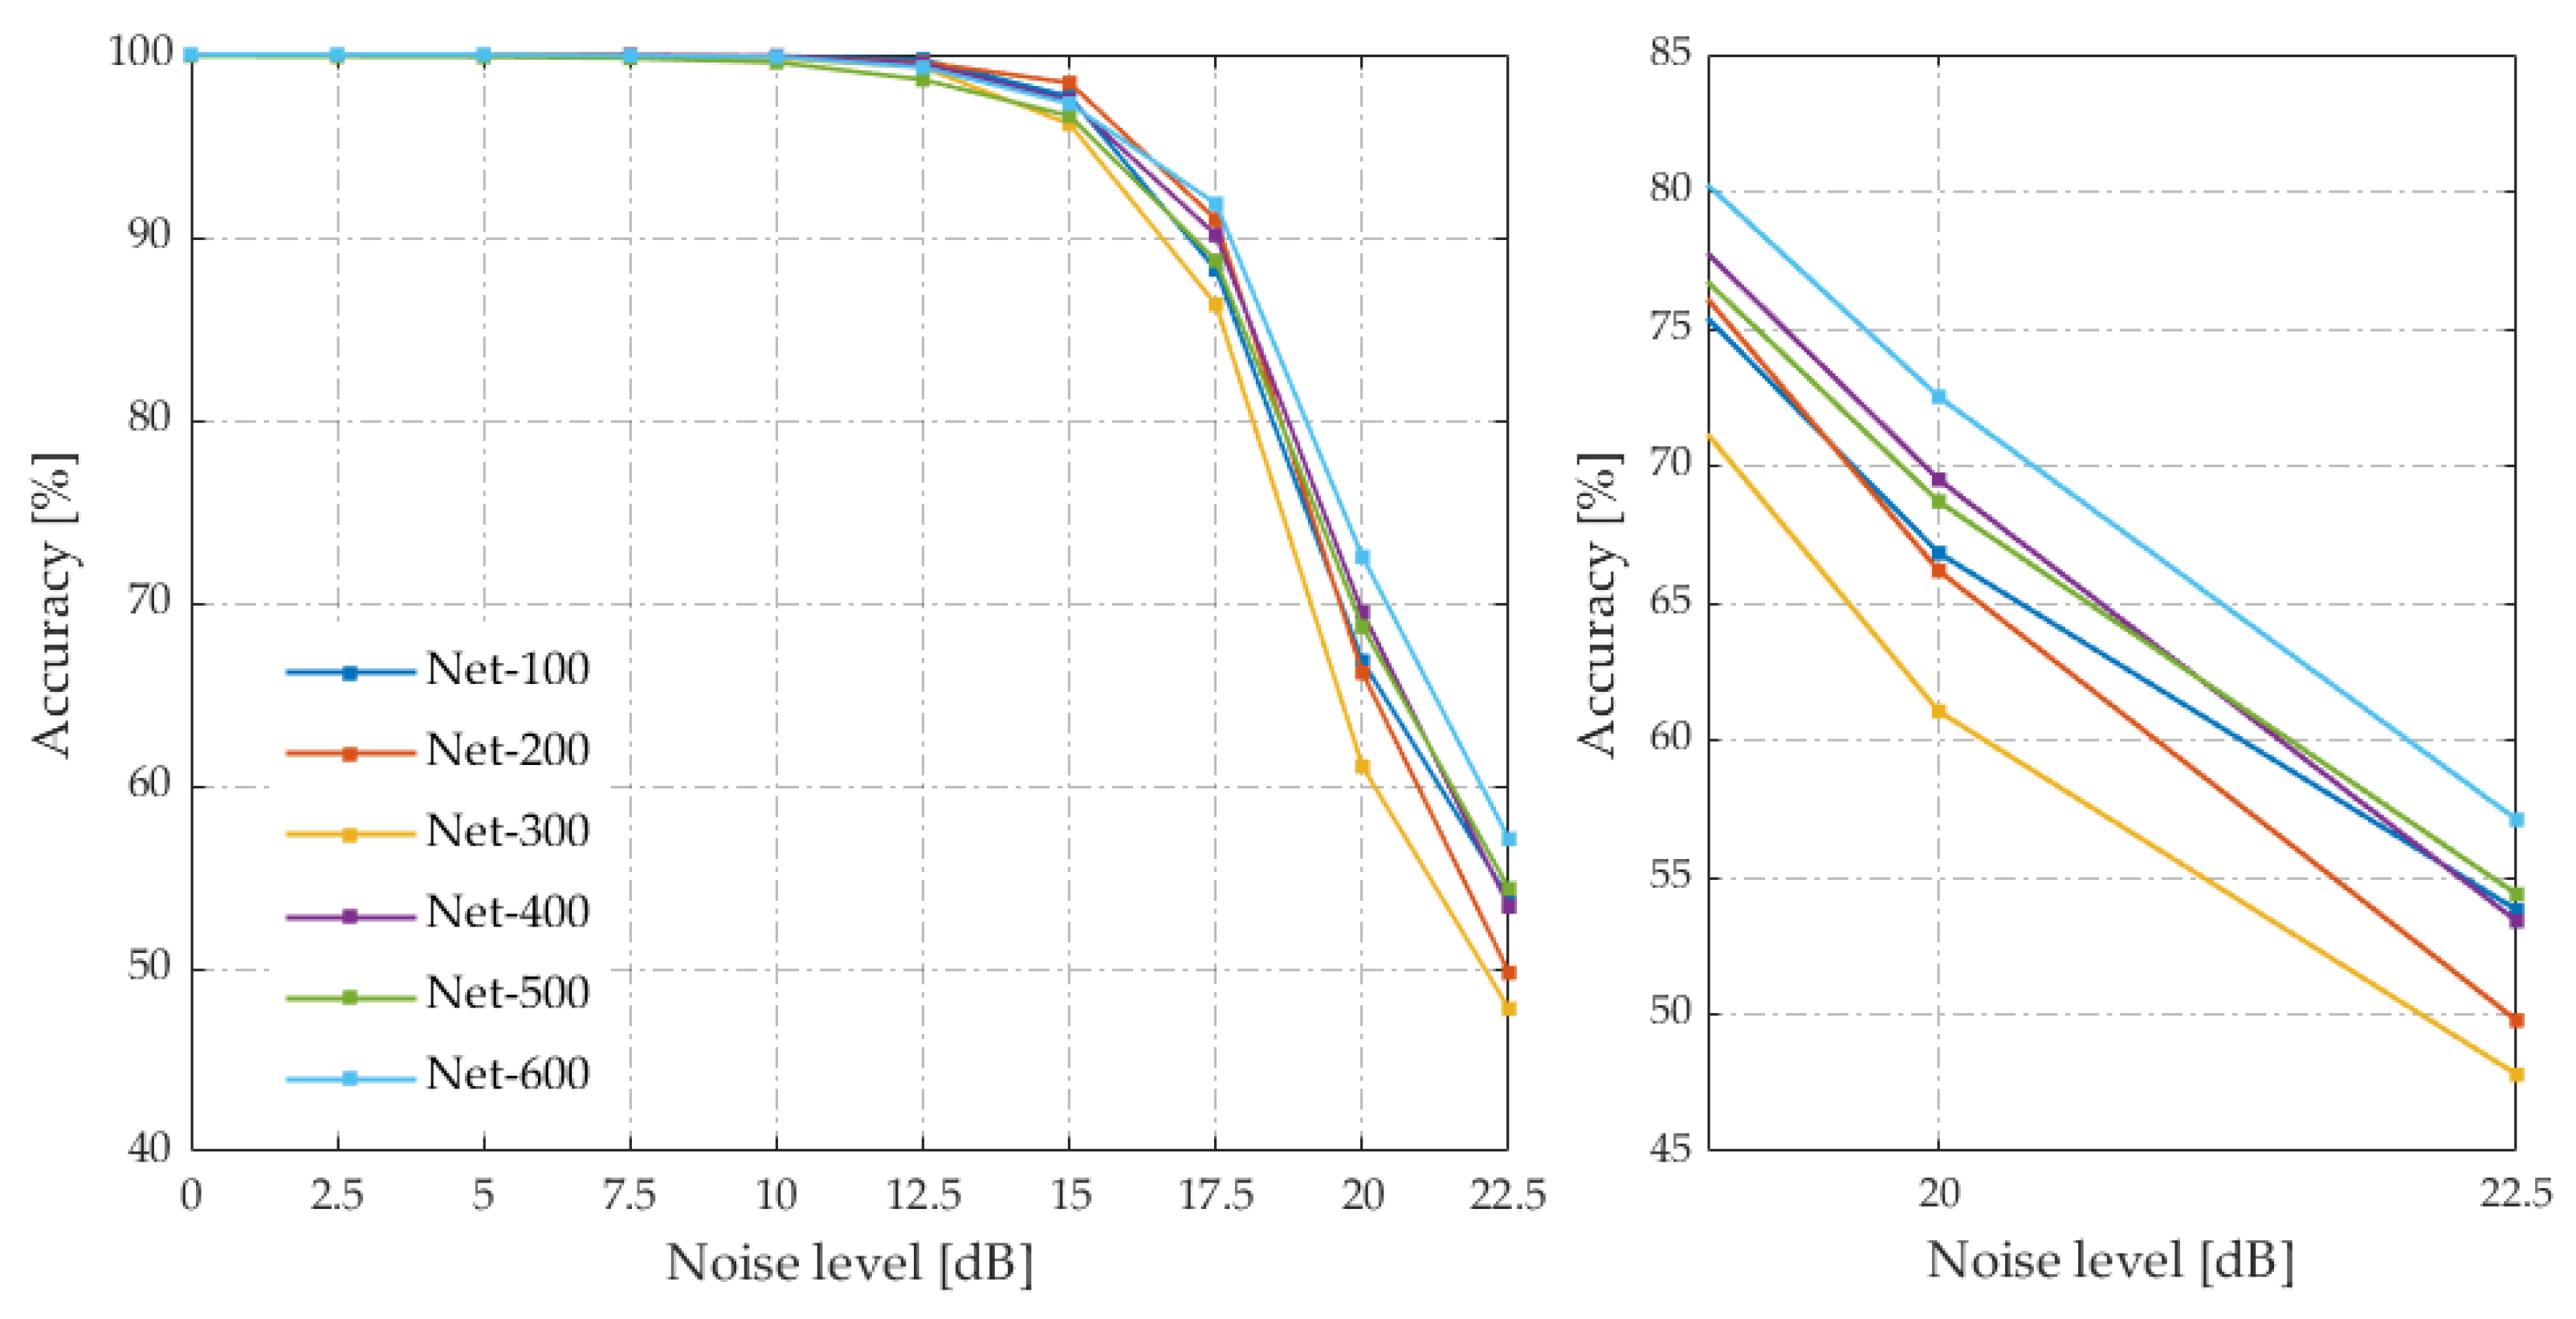
Figure 8 and
Figure 9 illustrate how increasing noise levels affect the accuracy of the tested networks. Noise values below 10 dB do not significantly affect the network’s diagnostic accuracy. However, above this threshold, the accuracy of the convolutional networks’ visibly decreases. It can be observed that the CNN structure with the largest input vector size (Net-600) demonstrates greater tolerance to noise, maintaining better performance under such conditions. This fact results from the larger amount of information stored in the vector that contains 600 current signal samples, which are useful for assessing the technical condition of the machine. At the highest noise level tested, it achieved an accuracy of 8% higher than that of the Net-300 network, which had the lowest results. However, despite the noticeable differences in the precision obtained for training data (
Figure 8) and testing data (
Figure 9) between the CNN structures developed, it can be concluded that all of the presented networks are characterized by high resistance to interference.
6. Conclusions
This article presents an innovative approach to rolling bearing fault diagnosis, which significantly differs from classical methods traditionally used in this field. The proposed solution is based on the use of current signals as the primary source of diagnostic information. This enables precise monitoring of the system’s technical condition without the need for additional sensors, which is particularly advantageous in vehicular drive systems, where strong mechanical vibrations hinder the implementation of conventional vibration-based diagnostic methods.
Furthermore, the developed system has been evaluated in terms of its robustness to noise and varying operating conditions. The tests demonstrated that the neural network used in the diagnostic process maintains high resistance to interference levels exceeding 10 dB, confirming its effectiveness even in noisy environments. Additionally, the system proved to perform reliably under different load and speed conditions, underscoring its practical applicability across a wide range of real-world scenarios.
One of the key advantages of this approach is its ability to classify not only the type of fault, but also its severity. The system achieved nearly 100% accuracy when analyzing current signals, making it a viable alternative to traditional vibration-based techniques. Additionally, a detailed analysis of the convolutional network layers revealed analogous feature extraction patterns for both vibration and phase current signals, confirming the effectiveness of the automatic fault feature extraction process in both cases.
Another important aspect is the efficiency of the diagnostic process in terms of the number of samples required. Initially, up to 600 samples were used, but during testing, this number was reduced to only 100 without compromising the accuracy of the diagnostic algorithm. This reduction enabled fault detection within approximately 50 milliseconds, both during steady-state and transient operating conditions of the drive system.
Author Contributions
Conceptualization, O.F. and M.S.; methodology, O.F. and MS.; software, M.S. and J.J.J.; validation, O.F., M.S., S.W., J.V. and K.S.; visualization J.J.J.; data curation J.J.J.; formal analysis, S.W., J.V. and K.S.; writing—original draft preparation, O.F., M.S., J.J.J., S.W. and J.V.; writing—review and editing, O.F., M.S. and K.S.; project administration, S.W. and K.S. All authors have read and agreed to the published version of the manuscript.
Funding
This research was funded by the European Union under GA no 101101961—HECATE. The views and opinions expressed are, however, those of the author(s) only, and do not necessarily reflect those of the European Union or the Clean Aviation Joint Undertaking. Neither the European Union nor the granting authority can be held responsible for them. This project is supported by the Clean Aviation Joint Undertaking and its Members.
Data Availability Statement
Data are contained within the article.
Conflicts of Interest
Authors Sebastien Weisse and Jerome Valire were employed by the company SAFRAN Electrical & Power. The remaining authors declare that the research was conducted in the absence of any commercial or financial relationships that could be construed as a potential conflict of interest.
Appendix A
Table A1.
Description and designations of the investigated bearing.
Table A1.
Description and designations of the investigated bearing.
| Type of Damage | Damage Level | Parameters |
|---|
| Rolling element | 1 | Spot indentation 0.5–1 mm deep |
| Cage | 1 | Spot indentation 2 mm deep |
| Inner race | 1 | Spot indentation 1 mm deep |
| 2 | Spot indentation 1 mm deep |
| 3 | Two spot indentations 1 mm deep |
| 4 | Longitudinal scratch at a length of 3 mm |
| 5 | Transverse scratch |
| Outer race | 1 | Spot indentation 1 mm deep |
| 2 | Two spot indentations 1 mm deep |
| 3 | Longitudinal scratch at a length of 3 mm |
| 4 | Transverse scratch |
| | - | No fault |
Appendix B
Table A2.
Parameters of convolutional neural network structures.
Table A2.
Parameters of convolutional neural network structures.
| Parameter Name | Parameter Value | |
|---|
| Net-100 | Net-200 | Net-300 | Net-400 | Net-500 | Net-600 |
|---|
| Number of convolution layers | 4 | 4 | 4 | 4 | 4 | 4 |
| Number of filters | [30, 30]
[20, 20] | [30, 30]
[20, 20] | [30, 30]
[20, 20] | [30, 30]
[20, 20] | [30, 30]
[20, 20] | [30, 30]
[20, 20] |
| Dimension of filters | 3 × 3 | 3 × 3 | 3 × 3 | 3 × 3 | 4 × 4 | 4 × 4 |
| Stride | 2 × 2 | 2 × 2 | 2 × 2 | 2 × 2 | 2 × 2 | 2 × 2 |
| Number of batch normalization layers | 4 | 4 | 4 | 4 | 4 | 4 |
| Value of coefficient ε for batch normalization | 0.001 | 0.001 | 0.001 | 0.001 | 0.001 | 0.001 |
| Number of layer normalization layers | 2 | 2 | 2 | 2 | 2 | 2 |
| Value of coefficient ε for layer normalization | 0.00001 | 0.00001 | 0.00001 | 0.00001 | 0.00001 | 0.00001 |
| Number of activation layers | 4 | 4 | 4 | 4 | 4 | 4 |
| Activation function | [ReLU, tanh] | [ReLU, tanh] | [ReLU, tanh] | [ReLU, tanh] | [ReLU, tanh] | [ReLU, tanh] |
| Number of pooling layers | 4 | 4 | 4 | 4 | 4 | 4 |
| Pooling method | [max, average]
[average, max] | [max, average]
[average, max] | [max, average]
[average, max] | [max, average]
[average, max] | [max, average]
[average, max] | [max, average]
[average, max] |
| Window size | [3 × 3]
[2 × 2] | [3 × 3]
[2 × 3] | [3 × 3]
[2 × 2] | 3 × 3 | 3 × 3 | 3 × 3 |
| Stride | [2 × 2]
[1 × 1] | [2 × 2]
[1 × 2] | [2 × 2]
[1 × 1] | 2 × 2 | 2 × 2 | 2 × 2 |
| Dropout probability | 0.5 | 0.5 | 0.5 | 0.5 | 0.5 | 0.5 |
| Number of fully connected layers | 2 | 2 | 2 | 2 | 2 | 2 |
| Number of fully connected neurons | (40), (12) | (40), (12) | (40), (12) | (40), (12) | (40), (12) | (40), (12) |
References
- Gangsar, P.; Tiwari, R. Signal based condition monitoring techniques for fault detection and diagnosis of induction motors: A state-of-the-art review. Mech. Syst. Signal Process. 2020, 144, 106908. [Google Scholar] [CrossRef]
- IEEE Power Engineering Society. Report of Large Motor Reliability Survey of Industrial and Commercial Installations, Part I. IEEE Trans. Ind. Appl. 1985, 21, 853–864. [Google Scholar]
- McInerny, S.A.; Dai, Y. Basic vibration signal processing for bearing fault detection. IEEE Trans. Educ. 2003, 46, 149–156. [Google Scholar] [CrossRef]
- Malla, C.; Panigrahi, I. Review of Condition Monitoring of Rolling Element Bearing Using Vibration Analysis and Other Techniques. J. Vib. Eng. Technol. 2019, 7, 407–414. [Google Scholar] [CrossRef]
- Morales-Perez, C.; Rangel-Magdaleno, J.; Peregrina-Barreto, H.; Ramirez-Cortes, J.; Vazquez-Pacheco, E. Bearing Fault Detection Technique by Using Thermal Images: A Case of Study. In Proceedings of the 2019 IEEE International Instrumentation and Measurement Technology Conference (I2MTC), Auckland, New Zealand, 20–23 May 2019; pp. 1–6. [Google Scholar] [CrossRef]
- Yakkati, R.R.; Yeduri, S.R.; Tripathy, R.K.; Cenkeramaddi, L.R. Multi-Channel Time-Frequency Domain Deep CNN Approach for Machinery Fault Recognition Using Multi-Sensor Time-Series. IEEE Access 2023, 11, 116570–116580. [Google Scholar] [CrossRef]
- Ewert, P.; Kowalski, C.T.; Orlowska-Kowalska, T. Low-Cost Monitoring and Diagnosis System for Rolling Bearing Faults of the Induction Motor Based on Neural Network Approach. Electronics 2020, 9, 1334. [Google Scholar] [CrossRef]
- Blodt, M.; Granjon, P.; Raison, B.; Rostaing, G. Models for Bearing Damage Detection in Induction Motors Using Stator Current Monitoring. IEEE Trans. Ind. Electron. 2008, 55, 1813–1822. [Google Scholar] [CrossRef]
- Schoen, R.R.; Habetler, T.G.; Kamran, F.; Bartfield, R.G. Motor Bearing Damage Detection Using Stator Current Monitoring. IEEE Trans. Ind. Appl. 1995, 31, 1274–1279. [Google Scholar] [CrossRef]
- Silva, J.L.H.; Cardoso, A.J.M. Bearing Failures Diagnosis in Three-Phase Induction Motors by Extended Park’s Vector Approach. In Proceedings of the 31st Annual Conference of IEEE Industrial Electronics Society (IECON 2005), Raleigh, NC, USA, 6–10 November 2005; p. 6. [Google Scholar] [CrossRef]
- Qiao, M.; Yan, S.; Tang, X.; Xu, C. Deep Convolutional and LSTM Recurrent Neural Networks for Rolling Bearing Fault Diagnosis under Strong Noises and Variable Loads. IEEE Access 2020, 8, 66257–66269. [Google Scholar] [CrossRef]
- Chen, Z.; Deng, S.; Chen, X.; Li, C.; Sanchez, R.-V.; Qin, H. Deep Neural Networks-Based Rolling Bearing Fault Diagnosis. Microelectron. Reliab. 2017, 75, 327–333. [Google Scholar] [CrossRef]
- Yuan, L.; Lian, D.; Kang, X.; Chen, Y.; Zhai, K. Rolling Bearing Fault Diagnosis Based on Convolutional Neural Network and Support Vector Machine. IEEE Access 2020, 8, 137395–137406. [Google Scholar] [CrossRef]
- Skowron, M.; Frankiewicz, O.; Jarosz, J.J.; Wolkiewicz, M.; Dybkowski, M.; Weisse, S.; Valire, J.; Wyłomańska, A.; Zimroz, R.; Szabat, K. Detection and Classification of Rolling Bearing Defects Using Direct Signal Processing with Deep Convolutional Neural Network. Electronics 2024, 13, 1722. [Google Scholar] [CrossRef]
- Alsalaet, J.K.; Hajnayeb, A.; Bahedh, A.S. Bearing Fault Diagnosis Using Normalized Diagnostic Feature-Gram and Convolutional Neural Network. Meas. Sci. Technol. 2023, 34, 045901. [Google Scholar] [CrossRef]
- Jin, Z.; Chen, D.; He, D.; Sun, Y.; Yin, X. Bearing Fault Diagnosis Based on VMD and Improved CNN. J. Fail. Anal. Prev. 2023, 23, 165–175. [Google Scholar] [CrossRef]
- Zhang, Q.; Deng, L. An Intelligent Fault Diagnosis Method of Rolling Bearings Based on Short-Time Fourier Transform and Convolutional Neural Network. J. Fail. Anal. Prev. 2023, 23, 795–811. [Google Scholar] [CrossRef]
- Zhang, Q.; Wei, X.; Wang, Y.; Hou, C. Convolutional Neural Network with Attention Mechanism and Visual Vibration Signal Analysis for Bearing Fault Diagnosis. Sensors 2024, 24, 1831. [Google Scholar] [CrossRef]
- Prosvirin, A.; Kim, J.; Kim, J.-M. Bearing Fault Diagnosis Based on Convolutional Neural Networks with Kurtogram Representation of Acoustic Emission Signals. In Advances in Computer Science and Ubiquitous Computing: CSA-CUTE 17; Springer: Singapore, 2018; pp. 21–26. [Google Scholar] [CrossRef]
- Pham, M.T.; Kim, J.-M.; Kim, C.H. Intelligent Fault Diagnosis Method Using Acoustic Emission Signals for Bearings under Complex Working Conditions. Appl. Sci. 2020, 10, 7068. [Google Scholar] [CrossRef]
- Barcelos, A.S.; Cardoso, A.J.M. Current-Based Bearing Fault Diagnosis Using Deep Learning Algorithms. Energies 2021, 14, 2509. [Google Scholar] [CrossRef]
- Hoang, D.T.; Kang, H.J. A Motor Current Signal-Based Bearing Fault Diagnosis Using Deep Learning and Information Fusion. IEEE Trans. Instrum. Meas. 2020, 69, 3325–3333. [Google Scholar] [CrossRef]
- Tandon, N. A Comparison of Some Vibration Parameters for the Condition Monitoring of Rolling Element Bearings. Measurement 1994, 12, 285–289. [Google Scholar] [CrossRef]
- Ali, J.B.; Fnaiech, N.; Saidi, L.; Chebel-Morello, B.; Fnaiech, F. Application of Empirical Mode Decomposition and Artificial Neural Network for Automatic Bearing Fault Diagnosis Based on Vibration Signals. Appl. Acoust. 2015, 89, 16–27. [Google Scholar] [CrossRef]
- Ince, T.; Kiranyaz, S.; Eren, L.; Askar, M.; Gabbouj, M. Real-Time Motor Fault Detection by 1-D Convolutional Neural Networks. IEEE Trans. Ind. Electron. 2016, 63, 7067–7075. [Google Scholar] [CrossRef]
- Sun, W.; Zhao, R.; Yan, R.; Shao, S.; Chen, X. Convolutional Discriminative Feature Learning for Induction Motor Fault Diagnosis. IEEE Trans. Ind. Inform. 2017, 13, 1350–1359. [Google Scholar] [CrossRef]
- Skowron, M.; Wolkiewicz, M.; Tarchała, G. Stator winding fault diagnosis of induction motor operating under the field-oriented control with convolutional neural networks. Bull. Pol. Acad. Sci. Tech. Sci. 2020, 68, 1039–1048. [Google Scholar] [CrossRef]
- Skowron, M.; Kowalski, C.T. Permanent Magnet Synchronous Motor Fault Detection System Based on Transfer Learning Method. In Proceedings of the IECON 2022—48th Annual Conference of the IEEE Industrial Electronics Society, Brussels, Belgium, 17–20 October 2022; pp. 1–6. [Google Scholar] [CrossRef]
- Sun, S.; Chen, W.; Wang, L.; Liu, X.; Liu, T.Y. On the Depth of Deep Neural Networks: A Theoretical View. In Proceedings of the AAAI Conference on Artificial Intelligence, Phoenix, AZ, USA, 12–17 February 2016. Volume 30, No. 1. [Google Scholar]
- Liu, R.; Wang, F.; Yang, B.; Qin, S.J. Multiscale Kernel-Based Residual Convolutional Neural Network for Motor Fault Diagnosis under Nonstationary Conditions. IEEE Trans. Ind. Inform. 2020, 16, 3797–3806. [Google Scholar] [CrossRef]
- Shao, S.; Yan, R.; Lu, Y.; Wang, P.; Gao, R.X. DCNN-Based Multi-Signal Induction Motor Fault Diagnosis. IEEE Trans. Instrum. Meas. 2020, 69, 2658–2669. [Google Scholar] [CrossRef]
| Disclaimer/Publisher’s Note: The statements, opinions and data contained in all publications are solely those of the individual author(s) and contributor(s) and not of MDPI and/or the editor(s). MDPI and/or the editor(s) disclaim responsibility for any injury to people or property resulting from any ideas, methods, instructions or products referred to in the content. |
© 2025 by the authors. Licensee MDPI, Basel, Switzerland. This article is an open access article distributed under the terms and conditions of the Creative Commons Attribution (CC BY) license (https://creativecommons.org/licenses/by/4.0/).


 ,
, 

