1. Introduction
Global energy demand is increasing, and much of this demand is still met by non-renewable sources. These sources have many negative effects, such as greenhouse gas (GHG) emissions, leading to climate change. Renewable energy sources offer cleaner alternatives and help reduce these harmful impacts. Ocean wave energy as a renewable energy source shows great potential. It is estimated that up to 2 TW of wave energy could be harnessed globally [
1]. Off-grid solutions for island communities and offshore structures’ power requirements can be the main beneficiaries of WECs [
2].
Wave energy has some unique advantages compared to other renewable sources. It has the highest energy density among renewables. The power of waves on the ocean surface is about five times stronger than wind power measured at 19.5 m above sea level. Wave energy also provides continuous power generation throughout the day. This makes it more reliable, as wave patterns are predictable and their seasonal changes often align with electricity demand [
3].
The history of wave energy dates back to 1799, when the first wave energy converter (WEC) was patented [
3]. Since then, hundreds of devices have been designed and tested. However, many of these technologies remain in the development phase and require improvements. Oscillating water column (OWC) technology is a type of wave energy-harnessing technology that has gained attention for its simple design. LIMPET (Land Installed Marine Powered Energy Transformer) in Scotland, Mutriku in Spain, the OE (Ocean Energy) buoy in Ireland, and Sharp Eagle in China are examples of commercial WECs that use OWC technology.
Both fixed and floating OWC WECs operate based on a simple working principle. An OWC consists of a hollow chamber that is partially submerged in water, with the upper section filled with air. The air chamber is connected to a turbine designed to rotate in one direction, even under bidirectional airflow, through an air vent. The submerged part of the chamber is open to incident waves. As wave action causes the water surface inside the chamber to oscillate, air is forced in and out through the vent, driving the turbine. This rotational motion of the turbine is transferred to a coupled generator, which produces electricity. Two types of turbines are mainly used in OWC WECs, which are Wells turbine and impulse turbine. Analysis of the operating characteristics of both turbine types reveals that impulse turbines are more efficient in harnessing annual energy compared to Wells turbines. Their ability to function optimally at lower rotational speeds minimizes mechanical strain on components, thereby extending operational life and reducing maintenance expenses. Moreover, impulse turbines exhibit a broader functional range, operate effectively with lower pressure drops at equivalent flow rates, and ensure more stable performance. These advantages make them a preferable option for wave energy systems [
4]. Durability, survivability, and low energy capture efficiency make OWC technology less commercially viable WECs [
2].
Even though WEC energy systems are considered renewable energy systems, little is known about their holistic environmental impacts. When developing these systems, life cycle assessment (LCA) is a helpful tool to identify their environmental impact. It can be hypothesized that the environmental impacts of WEC can be reduced through strategic construction practices, including proper material selection and improved energy-harnessing designs. However, few LCAs have been conducted on wave energy converters to address research questions, such as what are the specific environmental impacts associated with the construction of WEC devices, and how the selection of eco-friendly materials and advanced energy-harnessing technologies can improve the sustainability of the systems.
Life Cycle Assessment of Ocean Wave Energy Converters
LCAs provide a clearer understanding of how different technologies perform in terms of environmental sustainability. They also help identify key areas where improvements can be made to reduce the environmental footprint of marine renewable energy systems.
One study [
5] performed a cradle-to-grave LCA for the Pelamis P1 WEC with a capacity of 750 kW. This assessment covered every stage, such as material and manufacture, assembly and installation, operation and maintenance, and decommissioning of the WEC. The Pelamis manufacturer supplied the foreground data, while the background data came from the Ecoinvent database (version 3.3). SimaPro (version 8.3 PhD) was used to model the LCA model, and for the analysis, the ReCiPe and CED impact assessment methods were used. In this study, 1 kWh of output electrical power with a reference flow of 1 Pelamis served as the functional unit. The carbon footprint was estimated at 35 gCO
2 eq/kWh, and the carbon payback period was 18–24 months. The results revealed that steel production and sea vessel operations were the main contributors to environmental impacts. A large amount of steel used in manufacturing and the energy-intensive operations of sea vessels led to significant environmental burdens in each and every impact category.
Another cradle-to-grave LCA study [
6] focused on the Oyster 1 (capacity of 315 kW) and the Oyster 800 (capacity of 800 kW) wave energy converters designed for coastal waters. This study also used 1 kWh of generated electricity based on the expected total energy generated during its lifetime as the functional unit, with data from the Ecoinvent database v3.01 and constructed the LCA model on the SimaPro 8 software tool. The EDIP2003, CED, and ReCiPe 2008 methods were applied to assess the impacts. Since the database lacked specific data for marine-grade steel, the analysis used stainless steel as a substitute. Meanwhile, small mechanical components and onshore assembly data were excluded from the analysis under the assumption that the impacts of those components are relatively insignificant. The findings indicated substantial environmental impacts, particularly from the large volumes of steel required to construct the devices. The carbon footprint was estimated at 79 gCO
2 eq/kWh and 57 gCO
2 eq/kWh, and the energy payback periods were 45 and 42 months for Oyster 1 and Oyster 800, respectively. The results clearly stated that although the Oyster 800 is a larger WEC than its predecessor Oyster 1, the Oyster 800 performed well in terms of environmental performance. This demonstrates that design improvements for more energy harnessing have a positive effect on the environmental impact. These results emphasize that material choice, material reduction strategies, and design improvement for higher power output can greatly influence the sustainability of WEC technologies.
A different study [
7] explored the environmental impact of a smaller point absorber WEC known as the buoy-rope-drum (BRD) device, which has a capacity of 10 kW. The LCA used the ReCiPe midpoint level method and relied on data from the Ecoinvent 3 database, and the SimaPro v 8.3.0.0 software tool was used to construct the LCA model. In this case, the entire BRD WEC, during its service lifespan of 20 years, was used as the functional unit. This cradle-to-grave study calculated the energy intensity of the BRD device at 387 kJ/kWh and its carbon intensity at 89 gCO
2/kWh. The energy payback period was determined to be 26 months, and the carbon payback period was 23 months. These figures suggest that smaller WECs like the BRD device may offer shorter payback periods compared to larger systems, depending on their design and materials.
Another study [
8] examined the life cycle impacts of a 10 MW array consisting of 28-point absorber WECs by CorPower Ocean AB (CPO). This analysis was carried out at an early stage in the product’s development. The LCA was based on the ReCiPe v1.31 midpoint (H) and CED methods, covering 19 different impact categories. Ecoinvent v3.6 was used for background data, and the SimaPro v9.1.0 software tool was used for the LCA model construction. The functional unit was defined as 1 kWh of electricity generated by the array. Several assumptions were made, including the amount of steel lost during the machining processes, which was estimated to be 23%. The study showed that LCAs are especially valuable in the early stages of developing wave energy technologies. Comparisons were made among other renewable and conventional electricity generation methods. It shows that the CPO plant’s global warming potential is up to 18, 29, and 43 times lower compared to combined cycle gas, conventional gas, and hard coal power plant’s global warming potential, respectively. These results conclude that by identifying environmental hotspots early on, design improvements can be made to reduce future impacts. This ensures that wave energy technologies become more efficient and sustainable as they move towards commercialization.
A study published in 2021 [
9] shows the cradle-to-grave LCA analysis conducted for an oscillating wave surge (OWS) converter called MegaRoller with a nominal capacity of 1 MW. In this study, the functional unit was chosen as 1 kWh of electricity produced for the Portuguese electricity grid by a 1 MW WEC. SimaPro v8.5.2 software tool was used to model the system, and the Ecoinvent database (version 3.4) was used for the background data. The ReCiPe 2016 Midpoint method and CED method were used to assess the environmental impact. Several assumptions were made in some cases because of the lack of data; for processes taking place in unknown locations, the average European or global electricity mix was used. The results show that GWP was found to be 33.8 g CO
2 eq/kWh and the CED results to be 432 kJ/kWh, including the disposal of the components upon their end of life. These values rise to 75.1 g CO
2 eq/kWh and 1010 kJ/kWh for GWP and CED, respectively, if the disposal is excluded. The resulting marine eutrophication (MEU) and the Marine ecotoxicity (ME) are 1.1 mg N eq/kWh and 2.8 g 1,4-DCB /kWh, respectively, when disposal is included. The carbon payback period is 2.3 years, while the energy payback period is 2.4 years when the disposal is included. It was concluded that the concrete foundation is the main contributor to GHG emissions. The manufacture of steel mainly contributes to freshwater and marine eutrophication, and mineral resource scarcity impacts categories.
Table 1 shows the summary of these studies for a clear understanding. These studies consistently highlight the significance of materials, particularly steel and concrete, in shaping the environmental performance of WECs. The heavy use of steel and concrete in construction is a major factor driving the environmental impact of these devices. Moreover, the operational demands of sea vessels further add to the environmental footprint, particularly during installation and maintenance. Another concern when performing an LCA is selecting the appropriate LCA software for analysis. There are many open-source and commercial software options available, such as SimaPro, GaBi, and OpenLCA. The software’s effectiveness on results is crucial to prevent decision-makers from making wrong choices [
10].
SimaPro software was used in the above-discussed studies. Further LCA studies can be found in [
10,
11,
12,
13]. Moving forward, future research should focus on optimizing materials and improving the efficiency of WEC operations. This would help reduce the environmental impact and make wave energy a more viable and sustainable option for electricity generation.
The novelty of this study is to fill this gap by presenting a cradle-to-gate LCA of an oscillating water column WEC for the first time, assessing the environmental impacts of the plant across 19 impact categories.
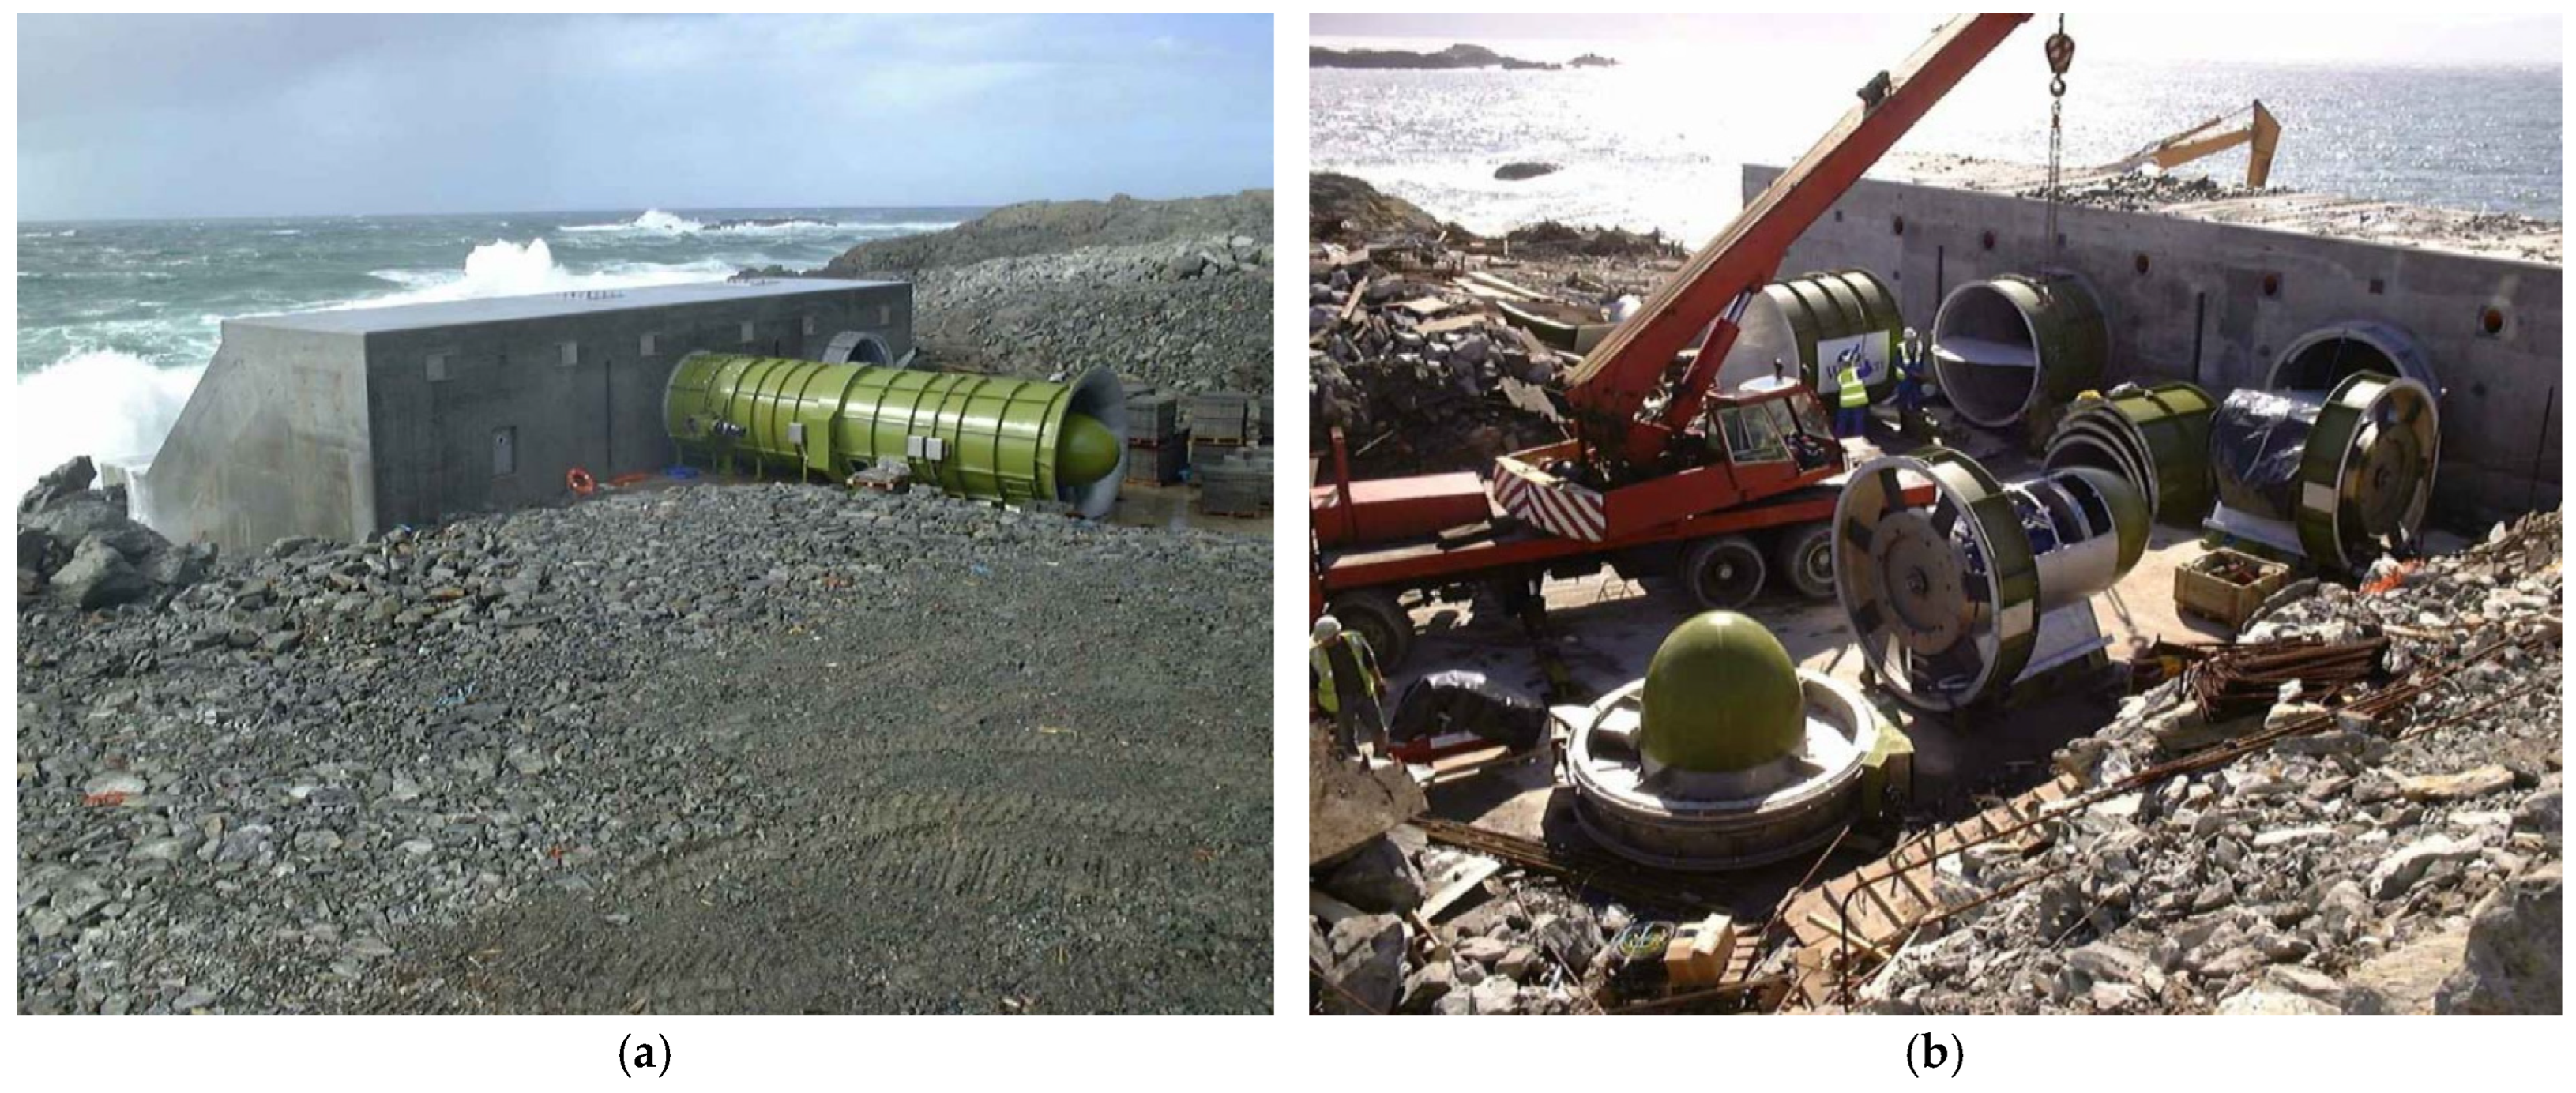
The data for this study were obtained from the 500 kW Land Installed Marine Powered Energy Transformer (LIMPET) OWC plant. It is the world’s first commercial wave energy plant [
10] which was located on Islay Island in Scotland and operated until its decommissioning in 2011, as shown in
Figure 1.
The analysis uses OpenLCA 2.0 software with the ReCiPe 2016 Midpoint and CED methods. The Ecoinvent v3.8 cut-off database was used for background data. This study, in particular, provides insights into the plant’s global warming potential, energy payback, and carbon payback periods.
2. Materials and Methods
The LCA analysis was carried out using the OpenLCA 2.0 software. Foreground data, including key details of the plant, was collected from the LIMPET project report [
15]. Ecoinvent v3.8 cut-off database was used to obtain background data, and SOLIDWORKS 2023 software was used to accurately determine material quantities based on the dimensions and types of materials used in the plant, creating 3D computer-aided drafting (CAD) models. The background data for the analysis was obtained from the Ecoinvent v3.8 cut-off life cycle inventory (LCI) database. The following sub-section provides a detailed explanation of the four phases of the LCA methodology. These phases follow the guidelines set by ISO 14040 [
16] and ISO 14044 standards [
17]. The first phase is the goal and scope definition, where the purpose of the LCA and its boundaries are established. Next is the inventory analysis, which involves collecting data on all inputs and outputs throughout the product’s life cycle. The third phase is the impact assessment, where the potential environmental impacts are evaluated based on inventory data. The final phase is interpretation, where the results are analyzed to draw conclusions and provide recommendations [
18].
2.1. Goal and Scope Definition
This study aimed to identify the major processes and material flows that contribute most significantly to the environmental impact of an OWC-type wave energy converter up to its operational period. An LCA was conducted using a 500 kW commercial-scale OWC named LIMPET as the case study to achieve this.
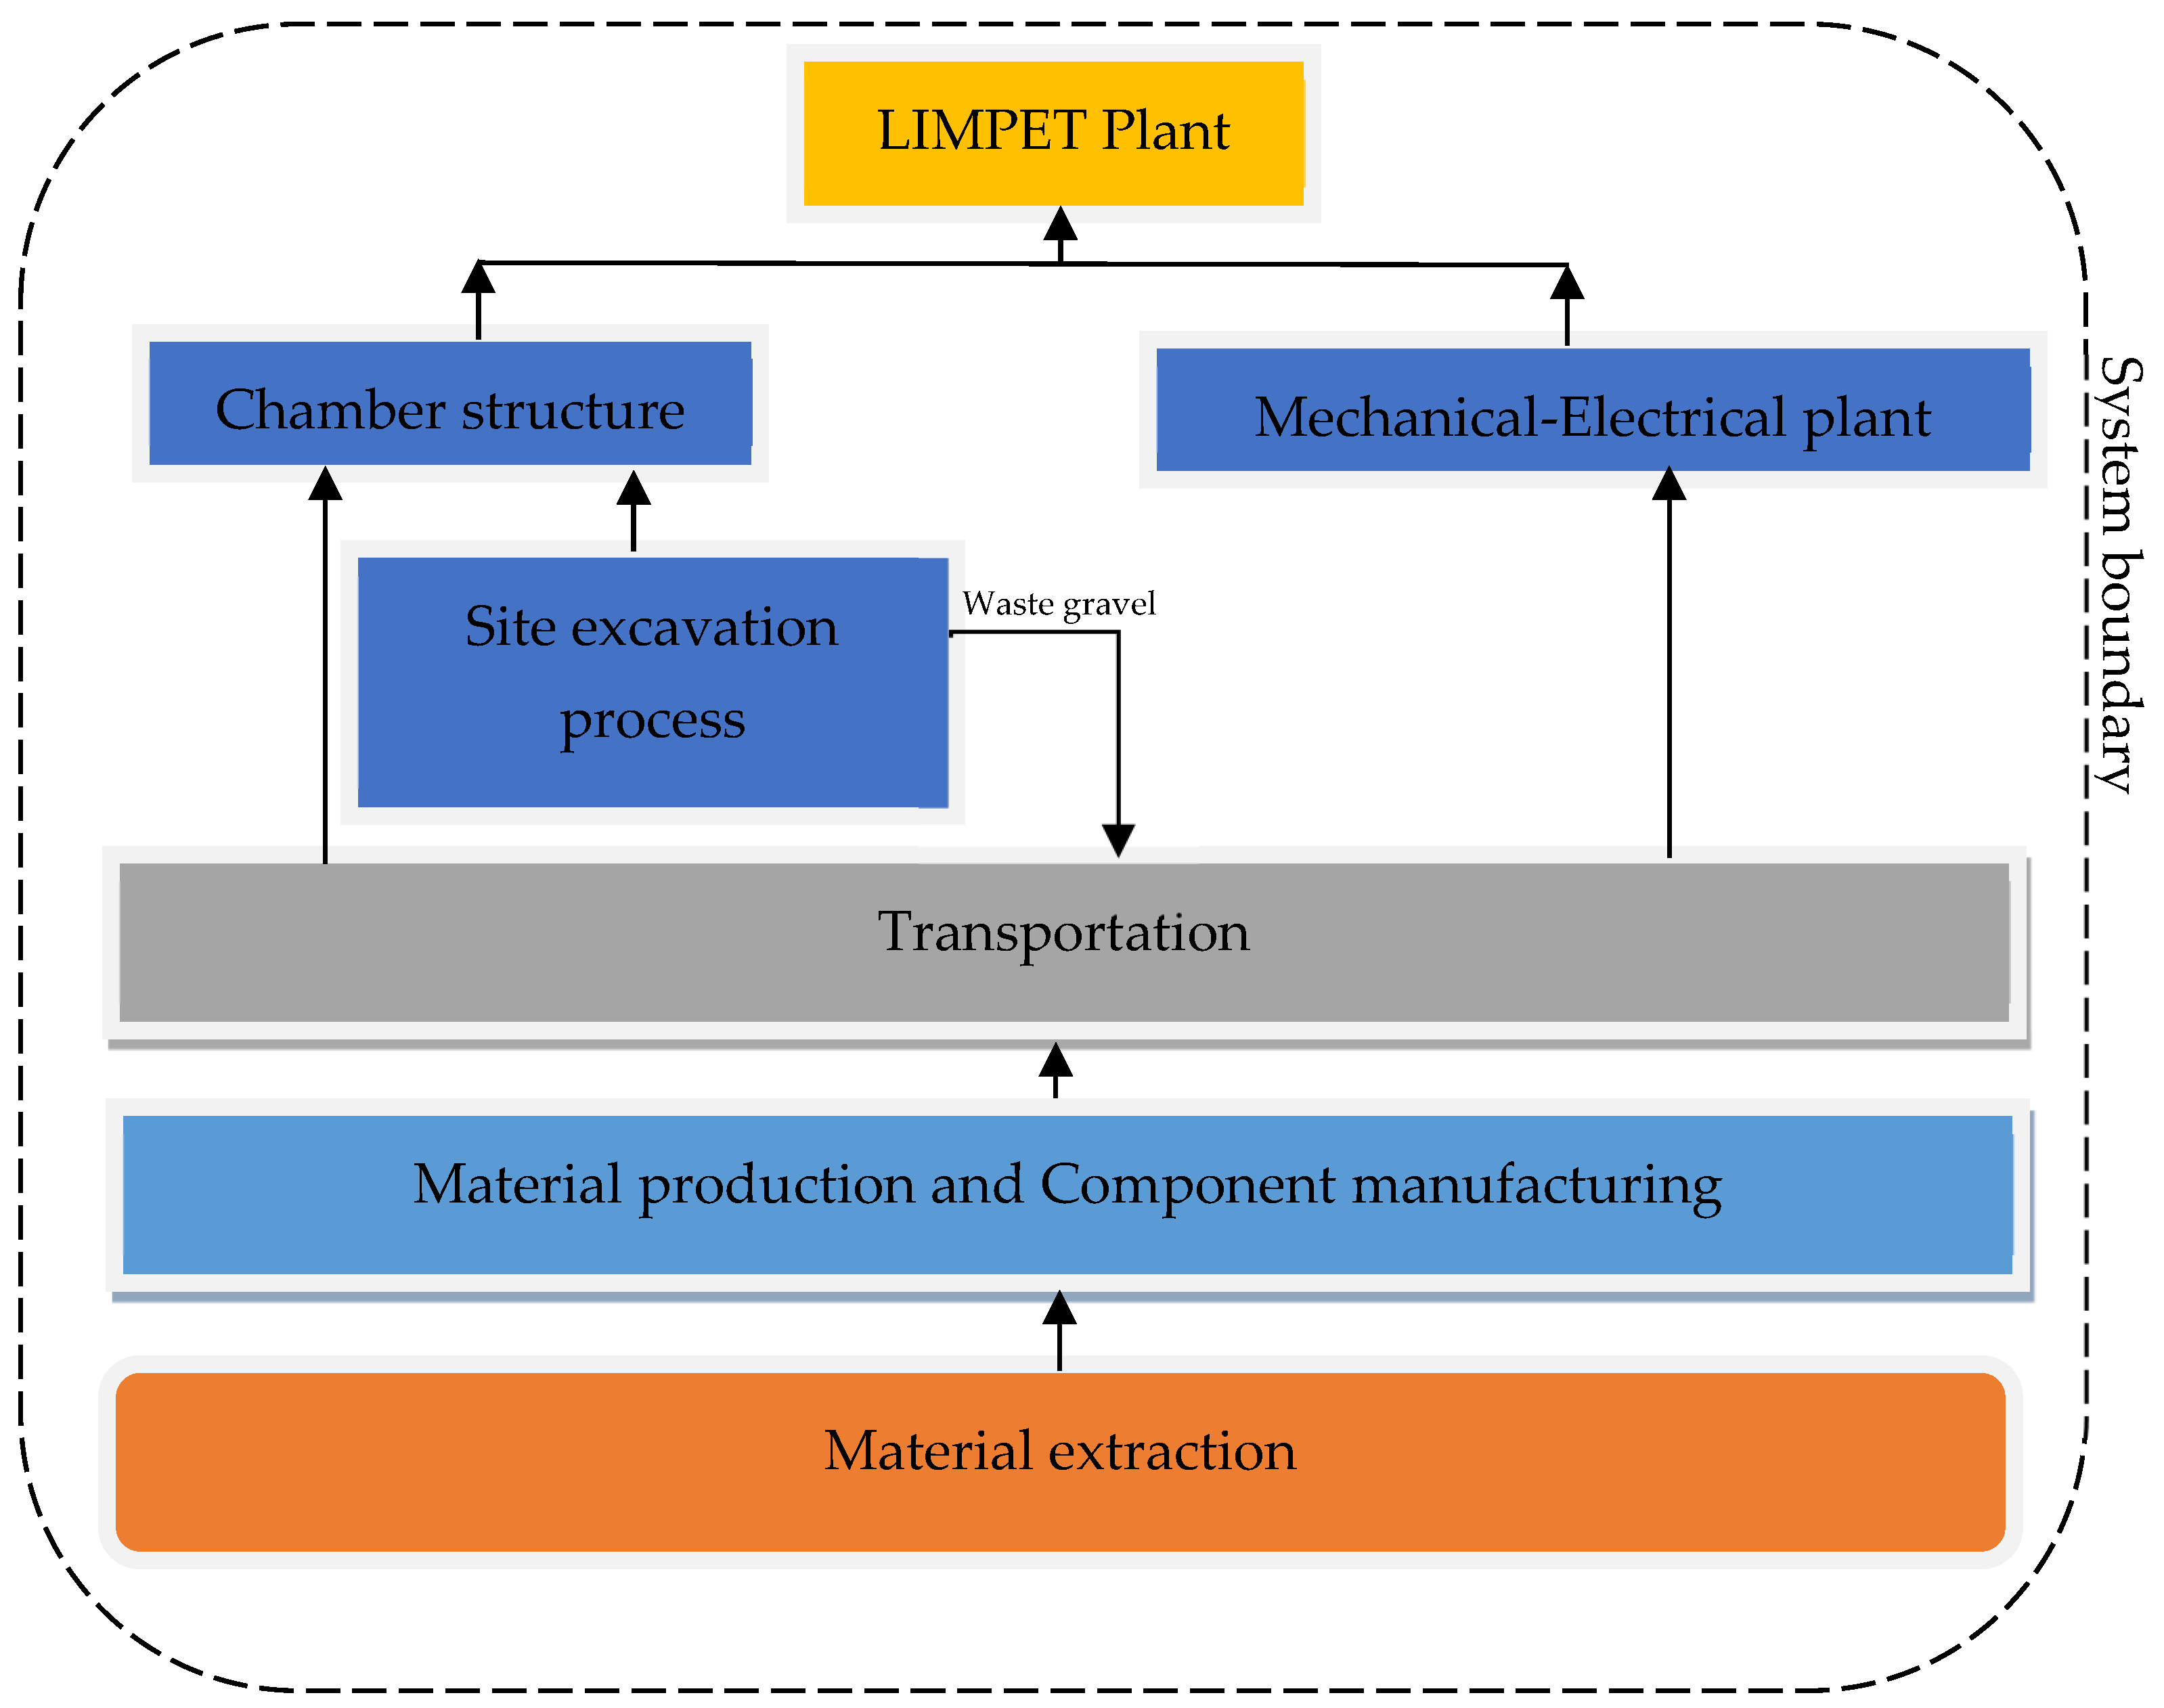
Figure 2 provides a pictorial overview of the OWC’s chamber structure and key components taken from the LIMPET project report [
15]. These include the turbines, control valves, flywheel, turbine stand, and air duct, all of which are part of the Mechanical–Electrical system in the plant.
The scope of this study is a cradle-to-gate life cycle assessment (LCA) for the 500 kW OWC wave energy converter, covering the initial stages of the system’s life cycle. According to the selected life stage, several sub-processes that make significant contributions to the main process have been identified. These include the extraction, transportation, and processing of raw materials. Since all raw materials come from the environment, they directly contribute to the environmental footprint. Furthermore, types of machinery that are used for extraction, transportation, and processing require fuel, electricity, or another power source to be operated, making them sensitive to the environmental footprint. These sub-processes also involve site excavation and the removal of waste gravel from the excavated site, the transportation of materials for constructing the chamber, and the manufacturing and transportation of Mechanical–Electrical equipment to the site. These processes also use different types of machinery for excavation and manufacturing, as well as waterborne and land transportation methods for transporting materials and components to the selected site, which mainly contribute to the environmental footprint because of their fuel consumption and their direct and indirect emissions.
Some processes were excluded from this analysis because of the lack of data, as well as some processes that were identified as insignificant to the main process. These include the production of smaller components like bolts, rivets, cables, and electronic parts such as sensors. Additionally, the study does not account for the assembly of the Mechanical–Electrical plant, the construction of the chamber, the connection to the power grid, and the plant’s operation and maintenance, since they were considered insignificant. Furthermore, this study focused on a cradle-to-gate LCA study, and the factory gate is placed upon the full completion of the LIMPET plant. Hence, the decommissioning of the plant and the end-of-life handling of materials are outside the scope of this assessment.
The study evaluated the environmental impact using a functional unit defined as the generation of 1 kWh of electricity by a 500 kW oscillating water column (OWC) power plant operated over the course of one year. The reference flows consist of two main processes: the manufacturing of the Mechanical–Electrical components and the construction of the chamber structure.
Figure 3 shows the process flow diagram of the study. In this study, all processes within the foreground product system were treated as single-function systems with a single output product. As a result, allocation methods were not applied. This approach simplifies the analysis by focusing solely on the direct environmental impacts associated with producing the specified output. The background data for the analysis was obtained from the Ecoinvent v3.8 cut-off life cycle inventory (LCI) database where wastes are the producer’s responsibility (“polluter pays”), and the recyclable by-products are available burden-free (cut-off). The developed LCI model follows the same cut-off system approach.
2.2. Inventory Analysis
2.2.1. Material and Manufacturing
A detailed inventory of the materials used for manufacturing the Mechanical–Electrical components and constructing the chamber structure was gathered from the LIMPET project report [
15]. The report provided precise dimensions for all the major components. 3D CAD models were created to estimate the material quantities needed for each part of the power plant using these dimensions.
Figure 4 shows several 3D CAD models of the LIMPET power plant. For the construction of the entire concrete OWC chamber, 1290 m
3 of reinforced concrete was used. Entry lips used to reduce the turbulence of the inlet flow were estimated to be 19,000 kg of steel. The Mechanical–Electrical plant consisted of different components that were cast out of marine-grade steel.
Table 2 provides a breakdown of the material quantities used for each LIMPET OWC power plant component. This includes the materials used in the Mechanical–Electrical components as well as the chamber structure. Each material type is quantified to give a clear understanding of the resource requirements for manufacturing, constructing the 500 kW OWC plant, and the raw material requirements for the entire power plant. Since waste material quantities have not been given in the report, it was assumed to be 25% of the component’s material quantity.
Since the Ecoinvent database does not include specific data on marine-grade steel, standard steel was used as a substitute for the Mechanical–Electrical plant and the entry lips of the chamber structure. This assumption was made to estimate the material impacts more accurately. Although marine-grade steel would be more accurate for this application, using standard steel still offers valuable insights into the environmental footprint of the materials used in the LIMPET power plant.
2.2.2. Site Excavation and Transportation
All the Mechanical–Electrical components of the power plant are assumed to be transported from Inverness, UK, to Islay Island [
15]. The land transport of these components is estimated to cover a distance of 280 km, using a 3.5–7.5 metric ton lorry. For waterborne transportation, a bulk carrier is assumed to travel 48 km, carrying the equipment across the sea to Islay. Additionally, the transportation of reinforced concrete for the construction is assumed to cover a distance of 20 km.
The site preparation and excavation took 150 days to complete, and the gravel that remained after the excavation was used for road and landscaping sites. The distance of gravel transportation is assumed to be 100 km.
Table 3 shows a summary of the site excavation data.
2.3. Impact Assessment
As discussed in
Section 1, performing a LCA across a wide range of impact categories is crucial to fully understanding and comparing the environmental impacts of different power generation technologies. This study utilized the ReCiPe 2016 Midpoint (H) [
19] and CED [
20] impact assessment methods. This method helps translate the emissions and resource extractions associated with the OWC power plant into 19 specific impact categories. The study also calculated the energy payback period (EPP) and the carbon payback period (CPP). These metrics provide further insight into the plant’s sustainability by measuring how long it takes for the energy and carbon emissions invested in its construction and operation to be offset by the energy it generates.
2.4. Interpretation
During the interpretation stage of the LCA, the environmental impacts of the 500 kW OWC power plant are evaluated across all 19 impact categories. To assess the robustness of the results, a sensitivity analysis is performed, varying the assumptions regarding waste material percentages at 20%, 25%, and 30%. This helps determine how changes in material waste affect the overall environmental performance of the plant.
Direct comparisons with individual LCA studies for other renewable energy technologies are not made due to differences in the scope, methods, and assumptions used in those studies. These variations could lead to inconsistencies, making it difficult to compare life cycle impacts between different renewable energy systems accurately.
The interpretation also helps identify “hotspots” materials and processes that significantly contribute to the environmental impacts in the 19 categories. By identifying these critical areas, the study recommends strategies to reduce the impacts, focusing on improving the sustainability of the plant’s materials and construction processes.
3. Results
The life cycle impact assessment of the LIMPET plant, outlined in
Table 4, was conducted using the ReCiPe 2016 Midpoint (H) and CED methods to evaluate 19 impact categories. The analysis shows a significant Global Warming Potential (GWP) of 56 kg CO
2 eq/kWh generated by the plant. The impact on the marine environment is caused by both marine ecotoxicity (ME) and marine eutrophication (MEU). According to the analysis, the resulting ME is 3.5 kg 1,4-DCB/kWh, while MEU is 3 × 10
−3 kg N eq/kWh. Since ocean wave energy technologies mainly focus on low-carbon energy systems, the main concern is the GWP, but the contribution to the other impact categories is also found in
Table 4.
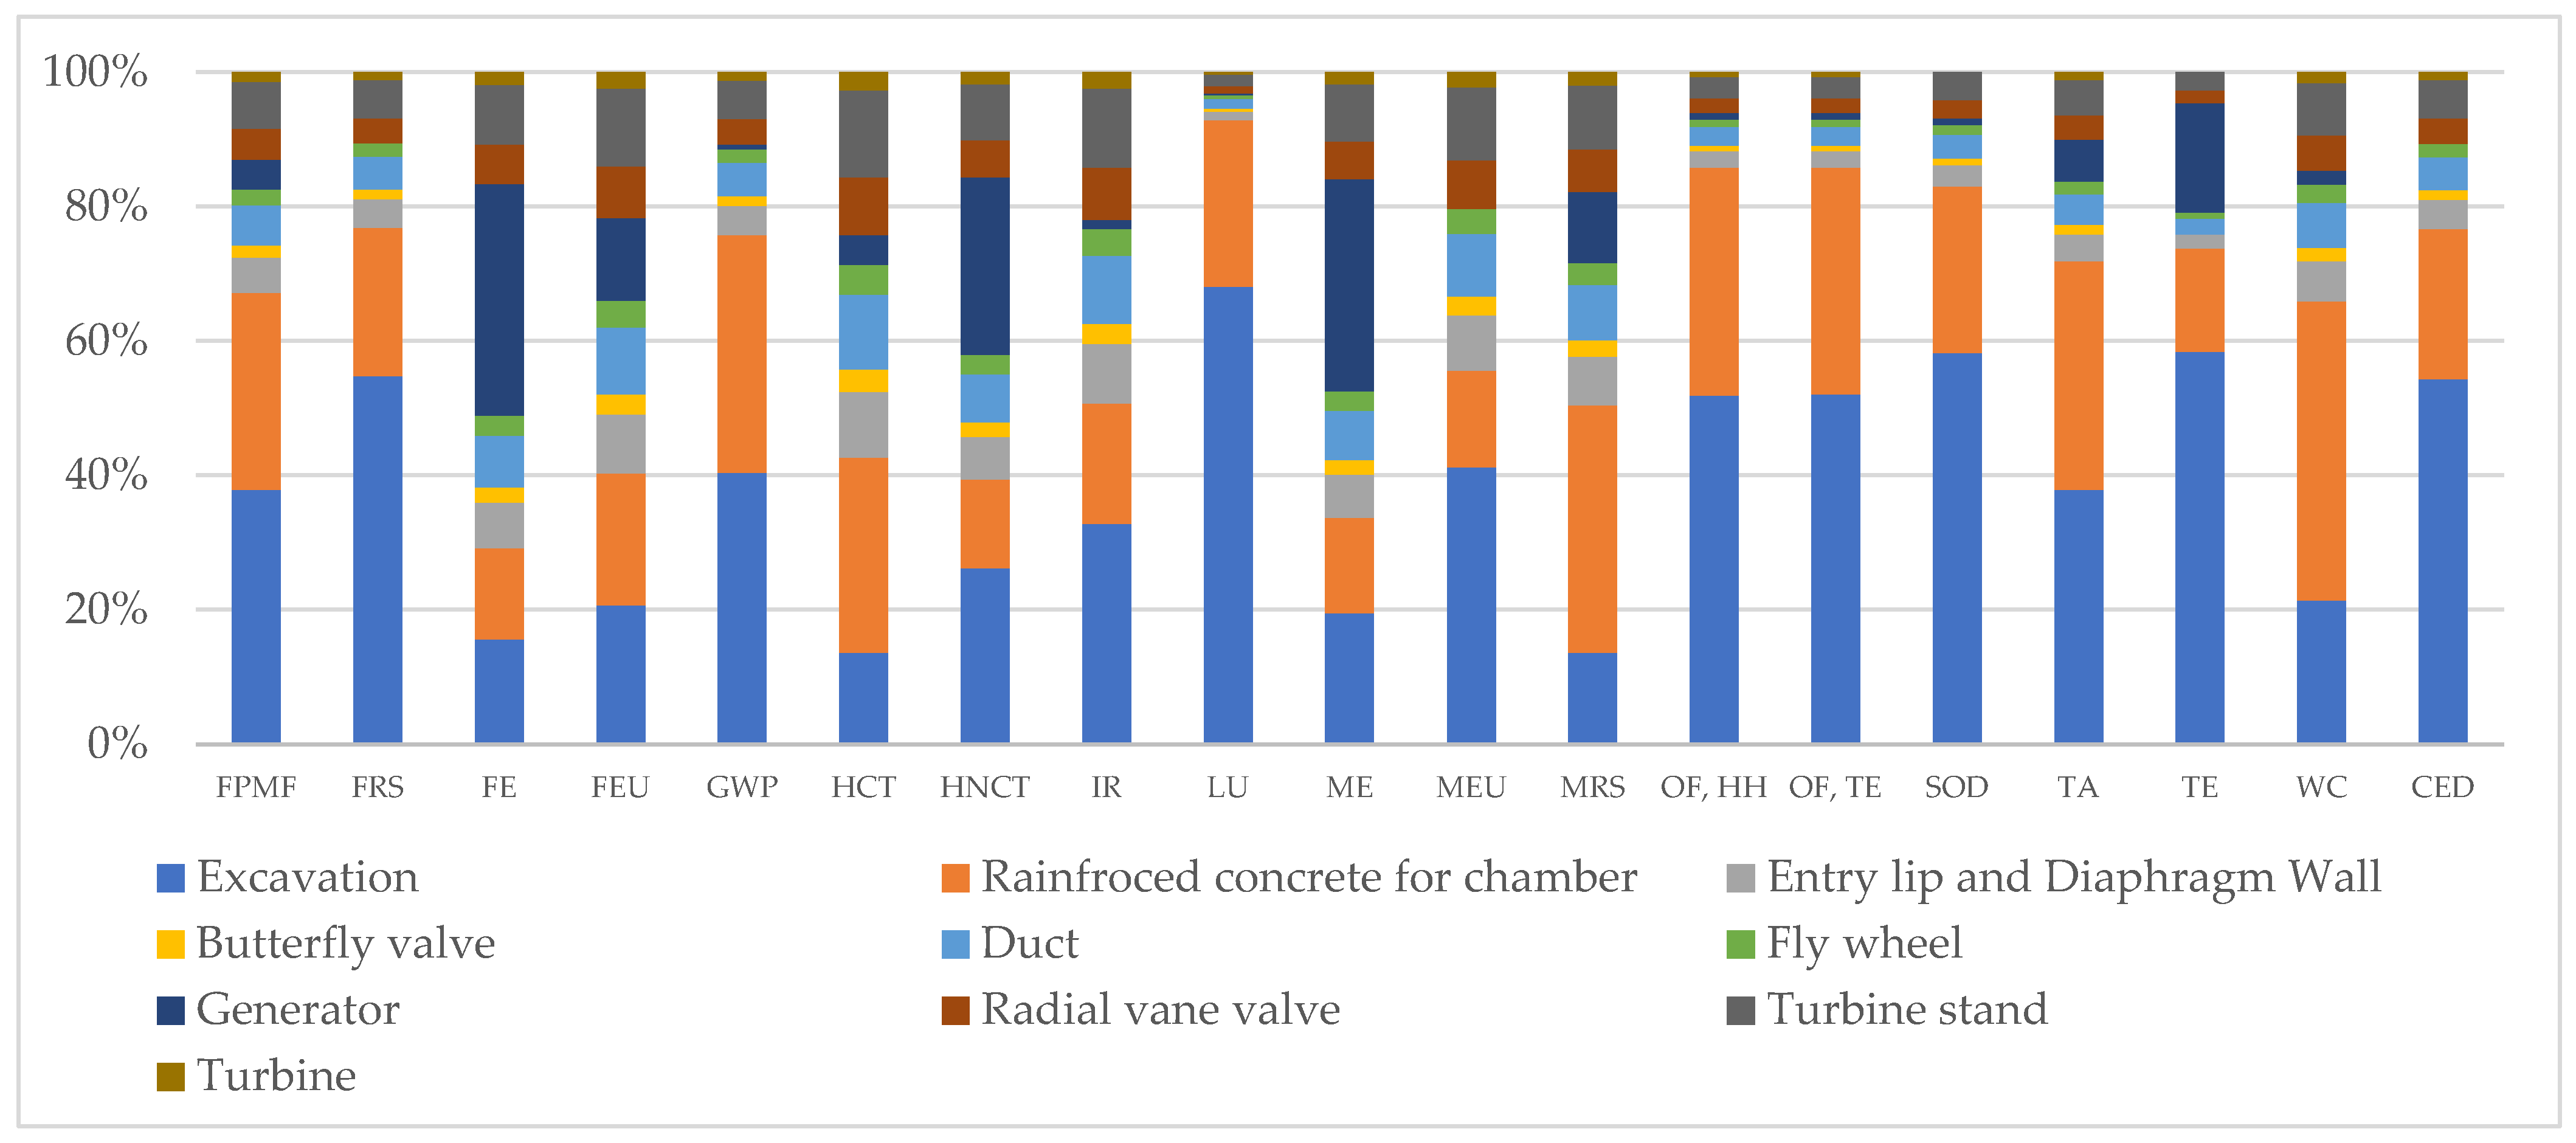
Figure 5 shows the LCIA results for each component of the LIMPET plant. It shows the GWP impact sources, illustrating that the chamber construction phase is the primary contributor. This phase accounts for 80.1% of the GWP impact, while the Mechanical–Electrical plant contributes 19.9% of the GWP impact. For the FRS, the chamber construction phase is responsible for 81.1% of the total fossil resource depletion. The remaining 18.9% of the FRS impact comes from the mechanical and electrical components of the plant. Generator production mainly contributes to ME by 31.6%, and the excavation process is the main contributor to the MEU, giving a 41.2% impact.
Using GWP and CED values, the carbon payback period (CPP) and energy payback periods (EPPs) were calculated according to the given Equations (1) and (2), respectively. The UK residual grid mix had an average carbon intensity of 400 kg CO
2 eq/kWh in 2009 [
21], and this value was taken as the annual CO
2 avoided. GWP is taken as the total CO
2 emitted during the life cycle. The total annual energy production of the LIMPET plant in 2001 was calculated to be 27,081 kWh. Because of maintenance and failures, the plant was not operated for 4905.8 h in the year 2001, resulting in low electricity generation [
15]. This energy production in 2001 was taken as the annual energy produced, and the CED result was taken as the energy spent in the stage considered in this study, which is 5,310,885 kWh for the entire considered life stage.
The calculation shows that the CO2 payback period is 0.14 years, while according to the value of annual energy production stated above, the energy payback time amounts to 196 years.
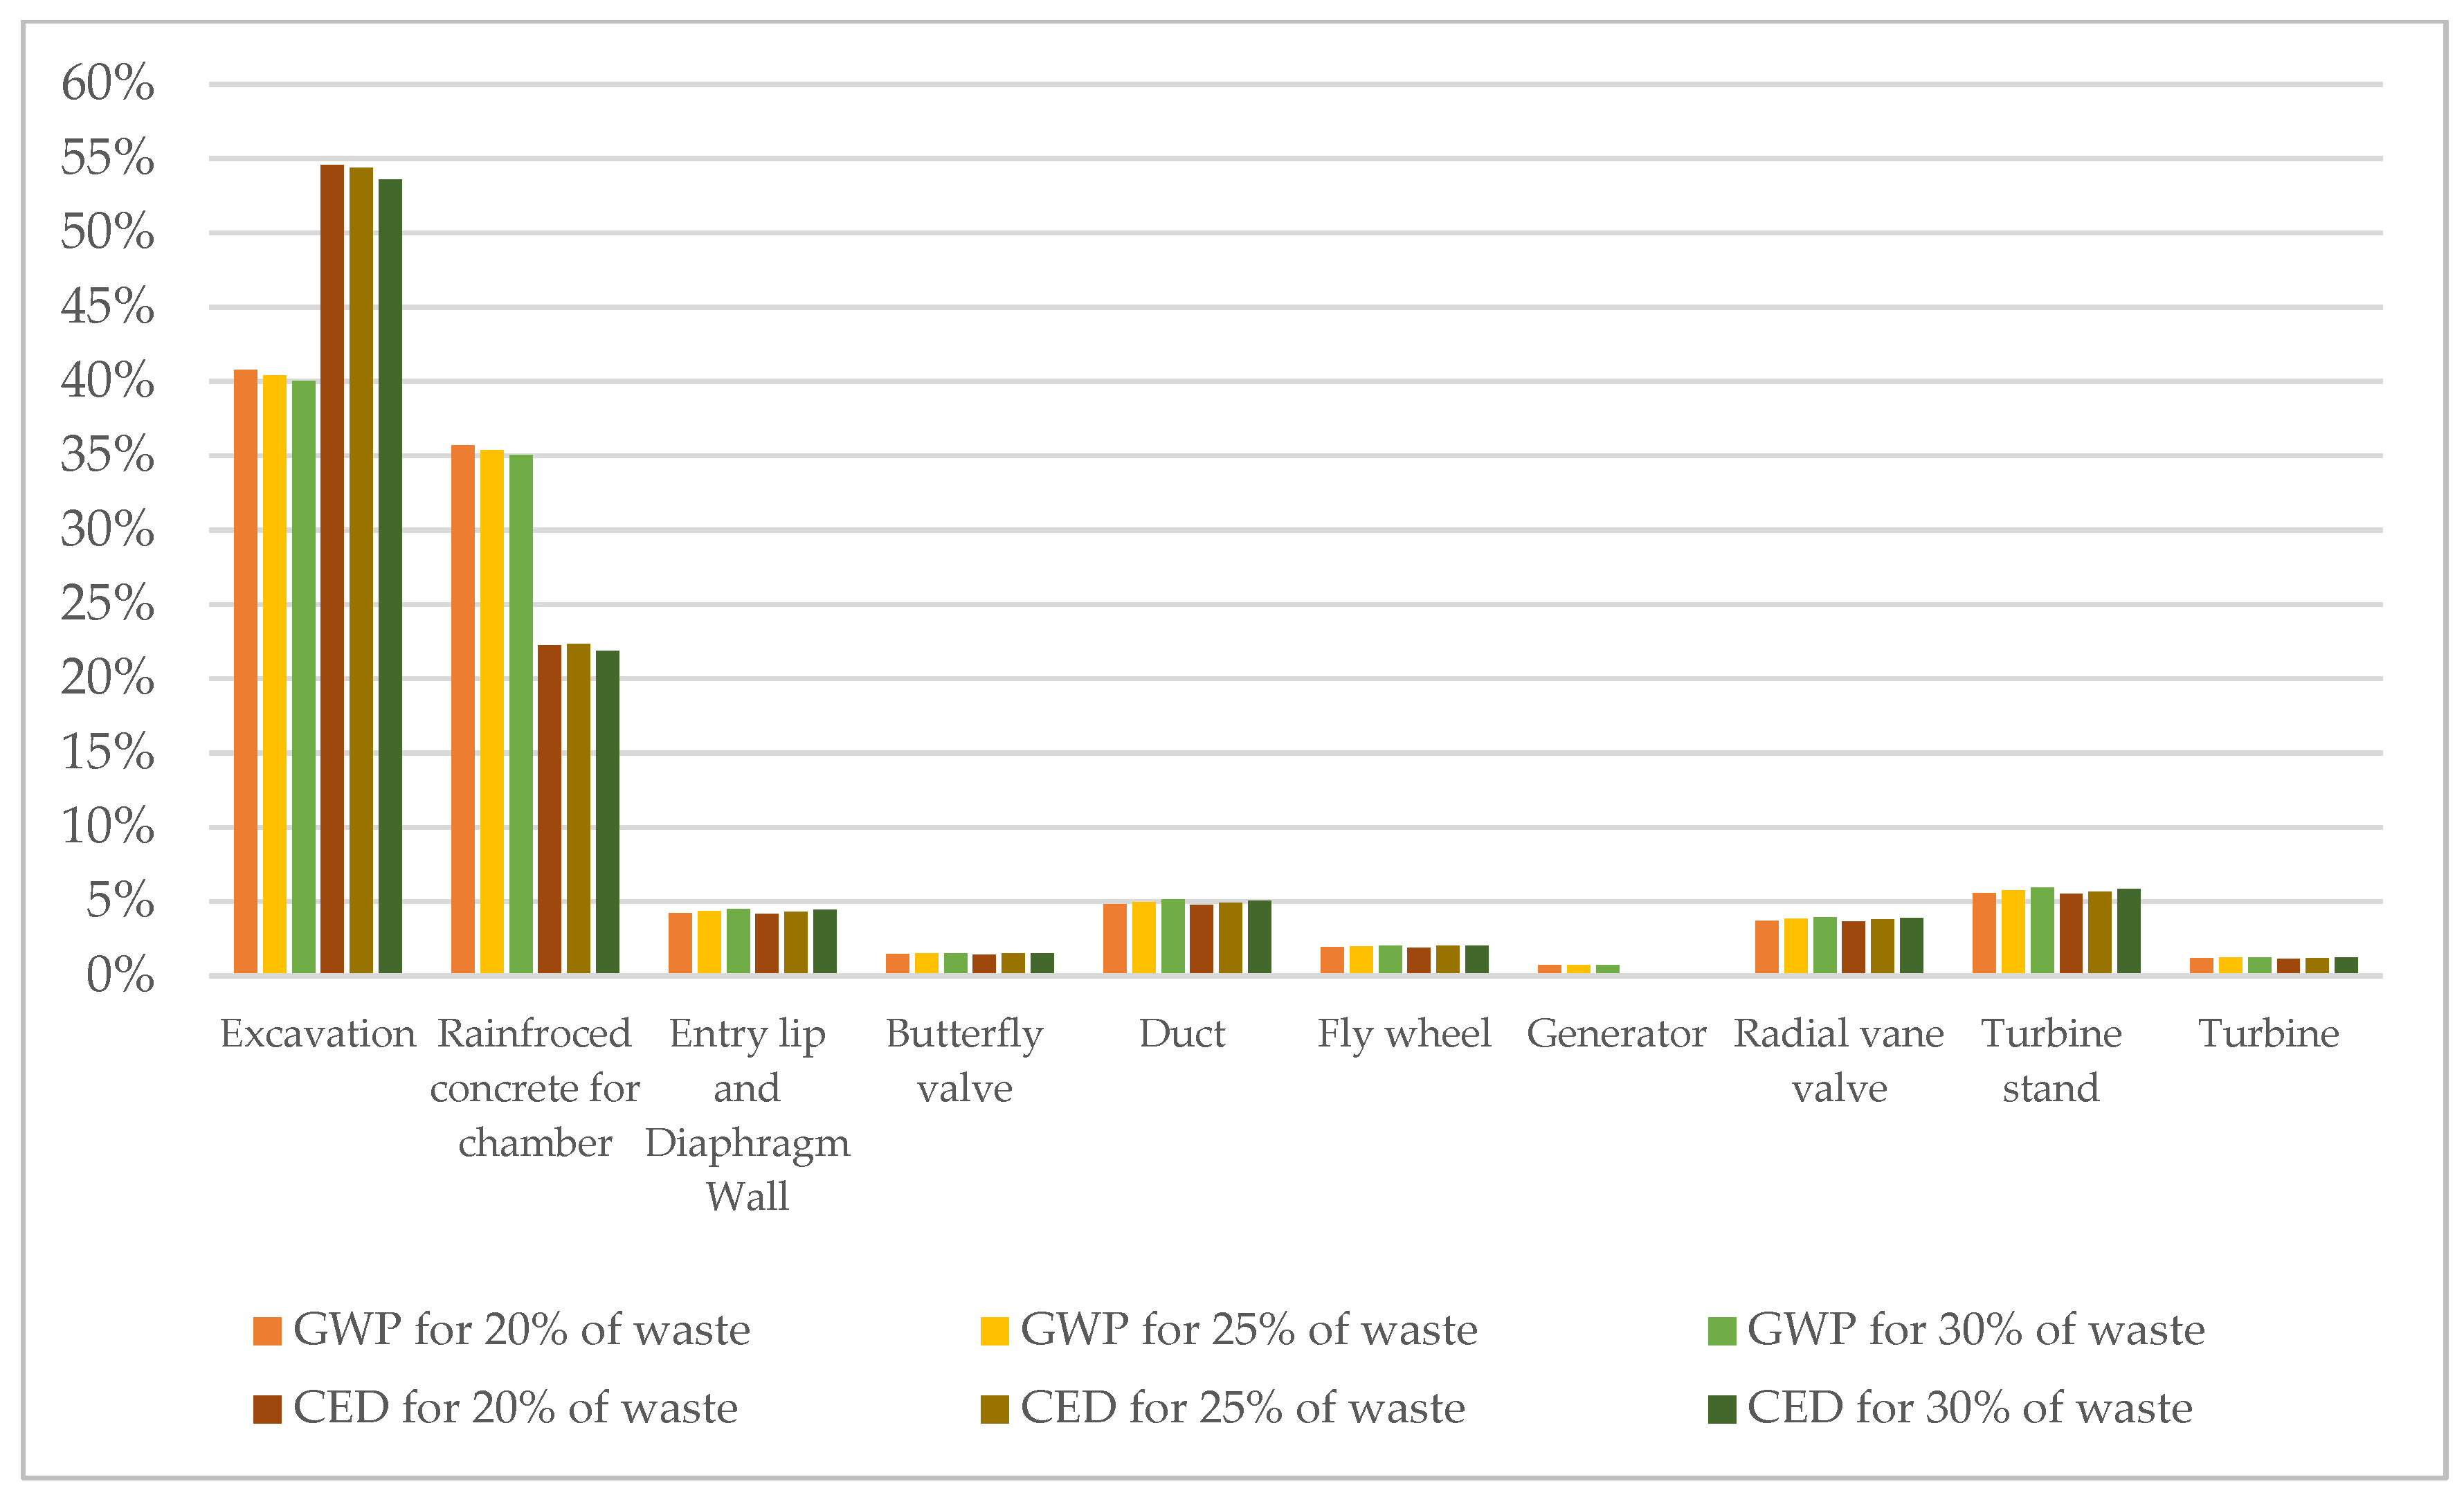
Sensitivity Analysis
Due to the lack of specific data on material waste, a 25% surplus of materials required for each process was assumed to account for potential waste in the life cycle impact assessment. A sensitivity analysis was conducted to ensure accuracy by increasing and decreasing the assumed waste to 30% and 20%, providing a range of potential impacts based on varying waste levels. The results across all impact categories were nearly identical, with minimal variation between the scenarios.
Figure 6 shows the GWP and CED results of the sensitivity analysis with a few discrepancies. This consistency suggests that the environmental impact of the LIMPET plant is not highly sensitive to changes in the assumed waste percentages. In other words, whether the waste is set at 20%, 25%, or 30%, the overall environmental impact remains largely the same. This stability indicates that the initial 25% waste assumption is a reasonable choice for estimating the plant’s actual environmental impact due to material waste.
4. Discussion
The interpretation of the results reveals that all the processes evaluated made substantial contributions across the various environmental impact categories, as detailed in
Table 4. This suggests that no single process can be overlooked when assessing the environmental performance of WECs. As a broader implication, these findings highlight the importance of a holistic approach in the design, construction, and deployment phases of WECs, ensuring that key contributing processes are addressed early to minimize environmental burdens throughout the device’s life cycle.
Results revealed a GWP of 56 kg CO
2 eq/kWh for this cradle-to-gate analysis, which will be lower if a cradle-to-grave analysis is carried out, since the Mechanical–Electrical plant has been taken to recycling after decommissioning. When compared with the other LCA analyses conducted for WECs, it can be clearly seen that the GWP values vary within the 25–89 g CO
2/kWh range (
Table 1), which is three orders of magnitude smaller than the LIMPET plant’s GWP impact. Chamber construction mainly contributed to the impact of GWP in this study. Among the chamber construction processes, the excavation process and the reinforced concrete for the chamber structure were the main contributors to the GWP impact, contributing 40% and 35%, respectively. When it comes to the excavation process, high fuel-consuming machineries were used during the excavation process to prepare the site for 150 days, and vehicles were used for gravel transport. Emissions from those machineries contributed largely to the GWP. Chamber construction is the other most impactful process to the GWP because of the extensive use of concrete material, as can be seen in the MegaRoller study. The concrete structure was also the main contributor to GHG emission [
9]. This comparison shows that alternative materials to concrete should be used to minimize GWP impact.
Fine particulate matter formation is largely associated with chamber construction, which contributes 72.4% of the total impact. Among the upstream processes involved, excavation has the highest contribution at 37.9%. This is mainly due to activities such as digging, earthmoving, and transporting gravel operations that release dust and fine particles into the air, significantly increasing particulate matter emissions. The largest impact contributed by excavation occurs in the LU impact category, which is 68%. The WC impact category is the one where the reinforced concrete process has the highest contribution, which is 44.5%.
FRS is a part of CED results, in which CED contains both renewable and non-renewable energy consumed in the life cycle. CED results in 16.86 kg oil eq while the FRS value is 13.9 kg oil eq, giving a difference of 2.96 kg oil eq. This difference is the renewable energy consumed in the selected life cycle of the power plant. The excavation stage mainly contributed to the FRS impact by 54.8%, which is mainly due to the heavy use of high-fuel-consuming excavation machinery for a long period of time. Secondly, the reinforced concrete contributed 22% to the FRS impact. This is due to the intensive energy requirements associated with the production of concrete and reinforced steel. However, in this study, the energy used for marine vessels is low compared with the other offshore-based WEC studies, since the LIMPET plant is an onshore WEC. A main contributor to most of the impacts comes from the marine vessels for offshore WECs. As highlighted, the majority of energy consumption is derived from non-renewable sources, which should be substituted with renewable energy sources.
ME and MEU exhibit significantly high values. It can be clearly seen that, when compared to the MegaRoller study, the ME and MEU results are three orders of magnitude lower than those reported in the LIMPET study. The main contributing factors to these differences in ME impact are that the generator production contributed 31.5% and the excavation process contributed 19.5%. For MEU impact, the excavation process accounted for 41% of the total contribution. This is mainly due to the use of excavation machinery and generator production. Further, the end-of-life stage of the LIMPET plant is not included in the analysis. Hence, the positive impact of recycling is not accounted.
When it comes to EPP and CPP, CPP results in 0.14 years while EPP results in 196 years, which is an unexpected period of time since the LIMPET plant was operated for nearly 11 years. The inefficiency of the plant and the recurring operational failures [
15] mainly resulted in a long EPP. The carbon payback period for the LIMPET plant was much shorter, at just 0.14 years. This short carbon payback period is mainly due to the high carbon intensity of the conventional energy grid mix during the plant’s operational period, which averaged at around 400 kg CO
2 eq/kWh in 2009.
To make WECs more environmentally friendly, electricity generation by WEC should be very efficient in terms of energy conversion, with minimal operational failures. Capture width ratio, which is the averaged power absorbed by the WEC from the averaged wave power incident, should be maximized. Thus, the chamber size can be reduced accordingly depending on the rated power capacity of the WEC. This leads to minimizing the use of material for the construction of the OWC chamber. Advancement of the power take-off (PTO) system and the geometry of the OWC chamber are crucial when increasing the capture width ratio. Further material selection is another crucial factor. Durable but sustainable construction materials such as Geopolymer Concrete should be used. Geopolymer Concrete is an eco-friendly, durable alternative to conventional concrete material that is suitable for ocean waters as well [
22].
Sensitivity analysis was conducted by varying the waste percentages to observe the environmental impact and to justify whether the chosen assumption is fair enough to interpret the impact data. The baseline waste percentage of 25% was changed to 20% and then to 30%. According to the results, no major changes were observed.
This cradle-to-gate study shows the environmental impact of an onshore OWC-type WEC across 19 impact categories, giving a fundamental understanding of major processes that contribute to environmental impacts. As the scope of the study is limited to a cradle-to-gate approach, all environmental impact values appear elevated. This highlights the significance of material recycling at the end-of-life stage of a WEC. Hence, to further enhance the accuracy of environmental impact assessments, a full cradle-to-grave LCA should be conducted on OWC-type WECs. Additionally, a comparative analysis with other ocean WECs could help identify the most environmentally sustainable approach to harnessing wave energy. Increasing the efficiency of WECs and adopting suitable materials and construction practices are essential steps toward reducing their environmental footprint.
5. Conclusions
This study provided a cradle-to-gate LCA of a 500 kW onshore OWC wave energy converter, taking the decommissioned LIMPET plant on the Isle of Islay, Scotland, as a case study. The analysis across 19 environmental impact categories reveals that all major processes evaluated contribute substantially to the total environmental burden. Among them, chamber construction, specifically excavation activities and the use of reinforced concrete, was identified as the dominant contributor to the GWP, accounting for approximately 75% of the total impact. These impacts are largely due to the energy-intensive nature of concrete production and the heavy fuel consumption associated with excavation machinery and transport vehicles.
The GWP for the LIMPET plant was calculated to be 56 kg CO2 eq/kWh, a value significantly higher than comparable WEC technologies, which typically range from 25 to 89 g CO2 eq/kWh. This elevated impact is partially due to the limited scope of the study (cradle-to-gate), as end-of-life processes such as material recycling were not included. Furthermore, the EPP was estimated at 196 years, a result that reflects the plant’s low energy conversion efficiency and operational inefficiencies during its 11 years of service. In contrast, the CPP was calculated to be only 0.14 years due to the high carbon intensity of the conventional energy mix in 2009.
The findings highlight several key areas for improvement in WEC sustainability: adoption of low-impact and durable alternative materials such as geopolymer concrete, reduction in the use of conventional fossil fuel machinery by transitioning to green fuels, and optimization of energy conversion through advanced PTO systems and chamber geometry refinement. Addressing those improvements, notable improvements across several impact categories can be achieved. A significant reduction in emissions associated with materials like concrete and steel can be achieved by selecting alternative low-carbon construction materials such as geopolymer concrete. Improvements in system efficiency through advanced power take-off mechanisms and optimized chamber designs can increase the energy output, thereby lowering the environmental impact per unit of electricity generated, and a lower EPP will be the result. Additionally, including the end-of-life stage in the life cycle assessment, such as accounting for material recycling, can further reduce the overall environmental burden. When these strategies are combined, the total environmental impact, particularly in terms of GWP, could be considerably lowered, supporting the case for a more sustainable and viable future for wave energy technologies
In conclusion, the LIMPET OWC plant’s LCA outlines the significant environmental challenges associated with current WEC technologies. Addressing these challenges through improved material selection, enhanced system efficiency, and consideration of full cradle-to-grave analysis are beneficial for advancing WECs as viable, environmentally sustainable contributors to the global renewable energy sector. Future research should include full LCA and comparative assessments across different WEC types to guide design improvements and recommendations for a sustainable wave energy future.


