


Energy Valorization Strategies in Rural Renewable Energy Communities: A Path to Social Revitalization and Sustainable Development


Abstract
1. Introduction
1.1. Type of Valorization Strategies
1.2. Social Impact of ECs
- Individual well-being—focuses on personal outcomes, such as success, education, health, and overall welfare.
- Community well-being—refers to social factors that influence the cohesion and development of a particular community or region.
- Societal impacts—encompasses broader, systemic effects that extend beyond local boundaries and contribute to addressing global social challenges.
2. Methodology
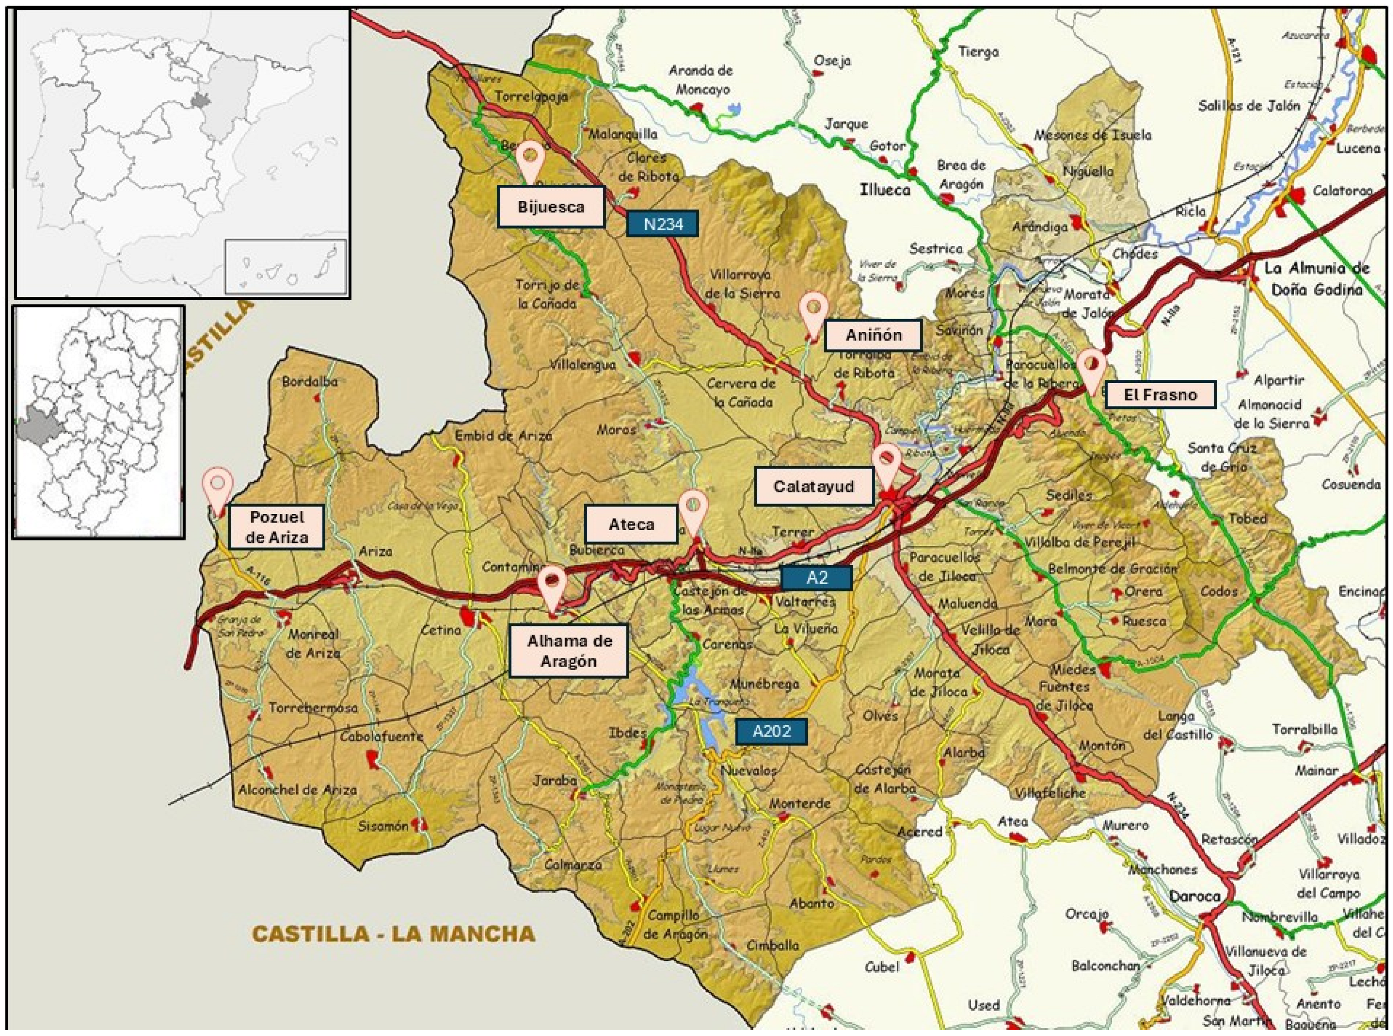
2.1. Case Study
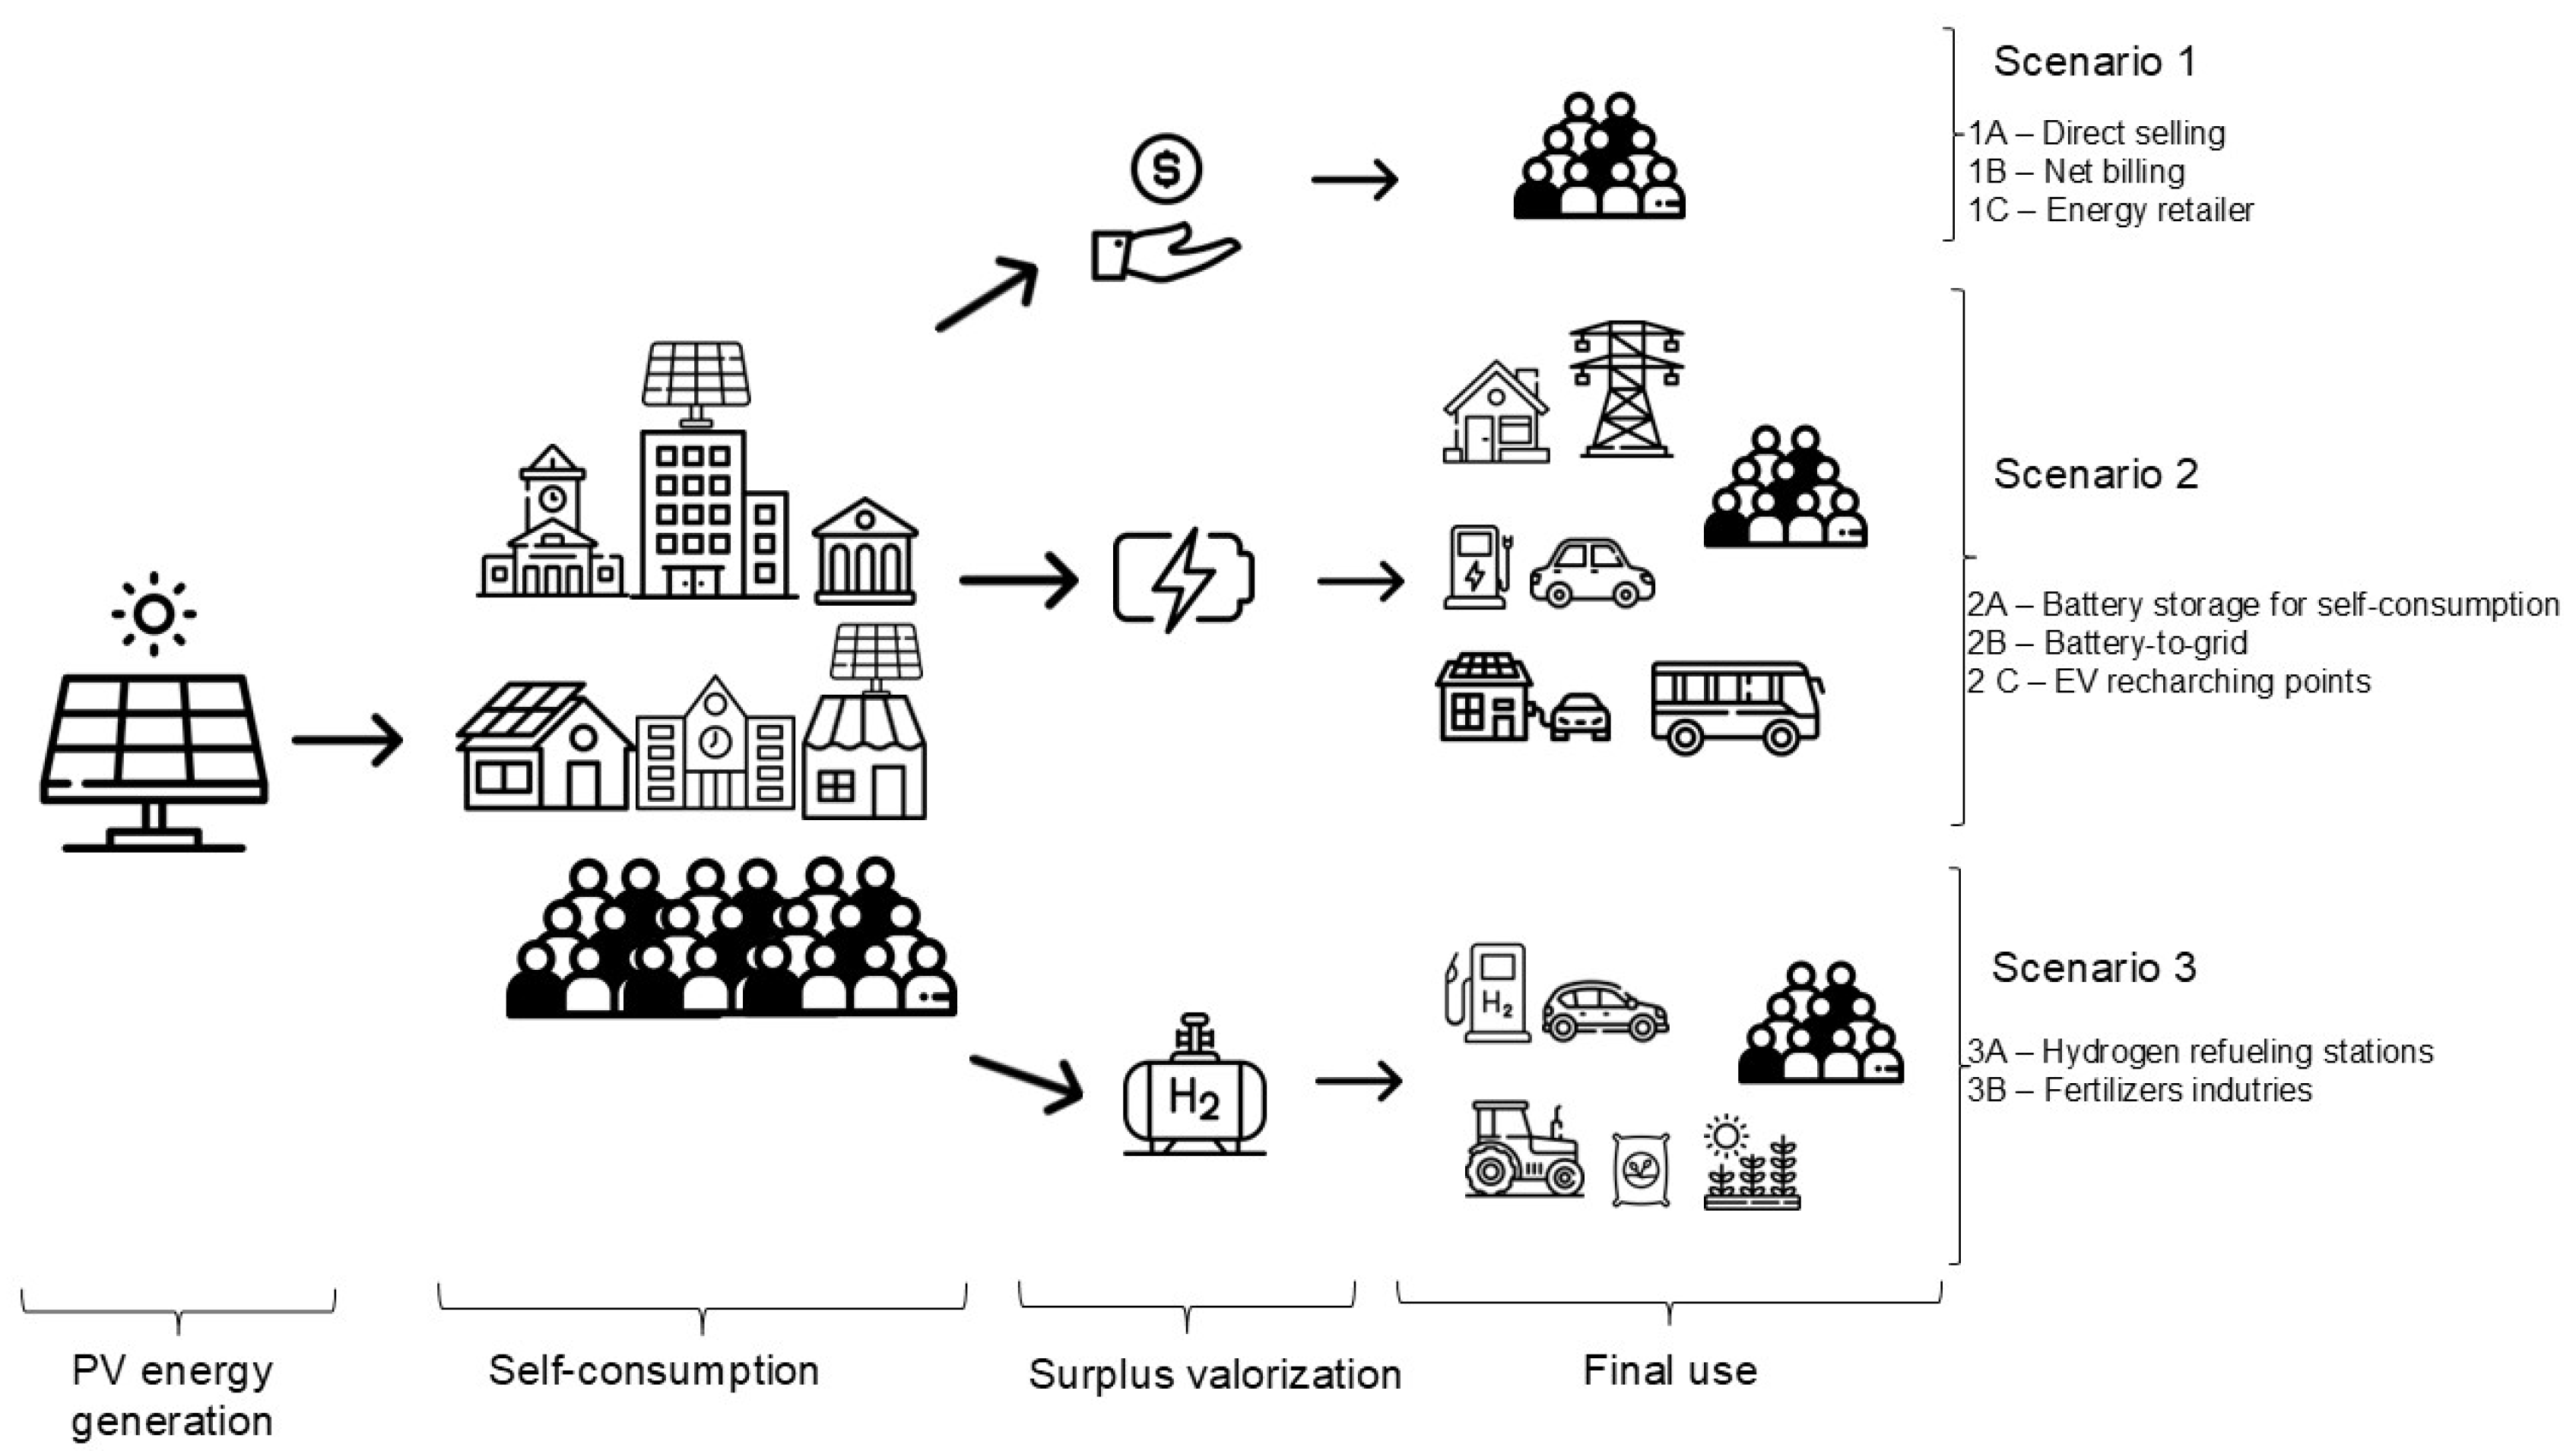
2.2. Technical Scenarios Definition
- Direct Sale to the Power Grid (Scenario 1): This scenario evaluates selling the surplus, with the aim of generating revenue that can be reinvested in local projects. It includes three subscenarios:
- Direct Sale (Subscenario 1A): Selling the surplus to the grid without intermediaries.
- Net Billing (Subscenario 1B): A simplified mechanism for compensating the surplus produced and injected into the grid against the consumer’s electricity bill.
- Sell to Other Consumers (Subscenario 1C): Selling the surplus to other consumers, acting as an energy retailer.
- Battery Storage (Scenario 2): This scenario examines storing the energy surplus in batteries for future use, including powering electric vehicle (EV) charging points. Three subscenarios are considered:
- Storage for Self-Consumption (Subscenario 2A): Utilizing stored surplus energy to cover the energy demands of local energy community members during times of low solar output.
- Battery-to-Grid (Subscenario 2B): Using stored surplus energy for grid injection, acting as an energy retailer.
- EV Charging Points (Subscenario 2C): Using stored surplus energy to power EV charging stations, promoting sustainable mobility.
- Hydrogen Strategies (Scenario 3): This scenario involves converting the surplus energy into hydrogen through electrolysis, and exploring its potential uses. Two subscenarios are included:
- Hydrogen Refueling Stations (Subscenario 3A): Implementing infrastructure to supply hydrogen as a clean fuel for transportation.
- Fertilizer Production (Subscenario 3B): Using hydrogen to synthesize ammonia for fertilizer production can support the local agricultural industry. Although such industries are highly energy-intensive—requiring approximately 15,000 MWh per day—we include this scenario as part of a tentative policy roadmap aimed at promoting the optimal use and valorization of energy within rural energy communities, particularly within the framework of a defined autonomous community.
2.3. Techno-Economic Assessment Methodology
2.3.1. Scenario 1
2.3.2. Scenario 2
2.3.3. Scenario 3
2.4. Social Assessment Methodology
- Monetary Value Indicators: These reflect the economic impact and the reinvestment of benefits back into the community.
- Informative Value Indicators: These capture both qualitative and quantitative aspects related to social and environmental impact.
- Financial Benefit (Economic Profitability): This is achieved through surplus management, which varies across scenarios. The benefits are assessed over 5, 10, 20, and 28-year periods.
- Investment and Operational Costs: These costs, which are necessary to create and maintain the EC as a cooperative, including hired workers, are subtracted from the EC’s benefits in each scenario. It is assumed that 14% of the population participates with a EUR 100/share.
- Taxation of Profits: Profits are taxed at a rate of 19%, with the resulting revenue assumed to be reinvested by local authorities into education, healthcare, infrastructure, and other community services.
- Participants’ Gains: Participants benefit from reduced electricity costs due to self-consumption ensuring a 34% SSR, leading to energy savings that are not included in the impact since it is not a collective impact, but an individual impact.
- Profit Distribution: This aspect will depend on the specific configuration of the EC. While economic benefits should not be the main objective of these structures, as stated in the European Directive, profitability is not prohibited. The key issue is to what extent the other benefits outlined in the Directive are also met. In our model, 20% of the profits—after covering costs and taxes, as described in points 2 and 3—are distributed among the cooperative members. This allocation aims to incentivize collective participation in energy communities over individual installations. Those with standalone systems can generally handle the surplus through net billing, achieving comparable profitability.Although these are private funds, they could contribute to an increase in local GDP, serving as a key indicator of social impact. However, this increase in GDP is not considered in the analysis since the funds do not remain within the cooperative’s management and it is not easy to link them to a local impact.
- Retained Profits: The remaining 80% of the profits are retained by the cooperative and reinvested to generate social value and stimulate the local economy. The allocation of these funds is guided by the cooperative’s social roadmap and may include initiatives such as supporting the creation of new businesses, fostering social cohesion through festivals, tourism programs, clubs, and promotional campaigns, raising awareness of key issues, improving access to energy, and providing job training and skill development programs aimed at creating new employment opportunities in the region.
- Person-Year Equivalent: Based on Spain’s 2022 minimum wage of EUR 14,000 per year [65], we calculate the equivalent number of person-years that 80% of profits (point 6) would generate for each village over the assessment period. This is used to estimate the potential increase in population. We also identify the cost of generating such a person-year equivalent under each scenario.
3. Results
3.1. Economic Profitability
3.2. Social Assessment
4. Discussion
4.1. Scenario 1
4.2. Scenario 2—Battery Storage
4.3. Scenario 3—Hydrogen Storage
4.4. Global Assessment
- In Scenario 1C, the inclusion of surplus management from Bijuesca and Pozuel results in higher growth rates. However, these villages rely on more expensive small-scale facilities (3 kWp), which significantly increases the investment required. As a result, the cost per equivalent person-year becomes higher.
- In Scenarios 2A, 2B, and 2C, which incorporate battery storage, centralized management through CERCA leads to a greater number of batteries, higher overall capacity, and increased operation and maintenance costs. While this allows more villages to participate, it also raises the total investment required, making it less efficient in terms of cost per equivalent person-year compared to individual village-level approaches.
- In Scenario 3A, the deployment of hydrogen-related infrastructure (HRSs) is limited to the same scale as in Calatayud, since the total combined surplus from all towns is still insufficient to justify an additional installation. The remaining surplus is sold to the grid, and profitability is not achieved. This is due to the significantly higher investment involved, as it includes the PV infrastructure of all contributing villages—even though not all of the generated energy is ultimately utilized.
5. Conclusions
Author Contributions
Funding
Data Availability Statement
Conflicts of Interest
Abbreviations
| ASU | Air separation unit |
| CEC | Citizen Energy Community |
| EC | Energy community |
| EV | Electric vehicle |
| H2 | Hydrogen |
| HRSs | Hydrogen refueling stations |
| IRR | Internal rate of return |
| kWp | Kilowatt peak |
| LCOH | Levelized cost of hydrogen |
| Li-ion | Lithium-ion |
| MWh | Megawatt hour |
| N2 | Nitrogen |
| Na-S | Sodium-sulfur |
| Ni-Cd | Nickel-cadmium |
| NOx | Nitrogen oxides |
| NPV | Net present value |
| Pb-A | Lead-acid |
| PV | Photovoltaic |
| REC | Renewable Energy Community |
| STH | Solar-to-hydrogen |
References
- European Union. Directive (EU) 2018/2001 of the European Parliament and of the Council on the Promotion of the Use of Energy from Renewable Sources; European Union: Brussels, Belgium, 2018. [Google Scholar]
- European Union. Directive (EU) 2019/ 944 of the European Parliament and of the Council on Common Rules for the Internal Market for Electricity and Amending Directive 2012/27/EU; European Union: Brussels, Belgium, 2019. [Google Scholar]
- Council of European. Regulators Regulatory Aspects of Self-Consumption and Energy Communities; Council of European: Strasbourg, France, 2019. [Google Scholar]
- Biresselioglu, M.E.; Limoncuoglu, S.A.; Demir, M.H.; Reichl, J.; Burgstaller, K.; Sciullo, A.; Ferrero, E. Legal Provisions and Market Conditions for Energy Communities in Austria, Germany, Greece, Italy, Spain, and Turkey: A Comparative Assessment. Sustainability 2021, 13, 11212. [Google Scholar] [CrossRef]
- López Prol, J.; Steininger, K.W. Photovoltaic Self-Consumption Is Now Profitable in Spain: Effects of the New Regulation on Prosumers’ Internal Rate of Return. Energy Policy 2020, 146, 111793. [Google Scholar] [CrossRef]
- Dasí-Crespo, D.; Roldán-Blay, C.; Escrivá-Escrivá, G.; Roldán-Porta, C. Evaluation of the Spanish Regulation on Self-Consumption Photovoltaic Installations. A Case Study Based on a Rural Municipality in Spain. Renew. Energy 2023, 204, 788–802. [Google Scholar] [CrossRef]
- Boletín Oficial del Estado. Ley 24/2013, de 26 de Diciembre, Del Sector Eléctrico; Boletín Oficial del Estado: Madrid, Spain, 2013. [Google Scholar]
- Boletín Oficial del Estado. Real Decreto 2019/1997, de 26 de Diciembre, Por El Que Se Organiza Regula El Mercado de Producción de Energía Eléctrica; Boletín Oficial del Estado: Madrid, Spain, 1997. [Google Scholar]
- Pellow, M.A.; Emmott, C.J.M.; Barnhart, C.J.; Benson, S.M. Hydrogen or Batteries for Grid Storage? A Net Energy Analysis. Energy Environ. Sci. 2015, 8, 1938–1952. [Google Scholar] [CrossRef]
- Zhang, C.; Wei, Y.L.; Cao, P.F.; Lin, M.C. Energy Storage System: Current Studies on Batteries and Power Condition System. Renew. Sustain. Energy Rev. 2018, 82, 3091–3106. [Google Scholar] [CrossRef]
- Dehghani-Sanij, A.R.; Tharumalingam, E.; Dusseault, M.B.; Fraser, R. Study of Energy Storage Systems and Environmental Challenges of Batteries. Renew. Sustain. Energy Rev. 2019, 104, 192–208. [Google Scholar] [CrossRef]
- Gallego-Castillo, C.; Heleno, M.; Victoria, M. Self-Consumption for Energy Communities in Spain: A Regional Analysis under the New Legal Framework. Energy Policy 2021, 150, 112144. [Google Scholar] [CrossRef]
- Boletín Oficial del Estado. Real Decreto 244/2019; Boletín Oficial del Estado: Madrid, Spain, 2019. [Google Scholar]
- May, G.J.; Davidson, A.; Monahov, B. Lead Batteries for Utility Energy Storage: A Review. J. Energy Storage 2018, 15, 145–157. [Google Scholar] [CrossRef]
- Zsiborács, H.; Hegedűsné Baranyai, N.; Vincze, A.; Háber, I.; Pintér, G. Economic and Technical Aspects of Flexible Storage Photovoltaic Systems in Europe. Energies 2018, 11, 1445. [Google Scholar] [CrossRef]
- BloombergNEF Lithium-Ion Battery Pack Prices Hit Record Low of $139/KWh. Available online: https://about.bnef.com/blog/lithium-ion-battery-pack-prices-hit-record-low-of-139-kwh/ (accessed on 8 February 2024).
- Berrada, A.; Laasmi, M.A. Technical-Economic and Socio-Political Assessment of Hydrogen Production from Solar Energy. J. Energy Storage 2021, 44, 103448. [Google Scholar] [CrossRef]
- Vartiainen, E.; Breyer, C.; Moser, D.; Román Medina, E.; Busto, C.; Masson, G.; Bosch, E.; Jäger-Waldau, A. True Cost of Solar Hydrogen. Sol. RRL 2022, 6, 2100487. [Google Scholar] [CrossRef]
- Zaik, K.; Werle, S. Solar and Wind Energy in Poland as Power Sources for Electrolysis Process—A Review of Studies and Experimental Methodology. Int. J. Hydrogen Energy 2023, 48, 11628–11639. [Google Scholar] [CrossRef]
- Sharma, S.; Ghoshal, S.K. Hydrogen the Future Transportation Fuel: From Production to Applications. Renew. Sustain. Energy Rev. 2015, 43, 1151–1158. [Google Scholar] [CrossRef]
- Brey, J.J. Use of Hydrogen as a Seasonal Energy Storage System to Manage Renewable Power Deployment in Spain by 2030. Int. J. Hydrogen Energy 2021, 46, 17447–17457. [Google Scholar] [CrossRef]
- IEA District Heat Production by Fuel, 2010–2020 and in the Net Zero Scenario, 2030. Available online: https://www.iea.org/data-and-statistics/charts/district-heat-production-by-fuel-2010-2020-and-in-the-net-zero-scenario-2030 (accessed on 16 March 2022).
- Jang, D.; Kim, J.; Kim, D.; Han, W.B.; Kang, S. Techno-Economic Analysis and Monte Carlo Simulation of Green Hydrogen Production Technology through Various Water Electrolysis Technologies. Energy Convers. Manag. 2022, 258, 115499. [Google Scholar] [CrossRef]
- Green, M.A.; Dunlop, E.D.; Siefer, G.; Yoshita, M.; Kopidakis, N.; Bothe, K.; Hao, X. Solar Cell Efficiency Tables (Version 61). Prog. Photovolt. Res. Appl. 2023, 31, 3–16. [Google Scholar] [CrossRef]
- Gibson, T.L.; Kelly, N.A. Predicting Efficiency of Solar Powered Hydrogen Generation Using Photovoltaic-Electrolysis Devices. Int. J. Hydrogen Energy 2010, 35, 900–911. [Google Scholar] [CrossRef]
- Astakhov, O.; Smirnov, V.; Rau, U.; Merdzhanova, T. Prediction of Limits of Solar-to-Hydrogen Efficiency from Polarization Curves of the Electrochemical Cells. Sol. RRL 2022, 6, 2100783. [Google Scholar] [CrossRef]
- Jia, J.; Seitz, L.C.; Benck, J.D.; Huo, Y.; Chen, Y.; Ng, J.W.D.; Bilir, T.; Harris, J.S.; Jaramillo, T.F. Solar Water Splitting by Photovoltaic-Electrolysis with a Solar-to-Hydrogen Efficiency over 30%. Nat. Commun. 2016, 7, 13237. [Google Scholar] [CrossRef]
- Shaner, M.R.; Atwater, H.A.; Lewis, N.S.; McFarland, E.W. A Comparative Technoeconomic Analysis of Renewable Hydrogen Production Using Solar Energy. Energy Environ. Sci. 2016, 9, 2354–2371. [Google Scholar] [CrossRef]
- International Renewable Energy Agency (IRENA). Making the Breakthrough: Green Hydrogen Policies and Technology Costs; International Renewable Energy Agency: Masdar City, United Arab Emirates, 2021; ISBN 978-92-9260-314-4. [Google Scholar]
- Tang, O.; Rehme, J.; Cerin, P. Levelized Cost of Hydrogen for Refueling Stations with Solar PV and Wind in Sweden: On-Grid or off-Grid? Energy 2022, 241, 122906. [Google Scholar] [CrossRef]
- International Energy Agency (IEA). The Future of Hydrogen; International Energy Agency: Paris, France, 2019. [Google Scholar]
- Lao, J.; Song, H.; Wang, C.; Zhou, Y.; Wang, J. Reducing Atmospheric Pollutant and Greenhouse Gas Emissions of Heavy Duty Trucks by Substituting Diesel with Hydrogen in Beijing-Tianjin-Hebei-Shandong Region, China. Int. J. Hydrogen Energy 2021, 46, 18137–18152. [Google Scholar] [CrossRef]
- International Energy Agency. Ammonia Technology Roadmap Towards More Sustainable Nitrogen Fertiliser Production; OECD Publishing: Paris, France, 2021. [Google Scholar]
- Urban-Rural Europe-Population Projections. Available online: https://ec.europa.eu/eurostat/statistics-explained/index.php?title=Urban-rural_Europe_-_population_projections#SE_MAIN_TT (accessed on 13 February 2025).
- Predominantly Rural Regions Experience Depopulation. Available online: https://ec.europa.eu/eurostat/web/products-eurostat-news/w/ddn-20230117-2 (accessed on 13 February 2025).
- Fedorova, E.; Pongrácz, E. Cumulative Social Effect Assessment Framework to Evaluate the Accumulation of Social Sustainability Benefits of Regional Bioenergy Value Chains. Renew. Energy 2019, 131, 1073–1088. [Google Scholar] [CrossRef]
- Berka, A.L.; Creamer, E. Taking Stock of the Local Impacts of Community Owned Renewable Energy: A Review and Research Agenda. Renew. Sustain. Energy Rev. 2018, 82, 3400–3419. [Google Scholar] [CrossRef]
- Brinkman, M.L.J.; Wicke, B.; Faaij, A.P.C.; van der Hilst, F. Projecting Socio-Economic Impacts of Bioenergy: Current Status and Limitations of Ex-Ante Quantification Methods. Renew. Sustain. Energy Rev. 2019, 115, 109352. [Google Scholar] [CrossRef]
- Basset, F. The Evaluation of Social Farming through Social Return on Investment: A Review. Sustainability 2023, 15, 3854. [Google Scholar] [CrossRef]
- Kitsikopoulos, D.; Vrettos, C. The Social Impact of Energy Communities in Greece; Heinrich Böll Foundation Greece and ELECTRA Energy Cooperative: Athens, Greece, 2023; ISBN 9786185580186. [Google Scholar]
- Adams, S.; Brown, D.; Cárdenas Álvarez, J.P.; Chitchyan, R.; Fell, M.J.; Hahnel, U.J.J.; Hojckova, K.; Johnson, C.; Klein, L.; Montakhabi, M.; et al. Social and Economic Value in Emerging Decentralized Energy Business Models: A Critical Review. Energies 2021, 14, 7864. [Google Scholar] [CrossRef]
- Cristóbal, A.B.; Narvarte, L.; Victoria, M.; Fialho, L.; Zhang, Z.; Sanz-Cuadrado, C.; Bokalič, M. Igniting University Communities: Building Strategies That Empower an Energy Transition through Solar Energy Communities. Sol. RRL 2023, 7, 2300498. [Google Scholar] [CrossRef]
- Cristóbal, A.B.; Sanz-Cuadrado, C.; Zhang, Z.; Victoria, M.; Fialho, L.; Cavaco, A.; Bokalič, M.; Narvarte, L. Delving into the Modeling and Operation of Energy Communities as Epicenters for Systemic Transformations. Univers. Access Inf. Soc. 2023. [Google Scholar] [CrossRef]
- JALON. Available online: https://jalon-ce.eu/es/ (accessed on 18 July 2024).
- Mapa de La Comarca de Comunidad de Calatayud. Zaragoza Aragoneria. Available online: https://www.aragoneria.com/mapas/comarcas/comunidaddecalatayud.php (accessed on 13 April 2025).
- DATADIS. Available online: https://datadis.es/queries (accessed on 26 July 2023).
- Rogers, E.M. Diffusion of Innovations; Free Press: New York, NY, USA, 1962. [Google Scholar]
- Red Eléctrica de España (REE). Autoconsumo en los Hogares; Red Eléctrica de España: Alcobendas, Spain, 2019. [Google Scholar]
- European Commission Photovoltaic Geographical Information System (PVGIS). Available online: https://re.jrc.ec.europa.eu/pvg_tools/en/ (accessed on 11 April 2025).
- Red Eléctrica Precio Mercado SPOT Diario. Available online: https://www.esios.ree.es/es/analisis/600?vis=1&start_date=01-01-2023T00%3A00&end_date=31-12-2023T23%3A55&compare_start_date=31-12-2022&groupby=day (accessed on 19 February 2024).
- Red Eléctrica Término de Facturación de Energía Activa Del PVPC 2.0TD. Available online: https://www.esios.ree.es/es/pvpc?date=22-10-2022 (accessed on 19 February 2024).
- Red Eléctrica Precio de La Energía Excedentaria Del Autoconsumo Para El Mecanismo de Compensación Simplificada (PVPC). Available online: https://www.esios.ree.es/es/analisis/1739?vis=1&start_date=01-01-2023T00%3A00&end_date=31-12-2023T23%3A55&compare_start_date=31-12-2022&groupby=day (accessed on 19 February 2024).
- Boletín Oficial del Estado. Ley 38/1992, de 28 de Diciembre, de Impuestos Especiales; Boletín Oficial del Estado: Madrid, Spain, 1992. [Google Scholar]
- Boletín Oficial del Estado. Real Decreto Legislativo 1175/1990, de 28 de Septiembre, Por El Que Aprueban Las Tarifas y La Instrucción Del Impuesto Sobre Económicas; Boletín Oficial del Estado: Madrid, Spain, 1990. [Google Scholar]
- Gobierno de Aragón Tasa 14. Por Servicios En Materia de Ordenación de Actividades Industriales, Energéticas, Metrológicas, Mineras y Comerciales. Modelo 514. Apartado 5. Tarifa 11.1. Available online: https://aplicaciones.aragon.es/alq/alq?dga_accion_app=buscar_tarifas&multiple=N&sri_tasa=14&sri_modelo=514&sri_modelo_id=1 (accessed on 8 April 2025).
- European Comission Electric Vehicle Recharging Prices. Available online: https://alternative-fuels-observatory.ec.europa.eu/consumer-portal/electric-vehicle-recharging-prices (accessed on 9 February 2024).
- CharBox Cargador Para Empresas Con Pedestal EBusiness E-30. Available online: https://www.cargadorcocheelectrico.net/cargador-empresas-pedestal-ebusiness-e-30/ (accessed on 8 February 2024).
- EDP Energía El Cuidado de Un Cargador Eléctrico. Available online: https://www.edpenergia.es/es/blog/movilidad-sostenible/cuidado-cargador-electrico/#:~:text=Mantenimiento%20de%20cargadores%20de%20veh%C3%ADculos,unos%20ocho%20o%20diez%20a%C3%B1os (accessed on 6 March 2024).
- Cano, J. Madrid Abre Su Propia “Hidrogenera”; El Coche de Hidrógeno, Más Cerca. El Español 2021. Available online: https://www.elespanol.com/motor/20210128/madrid-abre-primera-hidrogenera-coche-hidrogeno-cerca/554446376_0.html (accessed on 13 April 2025).
- Griñán, G.G. ¿Dónde Podre Llenar Mi Vehículo de Hidrógeno y a Qué Precio? 2023. Available online: https://openroom.fundacionrepsol.com/es/contenidos/donde-llenar-vehiculo-hidrogeno-precio/ (accessed on 13 April 2025).
- Danish Energy Agency. Technology Data-Energy Storage; Danish Energy Agency: København, Denmark, 2018. [Google Scholar]
- Ikäheimo, J.; Kiviluoma, J.; Weiss, R.; Holttinen, H. Power-to-Ammonia in Future North European 100 % Renewable Power and Heat System. Int. J. Hydrogen Energy 2018, 43, 17295–17308. [Google Scholar] [CrossRef]
- Cesaro, Z.; Ives, M.; Nayak-Luke, R.; Mason, M.; Bañares-Alcántara, R. Ammonia to Power: Forecasting the Levelized Cost of Electricity from Green Ammonia in Large-Scale Power Plants. Appl. Energy 2021, 282, 116009. [Google Scholar] [CrossRef]
- Rouwenhorst, K.; Castellanos, G.; International Renewable Energy Agency. Ammonia Energy Association. In Innovation Outlook: Renewable Ammonia; International Renewable Energy Agency: Masdar City, United Arab Emirates, 2022; ISBN 9789292604233. [Google Scholar]
- Boletín Oficial de Estado (BOE). Real Decreto 152/2022, de 22 de Febrero, Por El Que Se Fija El Salario Mínimo Interprofesional Para 2022; Boletín Oficial del Estado: Madrid, Spain, 2022. [Google Scholar]
- Peprah, F.; Aboagye, B.; Amo-Boateng, M.; Gyamfi, S.; Effah-Donyina, E. Economic Evaluation of Solar PV Electricity Prosumption in Ghana. Sol. Compass 2023, 5, 100035. [Google Scholar] [CrossRef]
- González-Arias, J.; Sánchez, M.E.; Cara-Jiménez, J. Profitability Analysis of Thermochemical Processes for Biomass-Waste Valorization: A Comparison of Dry vs Wet Treatments. Sci. Total Environ. 2022, 811, 152240. [Google Scholar] [CrossRef] [PubMed]
- Fernández-Caballero, J. Los Pueblos de España Pierden Siete Veces Más Población Que El Resto de Las Zonas Rurales de La UE. Available online: https://revistajaraysedal.es/zonas-rurales-espanolas-poblacion/?utm_ (accessed on 12 April 2025).

| Type of Impact | Social Level | Social Indicator | References |
|---|---|---|---|
| + collective benefits | |||
| Local capacity building | Societal impacts | Local community engagement | [36] |
| Societal impacts | Public opinion | [36,37] | |
| Societal impacts | Social acceptability | [37,38] | |
| Societal impacts | Improvements in life quality | [38,39] | |
| Societal impacts | GDP increase, sector contribution to GDP | [37,38] | |
| Improvement of local economy | Community well-being | Local economic development, economic feasibility | [36,38,40,41] |
| Community well-being | Direct economic impacts | [36] | |
| Community well-being | Creation of new business | [36,38,40,41] | |
| Societal impacts | Improve social relationships, reduce social isolation, build local capacity | [37,39,40] | |
| Community well-being | Improvement of local infrastructure | [36,37,38] | |
| Changes in community’s behavior | Individual well-being | Energy consumption reduction, household behavioral change measures | [37,40] |
| Individual well-being | Training and educational programs: long-life learning, developing behavioral skills, actions, and efforts to be more responsible toward environmental issues, change in citizens’ behavior: raise awareness of climate change | [36,37,38,40] | |
| Community well-being | Community involved in decision making | [38,40] | |
| Community well-being | Indirect economic impacts | [41] | |
| Energy security and access | Community well-being | Reduction in fossil fuel imports | [38] |
| Societal impacts | Energy access, energy security | [36,37,38,41] | |
| Societal impacts | Poverty reduction | [38,40,41] | |
| Societal impacts | Electricity costs reduction | [12,13,14,15] | |
| Individual well-being | Households with access to electricity grid | [38] | |
| Individual well-being | Consumption of self-generation energy | [37,41] | |
| Employment | Community well-being | Contribution to technology development | [37,38] |
| Individual well-being | Acquisition of job skills, training or education provided to employees, developing technical skills | [36,37,38,39] | |
| Community well-being | Job creation, employment in the sector, job creation in industry and in rural areas | [36,37,38,40] | |
| Participation | Community well-being | Communication with local authorities | [37] |
| Community well-being | Community investment | [37,38,40,41] | |
| Community well-being | Community participation, effective stakeholder participation | [37,38,40,41] | |
| Individual well-being | Access to information and knowledge | [37,38,40] | |
| − collective benefits | |||
| Village | Population | Electricity Contracts | Local EC Members’ Energy Demand— 14% of the Annual Village Consumption (kWh/yr) | Number and Type of Installations | Estimated Surpluses (kWh/yr) |
|---|---|---|---|---|---|
| Alhama de Aragón | 964 | 5215 | 1,233,907 | 8 of 60 kWp | 330,909 |
| Aniñón | 659 | 5048 | 338,165 | 2 of 60 kWp | 91,239 |
| Ateca | 1690 | 11,382 | 1,129,768 | 7 of 60 kWp | 304,296 |
| Bijuesca | 89 | 549 | 27,828 | 4 of 3 kWp | 7594 |
| Calatayud | 19,776 | 102,006 | 11,939,323 | 78 of 60 kWp | 3,200,024 |
| El Frasno | 379 | 2470 | 444,458 | 3 of 60 kWp | 120,220 |
| Pozuel de Ariza | 27 | 255 | 8675 | 1 of 3 kWp | 3253 |
| Economic Profitability | |||||
|---|---|---|---|---|---|
| Village | Scenario 1A | ||||
| Investment (EUR) | NPV (EUR) | IRR (%) | Profitability NPV & IRR | Profitability Index | |
| Alhama de Aragón | 358,160.00 | 382,762.07 | 23.31 | profitable | 1.07 |
| Aniñón | 98,420.00 | 104,972.65 | 23.29 | profitable | 1.07 |
| Ateca | 328,560.00 | 350,631.74 | 23.29 | profitable | 1.07 |
| Bijuesca | 20,240.00 | −2350.37 | 8.39 | non-profitable | −0.12 |
| Calatayud | 3,464,680.00 | 3,703,372.58 | 23.31 | profitable | 1.07 |
| El Frasno | 129,500.00 | 138,007.75 | 23.27 | profitable | 1.07 |
| Pozuel de Ariza | 7360.00 | −1186.75 | 7.74 | non-profitable | −0.16 |
| Village | Scenario 1B | ||||
| Investment (EUR) | NPV (EUR) | IRR (%) | Profitability NPV & IRR | Profitability Index | |
| Alhama de Aragón | 358,160.00 | 795,837.51 | 23.82 | profitable | 2.22 |
| Aniñón | 98,420.00 | 218,477.73 | 23.79 | profitable | 2.22 |
| Ateca | 328,560.00 | 729,555.98 | 23.80 | profitable | 2.22 |
| Bijuesca | 20,240.00 | 18,036.44 | 8.63 | non-profitable | 0.89 |
| Calatayud | 3,464,680.00 | 7,699,298.06 | 23.82 | profitable | 2.22 |
| El Frasno | 129,500.00 | 287,353.61 | 23.78 | profitable | 2.22 |
| Pozuel de Ariza | 7360.00 | 6218.12 | 8.04 | non-profitable | 0.85 |
| Village | Scenario 1C | ||||
| Investment (EUR) | NPV (EUR) | IRR (%) | Profitability NPV & IRR | Profitability Index | |
| Alhama de Aragón | 358,160.00 | 973,779.83 | 29.18 | profitable | 2.72 |
| Aniñón | 98,420.00 | 267,543.43 | 29.16 | profitable | 2.72 |
| Ateca | 328,560.00 | 893,194.94 | 29.18 | profitable | 2.72 |
| Bijuesca | 20,240.00 | 22,120.68 | 11.07 | profitable | 1.09 |
| Calatayud | 3,464,680.00 | 9,420,063.16 | 29.19 | profitable | 2.72 |
| El Frasno | 129,500.00 | 352,006.21 | 29.16 | profitable | 2.72 |
| Pozuel de Ariza | 7360.00 | 7972.26 | 10.84 | profitable | 1.08 |
| Regional EC–CERCA | 4,406,920.00 | 5,485,298.44 | 12.93 | profitable | 1.24 |
| Village | Scenario 2A | ||||
| Investment (EUR) | NPV (EUR) | IRR (%) | Profitability NPV & IRR | Profitability Index | |
| Alhama de Aragón | 465,755.24 | 428,276.30 | 22.09 | profitable | 0.92 |
| Aniñón | 128,086.42 | 117,521.95 | 22.06 | profitable | 0.92 |
| Ateca | 427,502.16 | 392,485.60 | 22.07 | profitable | 0.92 |
| Bijuesca | 22,709.16 | −1305.88 | 9.19 | non-profitable | −0.06 |
| Calatayud | 4,505,170.15 | 4,143,513.90 | 22.09 | profitable | 0.92 |
| El Frasno | 168,589.67 | 154,543.20 | 22.06 | profitable | 0.92 |
| Pozuel de Ariza | 8417.59 | −739.38 | 8.75 | non-profitable | −0.09 |
| Village | Scenario 2B | ||||
| Investment (EUR) | NPV (EUR) | IRR (%) | Profitability NPV & IRR | Profitability Index | |
| Alhama de Aragón | 465,755.24 | 520,289.41 | 24.54 | profitable | 1.12 |
| Aniñón | 128,086.42 | 142,892.02 | 24.52 | profitable | 1.12 |
| Ateca | 427,502.16 | 477,098.78 | 24.52 | profitable | 1.12 |
| Bijuesca | 22,709.16 | 805.69 | 10.49 | profitable | 0.04 |
| Calatayud | 4,505,170.15 | 5,033,318.41 | 24.54 | profitable | 1.12 |
| El Frasno | 168,589.67 | 187,971.84 | 24.51 | profitable | 1.12 |
| Pozuel de Ariza | 8417.59 | 165.05 | 10.27 | profitable | 0.02 |
| Regional EC–CERCA | 5,726,230.39 | 497,648.41 | 11.24 | profitable | 0.11 |
| Village | Scenario 2C | ||||
| Investment (EUR) | NPV (EUR) | IRR (%) | Profitability NPV & IRR | Profitability Index | |
| Alhama de Aragón | 362,160.00 | 705,233.61 | 33.80 | profitable | 1.95 |
| Aniñón | - | - | - | - | - |
| Ateca | 332,560.00 | 688,124.53 | 35.25 | profitable | 2.07 |
| Bijuesca | - | - | - | - | - |
| Calatayud | 3,512,680.00 | 8,008,149.52 | 37.76 | profitable | 2.28 |
| El Frasno | - | - | - | - | - |
| Pozuel de Ariza | - | - | - | - | - |
| Regional EC–CERCA | 4,469,512.10 | 4,489,964.77 | 22.59 | profitable | 1.02 |
| Village | Scenario 3A | ||||
| Investment (EUR) | NPV (EUR) | IRR (%) | Profitability NPV & IRR | Profitability Index | |
| Alhama de Aragón | - | - | - | - | - |
| Aniñón | - | - | - | - | - |
| Ateca | - | - | - | - | - |
| Bijuesca | - | - | - | - | - |
| Calatayud | 5,624,680.00 | 3,382,833.52 | 18.09 | profitable | 0.60 |
| El Frasno | - | - | - | - | - |
| Pozuel de Ariza | - | - | - | - | - |
| Regional EC–CERCA | 5,486,920.00 | −777,709.94 | 7.96 | non-profitable | −0.18 |
| Village | Scenario 3B | ||||
| Investment (EUR) | NPV (EUR) | IRR (%) | Profitability NPV & IRR | Profitability Index | |
| Alhama de Aragón | 33,396,145.93 | 646,756,697.20 | 239.98 | profitable | 19.37 |
| Aniñón | 9,207,733.44 | 178,324,758.33 | 239.98 | profitable | 19.37 |
| Ateca | 30,709,547.15 | 594,741,532.56 | 239.98 | profitable | 19.37 |
| Bijuesca | 778,415.09 | 14,831,017.94 | 236.27 | profitable | 19.05 |
| Calatayud | 322,955,574.46 | 6,254,404,826.13 | 239.98 | profitable | 19.37 |
| El Frasno | 12,123,298.96 | 234,967,588.90 | 239.99 | profitable | 19.37 |
| Pozuel de Ariza | 332,101.68 | 6,352,244.03 | 237.15 | profitable | 19.13 |
| Alhama de Aragón | ||||||||
|---|---|---|---|---|---|---|---|---|
| Scenario | Year 5 | Year 10 | Year 20 | Year 28 | ||||
| Person-year equivalent | Population growth (%) | Person-year equivalent | Population growth (%) | Person-year equivalent | Population growth (%) | Person-year equivalent | Population growth (%) | |
| 1A | - | - | 6 | 0.60 | 14 | 1.47 | 17 | 1.76 |
| 1B | - | - | - | - | - | - | - | - |
| 1C | 18 | 1.83 | 29 | 3.01 | 40 | 4.20 | 44 | 4.60 |
| 2A | - | - | 7 | 0.74 | 16 | 1.67 | 19 | 1.98 |
| 2B | - | - | 10 | 1.03 | 20 | 2.08 | 23 | 2.42 |
| 2C | 4 | 0.37 | 16 | 1.62 | 28 | 2.88 | 32 | 3.31 |
| 3A | - | - | - | - | - | - | - | - |
| 3B | 11,377 | 1180.23 | 19,315 | 2003.63 | 27,303 | 2832.21 | 29,935 | 3105.27 |
| Aniñón | ||||||||
| Scenario | Year 5 | Year 10 | Year 20 | Year 28 | ||||
| Person-year equivalent | Population growth (%) | Person-year equivalent | Population growth (%) | Person-year equivalent | Population growth (%) | Person-year equivalent | Population growth (%) | |
| 1A | - | - | 1 | 0.19 | 4 | 0.54 | 4 | 0.54 |
| 1B | - | - | - | - | - | - | - | - |
| 1C | 4 | 0.54 | 8 | 1.15 | 11 | 1.63 | 12 | 1.79 |
| 2A | - | - | - | - | - | - | 5 | 0.74 |
| 2B | - | - | - | - | 5 | 0.78 | 6 | 0.92 |
| 2C | - | - | - | - | - | - | - | - |
| 3A | - | - | - | - | - | - | - | - |
| 3B | 3137 | 475.97 | 5325 | 808.07 | 7528 | 1142.27 | 8253 | 1252.40 |
| Ateca | ||||||||
| Scenario | Year 5 | Year 10 | Year 20 | Year 28 | ||||
| Person-year equivalent | Population growth (%) | Person-year equivalent | Population growth (%) | Person-year equivalent | Population growth (%) | Person-year equivalent | Population growth (%) | |
| 1A | - | - | 5 | 0.28 | 12 | 0.74 | 15 | 0.89 |
| 1B | - | - | - | - | - | - | - | - |
| 1C | 16 | 0.92 | 26 | 1.54 | 37 | 2.16 | 40 | 2.37 |
| 2A | - | - | - | - | - | - | 17 | 1.00 |
| 2B | - | - | - | - | 18 | 1.05 | 21 | 1.23 |
| 2C | 3 | 0.21 | 15 | 0.89 | 27 | 1.58 | 31 | 1.81 |
| 3A | - | - | - | - | - | - | - | - |
| 3B | 10,462 | 619.05 | 17,761 | 1050.95 | 25,106 | 1485.57 | 27,527 | 1628.80 |
| Bijuesca | ||||||||
| Scenario | Year 5 | Year 10 | Year 20 | Year 28 | ||||
| Person-year equivalent | Population growth (%) | Person-year equivalent | Population growth (%) | Person-year equivalent | Population growth (%) | Person-year equivalent | Population growth (%) | |
| 1A | - | - | - | - | - | - | - | - |
| 1B | - | - | - | - | - | - | - | - |
| 1C | - | - | - | - | - | - | - | - |
| 2A | - | - | - | - | - | - | - | - |
| 2B | - | - | - | - | - | - | - | - |
| 2C | - | - | - | - | - | - | - | - |
| 3A | - | - | - | - | - | - | - | - |
| 3B | 260 | 292.59 | 443 | 497.26 | 626 | 703.21 | 686 | 771.09 |
| Calatayud | ||||||||
| Scenario | Year 5 | Year 10 | Year 20 | Year 28 | ||||
| Person-year equivalent | Population growth (%) | Person-year equivalent | Population growth (%) | Person-year equivalent | Population growth (%) | Person-year equivalent | Population growth (%) | |
| 1A | - | - | 51 | 0.26 | 131 | 0.66 | 158 | 0.8 |
| 1B | - | - | - | - | - | - | - | - |
| 1C | 165 | 0.83 | 275 | 1.39 | 386 | 1.95 | 423 | 2.10 |
| 2A | - | - | 63 | 0.32 | 150 | 0.76 | 179 | 0.9 |
| 2B | 59 | 0.30 | 221 | 1.12 | 368 | 1.86 | 417 | 2.11 |
| 2C | 51 | 0.26 | 182 | 0.92 | 314 | 1.59 | 358 | 1.81 |
| 3A | - | - | 24 | 0.12 | 108 | 0.55 | 144 | 0.73 |
| 3B | 110,019 | 556.33 | 186,778 | 944.47 | 264,021 | 1335.06 | 289,477 | 1463.78 |
| El Frasno | ||||||||
| Scenario | Year 5 | Year 10 | Year 20 | Year 28 | ||||
| Person-year equivalent | Population growth (%) | Person-year equivalent | Population growth (%) | Person-year equivalent | Population growth (%) | Person-year equivalent | Population growth (%) | |
| 1A | - | - | 2 | 0.52 | 5 | 1.32 | 6 | 0.61 |
| 1B | - | - | - | - | - | - | - | - |
| 1C | 6 | 1.65 | 10 | 2.74 | 15 | 3.83 | 16 | 4.20 |
| 2A | - | - | 2 | 0.52 | 6 | 1.61 | 7 | 1.88 |
| 2B | - | - | 3 | 0.92 | 7 | 1.88 | 8 | 2.19 |
| 2C | - | - | - | - | - | - | - | - |
| 3A | - | - | - | - | - | - | - | - |
| 3B | 4133 | 1090.59 | 7017 | 1851.47 | 9919 | 2617.13 | 10,875 | 2869.46 |
| Pozuel de Ariza | ||||||||
| Scenario | Year 5 | Year 10 | Year 20 | Year 28 | ||||
| Person-year equivalent | Population growth (%) | Person-year equivalent | Population growth (%) | Person-year equivalent | Population growth (%) | Person-year equivalent | Population growth (%) | |
| 1A | - | - | - | - | - | - | - | - |
| 1B | - | - | - | - | - | - | - | - |
| 1C | - | - | - | - | - | - | - | - |
| 2A | - | - | - | - | - | - | - | - |
| 2B | - | - | - | - | - | - | - | - |
| 2C | - | - | - | - | - | - | - | - |
| 3A | - | - | - | - | - | - | - | - |
| 3B | 111 | 464.57 | 190 | 789.59 | 268 | 1116.65 | 294 | 1224.43 |
| Regional EC–CERCA | ||||||||
| Scenario | Year 5 | Year 10 | Year 20 | Year 28 | ||||
| Person-year equivalent | Population growth (%) | Person-year equivalent | Population growth (%) | Person-year equivalent | Population growth (%) | Person-year equivalent | Population growth (%) | |
| 1C | 103 | 10.65 | 167 | 17.31 | 231 | 24.01 | 253 | 26.26 |
| 2B | - | - | - | - | 5 | 0.52 | 22 | 2.31 |
| 2C | - | - | 73 | 7.57 | 174 | 18.03 | 207 | 21.48 |
| 3A | - | - | - | - | - | - | - | - |
| Village | Scenario 1A—Direct Selling | |||
|---|---|---|---|---|
| Year 5 | Year 10 | Year 20 | Year 28 | |
| Alhama de Aragón | - | 53,693.33 | 25,582.86 | 21,068.24 |
| Aniñón | - | - | 24,605.00 | 24,605.00 |
| Ateca | - | 65,712.00 | 27,380.00 | 21,904.00 |
| Bijuesca | - | - | - | - |
| Calatayud | - | 67,934.90 | 26,447.94 | 21,928.35 |
| El Frasno | - | 64,750.00 | 25,900.00 | 21,583.33 |
| Pozuel de Ariza | - | - | - | - |
| Village | Scenario 1C—Energy Retailer | |||
| Year 5 | Year 10 | Year 20 | Year 28 | |
| Alhama de Aragón | 19,897.78 | 12,350.34 | 8954.00 | 8140.00 |
| Aniñón | 24,605.00 | 12,302.50 | 8947.27 | 8201.67 |
| Ateca | 20,535.00 | 12,636.92 | 8880.00 | 8214.00 |
| Bijuesca | - | - | - | - |
| Calatayud | 20,998.06 | 12,598.84 | 8975.85 | 8190.73 |
| El Frasno | 21,583.33 | 12,950.00 | 8633.33 | 8093.75 |
| Pozuel de Ariza | - | - | - | - |
| CERCA | 42,785.63 | 26,388.74 | 19,077.58 | 17,418.66 |
| Village | Scenario 2A—Batteries for Self-Consumption | |||
| Year 5 | Year 10 | Year 20 | Year 28 | |
| Alhama de Aragón | - | 66,536.46 | 29,109.70 | 24,513.43 |
| Aniñón | - | - | - | 25,617.28 |
| Ateca | - | - | - | 25,147.19 |
| Bijuesca | - | - | - | - |
| Calatayud | - | 71,510.64 | 30,034.47 | 25,168.55 |
| El Frasno | - | 84,294.84 | 28,098.28 | 24,084.24 |
| Pozuel de Ariza | - | - | - | - |
| Village | Scenario 2B—Battery-to-Grid | |||
| Year 5 | Year 10 | Year 20 | Year 28 | |
| Alhama de Aragón | - | 46,575.52 | 23,287.76 | 20,250.23 |
| Aniñón | - | - | 25,617.28 | 21,347.74 |
| Ateca | - | - | 23,750.12 | 20,357.25 |
| Bijuesca | - | - | - | - |
| Calatayud | 76,358.82 | 20,385.39 | 12,242.31 | 10,803.77 |
| El Frasno | - | 56,196.56 | 24,084.24 | 21,073.71 |
| Pozuel de Ariza | - | - | - | - |
| CERCA | - | - | 1,145,246.08 | 260,283.20 |
| Village | Scenario 2C—Electric Vehicle Chargers | |||
| Year 5 | Year 10 | Year 20 | Year 28 | |
| Alhama de Aragón | 90,540.00 | 22,635.00 | 12,934.29 | 11,317.50 |
| Aniñón | - | - | - | - |
| Ateca | 110,853.33 | 22,170.67 | 12,317.04 | 10,727.74 |
| Bijuesca | - | - | - | - |
| Calatayud | 68,876.08 | 19,300.44 | 11,186.88 | 9811.96 |
| El Frasno | - | - | - | - |
| Pozuel de Ariza | - | - | - | - |
| CERCA | - | 61,226.19 | 25,686.85 | 21,591.85 |
| Village | Scenario 3A—Hydrogen Refueling Stations | |||
| Year 5 | Year 10 | Year 20 | Year 28 | |
| Alhama de Aragón | - | - | - | - |
| Aniñón | - | - | - | - |
| Ateca | - | - | - | - |
| Bijuesca | - | - | - | - |
| Calatayud | - | 234,361.67 | 52,080.37 | 39,060.28 |
| El Frasno | - | - | - | - |
| Pozuel de Ariza | - | - | - | - |
| CERCA | ||||
| Village | Scenario 3B—Fertilizers | |||
| Year 5 | Year 10 | Year 20 | Year 28 | |
| Alhama de Aragón | 2935.41 | 1729.03 | 1223.17 | 1115.62 |
| Aniñón | 2935.20 | 1729.15 | 1223.13 | 1115.68 |
| Ateca | 2935.34 | 1729.04 | 1223.20 | 1115.62 |
| Bijuesca | 2993.90 | 1753.14 | 1243.47 | 1134.72 |
| Calatayud | 2935.45 | 1729.09 | 1223.22 | 1115.65 |
| El Frasno | 2935.47 | 1728.99 | 1223.14 | 1115.61 |
| Pozuel de Ariza | 2991.91 | 1747.90 | 1239.19 | 1129.60 |
Disclaimer/Publisher’s Note: The statements, opinions and data contained in all publications are solely those of the individual author(s) and contributor(s) and not of MDPI and/or the editor(s). MDPI and/or the editor(s) disclaim responsibility for any injury to people or property resulting from any ideas, methods, instructions or products referred to in the content. |
© 2025 by the authors. Licensee MDPI, Basel, Switzerland. This article is an open access article distributed under the terms and conditions of the Creative Commons Attribution (CC BY) license (https://creativecommons.org/licenses/by/4.0/).
Share and Cite
Sanz-Cuadrado, C.; Narvarte, L.; Cristóbal, A.B. Energy Valorization Strategies in Rural Renewable Energy Communities: A Path to Social Revitalization and Sustainable Development. Energies 2025, 18, 2561. https://doi.org/10.3390/en18102561
Sanz-Cuadrado C, Narvarte L, Cristóbal AB. Energy Valorization Strategies in Rural Renewable Energy Communities: A Path to Social Revitalization and Sustainable Development. Energies. 2025; 18(10):2561. https://doi.org/10.3390/en18102561
Chicago/Turabian StyleSanz-Cuadrado, Cristina, Luis Narvarte, and Ana Belén Cristóbal. 2025. "Energy Valorization Strategies in Rural Renewable Energy Communities: A Path to Social Revitalization and Sustainable Development" Energies 18, no. 10: 2561. https://doi.org/10.3390/en18102561
APA StyleSanz-Cuadrado, C., Narvarte, L., & Cristóbal, A. B. (2025). Energy Valorization Strategies in Rural Renewable Energy Communities: A Path to Social Revitalization and Sustainable Development. Energies, 18(10), 2561. https://doi.org/10.3390/en18102561