Coupling Short-Circuit Ratio Calculation Method Based on the Source Network Load Correlation Thevenin Equivalent

Abstract
1. Introduction
2. Short-Circuit Ratio Indicator Based on Voltage Calculation
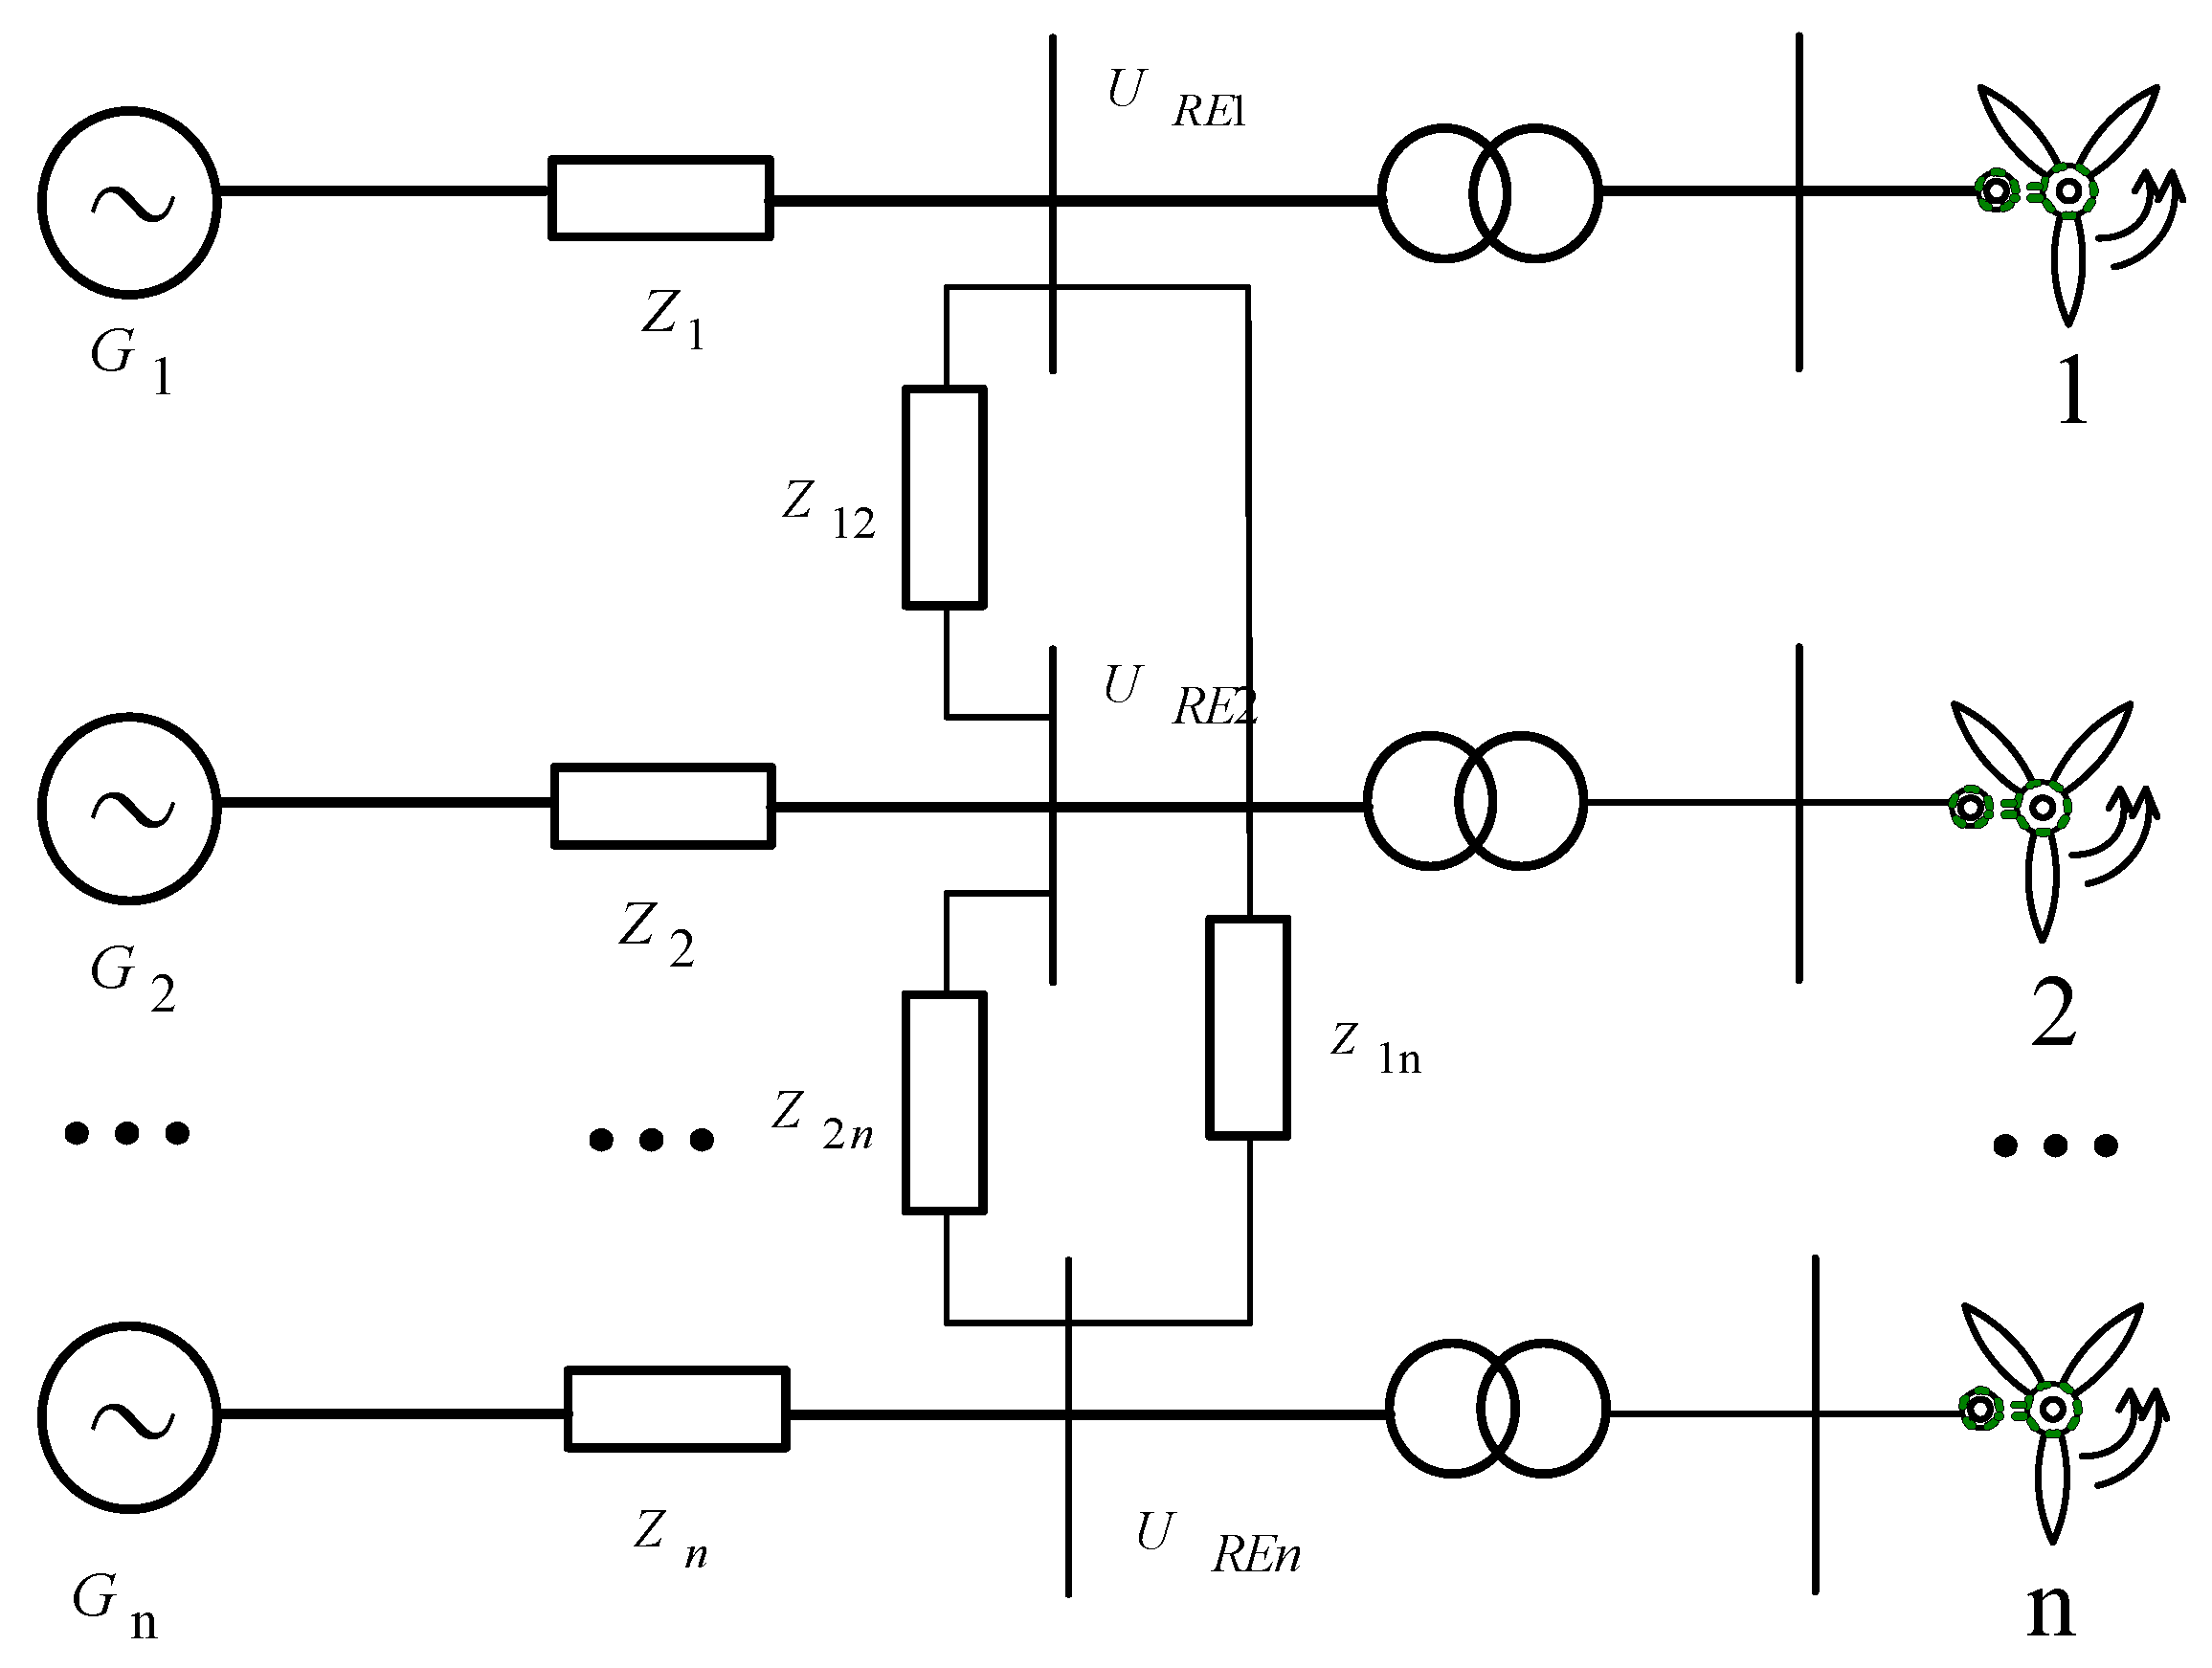
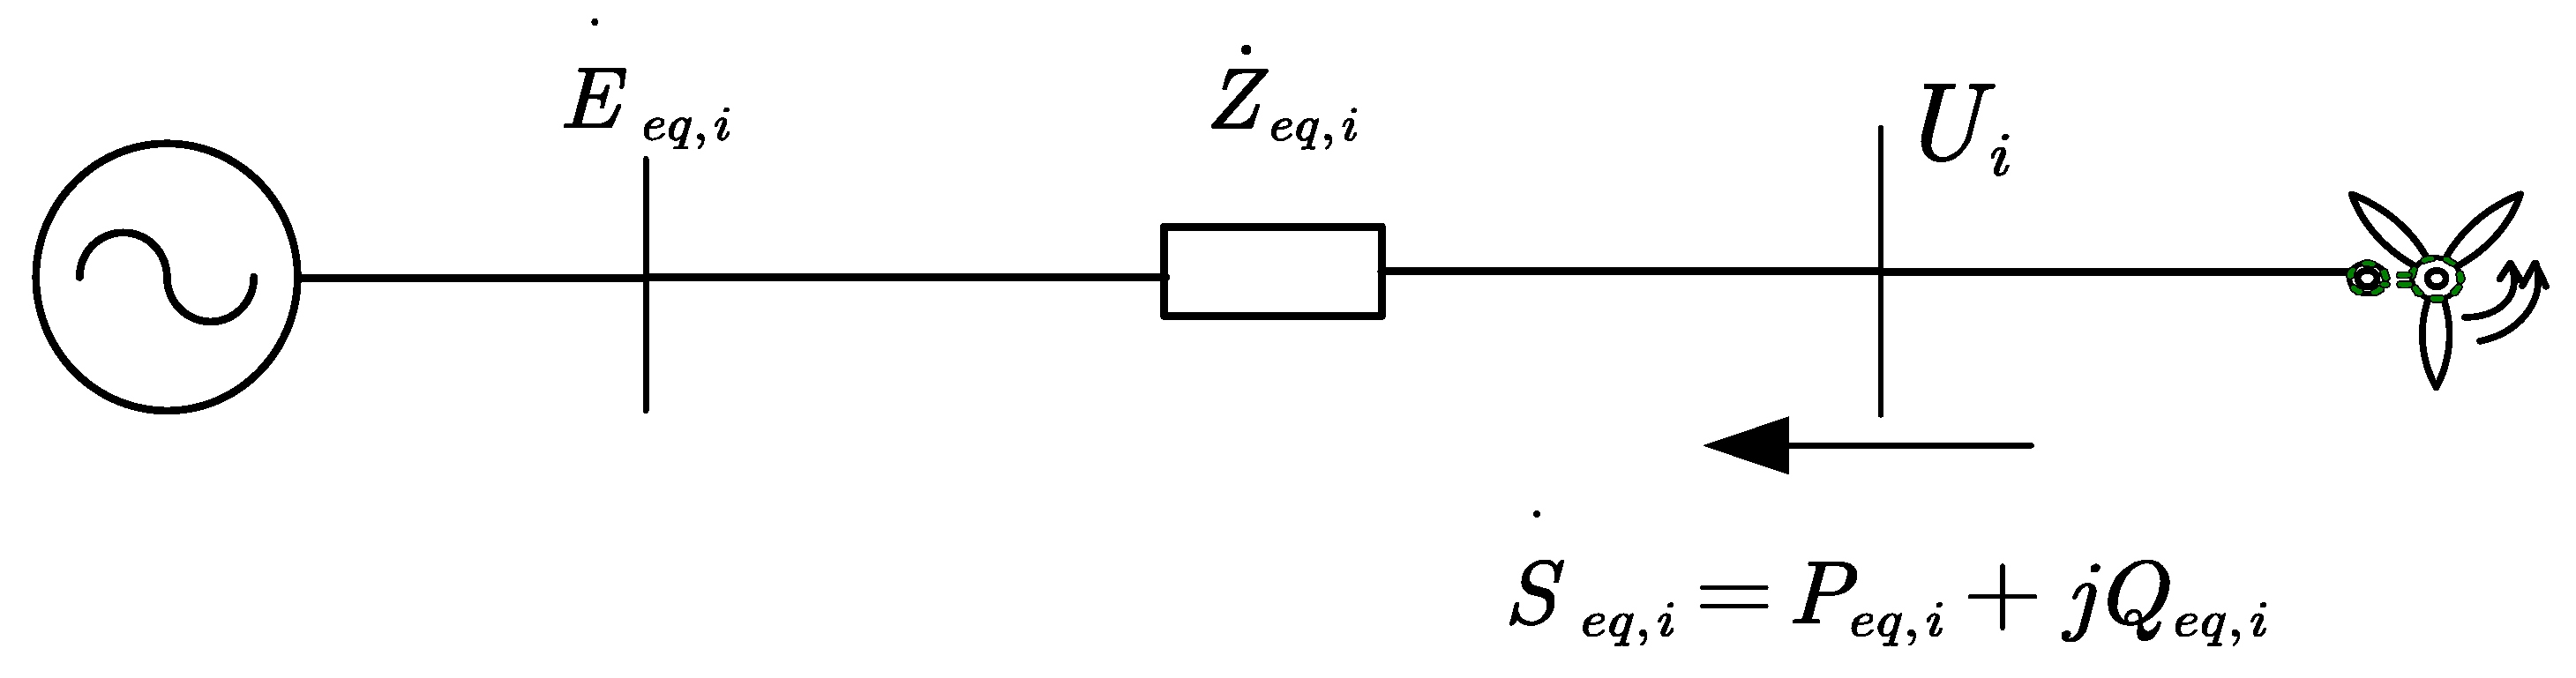
2.1. Equivalent Analysis Model
2.2. Definition and Analysis of Short-Circuit Ratio Based on Voltage Calculation
3. Short-Circuit Ratio Calculation Considering Load Coupling Relationship
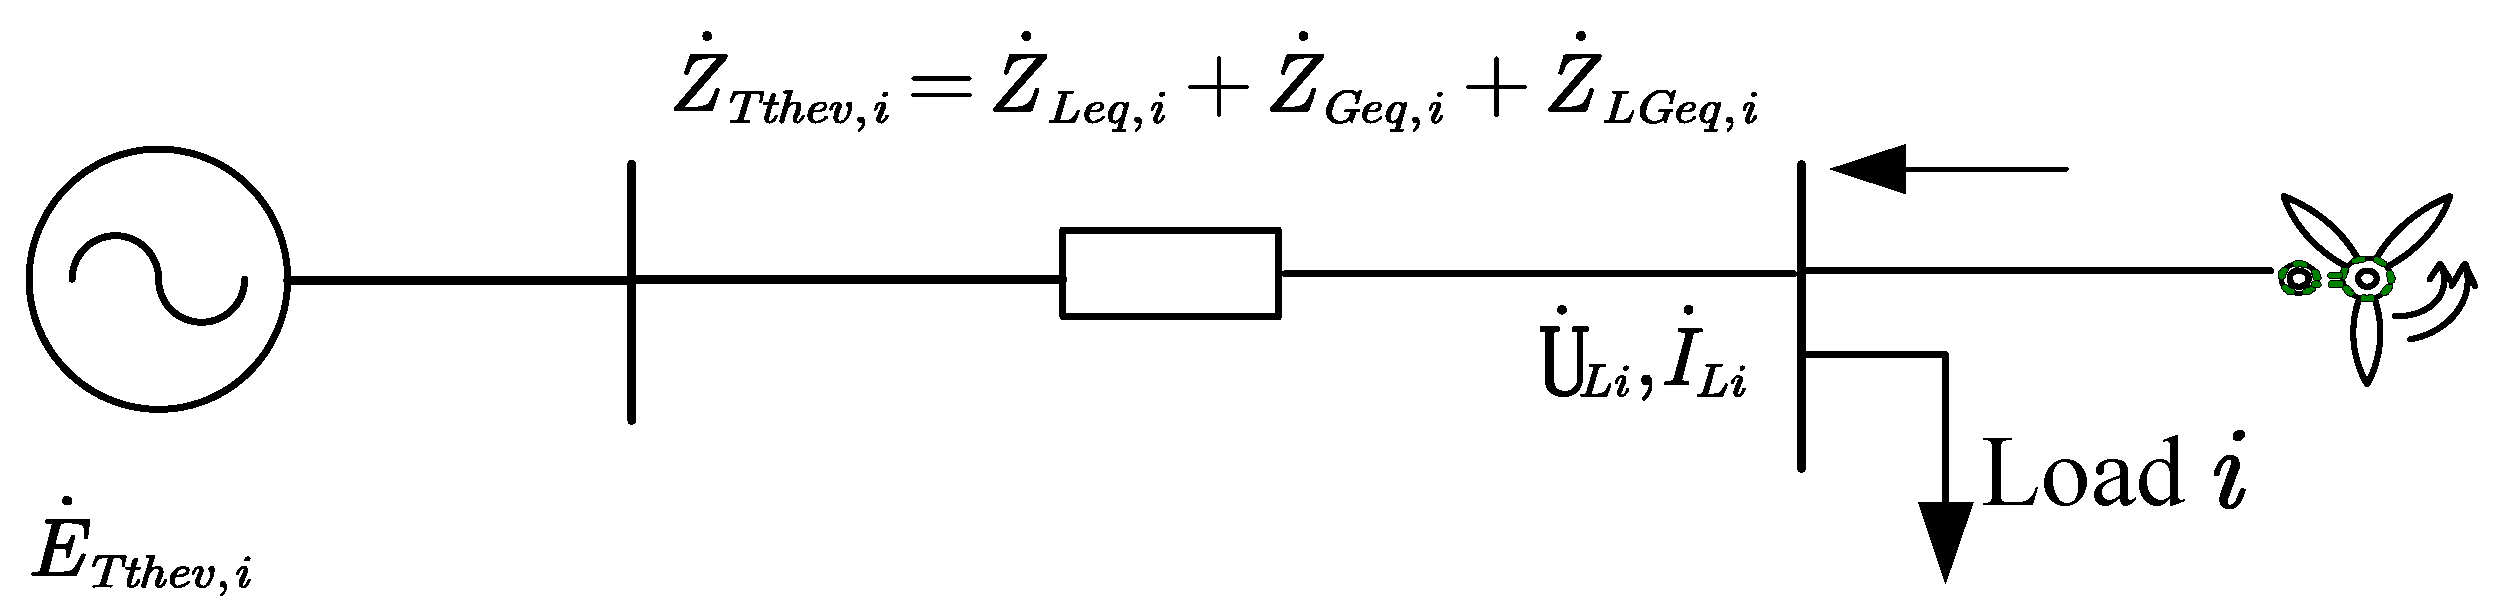
3.1. Analysis of Equivalent Coupling Impedance
3.2. Short-Circuit Ratio Indicator Based on Coupling Impedance Calculation
3.3. Impact of Coupling Impedance on Short-Circuit Ratio
4. Critical Coupling SCR Calculation for New Energy Grid-Connected Systems
Critical CSCR Based on Maximum Active Power
5. Simulation Verification
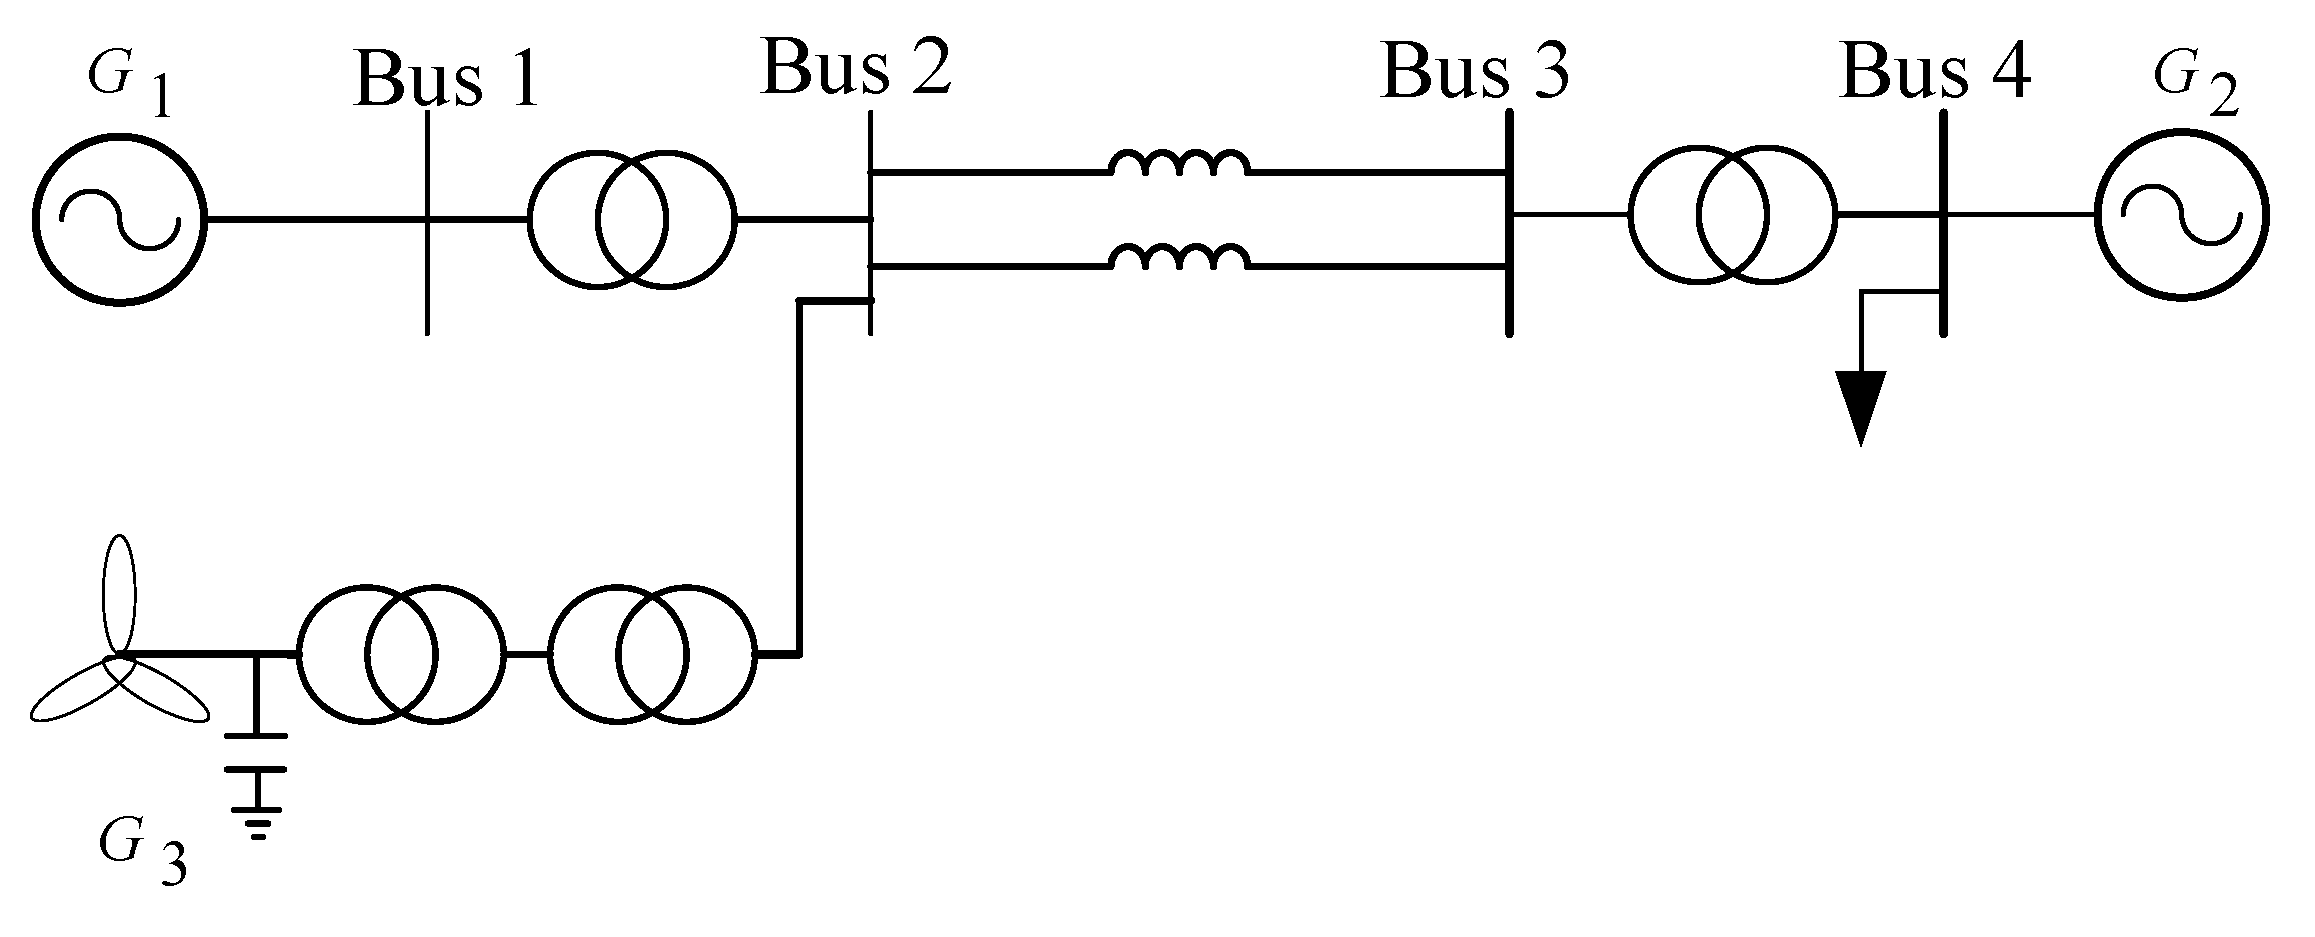
5.1. System Case
5.2. Case Analysis
6. Conclusions
Author Contributions
Funding
Data Availability Statement
Conflicts of Interest
Abbreviations
| CSCR | Coupled short-circuit ratio |
| SCR-U | Short-circuit ratio of voltage |
| SCR-O | Coupling short-circuit ratio |
| CSCR-O | Coupled short-circuit ratio of coupling |
References
- IEEE Std 1204-1997; IEEE Guide for Planning DC Links Terminating at AC Locations Having Low Short-Circuit Capacities. IEEE: New York, NY, USA, 1997.
- Chi, Y.J.; Habel, W.G. Connection of Wind Farms to Weak AC Networks; Conseil International Des Grands Reseaux Elecctriques: Paris, France, 2016. [Google Scholar]
- Strachan, N.P.W.; Jovcic, D. Stability of a variable-speed permanent magnet wind generator with weak A Cgrids. IEEE Trans. Power Deliv. 2010, 25, 2779–2788. [Google Scholar] [CrossRef]
- Lee, D.H.A.; Andersson, G. An equivalent singleinfeed model of multi-infeed HVDC systems for voltage and power stability analysis. IEEE Trans. Power Deliv. 2016, 31, 303–312. [Google Scholar] [CrossRef]
- Davies, J. CIGRE WG B4. 41 Report: Systems with Multiple DC Infeed; CIGRE Electra: Paris, France, 2007. [Google Scholar]
- Guo, X.J.; Tang, Y.; Guo, Q.; Lin, W.F.; Pu, G.Q.; Ma, S.Y. Factors and mechanisms affecting the DC short-circuit ratio index of CIGRE multi-feed-in DC. Power Syst. Prot. Control 2012, 40, 69–74, 81. [Google Scholar]
- Lin, W.-F.; Tang, Y.B. Definition and application of short-circuit ratio for multifeed AC/DC systems. Chin. J. Electr. Eng. 2008, 31, 1–8. [Google Scholar]
- Sun, H.D.; Wang, Y.M.; Gao, L.; Guo, Q.; Xu, T.; Song, R.; Li, Y.; He, J. Research on unification stability criterion for the power electronics dominated power system(II): Criterion of the powerelectronic interfaced subsystem. Proc. CSEE 2021, 42, 2060–2069. [Google Scholar]
- Tian, B.-Y.; Yuan, Z.-C.; Rao, H. A generalized short-circuit ratio index for multiple DC-fed systems. South. Power Grid Technol. 2019, 13, 1–8. [Google Scholar]
- Sun, H.D.; Xu, S.Y.; Xu, T.; Guo, Q.; He, J.B.; Zhao, B.; YU, L.; Zhang, Y.; Li, W.F.; Zhou, Y.K.; et al. Definition and index of short-circuit ratio of new energy multi-field station. Chin. J. Electr. Eng. 2021, 41, 497–505. [Google Scholar]
- Xin, H.; Dong, W.; Gan, D.; Wu, D.; Yuan, X. Generalized short-circuit ratio of power electronic multifeeded power systems. Chin. J. Electr. Eng. 2016, 36, 6013–6027. [Google Scholar]
- Xin, H.H.; Gan, D.Q.; Ju, P. Generalized short-circuit ratio of multi-feed-in power systems: Diverse new energy scenarios. Chin. J. Electr. Eng. 2020, 40, 5516–5526. [Google Scholar]
- Zhang, Y.; Huang, S.H.F.; Schmall, J.; Conto, J.; Billo, J.; Rehman, E. Evaluating system strength for large-scale wind plant integration. In Proceedings of the 2014 IEEE PES General Meeting Conference & Exposition, National Harbor, MD, USA, 27–31 July 2014; pp. 1–5. [Google Scholar]
- Taylor, C.W. Power System Voltage Stability; McGraw-Hill: New York, NY, USA, 1994. [Google Scholar]
- The Minnesota Utilities and Transmission Companies; Minnesota Department of Commerce. Minnesota Renewable Energy Integration and Transmission Study; The Minnesota Utilities and Transmission Companies: Duluth, MN, USA, 2014. [Google Scholar]
- Wu, D.; Ma, F.; Jiang, J.N. A fast weakness analysis method for renewable energy integration. In Proceedings of the 2018 IEEE Power & Energy Society General Meeting (PESGM), Portland, OR, USA, 5–10 August 2018; pp. 1–5. [Google Scholar]
- Li, W.X.; Mou, X.M.; Li, Z.M. Analysis and thoughts on the Thevenin equivalent parameters for power systems. Proc. CSEE 2012, 32, 28–34. (In Chinese) [Google Scholar]
- Yu, L.S.; Sun, H.D.; Zhao, B.; Xu, S.Y.; Zhang, J.; Li, Z.H. Analysis of short-circuit ratio index and calculation method of critical short-circuit ratio for new energy grid-connected system. Chin. J. Electr. Eng. 2022, 42, 919–929. [Google Scholar]
- Zhang, Y.; Cai, X.; Zhang, C.; Lu, J.; Li, Y. A review of transient synchronization stability studies of grid-connected converters. Chin. J. Electr. Eng. 2021, 41, 1687–1702. [Google Scholar]
- Taylor, C.W. Power System Voltage Stability; Wang, W.S., Translator; China Electric Power Press: Beijing, China, 2002. (In Chinese) [Google Scholar]


| SCR-U | Stability |
|---|---|
| 1.98 | Stable |
| 1.96 | Stable |
| 1.94 | Instability |
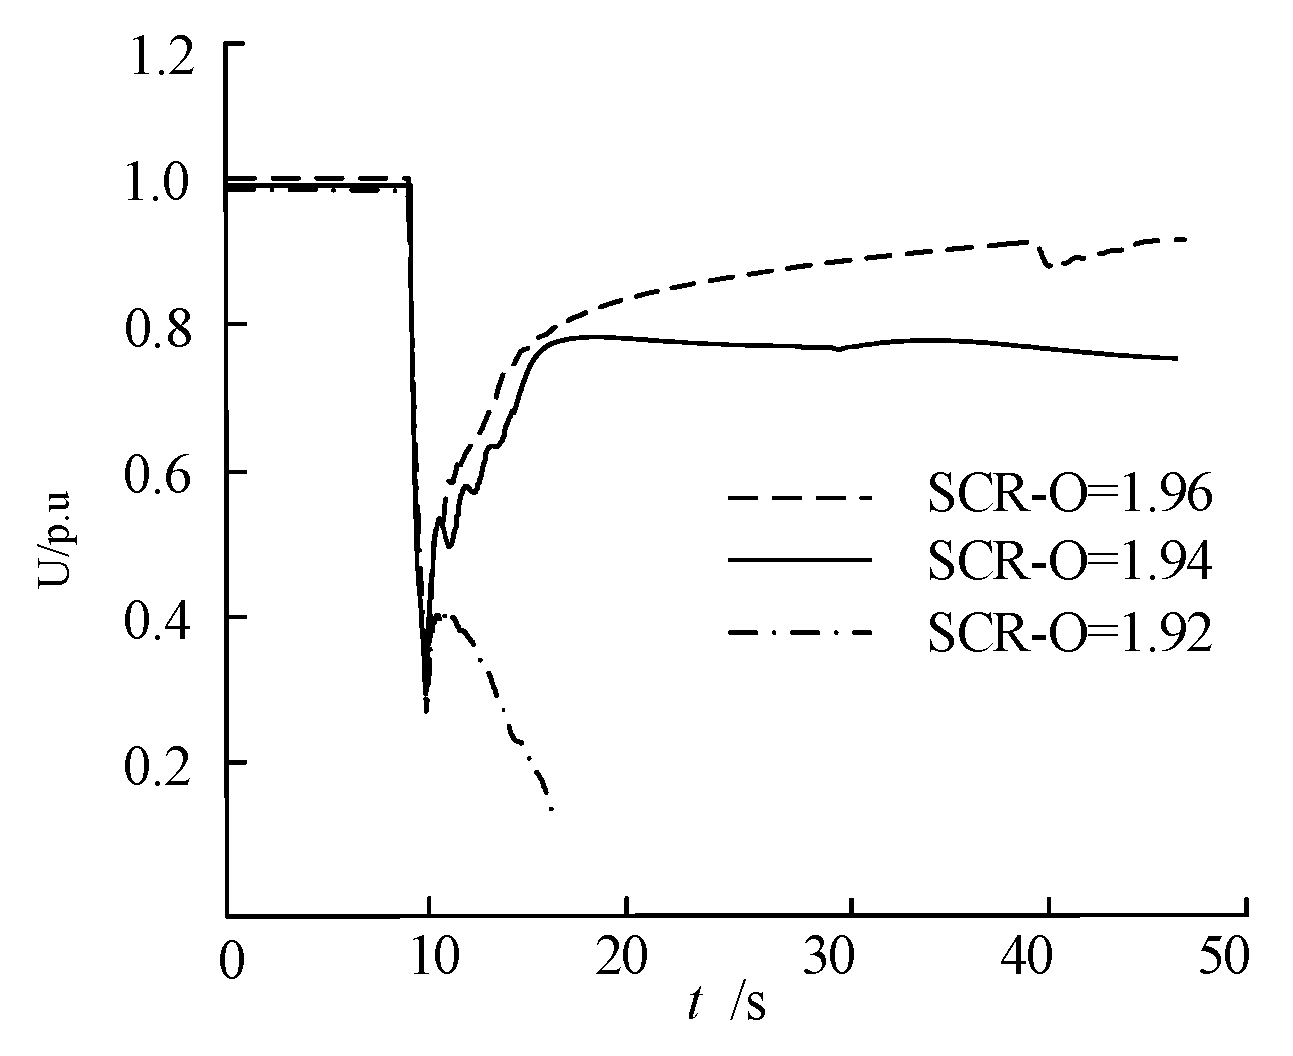
| SCR-O | Stability |
|---|---|
| 1.96 | Stable |
| 1.94 | Stable |
| 1.92 | Instability |
Disclaimer/Publisher’s Note: The statements, opinions and data contained in all publications are solely those of the individual author(s) and contributor(s) and not of MDPI and/or the editor(s). MDPI and/or the editor(s) disclaim responsibility for any injury to people or property resulting from any ideas, methods, instructions or products referred to in the content. |
© 2025 by the authors. Licensee MDPI, Basel, Switzerland. This article is an open access article distributed under the terms and conditions of the Creative Commons Attribution (CC BY) license (https://creativecommons.org/licenses/by/4.0/).
Share and Cite
Sun, L.; Kong, L. Coupling Short-Circuit Ratio Calculation Method Based on the Source Network Load Correlation Thevenin Equivalent. Energies 2025, 18, 2554. https://doi.org/10.3390/en18102554
Sun L, Kong L. Coupling Short-Circuit Ratio Calculation Method Based on the Source Network Load Correlation Thevenin Equivalent. Energies. 2025; 18(10):2554. https://doi.org/10.3390/en18102554
Chicago/Turabian StyleSun, Li, and Lingwei Kong. 2025. "Coupling Short-Circuit Ratio Calculation Method Based on the Source Network Load Correlation Thevenin Equivalent" Energies 18, no. 10: 2554. https://doi.org/10.3390/en18102554
APA StyleSun, L., & Kong, L. (2025). Coupling Short-Circuit Ratio Calculation Method Based on the Source Network Load Correlation Thevenin Equivalent. Energies, 18(10), 2554. https://doi.org/10.3390/en18102554