Article

Effects of Corrosion Depth on Wind-Induced Collapse Performance of an Angle Steel Transmission Tower

1
Nanxun Innovation Institute, Zhejiang University of Water Resources and Electric Power, Hangzhou 310018, China
2
Energy Engineering Group Zhejiang Power Design Institute Co., Ltd., Hangzhou 310012, China
3
College of Civil Engineering and Architecture, Zhejiang University, Hangzhou 310058, China
4
Hangzhou Jiangnan Talent Service Co., Ltd., Hangzhou 310012, China
5
Zhejiang Huayun Power Engineering Design Consulting Co., Ltd., Hangzhou 310016, China
*
Author to whom correspondence should be addressed.
Energies 2025, 18(10), 2518; https://doi.org/10.3390/en18102518
Submission received: 26 March 2025 / Revised: 6 May 2025 / Accepted: 8 May 2025 / Published: 13 May 2025
(This article belongs to the Section A3: Wind, Wave and Tidal Energy)

Abstract

:
Transmission towers in coastal and industrial areas have experienced significant corrosion due to prolonged exposure to atmospheric pollutants and saline moisture, which poses a risk to structural safety. To evaluate the impact of corrosion depth on wind-induced collapse performance of an angle steel transmission tower, a survey of 18 angle steel towers in Ningbo, China, was conducted. Finite element models (FEMs) incorporating observed corrosion patterns were developed to analyze natural vibration characteristics and progressive collapse. The collapse modes of both corroded and uncorroded towers were identified, and high-risk failure member was determined. The results indicate that the corrosion depth below the lower cross-arm can be considered representative of the overall corrosion condition of the tower. Torsional natural frequency of the angle steel tower is particularly sensitive to corrosion due to the critical role of diagonal members. Collapse analysis further reveals that moderate corrosion levels can reduce the tower’s wind resistance to below the design threshold, potentially compromising safety under extreme weather conditions. The diagonal member below the lower cross-arm is identified as a high-risk failure component. Strengthening this member, by up-grading from L75×6 to L90×6, can significantly enhance the tower’s tolerance to corrosion.

1. Introduction

The transmission tower-line system, which serves as the backbone of electricity delivery, plays a vital role in supporting the national economy. In China, the construction of transmission tower-line systems rated at 220 kV or higher has been ongoing since the 1950s. After several decades of service, towers located in coastal and industrial areas have experienced severe corrosion due to prolonged exposure to atmospheric pollutants and saline moisture. This corrosion leads to a reduction in cross-section and mechanical strength of steel components, increasing the risk of localized failure and posing a significant threat to the structural safety and integrity of the power grid [1,2,3]. Field investigations have reported corrosion damage in transmission towers. Liu et al. [4] and Shan et al. [2] surveyed 162 towers in Zhejiang, China, and found severe corrosion at tower feet due to water ponding and inadequate protective coatings. Huang [5] investigated towers in Guangzhou and reported more severe corrosion in components near factories and highways.
As corrosion progresses, it compromises both the cross-sectional geometry and mechanical properties of steel members [6,7,8]. Shi et al. [9] demonstrated experimentally that corrosion significantly reduces the load-bearing capacity of H-shaped beams, with flange thickness being the dominant factor. Xu et al. [10] found a linear relationship between bending capacity and remaining flange thickness in corroded channel beams and proposed a calculation method accordingly. Beaulieu et al. [11] investigated the compressive and bending capacities of angle steel members under varying corrosion levels and proposed prediction models based on international design standards [12,13,14]. Similarly, Zhang et al. [15,16] found that the axial compressive strength of Q345 angle steel declines as corrosion severity increases through fatigue and static tests. However, existing design codes such as GB 50017-2003 [17] insufficiently address the impact of corrosion on structural capacity.
Meanwhile, transmission towers are highly sensitive to wind loads, and failures under strong wind events—such as typhoons and hurricanes—are not uncommon [18,19]. Traditional wind-resistant design typically uses excessive top displacement or yield stress exceedance in critical members as failure criteria [20,21,22]. However, such approaches merely assess whether collapse occurs under a given wind load and do not reveal the progressive failure mechanisms or key failure paths. Structural failure mode identification can be used to determine the failure paths of the transmission tower structure under loading [23,24,25,26]. Edgar and Sordo [24] simulated the hurricane-induced damage to local electrical transmission towers using displacement-controlled pushover analyses. Fu and Li [27] employed an uncertainty analysis method to estimate the strength capacity of transmission towers and identify all potential failure modes. They found that uncertainties regarding material properties and section dimensions must be considered in failure modes identification. Zhang and Xie [28] estimated the load-bearing capacity of a transmission tower using static nonlinear buckling analysis and dynamic analysis, finding that the two methods predicted similar wind load capacities, while the failure modes and buckled members differed. Li et al. [26] employed progressive collapse analysis to assess the collapse-resistant capacity of a tube steel transmission tower, finding that the collapse begins with the horizontal bracing member near the waist. They also compared the effect of failure criterion on the collapse performance.
Despite extensive research on corrosion effects and wind-induced collapse separately, limited work has bridged these two aspects to understand how corrosion degrades the wind-resistant capacity of transmission towers and alters their collapse behavior. Corrosion weakens structural members, particularly diagonal and bracing elements critical for resisting wind-induced lateral forces, thereby increasing the likelihood of premature failure under wind loads. To address this research gap, this study assesses the effects of corrosion depth on the wind-induced collapse performance of an angle steel transmission tower. To achieve this, an investigation was conducted involving the corrosion distribution of 18 towers with varying service lives, vibration characteristics, failure modes of both corroded and uncorroded towers, as well as the identification of high-risk failure-prone members. The results suggest that the corrosion depth of members located beneath the lower cross-arm can be considered representative of the tower’s overall corrosion level. The diagonal member in this region has been identified as a high-risk failure component. Furthermore, strengthening these high-risk components can enhance the tower’s resistance to corrosion-induced failure.

2. Corrosion Investigation of Transmission Towers

2.1. Investigation Tower Details

The corrosion distributions and depths of eighteen angle steel transmission towers located near the coastline and industrial zone in Ningbo, China, were investigated. These areas experience more severe corrosion than other regions, primarily due to air pollution and salt vapor. The locations and detailed information of the investigated towers are provided in Figure 1 and Table 1, respectively. The service lifetimes of the towers vary from 3 to 35 years. The shortest distances to the industrial zone and coastline are 0 km and 0.4 km, respectively. The corrosion grades vary from C3 to CX, according to the corrosion classification map published by State Grid of China.

2.2. Investigation Procedures

Corrosion depth, a commonly used metric for assessing corrosion loss in steel members [2,9,10], is employed in this study. The corrosion depth of a tower member is defined as the difference between its original and remaining thickness. The original thickness of a member is obtained from the design documents. The remaining thickness of a member was measured using the HT180 ultrasonic thickness meter, manufactured by the Aipli company, Hangzhou, China, with a precision of ±0.05 mm.
To assess the corrosion distribution and depth across the tower, 100 randomly selected members of two towers, numbered W01~W02 (illustrated as Energies 18 02518 i003 in Figure 1), were measured for their remaining thickness. Three measurement points were taken for each member: two at the ends and one in the center. The remaining thickness of each member was calculated as the average of the three measuring points. According to the analysis in Section 5.1, the depths of the members around the lower cross-arm can represent the average corrosion of the tower. Five typical members distributed around this segment of sixteen towers, numbered L01 to L16 (illustrated as Energies 18 02518 i004 in Figure 1), were subsequently measured for their remaining thickness.
To obtain more accurate measurements of the remaining thickness using the ultrasonic thickness meter, the following guidelines should be followed: ① Set the ultrasound velocity to 5900 m/s, which is suitable for steel; ② polish the corroded members before measurement to ensure that cladding or rust is not included in the data; ③ position the ultrasonic thickness meter’s probe perpendicular to the surface of the angle steel member, and apply pressure with couplant covering the detection point.

3. Simulation of Progressive Collapse

3.1. FEM

An angle steel transmission tower, part of a 220 kV high-voltage transmission line, is selected as the subject for investigating the effects of corrosion on wind-induced collapse performance. The configuration of the tower is depicted in Figure 2. The tower has three cross-arms, a pinnacle height of 64.3 m, and a foundation measuring 12.27 m × 12.27 m. The tower members are constructed using equal-legged angles. The section dimensions of the leg, diagonal and horizontal members are shown in Figure 2. The leg members are constructed using Q420-grade steel, whereas the diagonal and horizontal members are constructed using Q345-grade steel. Material parameters such as density, yield strength, elastic modulus, and Poisson’s ratio are specified in the Chinese design code GB 50017-2017 [17]. For convenience, the tower is divided into 13 segments, as shown in Figure 2. Eight cables, including six conductors and two ground wires, are suspended from its three cross-arms, with two conductors on each arm and two ground wires at the end of the upper cross-arm. The conductors are 2×LGJ-630/45 with a unit weight of 2060 kg/km, while the ground wires are JLB20A-150, with a unit weight of 989.4 kg/km. The suspension insulators have a weight of 2800 kg. The cables and suspension insulators are not detailed in the FEM; instead, they are represented by concentrated masses at the hanging points. However, the loads acting on them, including dead loads and wind loads, are incorporated into the analysis.
The FEM of the transmission tower is illustrated in Figure 3. Each member of the tower is modeled using beam elements. Specifically, the Hughes–Liu beam element BEAM161, along with the PLASTIC_KINEMATIC (MAT_003) material model in LS-DYNA, is employed to model the tower members. The base nodes of the tower are fixed in all directions, and the bracing and redundant members are rigidly connected to the leg members. The loads applied to the FEM include: (1) the self-weight of the cables, insulators and tower; and (2) wind loads acting on both the cables and the tower. Since this study primarily focuses on the dynamic effects of wind loads on the tower, the wind loads on the cables are treated as static concentrated forces applied at the hanging points of the model. Geometric nonlinearity is incorporated into the analysis to account for second-order effects due to large deformations.

3.2. Member Corrosion Model

The thickness of a tower member decreases due to corrosion, resulting in a reduction in the member’s cross-section area, sectional modulus, and radius of inertia, which ultimately weakens the load-bearing capacity of the tower structure. In the FEM, the thickness of each corroded member is updated to the remaining thickness, and consequently, the aforementioned parameters are adjusted accordingly. In practice, corrosion typically forms a layer on the member, and the overall mass of the member remains nearly unchanged. To counteract the reduction in member mass resulting from the decrease in thickness, the steel density is adjusted to ensure that the mass of the member remains consistent before and after corrosion. Based on the corrosion investigation results of transmission towers (described in Section 5.1), it is assumed that all members of the corroded transmission tower are uniformly affected by corrosion, leading to a uniform reduction in the thickness of the tower members. In the progressive collapse analysis of the corroded transmission tower, the corrosion depth of each member ranges from 0 mm to 1.4 mm, with an interval of 0.2 mm, as shown in Table 2. According to the work of Chen [29] and Wu [30], the mechanical properties of a corroded steel member, such as the modulus of elasticity and yield strength, decreased by no more than 5% when the corrosion depth is less than 2 mm. Therefore, in the corroded model, the mechanical properties of steel are not adjusted.
Corrosion rates, defined as η = ( A 0 A ) / A 0 , for the leg and diagonal members at various corrosion depths, are presented in Table 3. Where A 0 is the design area of a member, and A is the residual area after corrosion. The corrosion rates of leg members with identical design thickness are grouped together. Diagonal members within each segment are made of angle steel with varying thicknesses. Therefore, the highest corrosion rates are shown in Table 3. In general, members with smaller design thicknesses exhibit higher corrosion rates under the same corrosion depth. At a corrosion depth of 0.6 mm, the corrosion rate of leg members in segments S01~S02, located above the middle cross-arm, is 5.8%, more than double the 2.3% rate observed in leg members of segments S11~S13, which are situated near the tower foot. This difference is attributed to the former’s thickness (10 mm) being nearly half that of the latter (24 mm). Additionally, at the same corrosion depth, the corrosion rate of diagonal members in segments S01~S02 is 11.6%, compared to 7.3% in segments S11~S13. It can be inferred that, under the same level of steel corrosion, the load-bearing capacity of tower members located higher up is significantly weakened compared to those near the tower foot. Furthermore, the load-bearing capacity of diagonal members is more significantly reduced than that of the leg members.

3.3. Wind Load Model

According to the DL/T 5154-2012 code [31], the time-varying wind load acting on the transmission tower is calculated using the following equation:
F w ( z , t ) = 0.5 ρ a μ s ( v z + v ˜ z ) 2 A s
where ρ a is the air density, (1.29 kg/m3), μ s is the drag coefficient (2.47 for the tower body and 2.29 for the cross-arm), v z is the mean wind speed at the height z, v ˜ z is the fluctuating component of wind speed. A s is the projected area of the tower in the windward direction. In the numerical simulation of fluctuating wind speed, the linear filtering method is applied in combination with the classical Davenport spectrum and the spatial coherence function [32]. Previous experimental and theoretical studies [33] indicated that the structural response is maximized when the incoming wind flow is perpendicular to the transmission line. Therefore, in the progressive collapse analysis presented in this study, the wind direction is assumed to be perpendicular to the transmission line. Figure 4 presents the time history and spectrum of the simulated wind speed at the tower top, with a design mean wind speed of 39 m/s at a height of 10 m, in which v is the time-varying wind speed, S v is the spectrum of v, t is the time and n is the frequency. The spectrum of the simulated fluctuating wind also aligns with the target Davenport spectrum, as shown in Figure 4b, confirming that the simulated fluctuating wind flow is reasonable.
In practical engineering, uncorroded structures are typically safe under design wind loads, whereas corroded structures may be at risk of collapse. Therefore, in the progressive collapse analysis of the tower with varying corrosion depths, the time-varying wind loads acting on the tower and the equivalent static wind loads applied on the cables must be adjusted by the same scale factor to facilitate the collapse, while the other static loads remain constant.

4. Methodologies for Progressive Collapse

The capacity-based failure criterion is employed to assess whether a member of a corroded transmission tower has failed. According to the DL/T 5154-2012 standard [31], tension-bending members in angle steel transmission towers are controlled by the strength and must satisfy Equation (2).
γ = N m A f ± M W f 1
Compressive bending members are controlled by stability and must satisfy Equation (3).
γ = N φ m N A f ± M W 1 0.8 N N EX f 1
where γ is the demand to capacity ratio, b t b t lim , m N = 1.0 , or b t lim < b t 380 f y , m N = 1.667 0.677 b / t b / t lim . For axial compression member, b t lim = 10 + 0.1 λ 235 f y , while for compression bending members, b t lim = 15 235 f y . b and t are width and thickness of the angle steel, respectively, λ is the slenderness. M and N are the bending moment and the axial force, respectively, A is the cross-sectional area, W is the sectional modulus, f is the design material strength, m and m N are strength reduction factor for components, φ is the stability factor accounting for the reduction in bearing capacity due to the instability, and related to the relative slenderness and the section classification. N EX = π 2 E A / 1.1 λ x 2 is the corrected Euler buckling load. The two equations are independent, which means that the component fails once one of them does not hold.
In the analysis of the progressive collapse of a corroded transmission tower, the birth–death element method [25,26,34] is employed to model member failure. A structural member is considered “failed” when it loses its load-bearing capacity; at that point, it no longer contributes to either the mass or stiffness matrices. However, simply removing the entire failed member is inadequate, as the remaining parts of the member may still interact with the surrounding structure and influence its dynamic behavior post-failure. To address this issue, Liu et al. [22] proposed dividing each tower member in the finite element model into three segments, removing only the central segment upon failure. This approach preserves the intact end segments of the failed member, allowing the residual stiffness and mass effects to be considered in subsequent dynamic analyses. This modeling strategy is adopted in the present study.
Incremental Dynamic Analysis (IDA) is used to simulate the progressive collapse process of towers with varying levels of corrosion. This method captures the dynamic effects associated with member failures and is implemented using the central difference method. The commercial software ANSYS/LS-DYNA (R12.0) is utilized for the IDA simulations. A user-defined failure criterion is embedded into the LS-DYNA solver via custom programming and is integrated with the post-processing software LSPREPOST (R3.2). Specifically, during each time step of the nonlinear explicit dynamic analysis, every element in the transmission tower is evaluated against the defined failure criterion. This evaluation considers internal forces, as well as the geometric and material properties of each member. Once an element meets the failure condition, it is removed from the model, and the finite element input file is updated for the next analysis step.

5. Results and Discussion

5.1. Corrosion Characteristics

Figure 5 illustrates the corrosion depths of the 100 examined members from towers W01 and W02. The heights of the towers are 39.2 m, 38 m, respectively. Overall, the corrosion depth is relatively uniform from the root to the top of each tower. After 30 years of service, the zinc coating on the members of tower W01 and W02 has failed, and the steel is severely corroded. To further illustrate the effect of member height on steel corrosion, Table 4 presents the mean corrosion depths of the leg, diagonal, and all members located at the tower foot, middle, and head. The mean corrosion depths listed for all members include the leg, diagonal, and auxiliary members. Generally, steel corrosion in the leg and diagonal members is less severe than in the auxiliary members, as the mean corrosion depths for all members are greater than those for the leg and diagonal members. Corrosion depths in tower members decrease with height. For both towers, the members located at the tower foot exhibit larger corrosion depths than those at the tower head. It should be noted that, after 30 years of service for towers W-01 and W-02, members in the middle of the tower exhibit corrosion depths that fall between those of tower foot and tower head. Since the leg and diagonal members are the primary load-bearing members, their corrosion significantly affects the tower’s structural integrity. Therefore, the corrosion depths of the leg and diagonal members located in the tower middle, specifically under the lower cross-arm, can be regarded as representative of the tower’s overall corrosion depth. This approach may be conservative for the members at the foot and non-conservative for the members at the head. However, it will not overestimate the load-bearing capacity of the tower for the following reasons. The members located at the foot have relatively larger thicknesses compared to the other members. Their corrosion rate is comparatively lower at the same corrosion depth, as shown in Table 3, leading to less loss in load-bearing capacity. Members at the tower head have lower demand-to capacity ratio than the other members; a slight overestimation of corrosion depth will yield conservative results. Thus, in the corrosion depth investigation of towers L01 to L16, five leg or diagonal members located round the lower cross-arm will be considered typical members, with their mean corrosion depth regarded as representative of the overall corrosion depth of the tower.
Table 5 presents the mean corrosion depths for the 18 examined transmission towers. The corrosion depth of a steel member across different corrosion grades can be predicted using the GB/T 19292.2 [35] standard (Model 1) and a power-law function model (Model 2), as illustrated by Panchenko and Marshakov [36]. The predicted corrosion depths for the towers, based on these two methods, are also presented in Table 5, along with the corresponding errors compared to the examined values. A higher corrosion grade and a longer service life can result in increased corrosion depths, with corrosion grade having a more significant impact. For instance, towers L14 and L15, both classified under corrosion grade CX, with service durations of 35 years and 30 years, respectively, exhibit corrosion depths of 0.83 mm and 0.94 mm. This indicates a significant loss of load-bearing capacity in members with smaller design thickness. However, tower L09, classified under corrosion grade C5, with a comparable service duration of 32 years, has a corrosion depth of only 0.44 mm, nearly half that of tower L14 and L15. Compared to the examined corrosion depths, the corrosion depths predicted by Model 2 are slightly larger, while those predicted by Model 1 are even greater. As the corrosion grade increases and service duration lengthens, the predicted values tend to align more closely with the examined values. This may be attributed to the failure of the zinc coating after a longer service duration in higher corrosion grades, leading to more accurate predictions. This also suggests that, for the corrosion-resistant design of angle steel transmission towers, corrosion depth can be effectively predicted using Model 2.

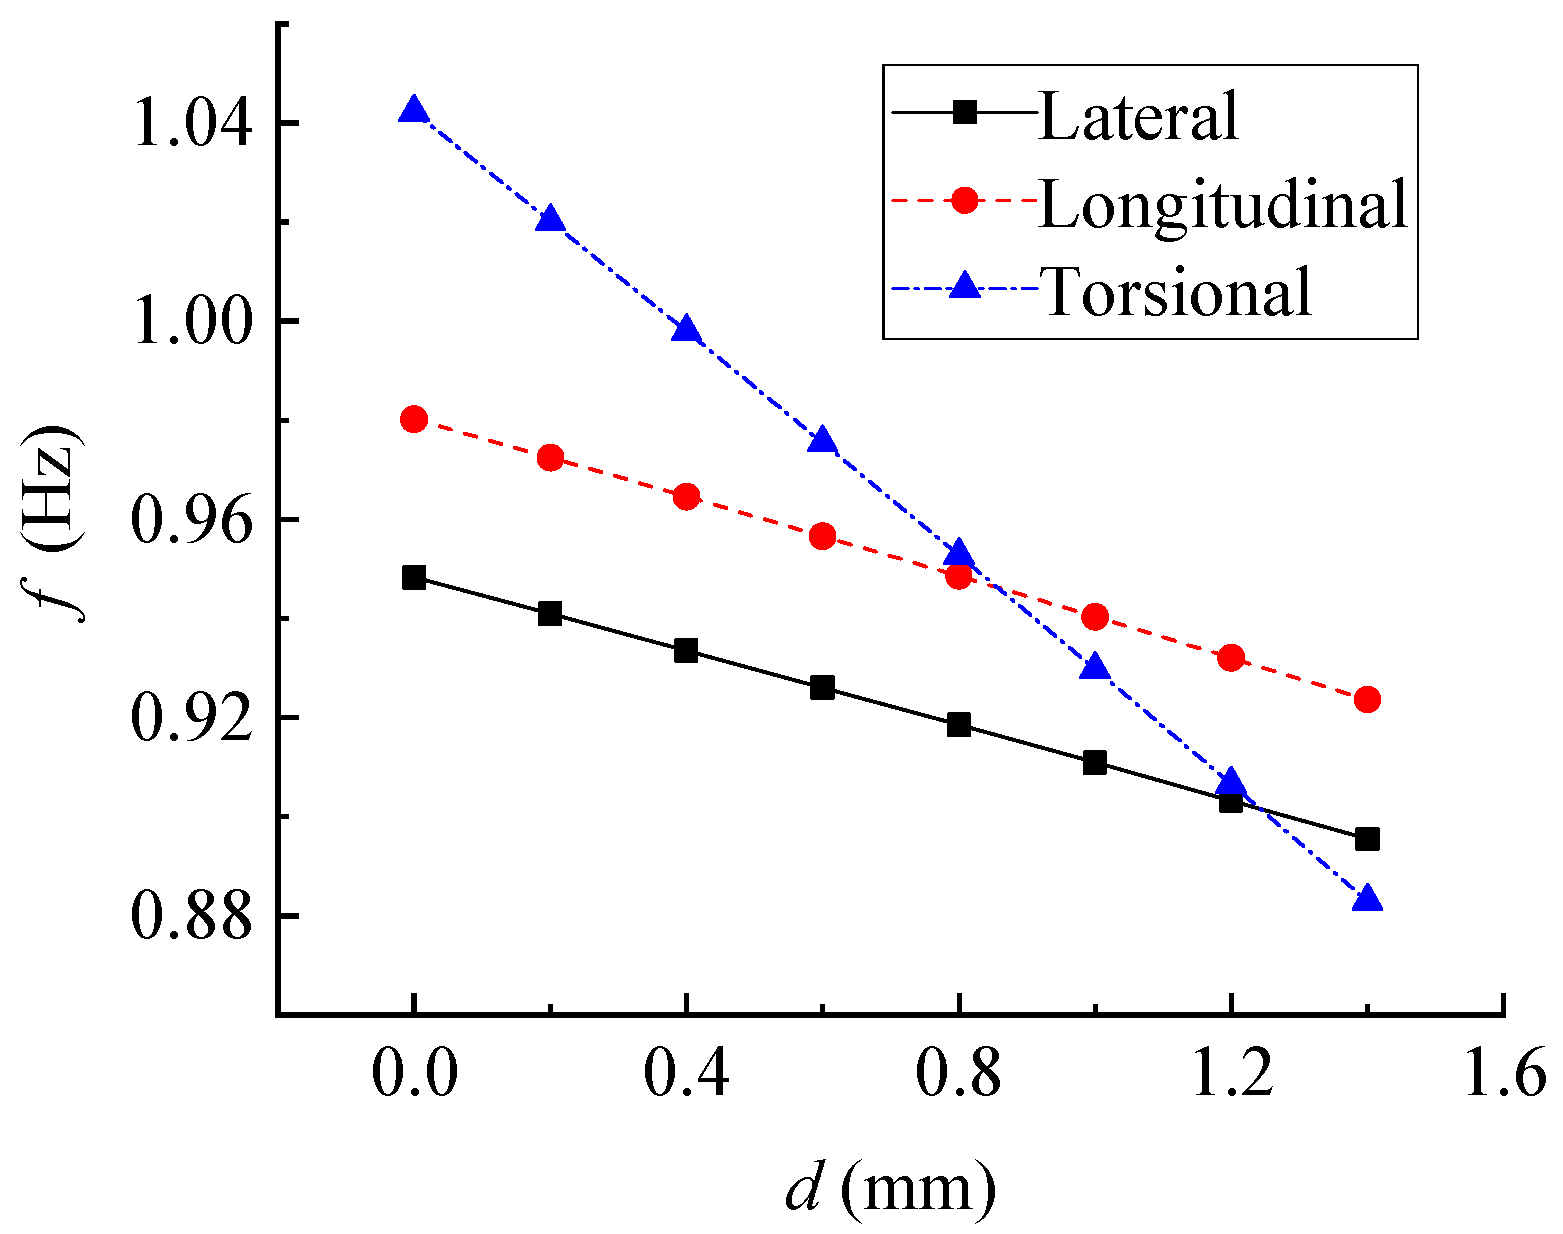
5.2. Vibration Features of Corroded Tower

Figure 6 illustrates the variation in the first natural frequencies (f) of the transmission tower in the lateral, longitudinal, and torsional directions, as the corrosion depth (d) ranges from 0 mm to 1.4 mm. The natural frequencies of the corroded tower in the three directions decrease at different rates. The torsional frequency exhibits the most significant decline, followed by the longitudinal and lateral frequencies. When the corrosion depth reaches 1.2 mm, the tower’s natural frequency in the torsional direction decreases by 15.28%, nearly falling below the other two frequencies and becoming the tower’s dominant frequency. This is because the torsional stiffness of the tower is primarily provided by the diagonal members, which experience a much greater loss of stiffness when subjected to steel corrosion. It should also be noted that when the torsional frequency becomes the dominant frequency of a transmission tower, which should be avoided in design practice, the tower will experience significant torsional displacement under strong winds, consequently increasing uneven tension in the transmission lines and the risk of line breakage. However, corrosion does not significantly reduce the natural frequencies in the lateral and longitudinal directions, which decrease by 5.56% and 5.78%, respectively. This is because the lateral and longitudinal stiffnesses are primarily provided by the leg members, which experience a smaller loss in stiffness when subjected to steel corrosion.

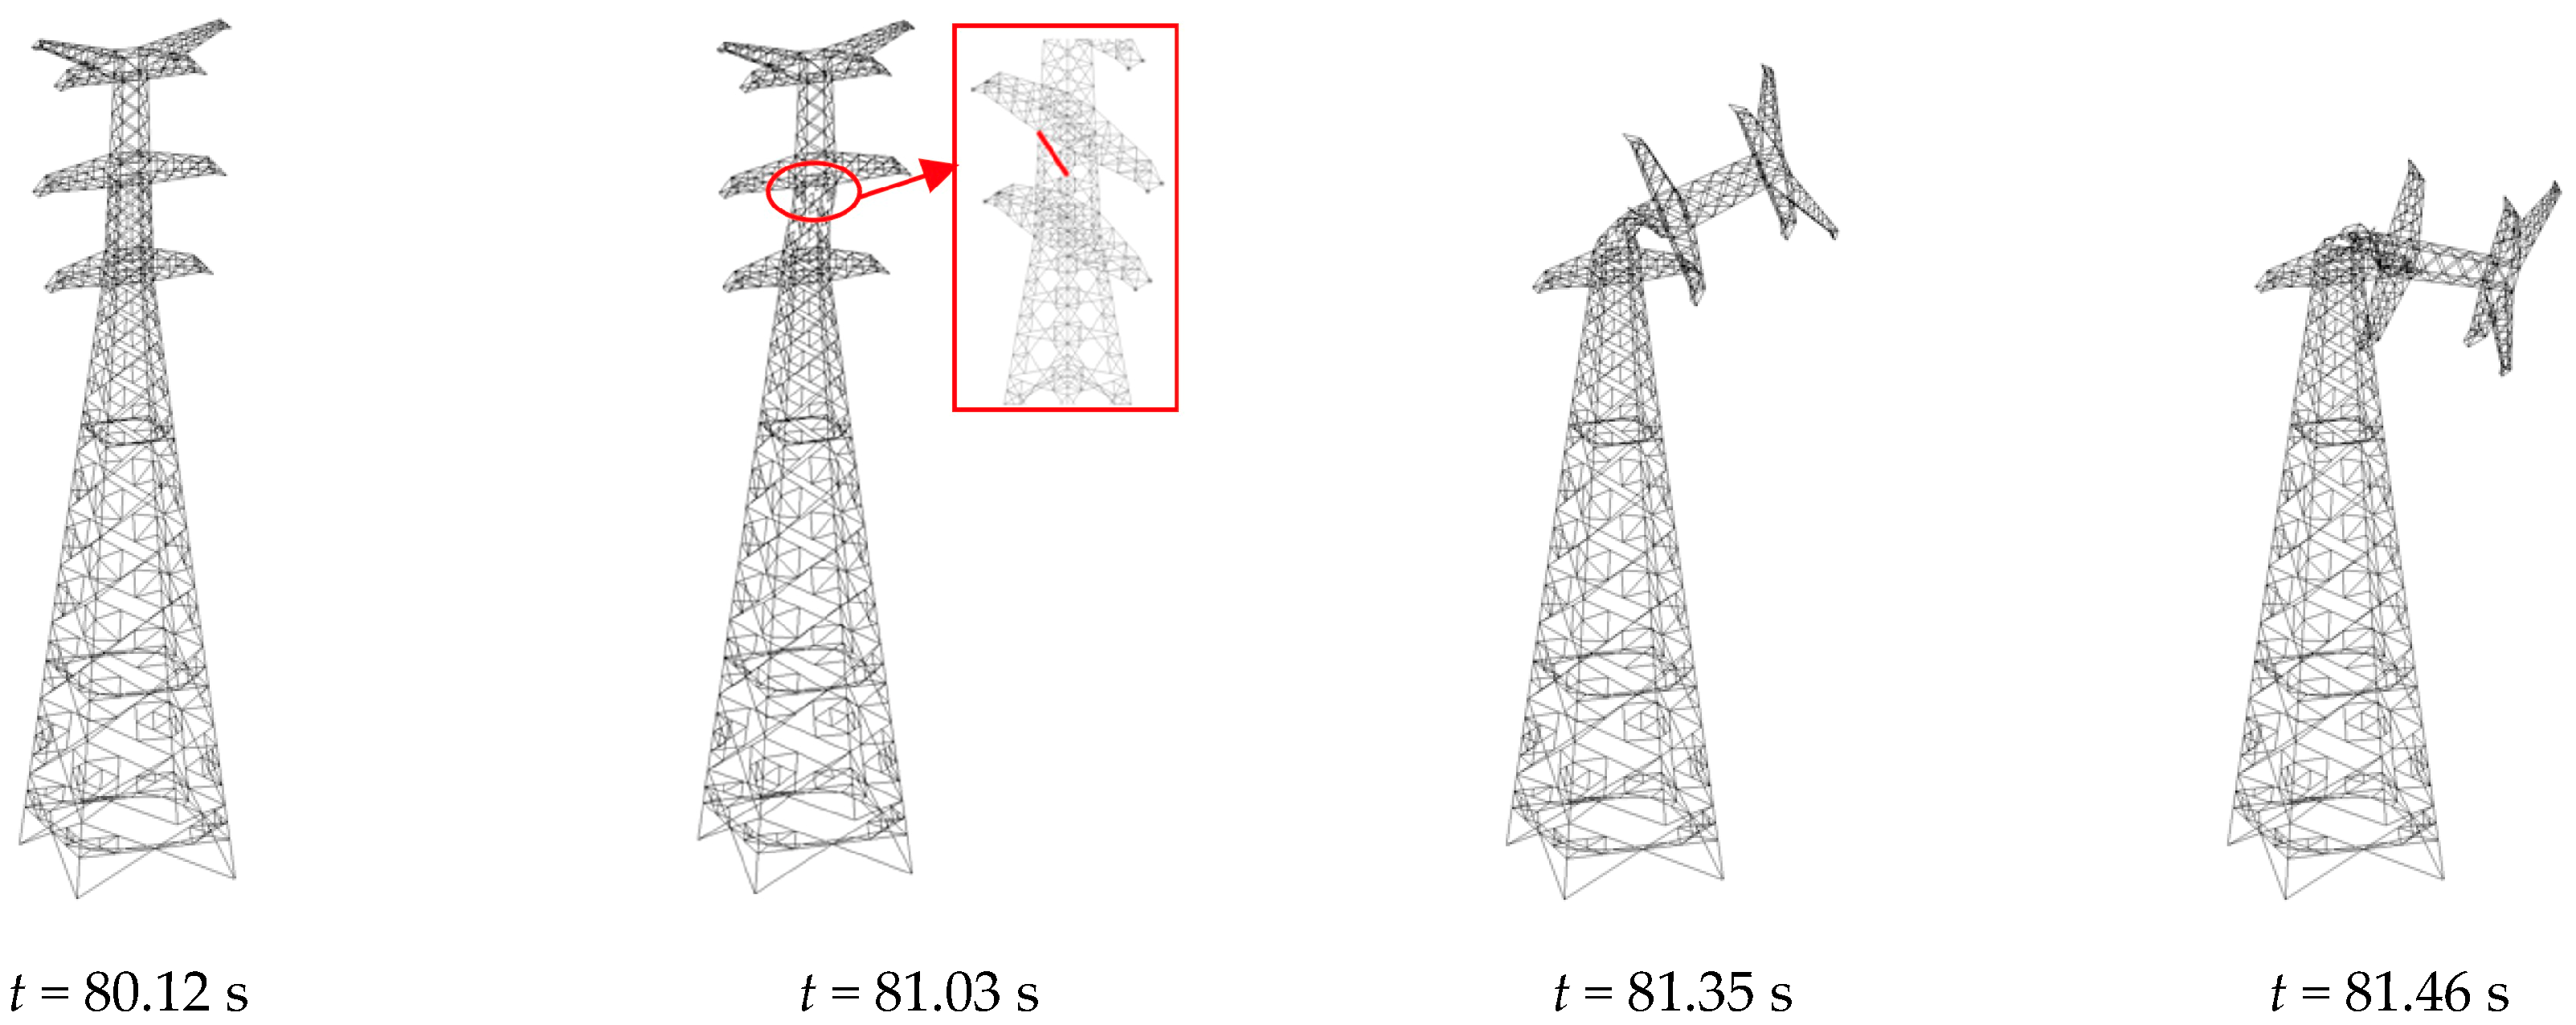
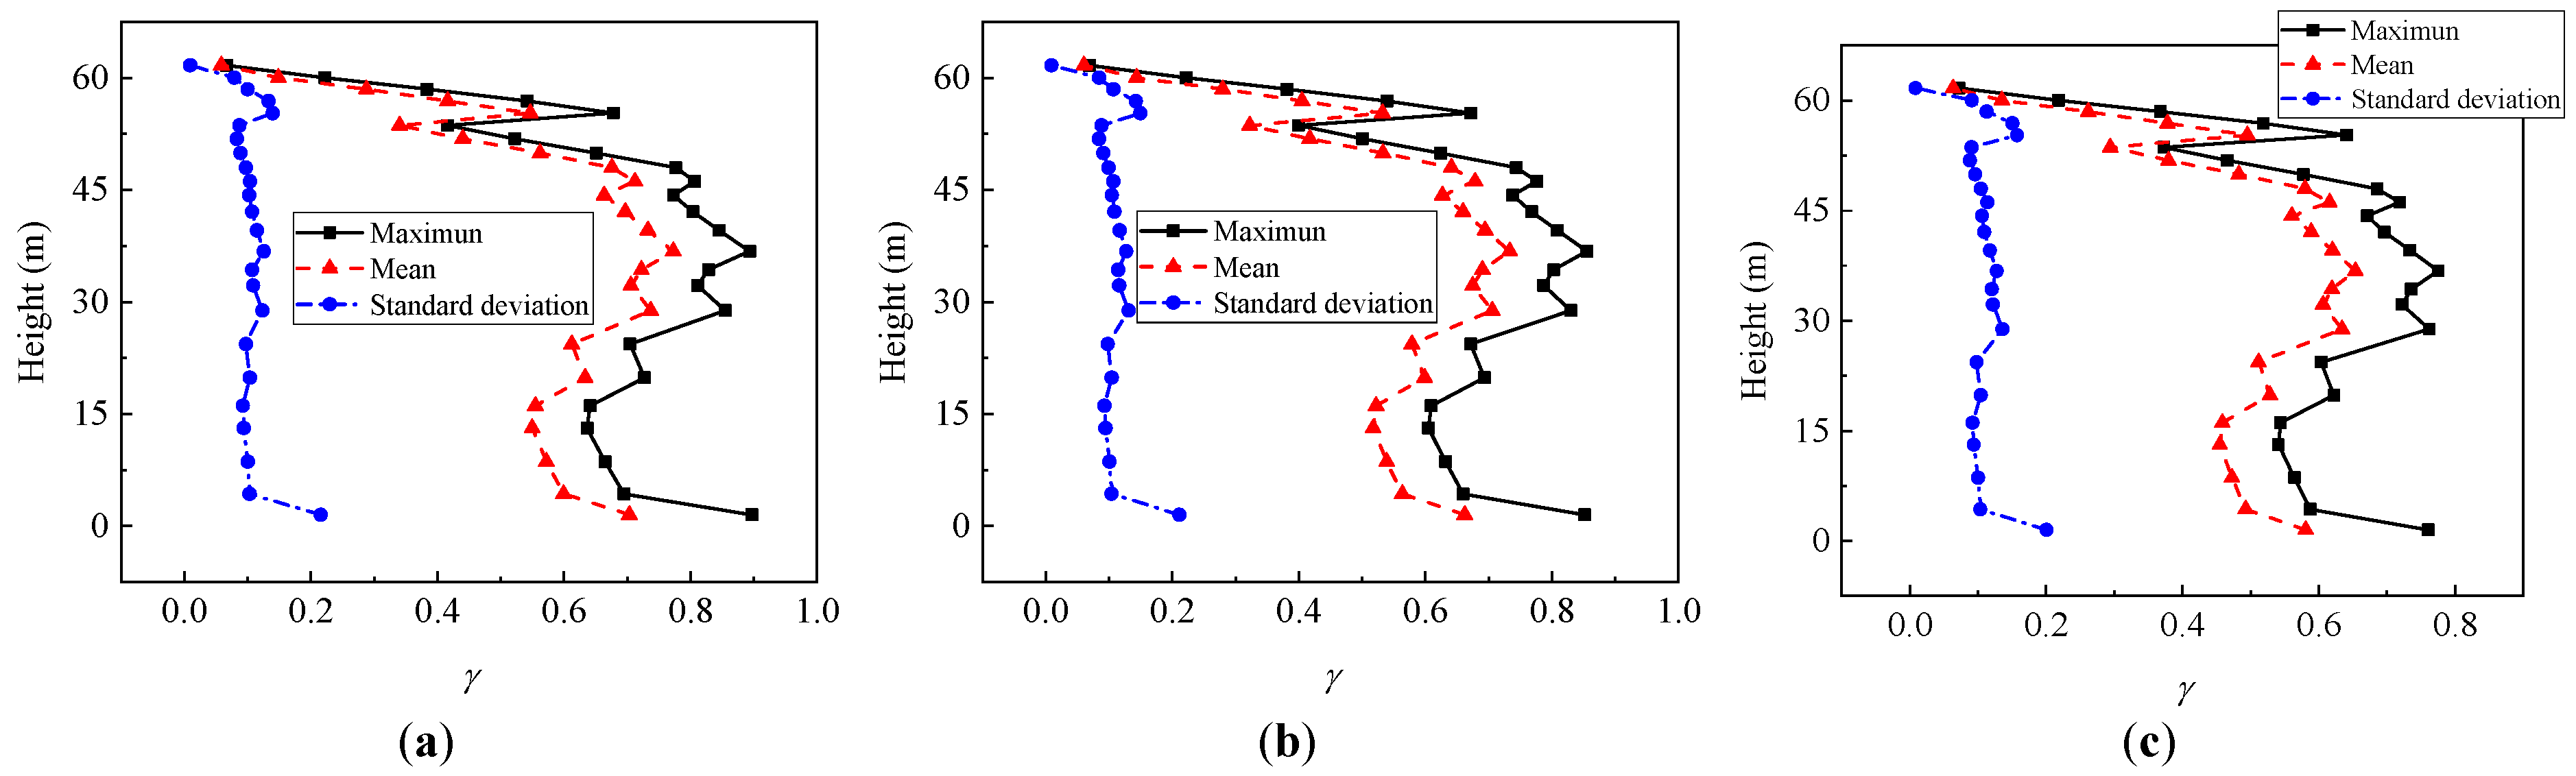
5.3. Progressive Collapse of Uncorroded Transmission Tower

Figure 7 depicts the development of deformation in the uncorroded tower as it undergoes collapse. It should be noted that time t is used to identify the failure sequence of the tower members. The uncorroded tower collapsed at a mean wind speed of 42 m/s, which exceeds the design mean wind speed of 39 m/s. The first member to fail is a diagonal member located at a height of 52 m, between the middle and lower cross-arm, as highlighted in Figure 7. This failure is due to compression buckling. The sudden loss of capacity in the member results in dynamic effects on the structure and a redistribution of internal forces, which consequently induces the failure of neighboring members. Subsequently, the neighboring diagonal member loses its capacity, followed by the sequential failure of the leg and diagonal members. This failure initiates in the segment between the middle and lower cross-arm and propagates to the segment below the lower cross-arm. The wind-induced displacement response increases dramatically over time.
The larger values of demand to capacity ratios (γ) of leg and diagonal members, as defined in Equations (2) and (3), before the collapse, in terms of maximum value, mean value and standard deviation, are shown in Figure 8. The location of potential failure risk can be easily identified by examining the curve of the maximum values in Figure 8. For the leg members, those located at the tower root and at a height of 37.5 m, below the lower cross-arms, exhibit larger values of γ. For the diagonal members, those located at the height of 52 m, where the first failure occurred, exhibit larger values of γ. Furthermore, the diagonal members exhibit larger values of γ when the tower is subjected to strong winds. This indicates that the weakest members are located in the segment between the middle and lower-cross-arms, and that the diagonal members experience greater risk when subjected to strong winds.

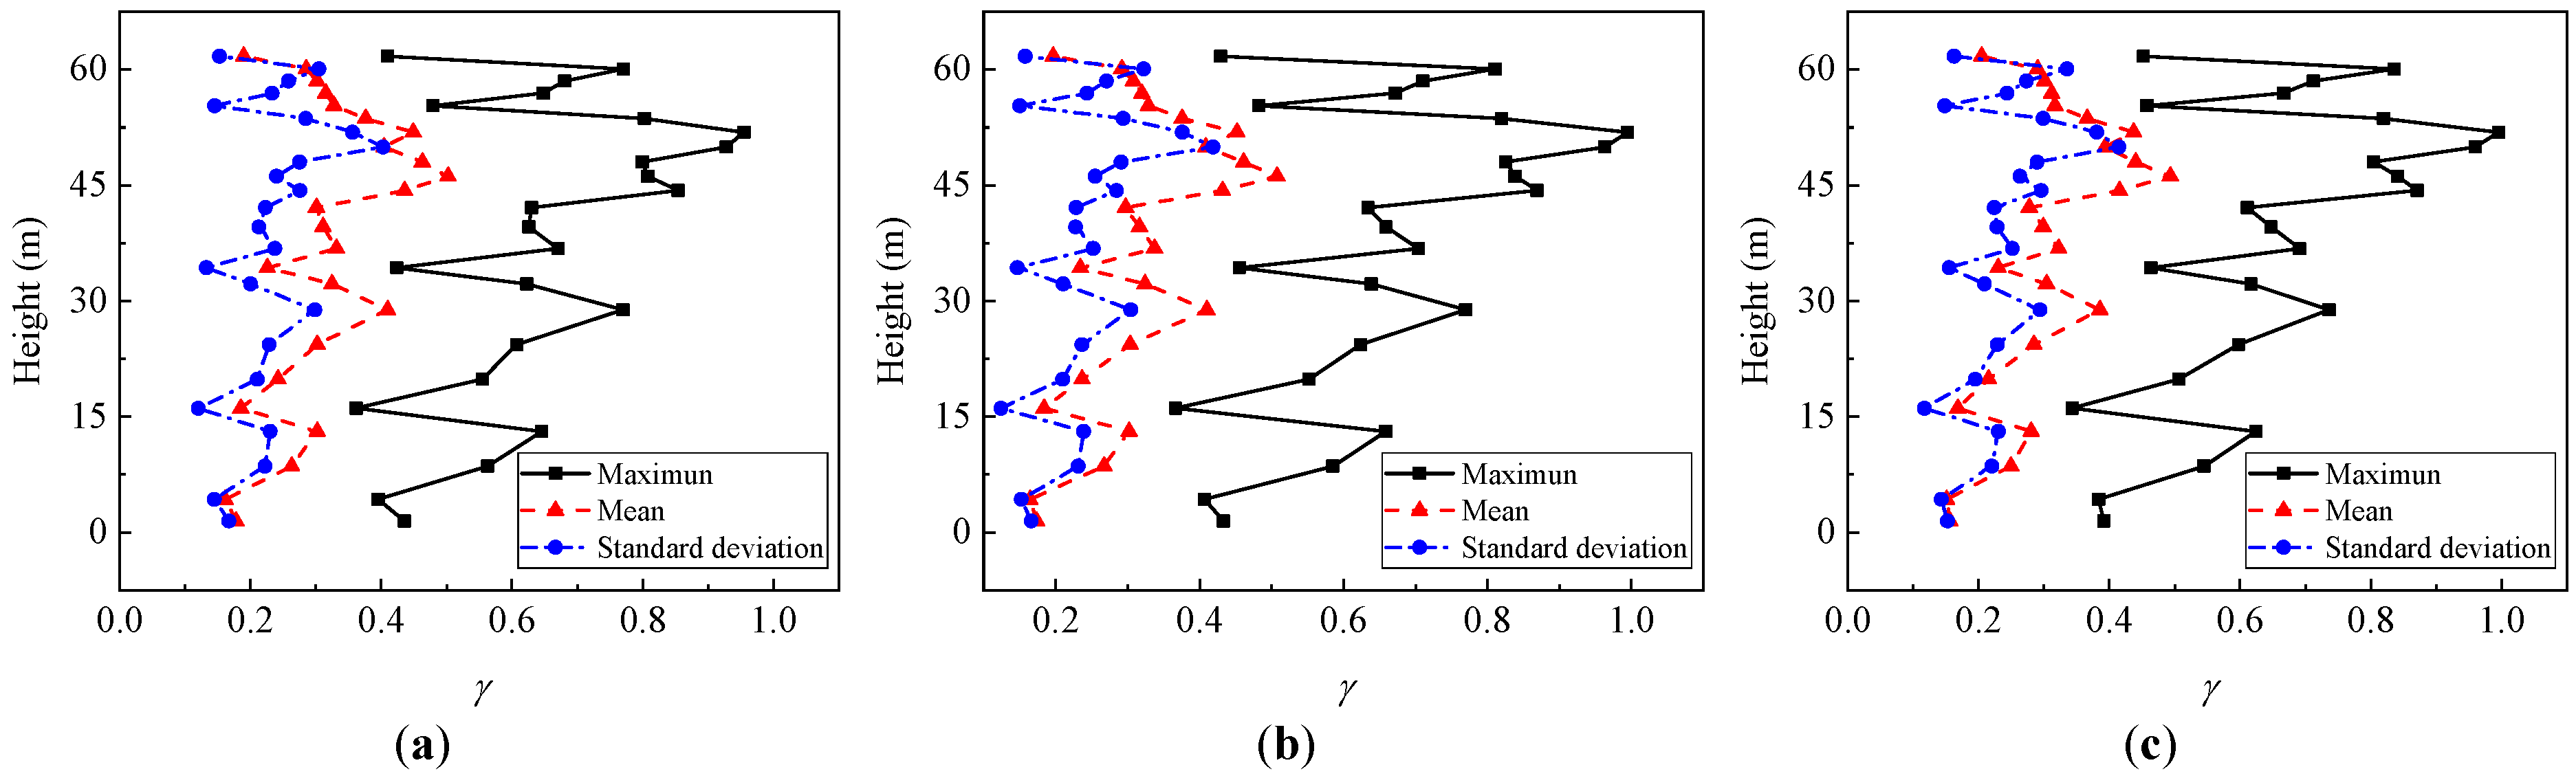
5.4. Progressive Collapse of Corroded Transmission Tower

Figure 9 illustrates the development of deformation in the corroded transmission tower as it undergoes collapse. It should be noted that as the corrosion depth ranges from 0.2 mm to 1.4 mm, the deformation model and process remains unchanged. The first member to fail still appears on the diagonal member at the height of 52 m, between the middle and lower cross-arms, consistent with the uncorroded tower. This indicates that both the deformation process and the first member to fail do not change with increasing corrosion depth. However, the failure segment, located between the middle and lower cross-arm, is more concentrated compared to that of the uncorroded tower.
The larger values of demand to capacity ratios (γ) for the leg and diagonal members of the tower, with corrosion depth of 0.4 mm, 0.8 mm, and 1.2 mm, before the collapse, are shown in Figure 10 and Figure 11, respectively. With increasing corrosion depth, γ in the leg members decreases due to the redistribution of the internal forces within the structure, while γ in the diagonal members changes little. The γ of the diagonal member at the height of 52 m experiences high internal stress, regardless of changes in corrosion depth. It indicates that diagonal members located between the middle and lower cross-arms are the weakest members, and their γ will not change with increasing corrosion depth. In other words, in the corrosion resistant design of the angle steel transmission tower, the diagonal member at a height of 52 m should be reinforced.
Figure 12 illustrates the mean wind speed causing structural collapse as a function of corrosion depth, ranging from 0 to 1.4 mm. The mean wind speed decreases approximately linearly as the corrosion depth increases. For each 0.2 mm increase in corrosion depth, the mean wind speed decreases by 1 m/s. When the corrosion depth reaches 0.8 mm, the mean wind speed equals the design mean wind speed of 39 m/s. Therefore, the critical corrosion depth for the angle steel transmission tower is 0.8 mm. The redundant wind-resistant design ensures that the tower can withstand the design mean wind speed even under slight corrosion.
The effect of reinforcing the diagonal members at the height of 52 m, which exhibit the highest risk of failure due to corrosion and strong wind, is illustrated in Figure 12, where the diagonal members are upgraded from L75×6 to L90×6. In the reinforced tower, the first member to fail is the same diagonal member as in the prototype tower. The progressive collapse remains unaffected. The critical corrosion depth was improved to 1.0 mm.

6. Conclusions

This study systematically investigated the impact of corrosion depth on the wind-induced collapse performance of angle steel transmission towers by combining field survey data with numerical simulation. Through the corrosion assessment of 18 towers and the establishment of FEMs, the progressive collapse behavior and dynamic characteristics of both corroded and uncorroded towers were analyzed in detail.
The corrosion depth across the towers was slightly uneven. The corrosion depth of members below the lower cross-arm can effectively represent the overall corrosion condition of the tower. Torsional natural frequency of the angle steel tower is the most sensitive to corrosion due to the critical role of diagonal members, and this reduction in frequency can serve as an early warning indicator of structural degradation. Additionally, the collapse analysis highlighted that even moderate levels of corrosion (e.g., 0.8 mm) can reduce the tower’s wind resistance to below the design threshold, potentially compromising safety under extreme weather conditions. The diagonal member below the lower cross-arm is identified as a high-risk failure component. Strengthening the high-risk member (e.g., upgrading from L75×6 to L90×6) can effectively improve the tower’s tolerance to corrosion, raising the critical corrosion depth and thus enhancing service reliability. However, since this study only examines the effect of corrosion depth on T-shaped transmission towers, the impact of corrosion depth on other types of transmission towers should be explored in future research.

Author Contributions

Conceptualization, Z.T., J.Y. and L.Z.; methodology, Z.L. and X.Z.; investigation, Z.T. and X.Z.; writing—original draft preparation, Z.T. and J.Y.; writing—review and editing, Z.T., J.Y. and Z.L. All authors have read and agreed to the published version of the manuscript.

Funding

This research was funded by Zhejiang Provincial Natural Science Foundation of China (No. LTGS23E080003). The authors also appreciate the strong support of the Nanxun Scholars Program for Young Scholars of ZJWEU under Grant RC2022020824. The opinions and statements do not necessarily represent those of the sponsors.

Data Availability Statement

Data are contained within the article.

Conflicts of Interest

Author Jianfeng Yao was employed by the company Energy Engineering Group Zhejiang Power Design Institute Co., Ltd. Author Xing Zhou was employed by the company Hangzhou Jiangnan Talent Service Co., Ltd. Author Ligang Zhang was employed by the company Zhejiang Huayun Power Engineering Design Consulting Co., Ltd. The remaining authors declare that the research was conducted in the absence of any commercial or financial relationships that could be construed as a potential conflict of interest.

References

  1. Teng, Y.; Nie, Y.; Miao, C.; Chen, G.; Jin, S. Investigation on the corrosion of transmission towers in China. J. Anhui Electr. Eng. Prof. Tech. Coll. 2020, 25, 47–52. [Google Scholar]
  2. Shan, K.; Li, T.; Yan, C.; Hu, J.; Xia, J. Influence of tower feet corrosion on safety performance of power transmission tower. Corros. Prot. 2021, 24, 3. [Google Scholar]
  3. Zhou, J.; He, X.; Sun, K.; Huang, S.; Cai, W. Research of corrosion and monitoring protection of transmission lines in serious corrosion area. Corros. Prot. 2021, 42, 1–8. [Google Scholar]
  4. Liu, S.; Hu, X.; Gao, S.; Fan, Z. Causes and treatment scheme of tower foot corrosion of a 500 kV transmission tower. Corros. Prot. 2013, 34, 1026–1029. [Google Scholar]
  5. Huang, X. Study on the Natural Vibration Period of the Bucket Transmission Tower and the Overall Safety Performance While Corrosion. Master’s Thesis, South China University of Technology, Guangzhou, China, 2017. [Google Scholar]
  6. Meda, A.; Mostosi, S.; Rinaldi, Z.; Riva, P. Experimental evaluation of the corrosion influence on the cyclic behavior of RC columns. Eng. Struct. 2014, 76, 112–123. [Google Scholar] [CrossRef]
  7. Fernandez, I.; Bairán, J.M.; Marí, A.R. Corrosion effects on the mechanical properties of reinforcing steel bars. Fatigue and σ–ε behavior. Constr. Build. Mater. 2015, 101, 772–783. [Google Scholar] [CrossRef]
  8. Wang, Y.; Xu, S.; Wang, H.; Li, A. Predicting the residual strength and deformability of corroded steel plate based on the corrosion morphology. Constr. Build. Mater. 2017, 152, 777–793. [Google Scholar] [CrossRef]
  9. Shi, W.; Tong, L.; Chen, Y.; Li, Z.; Shen, K. Experimental study on influence of corrosion on behavior of steel material and steel beams. J. Build. Struct. 2012, 33, 53–60. [Google Scholar]
  10. Xu, S.; Zhang, H.; Bai, Y. Study on bending performance of corroded channel steel beams. J. Exp. Mech. 2019, 34, 1061–1067. [Google Scholar]
  11. Beaulieu, L.V.; Legeron, F.; Langlois, S. Compression strength of corroded steel angle members. J. Constr. Steel Res. 2019, 66, 1366–1373. [Google Scholar] [CrossRef]
  12. CSA S16-09; Design of Steel Structures. Canadian Standards Association, CSA Group: Singapore, 2009.
  13. AICS 2005; Steel Construction Manual (13th ed.). American Institute of Steel Construction: Chicago, IL, USA, 2005.
  14. ASCE 10-97; Design of Latticed Steel Transmission Structures. American Society of Civil Engineers: Reston, VA, USA, 1997.
  15. Zhang, C.; Fan, W.; Li, Z. Effects of corrosion on fatigue property of Q345 equal angles. Eng. Mech. 2013, 30, 211–218. [Google Scholar]
  16. Zhang, C.; Fan, W.; Li, Z. Quasi-static test of Q345 equal-angles in corrosion environment. Eng. Mech. 2014, 31, 53–62. [Google Scholar]
  17. GB 50017-2017; Standard for Design of Steel Structures. China Architecture & Building Press: Beijing, China, 2017.
  18. Chen, P.; Cao, B.; Luo, X.; Chen, R. Operation data and feature analysis of the main natural disasters of power network in China. Electr. Power 2014, 47, 57–61. [Google Scholar]
  19. Tu, Z.; Yao, J.; Xu, H.; Zhong, W.; Lou, W. Influence of refined wind load parameters and wind-loading mode on wind-induced responses of a long cross-arm angle-steel transmission tower. Int. J. Struct. Stab. Dyn. 2022, 22, 2250074. [Google Scholar] [CrossRef]
  20. Chen, Z.; Tang, K.; Zhou, Q.; Zhang, W.; Chen, J. Calculation models of ultimate bearing capacity and failure modes for transmission tower under wind load. J. Archit. Civ. Eng. 2018, 35, 47–55. [Google Scholar]
  21. Wei, W.; Zhou, X.; Deng, C.; Ji, B. Research on failure and collapse of transmission tower line system under downburst action based on energy method. J. Archit. Civ. Eng. 2020, 37, 73–80. [Google Scholar]
  22. Liu, S.; Huang, Z.; Yang, Y.; Zhang, C.; Gao, Q. Ultimate bearing capacity analysis of transmission tower-line system under equivalent static typhoon wind load. J. Disaster Prev. Mitig. Eng. 2020, 40, 757–763+778. [Google Scholar]
  23. Wang, W.; Li, H.; Tian, L. Progressive collapse analysis of transmission tower-line system under earthquake. Adv. Steel Constr. 2013, 9, 161–172. [Google Scholar]
  24. Edgar, T.; Sordo, E. Structural behaviour of lattice transmission towers subjected to wind load. Struct. Infrastruct. Eng. 2017, 13, 1462–1475. [Google Scholar] [CrossRef]
  25. Tian, L.; Pan, H.; Qiu, C.; Ma, R.; Yu, Q. Wind-induced collapse analysis of long-span transmission tower–line system considering the member buckling effect. Adv. Struct. Eng. 2019, 22, 30–41. [Google Scholar] [CrossRef]
  26. Li, Y.; Chen, Y.; Shen, G.; Lou, W.; Zhao, W.; Wang, H. Member capacity-based progressive collapse analysis of transmission towers under wind load. Wind. Struct. 2021, 33, 317–329. [Google Scholar]
  27. Fu, X.; Li, H. Uncertainty analysis of the strength capacity and failure path for a transmission tower under a wind load. J. Wind. Eng. Ind. Aerodyn. 2018, 173, 147–155. [Google Scholar] [CrossRef]
  28. Zhang, J.; Xie, Q. Failure analysis of transmission tower subjected to strong wind load. J. Constr. Steel Res. 2019, 160, 271–279. [Google Scholar] [CrossRef]
  29. Chen, Y. Life-Cycle Design and Time-Dependent Reliability in Corrosive Environment. Ph.D. Thesis, Southeast University, Nanjing, China, 2021. [Google Scholar]
  30. Wu, C. The Prediction of Corrosion Behavior of Coated Steel and Research on the Performance of Corroded Steel Members. Master’s Thesis, Southeast University, Nanjing, China, 2022. [Google Scholar]
  31. DL/T 5154-2012; Technical Code for the Design of Tower and Pole Structures of Overhead Transmission Line. China Planning Press: Beijing, China, 2012.
  32. Davenport, A.G. The spectrum of horizontal gustiness near the ground in high winds. Q. J. R. Meteorol. Soc. 1961, 87, 194–211. [Google Scholar] [CrossRef]
  33. Liang, S.; Zou, L.; Wang, D.; Cao, H. Investigation on wind tunnel tests of a full aeroelastic model of electrical transmission tower-line system. Eng. Struct. 2015, 85, 63–72. [Google Scholar] [CrossRef]
  34. Zhang, Z.; Li, H.; Li, G.; Wang, W.; Tian, L. The numerical analysis of transmission tower-line system wind-induced collapsed performance. Math. Probl. Eng. 2013, 2013, 413275. [Google Scholar] [CrossRef]
  35. GB/T 19292.1-2018; Corrosion of Metals and Alloys-Corrosivity of Atmospheres—Part 1: Classification, Determination and Estimation. Standard Press of China: Beijing, China, 2018.
  36. Panchenko, Y.; Marshakov, A. Long-term prediction of metal corrosion losses in atmosphere using a power-linear function. Corros. Sci. 2016, 109, 217–229. [Google Scholar] [CrossRef]
Figure 1. Sites of the corroded transmission towers: Energies 18 02518 i001 represents the towers of which 100 members distributed from tower foot to tower head were investigated; Energies 18 02518 i002 represents the towers of which 5 typical members were investigated.
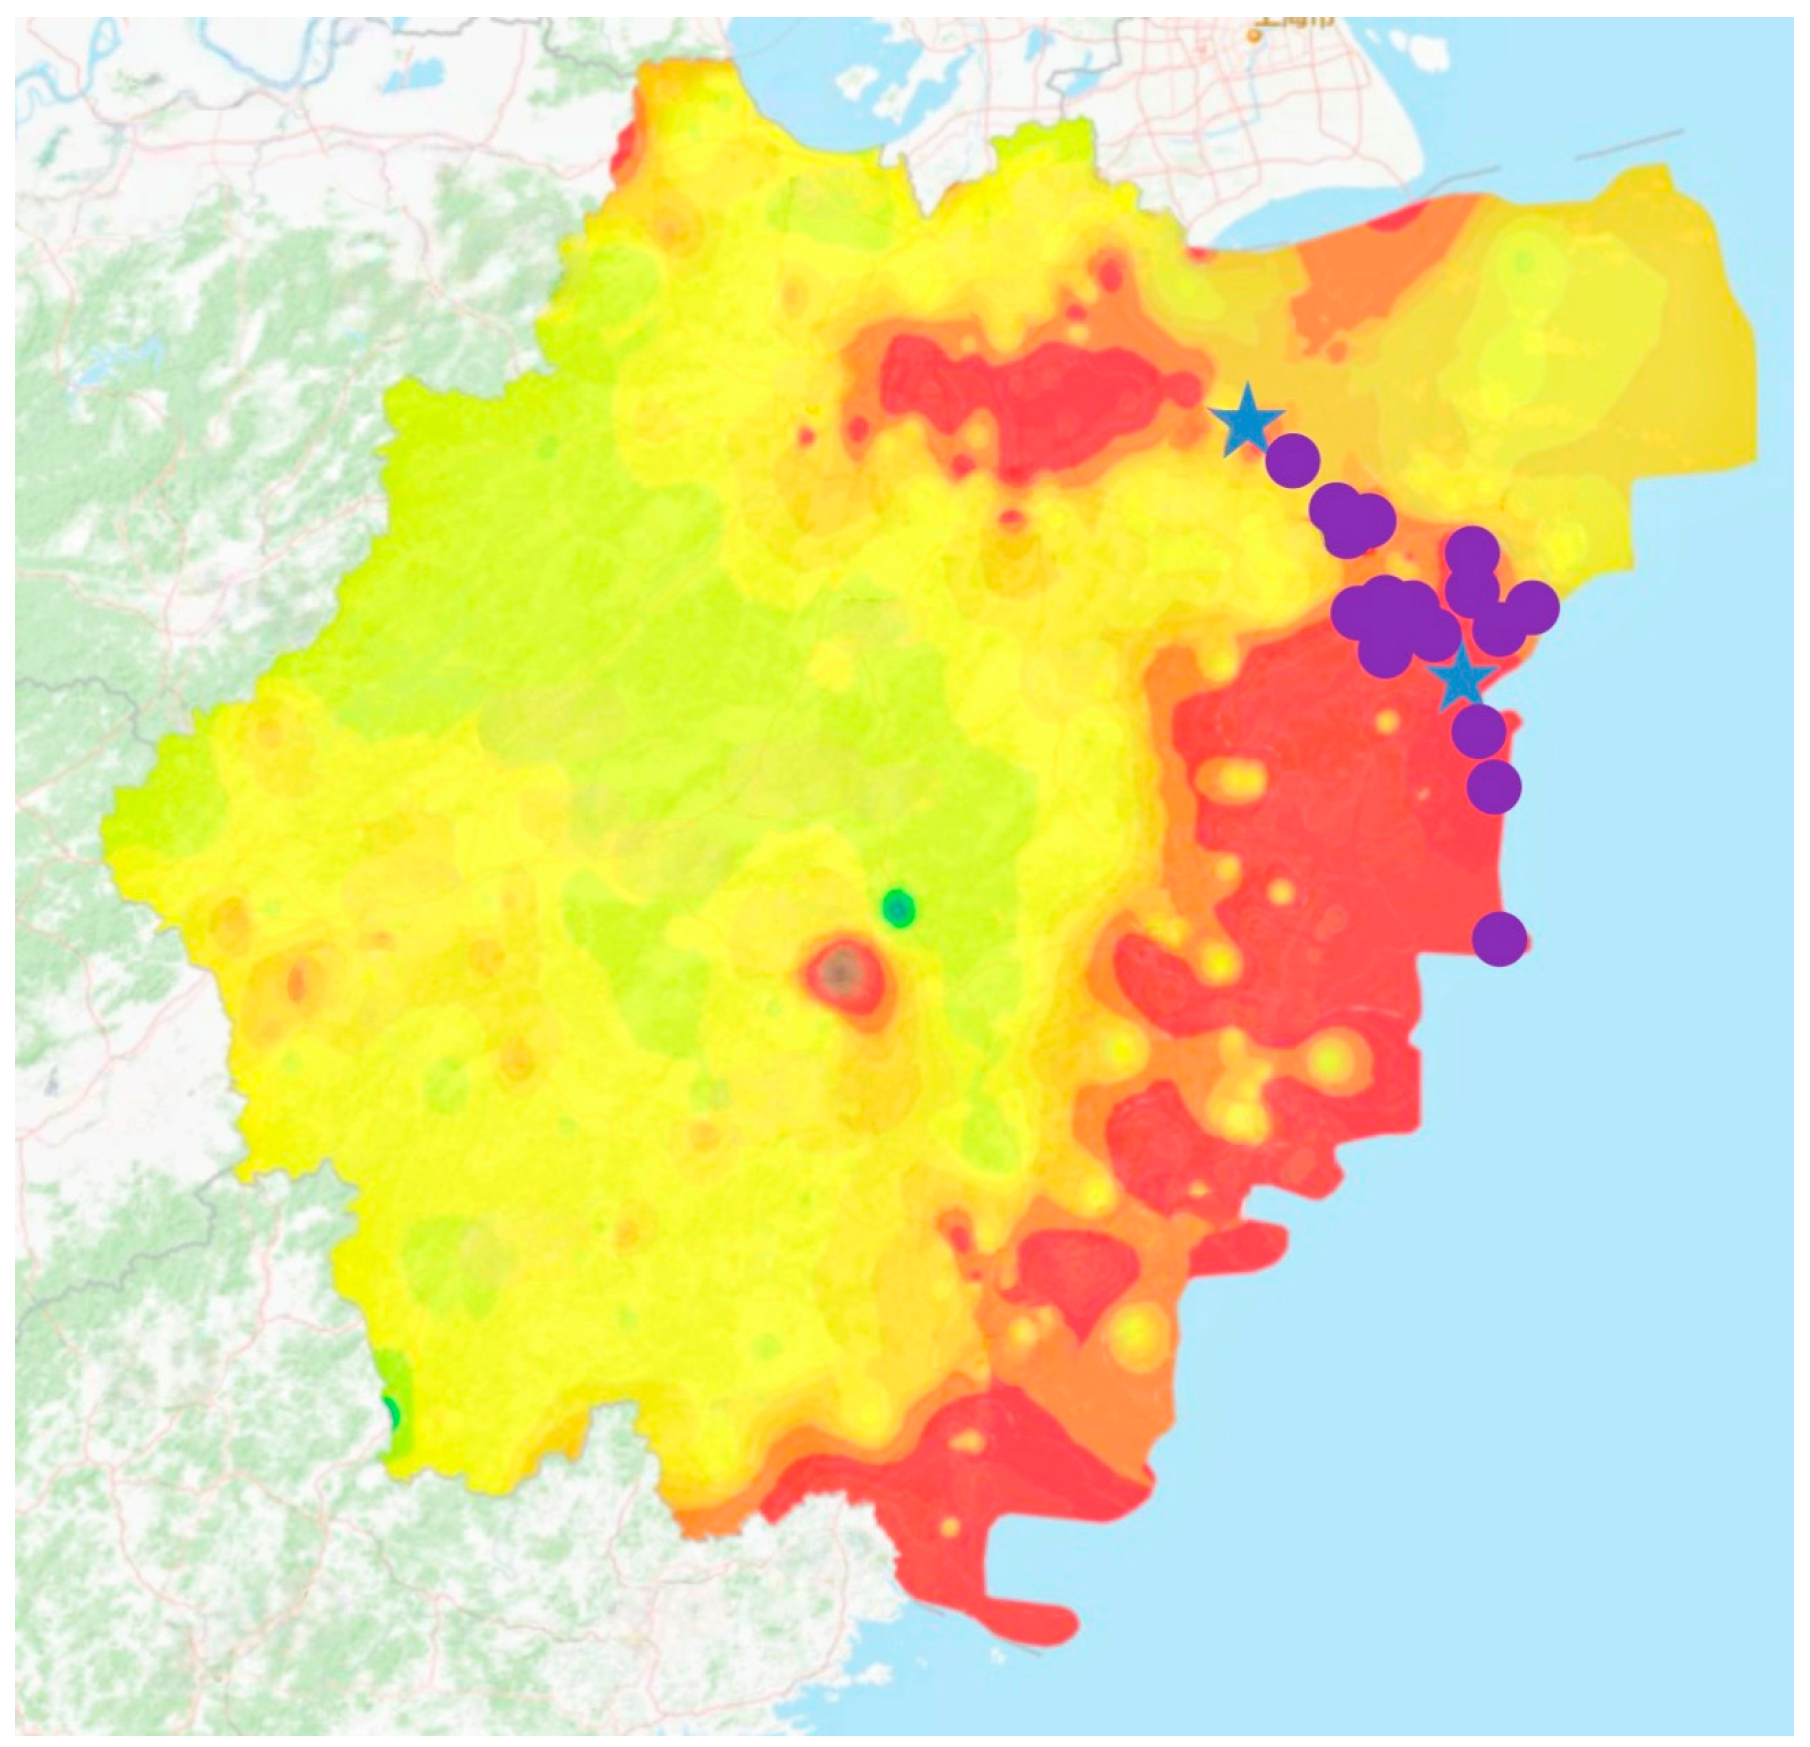
Energies 18 02518 g001
Figure 2. Configuration of angle steel transmission tower.
Energies 18 02518 g002
Figure 3. FE model of angle steel transmission tower.
Energies 18 02518 g003
Figure 4. Simulated fluctuating wind flow at tower top: (a) time history; (b) spectrum.
Energies 18 02518 g004
Figure 5. Corrosion depths of tower W01~W02 over height.
Energies 18 02518 g005
Figure 6. Natural frequencies of the transmission tower with corrosion depth ranging from 0 mm to 1.4 mm.
Energies 18 02518 g006
Figure 7. Progressive collapse of the uncorroded transmission tower.
Energies 18 02518 g007
Figure 8. Distribution of demand to capacity ratios (γ) over height before tower collapse: (a) leg members; (b) diagonal members.
Energies 18 02518 g008
Figure 9. Progressive collapse of the corroded transmission tower.
Energies 18 02518 g009
Figure 10. Distribution of leg members’ demand to capacity ratios (γ) over height: (a) 0.4 mm; (b) 0.8 mm; (c) 1.2 mm.
Energies 18 02518 g010
Figure 11. Distribution of diagonal members’ demand to capacity ratios (γ) over height: (a) 0.4 mm; (b) 0.8 mm; (c) 1.2 mm.
Energies 18 02518 g011
Figure 12. Mean wind speed causing structural collapse varying with corrosion depth.
Energies 18 02518 g012
Table 1. Details of the investigated corroded angle steel transmission towers.
Tower No.Service Time (Years)Distances to Manufacturing
District (km)
Distances to
Coastline (km)
Corrosion Grade
W-0130>5.018.1C3
W-0230>5.08.9C4
L-0121>5.035.0C3
L-0216>5.032.0C3
L-0332>5.020.0C4
L-0425>5.06.0C4
L-0522>5.025.0C4
L-0618>5.026.0C4
L-0782.335.0C4
L-0832.718.0C4
L-0932>5.05.0C5
L-10261.24.8C5
L-11162.22.0C5
L-1215>5.00.4C5
L-1362.03.5C5
L-143500.8CX
L-15300.32.8CX
L-1661.25.0CX
Table 2. Corrosion cases of the angle steel transmission tower.
Corrosion DepthIntervalCorrosion Description
0~1.4 mm0.2 mmAll members are assumed to have the same corrosion depth.
Table 3. Corrosion rates ( η ) of leg and diagonal members at varying corrosion depths.
MembersCorrosion Depth (mm)Segments
S01~S02
Segments
S03~S05
Segments
S06~S08
Segments
S09~S10
Segments
S11~S13
Leg0.21.9%1.4%1.2%1.0%0.8%
0.43.8%2.7%2.4%1.9%1.6%
0.65.8%4.1%3.6%2.8%2.3%
0.87.7%5.5%4.8%3.8%3.1%
1.09.6%6.8%6.0%4.7%3.9%
1.211.5%8.2%7.2%5.7%4.7%
1.413.4%9.6%8.4%6.6%5.5%
Diagonal0.23.9%3.2%3.9%2.8%2.4%
0.47.7%6.4%7.7%5.5%4.8%
0.611.6%9.6%11.6%8.3%7.3%
0.815.4%12.8%15.5%11.0%9.7%
1.019.3%16.0%19.3%13.8%12.1%
1.223.1%19.2%23.2%16.5%14.5%
1.427.0%22.4%27.1%19.3%16.9%
Table 4. Mean corrosion depths of leg, diagonal, and all members of transmission towers investigated from tower foot to tower top. (unit: mm).
Leg MembersDiagonal MembersAll Members
Tower Foot Tower MiddleTower Head Tower Foot Tower MiddleTower Head Tower Foot Tower MiddleTower Head Mean
W-010.190.120.090.150.120.090.310.290.240.28
W-020.940.610.080.230.190.110.460.400.390.40
Table 5. Mean corrosion depths of investigated transmission towers.
Tower No.Corrosion Depth (mm)Err1 (%)Err2 (%)
ExaminedModel 1Model 2
W-010.280.240.31−14.2910.71
W-020.400.340.41−15.002.50
L010.200.300.2550.0025.00
L020.070.150.11114.2957.14
L030.330.390.3418.183.03
L040.290.330.2813.79−3.45
L050.240.310.2629.178.33
L060.220.280.2327.274.55
L070.150.180.1420.00−6.67
L080.120.100.10−16.67−16.67
L090.440.360.43−18.18−2.27
L100.370.320.36−13.51−2.70
L110.170.240.2541.1847.06
L120.140.240.2471.4371.43
L130.130.150.1415.387.69
L140.830.750.87−9.644.82
L150.940.680.76−27.66−19.15
L160.180.290.2661.1144.44
Disclaimer/Publisher’s Note: The statements, opinions and data contained in all publications are solely those of the individual author(s) and contributor(s) and not of MDPI and/or the editor(s). MDPI and/or the editor(s) disclaim responsibility for any injury to people or property resulting from any ideas, methods, instructions or products referred to in the content.

