Article

Analysis of Wind-Induced Vibration Response in Additional Conductors and Fittings Based on the Finite Element Method

1
Standards & Metrology Research Institute, China Academy of Railway Sciences Co., Ltd., Beijing 100015, China
2
School of Electrical Engineering, Southwest Jiaotong University, Chengdu 611730, China
*
Author to whom correspondence should be addressed.
Energies 2025, 18(10), 2487; https://doi.org/10.3390/en18102487
Submission received: 2 April 2025 / Revised: 30 April 2025 / Accepted: 7 May 2025 / Published: 12 May 2025
(This article belongs to the Section A3: Wind, Wave and Tidal Energy)

Abstract

:
Wind-induced vibrations in additional conductors on electrified railway catenary systems pose a risk to operational safety and long-term structural performance. This study investigates the dynamic response of these components under wind excitation through nonlinear finite element analysis. A wind speed spectrum model is developed using wind tunnel tests and field data, and the autoregressive method is used to generate realistic wind fields incorporating longitudinal, lateral, and vertical components. A detailed finite element model of the additional conductors and fittings was constructed using the Absolute Nodal Coordinate Formulation to account for large deformations. Time domain simulations with the Newmark-β method were conducted to analyze vibration responses. The results show that increased wind speeds lead to greater vibration amplitudes, and the stochastic nature of wind histories significantly affects vibration modes. Higher conductor tension effectively reduces vibrations, while longer spans increase flexibility and susceptibility to oscillation. The type of fitting also influences system stability; support-type fittings demonstrate lower stress fluctuations, reducing the likelihood of resonance. This study enhances understanding of wind-induced responses in additional conductor systems and informs strategies for vibration mitigation in high-speed railway infrastructure.

1. Introduction

The safe and stable operation of railway power supply lines is crucial for electrified railways. The additional conductor is a special type of conductor in power transmission lines, typically used to enhance the line’s current-carrying capacity or improve the electromagnetic environment. The fittings, including suspension fittings and strain fittings, are key components used to connect and secure the conductors. As important parts of railway power supply lines, the additional conductor and fittings not only perform the function of current transmission but also play a role in force transmission and fixation at the structural level. Their dynamic response under wind load directly affects the overall stability and service life of the line [1].
Wind-induced vibration refers to the oscillation of structures due to wind excitation, which manifests as randomly distributed turbulent forces in both time and space. This phenomenon is commonly observed in slender structures with nearly circular cross-sections [2,3]. Wind-induced vibration, as a typical type of wind-related structural response, is commonly found in long, flexible structures such as bridges, overhead contact lines, and elevated transmission lines. Zhao et al. [4] investigated how cable failure affects the wind-induced vibration characteristics of a curved-beam single-side suspended bridge. Their study emphasized the importance of considering these factors in structural design to ensure safety under wind load conditions. Xing et al. [5] studied the use of tuned mass dampers (TMDs) to control wind-induced vibrations in large-span cable-stayed bridges, proposing a TMD-type counterweight device to better control the structural dynamic response. This method showed significant effectiveness in reducing the flutter response of the Sutong Bridge (SCB). Recent advancements in wind engineering and structural dynamics have enabled extensive research into wind-induced vibration mechanisms in railway power supply lines, employing wind tunnel experiments, field monitoring, and numerical simulations. The wind-induced vibration of additional conductors primarily involves turbulence excitation, aeroelastic instability, and nonlinear structural response. Den et al. [6] were among the first to study wind-induced vibration in ice-covered transmission lines and proposed the classical Den Hartog galloping mechanism. Yu et al. [7,8] introduced a three-degrees-of-freedom vibration model to refine the mathematical description of additional conductor wind-induced vibration. Initial research on wind-induced vibration was primarily conducted in transmission lines: Song, P. et al. [9] proposed the use of a spring-pendulum dynamic vibration absorber to suppress the wind load response of large-span transmission tower–line systems, and analyzed the effectiveness of this method under different wind speeds using a finite element model. Zhao, M. et al. [10] conducted wind tunnel tests to investigate the galloping performance of single-span and two-span multi-bundle transmission lines with rime under wind loads, and analyzed the effects of wind speed, wind direction, and the number of conductors on the wind-induced response and galloping performance of the transmission line system. Lu et al. [11] developed a novel algorithm to analyze multi-damped aeolian vibration. Compared to transmission lines, railway lines have more complex structures, shorter spans, and higher tensions, which make their wind-induced vibration problems exhibit strong nonlinear characteristics [12]. Therefore, in-depth research into the wind-induced vibration response mechanisms of additional conductors and fittings, along with the development of rational analytical methods, is of significant theoretical and engineering value in terms of enhancing the safety and reliability of railway power supply lines. Duan et al. [13] investigates the aerodynamic instability and galloping behavior of railway overhead contact lines (OCL) using wind tunnel tests and nonlinear finite element simulations. Song et al. [14,15,16,17] used high-order nonlinear finite element methods to analyze the galloping behavior of electrified railway catenaries, demonstrating that structural stiffness and aerodynamic forces play a crucial role in determining vibration amplitudes. Wang [18,19] enhanced the performance and stability of active pantograph control systems using reinforcement learning, providing theoretical support for overhead contact lines structural design. In terms of wind load simulation, the empirical spectra proposed by Kaimal, Panofsky, and Tieleman have been widely applied to the generation of stochastic wind speed time histories in the along-wind, cross-wind, and vertical wind directions [20,21,22], laying the foundation for multi-directional and multi-scale wind vibration analysis. Additionally, the use of CFD methods to obtain the aerodynamic parameters of conductors and their coupling with finite element models has become one of the recent research trends [23,24].
Fittings, as key connecting components in transmission lines, also play a significant role in system stability under wind-induced vibrations. Traditional research has primarily focused on the static mechanical properties of fittings, with limited attention to their dynamic response under wind excitation. In recent years, researchers have increasingly adopted numerical simulations combined with experimental testing to analyze the mechanical behavior of fittings under wind excitation. Diana et al. [25] developed an energy-based method to compute the maximum vibration amplitude of fittings in ice-covered conductors. Zhao et al. [26,27] employed fluid–structure interaction analysis to investigate the galloping mechanism of feeder line fittings in high-speed railway catenary systems. Stickland et al. [28,29] examined the mechanical damping characteristics of high-speed railway catenary fittings and their effects on aerodynamic galloping stability. Studies show that multiple factors, such as wind speed, connection type, and structural parameters, influence the wind-induced vibration response of fittings. However, systematic investigations on this topic remain limited.
There are two main types of conductor modeling methods commonly used in electrified railways worldwide—one involves establishing the continuous wave equation of the beam, discretizing the equation using modal equations to obtain the dynamics equation in generalized coordinates, known as the modal analysis method or Fourier series expansion method [30,31]; the other involves constructing a finite element model, where the conductor is discretized into several sub-elements, and the element coordinates are transformed into global coordinates using a coordinate transformation matrix. The elements are then assembled into the system’s overall dynamics equation, referred to as the finite element method [32,33,34]. The advantage of the modal superposition method lies in its ability to represent the geometric continuity and vibration characteristics of the conductor, but the accuracy of this method is affected by the number of modes retained. Under wind load, the finite element method can better capture the system’s nonlinearity, leading to more precise numerical results. Therefore, using the finite element method to model the additional conductor is more practical and reasonable.
Despite the existing research on wind-induced vibration in transmission lines, most studies rely on simplified mathematical models or linear assumptions, which fail to fully account for the coupling effects between additional conductors and fittings, as well as the stochastic nature of wind excitation. As a result, discrepancies may arise between numerical predictions and actual operating conditions. This study combines numerical simulations and theoretical analysis, employing finite element analysis as the primary methodology to model the wind-induced vibration response of additional conductors and fittings. First, a realistic wind field is simulated by combining an empirical wind speed spectrum with a random wind speed time history generation method, enabling a more accurate reproduction of the wind time history and its influence on the vibration of the additional conductor. Subsequently, a nonlinear finite element model based on the Absolute Nodal Coordinate Formulation (ANCF) is established to accurately capture the nonlinear behavior of the additional conductor, particularly under large deformation conditions, in order to precisely describe the dynamic characteristics of the additional conductor and fittings under wind-induced vibrations. To further analyze system response, the Newmark-β method is applied to solve the dynamic equations, supplemented by time–frequency analysis to evaluate the impact of wind excitation on structural vibrations. Finally, the response characteristics of the structure under varying tension, span length, and wind speed conditions are systematically investigated.

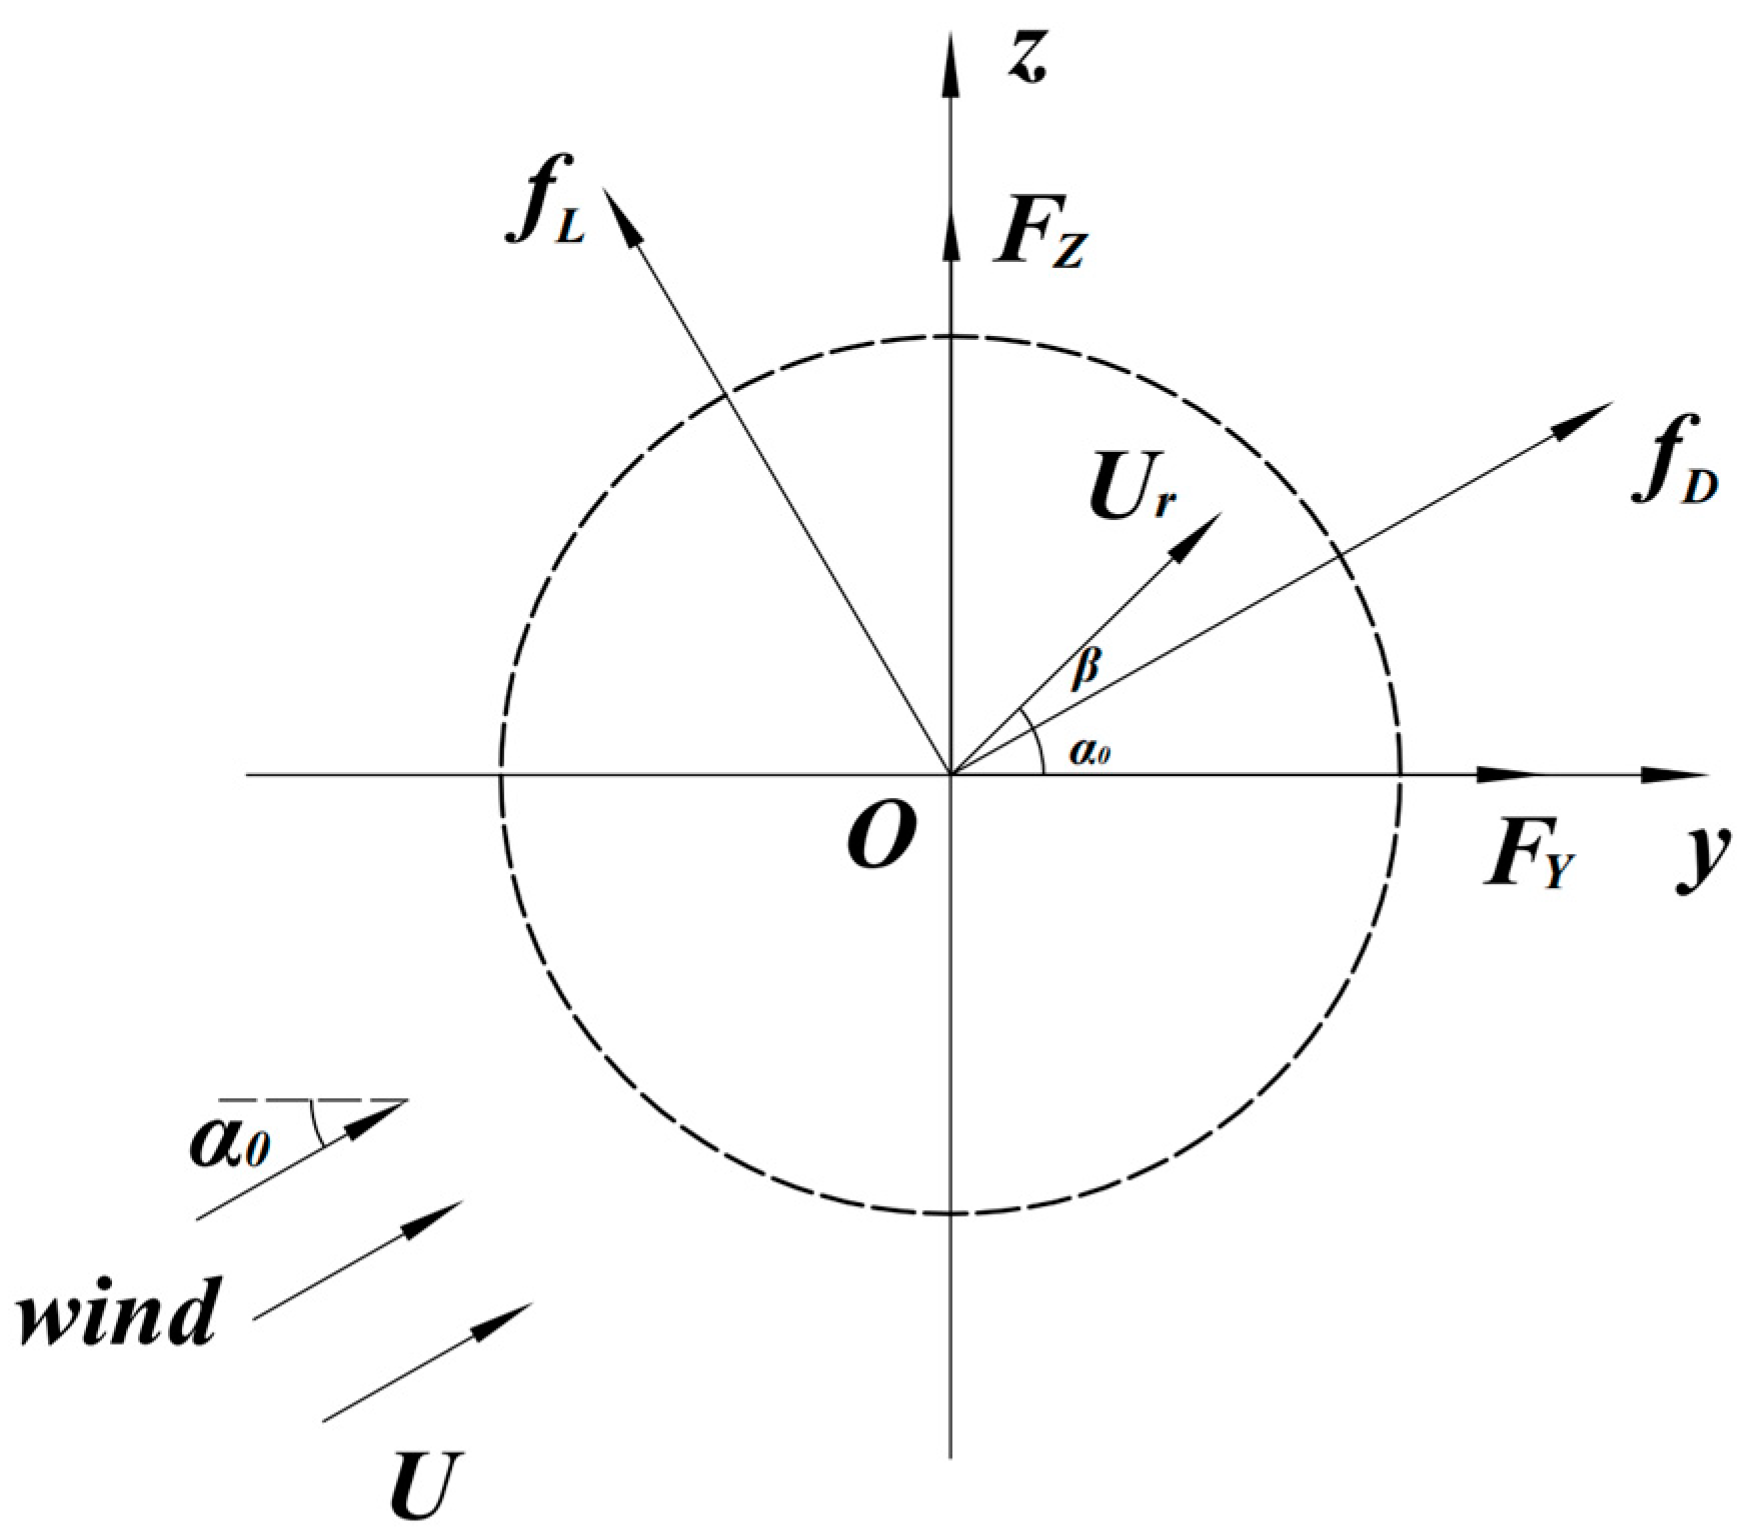
2. Application and Loading Conditions of Wind Forces

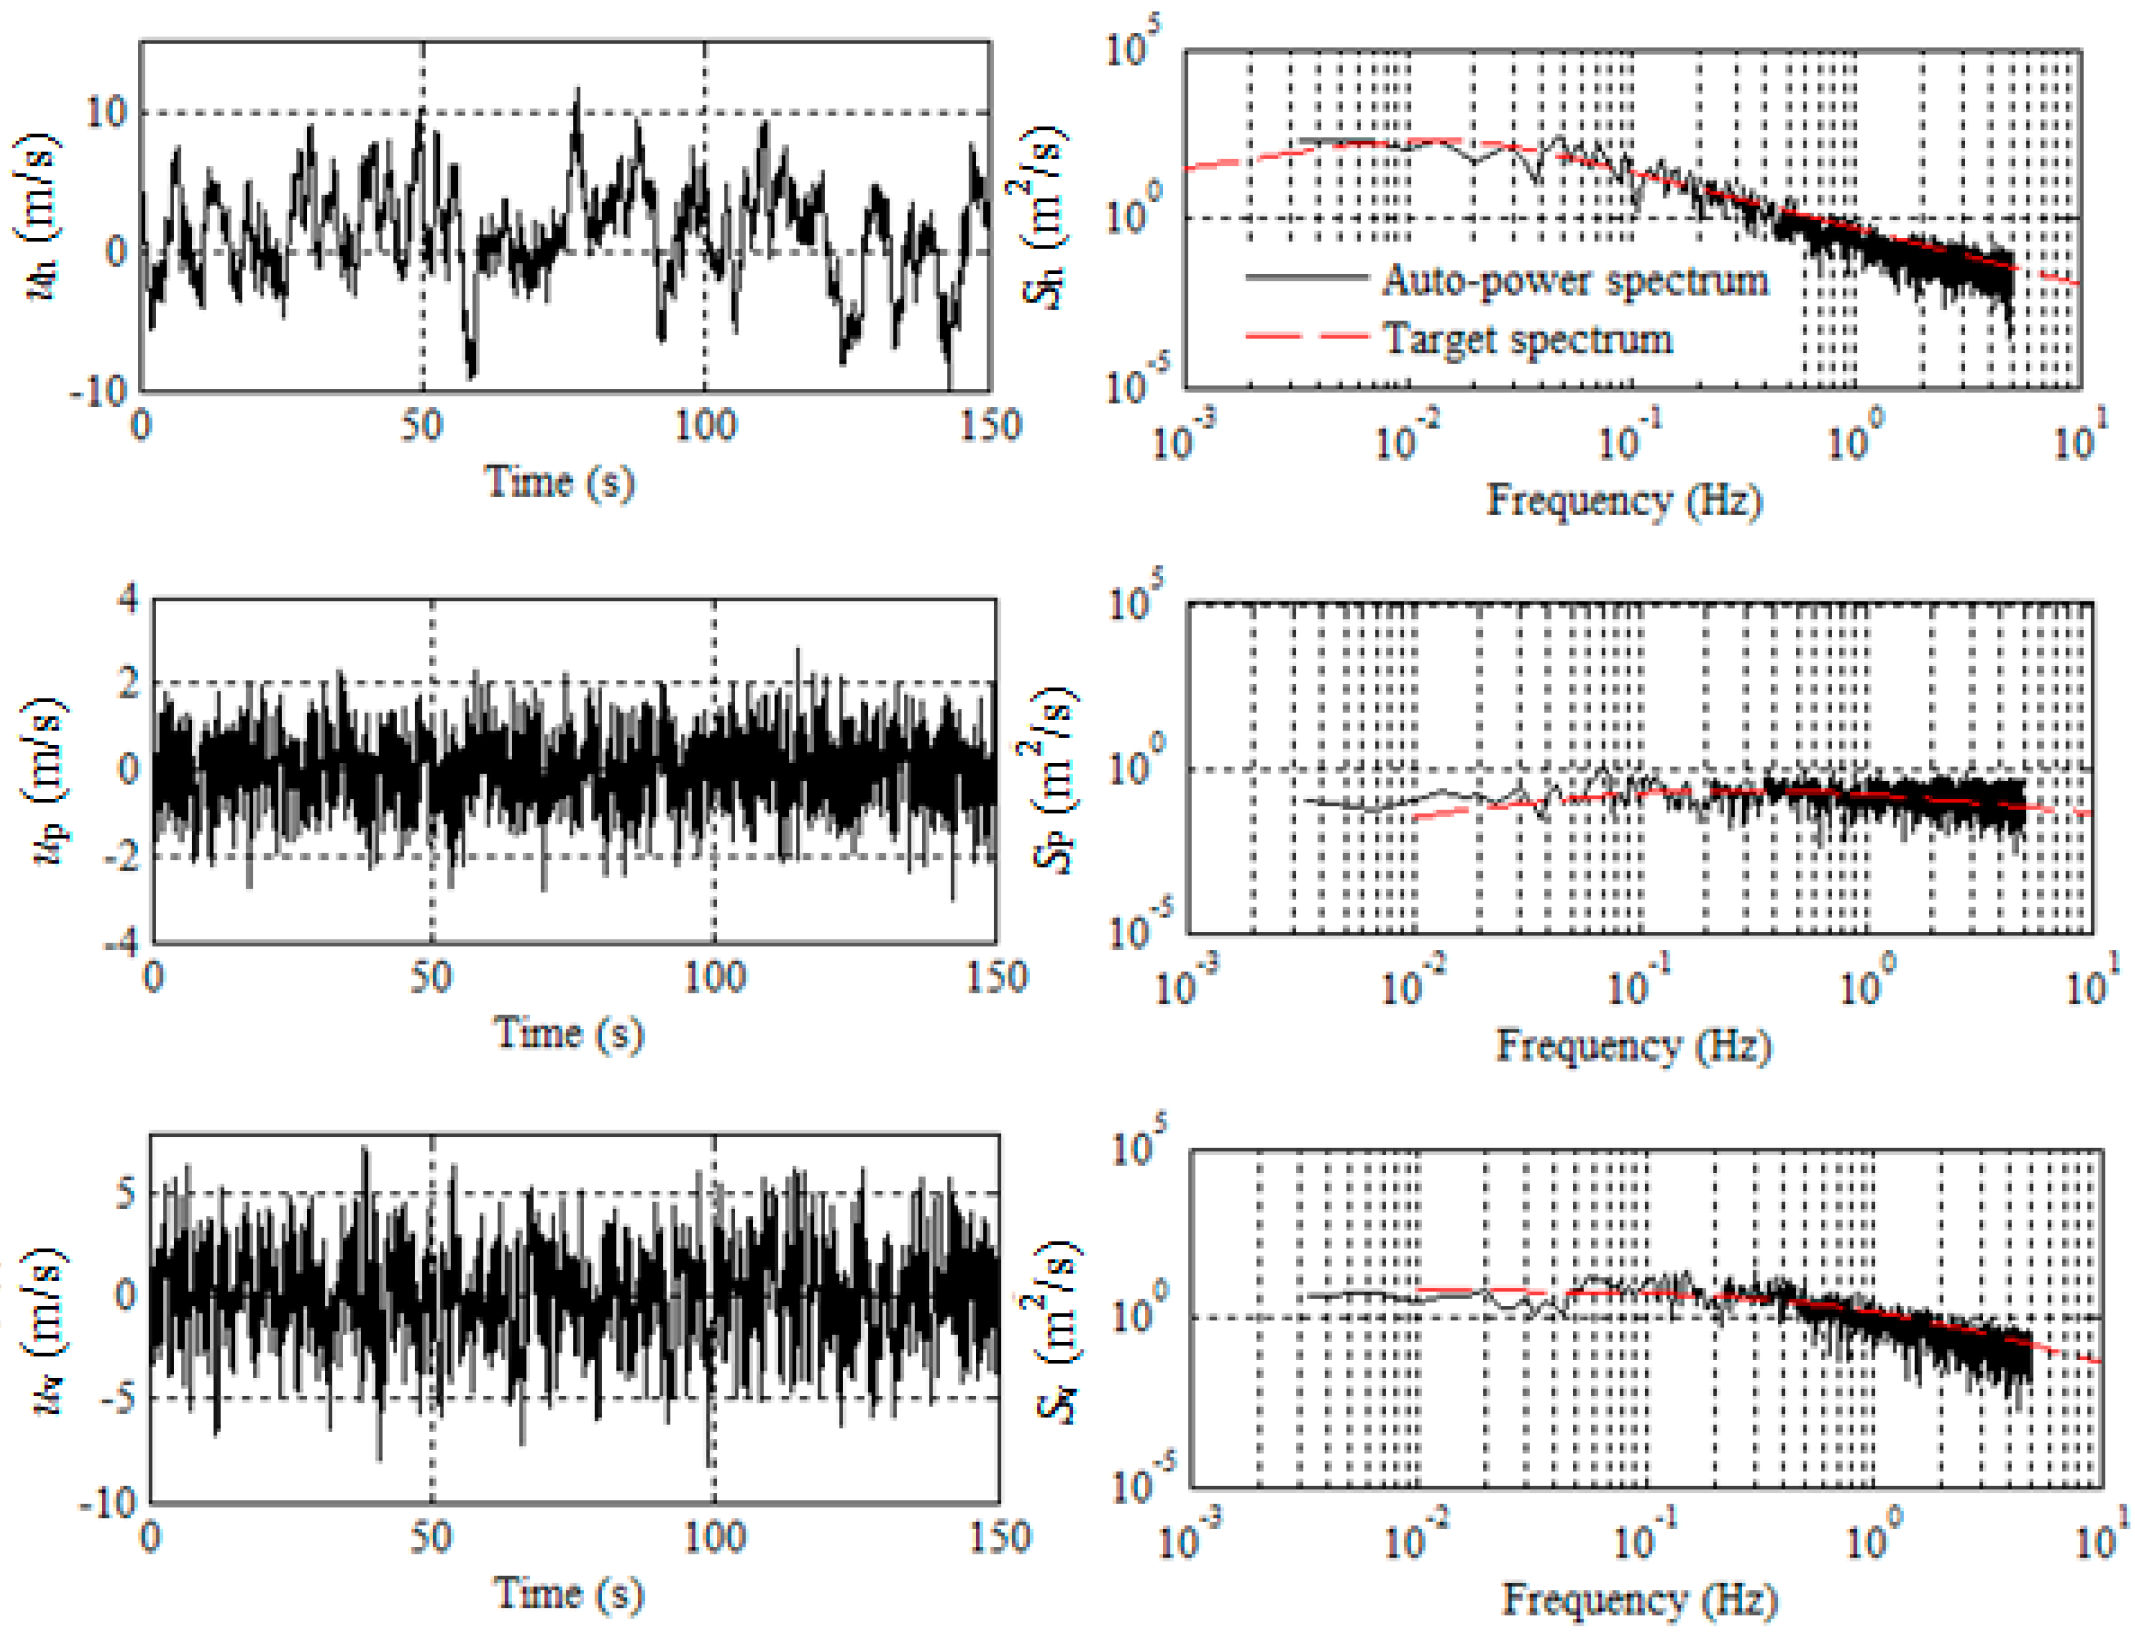
2.1. Generation of Fluctuating Wind Time Histories

This section employs an empirical wind power spectrum inversion method to simulate the fluctuating wind velocity time histories acting on additional conductors. This method effectively captures the temporal variations in wind speed, particularly when accounting for three-dimensional wind components. To simulate stochastic wind velocity components in the longitudinal, lateral, and vertical directions, this study adopts the empirical wind speed spectrum models proposed by Kaimal [20], Panofsky [21], and Tieleman [22]. These models have been widely applied in wind speed simulations and wind energy research, offering a reliable representation of wind speed variations across different frequency ranges. The Kaimal, Panofsky, and Tieleman spectra can be expressed as follows:
S h z , n = 200 v ¯ z 2 f n 1 + 50 f 5 / 3 ;   f = n z v ¯ z S p z , n = 13 v ¯ z 2 f n 1 + 20.16 f 5 / 3 ;   f = n z v ¯ z S v z , n = 6 v ¯ z 2 f n 1 + 4 f 2 ;   f = n z v ¯ z
where S h z , n , S p z , n , and S v z , n denote the along-wind, crosswind, and vertical wind spectra, respectively; n is the frequency; and v ¯ z represents the mean wind speed at the reference height z.
A fourth-order autoregressive (AR) model [35] is utilized to simulate multi-directional stochastic wind velocities. Specifically, at a given time t, the fluctuating wind velocity V X , Y , Z , t at a spatial point is expressed as:
V X , Y , Z , t = i = 1 4 φ i V X , Y , Z , t i Δ t + N t X = x 1 , x 2 , , x m T Y = y 1 , y 2 , , y m T Z = z 1 , z 2 , , z m T
Here, X ,   Y , and   Z are spatial position vectors; m is the total number of spatial points; Δ t is the time step; φ i is the autoregressive coefficient matrix; and the random sequences N k t are determined as follows:
The cross-correlation function R g h t between two spatial points g and h is defined as:
R g h t = 0 S g h f cos 2 π f t d ω    
where g , h = 1 , 2 , , m represents different directions of spatial points.
The correlation function matrix R j Δ t is expressed as:
R j Δ t = R 11 j Δ t R 12 j Δ t R 1 n j Δ t R 21 j Δ t R 22 j Δ t R 2 n j Δ t R n 1 j Δ t R n 2 j Δ t R n n j Δ t
where j = 1 , 2 , , p . Each term R j Δ t reflects the temporal correlation of wind speed and can be further confirmed by:
R ( j Δ t ) = i = 1 p R [ ( j i ) Δ t ] φ i T
Thus, the autocorrelation matrix R ( 0 ) and the related stochastic process model can be expanded as:
R ( 0 ) = i = 1 p φ i R ( i Δ t ) + R N
To achieve this, the Cholesky decomposition is applied to the noise covariance matrix R N = L L T , yielding the noise term:
N t = L Q t Q t = Q 1 t , Q 2 t Q n t T
where Q k t are independent Gaussian random sequences, ensuring the randomness and autocorrelation of the simulation process.
When the steady wind speed is 20 m/s, the simulation results of three directions fluctuating wind velocities are shown in Figure 1.

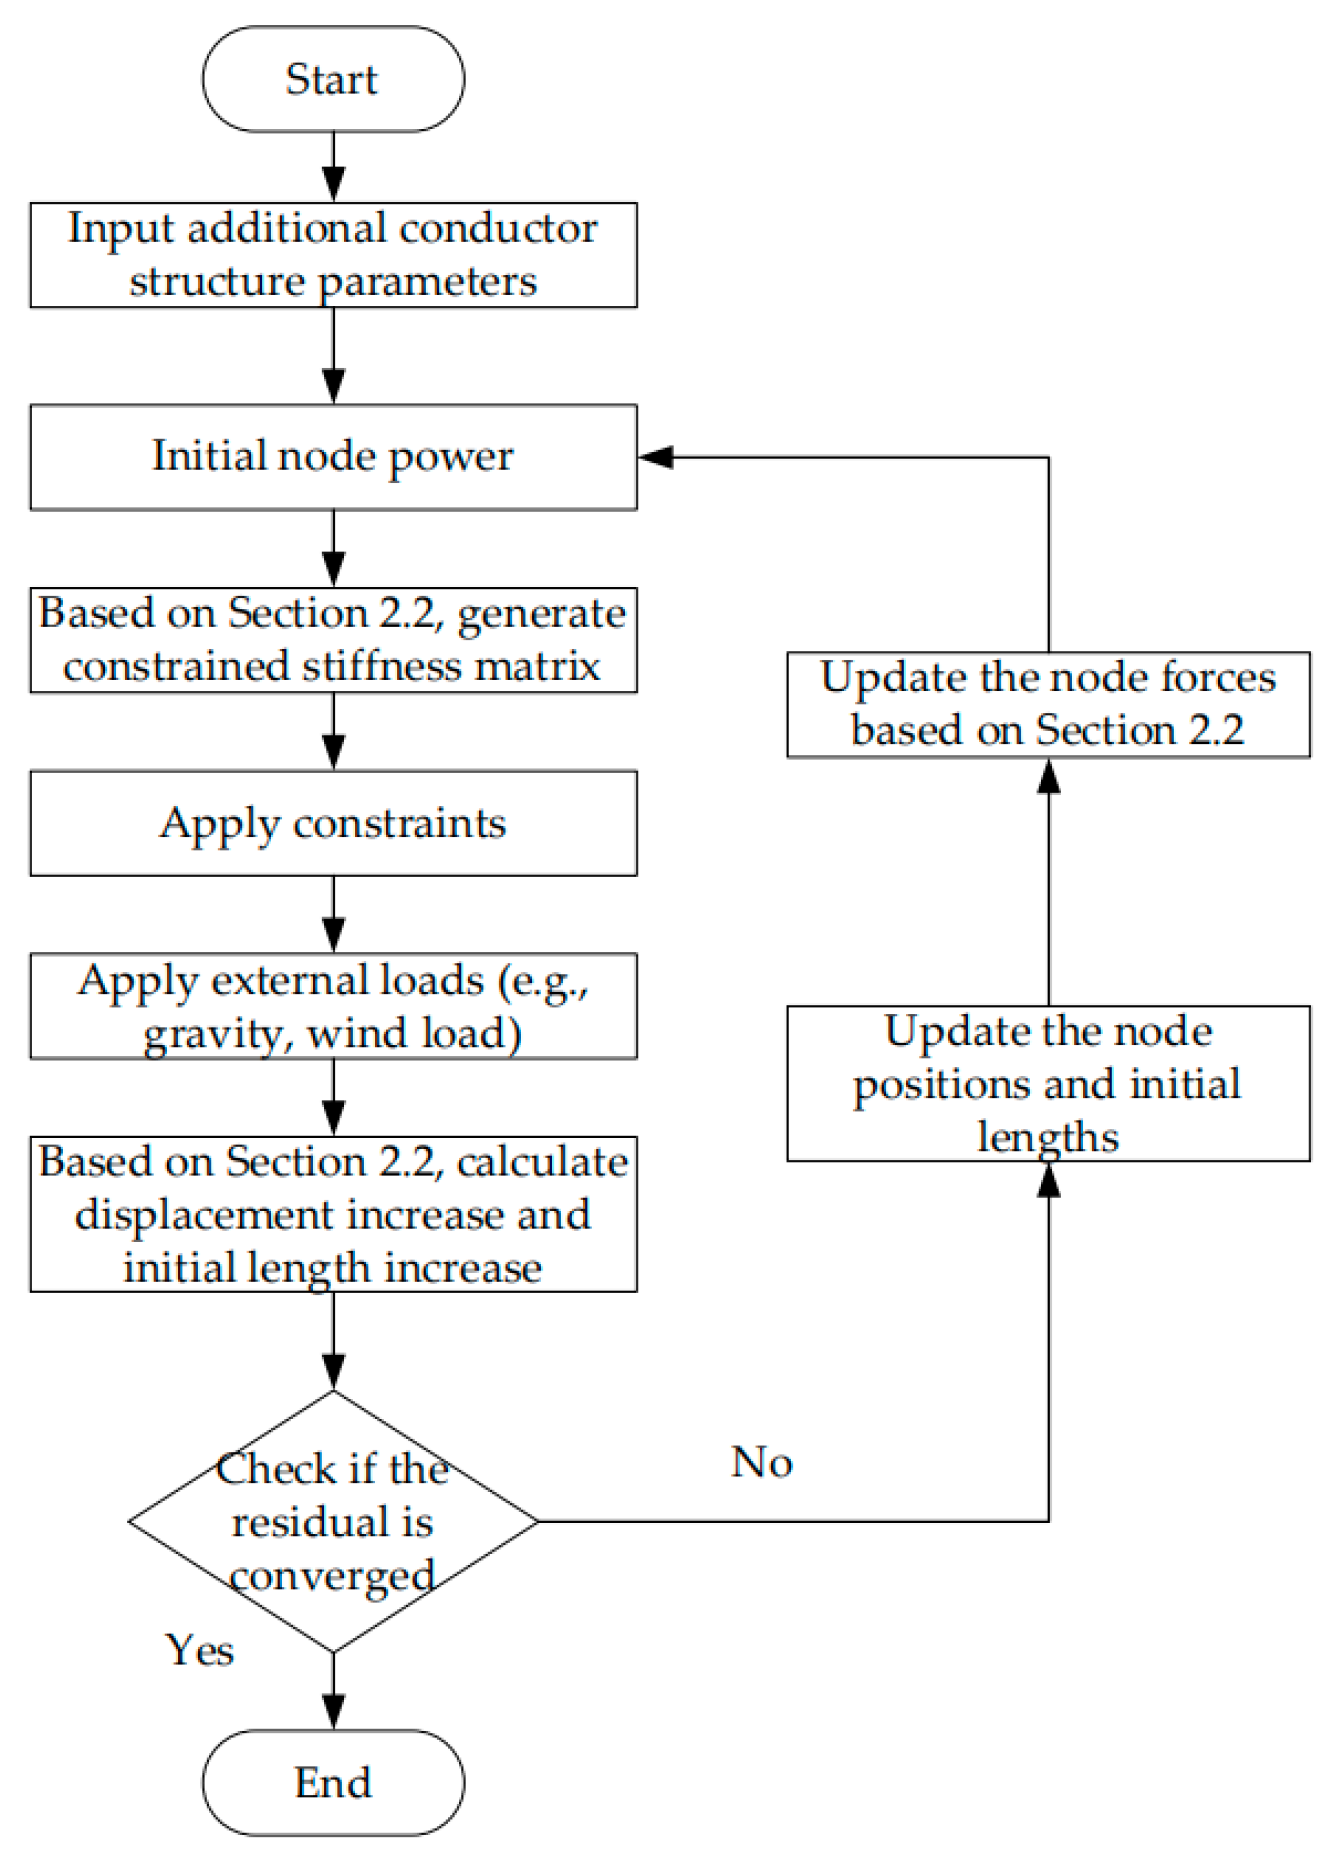
2.2. Wind-Induced Vibration Model of the Additional Conductor

The modeling and analysis of the wind-induced vibration behavior of additional conductors involve nonlinear characteristics and large deformation effects. The additional conductor is typically modeled as a beam element, where the structural analysis considers not only gravitational and tensile forces but also the effects of bending stiffness on overall structural behavior. The Absolute Nodal Coordinate Formulation (ANCF) method [36,37] is well-suited for capturing such nonlinear behaviors and demonstrates superior performance in dynamic simulations. This method employs absolute coordinates and trapezoidal parameterization, effectively avoiding the complexities associated with strain parameterization in traditional finite element methods.
In a three-dimensional space, the beam element may undergo large deformations, where nodes include both positional degrees of freedom and slope degrees of freedom. The displacement vector of a beam element can be expressed as:
e = x i y i z i θ x i θ y i θ z i x j y j z j θ x j θ y j θ z j T
where the positional degrees of freedom describe nodal translation, while the slope degrees of freedom describe cross-section rotation.
Using the ANCF method, the shape function matrix S of the beam element interpolates the displacement field, facilitating the formulation of the nonlinear deformation stiffness matrix:
Q = L S T K e S d L
where L represents the element length and K e is the element stiffness matrix, which varies with deformation, demonstrating the advantage of the ANCF method in large deformation problems.
After constructing the stiffness matrix of the additional conductor using the aforementioned method, the static equilibrium equation for the additional conductor model is formulated as follows:
Δ F = K T Δ X + K L Δ L
where Δ F is the global unbalanced force vector, K T and K L are stiffness matrices related to the displacement increment Δ X and the length increment Δ L , respectively.
Based on the static modeling results, incorporating the consistent mass matrix M T and the damping matrix C T , the dynamic equation of the additional conductor under external forces is established as:
M T X ¨ ( t ) + C T X ˙ ( t ) + K T X ( t ) = F T ( t )
where X ¨ ( t ) , X ˙ ( t ) , and X ( t ) represent nodal acceleration, velocity, and displacement, respectively, and F T ( t ) denotes the external force acting on the node.
The nonlinear dynamic response is solved using the Newmark-β method [38] for numerical integration, with an appropriately chosen time step.
X ¨ ( t + Δ t ) = 1 α Δ t 2 X ( t + Δ t ) X ( t ) 1 α Δ t X ˙ ( t ) ( 1 2 α 1 ) X ¨ ( t ) X ˙ ( t + Δ t ) = X ˙ ( t ) + 1 β Δ t X ¨ ( t ) + β Δ t X ¨ ( t + Δ t )
where α and β control the interpolation accuracy. By selecting α = 0.25 and β = 0.5 , a constant acceleration is ensured.
Using this method, the motion equation at time t + Δ t is obtained as:
K ¯ T X ( t + Δ t ) = F ¯ T ( t + Δ t )
where K ¯ T is the modified stiffness matrix and F ¯ T ( t + Δ t ) is the modified load matrix, which can be expressed as:
K ¯ T = K T + 1 α Δ t 2 M T + β α Δ t C T
F ¯ T ( t + Δ t ) = F T ( t + Δ t ) + M T ( 1 α Δ t 2 ( X ( t + Δ t ) X ( t ) ) + 1 α Δ t X ˙ ( t ) + ( 1 2 α 1 ) X ¨ ( t ) ) + C T ( β α Δ t ( X ( t + Δ t ) X ( t ) ) + ( β α 1 ) X ˙ ( t ) + ( α 2 ) Δ t 2 β X ¨ ( t ) )
This method can solve the dynamic response of large deformation for the additional conductor, indicating that the stiffness matrix changes with time and the system exhibits nonlinear characteristics.

2.3. Additional Conductor Wind Vibration Model

In analyzing the effects of wind load on the conductor, the additional conductor’s mass is assumed to be concentrated at a single point. A coordinate system (Oyz) is established with the center of mass O as the origin, where the horizontal direction of O is the y-direction, and the vertical direction is the z-direction, as shown in Figure 2. According to the vibration principle of flexible bridges [39,40], the wind load acting on the iced additional conductor will change with the dynamic windward attack angle, and the aerodynamic force is derived as follows:
When the wind speed U blows toward the conductor, the relative wind speed U r experienced by the actual conductor is:
U r = U y ˙ 2 + z ˙ 2
where z ˙ and y ˙ represent the velocities of the conductor in the vertical and horizontal directions relative to the wind speed when the conductor is swinging.
Let the dynamic wind attack angle be β , then:
β = arctan z ˙ U r z ˙ U r
the lift coefficient and drag coefficient depend on the actual angle of attack α , where α = α 0 + β , with α 0 denoting the initial angle of attack corresponding to the wind speed.
The wind load typically consists of lift F L and drag forces F D , expressed as follows:
F L = 1 2 ρ U r 2 l D C L ( α )  
F D = 1 2 ρ U r 2 l D C D ( α )
where ρ is the air density, D is the conductor’s windward diameter, the lift coefficient and drag coefficient are denoted as C L ( α ) and C D ( α ) , respectively, and their values are primarily related to the angle of attack α . The conductor’s calculation length is l .
Decomposing the lift F L and drag F D in the Cartesian coordinate system yields:
F y = F D cos α 0 F L sin α 0    
F z = F L cos α 0 + F D sin α 0 m g  

3. Reconstruction of Wind-Induced Vibration and Structural Optimization of Additional Conductors

3.1. Reconstruction of Wind-Induced Vibration in Additional Conductors

To accurately simulate wind-induced vibration phenomena and validate the mathematical model developed in the previous sections, this study selects a 50 m conductor segment as the research subject. To improve computational accuracy and spatial resolution, the conductor is discretized into multiple finite elements, each with a uniform spacing of 0.5 m. Initially, the axial tension applied to the conductor is set to 3500 N. The specific parameters of the additional conductor are listed in Table 1.
A comprehensive approach is employed to analyze wind-induced vibration characteristics, considering wind speeds of 20 m/s and 30 m/s. Given the stochastic nature of turbulence, multiple characteristic points are randomly selected along different spatial positions of the conductor, and the time domain analysis of wind-induced responses is conducted at these points. Numerical simulations are performed using MATLAB (2022), where the amplitude–frequency response characteristics of the time series data are analyzed to evaluate the influence of wind speed variations on the wind-induced vibration behavior of additional conductors. Furthermore, a detailed analysis of vibration amplitude and its time history characteristics is performed. To ensure the stability and statistical reliability of the results, a simulation time of 500 s is selected. This approach allows for an accurate assessment of the conductor’s dynamic response to wind excitation, offering valuable insights into its aerodynamic behavior and structural optimization. The iterative calculation process in MATLAB (2022) is shown in Figure 3.
Figure 4 illustrates the vibration response of the additional conductor in both the horizontal and vertical directions under different wind speed conditions. As wind speed increases, the vibration amplitude of the conductor rises significantly, indicating an enhanced excitation effect of wind on the conductor’s vibration characteristics. Additionally, due to the inherent structural flexibility of the conductor, the vibration frequency under wind loading demonstrates strong temporal randomness, exhibiting typical characteristics of turbulence-induced excitation.
Figure 5 shows the mid-span trajectory under different wind speeds.
To further characterize the motion patterns of the additional conductor, the centroid trajectory of the conductor under wind excitation is extracted and visualized using phase-plane analysis, as shown in Figure 4. The results reveal that wind speed variations not only influence the instantaneous displacement characteristics of the conductor but also significantly expand the distribution range of its motion trajectory in phase space, highlighting the strong nonlinear dynamic nature of the wind-induced vibration process. As wind speed increases, the density of the conductor’s vibration trajectory intensifies, suggesting an increased complexity in its vibration modes.

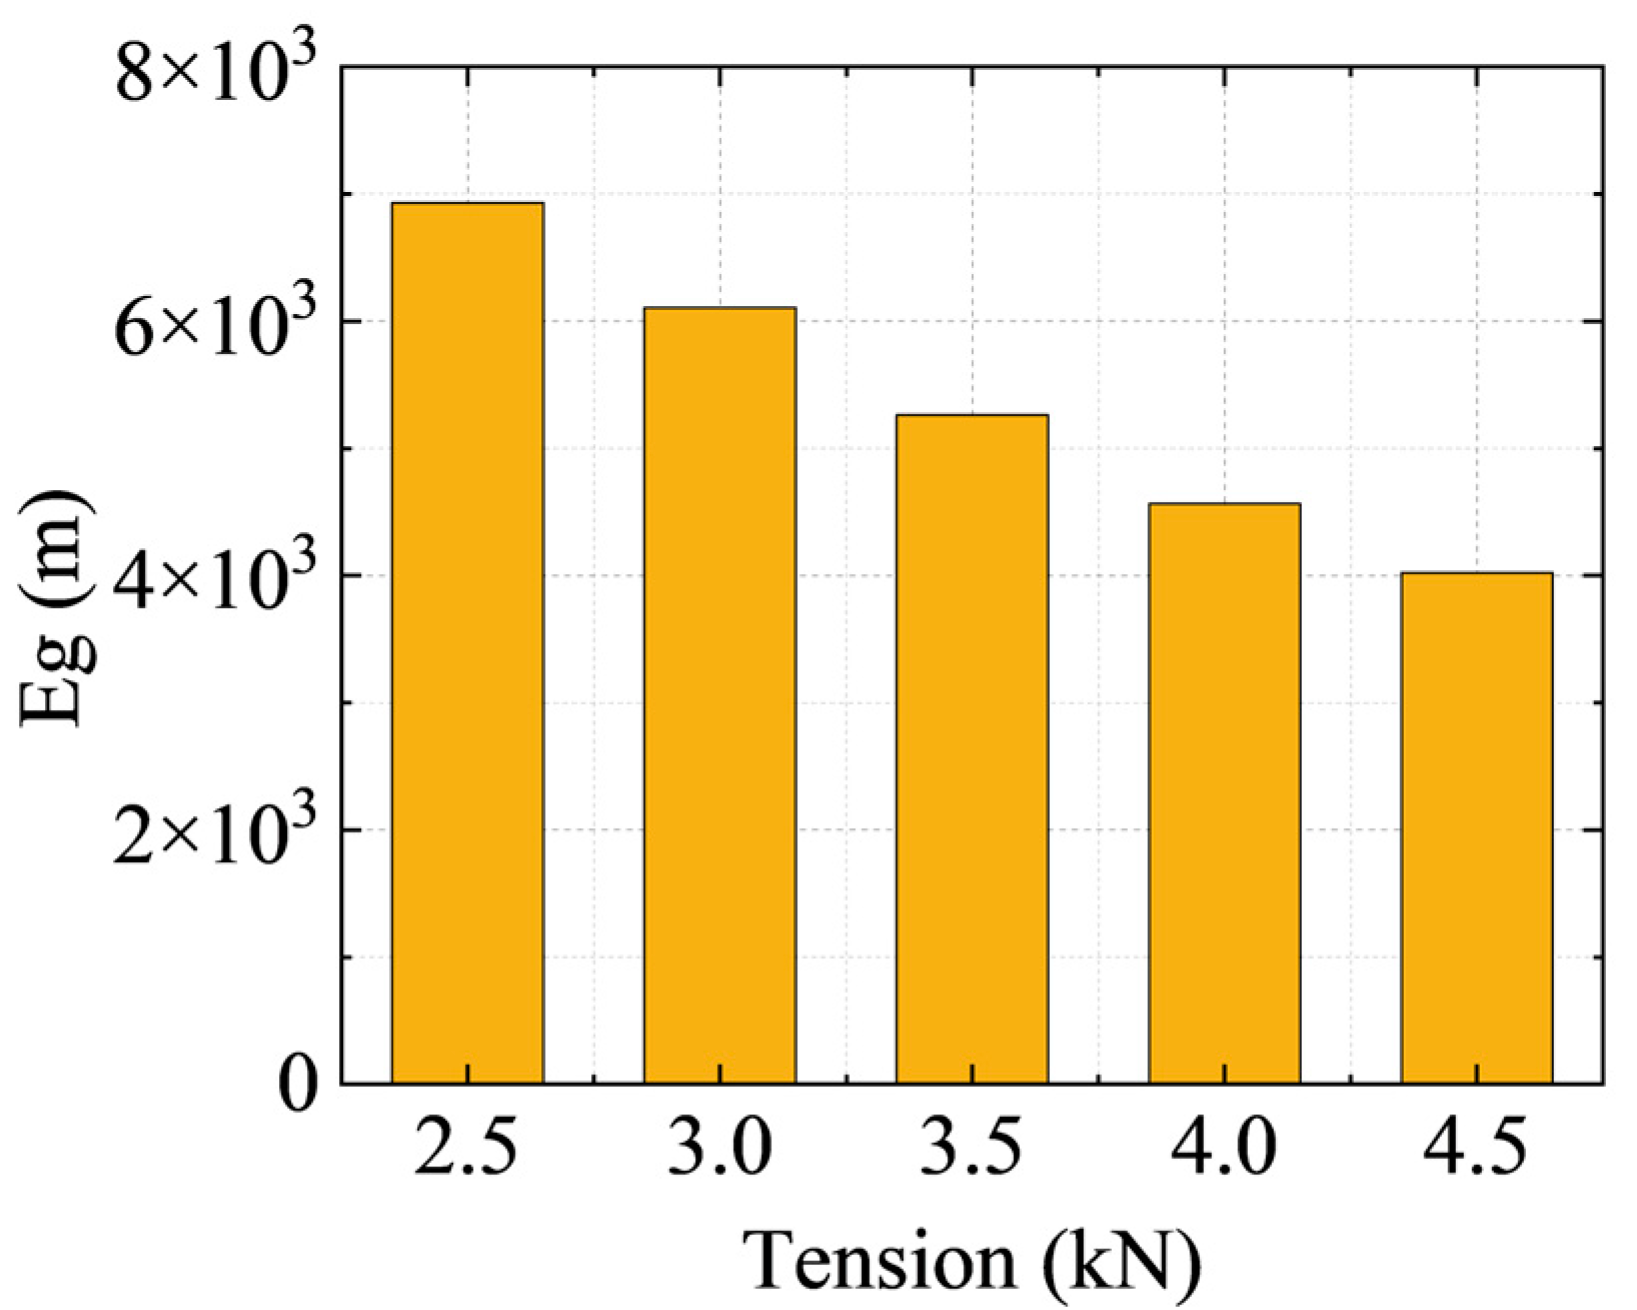
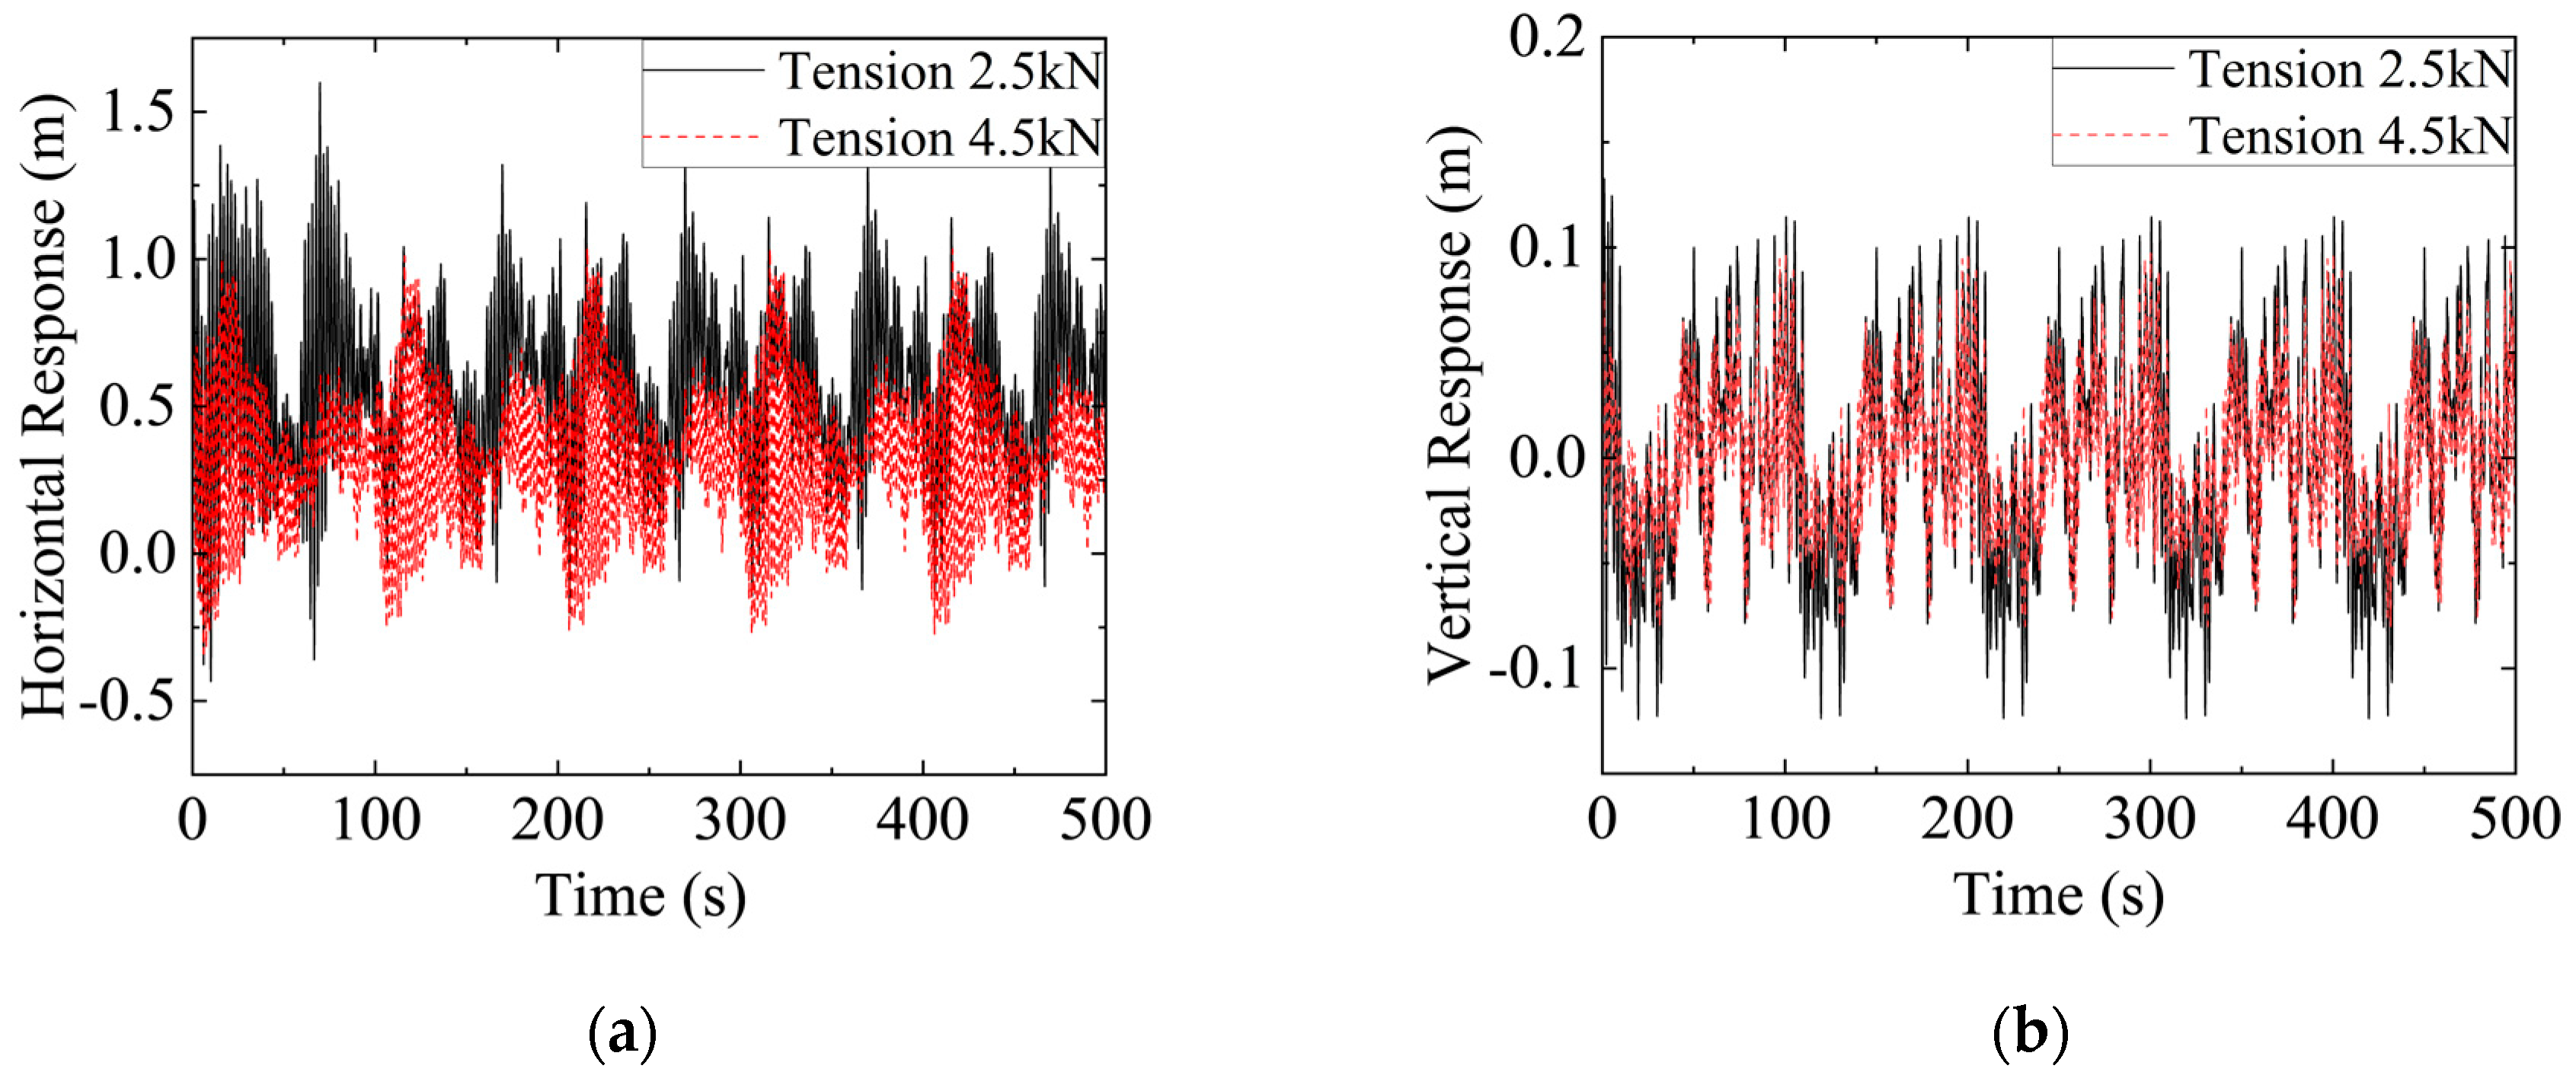
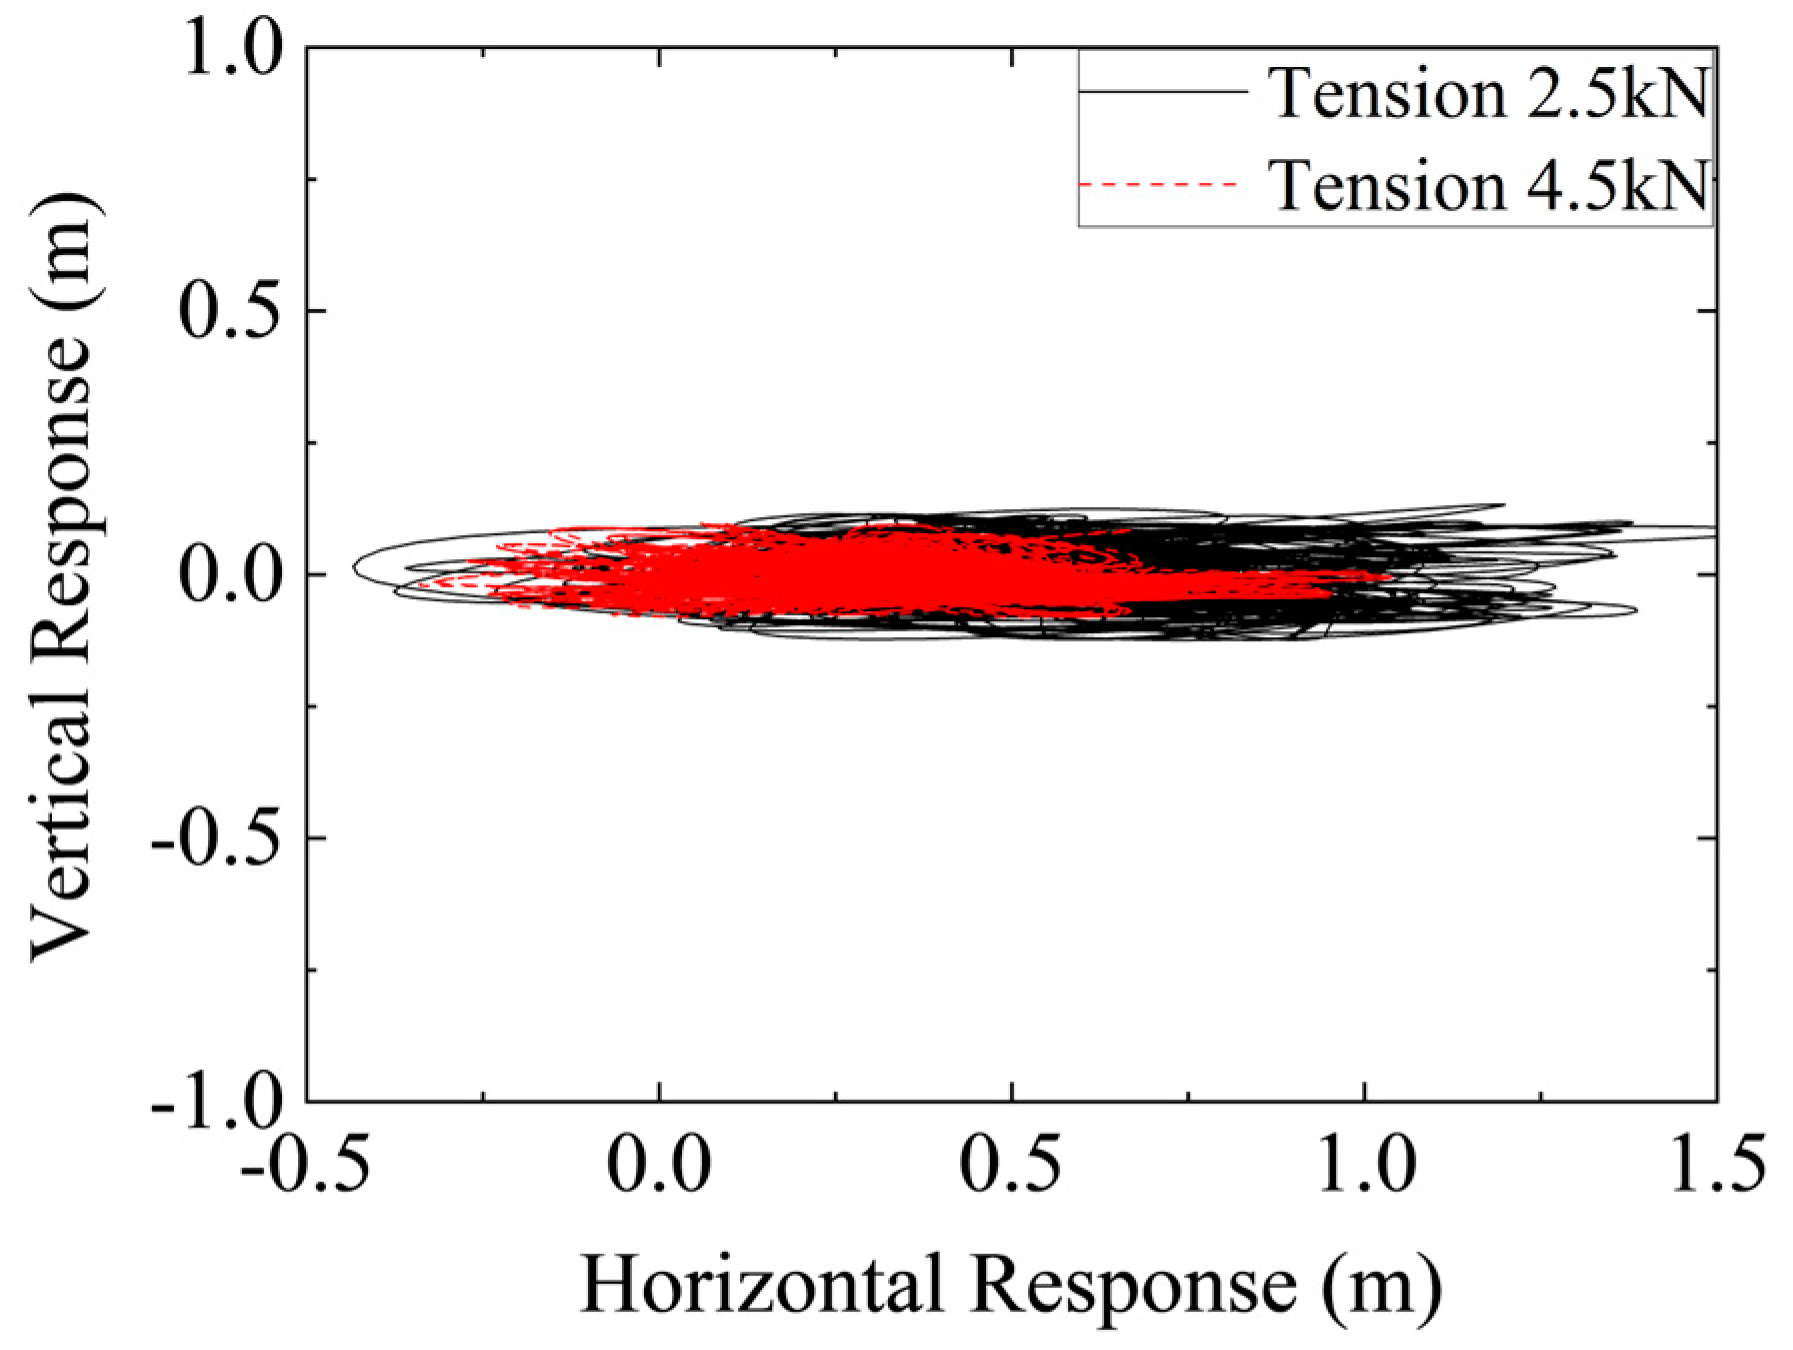
3.2. Influence of Tension on Wind-Induced Vibration

In wind-induced vibration analysis, the initial tension of the conductor is a critical parameter that significantly influences its dynamic response. To investigate the effects of different tension levels on the wind-induced vibration behavior of the auxiliary conductor, this study analyzes the displacement response characteristics of the conductor under a fixed wind speed of 20 m/s with multiple selected tension values.
Definition of scalarized root mean square displacement:
E g = 0 t u ( x z ( t ) x z ( 0 ) ) 2 + ( x y ( t ) x y ( 0 ) ) 2 d t
where x z ( t ) and x y ( t ) represent the vertical and horizontal displacements of the conductor at any given time, respectively. E g quantifies the degree of deviation of the conductor from its original position.
Figure 6 presents the trend of root mean square displacement variations under different tension levels. It can be observed that as the tension increases, the vibration amplitude of the conductor decreases markedly. This phenomenon indicates that higher initial tension effectively enhances the conductor’s stiffness, thereby suppressing wind-induced vibrations. However, the suppression effect is not linear; beyond a certain threshold, the influence of increasing tension on reducing vibration amplitude begins to level off, indicating a saturation effect.
To further investigate the specific effects of tension on wind-induced vibration, a time domain analysis is conducted to evaluate the displacement characteristics of the conductor under different tension levels. Figure 7a,b present the vibration response curves of the conductor in the horizontal and vertical directions under different tension levels, respectively. The time domain response reveals that, under low-tension conditions, the vibration amplitude is relatively large, exhibiting a distinct periodic pattern. In contrast, under high-tension conditions, the vibration amplitude is significantly reduced, and the vibration frequency exhibits a shift, demonstrating more complex dynamic characteristics.
Figure 8 shows the phase trajectory distribution of the conductor’s centroid under different tension levels. It can be observed that, under low-tension conditions, the centroid trajectory presents a relatively regular elliptical distribution, indicating that the vibration is primarily influenced by a single dominant frequency. However, under high-tension conditions, the amplitude is significantly reduced, suggesting that higher tension effectively suppresses wind-induced vibrations. Additionally, the symmetry of the conductor’s motion trajectory is enhanced, and nonlinear vibration phenomena are reduced.

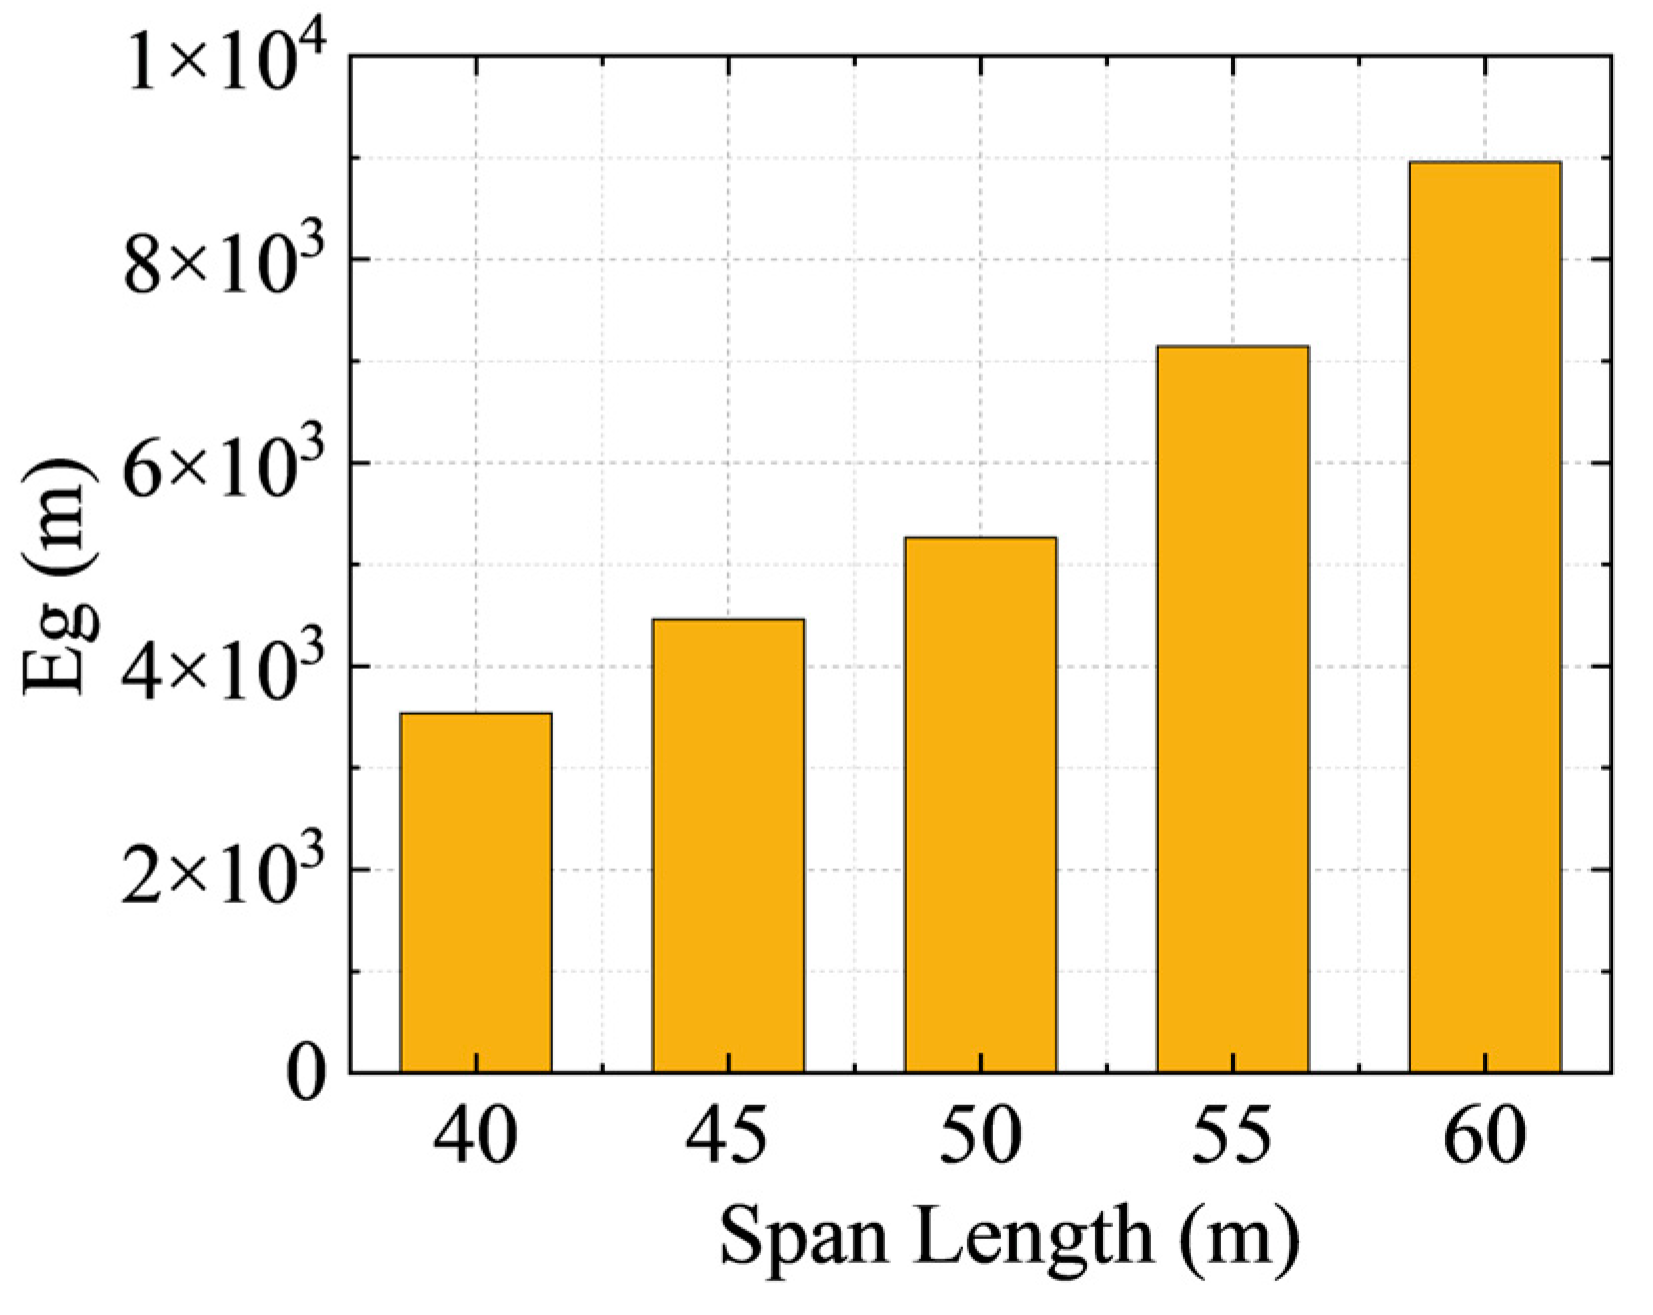
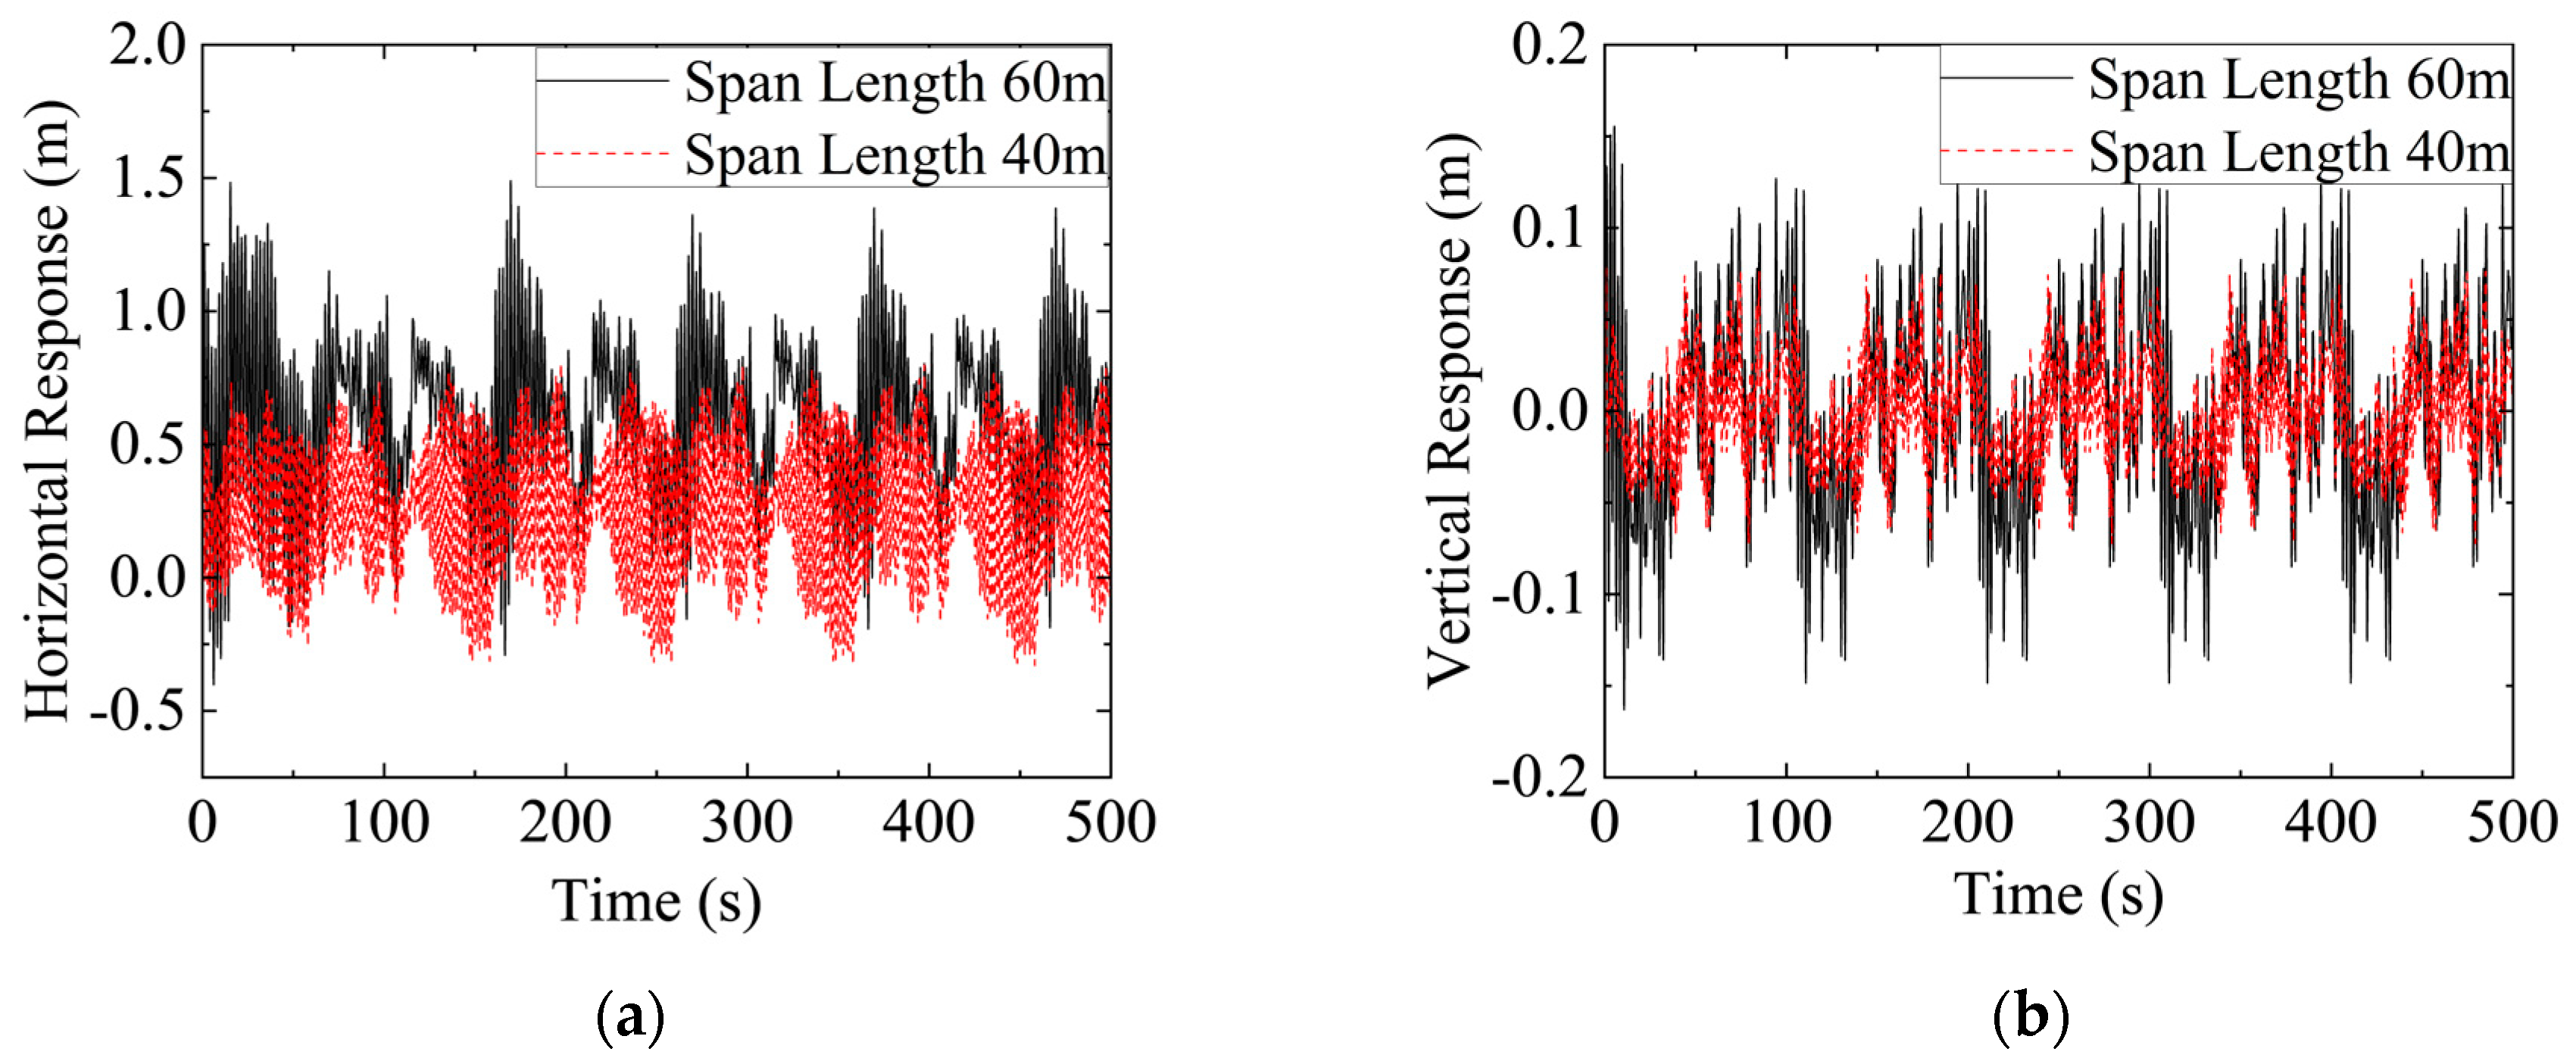
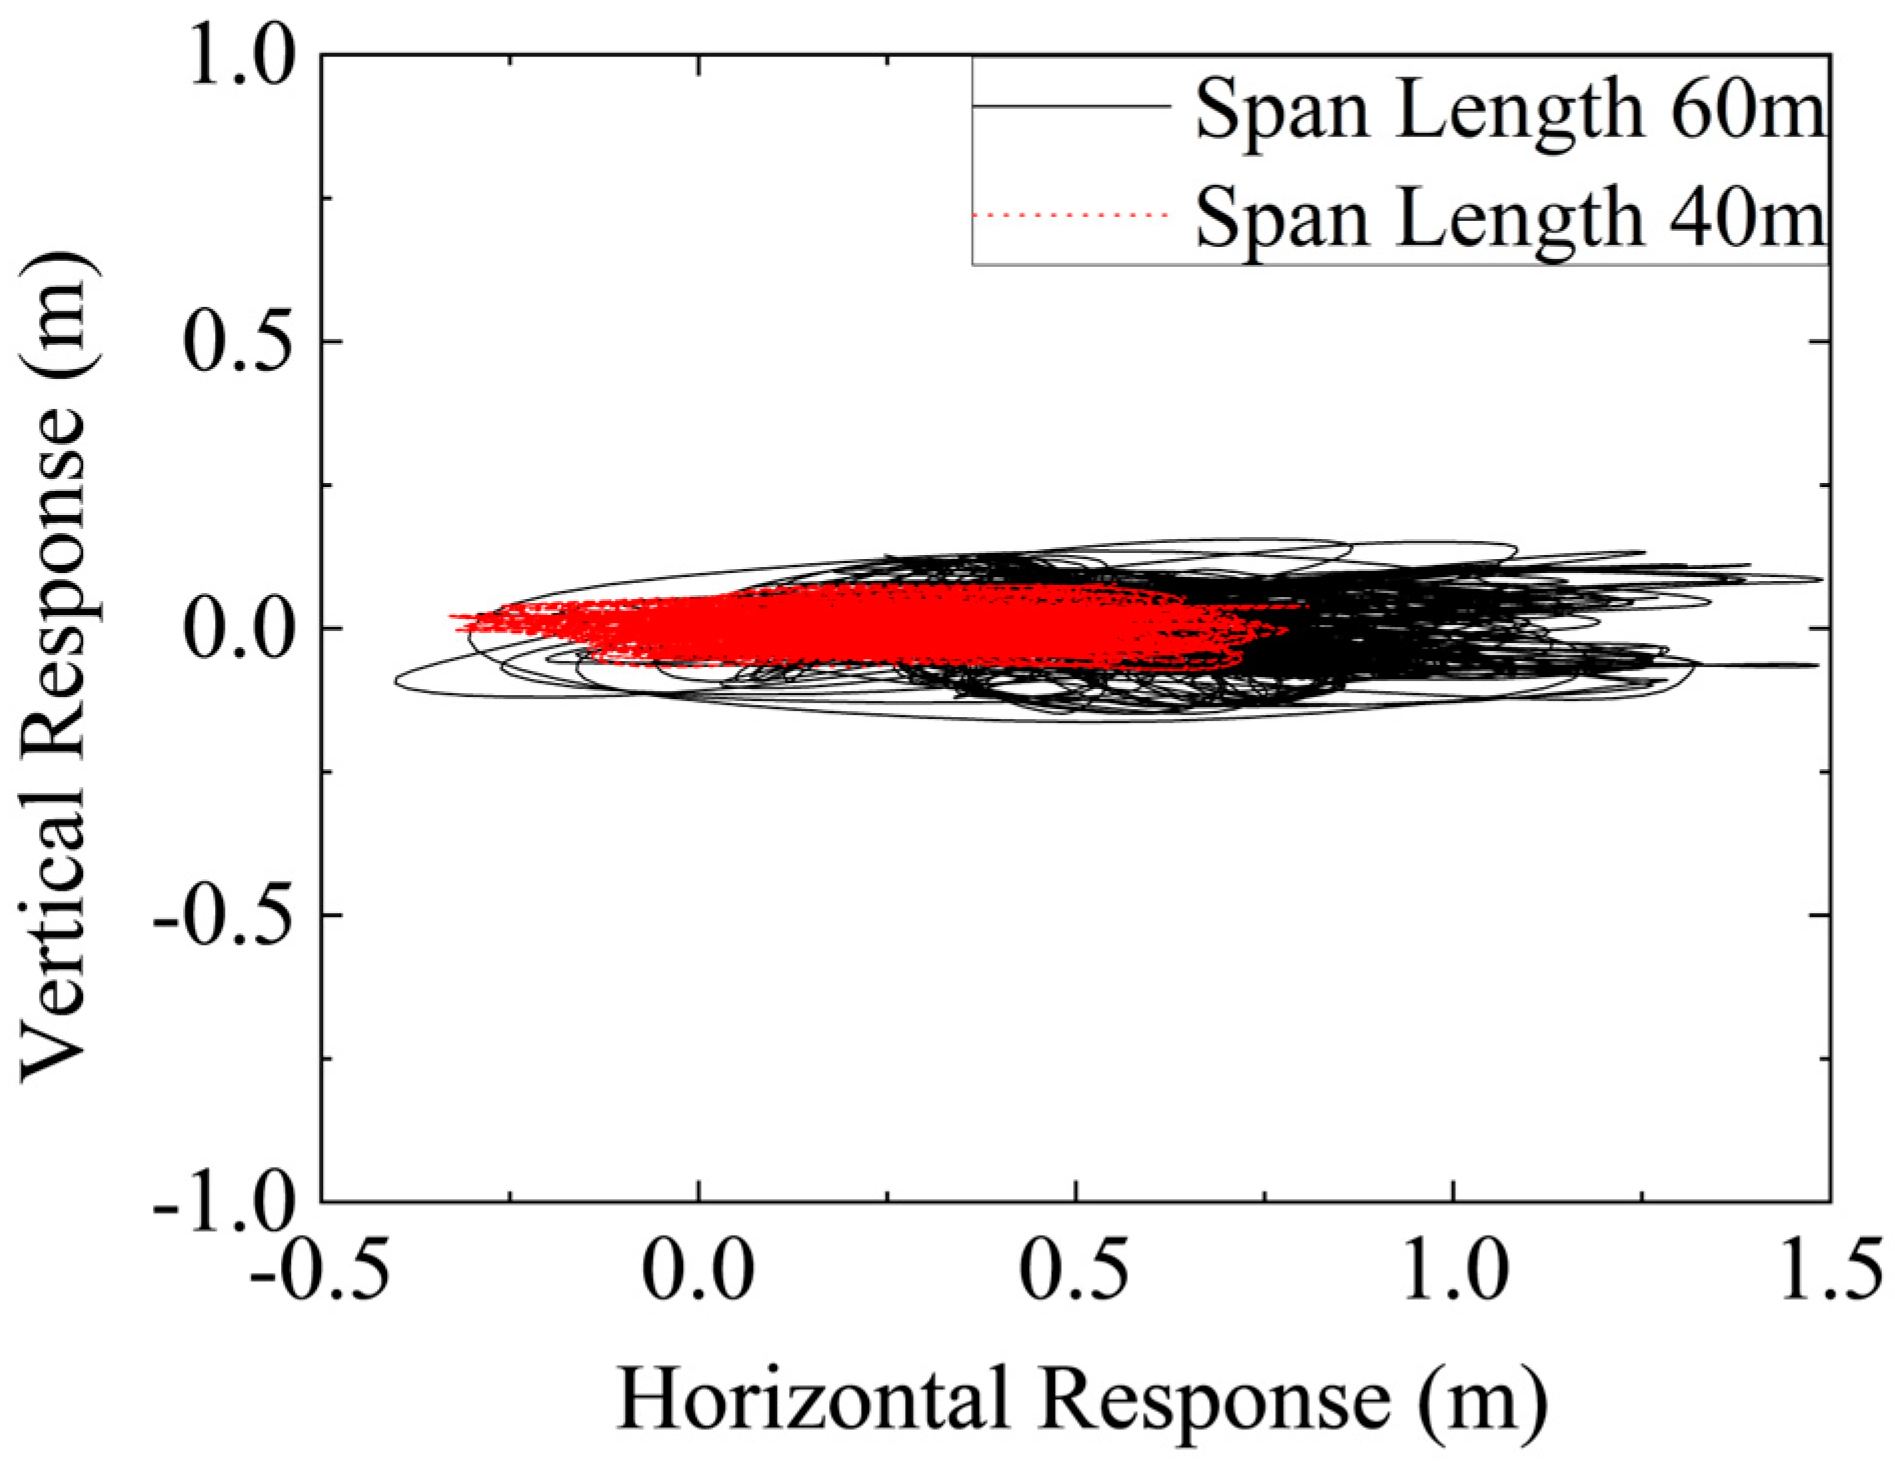
3.3. Influence of Span Length on Wind-Induced Vibration

In wind-induced vibration analysis, the span length of the conductor is another critical parameter influencing its dynamic response. To investigate the effects of different span lengths on the wind-induced vibration behavior of the auxiliary conductor, this study analyzes the displacement response characteristics under a fixed wind speed of 20 m/s for multiple selected span values.
Figure 9 presents the trend of root mean square displacement variations under different span lengths. As the span increases, the displacement response amplitude of the conductor exhibits an increasing trend. This suggests that a longer span increases conductor flexibility, making it more susceptible to wind excitation and amplifying vibration amplitude. A longer span may reduce local stiffness, making the structure more responsive to turbulent winds and increasing the likelihood of wind-induced instability.
To further analyze the specific effects of span length on wind-induced vibration response, a time domain analysis method is employed to examine the vibration characteristics of the conductor under different span conditions. Figure 10a,b present the vibration response curves in the horizontal and vertical directions, respectively. The time domain response indicates that under short-span conditions, the vibration amplitude remains relatively small, exhibiting a more regular vibration pattern. In contrast, under long-span conditions, the vibration amplitude increases significantly, and the vibration trajectory becomes more complex, indicating that the system is more strongly influenced by turbulence.
Figure 11 presents the phase trajectory distribution of the conductor’s centroid under different span lengths. It can be observed that under short-span conditions, the centroid trajectory exhibits a relatively regular elliptical distribution, suggesting that the conductor’s vibration is primarily dominated by low-order modes and remains relatively stable. However, as the span length increases, the conductor’s centroid trajectory becomes more dispersed, exhibiting greater irregularity. This indicates that longer spans reduce structural stiffness, making the conductors more vulnerable to wind excitation and aerodynamic instability, which in turn exacerbates vibration irregularities and increases the risk of severe oscillations.

4. Wind-Induced Vibration Response of Fittings

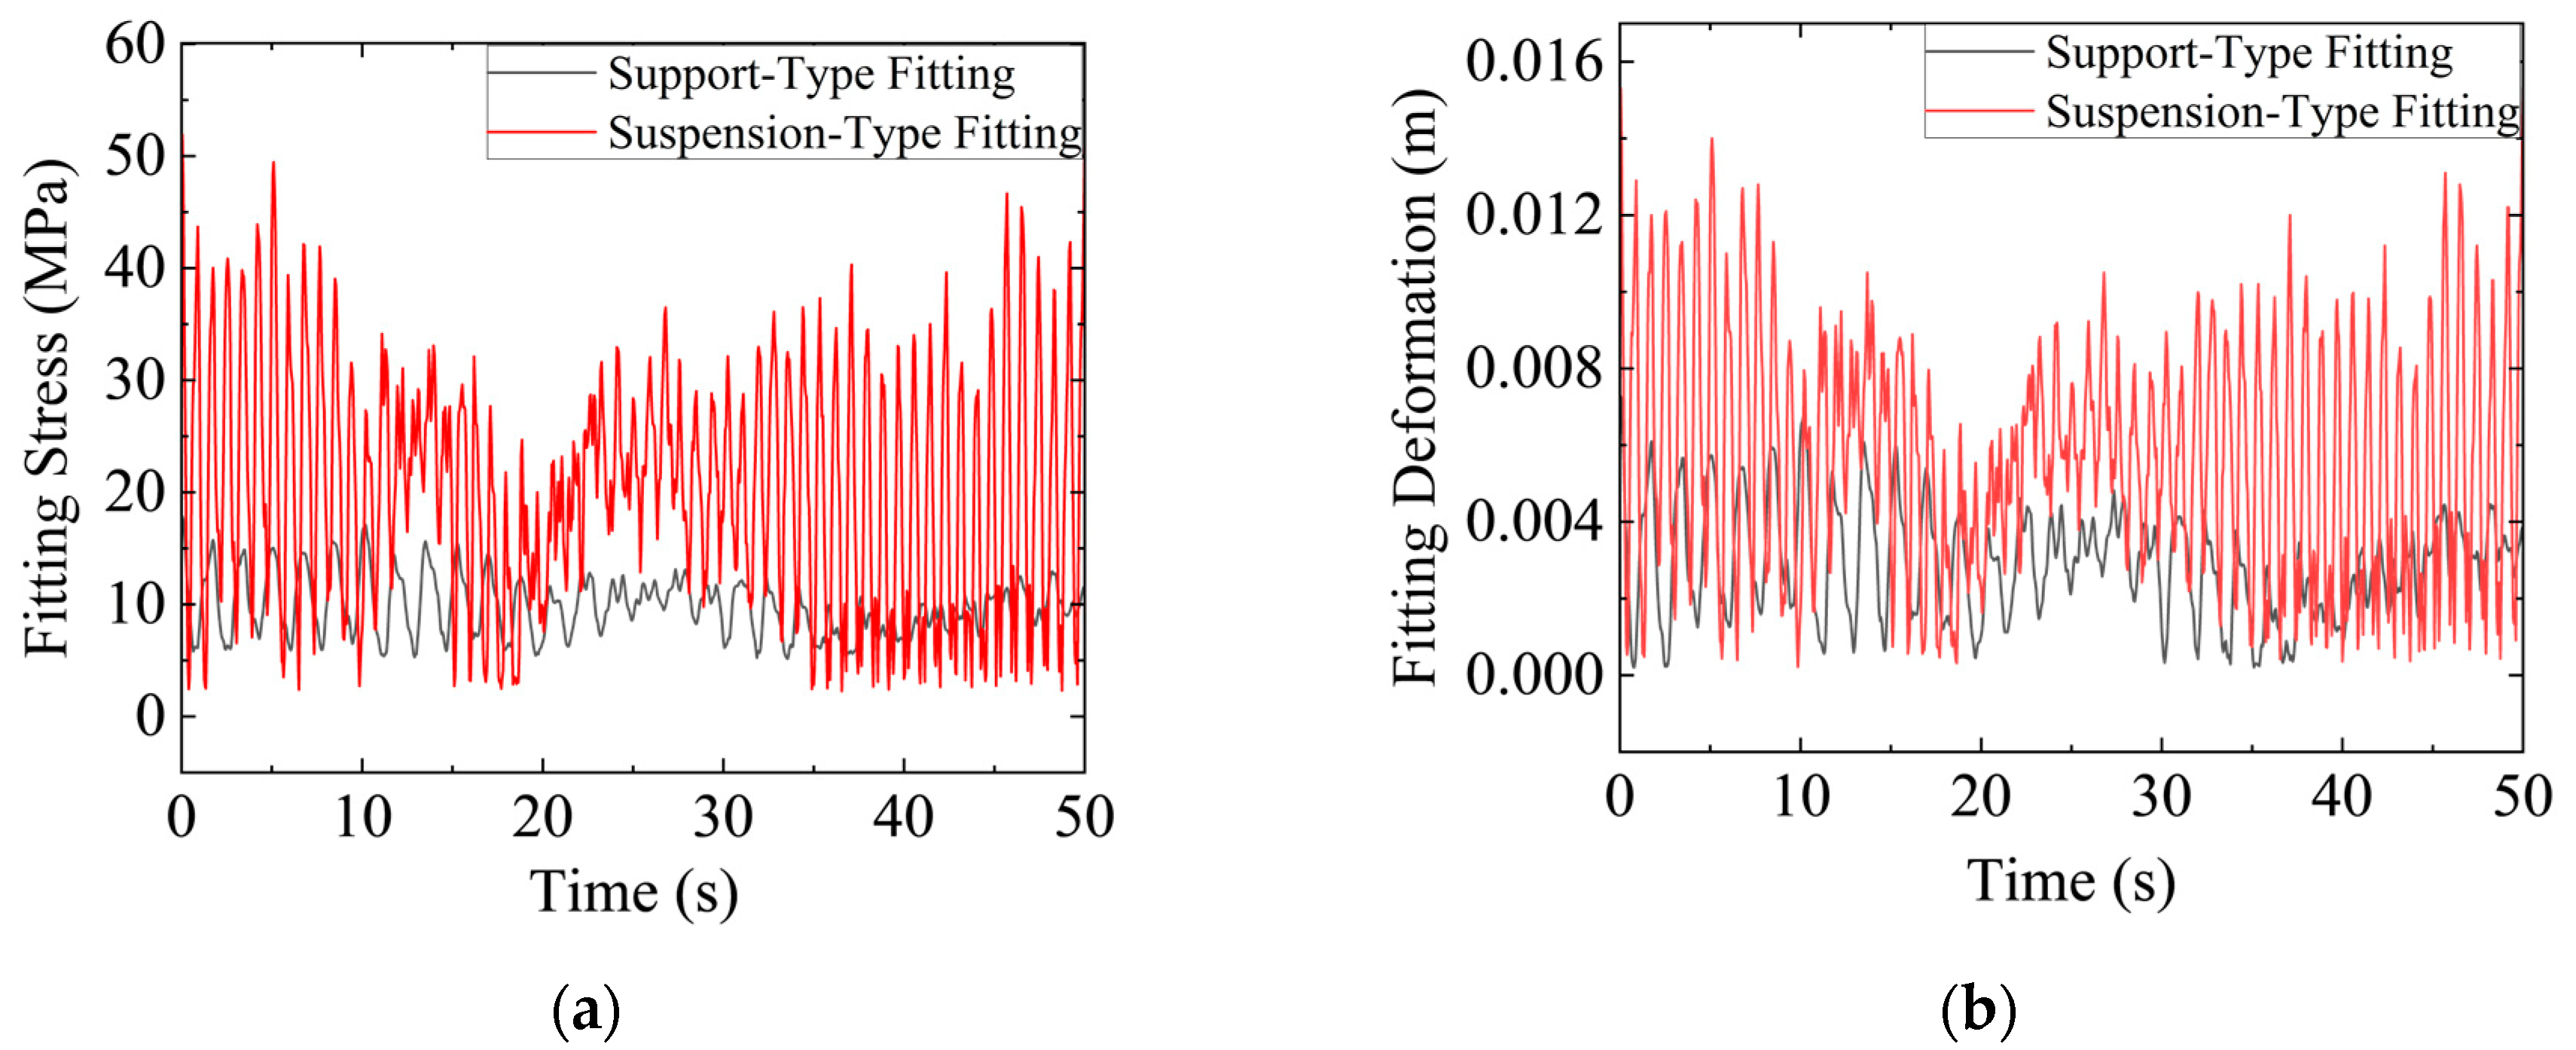
4.1. Overall Response Analysis of Fittings

In railway power supply system design and stability analysis, the dynamic response of connecting fittings is crucial to ensuring system safety. To examine the mechanical behavior and impact of different connecting fittings under wind excitation, this study develops two representative fitting models, as shown in Figure 12a,b. The model in Figure 12a represents a conventional support-type fitting, which secures the conductor through a rigid connection. It exhibits high load-bearing capacity and structural stability, making it suitable for applications that require enhanced conductor fixation and displacement prevention. In contrast, the model in Figure 12b is an improved suspension-type fitting connection, primarily designed for flexible connections between auxiliary conductors and main conductors. This configuration helps attenuate vibration transmission and improves system stability. Each fitting type offers distinct advantages—the suspension-type fitting enhances conductor flexibility and operational safety, whereas the support-type fitting enhances overall structural stiffness and positioning precision.
To further clarify the relationship between the mechanical behavior of connecting fittings and their wind-induced vibration response, this study employs both time domain and frequency domain analyses to assess the stress fluctuations of different fittings under strong wind conditions. Figure 13a presents the maximum stress variation curves of both fittings under a span length of 50 m and a wind speed of 20 m/s. From the time domain response, the suspension-type fitting exhibits a larger stress fluctuation amplitude, indicating strong transient response characteristics. This suggests that its dynamic adaptability under wind excitation is relatively weaker. In contrast, the stress response curve of the support-type fitting is relatively stable, with smaller fluctuations, demonstrating superior wind resistance.
Figure 13b further illustrates the deformation variation in the two fittings under wind excitation. It can be observed that the deformation of the suspension-type fitting fluctuates significantly, exhibiting strong periodic variation characteristics. This indicates lower stiffness under wind excitation, making it more susceptible to external excitations and resulting in greater structural deformation. Such excessive deformation may lead to fatigue accumulation at the connection points, thereby reducing the long-term stability of the system. Comparatively, the support-type fitting exhibits significantly smaller deformation fluctuations, suggesting that its optimized structural design provides higher wind resistance. It effectively distributes external loads, reduces wind-induced structural deformations, and enhances the reliability and service life of the fitting.

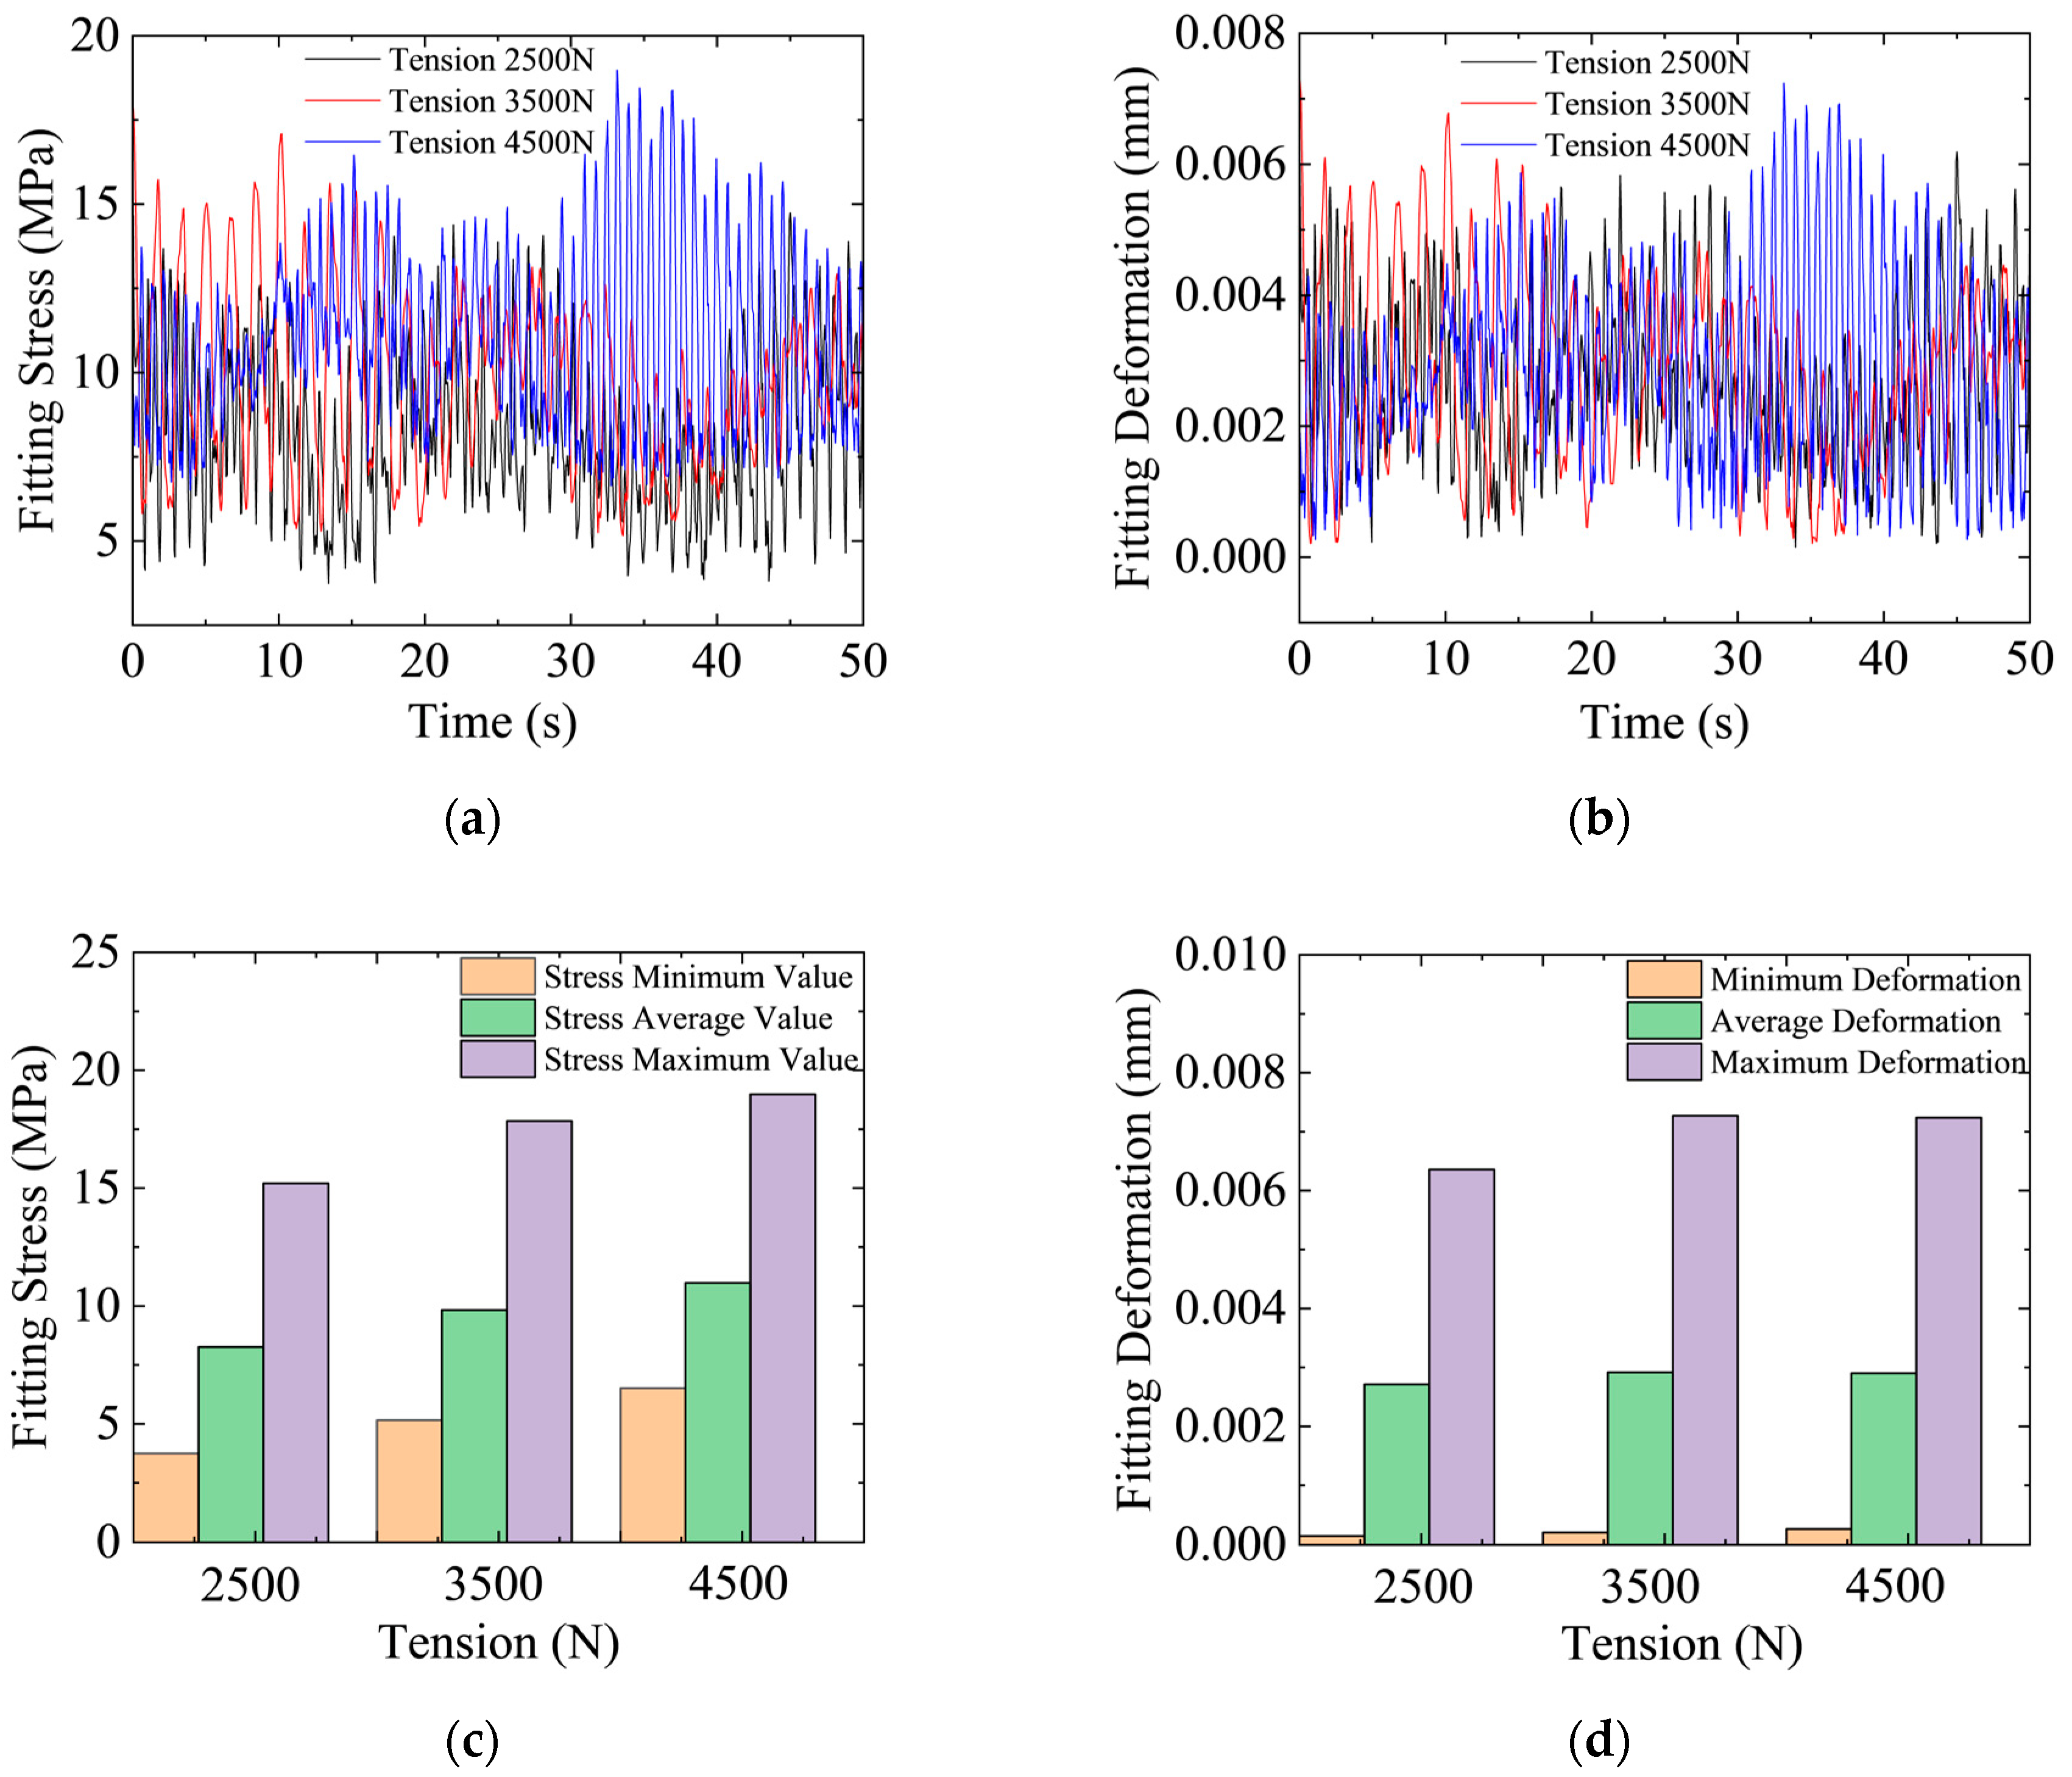
4.2. Evaluation of Fittings Under Different Tension Levels

Figure 14 illustrates the wind-induced vibration response of the support-type fitting under varying tension levels. Various loading conditions were set to examine the vibration characteristics of the fitting under different loads. To ensure the reliability of the experimental results, comparative tests were performed at a wind speed of 20 m/s, focusing on the effects of varying applied loads on the mechanical behavior of the fitting.
As shown in Figure 14a,c, the stress in the fitting increases with the applied load. This suggests that higher loads induce a more complex stress state under wind excitation, resulting in greater stress responses. In contrast, under lower load conditions, the stress variations are more moderate, suggesting that at lower load levels, the system can stably withstand wind load excitations, and stress concentration effects are less pronounced compared to high-load conditions.
Figure 14b,d illustrate the deformation trends of the fitting under different applied loads. As the applied force increases, the deformation of the fitting gradually increases, indicating a relative reduction in structural stiffness. This leads to larger deformations under wind excitation, particularly under high-load conditions, where the deformation significantly affects the stability of the fitting.

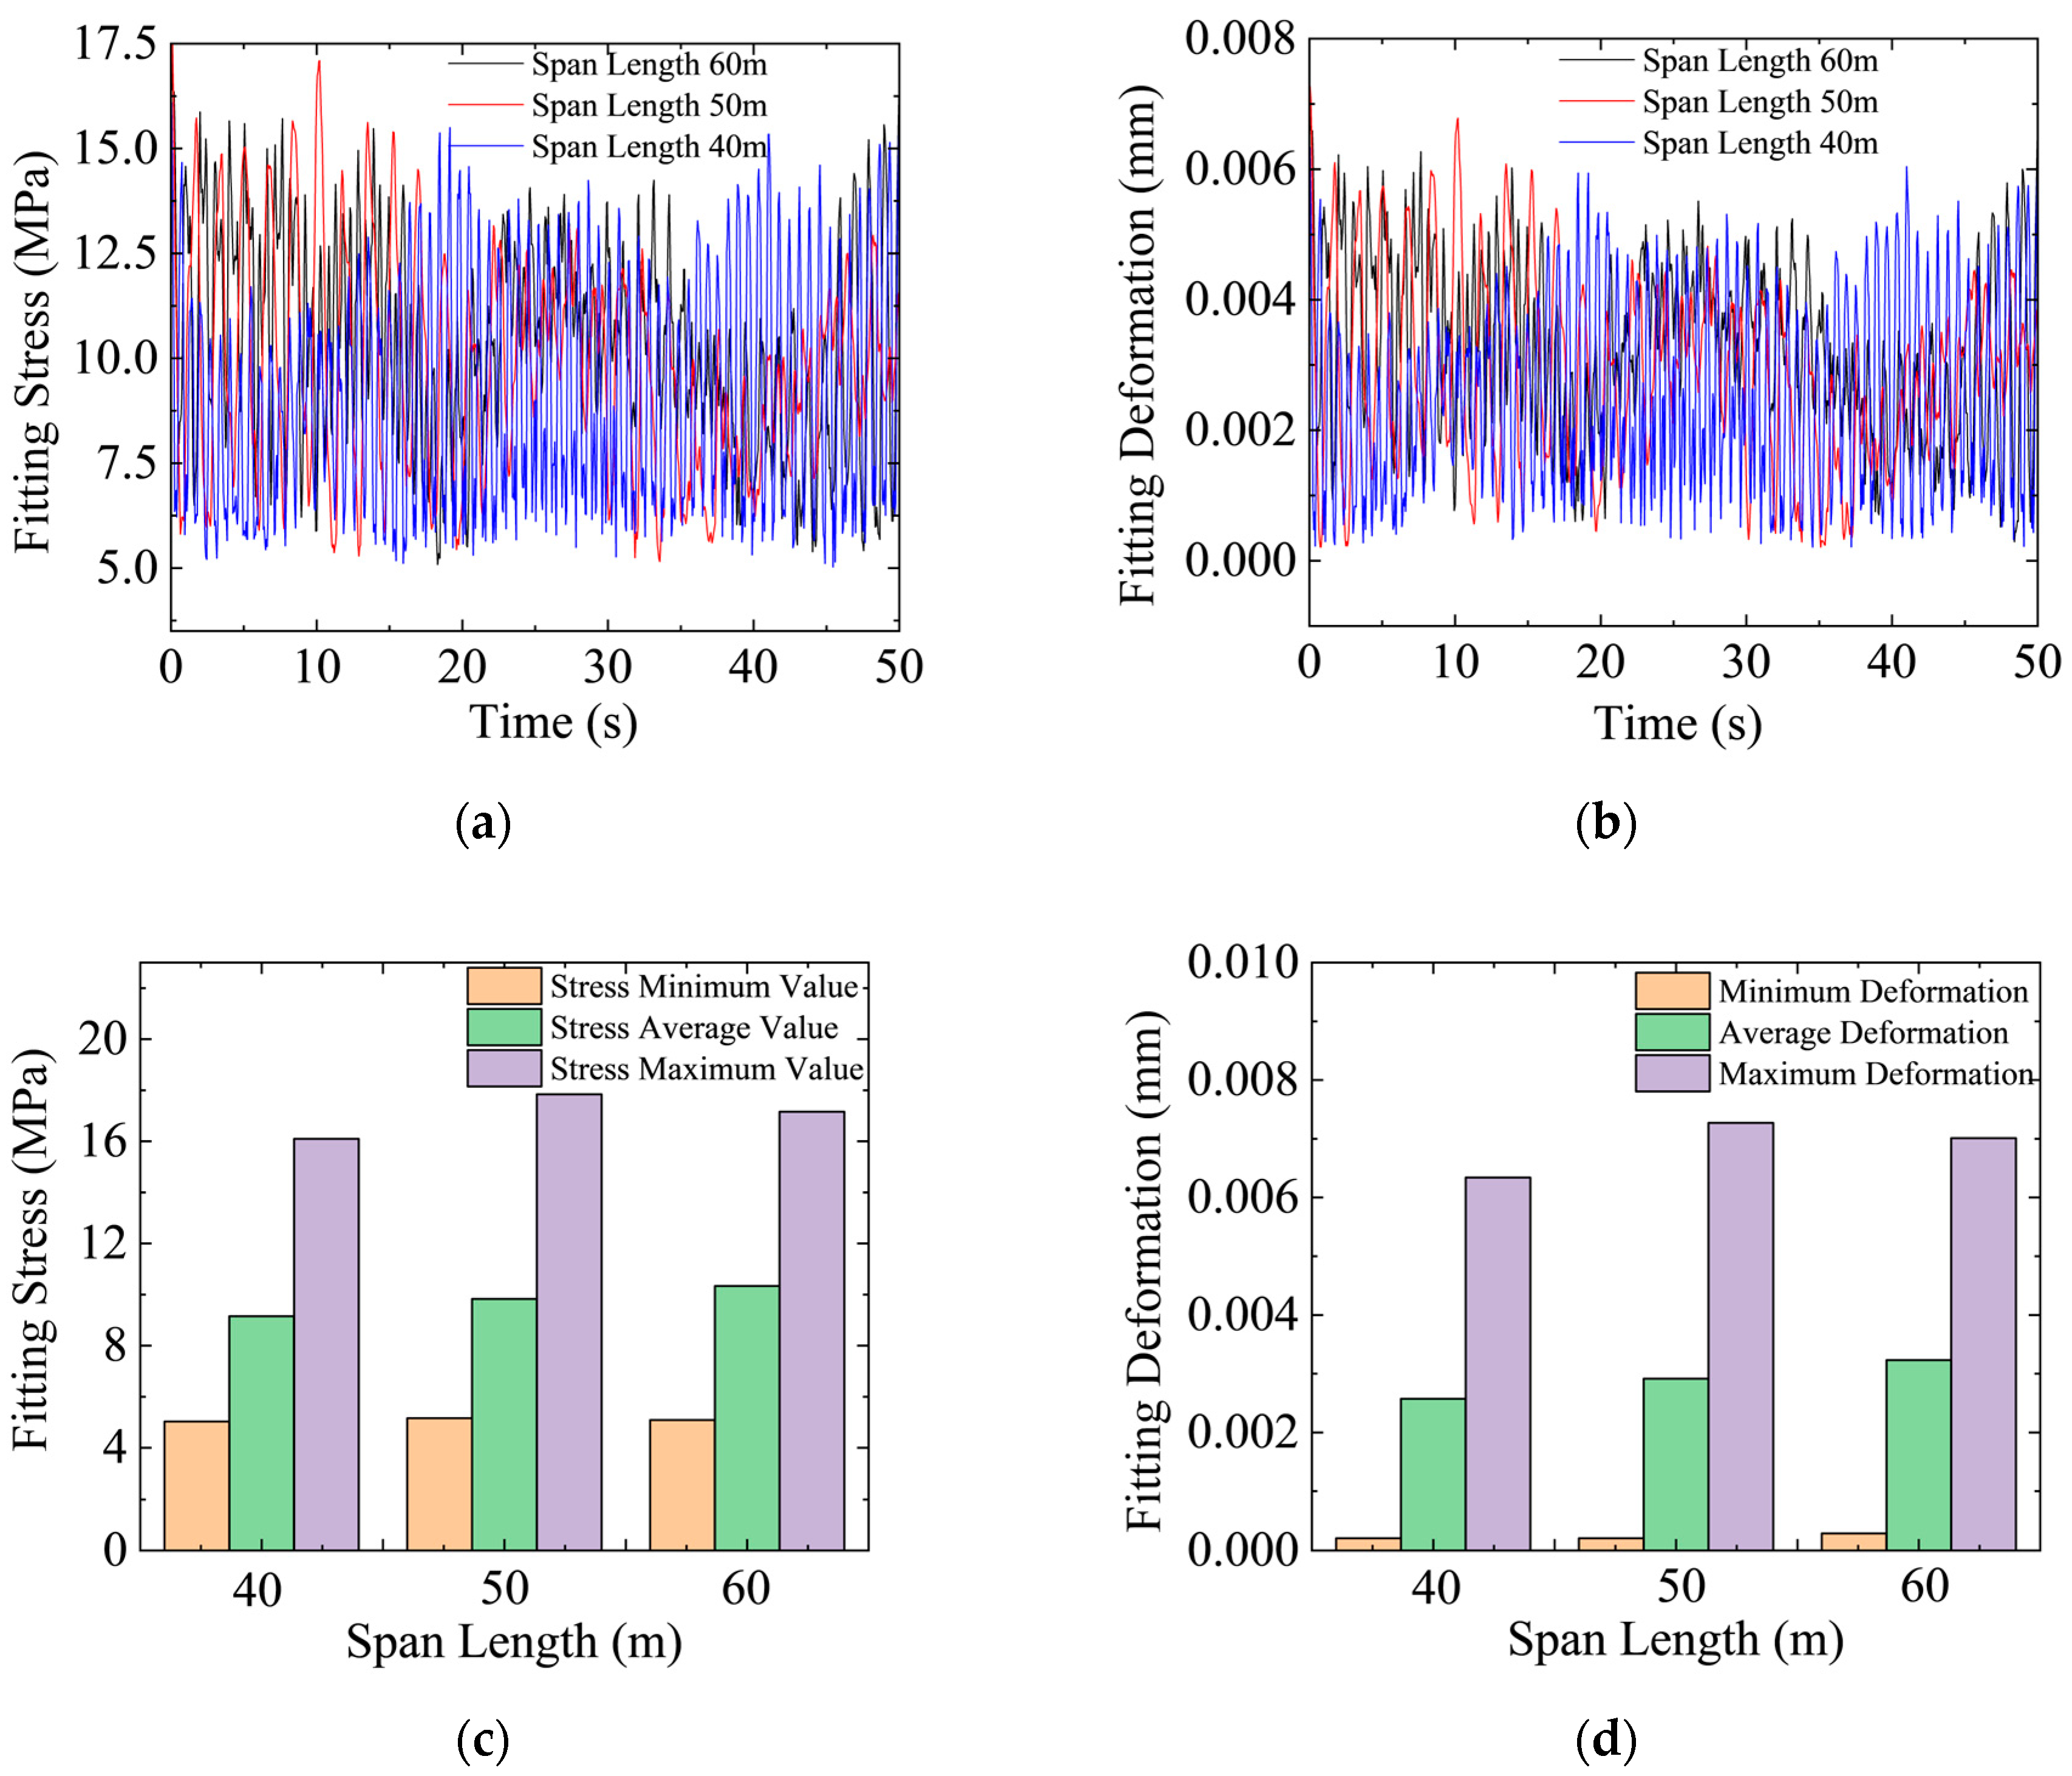
4.3. Evaluation of Fittings Under Different Span Lengths

Figure 15 illustrates the wind-induced vibration response of the support-type fitting under varying span lengths. Different span lengths were selected to examine the vibration characteristics of the fitting. To ensure the reliability of the experimental results, comparative tests were performed at a wind speed of 20 m/s, examining the effects of different spans on the mechanical behavior of the fitting.
Figure 15a,c indicate that, as the span length increases, the overall stress in the fitting rises accordingly. This suggests that with longer spans, wind load effects on the fitting become more pronounced, resulting in greater stress responses. Conversely, when the span is reduced, stress variations remain relatively minor, suggesting that the system exhibits greater stability against wind load disturbances at shorter spans, with reduced stress concentrations.
Figure 15b,d show that the deformation of the fitting increases with span length, suggesting that under larger spans, the structural stiffness of the fitting is relatively reduced, resulting in more pronounced deformations under wind excitation. This effect is particularly evident at a span of 60 m, significantly impacting the long-term stability and reliability of the fitting.

5. Conclusions and Research Perspectives

This study focuses on the vibration characteristics of additional conductors and their fittings under wind loads and proposes a nonlinear dynamic model based on the finite element method. The model can accurately capture the wind-induced vibration responses of additional conductors under varying wind speeds, tensions, and span conditions. Compared with traditional simplified mathematical models and linear assumption approaches, the present work adopts the Absolute Nodal Coordinate Formulation (ANCF) to construct a nonlinear finite element model, which fully accounts for the effects of wind speed fluctuations and the nonlinear deformation of the conductors, thereby achieving a more realistic and precise analysis of wind-induced vibration behavior. In addition, the Newmark-β method is introduced for time domain numerical simulation, further improving the computational accuracy and solution efficiency of the model. The main conclusions can be summarized as follows:
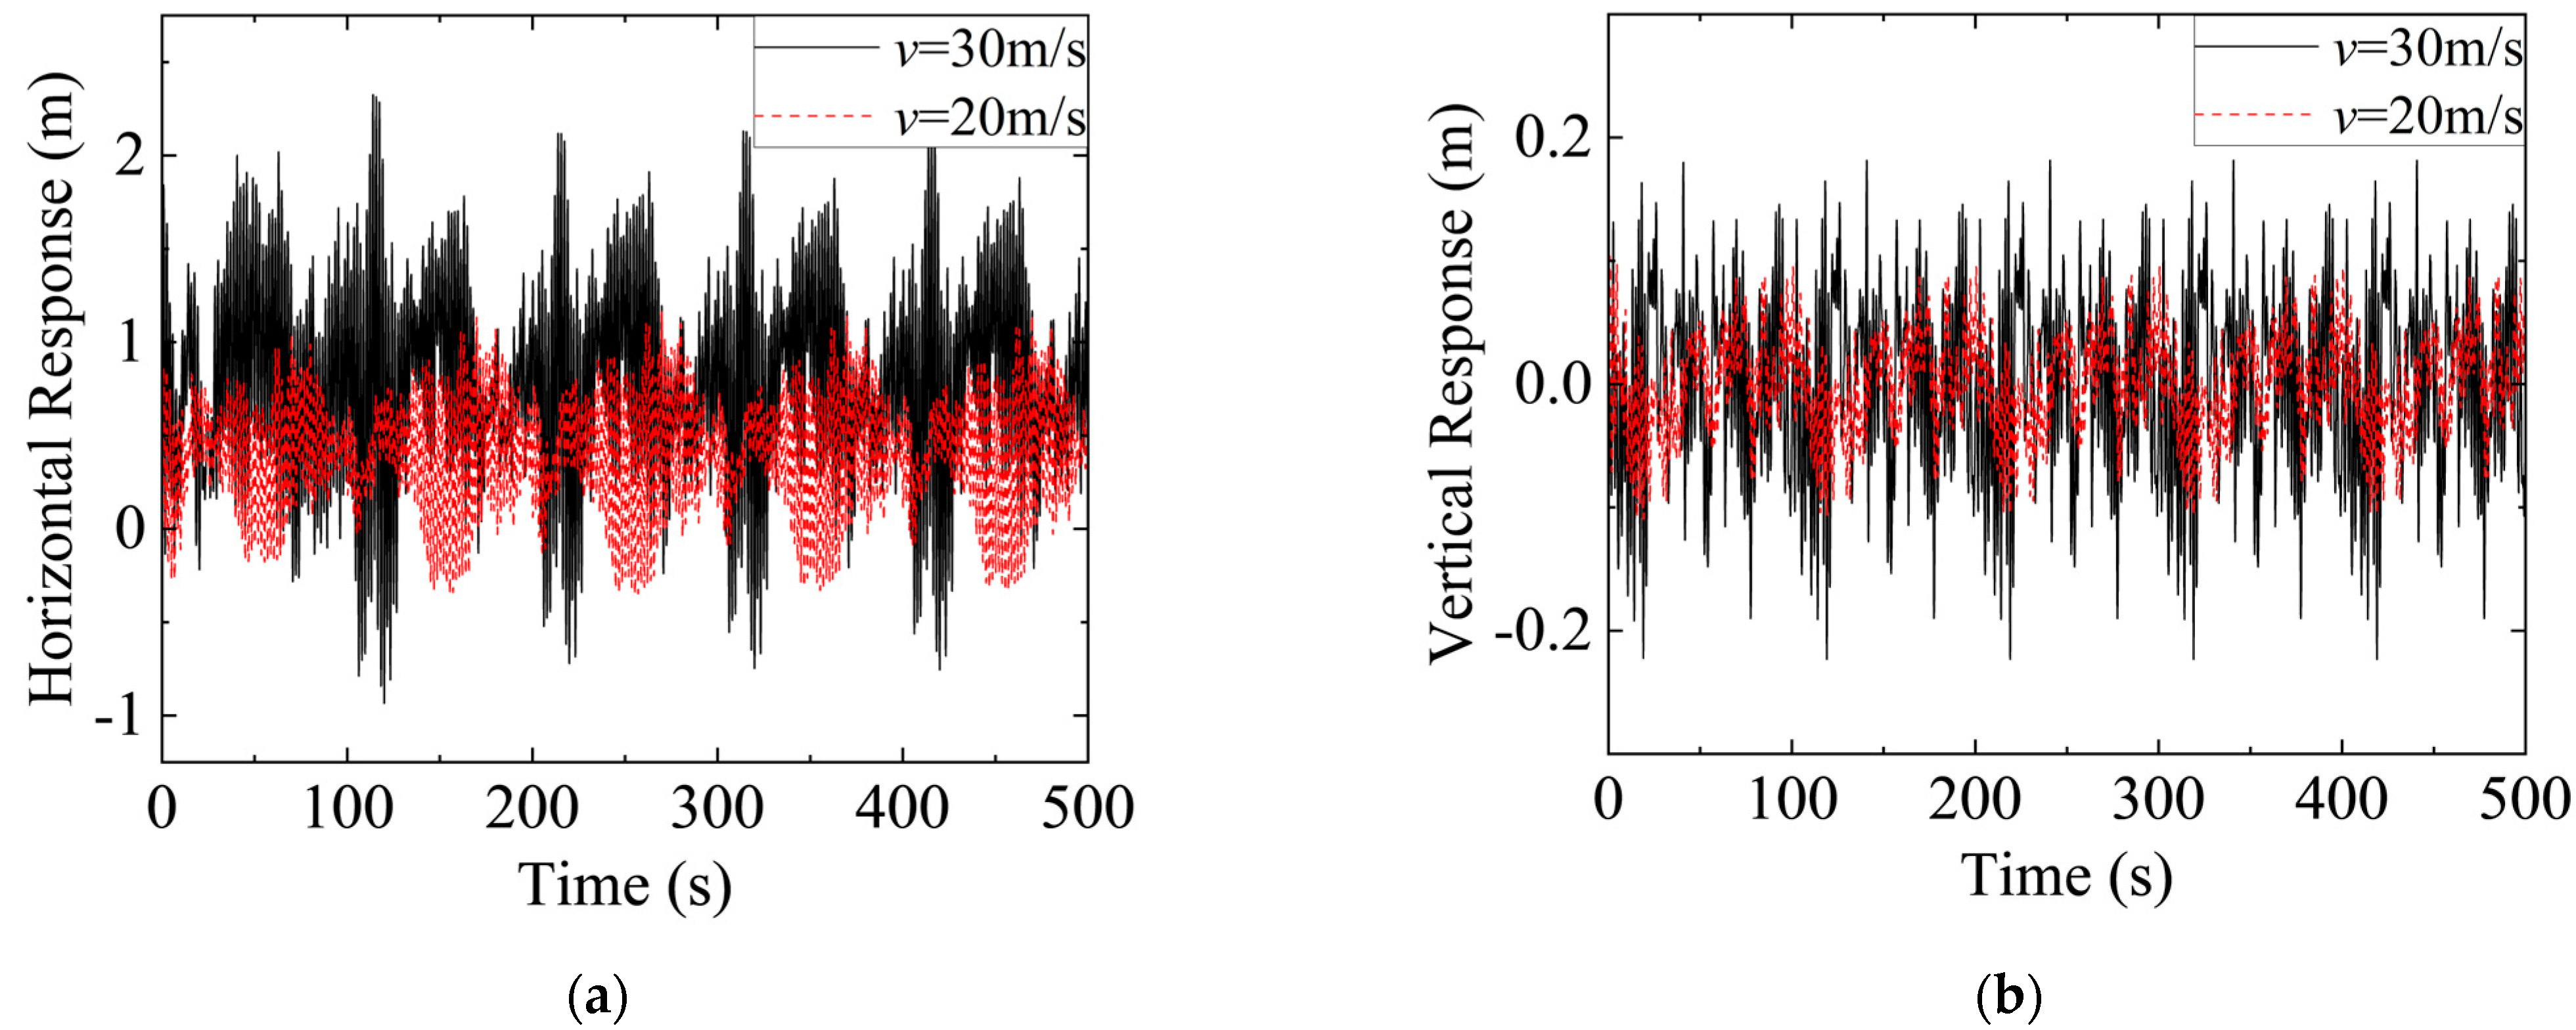
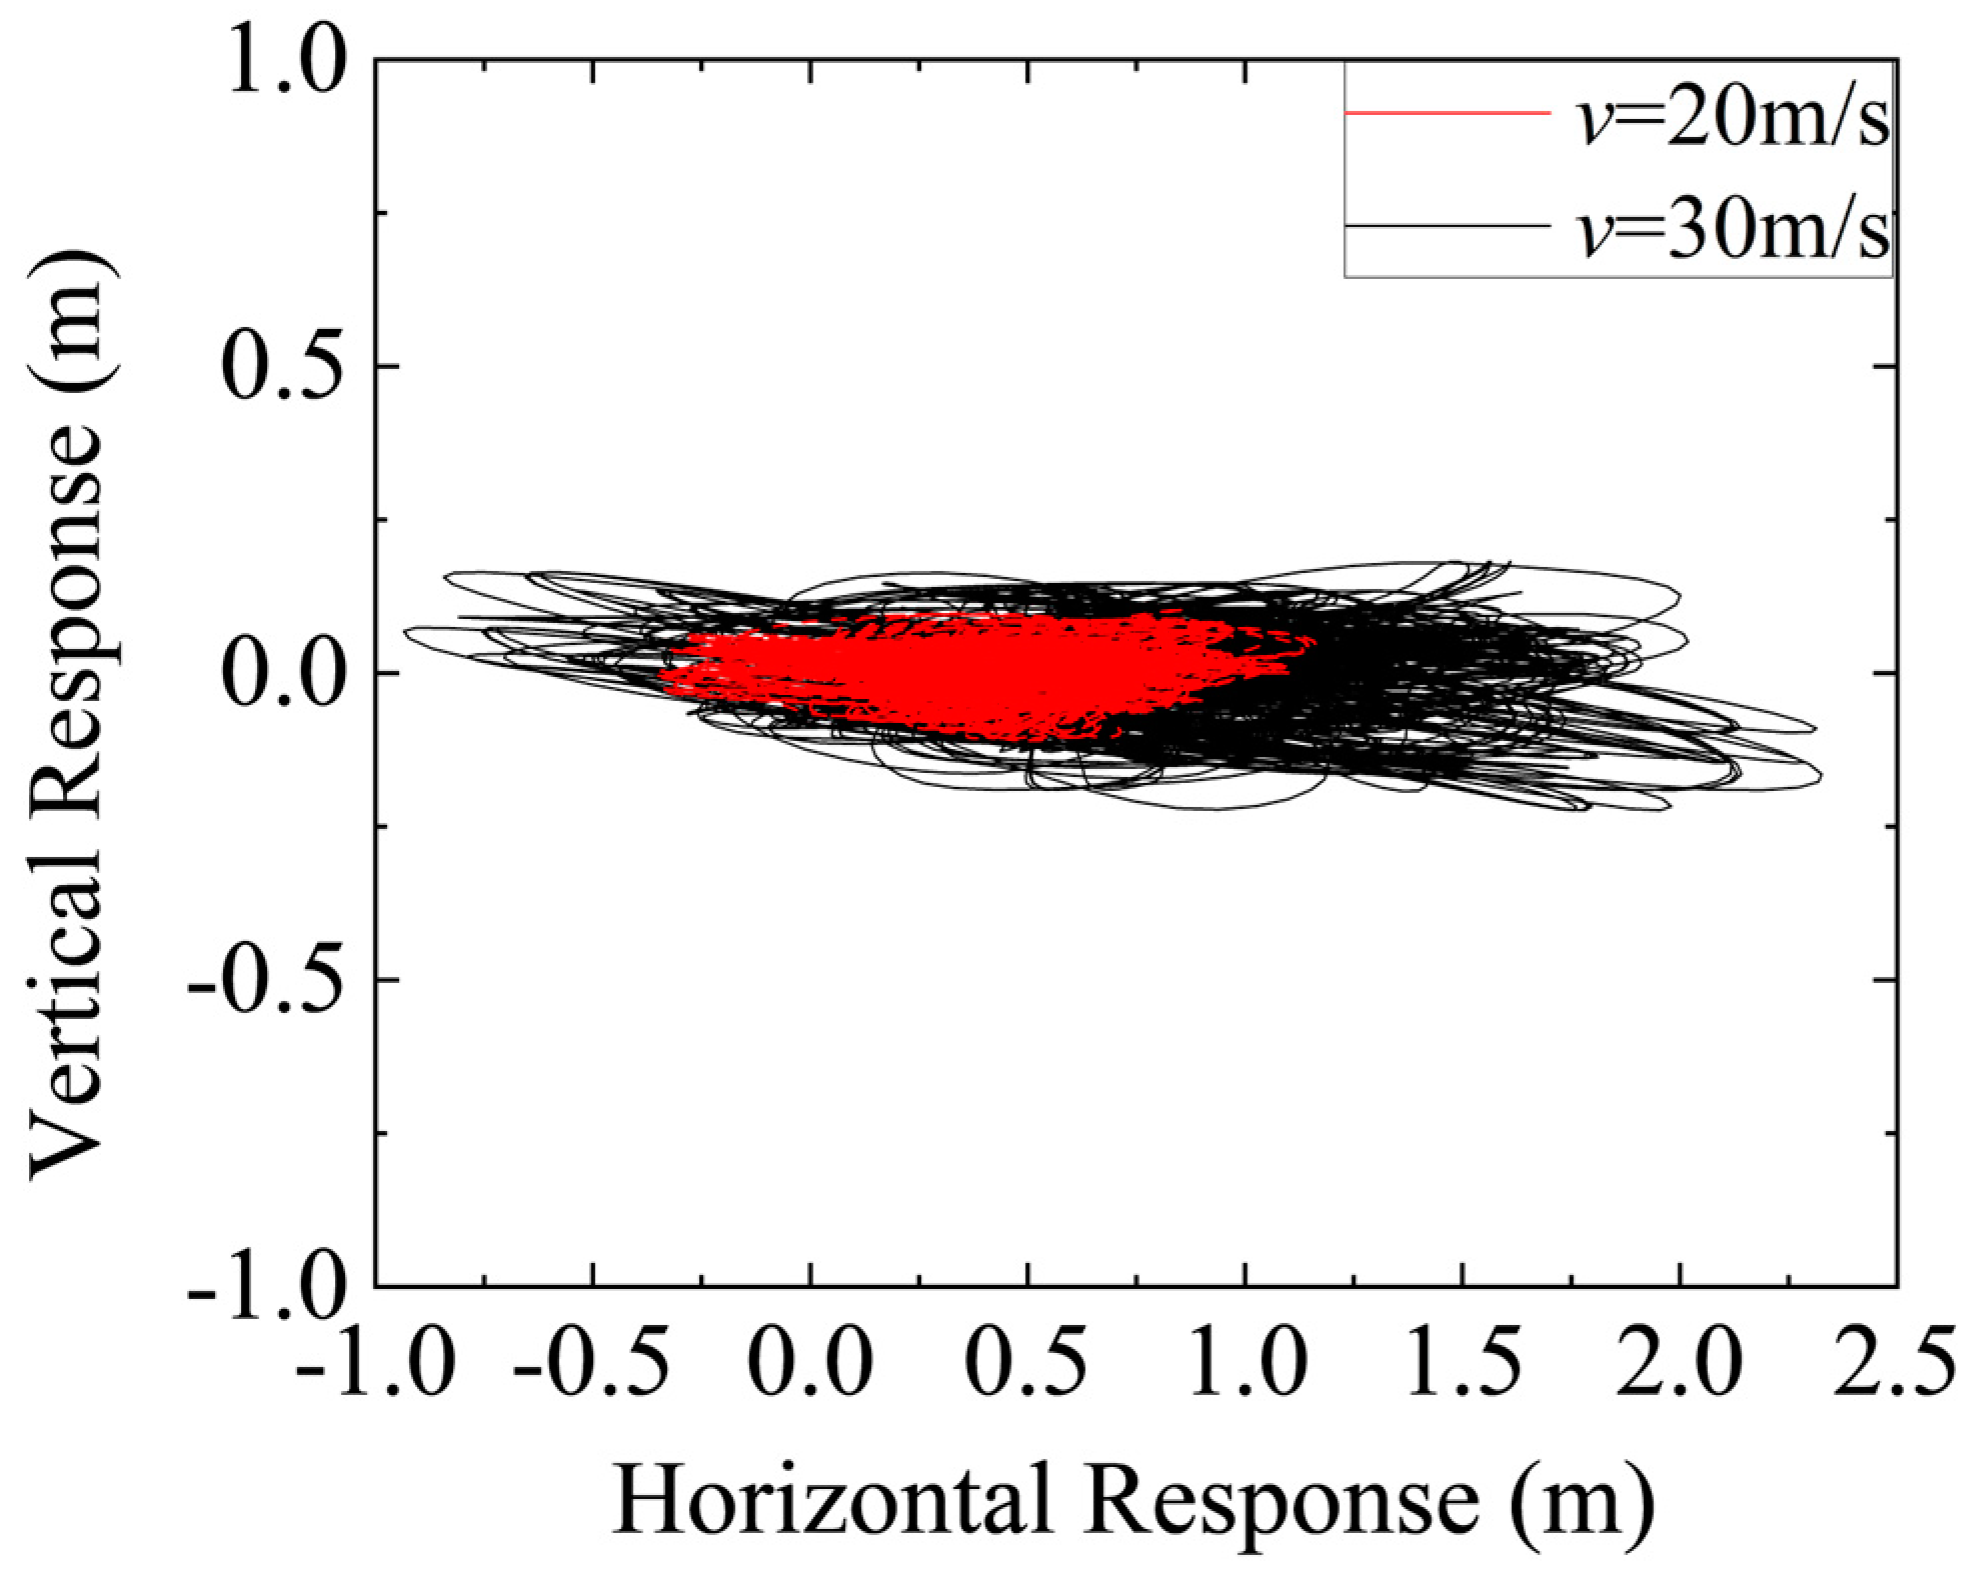
  • Wind speed is a primary factor influencing the wind-induced vibration response of auxiliary conductors. At low wind speeds, conductor vibrations remain relatively stable with small amplitudes, predominantly exhibiting low-frequency oscillations. As wind speed increases, the vibration response intensifies, characterized by larger amplitudes and more complex modal features. Additionally, the characteristics of the stochastic wind time history directly influence the system’s vibration patterns.
  • Conductor tension plays a crucial role in mitigating wind-induced vibrations. A moderate increase in conductor tension enhances structural stiffness, suppresses vibration amplitudes, and reduces vibration energy accumulation, thereby lowering the risk of fatigue damage. However, the benefits of increasing tension are not unlimited. Excessive tension may lead to high internal stress, potentially compromising the long-term reliability of the conductor.
  • Span length has a substantial impact on the wind-induced vibration characteristics of auxiliary conductors. Conductors with shorter spans experience reduced wind-induced vibrations due to increased structural stiffness. In contrast, longer-span conductors, with increased flexibility, are more susceptible to wind load excitations, resulting in larger vibration amplitudes.
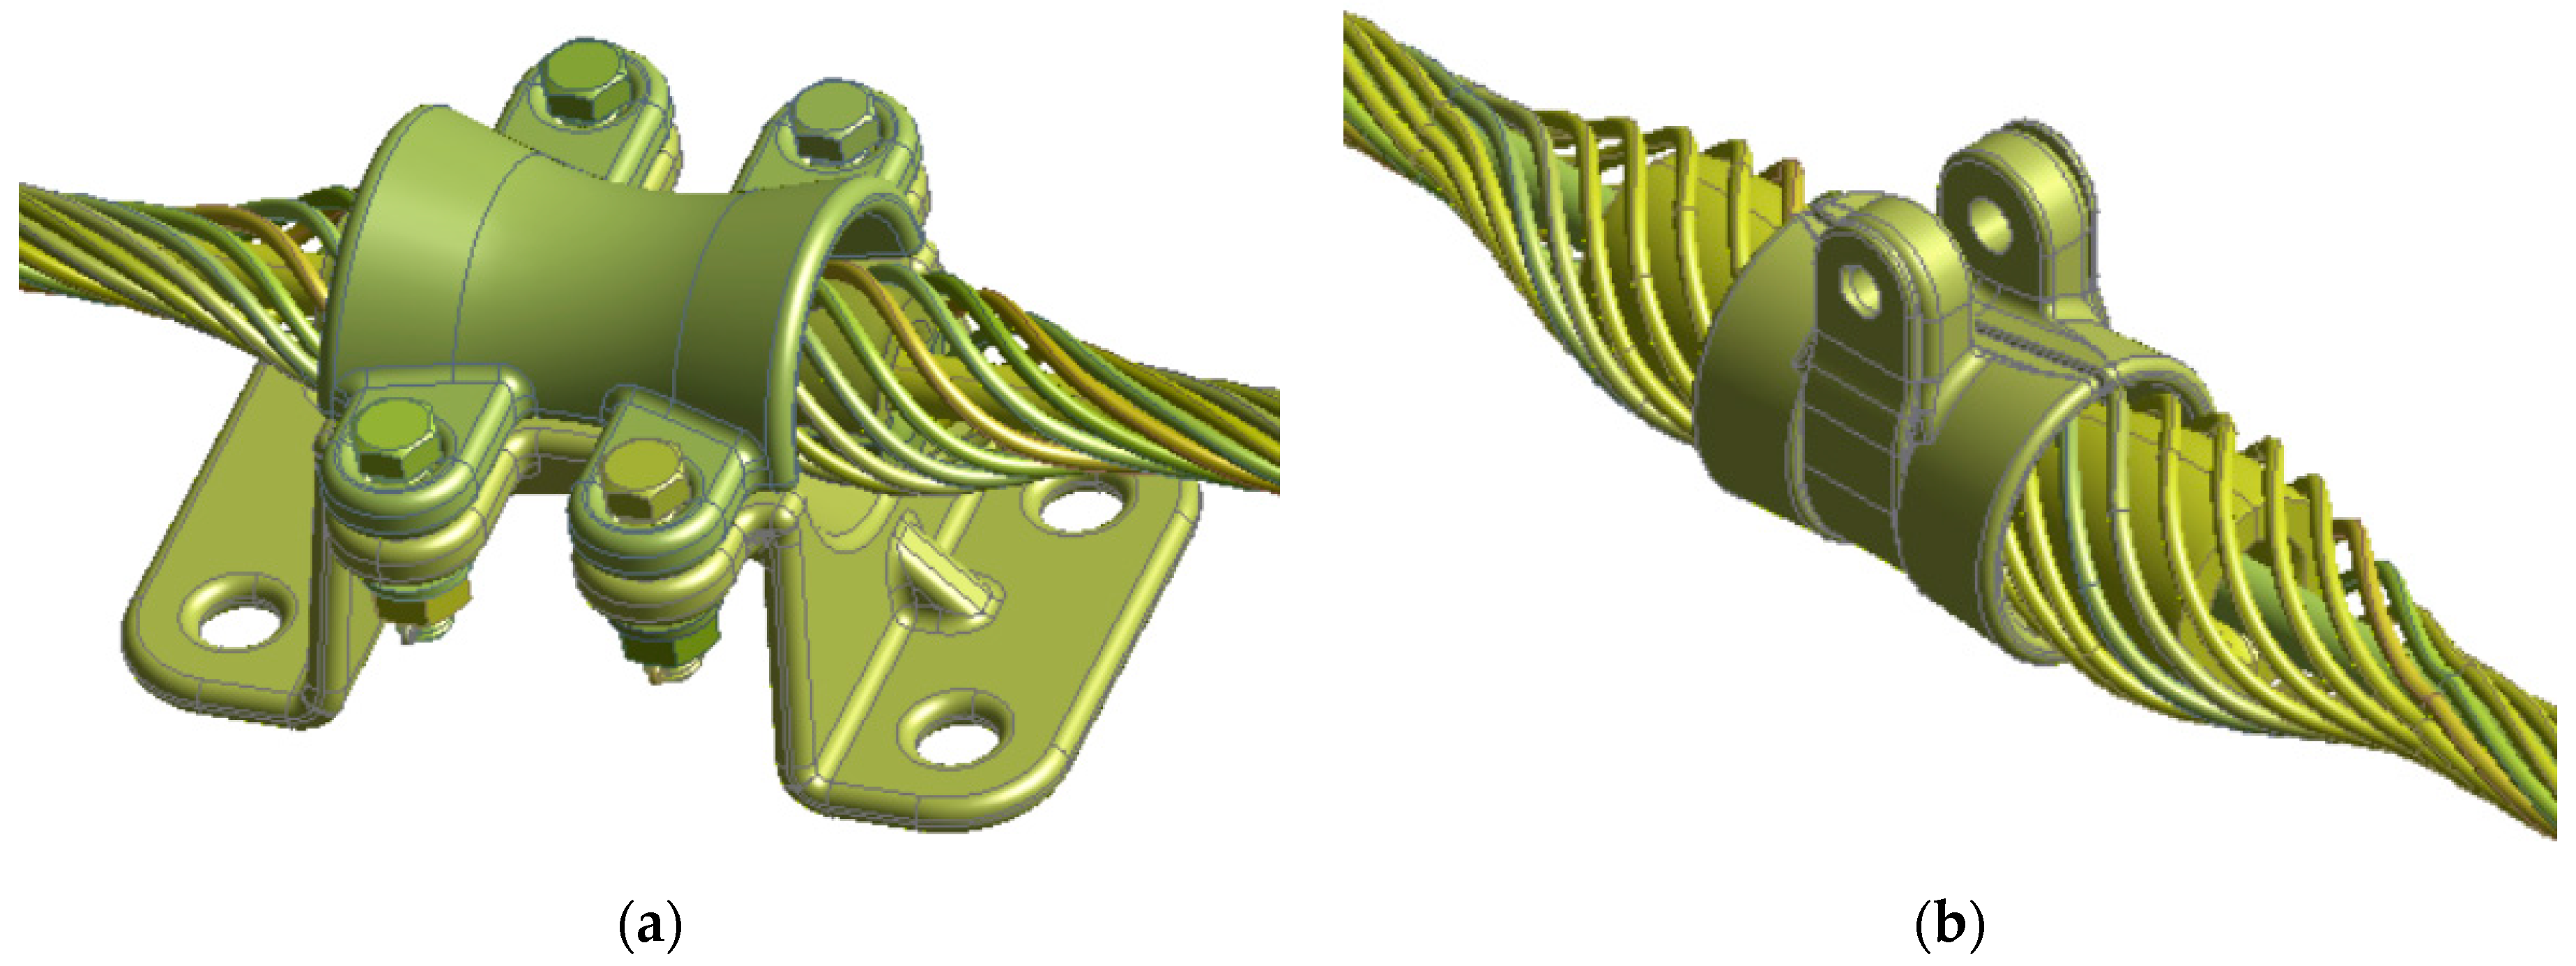
  • The type of fitting connection also plays a critical role in wind-induced vibration response. Different types of fittings exhibit distinct mechanical behaviors under wind excitation. Support-type fittings exhibit lower stress fluctuations, contributing to reduced wind-induced vibration risks. Additionally, shorter spans reduce displacement responses in fittings, leading to more uniform force distribution and lower additional stress caused by wind excitation, thereby delaying fatigue damage. Increasing tension enhances conductor stiffness and reduces fitting vibration amplitudes; however, excessive tension may cause stress concentration, ultimately affecting the service life of the system.
The method proposed in this study demonstrates significant technical advantages. By accurately modeling wind speed fluctuations and the nonlinear response of the conductor, it provides a reliable basis for the wind-induced vibration mitigation design of additional conductors in railway systems. In practical applications, this method is expected to enhance the operational safety and efficiency of railway systems, such as improving train operation safety, strengthening the power and information transmission capacity of additional conductors, and reducing operational disruptions caused by wind-induced failures.
From an economic perspective, although the implementation of this method may require higher initial investment (e.g., higher quality and larger conductors, high-performance anchoring systems, etc.), it can significantly optimize long-term cost efficiency by reducing maintenance frequency, extending equipment service life, and lowering failure rates, thus offering good prospects for engineering application and promotion.
Nevertheless, there are still some limitations in this study. Although the random wind field generation method based on the wind speed spectrum can provide reliable analysis results in most cases, its adaptability and predictive capability under extreme wind conditions remain somewhat limited. Furthermore, the finite element method involves substantial computational demands, especially when analyzing large-scale systems, where high computational resources may be required. Future research may focus on further optimizing the computational methods to enhance their applicability in practical engineering, particularly by improving wind spectrum models and reducing computational time to better address wind-induced vibration problems under complex environmental conditions.

Author Contributions

Methodology, L.P.; software, Y.Y.; formal analysis, T.X.; investigation, W.W.; resources, A.Y.; data curation, Y.S.; writing—original draft, L.P., Y.Y., T.X., W.W., A.Y. and Y.S.; writing—review and editing, L.P., Y.Y., T.X., W.W., A.Y. and Y.S. All authors have read and agreed to the published version of the manuscript.

Funding

This research was funded by the China Railway Science Institute, grant number 2023YJ268; the China National Railway Group Corporation Science and Technology Research and Development Program, grant number P2024G001; and the National Natural Science Foundation of China, grant numbers 52477129, U2468230, and U2468229.

Data Availability Statement

The original contributions presented in this study are included in the article. Further inquiries can be directed to the corresponding author.

Conflicts of Interest

The authors declare that this study received funding from the China Academy of Railway Sciences Co., Ltd. Authors Like Pan, Tong Xing, Yuan Yuan, and We Wang were employed by the China Academy of Railway Sciences Corporation Limited. The remaining authors declare that the research was conducted in the absence of any commercial or financial relationships that could be construed as potential conflicts of interest. The funder was not involved in the study design, collection, analysis, interpretation of the data, the writing of this article, or the decision to submit it for publication.

References

  1. Song, Y.; Zhang, M. Wind deflection analysis of railway catenary under crosswind based on nonlinear finite element model and wind tunnel test. Mech. Mach. Theory 2022, 168, 104608. [Google Scholar] [CrossRef]
  2. Jafari, M.; Hou, F. Wind-induced vibration of structural cables. Nonlinear Dyn. 2020, 100, 351–421. [Google Scholar] [CrossRef]
  3. Fujino, Y.; Yoshida, Y. Wind-induced vibration and control of Trans-Tokyo Bay Crossing bridge. J. Struct. Eng. ASCE 2002, 128, 1012–1025. [Google Scholar] [CrossRef]
  4. Zhao, S.; Shi, Y. Study the influence of cable breakage on wind-induced vibration characteristics of the curved beam unilateral stayed bridge. Buildings 2023, 13, 1038. [Google Scholar] [CrossRef]
  5. Xing, C.; Wang, H. Study on wind-induced vibration control of a long-span cable-stayed bridge using TMD-type counterweight. J. Bridge Eng. 2014, 19, 141–148. [Google Scholar] [CrossRef]
  6. Den, H. Transmission Line Vibration Due to Sleet. Trans. Am. Inst. Electr. Eng. 1932, 51, 1074–1076. [Google Scholar] [CrossRef]
  7. Yu, P.; Desai, M. Three-degree-of-freedom model for galloping. Part 1: Formulation. J. Eng. Mech. 1993, 119, 2404–2425. [Google Scholar] [CrossRef]
  8. Yu, P.; Desai, Y.M. Three-degree-of-freedom model for galloping. Part 2: Solutions. J. Eng. Mech. 1993, 119, 2426–2448. [Google Scholar] [CrossRef]
  9. Song, P.; Lang, X. Study on windage response suppression of large-span transmission tower-line system using a spring-pendulum dynamic vibration absorber. Energies 2024, 17, 5638. [Google Scholar] [CrossRef]
  10. Zhao, M.; Li, M. Galloping performance of transmission line system aeroelastic model with rime through wind-tunnel tests. Energies 2025, 18, 1203. [Google Scholar] [CrossRef]
  11. Lu, M.L.; Chan, J.K. An efficient algorithm for aeolian vibration of single conductor with multiple dampers. IEEE Trans. Power Deliv. 2007, 22, 1822–1829. [Google Scholar] [CrossRef]
  12. Song, Y.; Liu, Z. Nonlinear analysis of wind-induced vibration of high-speed railway catenary and its influence on pantograph-catenary interaction. Veh. Syst. Dyn. 2016, 54, 723–747. [Google Scholar] [CrossRef]
  13. Duan, F.; Song, Y. Study on Aerodynamic Instability and Galloping Response of Rail Overhead Contact Line Based on Wind Tunnel Tests. IEEE Trans. Veh. Technol. 2023, 72, 7211–7220. [Google Scholar] [CrossRef]
  14. Song, Y.; Liu, Z. Study on dynamic flow characteristics of high-speed bow network taking into account contact network aerodynamics. J. Railw. 2016, 38, 48–58. [Google Scholar]
  15. Song, Y.; Ronnquist, A. Assessment of the High-Frequency Response in Railway Pantograph-Catenary Interaction Based on Numerical Simulation. IEEE Trans. Veh. Technol. 2020, 69, 10596–10605. [Google Scholar] [CrossRef]
  16. Song, Y.; Zhang, M. A response spectrum analysis of wind deflection in railway overhead contact lines using pseudo-excitation method. IEEE Trans. Veh. Technol. 2021, 70, 1169–1178. [Google Scholar] [CrossRef]
  17. Song, Y.; Liu, Z. Study on wind-induced vibration behavior of railway catenary in spatial stochastic wind field based on nonlinear finite element procedure. J. Vib. Acoust. 2018, 140, 011010. [Google Scholar] [CrossRef]
  18. Wang, H.; Liu, Z. Offline meta-reinforcement learning for active pantograph control in high-speed railways. IEEE Trans. Ind. Inform. 2024, 20, 10669–10679. [Google Scholar] [CrossRef]
  19. Wang, H.; Liu, Z. HO2RL: A novel hybrid offline-and-online reinforcement learning method for active pantograph control. IEEE Trans. Ind. Electron. 2024, 72, 6286–6296. [Google Scholar] [CrossRef]
  20. Kaimal, J.C. Horizontal velocity spectra in an unstable surface layer. J. Atmos. Sci. 1978, 35, 18–24. [Google Scholar] [CrossRef]
  21. Panofsky, H.A.; McCormick, R.A. The spectrum of vertical velocity near the surface. Q. J. R. Meteorol. Soc. 1960, 86, 495–503. [Google Scholar] [CrossRef]
  22. Tieleman, H.W. Universality of velocity spectra. J. Wind. Eng. Ind. Aerodyn. 1995, 56, 55–69. [Google Scholar] [CrossRef]
  23. Liu, J.; Yan, B. Numerical study of aeolian vibration characteristics and fatigue life estimation of transmission conductors. PLoS ONE 2022, 17, e0263163. [Google Scholar] [CrossRef]
  24. Wang, D.; Sun, C. Flow-induced vibration analysis by simulating a high-speed train pantograph. Appl. Sci. 2024, 14, 4493. [Google Scholar] [CrossRef]
  25. Diana, G.; Manenti, A. Energy method to compute the maximum amplitudes of oscillation due to galloping of iced bundled conductors. IEEE Trans. Power Deliv. 2021, 36, 2804–2813. [Google Scholar] [CrossRef]
  26. Zhang, Y.; Zhang, Y.; Zhao, S. Effectiveness analysis of anti-galloping of spacer for catenary additional wires in strong wind section of high-speed railways. Arch. Electr. Eng. 2024, 73, 499–517. [Google Scholar] [CrossRef]
  27. Zhao, S.; Zhao, S. Design and data processing of galloping online monitoring system for positive feeder of high-speed railway catenary in gale area. IEEJ Trans. Electr. Electron. Eng. 2021, 16, 1248–1259. [Google Scholar] [CrossRef]
  28. Stickland, M.T.; Scanlon, T.J. An investigation into the mechanical damping characteristics of catenary contact wires and their effect on aerodynamic galloping instability. Proc. Inst. Mech. Eng. F J. Rail Rapid Transit. 2003, 217, 63–71. [Google Scholar] [CrossRef]
  29. Stickland, M.T.; Scanlon, T.J. An investigation into the aerodynamic characteristics of catenary contact wires in a cross-wind. Proc. Inst. Mech. Eng. F J. Rail Rapid Transit. 2001, 215, 311–318. [Google Scholar] [CrossRef]
  30. Zhang, W.; Liu, Y. Evaluation of the coupled dynamical response of a pantograph-catenary system: Contact force and stresses. Veh. Syst. Dyn. 2006, 44, 645–658. [Google Scholar] [CrossRef]
  31. Liu, Y.; Zhang, W. Study of dynamic stress of the catenary in the pantograph/catenary vertical coupling movement. J. Railw. 2003, 4, 23–26. [Google Scholar] [CrossRef]
  32. Wang, H.; Zhang, L. Finite element simulation and experimental study on vibration characteristics of converter transformer under DC bias. Prot. Control Mod. Power Syst. 2024, 9, 110–125. [Google Scholar] [CrossRef]
  33. Liu, Z.; Song, Y. Review of perspectives on pantograph-catenary interaction research for high-speed railways operating at 400 km/h and above. IEEE Trans. Transp. Electrific. 2024, 10, 7236–7257. [Google Scholar] [CrossRef]
  34. Banerjee, J.R. Review of the dynamic stiffness method for free-vibration analysis of beams. Transp. Saf. Environ. 2019, 1, 106–116. [Google Scholar] [CrossRef]
  35. Chen, P.; Pedersen, T. ARIMA-based time series model of stochastic wind power generation. IEEE Trans. Power Syst. 2010, 25, 667–676. [Google Scholar] [CrossRef]
  36. Song, Y.; Liu, Z. Current collection quality of high-speed rail pantograph-catenary considering geometry deviation at 400 km/h and above. IEEE Trans. Veh. Technol. 2024, 73, 14415–14424. [Google Scholar] [CrossRef]
  37. Seo, J.H.; Sugiyama, H.A. Three-dimensional large deformation analysis of the multibody pantograph/catenary systems. Nonlinear Dyn. 2005, 42, 199–215. [Google Scholar] [CrossRef]
  38. Newmark, N.M. A method of computation for structural dynamics. Trans. Am. Soc. Civ. Eng. 1962, 127, 1406–1433. [Google Scholar] [CrossRef]
  39. Scanlan, R.H. The action of flexible bridges under wind, I: Flutter theory. J. Sound Vib. 1978, 60, 187–199. [Google Scholar] [CrossRef]
  40. Scanlan, R.H. The action of flexible bridges under wind, II: Buffeting theory. J. Sound Vib. 1978, 60, 201–211. [Google Scholar] [CrossRef]
Figure 1. Stochastic wind speeds in three directions.
Energies 18 02487 g001
Figure 2. Force analysis of conductor.
Energies 18 02487 g002
Figure 3. Iterative calculation flowchart.
Energies 18 02487 g003
Figure 4. Comparison of Responses Under Different Wind Speeds. (a) Mid-span horizontal response; (b) mid-span vertical response.
Energies 18 02487 g004
Figure 5. Mid−span trajectory under different wind speeds.
Energies 18 02487 g005
Figure 6. Root mean square displacement under different tension levels.
Energies 18 02487 g006
Figure 7. Comparison of responses under different tension levels. (a) Mid-span horizontal response; (b) mid-span horizontal response.
Energies 18 02487 g007
Figure 8. Mid-span trajectory under different tension levels.
Energies 18 02487 g008
Figure 9. Root mean square displacement under different span lengths.
Energies 18 02487 g009
Figure 10. Comparison of responses under different span lengths. (a) Mid-span horizontal response; (b) mid-span horizontal response.
Energies 18 02487 g010
Figure 11. Mid-span trajectory under different span lengths.
Energies 18 02487 g011
Figure 12. Different fitting connection configurations. (a) Support-type fitting connection; (b) suspension-type fitting connection.
Energies 18 02487 g012
Figure 13. Wind-induced vibration response of different fitting connection models. (a) Comparison of fitting stress; (b) comparison of fitting deformation.
Energies 18 02487 g013
Figure 14. Wind-induced vibration response of support-type fitting under different tension levels. (a) Comparison of fitting stress; (b) comparison of fitting deformation; (c) comparison of fitting stress values; (d) comparison of fitting deformation values.
Energies 18 02487 g014
Figure 15. Wind-induced vibration response of support-type fitting under different span lengths. (a) Comparison of fitting stress; (b) comparison of fitting deformation; (c) comparison of fitting stress values; (d) comparison of fitting deformation values.
Energies 18 02487 g015
Table 1. Parameters of the auxiliary conductor.
Conductor ParametersValue
Rated Tension (N)3500
Cross-Sectional Area (mm2)333.33
Mass (kg/km)1058
Elastic Modulus (Gpa)65.0
Density (kg/m3)3076.12
Disclaimer/Publisher’s Note: The statements, opinions and data contained in all publications are solely those of the individual author(s) and contributor(s) and not of MDPI and/or the editor(s). MDPI and/or the editor(s) disclaim responsibility for any injury to people or property resulting from any ideas, methods, instructions or products referred to in the content.

