
A Spatial Long-Term Load Forecast Using a Multiple Delineated Machine Learning Approach


 ,
, 
Abstract
1. Introduction
2. Materials and Methods
2.1. Data Acquisition, Processing, and Segmentation
- -
- Electrical and Topological Coherence
- -
- Geographical and Climatic Homogeneity
- Climate zones (e.g., humid tropical coast versus temperate highlands);
- Altitude (lowland LT versus elevated WN);
- Urban density and land use (dense commercial centers versus rural peripheries).
- -
- Socioeconomic Load Typology
- -
- Operational Zoning and Contingency Management
- -
- Generation–Load Balancing Characteristics
- South cluster: Large base-load capacity (KRIBI power plant, MEMVE’ELE hydropower plant) and low local demand, implying a potential net power exporter.
- Littoral cluster: Dense demand with moderate hydro generation, which implies, structurally, a net importer.
- West–Northwest cluster: Limited generation, high terrain-induced losses, implying that it could import capacity.
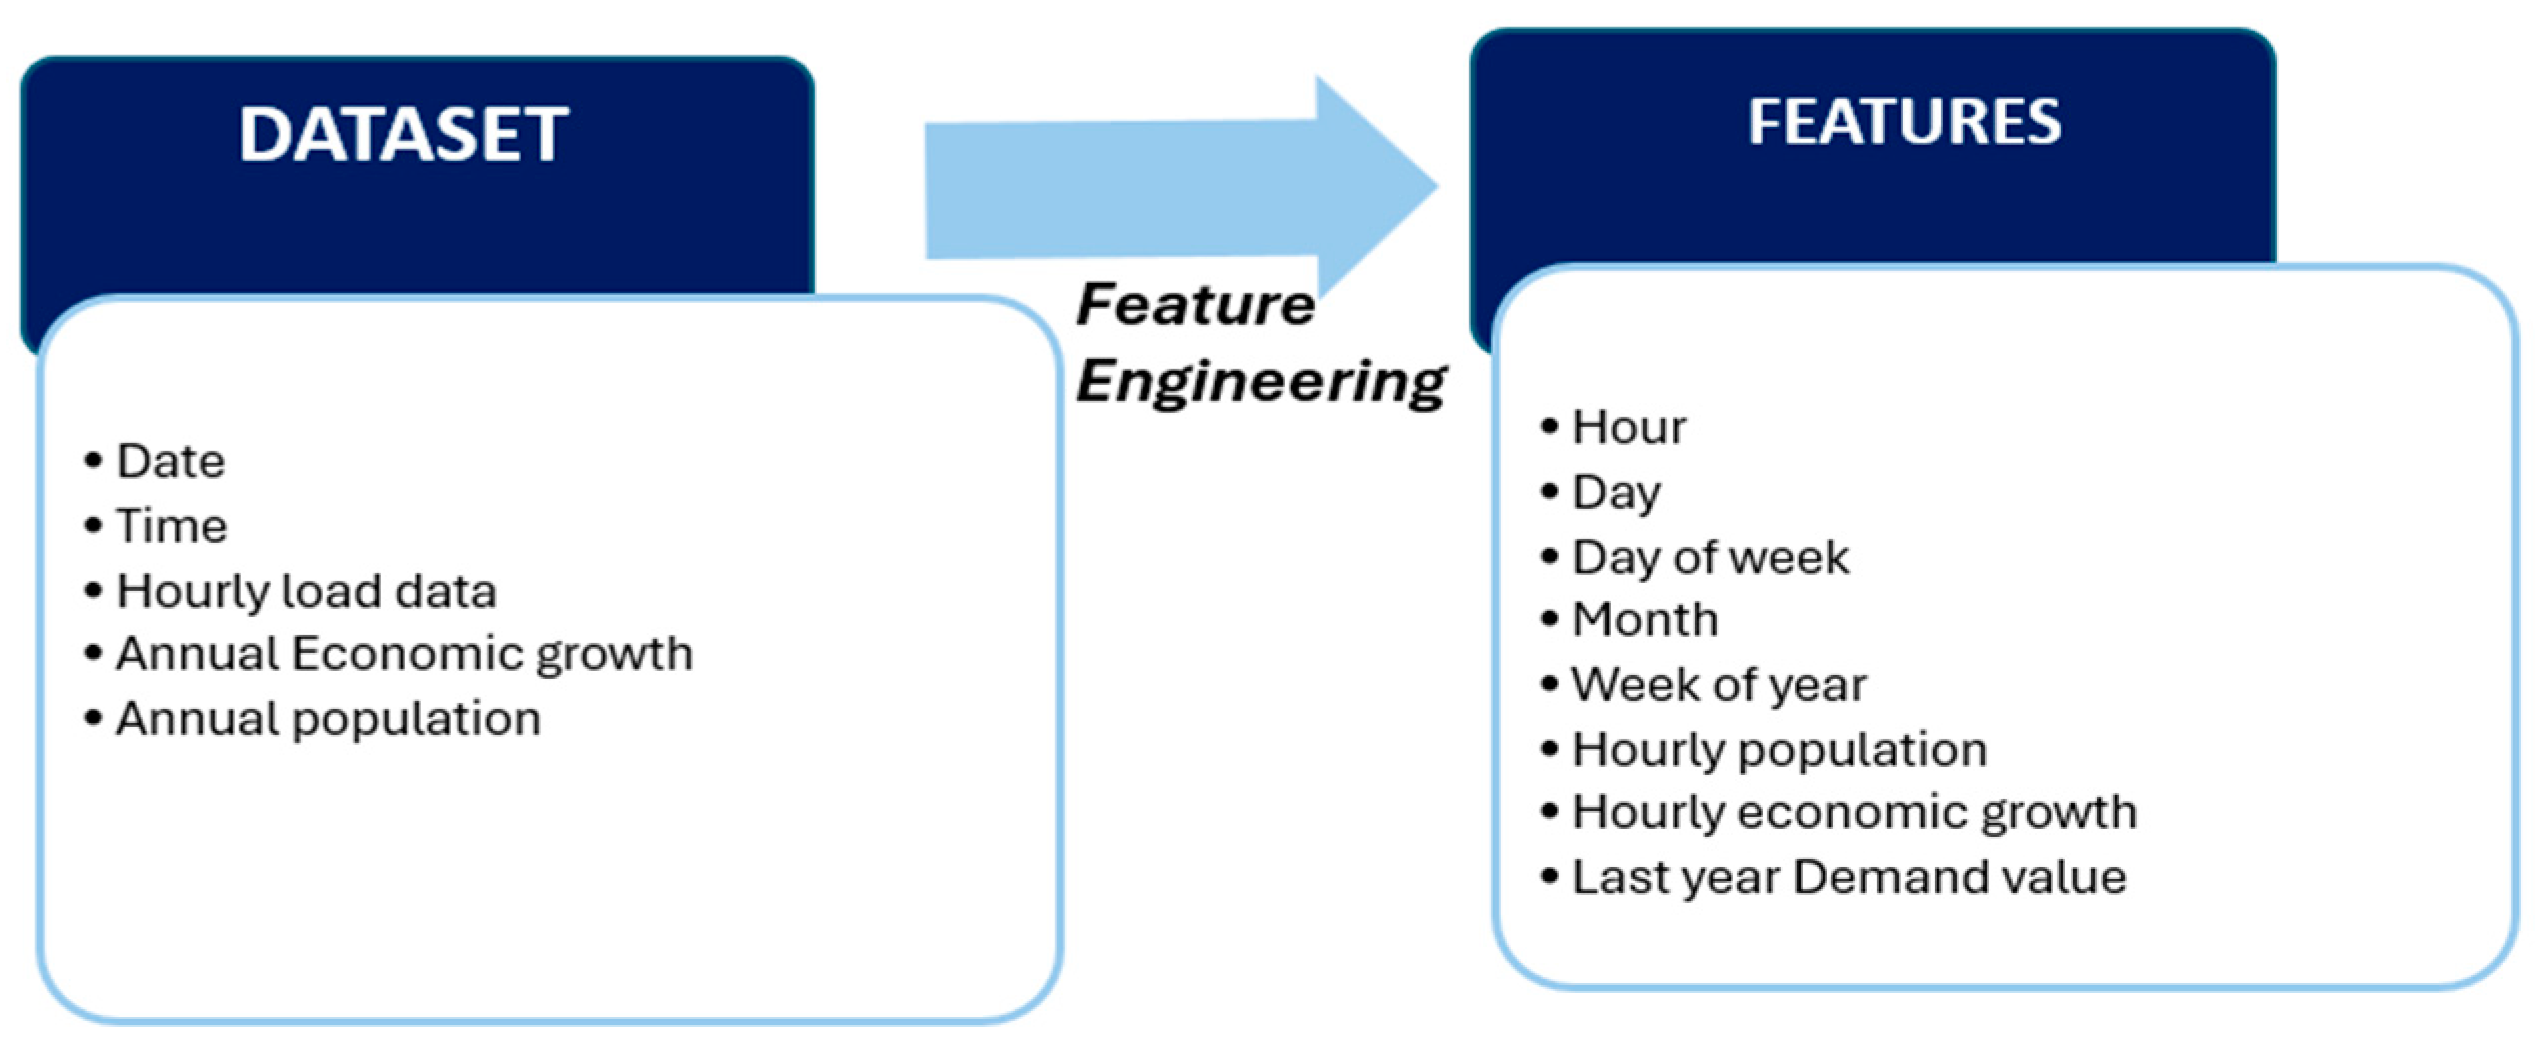
2.2. Feature Engineering
- For hours of the day:
- For days of the week:
- For months:
- For weeks of the year:
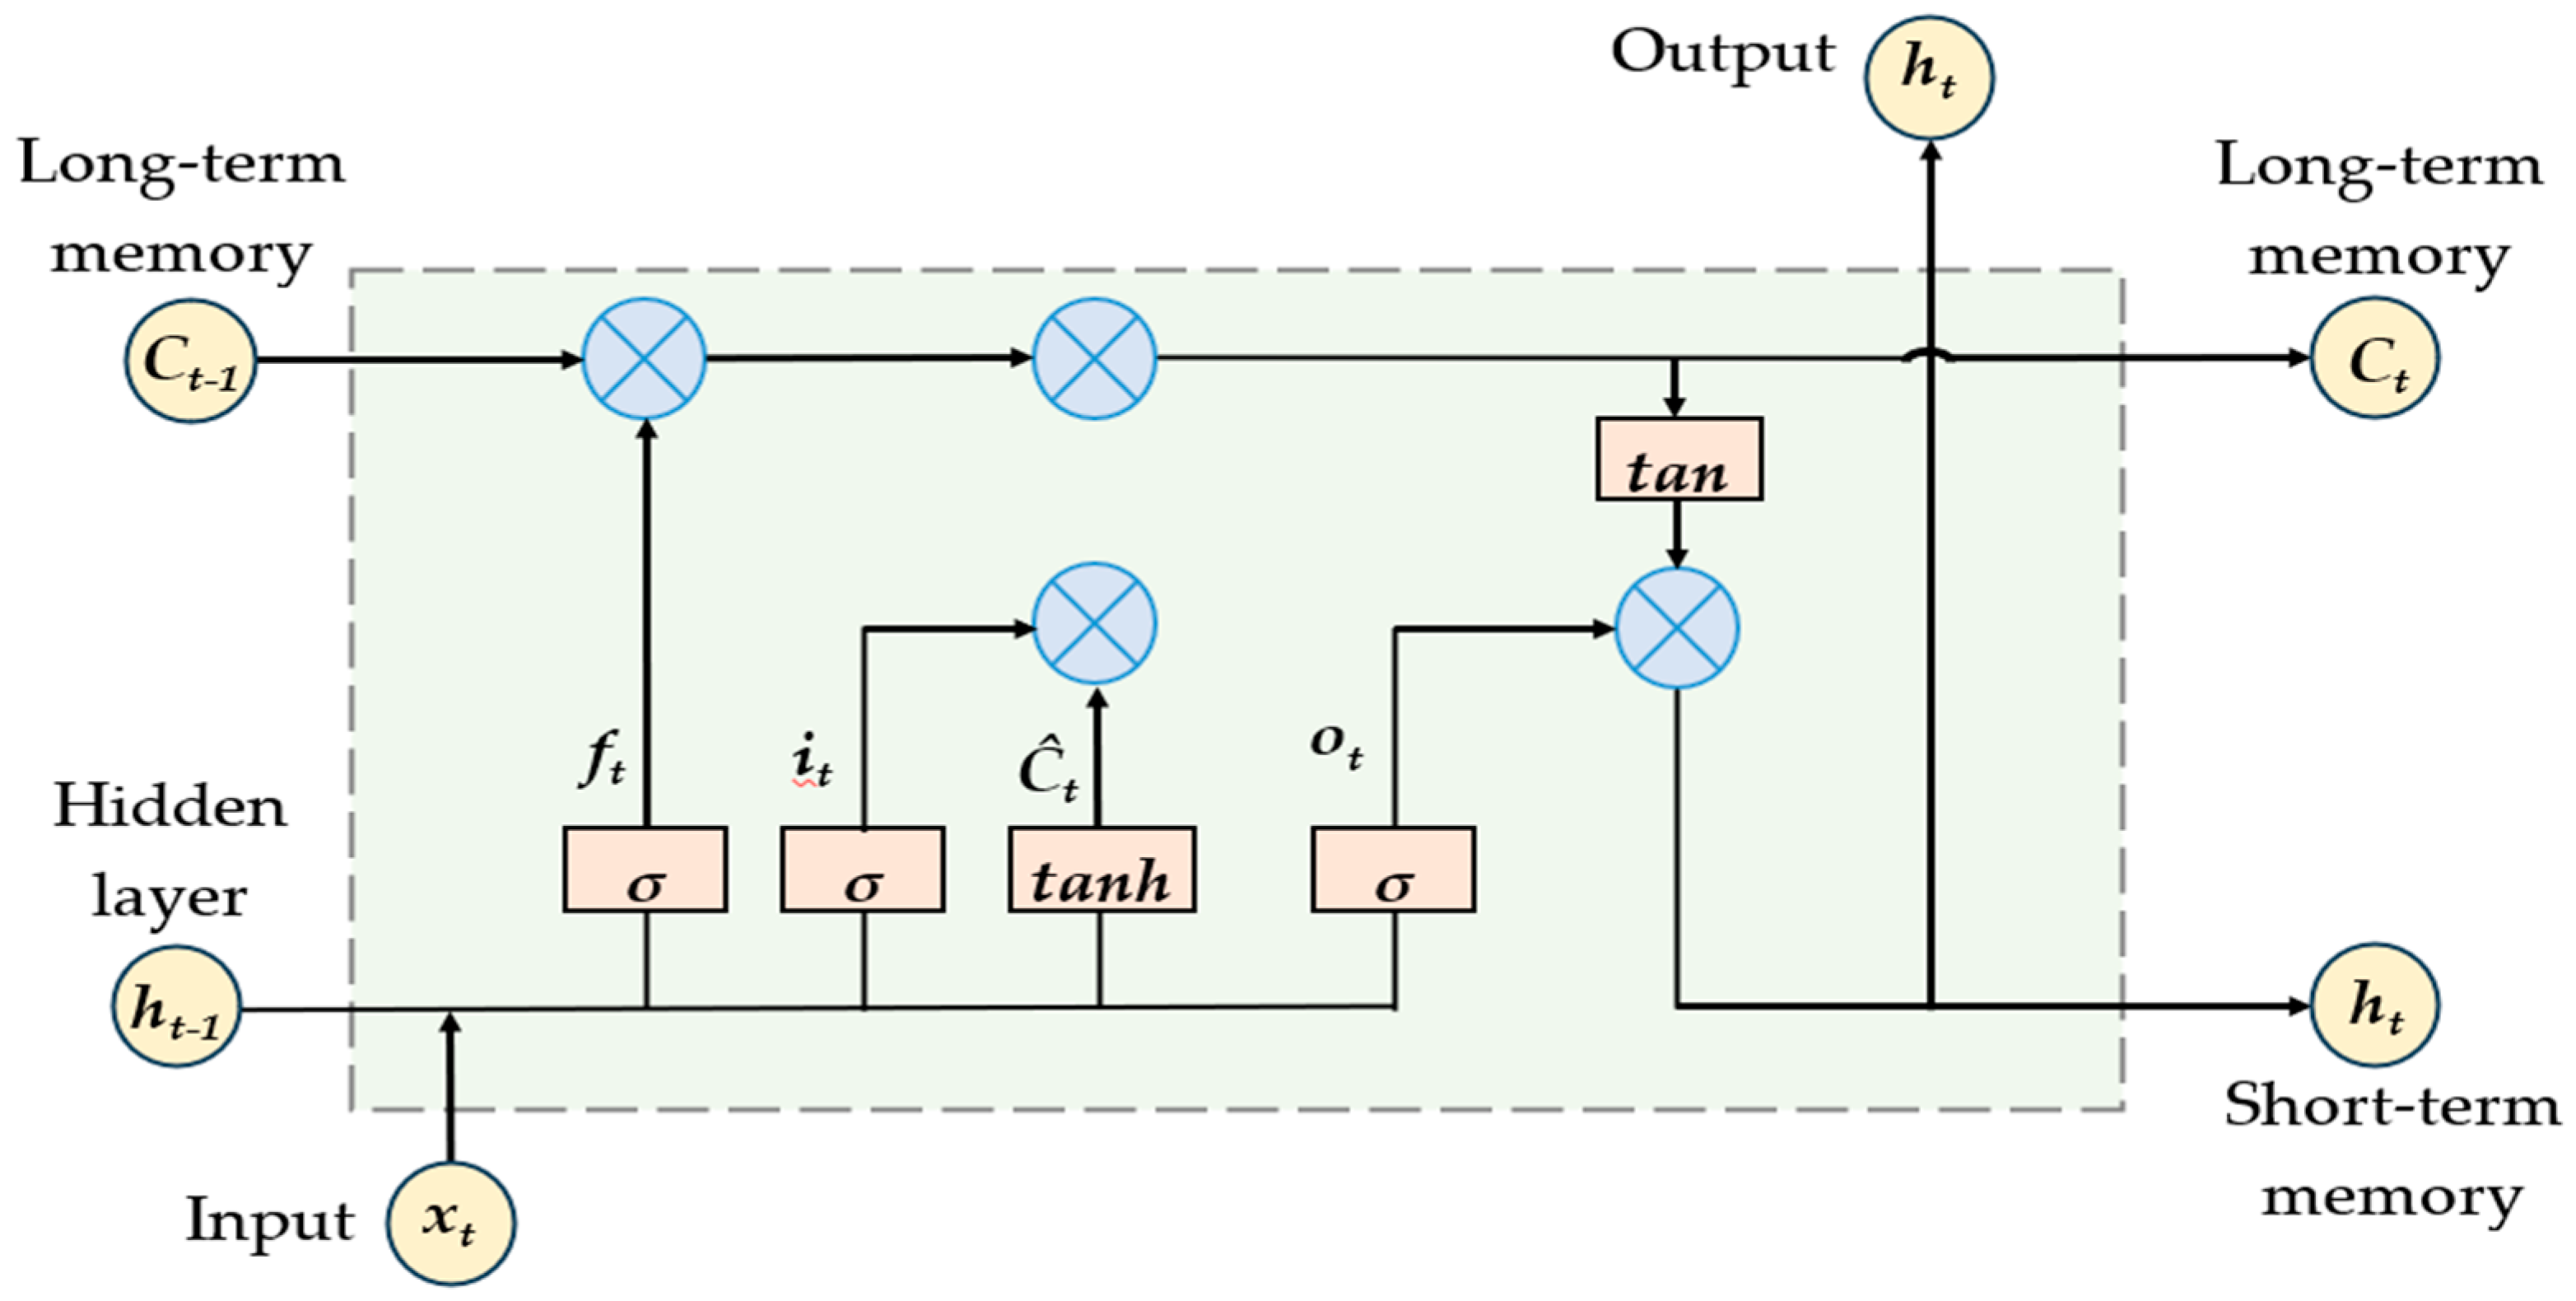
2.3. LSTM Neural Network
2.4. Construction of LSTM Prediction Models
2.5. Evaluation Metrics
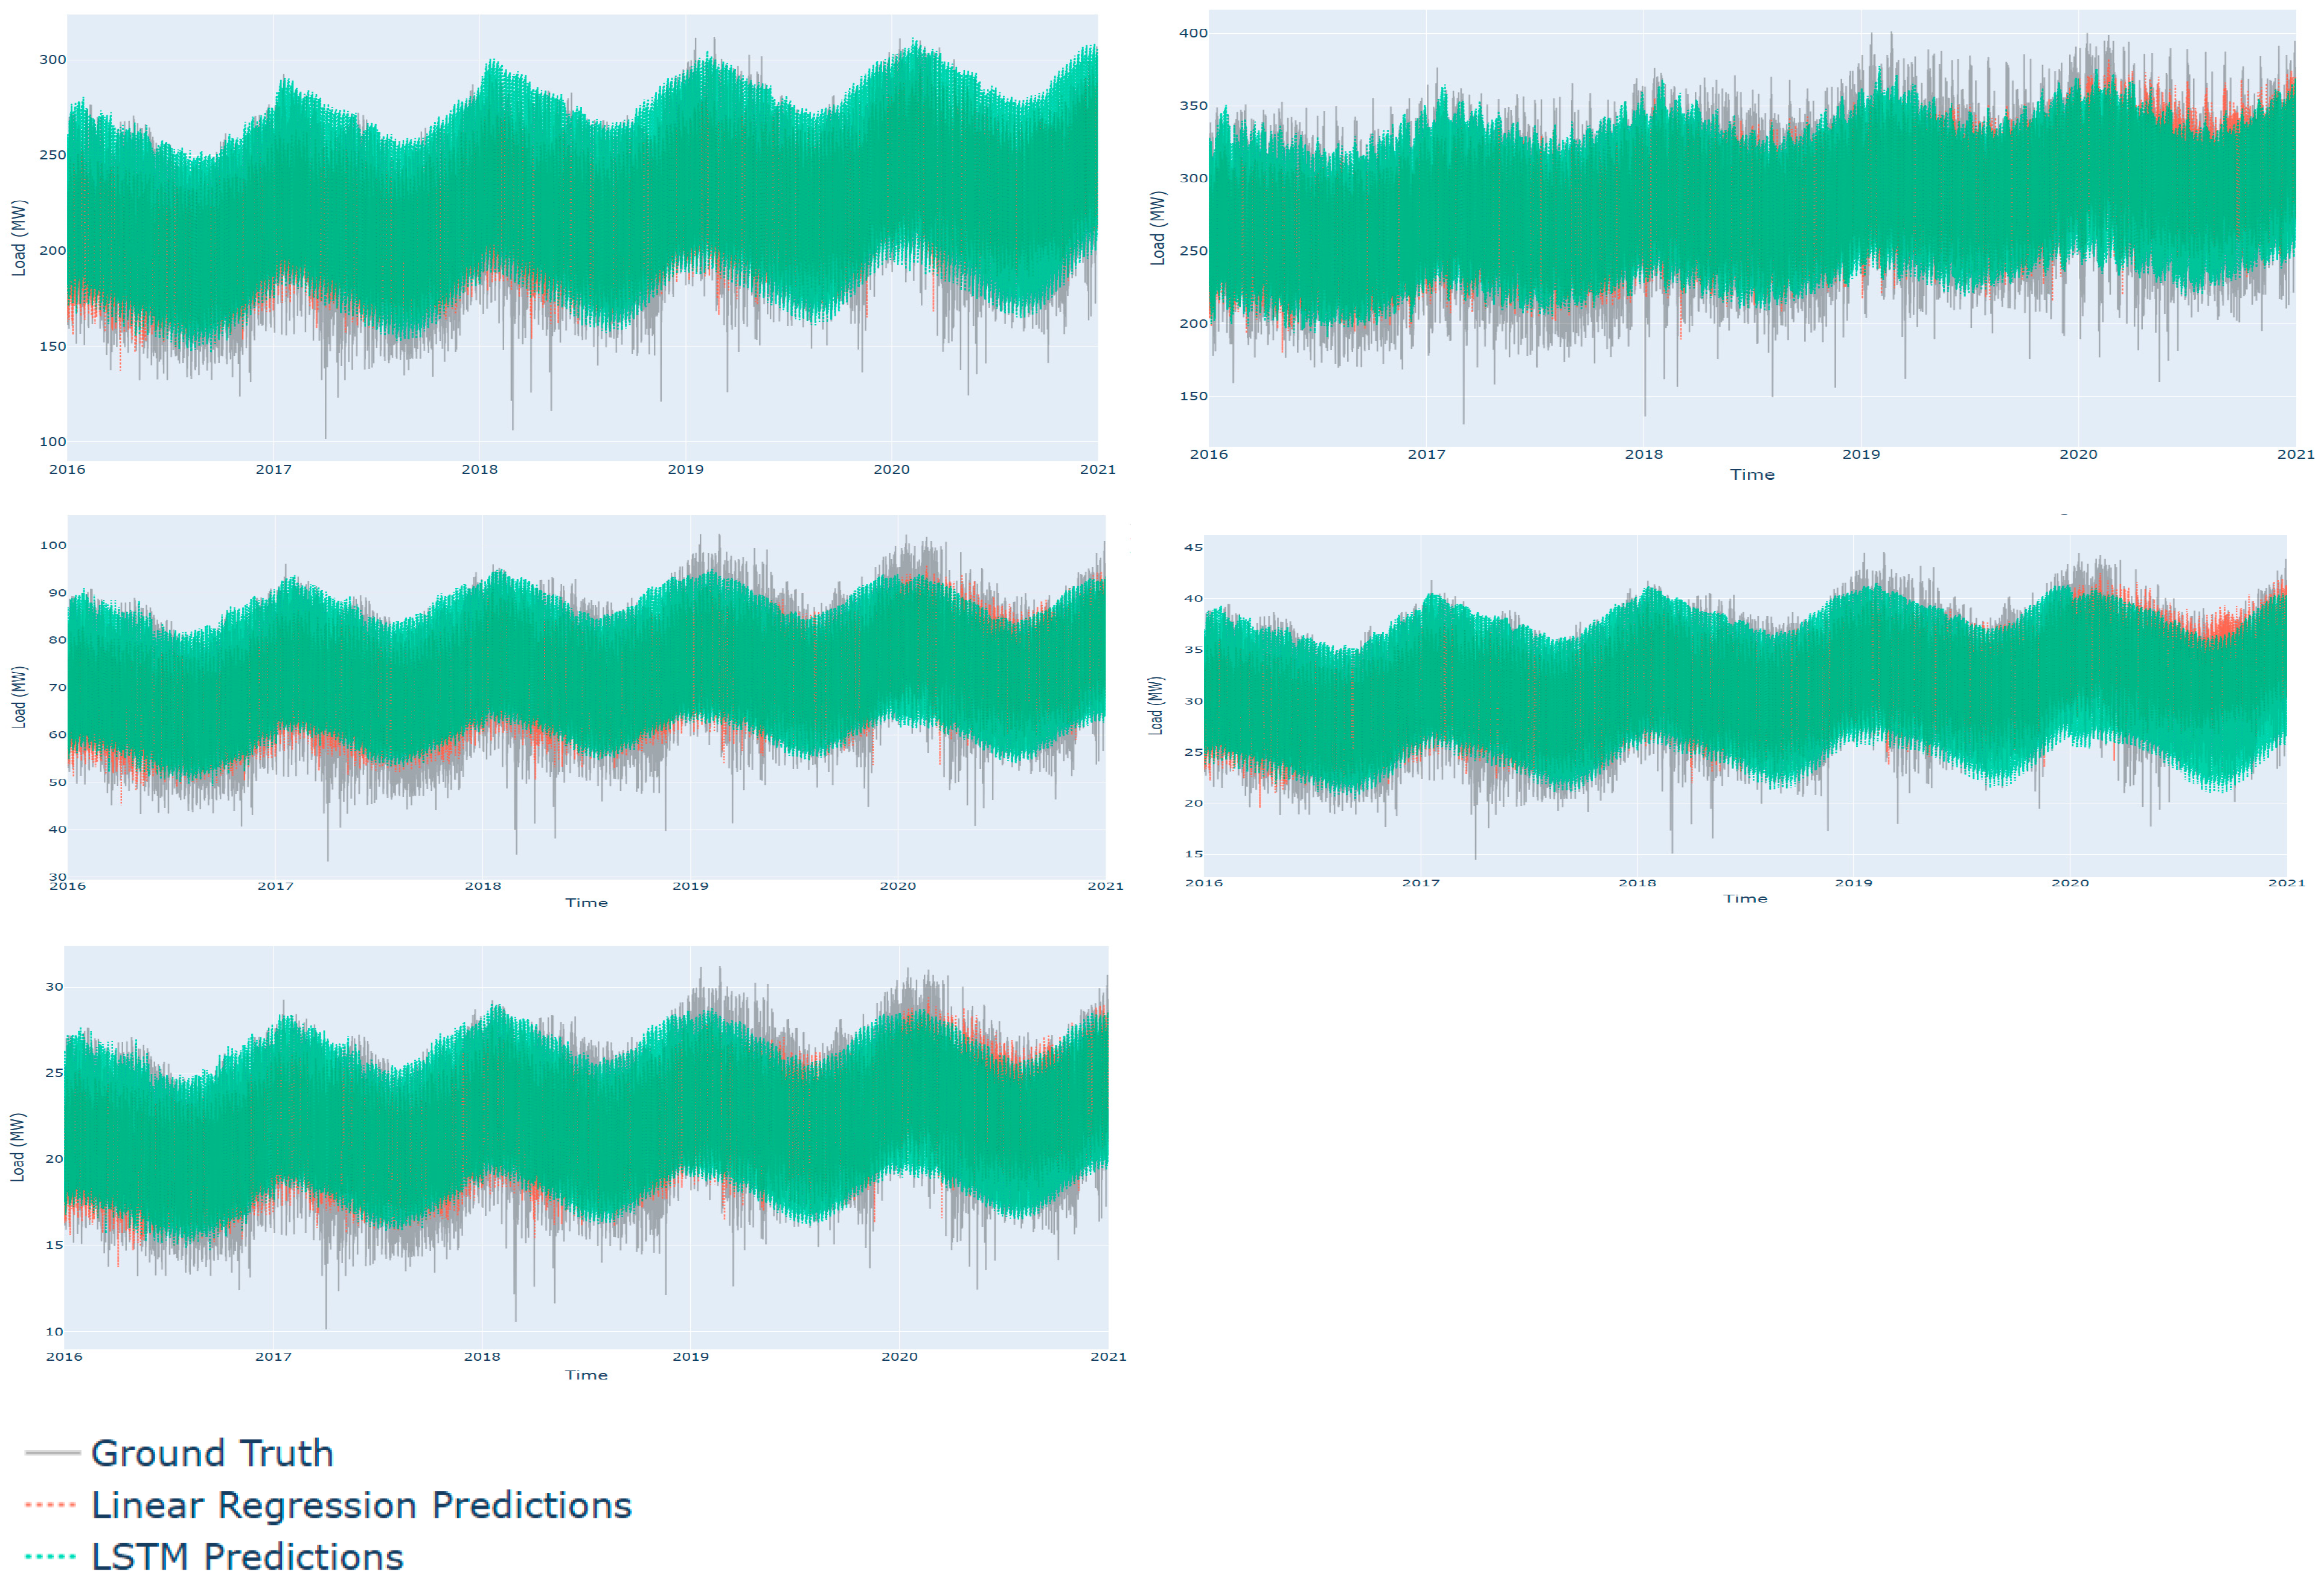
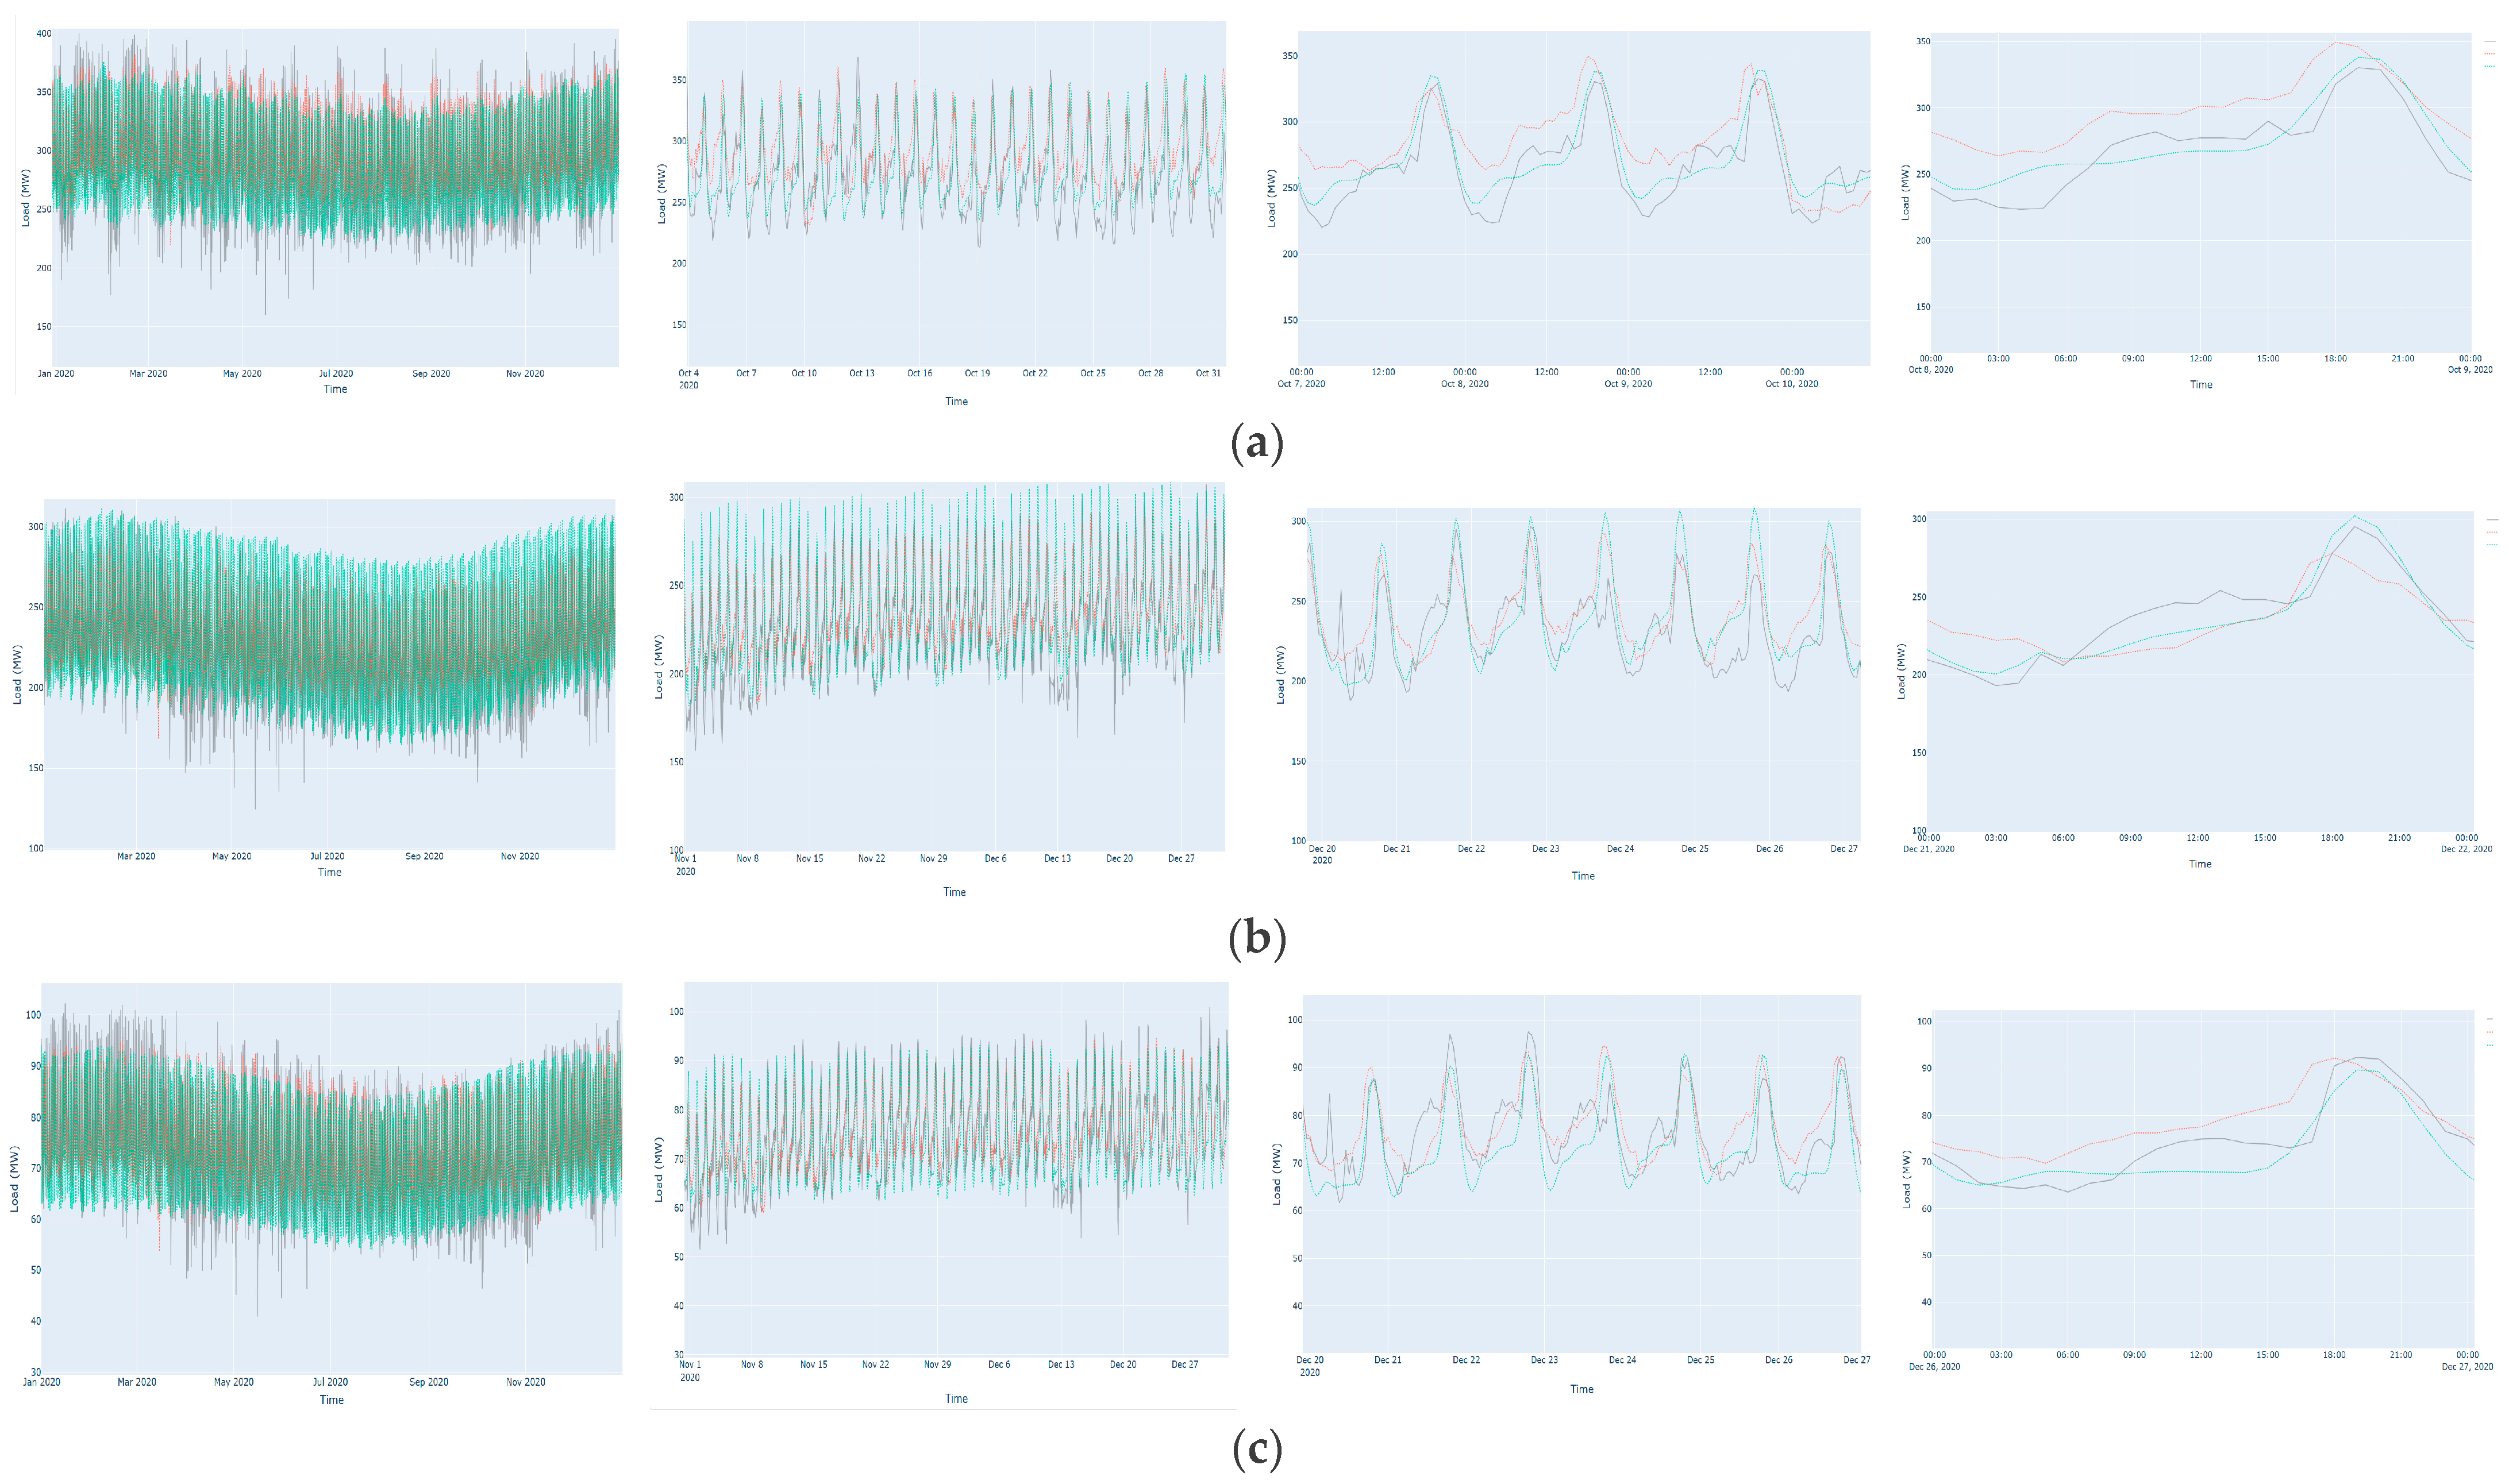
3. Results
4. Conclusions
Author Contributions
Funding
Data Availability Statement
Conflicts of Interest
References
- Heymann, F.; Melo, J.D.; Martínez, P.D.; Soares, F.; Miranda, V. On the emerging role of spatial load forecasting in transmission/distribution grid planning. In Proceedings of the Mediterranean Conference on Power Generation, Transmission, Distribution and Energy Conversion (MEDPOWER 2018), Dubrovnik, Croatia, 2–15 November 2018; pp. 1–6. [Google Scholar] [CrossRef]
- Terence, L.K.; Tanyu, D.N.; Tatietse, T.T.; Schulz, D. Long Term Electricity Load Forecast Based on Machine Learning for Cameroon’s Power System. Energy Environ. Res. 2022, 12, 45. [Google Scholar] [CrossRef]
- Zhou, J.; Batour, T.C.; Qayyim, A.; Al Harthi, M.; Bashir, F.; Mohsen, M.; Hanif, I.; Abbas, Q. Load forecasting via Grey Model-Least Squares Support Vector Machine model and spatial-temporal distribution of electric consumption intensity. Energy 2022, 255, 124468. [Google Scholar] [CrossRef]
- Sasmono, S.; Sinisuka, N.I.; Atmopawiro, M.W. Alternative spatial approach on spatial demand forecasting for transmission expansion planning. In Proceedings of the IEEE International Conference on Condition Monitoring and Diagnosis, Bali, Indonesia, 23–27 September 2012; pp. 577–580. [Google Scholar]
- Carreno, E.M.; Rocha, R.M.; Padilha, A.-F. A cellular automaton approach to spatial electric load forecasting. IEEE Trans. Power Syst. 2011, 26, 532–540. [Google Scholar] [CrossRef]
- Zhu, C.; Hu, Z.-S.; Wang, X.-R.; Wang, L. A Hierarchical Data Driven Method for Spatial Electric Load Forecasting. In Proceedings of the International Conference on Power System Technology (POWERCON), Haikou, China, 8–9 December 2021; pp. 360–364. [Google Scholar] [CrossRef]
- Prasath, J.S.; Natarajan, B.; Venkatraman, K.; Nallusamy, M.; Revathi, M.; Muruganantham, T. A Novel Approach for Electricity Load Forecasting using Hybrid Deep Learning Models. In Proceedings of the ICWITE 2024: IEEE International Conference for Women in Innovation, Technology and Entrepreneurship, Bangalore, India, 16–17 February 2024; pp. 570–575. [Google Scholar] [CrossRef]
- Willis, H.L.; Northcote-Green, J.E.D. Spatial electric load forecasting: A tutorial review. Proc. IEEE 1983, 71, 232–253. [Google Scholar] [CrossRef]
- Zhuang, J.; Guo, Z.; Gong, X.; Hu, Y.; Lian, H.; Xu, W. Spatial Load Forecasting Method Based on GIS and Generative Adversarial Network. In Proceedings of the 2023 8th Asia Conference on Power and Electrical Engineering, ACPEE 2023, Tianjin, China, 14–16 April 2023; pp. 1965–1969. [Google Scholar] [CrossRef]
- Tephiruk, N.; Hongesombut, K.; Damrongkulkamjorn, P.; Jamroen, C. Spatial Electric Load Forecasting Using a Geographic Information System: A Case Study of Khon Kaen, Thailand. In Proceedings of the IEEE 3rd International Conference on Sustainable Energy and Future Electric Transportation, SeFet 2023, Bhubaneswar, India, 9–12 August 2023. [Google Scholar] [CrossRef]
- Zhuang, W.; Fan, J.; Xia, M.; Zhu, K. A Multi-Scale Spatial-Temporal Graph Neural Network-Based Method of Multienergy Load Forecasting in Integrated Energy System. IEEE Trans. Smart Grid 2024, 15, 2652–2666. [Google Scholar] [CrossRef]
- Wei, M.; Wen, M.; Zhang, Y. A novel spatial electric load forecasting method based on LDTW and GCN. IET Gener. Transm. Distrib. 2024, 18, 491–505. [Google Scholar] [CrossRef]
- Zhu, L.; Gao, J.; Zhu, C.; Deng, F. Short-term power load forecasting based on spatial-temporal dynamic graph and multi-scale Transformer. J. Comput. Des. Eng. 2025, 12, 92–111. [Google Scholar] [CrossRef]
- Vieira, D.A.G.; Silva, B.E.; Menezes, T.V.; Lisboa, A.C. Large scale spatial electric load forecasting framework based on spatial convolution. Int. J. Electr. Power Energy Syst. 2020, 117, 105582. [Google Scholar] [CrossRef]
- Alausa, O.A.; Adaradoun, O.S.; Adekunle, G.T.; Priyono, K.D. Leveraging Geospatial Technology for Enhanced Utility Management: A Case Study in Electrical Distribution Power Systems. Forum Geografi 2023, 37, 164–177. [Google Scholar] [CrossRef]
- Melo, J.D.; Padilha-Feltrin, A.; Carreno, E.M. Data issues in spatial electric load forecasting. In Proceedings of the IEEE PES General Meeting|Conference & Exposition, National Harbor, MD, USA, 27–31 July 2014; pp. 1–5. [Google Scholar] [CrossRef]
- Cameroon City Competitiveness Diagnostic, World Bank. 2018. Available online: http://www.copyright.com/ (accessed on 20 February 2025).
- Sherafat, E.; Farooq, B.; Karbasi, A.H.; Seyedabrishami, S. Attention-LSTM for Multivariate Traffic State Prediction on Rural Roads. arXiv 2023, arXiv:2301.02731. Available online: https://api.semanticscholar.org/CorpusID:255545947 (accessed on 30 January 2025).
- Pedregosa, F.; Varoquaux, G.; Gramfort, A.; Michel, V.; Thirion, B.; Grisel, O.; Blondel, M.; Prettenhofer, P.; Weiss, R.; Dubourg, V.; et al. Scikit Learn: Machine Learning in Python. 2011. Available online: http://scikit-learn.sourceforge.net (accessed on 30 December 2024).
- Gal, Y.; Ghahramani, Z. Dropout as a Bayesian Approximation: Representing Model Uncertainty in Deep Learning. arXiv 2016, arXiv:1506.02142. [Google Scholar]
- Lakshminarayanan, B.; Pritzel, A.; Blundell, C. Simple and Scalable Predictive Uncertainty Estimation using Deep Ensembles. arXiv 2017, arXiv:1612.01474. [Google Scholar]
- Tagasovska, N.; Lopez-Paz, D. Single-Model Uncertainties for Deep Learning. Advances in Neural. arXiv 2019, arXiv:1906.02530. [Google Scholar]
- Blundell, C.; Cornebise, J.; Kavukcuoglu, K.; Wierstra, D. Weight Uncertainty in Neural Networks. arXiv 2015, arXiv:1505.05424. [Google Scholar]
- Efron, B.; Tibshirani, R.J. An Introduction to the Bootstrap; Chapman & Hall/CRC: New York, NY, USA, 1993. [Google Scholar]


| Clusters/Region | Analyzed Characteristics |
|---|---|
| Littoral Cluster | Includes major industrial and urban load centers, such as the city of Douala, the Edea–Songloulou, and the Kribi generation corridor. It is characterized by
|
| Center Cluster | Covers the city of Yaoundé metropolitan area and surrounding zones, including Kondengui, Nkolanga, Nsimalen, Oyomabang, and Ngousso. This area is marked by
|
| West-Northwest Cluster | Comprises highland nodes, such as Bafoussam, Bamenda, Dschang, and Nkongsamba. This region is characterized by
|
| Southwest Cluster | Includes the cities of Limbe, Bekoko, Logbaba, and their adjacent industrial infrastructures. It is characterized by
|
| South Cluster | Encompasses the cities of Ebolowa, Mbalmayo, and Memve’ele. It is
|
| Datetime | Load (MW) | Population | Economic Growth |
|---|---|---|---|
| 01/01/2006 00:00 | 157.05 | 2,682,633.82139541 | 0.829840510211798 |
| 01/01/2006 01:00 | 151.2 | 2,682,633.82139541 | 0.829840510211798 |
| 01/01/2006 02:00 | 143.55 | 2,682,633.82139541 | 0.829840510211798 |
| 01/01/2006 03:00 | 138.15 | 2,682,633.82139541 | 0.829840510211798 |
| 01/01/2006 04:00 | 131.4 | 2,682,633.82139541 | 0.829840510211798 |
| 01/01/2006 05:00 | 138.6 | 2,682,633.82139541 | 0.829840510211798 |
| 01/01/2006 06:00 | 127.8 | 2,682,633.82139541 | 0.829840510211798 |
| 01/01/2006 07:00 | 115.65 | 2,682,633.82139541 | 0.829840510211798 |
| 01/01/2006 08:00 | 112.5 | 2,682,633.82139541 | 0.829840510211798 |
| 01/01/2006 10:00 | 113.4 | 2,682,633.82139541 | 0.829840510211798 |
| … | … | … | … |
| (a) | ||||||||
| Year | LSTM-RNN | LR | ||||||
| MAPE | MAE | RMSR | R2 Score | MAPE | MAE | RMSR | R2 Score | |
| 2016 | 5.727 | 13.38 | 16.92 | 0.78 | 7.749 | 18.47 | 23.18 | 0.59 |
| 2017 | 6.7 | 15.88 | 20.14 | 0.719 | 8.364 | 19.7 | 24.67 | 0.579 |
| 2018 | 6.033 | 15.56 | 19.75 | 0.714 | 7.65 | 19.06 | 24.04 | 0.577 |
| 2019 | 6.53 | 18.11 | 22.5 | 0.64 | 7.35 | 20.31 | 24.88 | 0.561 |
| 2020 | 6.78 | 18.878 | 23.43 | 0.614 | 8.09 | 21.67 | 26.72 | 0.498 |
| Total | 6.35 | 16.36 | 20.67 | 0.69 | 8.327 | 23.35 | 29.44 | 0.688 |
| (b) | ||||||||
| Year | LSTM-RNN | LR | ||||||
| MAPE | MAE | RMSR | R2 Score | MAPE | MAE | RMSR | R2 Score | |
| 2016 | 4.598 | 8.29 | 10.91 | 0.85 | 7.31 | 13.65 | 17.2 | 0.632 |
| 2017 | 5.3 | 9.82 | 12.87 | 0.81 | 9.141 | 16.53 | 20.65 | 0.512 |
| 2018 | 5.139 | 10.234 | 13.64 | 0.77 | 7.94 | 15.3 | 19.61 | 0.53 |
| 2019 | 4.9 | 10.47 | 13.66 | 0.781 | 6.93 | 14.4 | 18.27 | 0.609 |
| 2020 | 5.39 | 11.63 | 15.03 | 0.73 | 7.797 | 16.09 | 20.41 | 0.51 |
| Total | 5.065 | 10.089 | 13.22 | 0.788 | 7.824 | 15.19 | 19.23 | 0.5586 |
| (c) | ||||||||
| Year | LSTM-RNN | LR | ||||||
| MAPE | MAE | RMSR | R2 Score | MAPE | MAE | RMSR | R2 Score | |
| 2016 | 5.45 | 3.19 | 4.1 | 0.81 | 7.32 | 4.48 | 5.65 | 0.63 |
| 2017 | 7.13 | 4.25 | 5.316 | 0.7 | 9.43 | 5.575 | 6.93 | 0.49 |
| 2018 | 5.86 | 3.72 | 4.937 | 0.73 | 8.86 | 5.54 | 7.02 | 0.44 |
| 2019 | 5.39 | 3.81 | 4.769 | 0.75 | 7.02 | 4.79 | 5.95 | 0.62 |
| 2020 | 5.96 | 4.27 | 5.29 | 0.699 | 7.01 | 4.88 | 6.09 | 0.6 |
| Total | 5.958 | 3.848 | 4.882 | 0.7378 | 7.928 | 5.053 | 6.328 | 0.556 |
| (d) | ||||||||
| Year | LSTM-RNN | LR | ||||||
| MAPE | MAE | RMSR | R2 Score | MAPE | MAE | RMSR | R2 Score | |
| 2016 | 3.92 | 1.02 | 1.37 | 0.88 | 7.32 | 1.95 | 2.45 | 0.63 |
| 2017 | 4.38 | 1.16 | 1.58 | 0.86 | 8.22 | 2.14 | 2.69 | 0.59 |
| 2018 | 4.82 | 1.37 | 1.787 | 0.81 | 7.043 | 1.974 | 2.53 | 0.622 |
| 2019 | 6.29 | 1.93 | 2.34 | 0.69 | 6.5 | 2.02 | 2.51 | 0.63 |
| 2020 | 6.58 | 2.05 | 2.59 | 0.62 | 6.57 | 2.1 | 2.58 | 0.661 |
| Total | 5.34 | 1.55 | 2 | 0.79 | 7.1 | 2 | 2.55 | 0.62 |
| (e) | ||||||||
| Year | LSTM-RNN | LR | ||||||
| MAPE | MAE | RMSR | R2 Score | MAPE | MAE | RMSR | R2 Score | |
| 2016 | 5.13 | 0.922 | 1.19 | 0.823 | 7.33 | 1.36 | 1.77 | 0.63 |
| 2017 | 6.35 | 1.15 | 1.47 | 0.752 | 9.1 | 1.63 | 2.04 | 0.52 |
| 2018 | 5.59 | 1.09 | 1.44 | 0.748 | 8.08 | 1.54 | 1.98 | 0.526 |
| 2019 | 5.88 | 1.27 | 1.56 | 0.71 | 6.74 | 1.41 | 1.76 | 0.64 |
| 2020 | 5.84 | 1.27 | 1.577 | 0.711 | 6.7 | 1.43 | 1.788 | 0.62 |
| Total | 5.758 | 1.1404 | 1.447 | 0.7488 | 7.59 | 1.474 | 1.868 | 0.5872 |
| LSTM | LR | |
|---|---|---|
| Mean | 590.9836874 | 597.3554465 |
| Variance | 6330.735656 | 5042.239544 |
| Observations | 43.848 | 43.848 |
| Pearson correlation | 0.851442119 | |
| Hypothesized mean difference | 0 | |
| df | 43.847 | |
| t Stat | −31.87722655 | |
| p(T ≤ t) one-tail | 9.2085 × 10−221 | |
| t Critical one-tail | 1.64488838 | |
| p(T ≤ t) two-tail | 1.8417 × 10−220 | |
| t Critical two-tail | 1.960018089 |
| Metric | Value | Interpretation |
|---|---|---|
| MEAN (LSTM vs. LR) | 590.98 vs. 597.36 | LSTM demonstrates a lower mean error compared with LR (better performance). |
| T STAT | −31.88 | A significantly large negative value, indicating that LSTM consistently outperforms LR across all samples. |
| DEGREES OF FREEDOM (DF) | 43.847 | Extensive sample size ensures robust statistical inference. |
| p-VALUE (TWO-TAIL) | ~1.84 × 10−220 | This is essentially zero, indicating a highly significant difference. |
| TCRITICAL (TWO-TAIL) | 1.96 | For significance at α = 0.05, the t-stat far exceeds this value. |
Disclaimer/Publisher’s Note: The statements, opinions and data contained in all publications are solely those of the individual author(s) and contributor(s) and not of MDPI and/or the editor(s). MDPI and/or the editor(s) disclaim responsibility for any injury to people or property resulting from any ideas, methods, instructions or products referred to in the content. |
© 2025 by the authors. Licensee MDPI, Basel, Switzerland. This article is an open access article distributed under the terms and conditions of the Creative Commons Attribution (CC BY) license (https://creativecommons.org/licenses/by/4.0/).
Share and Cite
Lukong, T.K.; Nganyu Tanyu, D.; Nkongtchou, Y.; Tatietse, T.T.; Schulz, D. A Spatial Long-Term Load Forecast Using a Multiple Delineated Machine Learning Approach. Energies 2025, 18, 2484. https://doi.org/10.3390/en18102484
Lukong TK, Nganyu Tanyu D, Nkongtchou Y, Tatietse TT, Schulz D. A Spatial Long-Term Load Forecast Using a Multiple Delineated Machine Learning Approach. Energies. 2025; 18(10):2484. https://doi.org/10.3390/en18102484
Chicago/Turabian StyleLukong, Terence Kibula, Derick Nganyu Tanyu, Yannick Nkongtchou, Thomas Tamo Tatietse, and Detlef Schulz. 2025. "A Spatial Long-Term Load Forecast Using a Multiple Delineated Machine Learning Approach" Energies 18, no. 10: 2484. https://doi.org/10.3390/en18102484
APA StyleLukong, T. K., Nganyu Tanyu, D., Nkongtchou, Y., Tatietse, T. T., & Schulz, D. (2025). A Spatial Long-Term Load Forecast Using a Multiple Delineated Machine Learning Approach. Energies, 18(10), 2484. https://doi.org/10.3390/en18102484