1. Introduction
The global expansion of wind energy—both onshore and offshore—has positioned it as a basis for the transition toward sustainable and low-carbon power systems [
1,
2]. Driven by national and international decarbonization targets, wind power now constitutes a substantial share of installed generation capacity in many countries. In Portugal, for instance, wind energy accounts for approximately 30% of the total installed capacity, with projections indicating a rise to nearly 38% by 2030 [
3,
4]. The country’s ambition to achieve carbon neutrality by 2050 further underscores the strategic importance of wind power in its electricity mix [
5].
Despite its environmental benefits and increasing deployment, wind power is inherently variable and uncertain, posing growing challenges for electricity producers and system operators. While it is currently integrated into power systems without curtailment and is treated as fully dispatchable, the stochastic nature of wind introduces operational complexity—particularly under high penetration scenarios [
6,
7]. These challenges become more pronounced when generators are required to commit to day-ahead energy markets, where deviations from the scheduled output due to forecast errors or resource intermittency may incur financial penalties [
8,
9].
Recent studies have demonstrated the effectiveness of entropy-based metrics in characterizing uncertainty and variability in renewable energy systems. For example, Shannon entropy has been employed to evaluate statistical uncertainty in wind and solar energy generation [
10]. Rényi entropy has been used to enhance the sensitivity analysis of wind power forecasting errors [
11], while Tsallis entropy has proven effective for spatial uncertainty evaluation [
12]. Additionally, permutation entropy has been applied to assess the complexity and predictability of energy-related time series [
13]. These prior studies support the adoption of multiple entropy formulations in this work, providing a robust and complementary perspective on the stochastic behavior of wind generation.
This study investigates the differences in uncertainty and reliability between onshore and offshore wind generation through a real-world case study. The system under analysis comprises three onshore and one offshore wind generator, all located in a region of Portugal. Active power data were recorded at 15-min intervals from 1 January 2022 to 31 December 2024, yielding high-resolution time series that reflect the actual variability and behavior of wind power production under diverse geographical and climatic conditions.
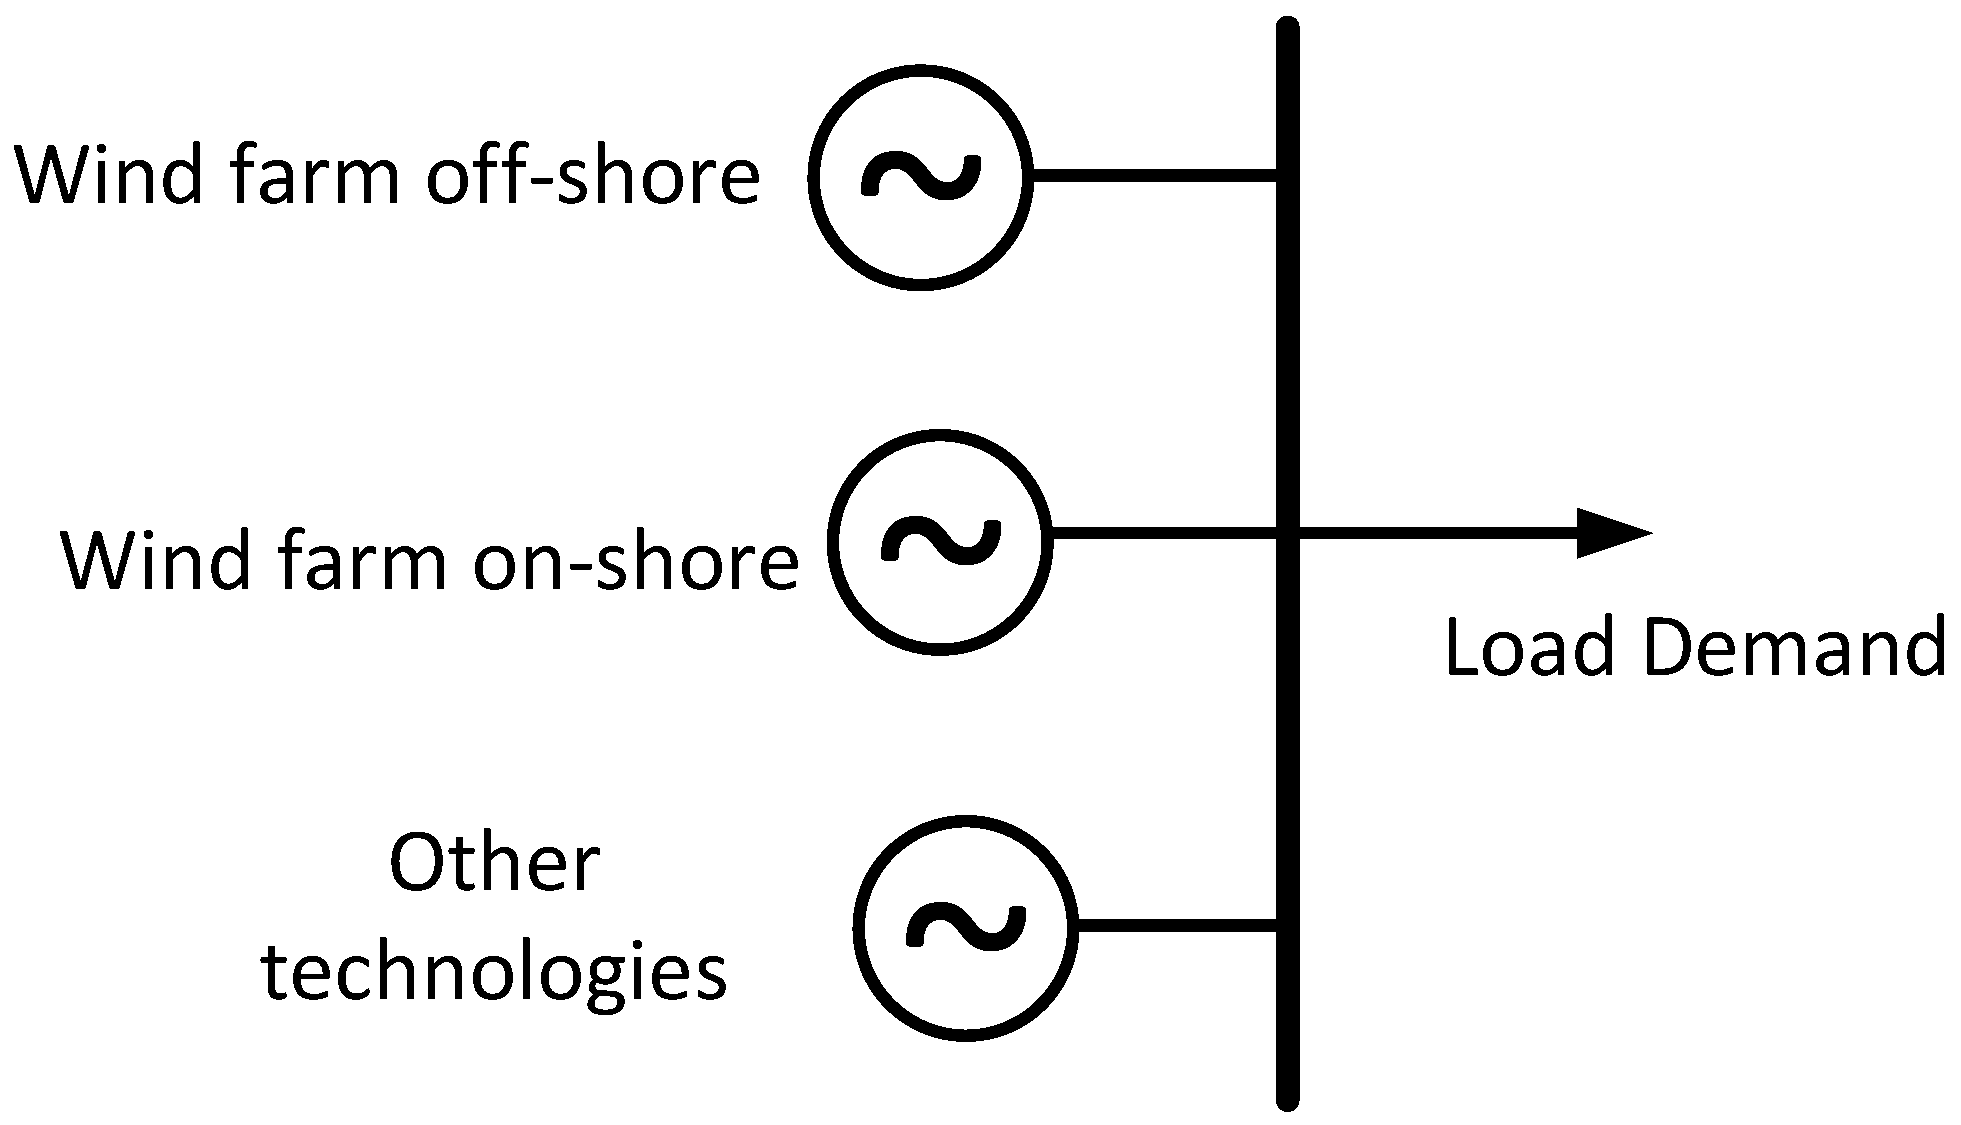
Figure 1 provides a generic schematic representation of how offshore and onshore wind sources contribute to overall load demand within a power system. The actual network topology and geographic configuration of the real case study are detailed in
Section 2.
The novelty of this work is based on the development of an integrated and structured methodology that combines statistical modeling, probabilistic distribution fitting—including zero-inflated formulations—entropy-based uncertainty metrics, and economic analysis through an uncertainty-adjusted Levelized Cost of Energy (LCOE). This integrated framework enables a comprehensive comparison of onshore and offshore wind generation in terms of variability, predictability, and economic reliability.
Whereas previous studies have typically addressed these aspects in isolation—focusing either on forecast uncertainty [
14,
15], entropy-based signal analysis [
16], or cost modeling [
17,
18]—this paper proposes a unified and reproducible workflow that systematically links technical uncertainty to financial impact. To the best of the authors’ knowledge, this is the first application of such an integrated approach to multi-year, high-resolution data from both onshore and deep offshore wind generators in a real power system context.
This paper is organized as follows:
Section 2 details the methodology, including data acquisition, preprocessing, statistical and probabilistic modeling, entropy computation, and LCOE formulation.
Section 3 presents the main observational results.
Section 4 provides a critical analysis and contextual interpretation of the findings. Finally,
Section 5 summarizes the conclusions and outlines directions for future research.
2. Materials and Methods
This section presents the methodological framework employed to evaluate and compare the uncertainty and reliability of onshore and offshore wind power generation. This analytical framework integrates high-resolution real-world data with a sequence of statistical, probabilistic, entropic, and economic analyses. The entire methodology was implemented in MATLAB R2024a to ensure computational consistency and reproducibility across all stages.
2.1. Case Study Description
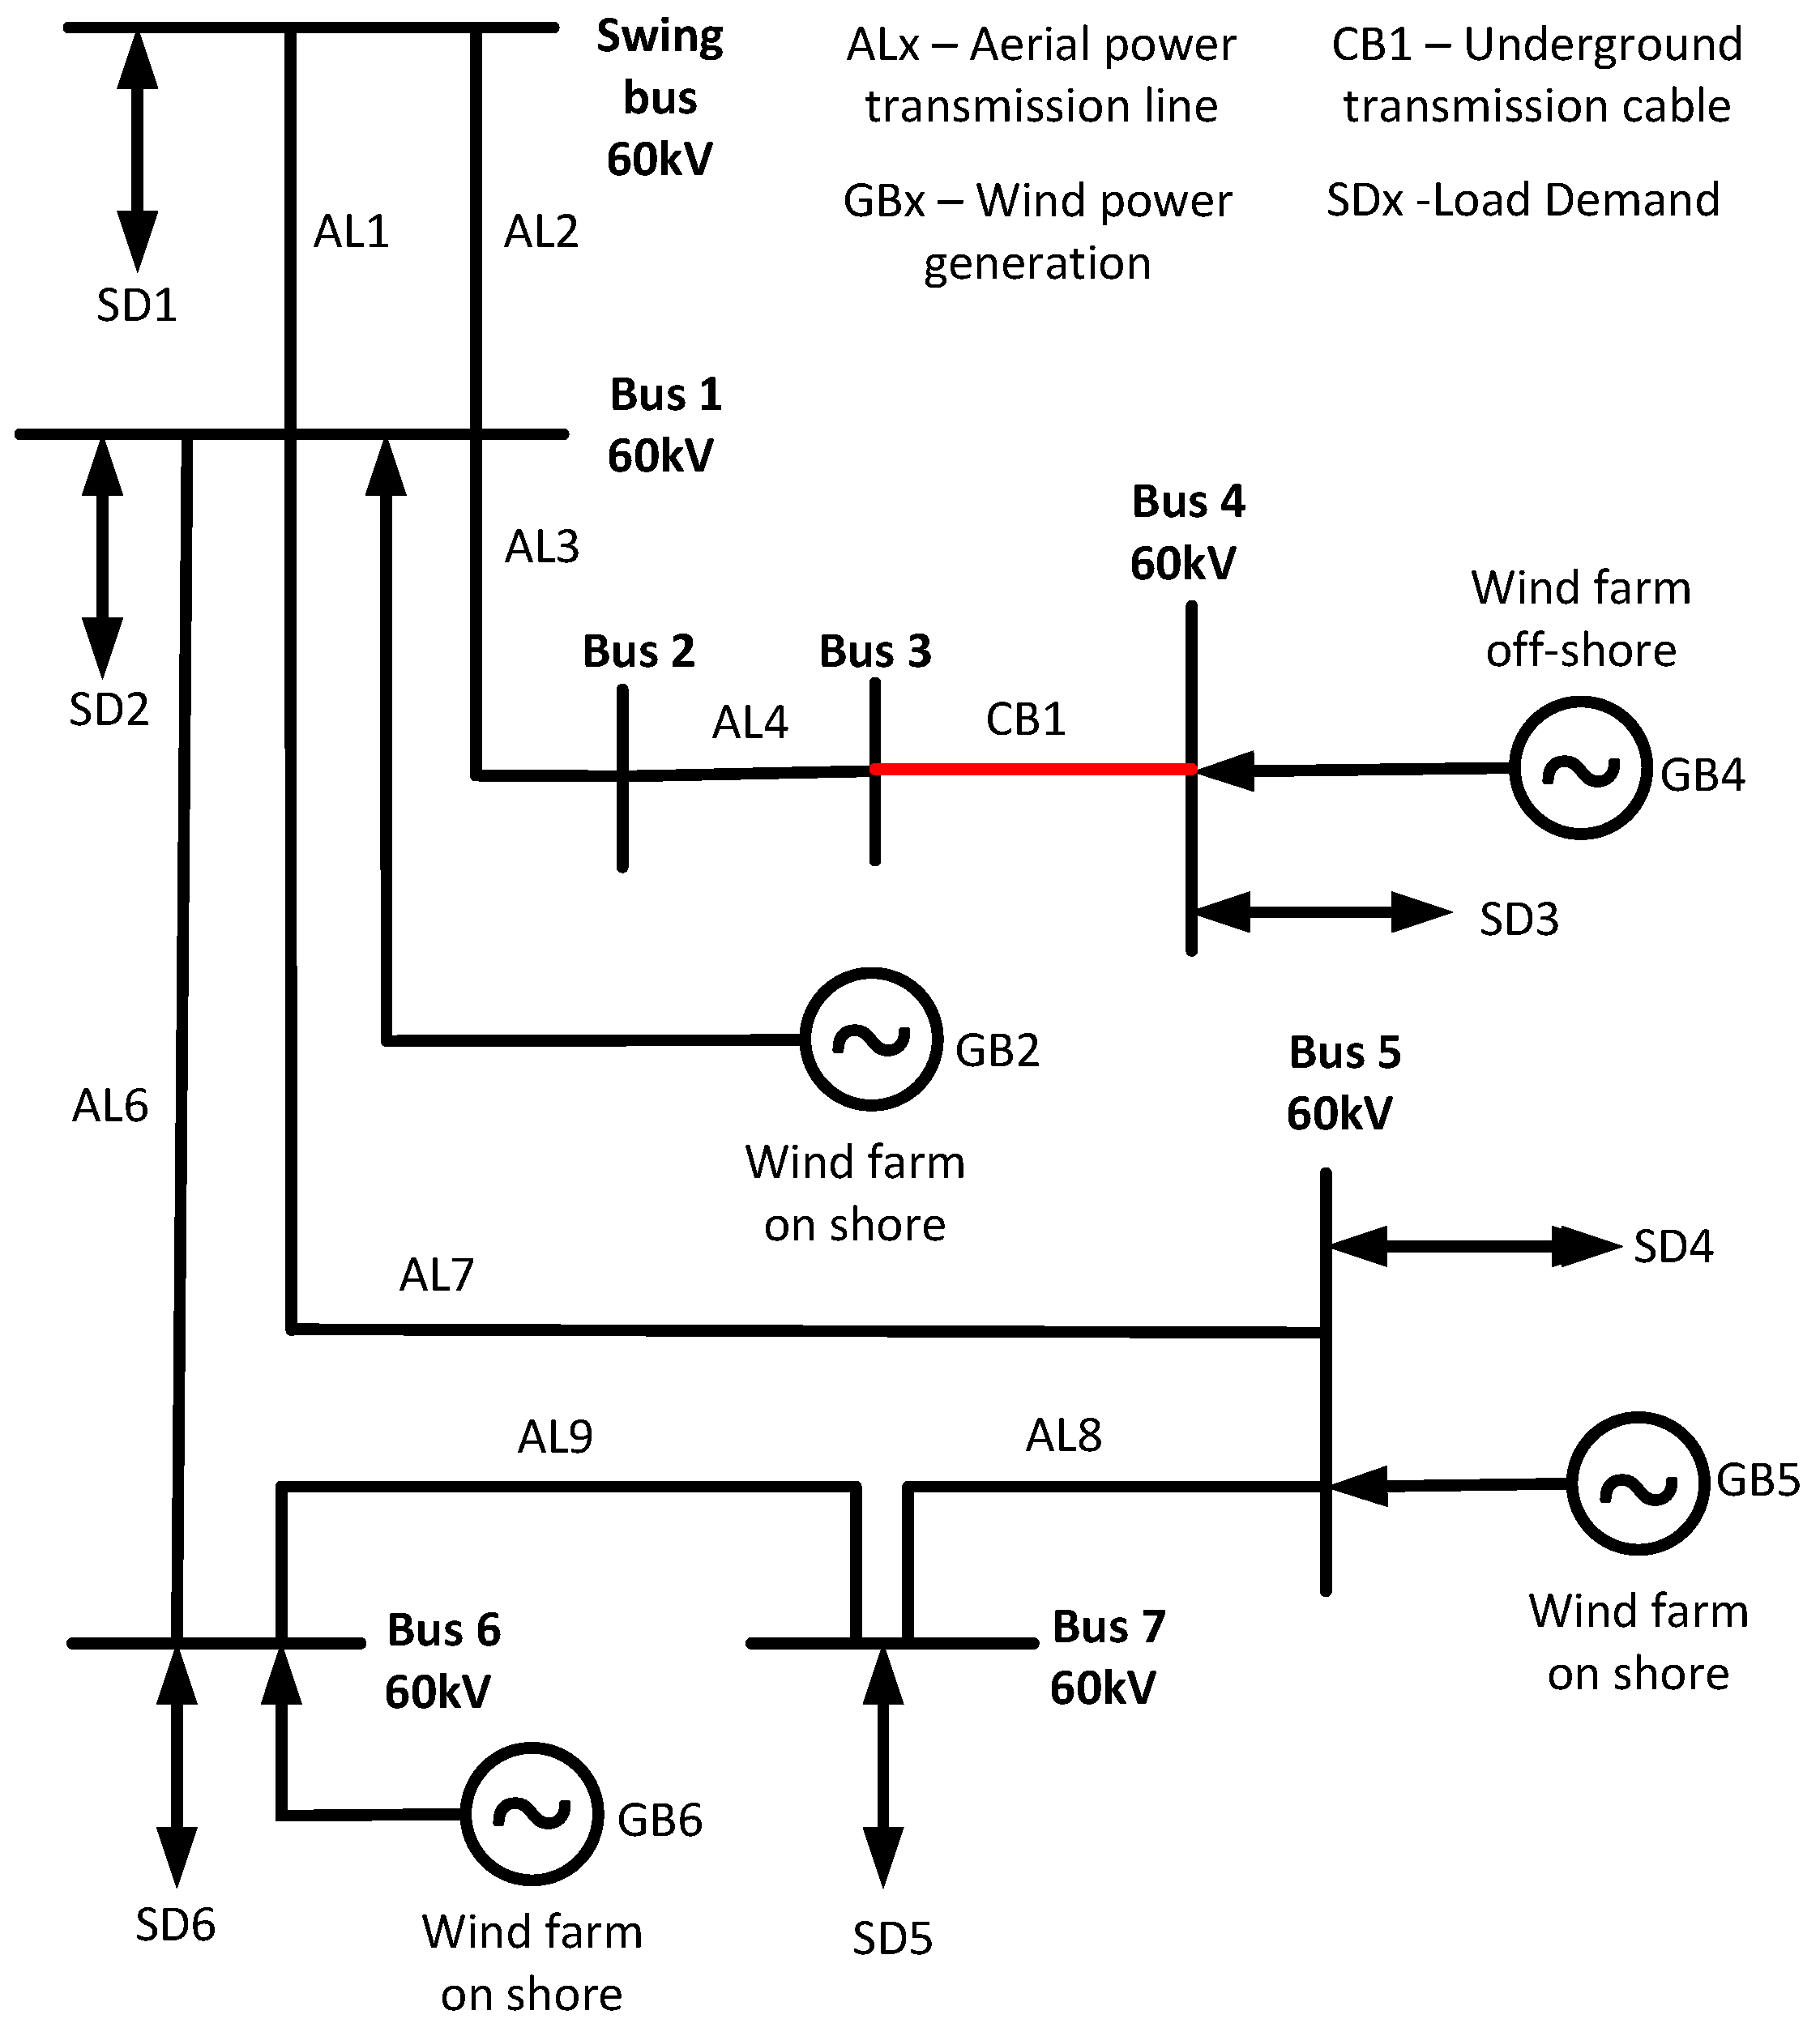
The study focuses on a real-world case involving a regional 60 kV electrical distribution network in Portugal, consisting of four wind power generators. Among these, three are located onshore across inland areas with variable topography, while one is installed offshore in deep waters, operating under more stable maritime wind conditions (see
Figure 2).
Active power data from all four units were collected at 15 min intervals over a three-year period (from 1 January 2022 to 31 December 2024). This high-resolution dataset captures the temporal variability of wind generation and provides the analytical basis for the entire analysis.
The wind generation data were obtained from SCADA (Supervisory Control and Data Acquisition) systems of operational onshore and offshore wind farms located in Portugal. Although the individual generators are anonymized due to confidentiality agreements, the data acquisition was conducted within established research collaborations, ensuring high-resolution (15 min) and quality-controlled measurements suitable for uncertainty and reliability analyses.
The 60 kV distribution network analyzed in this study corresponds to a real-world system located in Portugal. The network includes eight buses, underground cables, and the integration of wind generation units and loads. This study focuses specifically on the uncertainty quantification and economic reliability of wind power generation within this network. All electrical parameters and topological configurations were retained throughout the analysis to ensure consistency and comparability.
2.2. Data Acquisition and Preprocessing
The dataset comprises active power time series for each wind generator, resulting in more than 100,000 observations per unit. Initial preprocessing steps included the conversion of all values to absolute magnitudes, the removal of spurious or negative readings, and the preservation of zero-output intervals—essential for modeling intermittency and availability patterns.
2.3. Exploratory Statistical Analysis
Descriptive statistics were computed to summarize the central tendency, dispersion, and distribution shape of the generation profiles. The mean power output is defined as follows:
The variance, quantifying dispersion around the mean, is given by the following:
Skewness and kurtosis were also computed to characterize distribution asymmetry and tail behavior, respectively, as follows:
These statistical moments are the standard tools in the analysis of wind power data [
19,
20].
2.4. Probabilistic Distribution Modeling
To characterize the stochastic nature of wind generation, the positive-valued data were fitted to four continuous probability distributions commonly used in wind energy modeling as follows: Weibull, Rayleigh, Lognormal, and Normal [
21,
22]. The estimation was performed using MATLAB’s
fitdist function with maximum likelihood estimation (MLE).
Given the high frequency of zero-output intervals—especially for onshore units—zero-inflated variants of the distributions were adopted. These events arise from several real-world conditions, including low wind speeds below turbine cut-in thresholds, operational curtailments, or planned maintenance. Such occurrences introduce a large number of zero-valued data points, which conventional continuous distributions are not equipped to model accurately.
To address this, the zero-inflated modeling framework was employed, combining a discrete probability mass at zero with a continuous distribution for the non-zero values as follows:
Here, represents the empirical probability of zero generation, is the Dirac delta function at zero, and is the probability density function (PDF) of the chosen continuous distribution. This formulation effectively captures the dual nature of wind power output—frequent null generation interspersed with a continuous range of positive values.
Model performance was evaluated using an adapted Kolmogorov–Smirnov (K–S) test for zero-inflated distributions, along with the Akaike Information Criterion (AIC) and Bayesian Information Criterion (BIC) [
23] as follows:
where
k is the total number of model parameters (including
),
n is the sample size, and NLL is the negative log-likelihood of the fitted model.
This approach allowed for improved statistical accuracy and a more realistic representation of the intermittent nature of wind generation, particularly for onshore generators, which are more susceptible for prolonged low-wind or maintenance-induced shutdowns.
2.5. Entropy-Based Uncertainty Analysis
To quantify the uncertainty associated with each generator, the following four entropy measures were computed from the normalized empirical distributions:
Rényi entropy (order
) [
25]:
Tsallis entropy (parameter
) [
26]:
Permutation entropy, based on ordinal patterns of order 3 [
27]:
The Rényi and Tsallis entropy measures were computed using order parameters and , respectively. These values are commonly adopted in the energy-related literature due to their analytical simplicity and ability to emphasize dominant probability components. In systems with zero-inflated data, such as wind generation profiles, these parameter choices can influence sensitivity to rare or null outputs. Although the current analysis focuses on these standard values, further sensitivity studies could explore the effects of varying and q, especially for systems with extreme intermittency.
The selection of entropy measures in this study is grounded in their demonstrated relevance for modeling uncertainty and complexity in energy systems. Shannon entropy is widely adopted to quantify statistical uncertainty and variability in renewable energy assessments [
10]. Rényi entropy, particularly with
, has been used to analyze wind power forecasting errors, providing enhanced sensitivity to dominant outcomes in non-Gaussian distributions [
11]. Tsallis entropy with
has been applied in spatial uncertainty evaluations, capturing non-extensive statistical behaviors that are also relevant in renewable energy systems [
12]. Permutation entropy, being robust to noise and model-free, has been employed to assess the complexity and predictability of energy-related time series [
13]. These choices offer complementary perspectives on the stochastic behavior of wind generation and are consistent with prior work in the field.
Finally, probabilities were obtained from normalized histograms with 50 intervals. All entropy computations were implemented in MATLAB R2024a.
2.6. Economic Reliability Analysis
The economic performance of each generator was evaluated using the Levelized Cost of Energy (LCOE), defined as follows:
where CAPEX is the capital investment,
is the operation and maintenance cost in year
t,
is the energy produced in year
t,
r is the discount rate, and
years represents the assumed project lifetime [
28].
The LCOE simulation was based on representative investment and operational assumptions derived from industry benchmarks. Onshore wind projects were modeled with CAPEX ranging from EUR 1.1 to 1.7 million per MW, while offshore projects used a higher range from EUR 2.5 to 4 million per MW, reflecting the additional installation and infrastructure costs specific to maritime deployment [
17,
28,
29]. Operational and maintenance (O&M) costs were assumed to represent approximately 3% of CAPEX annually, consistent with the standard values reported in the literature [
28,
29].
Accordingly, operational and maintenance (O&M) costs were assumed to be 3% of CAPEX annually, in line with standard practice for utility-scale wind systems. A project lifetime of 25 years and a discount rate of 7% were applied to all generators. These values were held constant to isolate the effect of production uncertainty on cost performance.
To account for variability in generation, the LCOE was adjusted using the normalized Shannon entropy as follows:
This formulation penalizes generators with higher uncertainty and rewards those with more predictable behavior—aligning with recent efforts to incorporate risk and reliability into cost metrics [
30,
31].
2.7. Methodological Overview
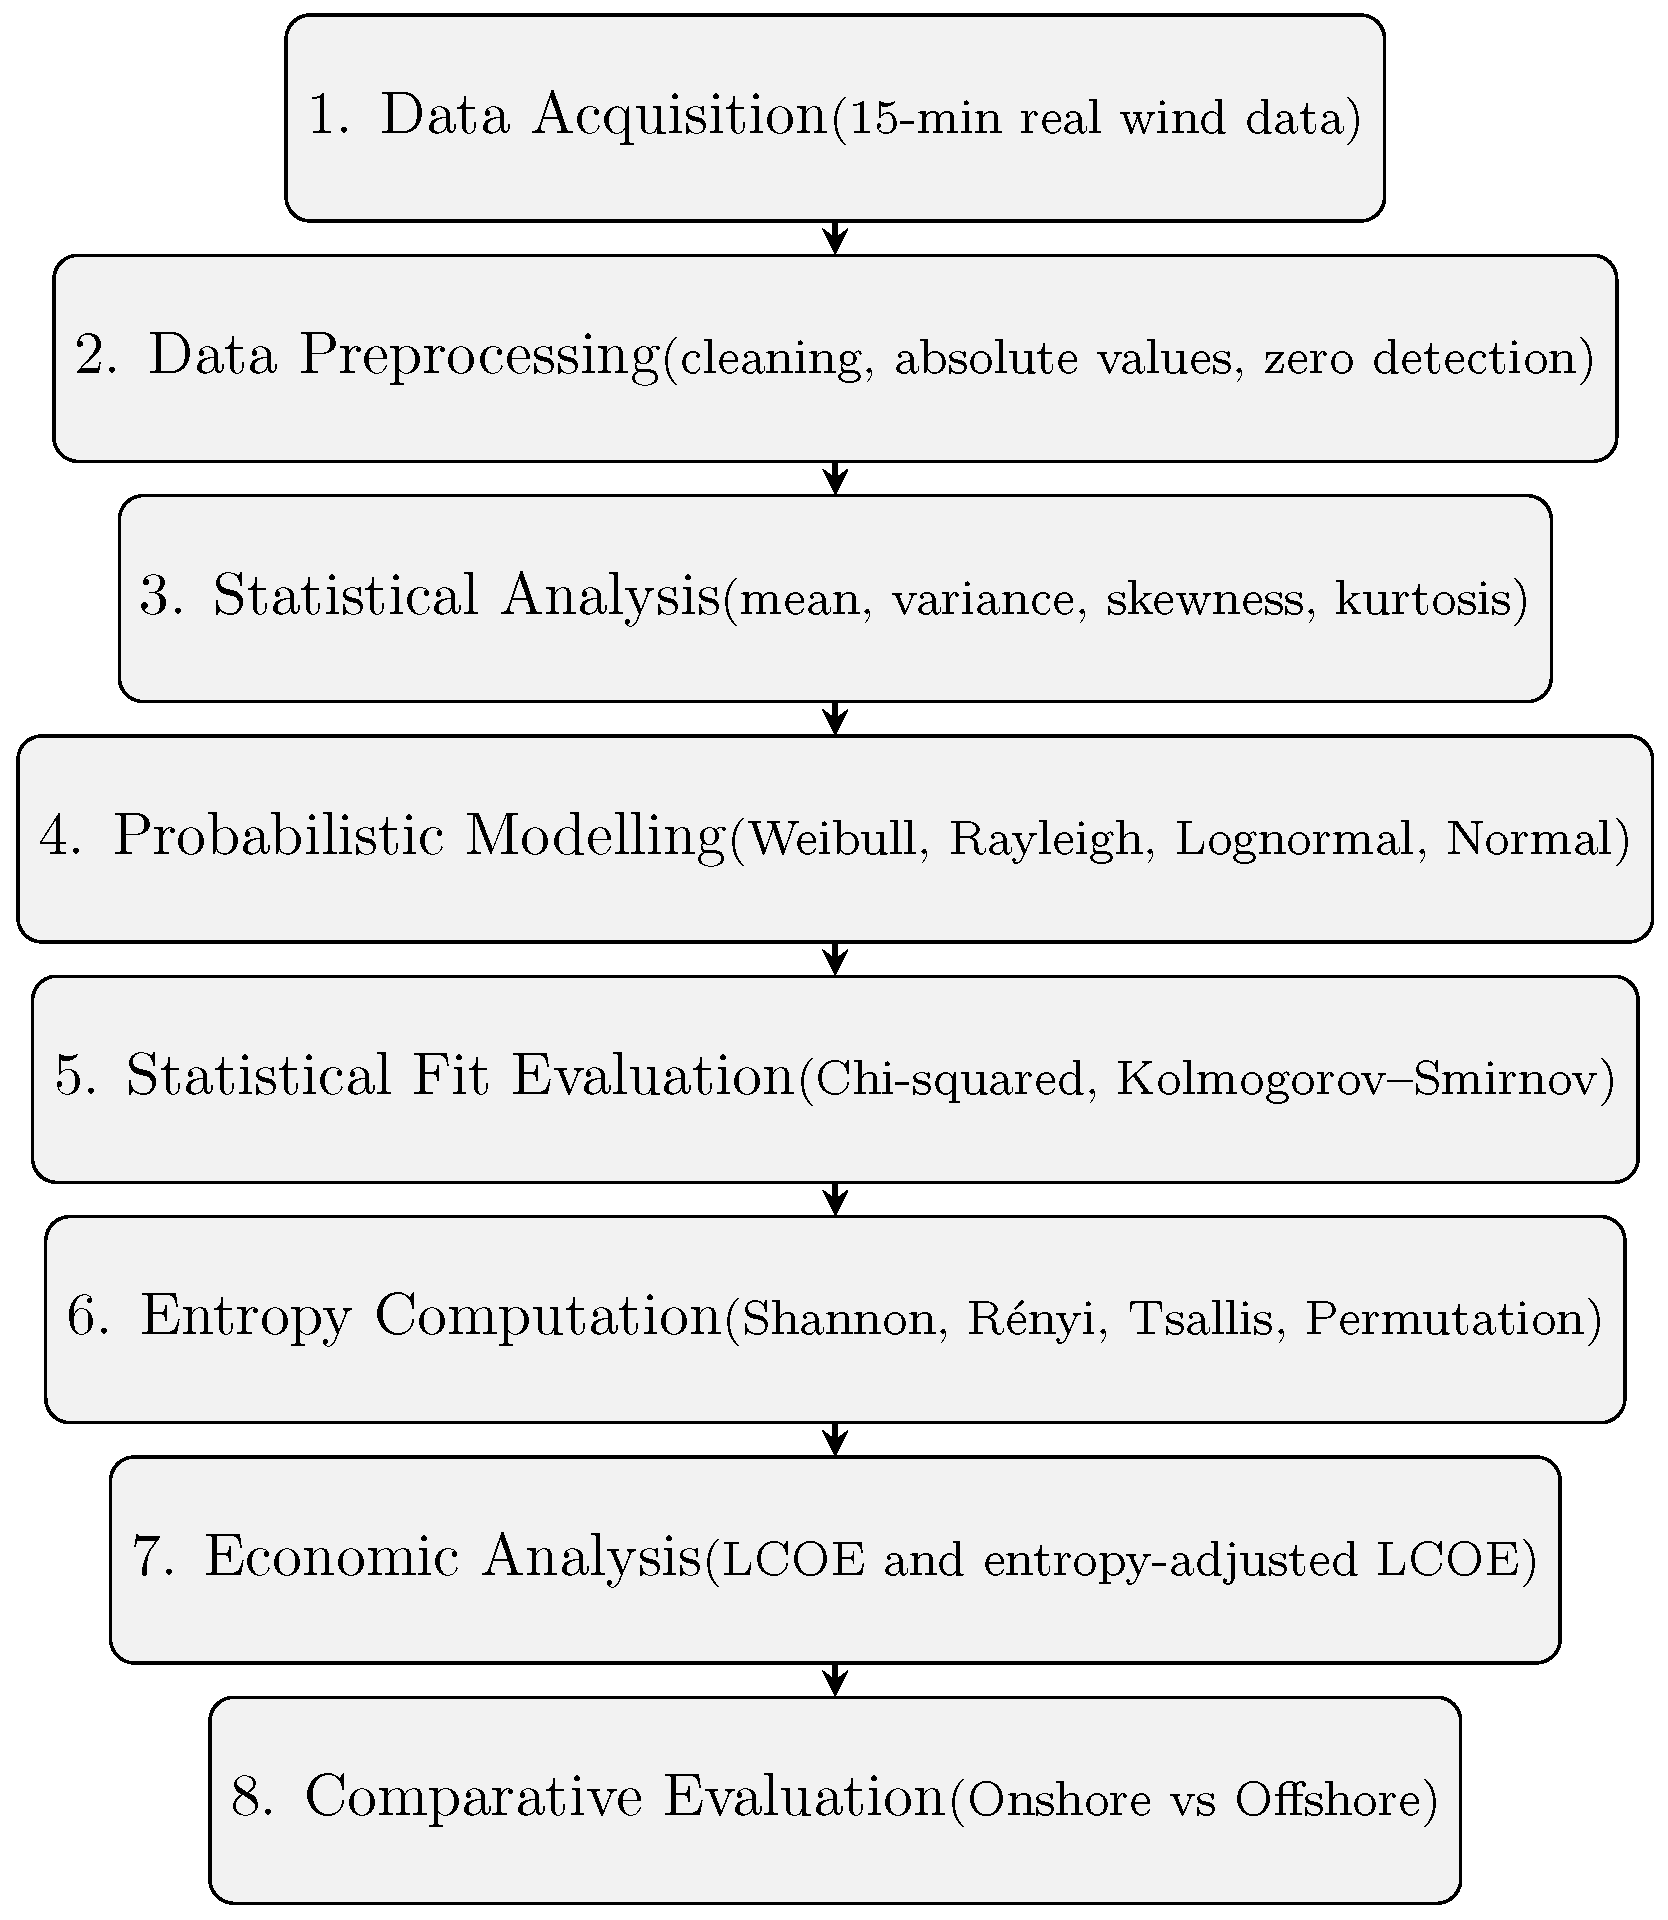
The complete methodological process is summarized in
Figure 3. It begins with data acquisition and preprocessing, followed by statistical and probabilistic modeling, entropy-based uncertainty analysis, and finally, an economic evaluation that integrates uncertainty into the cost framework. This workflow approach ensures a comprehensive assessment of wind power systems from multiple analytical perspectives.
The computational steps were implemented in MATLAB. To enhance reproducibility and clarity, a pseudocode summarizing the main processing sequence is presented in Algorithm 1.
| Algorithm 1 Pseudocode of the methodology implementation |
Load high-resolution wind power data for each generator (onshore and offshore). For each generator: - (a)
Identify the proportion of zero outputs. - (b)
Fit zero-inflated Weibull, Rayleigh, Lognormal, and Normal distributions to the positive outputs. - (c)
Compute statistical performance metrics (AIC, BIC, and Kolmogorov-Smirnov test). - (d)
Select the best-fitting distributions based on AIC and BIC criteria.
For each generator: - (a)
Estimate probability distributions of power output. - (b)
Calculate entropy-based uncertainty metrics:
Perform economic analysis: - (a)
Estimate the Levelized Cost of Energy (LCOE) for each generator, considering CAPEX, O&M costs, and annual energy production. - (b)
Normalize Shannon entropy values to define a relative uncertainty index. - (c)
Adjust LCOE values based on the associated uncertainty index.
Visualize and compare: - (a)
Probability density functions and empirical histograms. - (b)
Entropy metrics across generators. - (c)
Original and uncertainty-adjusted LCOE values.
Save all numerical results and figures for further analysis.
|
3. Results
This section presents the results obtained from the statistical, probabilistic, entropic, and economic analyses performed on the four wind power generators. The results are structured in alignment with the methodological steps described in
Section 2, enabling a coherent progression from distribution modeling to uncertainty quantification and economic reliability assessment.
Particular emphasis is placed on the comparison between onshore and offshore systems, highlighting key differences in operational consistency, predictability, and economic performance. The analysis begins with an evaluation of how well various probabilistic models represent the empirical distribution of power output data, with special consideration given to the prevalence of zero-generation intervals.
3.1. Distribution Fitting and Zero-Inflated Modeling
The empirical power output distributions were modeled using zero-inflated versions of the following four candidate distributions: Weibull, Rayleigh, Lognormal, and Normal.
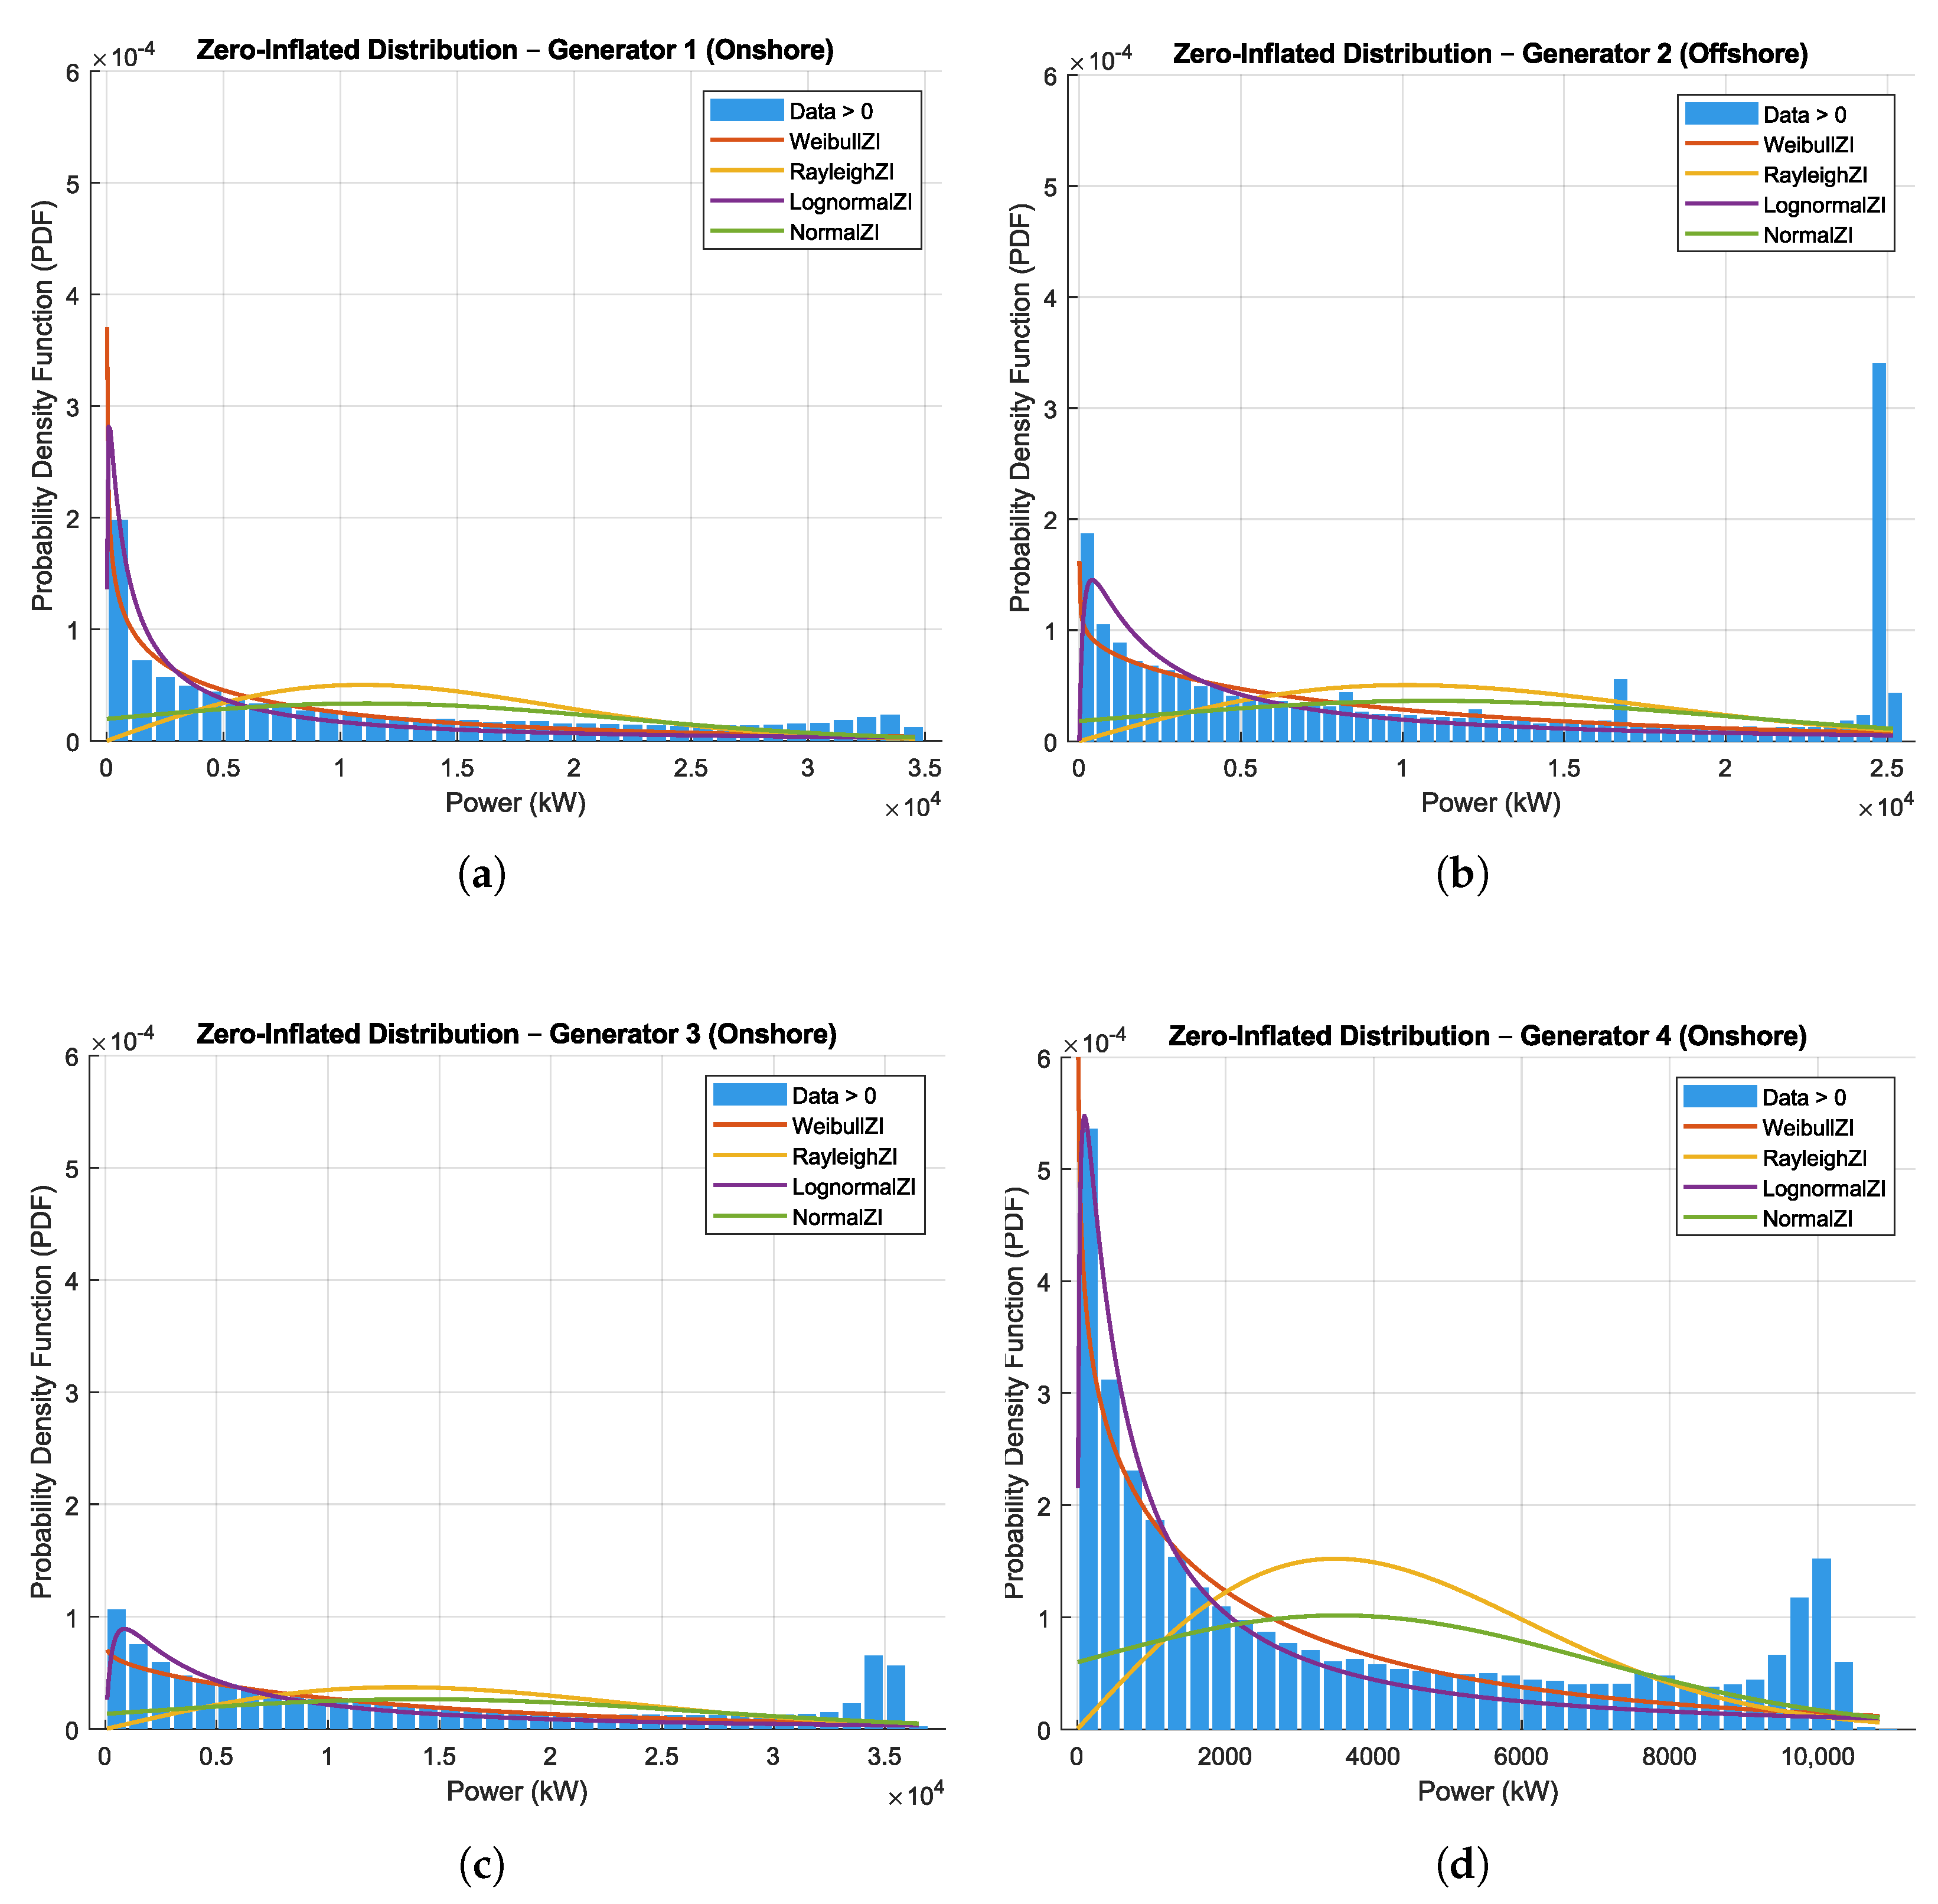
Figure 4 illustrates the fitting results for each generator, comparing the modeled probability density functions (PDFs) with the corresponding empirical histograms.
Although the visual comparison is limited by the use of different axis scales, the offshore generator (
Figure 4b) displayed a more compact and symmetrical distribution. This observation is supported by the statistical modeling results, particularly the lower AIC and BIC values associated with the WeibullZI and LognormalZI results, displayed in
Table 1. In contrast, the onshore generators (
Figure 4a,c,d) exhibited a more dispersed distribution with heavier extremes, reflecting greater variability and intermittency.
Figure 4 standardizes the Y-axis scale across all subplots, allowing for a clearer and more consistent visual comparison of the fitted probability density functions among the generators. These adjustments improve visual comparability while preserving the interpretability of each distributional fit.
To quantitatively assess model performance, the Akaike Information Criterion (AIC) and Bayesian Information Criterion (BIC) were computed for each fitted model.
Table 1 summarizes the resulting values. In all generators, the WeibullZI and LognormalZI models provided superior performance, confirming their suitability for characterizing wind generation patterns, as supported in the literature [
21,
22].
3.2. Entropy Analysis
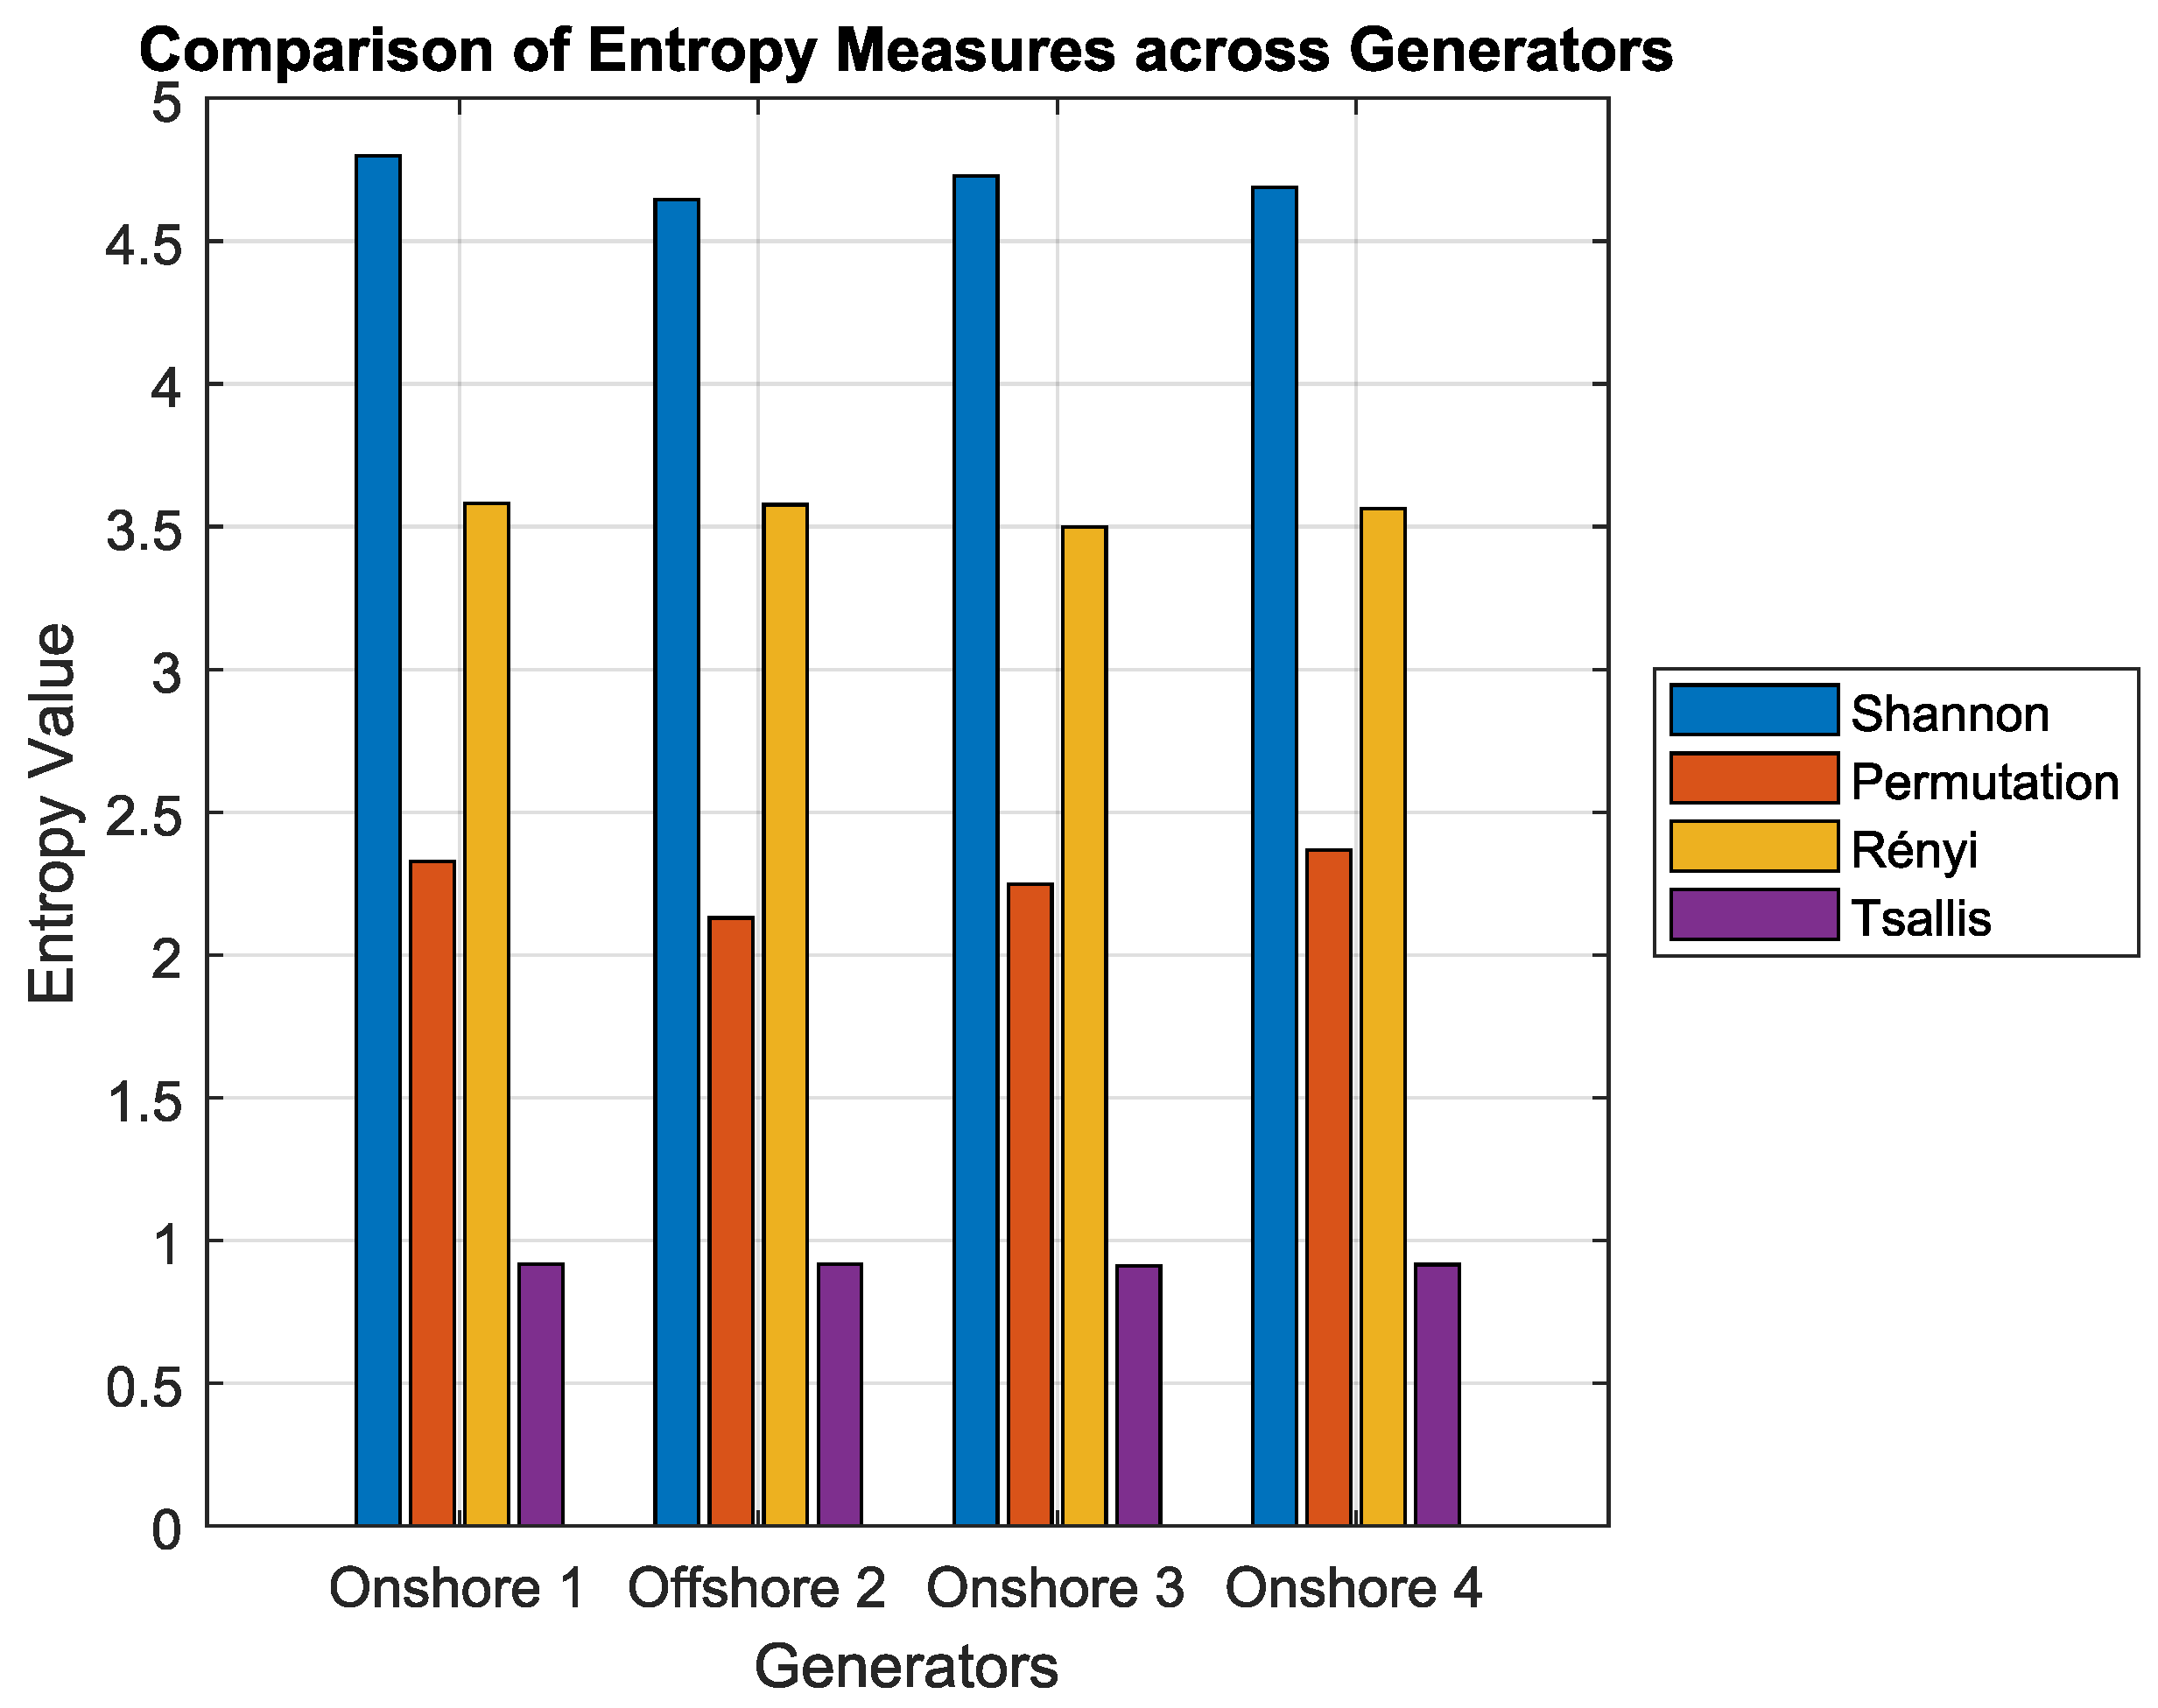
To assess the informational complexity and uncertainty of power generation, the following four entropy metrics were calculated for each generator: Shannon, Rényi, Tsallis, and permutation entropy. These indicators provide complementary insights into the temporal structure and statistical unpredictability of the power output time series.
As shown in
Figure 5 and
Table 2, the offshore unit (Generator 2) exhibited lower entropy values under the Shannon and permutation metrics, suggesting higher regularity in power output. For the Rényi and Tsallis entropies, the differences were less pronounced, with Generator 2 showing comparable values to the onshore units. Nevertheless, Generator 1 consistently recorded the highest entropy levels across most metrics, reflecting greater temporal irregularity.
Table 2 reports the numerical entropy values. Despite the general agreement among metrics, small variations between Rényi and Tsallis entropy provide complementary perspectives on higher-order statistical moments [
16].
Although the entropy differences between generators are numerically modest, the trends observed across all four entropy measures consistently distinguish the offshore unit from the onshore units, particularly in Shannon and permutation entropies. This consistency strengthens the validity of the comparative analysis. In addition to
Figure 5,
Table 2 provides the exact entropy values, offering complementary quantitative evidence for the observed distinctions.
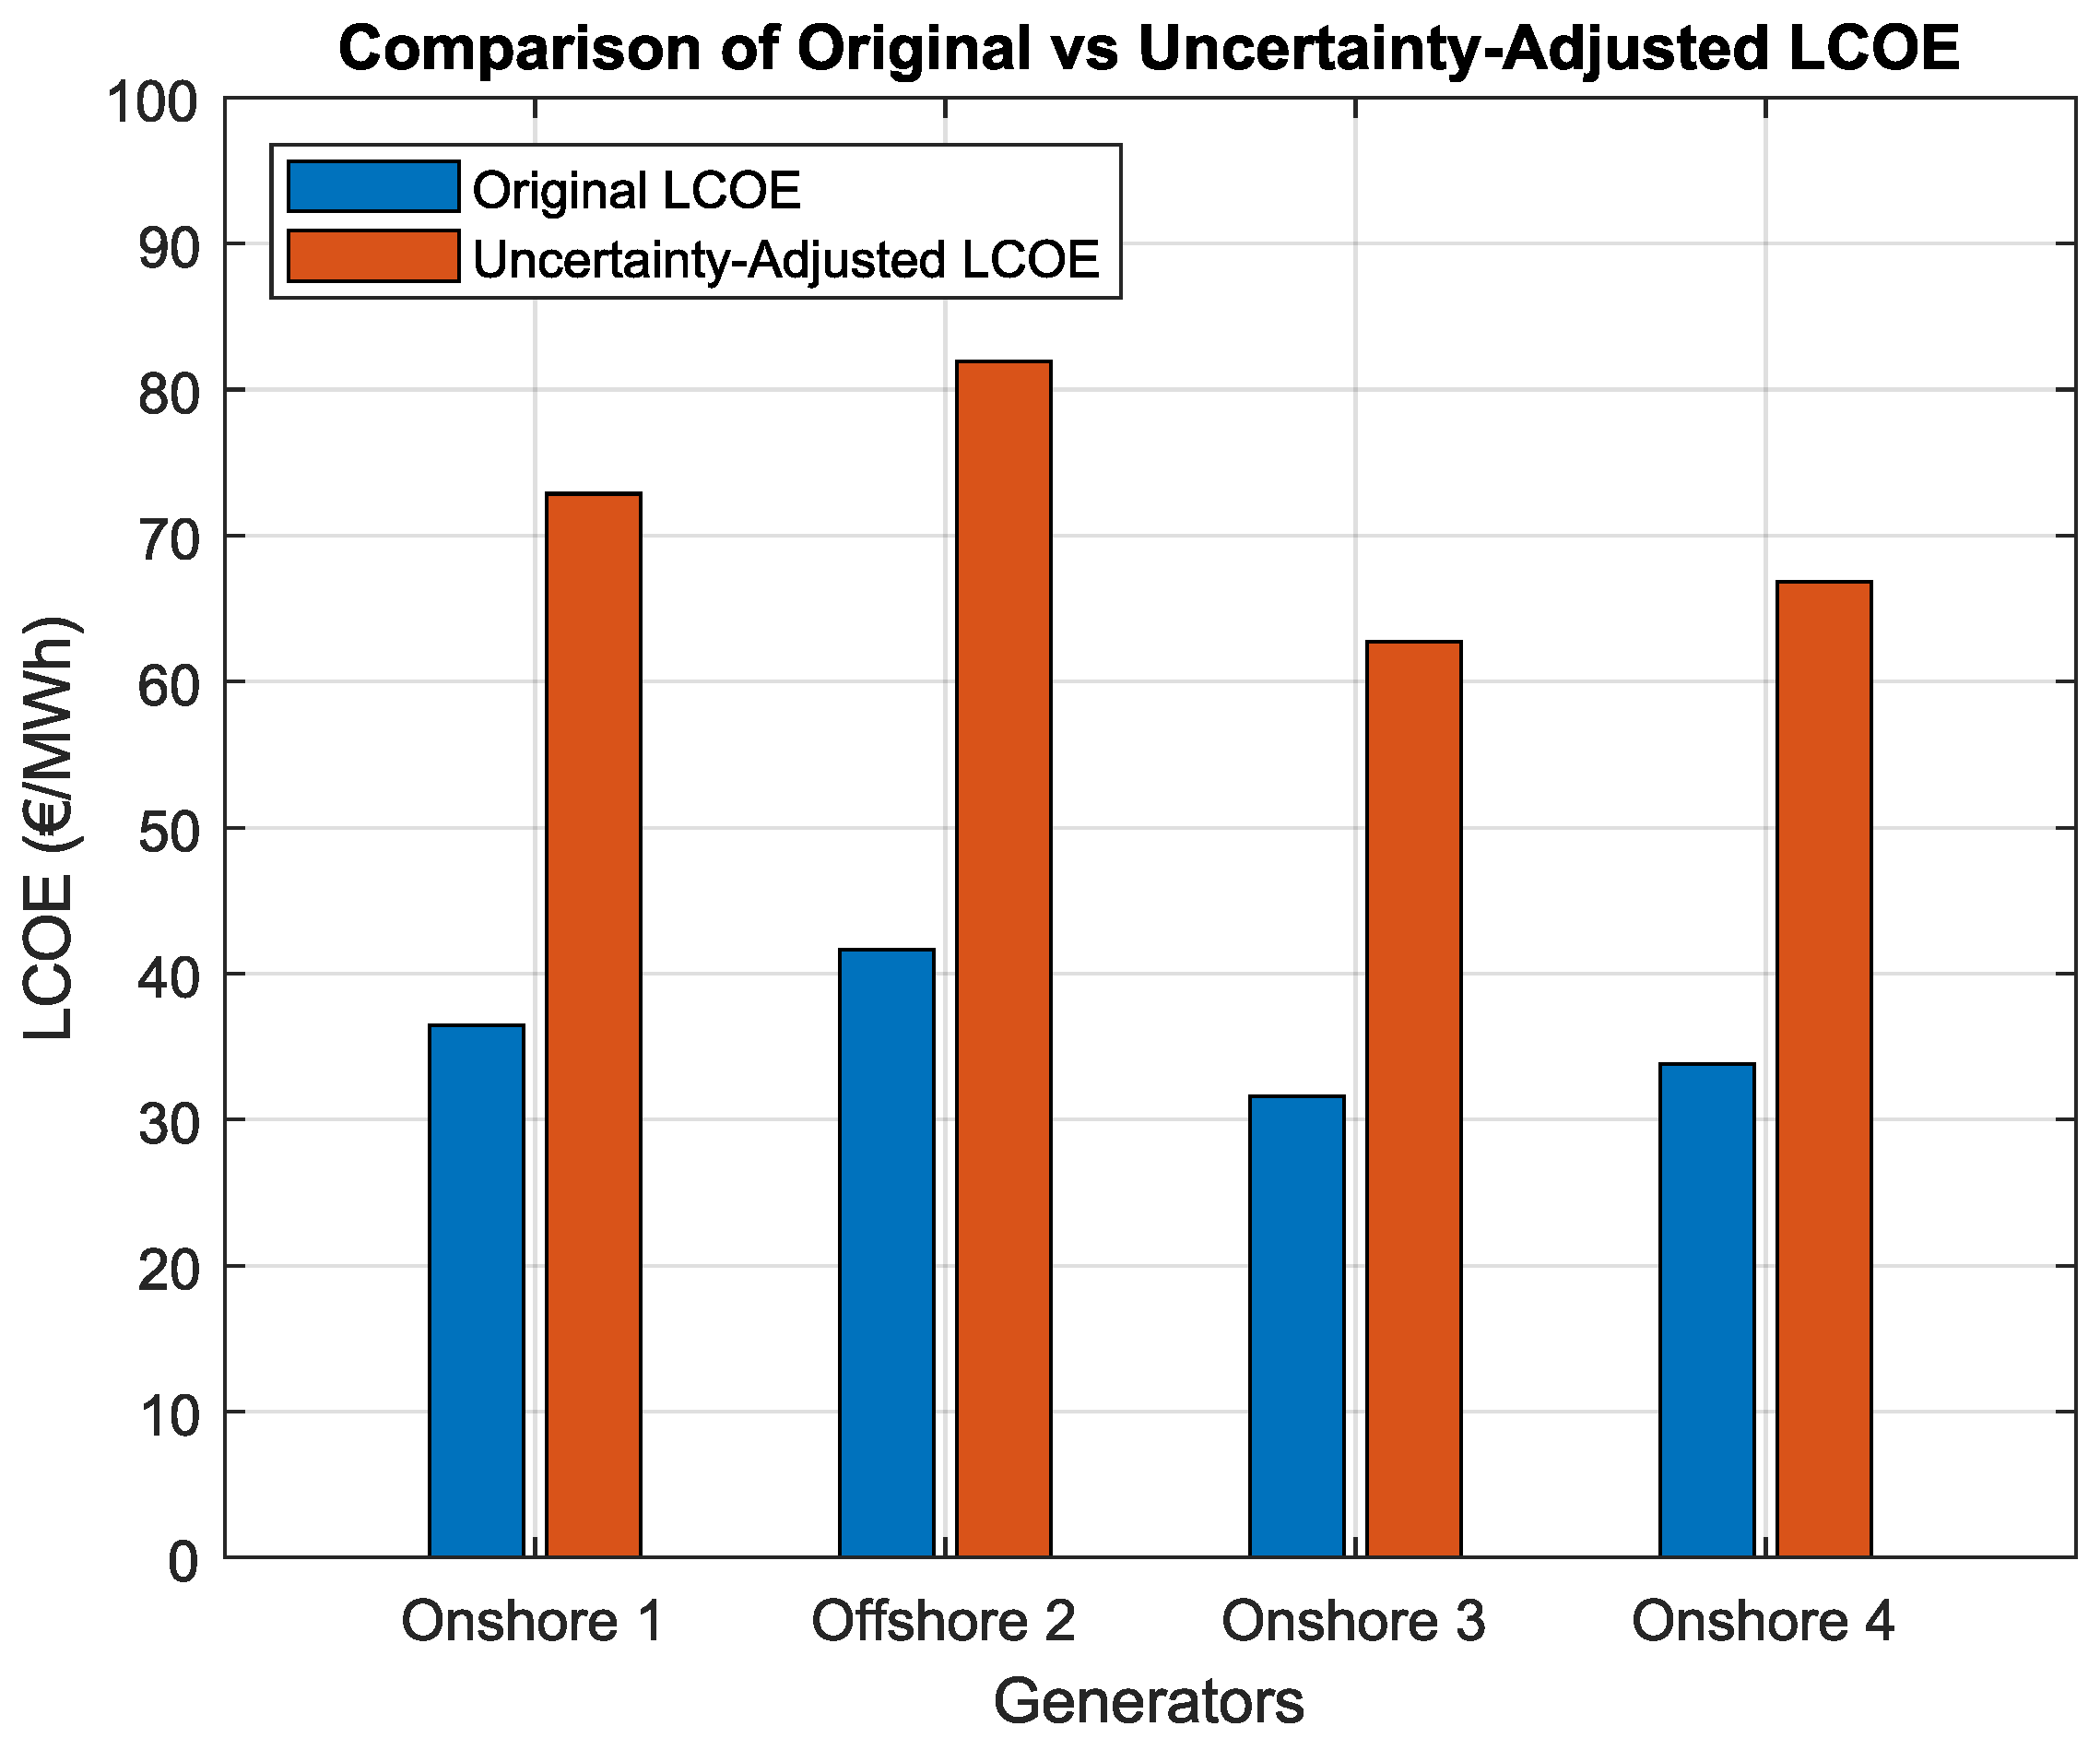
3.3. Economic Analysis (LCOE)
Figure 6 shows the original and entropy-adjusted Levelized Cost of Energy (LCOE) values for each generator. The adjusted metric incorporates the effect of generation uncertainty by penalizing generators with higher Shannon entropy, thereby aligning technical variability with economic risk.
Table 3 presents the corresponding LCOE values. The offshore generator (Generator 2) exhibits the highest original LCOE, primarily due to the elevated capital expenditure (CAPEX). However, despite its higher original LCOE, it experienced the smallest relative increase after entropy adjustment (+96.84%), reflecting superior robustness to variability and lower informational uncertainty. In contrast, Generator 1 (onshore) registered the highest adjusted LCOE and the largest relative increase (+100%), indicating greater operational irregularity and economic vulnerability under uncertain conditions.
All generators experienced relative increases in the adjusted LCOE within a narrow range (approximately 97–100%), consistent with the observed Shannon entropy values and reinforcing the connection between generation uncertainty and economic performance.
4. Discussion
4.1. Variability and Statistical Properties
The statistical analysis revealed distinct behavioral patterns between the onshore and offshore wind generators. The offshore unit demonstrated a higher mean output coupled with lower variability, suggesting a more stable and persistent wind resource. This behavior aligns with the well-documented characteristics of offshore wind environments, where wind flows are generally stronger and less turbulent due to the absence of surface roughness and orographic effects [
32].
In contrast, the onshore generators displayed greater skewness and higher kurtosis, reflecting distributions dominated by frequent low-output events punctuated by occasional peaks. These characteristics are indicative of increased intermittency and suggest a stronger dependency on short-term fluctuations. Such volatility introduces operational challenges for system operators, particularly in the context of grid balancing and dispatch planning.
4.2. Distribution Fitting and Reliability
The probabilistic modeling results, shown in
Figure 4 and
Table 1, confirm that WeibullZI and LognormalZI distributions best captured the empirical behavior of wind power generation. The Weibull distribution performed particularly well for the offshore generator, consistent with the prior literature on offshore wind speed modeling [
21,
22]. In contrast, the Lognormal distribution yielded better fits for onshore generators, describing the output’s statistical asymmetry and propensity for extreme values.
The inclusion of zero-inflated components significantly improved model performance, especially for onshore systems, which exhibited a higher incidence of zero-generation periods. These zero outputs often result from low wind speeds below turbine cut-in thresholds or from operational curtailments, and their correct representation is essential for accurate risk and reliability assessments [
20].
4.3. Entropy and Uncertainty
Entropy-based metrics provided valuable insight into the informational complexity of wind generation time series. As illustrated in
Figure 5 and
Table 2, the offshore generator (Generator 2) exhibited the lowest entropy values under the Shannon and permutation measures, indicating higher temporal regularity and predictability. Although the Rényi and Tsallis entropy values showed less pronounced differences across generators, Generator 2 remained among the units with the lowest overall uncertainty. In contrast, Generator 1 (onshore) consistently recorded the highest entropy levels across most metrics, corroborating its greater temporal variability and unpredictability.
The use of multiple entropy formulations—Shannon, Rényi, Tsallis, and permutation—enabled a more comprehensive characterization of uncertainty. Shannon entropy captured the overall disorder of the output distribution, while permutation entropy was sensitive to the temporal ordering of values, thus providing complementary perspectives. The consistency across these metrics reinforces their robustness and suitability for assessing the stochastic behavior of renewable energy generation [
16,
27].
4.4. Economic Reliability (LCOE and Entropy-Adjusted LCOE)
The entropy-adjusted LCOE framework introduced in this study established a direct link between production uncertainty and economic valuation. As shown in
Figure 6 and
Table 3, generators with higher entropy values experienced more substantial increases in their adjusted LCOE. This reinforces the idea that technical unpredictability entails implicit economic penalties due to increased forecasting errors, balancing costs, and potential penalties in energy markets.
Generator 1 (onshore), with the highest entropy, exhibited the largest relative increase in LCOE (+100%), while the offshore unit, despite its higher original LCOE due to greater CAPEX, maintained the lowest adjusted LCOE increase (+96.84%). These results suggest that the offshore generator benefits from a form of “economic resilience” to uncertainty, which may justify its higher initial investment in long-term planning scenarios.
In this context, economic resilience refers to the capacity of a renewable generation asset to maintain stable and predictable financial performance despite the inherent variability of its energy production. Specifically, it relates to the minimization of exposure to financial penalties, balancing costs, and revenue volatility in electricity markets. This interpretation aligns with risk-adjusted economic performance concepts discussed in the literature [
30,
31], where lower uncertainty directly enhances the investment attractiveness and operational robustness of energy projects.
Although the relative increases in entropy-adjusted LCOE were close between offshore and onshore generators (ranging from 96.84% to 100%), no formal statistical significance analysis was conducted due to the limited sample size (three onshore and one offshore unit). Nevertheless, the offshore generator systematically exhibited a lower increase in the adjusted LCOE compared to all onshore units. From an investment perspective, even marginal reductions in uncertainty-adjusted costs can have meaningful implications over the project’s lifetime, particularly in markets where penalties for variability or risk-adjusted financial models are applied. Therefore, while the observed differences should be interpreted carefully from a statistical point of view, they reinforce the superior economic reliability of offshore wind generation when uncertainty effects are considered.
This entropy-informed economic analysis provides an improvement over conventional LCOE metrics, which often overlook the impact of output volatility. By integrating uncertainty directly into the cost framework, the adjusted LCOE offers a more realistic and risk-aware valuation of generation assets, aligning with the evolving requirements of future electricity markets [
31].
4.5. Broader Implications and Literature Context
The results of this study are consistent with the existing literature recognizing the smoother and more reliable profile of offshore wind generation [
14,
32]. However, this work introduces novelty by explicitly quantifying uncertainty using a suite of entropy measures and linking those to economic performance through an adjusted LCOE metric. This multidimensional perspective—encompassing statistical, probabilistic, and financial aspects—enhances the overall perspective on the dependable performance of wind power systems.
From a practical perspective, these findings offer useful insights for energy system planners, investors, and policymakers. By incorporating uncertainty metrics into economic assessments, it becomes possible to design more robust investment strategies and to develop incentive structures that reward not only capacity but also predictability and temporal regularity—key attributes in future grid configurations with high shares of variable renewables.
Moreover, the entropy-adjusted LCOE may serve as a decision-support tool in project evaluation, allowing decision makers to better assess trade-offs between cost, risk, and performance. Future research could extend this framework to hybrid systems (e.g., wind plus storage), regional aggregations, or real-time forecasting integration. Additionally, the use of more advanced information-theoretic measures, such as multiscale entropy or transfer entropy, could further enhance the characterization of dynamic uncertainty in renewable systems.
Although the methodology was applied to a limited case study involving four individual generators, it is naturally scalable. The framework—comprising zero-inflated modeling, entropy-based uncertainty assessment, and LCOE adjustment—can be extended to larger wind farms, regional portfolios, or even hybrid systems combining wind and battery storage. In such cases, the entropy metrics could inform real-time dispatch strategies, while the adjusted LCOE could support investment prioritization under uncertainty. As energy systems transition to higher shares of variable renewables, tools that integrate technical and economic dimensions of uncertainty are increasingly valuable for planning and operational resilience.
While the case study analyzed in this work provides valuable insights into the differences between onshore and offshore wind generation, it is important to acknowledge certain limitations. The analysis is based on a relatively small sample size—three onshore and one offshore generator—and a specific geographical context within Portugal. As such, the direct generalization of the results to other regions or larger portfolios should be approached with caution. Nevertheless, the methodological framework developed—combining statistical modeling, entropy-based uncertainty quantification, and uncertainty-adjusted LCOE analysis—is scalable and can be readily applied to broader datasets. Future studies could extend this framework to larger wind farms, regional aggregations, or multi-country comparisons to further validate and refine the findings.
The findings discussed in this study form the basis for the concluding remarks presented in the next section.
5. Conclusions
This study introduced a comprehensive and integrative framework for evaluating the reliability and uncertainty of wind power generation, combining statistical, probabilistic, informational, and economic perspectives. Using high-resolution real-world data from four wind generators—three onshore and one offshore—the analysis encompassed statistical characterization, distribution modeling with zero-inflated variants, entropy-based uncertainty quantification, and an extended LCOE formulation that accounts for generation variability.
The main findings can be summarized as follows:
Offshore wind generation demonstrated lower variability, fewer zero-output intervals, and more consistent output profiles compared to onshore units, resulting in systematically lower entropy values across all metrics.
Zero-inflated Weibull and Lognormal distributions yielded the best probabilistic fits to the real-world data, with the former better suited for offshore systems and the latter for onshore systems, reflecting their respective statistical properties. Incorporating zero-generation events was crucial for accurate reliability modeling.
Entropy measures—particularly Shannon and permutation entropy—proved to be effective indicators of generation irregularity. The use of multiple entropy formulations provided a robust and multidimensional view of uncertainty.
Adjusting the LCOE using entropy-based metrics enabled the incorporation of uncertainty into economic analysis. Generators with higher entropy values exhibited significantly higher adjusted LCOE, highlighting the financial implications of operational unpredictability.
These results confirm the superior operational regularity and economic resilience of offshore wind generation under uncertain conditions. More broadly, the findings underscore the importance of integrating uncertainty metrics—particularly those grounded in information theory—into the planning, valuation, and risk assessment of renewable energy assets.
The methodological framework presented here offers a scalable and adaptable tool for future research and practical applications. Further extensions may include hybrid systems (e.g., wind + storage), strategies for aggregating output from multiple wind generation farms, the integration of real-time forecasting, or the exploration of market mechanisms that explicitly penalize or reward predictability. As electricity systems continue to evolve towards high-renewable scenarios, entropy-informed tools can play a key role in enhancing reliability, economic efficiency, and strategic decision making.
Ultimately, this approach contributes to a more resilient and intelligence-driven energy transition, where uncertainty is not only acknowledged but systematically quantified and managed.
Author Contributions
F.M.C.: Writing—original draft, review, and editing; Validation; Conceptualization; Methodology; Software (MATLAB R2024a); Formal analysis; Investigation; Data curation; Supervision; and Project administration. P.J.S.: Writing—original draft, review, and editing; Validation; Formal analysis; Supervision; Project administration; and Funding acquisition. A.J.P.: Writing—original draft, review, and editing; Validation; Conceptualization; Methodology; Software; Formal analysis; Investigation; Data curation, Supervision; Project administration; and Funding acquisition. All authors have read and agreed to the published version of the manuscript.
Funding
This research was funded by Instituto Politécnico de Setúbal and the Portuguese Foundation for Science and Technology under project grant CTS/00066.
Data Availability Statement
The data used in this study are not publicly available due to institutional or proprietary restrictions. However, summary results and the methodological code can be made available from the corresponding author upon reasonable request.
Conflicts of Interest
The authors declare no conflict of interest.
Abbreviations
The following abbreviations are used in this manuscript:
| AIC | Akaike Information Criterion |
| BIC | Bayesian Information Criterion |
| CAPEX | Capital Expenditure (initial investment cost) |
| DGEG | Direção-Geral de Energia e Geologia |
| ENTSO-E | European Network of Transmission System Operators for Electricity |
| GWEC | Global Wind Energy Council |
| IEA | International Energy Agency |
| IRENA | International Renewable Energy Agency |
| K–S | Kolmogorov–Smirnov |
| LCOE | Levelized Cost of Energy |
| MDPI | Multidisciplinary Digital Publishing Institute |
| MLE | Maximum Likelihood Estimation |
| NLL | Negative Log-Likelihood |
| O&M | Operation and Maintenance |
| PDF | Probability Density Function |
| PNEC | Plano Nacional Energia e Clima |
| RNC | Roteiro para a Neutralidade Carbónica |
| SCADA | Supervisory Control and Data Acquisition |
| ZI | Zero-Inflated |
References
- International Energy Agency (IEA). World Energy Outlook 2023. Available online: https://www.iea.org/reports/world-energy-outlook-2023 (accessed on 9 January 2025).
- Global Wind Energy Council (GWEC). Global Wind Report 2023. Available online: https://www.enertechnos.com/news/press-releases/gwec-global-wind-report-2023/ (accessed on 21 January 2025).
- Direção-Geral de Energia e Geologia (DGEG). Estatísticas Rápidas da Eletricidade. Available online: https://www.dgeg.gov.pt (accessed on 22 January 2025).
- Ministério do Ambiente e da Ação Climática. Plano Nacional Energia e Clima 2021–2030 (PNEC 2030). Available online: https://energy.ec.europa.eu/document/download/f3782304-9534-41db-bf76-6fcb23f6a597_pt?filename=portugal_draftnecp_0.pdf (accessed on 28 January 2025).
- Direção-Geral de Energia e Geologia (DGEG). Roteiro Para a Neutralidade Carbónica 2050. Available online: https://www.dgeg.gov.pt/pt/areas-transversais/relacoes-institucionais-e-de-mercado/politica-energetica/roteiro-para-a-neutralidade-carbonica-2050-rnc-2050/ (accessed on 28 January 2025).
- Holttinen, H.; Meibom, P.; Orths, A.; van Hulle, F.; Lange, B.; O’Malley, M.; Pierik, J.; Ummels, B. Design and Operation of Power Systems with Large Amounts of Wind Power: Final Report, IEA WIND Task 25, Phase Two 2006–2009. Available online: https://findit.dtu.dk/en/catalog/6231f81bdb3709b6f3daaf24 (accessed on 29 January 2025).
- Morales, J.M.; Conejo, A.J.; Madsen, H.; Pinson, P.; Zugno, M. Integrating Renewables in Electricity Markets: Operational Problems; Springer: New York, NY, USA, 2013. [Google Scholar] [CrossRef]
- Zugno, M.; Morales, J.M.; Conejo, A.J. A bilevel model for electricity retailers’ participation in a demand response market environment. Energy Econ. 2013, 36, 182–197. [Google Scholar] [CrossRef]
- European Network of Transmission System Operators for Electricity (ENTSO-E). Day-Ahead Market Integration. Available online: https://www.entsoe.eu/network_codes/cacm/ (accessed on 1 February 2025).
- Yazdani, M.; Torkayesh, A.E.; Santibanez-Gonzalez, E.D.R.; Otaghsara, S.K. Evaluation of renewable energy resources using integrated Shannon Entropy-EDAS model. Sustain. Oper. Comput. 2020, 1, 35–42. [Google Scholar] [CrossRef]
- Milligan, M.; Kirby, B.; Wan, Y. Examining Information Entropy Approaches as Wind Power Forecasting Performance Metrics. Technical Report, National Renewable Energy Laboratory (NREL). 2012. Available online: https://www.nrel.gov/docs/fy12osti/53515.pdf (accessed on 1 March 2025).
- Ilunga, M. Tsallis Entropy for Assessing Spatial Uncertainty Associated with Mean Annual Runoff of Quaternary Catchments of the Middle Vaal Basin in South Africa. Entropy 2020, 22, 1050. [Google Scholar] [CrossRef] [PubMed]
- Kilpua, E.K.J.; Good, S.; Ala-Lahti, M.; Osmane, A.; Koikkalainen, V. Permutation Entropy and Complexity Analysis of Large-Scale Solar Wind Structures and Streams. Ann. Geophys. 2024, 42, 163–177. [Google Scholar] [CrossRef]
- Pinson, P.; Chevallier, C.; Kariniotakis, G.N. Trading wind generation from short-term probabilistic forecasts of wind power. IEEE Trans. Power Syst. 2007, 22, 1148–1156. [Google Scholar] [CrossRef]
- Bessa, R.J.; Miranda, V.; Botterud, A.; Zhou, Z.; Wang, J. Time-adaptive quantile-copula for wind power probabilistic forecasting. Renew. Energy 2012, 40, 29–39. [Google Scholar] [CrossRef]
- Qu, Z.; Hou, X.; Hu, W.; Yang, R.; Ju, C. Wind power forecasting based on improved variational mode decomposition and permutation entropy. Clean Energy 2023, 7, 1032–1045. [Google Scholar] [CrossRef]
- Wiser, R.; Bolinger, M. 2011 Wind Technologies Market Report; U.S. Department of Energy: Washington, DC, USA, 2011. Available online: https://www.osti.gov/biblio/1223006 (accessed on 3 March 2025).
- Schallenberg-Rodríguez, J. A methodological review to estimate techno-economic potential of renewable energy production. Renew. Sustain. Energy Rev. 2013, 21, 272–287. [Google Scholar] [CrossRef]
- Zhang, Y.; Wang, J.; Wang, X. Review on probabilistic forecasting of wind power generation. Renew. Sustain. Energy Rev. 2014, 32, 255–270. [Google Scholar] [CrossRef]
- Shi, H.; Dong, Z.; Xiao, N.; Huang, Q. Wind speed distributions used in wind energy assessment: A review. Front. Energy Res. 2021, 9, 769920. [Google Scholar] [CrossRef]
- Celik, A.N. A statistical analysis of wind power density based on the Weibull and Rayleigh models at the southern region of Turkey. Renew. Energy 2003, 29, 593–604. [Google Scholar] [CrossRef]
- Carta, J.A.; Ramirez, P.; Velazquez, S. A review of wind speed probability distributions used in wind energy analysis: Case studies in the Canary Islands. Renew. Sustain. Energy Rev. 2009, 13, 933–955. [Google Scholar] [CrossRef]
- Burnham, K.P.; Anderson, D.R. Model Selection and Multimodel Inference: A Practical Information-Theoretic Approach; Springer: New York, NY, USA, 2002. [Google Scholar] [CrossRef]
- Shannon, C.E. A Mathematical Theory of Communication. Bell Syst. Tech. J. 1948, 27, 379–423. [Google Scholar] [CrossRef]
- Rényi, A. On measures of entropy and information. Berkeley Symp. Math. Stat. Probab. 1961, 1, 547–561. Available online: https://projecteuclid.org/ebooks/berkeley-symposium-on-mathematical-statistics-and-probability/On-Measures-of-Entropy-and-Information/chapter/On-Measures-of-Entropy-and-Information/bsmsp/1200512181?tab=ChapterArticleLink (accessed on 9 March 2025).
- Tsallis, C. Possible generalization of Boltzmann–Gibbs statistics. J. Stat. Phys. 1988, 52, 479–487. [Google Scholar] [CrossRef]
- Bandt, C.; Pompe, B. Permutation entropy: A natural complexity measure for time series. Phys. Rev. Lett. 2002, 88, 174102. [Google Scholar] [CrossRef] [PubMed]
- International Renewable Energy Agency (IRENA). Renewable Power Generation Costs in 2019; IRENA: Abu Dhabi, United Arab Emirates, 2020; Available online: https://www.irena.org/publications/2020/Jun/Renewable-Power-Costs-in-2019 (accessed on 11 March 2025).
- International Energy Agency (IEA). Offshore Wind Outlook 2019; IEA: Paris, France, 2019; Available online: https://www.iea.org/reports/offshore-wind-outlook-2019 (accessed on 12 March 2025).
- Kwon, J.; Levin, T.; Zhou, Z.; Botterud, A.; Mehrtash, M.; Hobbs, B. The impact of market design and clean energy incentives on strategic generation investments and resource adequacy in low-carbon electricity markets. Appl. Energy 2023, 343, 121196. [Google Scholar] [CrossRef]
- Gutierrez-Garcia, F.; Amorim, F.; Dominguez-Navarro, J.A.; Linares, P.; Iribarren, D. Robustness of electricity systems with nearly 100% share of renewables: A worst-case study. Renew. Sustain. Energy Rev. 2021, 150, 111977. [Google Scholar] [CrossRef]
- Barthelmie, R.J.; Pryor, S.C.; Frandsen, S.T.; Hansen, K.S.; Schepers, J.G.; Rados, K.; Schlez, W.; Neubert, A.; Jensen, L.E.; Neckelmann, S. Comparison of Wake Model Simulations with Offshore Wind Turbine Wake Profiles Measured by Sodar. Wind Energy 2007, 10, 573–586. [Google Scholar] [CrossRef]
| Disclaimer/Publisher’s Note: The statements, opinions and data contained in all publications are solely those of the individual author(s) and contributor(s) and not of MDPI and/or the editor(s). MDPI and/or the editor(s) disclaim responsibility for any injury to people or property resulting from any ideas, methods, instructions or products referred to in the content. |
© 2025 by the authors. Licensee MDPI, Basel, Switzerland. This article is an open access article distributed under the terms and conditions of the Creative Commons Attribution (CC BY) license (https://creativecommons.org/licenses/by/4.0/).


