1. Introduction
In recent years, the concept of sustainable development proposed by the United Nations is rapidly spreading in the electricity market. The spirit of ESG is to use the three major indicators of environmental protection, social responsibility, and corporate governance to evaluate whether corporate organizations are pursuing the greatest commercial interests [
1]. In the future, users will be legally responsible for energy conservation and carbon reduction, and the electricity consumed by air-conditioning systems is one of the main sources of carbon emissions for enterprises and institutions [
2]. However, the power consumed by air-conditioning systems may account for up to 40% of the total electricity consumption, indicating that they often exacerbate peak load pressure on the grids. As electricity consumption peaks continue to rise, energy costs remain high, and the global consensus on carbon reduction has formed an unstoppable wave, users must focus more and more attention on power demand side management (DSM) [
3,
4]. Because the cooling load is a significant portion of peak energy consumption, an ice-storage air-conditioning system was used as part of the proposed peak reduction technology. An ice-storage air-conditioning system is charged by operating chillers at off-peak periods, and discharged by melting ice during the peak period in order to meet the cooling load. This can permanently shift the energy use of the system from peak periods to off-peak periods, thereby reducing peak electricity demand. Ice-storage air-conditioning systems will play an important role in managing the electrical energy of air-conditioners in the future.
Demand response (DR) is one of the strategies in DSM to reduce an electricity bill. The management method of DR is divided into two strategies: price-oriented and reward-induced [
5]. In the price-oriented strategy, utility implements the Time-of-Use (TOU) price [
6] to reasonably reflect the supply cost between peak load and off-peak load in each seasons. In the reward-induced strategy, utility provides the incentives to the user during periods of tight power. Users cooperate to reduce the agreed load for achieving electricity bill deductions. Without affecting normal operation, users can receive feedback and compensations. Users make the proper use of the DR compensation mechanism to reduce their electricity bill through electricity usage behavior during periods of a high electricity price. In practice, operators gradually pay attention to the DR mechanism for reducing the annual electricity budget. Therefore, DR has become one of the key items in the EMS strategies for users to reduce their bills [
7,
8].
Taiwan is located on a subtropical island where summers are hot and dry. The load demand has been continuously growing at an average rate of 3.2% per year, while air-conditioning systems account for up to 40% of the total load during peak periods [
9]. The system peak load has also increased at an annual rate of 10% due to the rapid growth in the number of air-conditioning systems. The gap between summer peak and off-peak loads continues to expand significantly year by year. To shift the system peak load, ice-storage air-conditioning systems have been introduced as a demand-side management strategy to reduce energy consumption [
10]. These systems not only reduce peak loads during peak periods but also take advantage of lower electricity prices by operating the refrigerating compressor during off-peak hours. In addition, DR strategies can be employed to further reduce peak loads without affecting user comfort. Human thermal comfort can be quantified using the Predicted Mean Vote (PMV) and Predicted Percentage of Dissatisfied (PPD) indices. PMV and PPD evaluate the combined effects of temperature (°C), humidity (%), and environmental wind velocity (m/s) on the human body [
11]. PMV is also related to two personal factors, namely clothing insulation and metabolic rate. These indices indicate that users feel comfortable at certain combinations of temperature and relative humidity. In this study, various temperature and humidity combinations were used to operate air-conditioning systems in cooling spaces. This study demonstrates the effectiveness of an operation strategy based on DR and PMV, creating a more efficient, comfortable, and energy-saving indoor environment.
The DR offered by ice-storage air-conditioning systems is a huge challenge due to the efficiency of the ice-storage and ice melting [
12]. In recent years, a substantial amount of the literature mainly focuses on the effects of various operation strategies. Refs. [
13,
14] proposed an improved transitive control of air-conditioning DR for determining room set-point temperature. Refs. [
15,
16] take a heating ventilation air conditioner (HVAC) as control load equipment to improve personalized thermal comfort by implementing DR optimization strategies. Ref. [
17] proposed an intelligent control strategy for multizone office buildings fed to optimize HVAC operation considering the varying thermal preferences of occupants in various zones as a response of real-time pricing signals. Ref. [
18] proposed a control strategy of DR in an office building by using an Elman neural network prediction model. Combining the electric energy management of air conditioners and DR policies can reduce users’ electricity bills and increase extra revenue [
19,
20,
21]. Ref. [
22] combined external envelope conditions and direct load control strategies to establish an annual AC energy consumption in rural building complexes. Some energy management control strategies are used to construct the demand response of integrated air conditioners for reducing load growth, so as to achieve the energy-saving dispatching of air conditioners [
23,
24]. Ref. [
25] developed a novel air-conditioning system with DR for daily load shifting and real-time power balance in the developing smart grid. It is achieved by considering the temperature and humidity independent controls whish have no impact on the building occupants’ thermal comfort and reduce the demand requirement. Ref. [
26] is focused on the participation of commercial buildings in the DR program through curtailment in the electricity demand of air-conditioning systems for financial incentive and power grid benefits. Generally, for the air-conditioning systems operated during peak and high-rate periods, the ice-storage system is necessary. The air-conditioning systems only reduce the peak load for DR, but also lower the energy electricity price by shifting the preferential rates of the peak load profile to off-peak periods. Therefore, DR strategies in an ice-storage air-conditioning system are very important for saving energy [
27,
28,
29,
30].
In recent years, with the rapid development of urbanization and the increasing impact of climate change, the operation and management of air-conditioning systems have become a key focus of research. DR is an energy management strategy that promotes more efficient energy use and reduces pressure on the electricity supply system. This paper investigates the optimal operation of ice-storage air-conditioning systems by considering both thermal comfort and DR strategies, aiming to achieve a win–win outcome in terms of energy savings and user satisfaction. DR is typically implemented to mitigate electricity price fluctuations and enhance the stability of the energy system. In this study, an office building is used as the research case, and its power consumption data are analyzed under both ice-melting and ice-storage modes. The Predicted Mean Vote (PMV) is derived using indoor environmental parameters and human physiological parameters to quantify human thermal comfort [
31]. By incorporating the DR strategy, cooling load requirements, and various operational constraints, a dispatch model for the ice-storage air-conditioning system is formulated to minimize the total electricity cost. A dynamic programming approach is employed to solve the dispatch model and to analyze the optimal operational cost of the ice-storage air-conditioning system under both two-section and three-section Time-of-Use (TOU) pricing schemes. It is expected that the implementation of this research will enhance the operational and management capabilities of participating enterprises, enabling them to reduce peak demand, lower electricity bills, and improve their competitiveness in the energy market.
2. Problem Formulation
2.1. Demand Response
DR is an important strategy for utilities to reduce peak loads and avoid the risk of power rationing. During periods of power supply shortages or high electricity prices, utilities provide incentives for users to reduce their agreed load consumption. Users are expected to respond based on their load characteristics in order to receive bill discounts. In this study, the DR load management strategies are presented in
Table 1, including an 8-day monthly reduction model, a 6-h daily reduction model, and a 2-h daily reduction model [
5]. The target participants were users with a load demand exceeding 100 kW. The implementation period was from 1 June to 30 September each year.
Regardless of the type of planned strategies, the bill reduction was decided by the execution rate (
). The execution rate is defined as Equation (1).
: Implementation rate;
: Actual reduced capacity;
: Agreed reduced capacity.
In the DR load management strategy, each execution rate has a corresponding bill deduction rate (
). There is a corresponding deduction rate for electricity bills depending on the range of the implement rate as shown in
Table 2,
Table 3 and
Table 4 [
5]. The deduction of the total bill in the DR strategy is calculated as in Equation (2).
: Deduction of total bill;
: Basic electricity price;
: Deduction rate.
Table 2.
The correspondence table for and in the 8-day monthly reduction model.
Table 2.
The correspondence table for and in the 8-day monthly reduction model.
| Implementation Rate () | < 60% | 60% ≤ < 80% | 80% ≤ < 100% | ≥ 100% |
|---|
| Deduction rate () | 0% | 10% | 20% | 30% |
Table 3.
The correspondence table for and in the 6-h daily reduction model.
Table 3.
The correspondence table for and in the 6-h daily reduction model.
| Implementation Rate () | < 60% | 60% ≤ < 80% | 80% ≤ < 100% | ≥ 100% |
|---|
| Deduction rate () | 0% | 60% | 80% | 100% |
Table 4.
The correspondence table for and in the 2-h daily reduction model.
Table 4.
The correspondence table for and in the 2-h daily reduction model.
| Implementation Rate () | < 60% | 60% ≤ < 80% | 80% ≤ < 100% | ≥ 100% |
|---|
| Deduction rate () | 0% | 30% | 40% | 50% |
2.2. Thermal Comfort
The indoor temperature is typically set between 20 °C and 25 °C, and the relative humidity is maintained between 40% and 60%, which is considered the comfortable range. The indoor air velocity should be between 0.1 m/s and 0.5 m/s, as it helps regulate indoor temperature and humidity. The Predicted Mean Vote (PMV) is used to define indoor comfort levels for occupants. PMV represents the predicted average thermal sensation vote and is one of the most commonly used comfort indices for the human body. The calculation of PMV is given by Equation (3) [
11].
M: Human metabolic rate (W/m2);
W: External energy affecting the human body (W/m2);
fcl: Clothing surface area factor;
ta: Room temperature (°C);
: Average radiation temperature (°C);
Pa: Partial pressure of water vapor (Pa);
hc: Convection heat transfer coefficient (W/m2·K);
tcl: Clothing surface temperature (°C).
The parameters that affect human indoor thermal comfort can be divided into two categories: environmental parameters and human-related parameters. Environmental parameters include air temperature (
), relative humidity (
,
), and mean radiant temperature (
). Human-related parameters include clothing insulation (
) and metabolic rate (M) as well as external work (W). The PMV represents people’s thermal sensation of the overall environment. A higher positive PMV value indicates a warmer sensation, while a higher negative value indicates a colder sensation. Generally, when the PMV value is close to zero, it corresponds with a higher level of thermal comfort. The International Organization for Standardization (ISO 7730) stipulates that the acceptable range for indoor thermal comfort, in terms of PMV, is between −0.5 and +0.5 [
31].
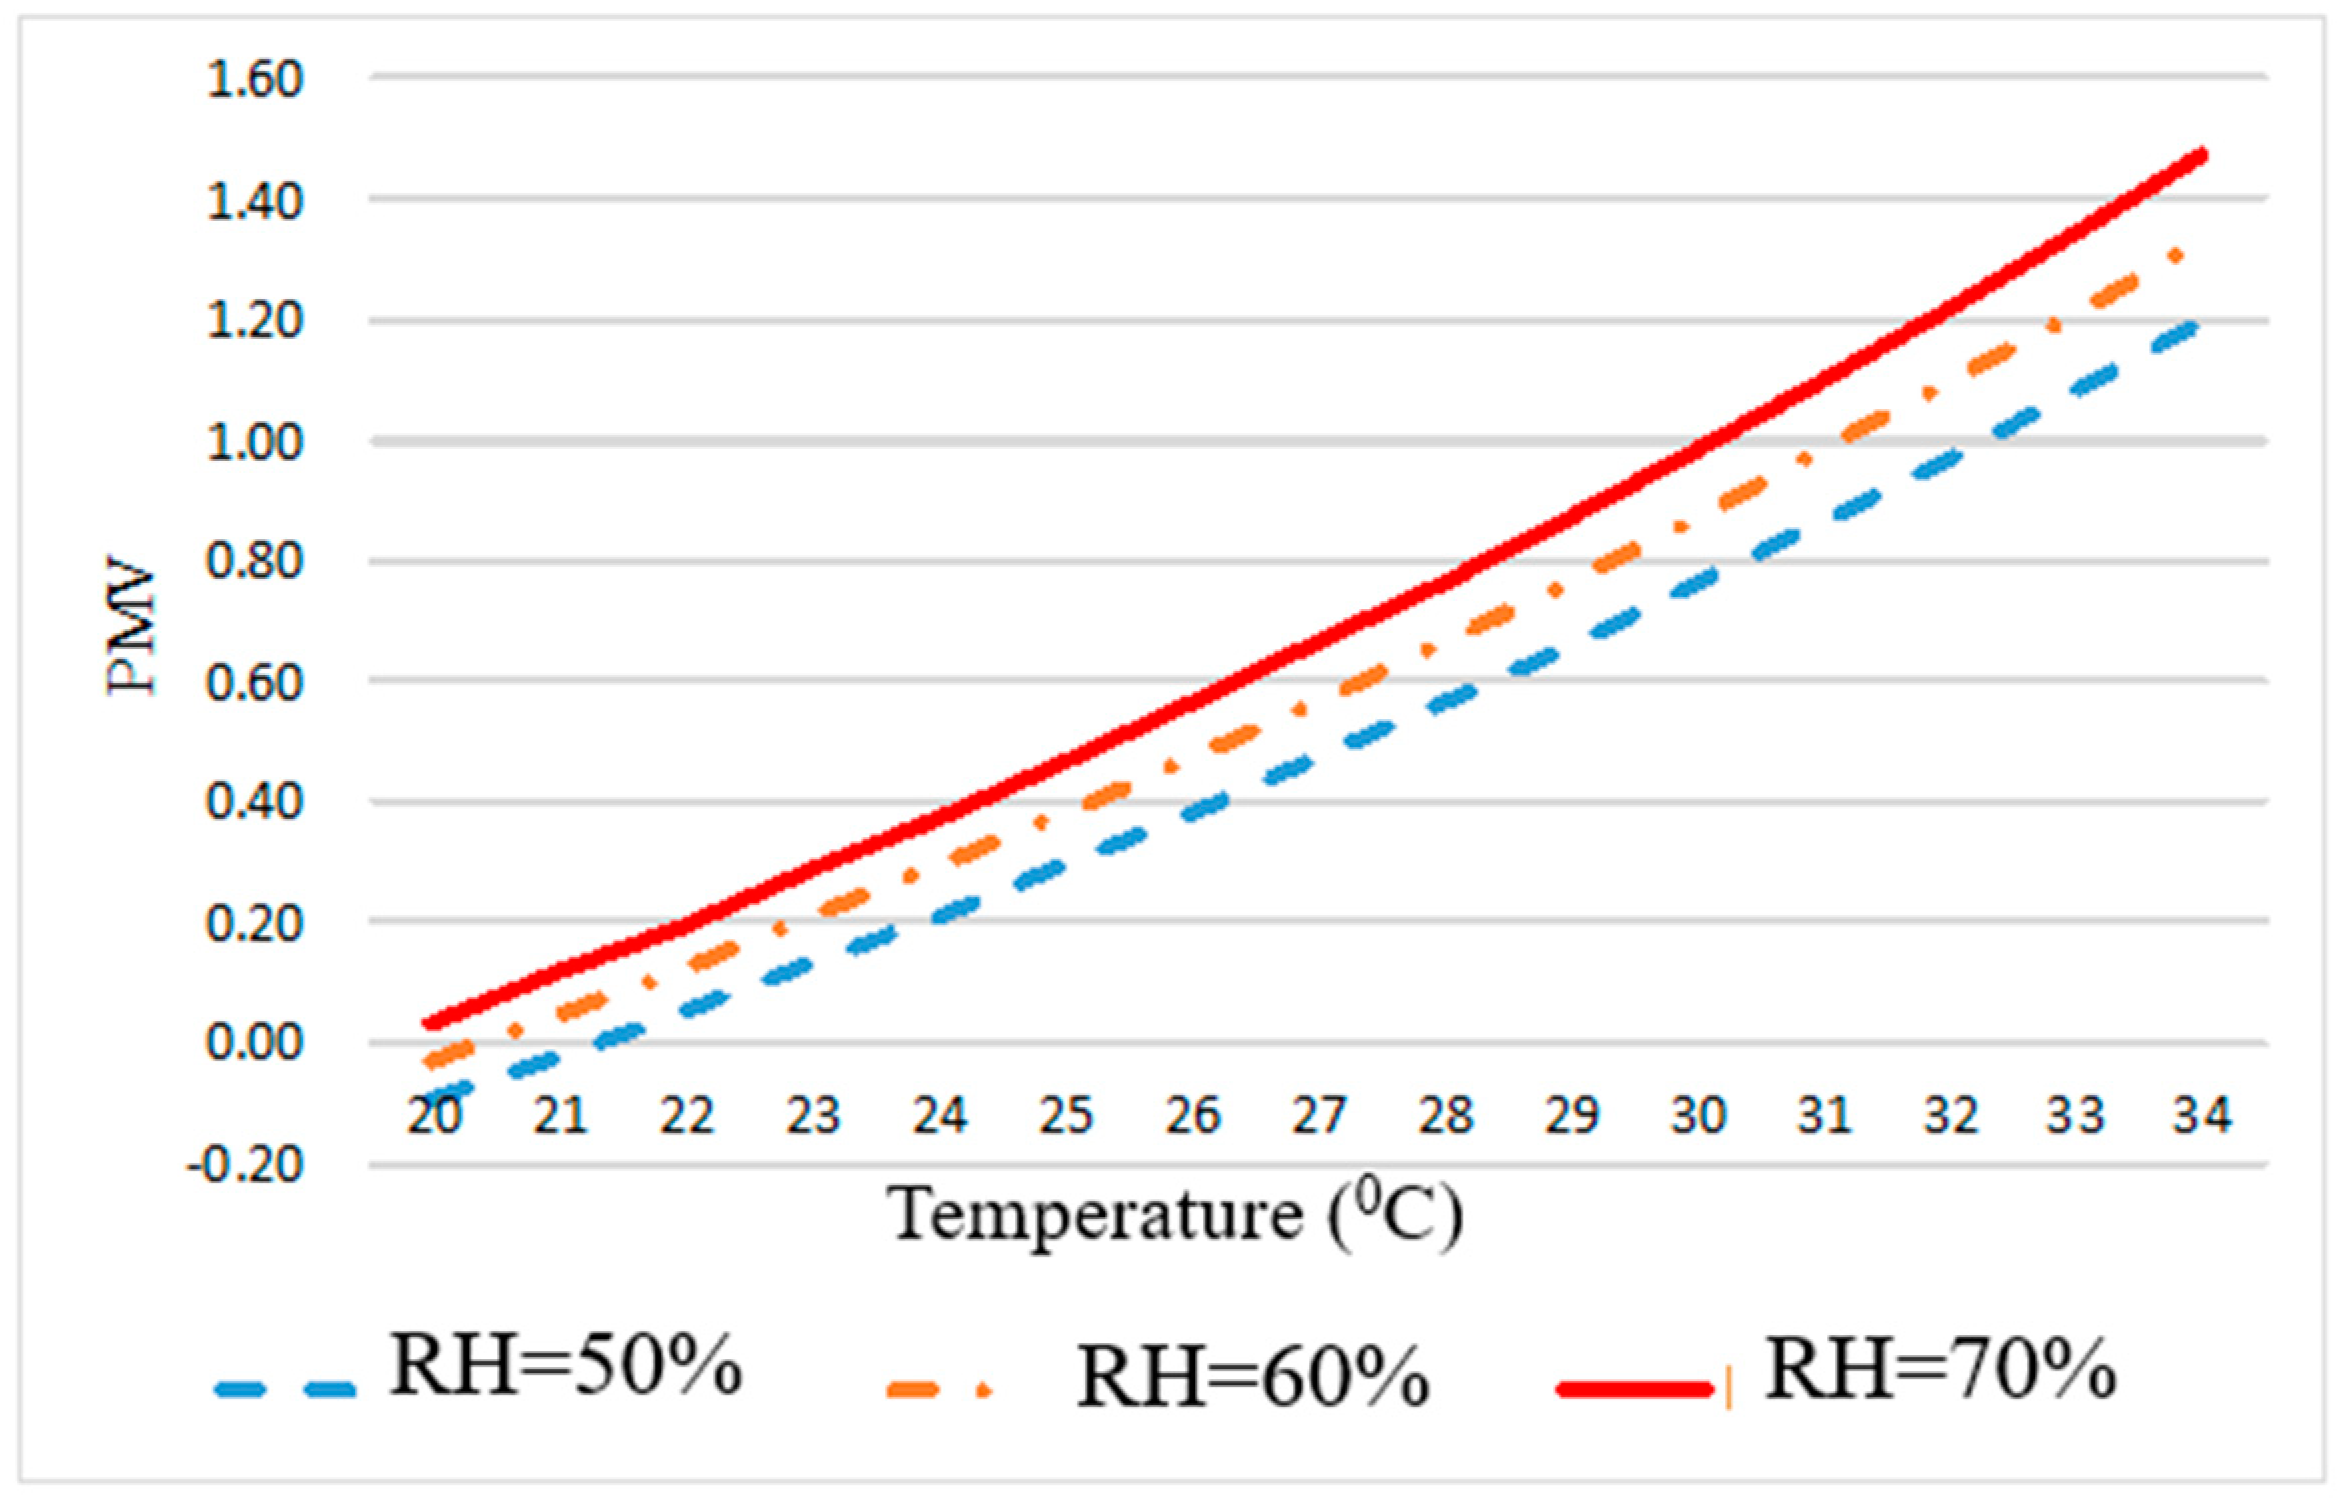
To achieve both thermal comfort and energy savings, temperature, relative humidity, clothing insulation, and air velocity must be adjusted simultaneously. In this study, the test site is an office building. The indoor temperature was set between 20 °C and 30 °C, while the other parameters were treated as constants based on the average values recommended by ISO 7730 [
31]. The parameter settings are listed in
Table 5. By using
Table 5, the relationship between the PMV value and temperature–humidity combinations is calculated as shown in
Figure 1.
The PMV value is used to represent the human body’s perception of thermal environments, ranging from cold to hot. As shown in
Figure 1, when the relative humidity is 50%, temperatures between 20 °C and 27 °C fall within the comfort zone. However, when the relative humidity increases to 70%, a temperature of 25 °C exceeds the comfort zone. This indicates that under high humidity conditions, even if the air temperature is not particularly high, thermal comfort can still fall outside the acceptable range.
2.3. The Power Consumption of the Ice-Storage Air-Conditioning System
Through the records of meters for the ice-storage air-conditioning systems, the power consumption of the ice storage during off-peak hours can be obtained as shown in Equation (4).
The cost of ice-storage per unit is shown in Equation (5).
E: Power consumption of ice storage (KWh/%);
C: The cost of ice-storage per unit (TWD/%);
T: Total ice storage time during off-peak hours;
KWhi: The power consumption of Ice storage in period i;
Vi: The percentage of ice storage in period i (%);
Bi: Electricity price in time period i (TWD/KWh).
The operation of the ice-storage air-conditioning system includes two modes, the “ice-melting mode” and the “air-conditioning mode”, both of which provide cooling to the same space. These two modes cannot operate simultaneously. Based on the ice-melting mode, this paper estimates the corresponding cooling load using the amount of melted ice, as shown in Equation (6).
: The total cooling load of office building (RT);
Pi: The percentage of ice melt at the i-th hour (%);
VT: Maximum ice volume of ice-storage tank (m3).
D: Density of ice (Kg/m3);
K: Latent heat of melting ice;
H: Ice-melting time interval (hour).
The hourly cooling load was estimated by using the ice-melting model, and then the Energy Efficiency Ratio (EER) of chillers was used to estimate the power consumption of chillers as shown in Equation (7).
Qe: The freezing capacity of the chiller (Kw);
Pkw: The power consumption of the chiller (Kw).
By controlling the chiller, its cooling capacity can be regulated to match the cooling load
, i.e.,
Qe =
. The hourly power consumption of the chiller can be calculated using Equation (8).
Through the ice-storage air-conditioning monitoring system, the amount of ice stored and the corresponding power consumption during the daily off-peak period can be obtained. Based on this information, the electricity cost per unit of ice storage can be calculated using Equation (9).
C: Electricity cost per unit of ice-storage ($/%);
T: Total ice-storage time during off-peak period;
Vi: Percentage of ice-storage in period i (%);
Bi: TOU price in period i.
2.4. Objective and Constraints
The main purpose of this paper is to derive the optimal operation of the ice-storage air-conditioning system under the operational constraints. By considering DR strategies, the total bill can be formulated as in Equation (10).
: The total bill during one working day;
: The total time period of cooling load provided;
: The least bill from the best point in period ;
: The bill from state point to point in period i;
: The least bill from the best period in period ;
: The power consumption of chiller in period ();
: The power consumption of chiller in period + 1 ();
: The electricity price in period (TWD/kWh);
: The electricity price in period ;
: DR of state point in period (1: execute, 0: non-execute);
: DR of state point in period (1: execute, 0: non-execute);
: Ice melting amount during ice melting period (%);
: Ice melting amount during ice melting period (%);
: Deduction of the electricity bill;
: The time of DR (Hour);
: the cost of ice-storage per unit (TWD/%).
consists of three parts. The first part is . If is equal to 0, it means that the air-conditioning load is provided by the chillers. The operation cost during this period is determined by the power consumption of the chillers and the electricity price during this period. Similarly, the power consumption is determined by the electricity price in the period . The second part is . If is equal to 1, it means that the cooling load is supplied by ice-melting model. The operation cost during this period is determined by the ice-melting amount and the cost of ice-storage per unit (C). is the ice-melting amount in period i, which can be obtained from the record of the liquid level transmitter on the ice-storage tank. The third part is . If is equal to 1, it means that the electricity bill deduction for DR can be obtained. The electricity bill deduction value for this period i is determined by the DR deduction per hour on that day.
3. Solution Algorithm
In this study, a DP-based control strategy is proposed for optimizing the dispatch of an ice-storage air-conditioning system. DP is particularly attractive because it transforms multi-stage processes into a series of single-stage problems, providing global optimal solutions in discrete state spaces. In the DP approach, decisions at each stage are dependent on the current state and time, influencing subsequent states [
32,
33,
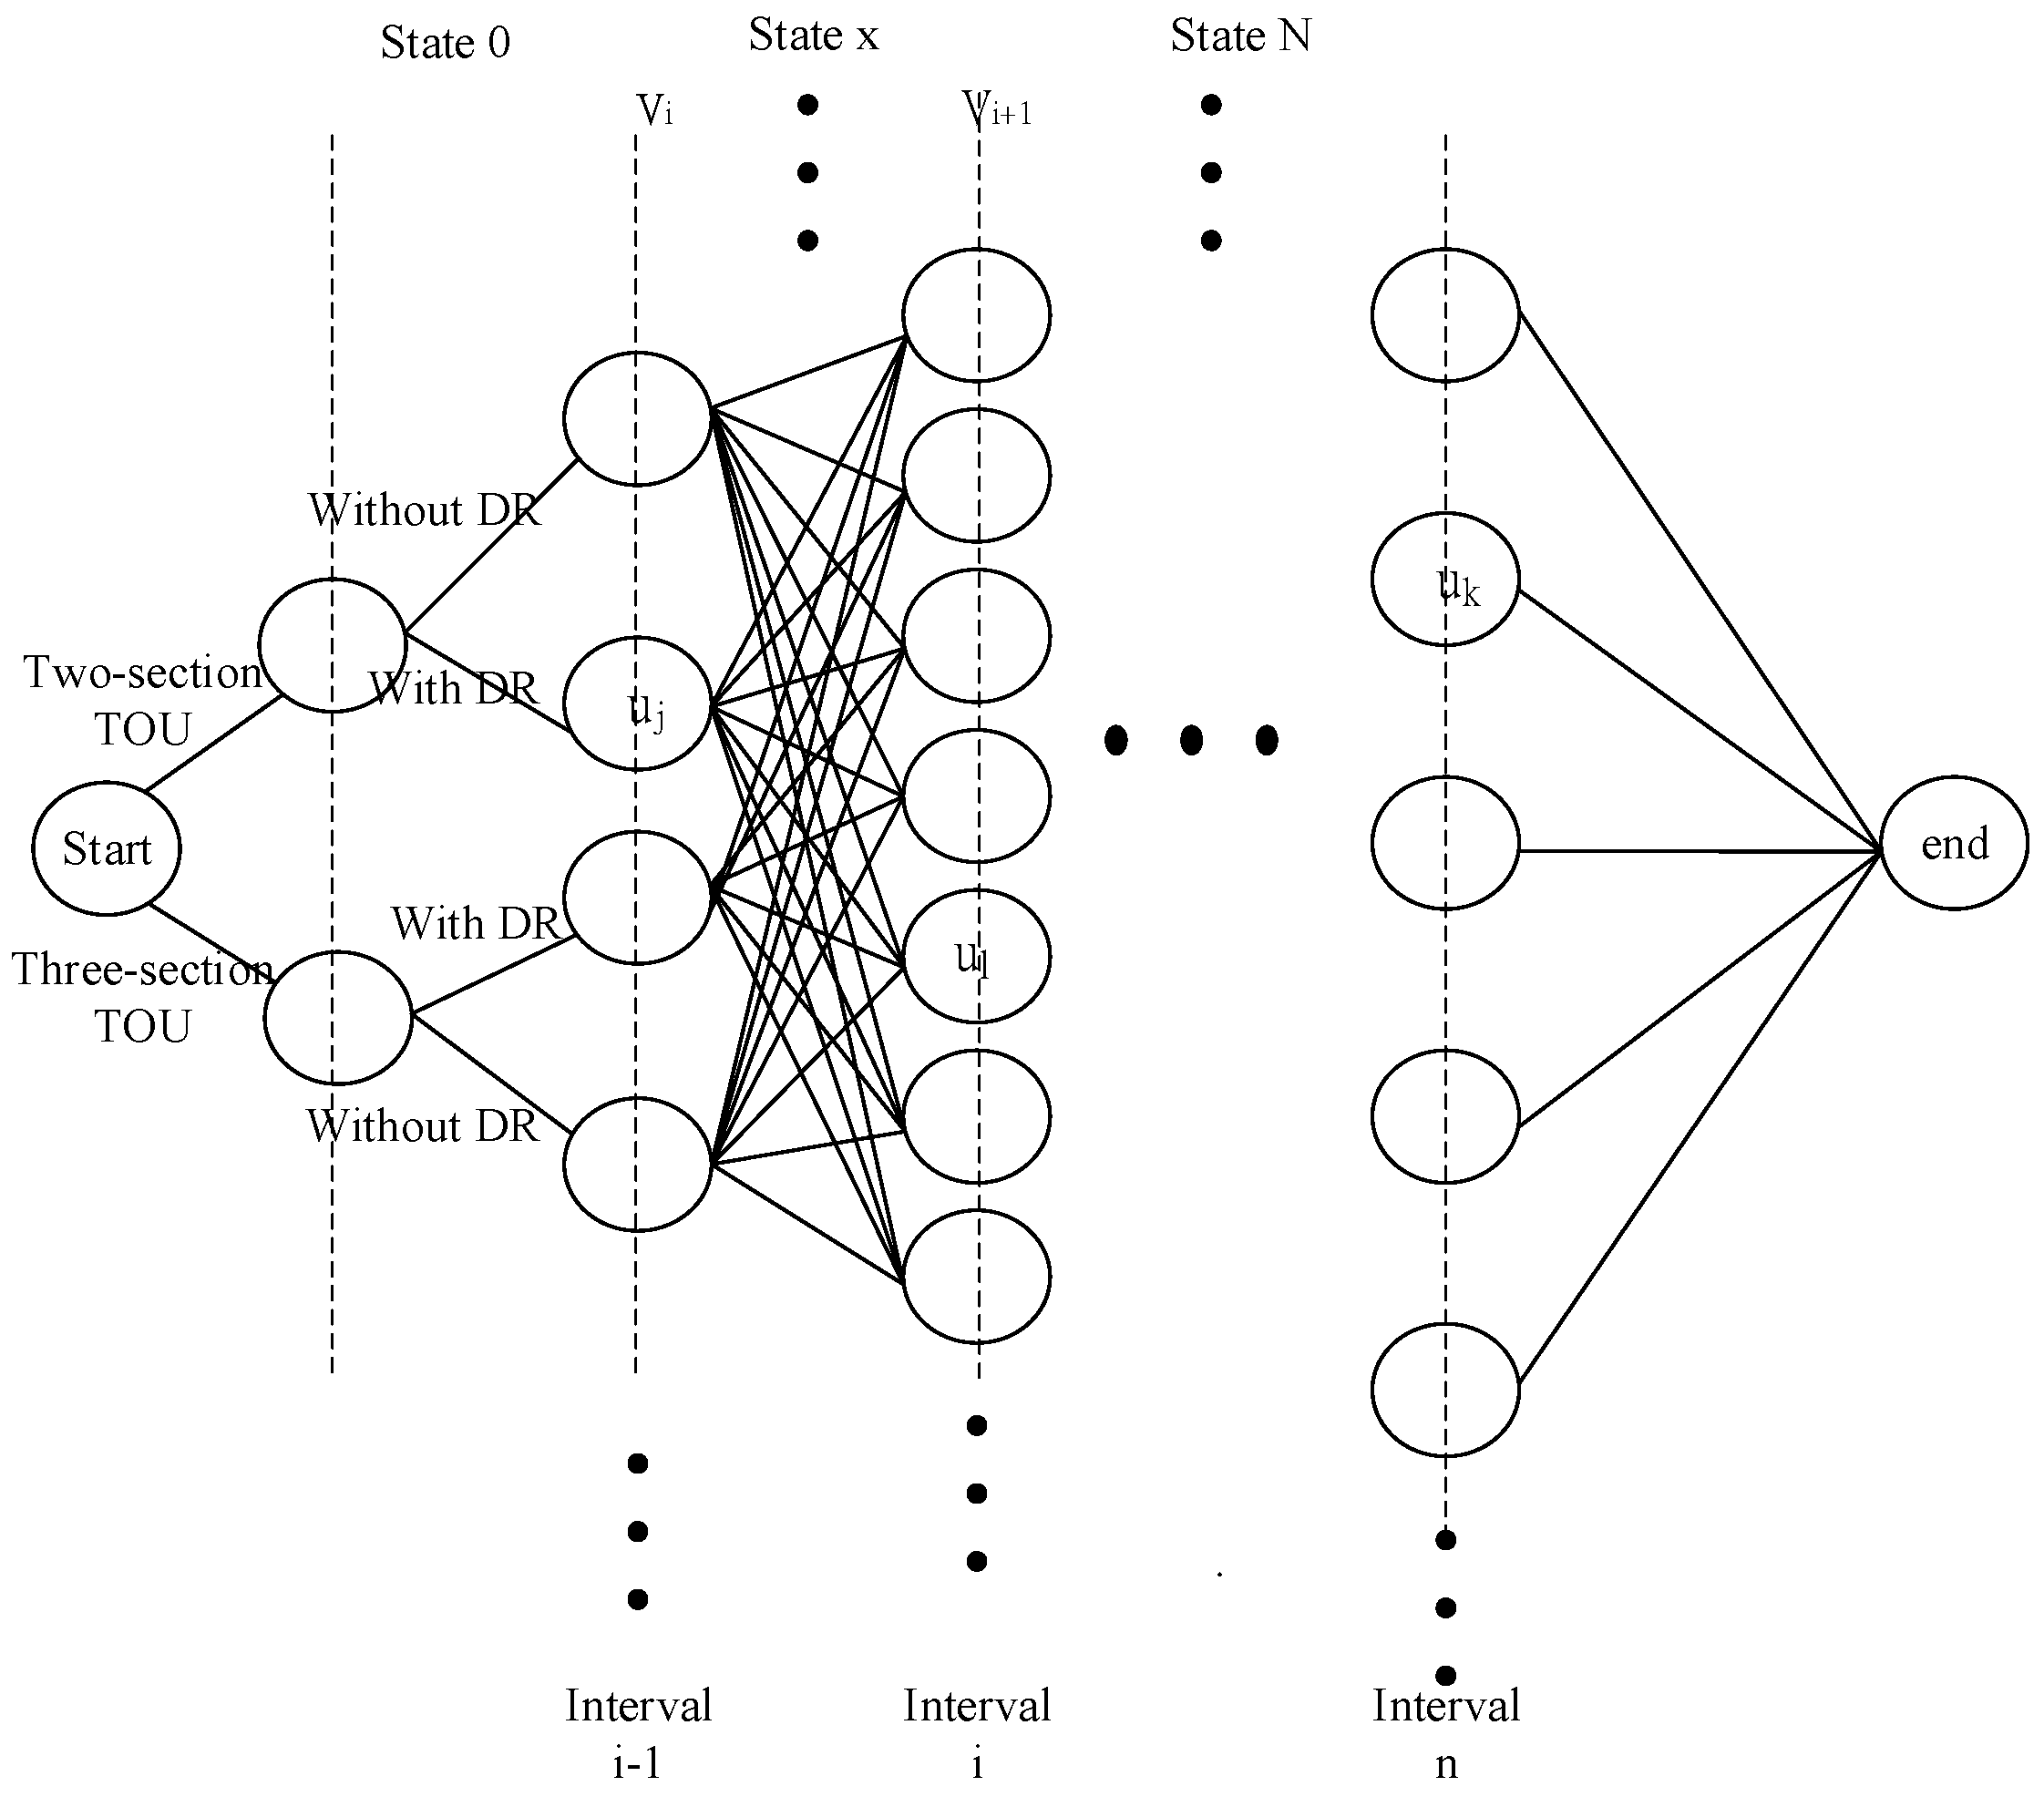
34]. The “daily time period type” was chosen to find the best operation strategy of ice-storage air-conditioning systems while matching the DR executable period (peak period). In the DR strategy, the execution period in peak periods is used to find the best operation strategy of the ice-storage air-conditioning system. The state transition diagram for the DP-based control strategy under different TOU and DR schemes is shown in
Figure 2.
According to the DR measures stipulated by the power company, the DP method is applied for solving the objective function to determine the lowest operating cost of the ice-storage air-conditioning system. As illustrated in
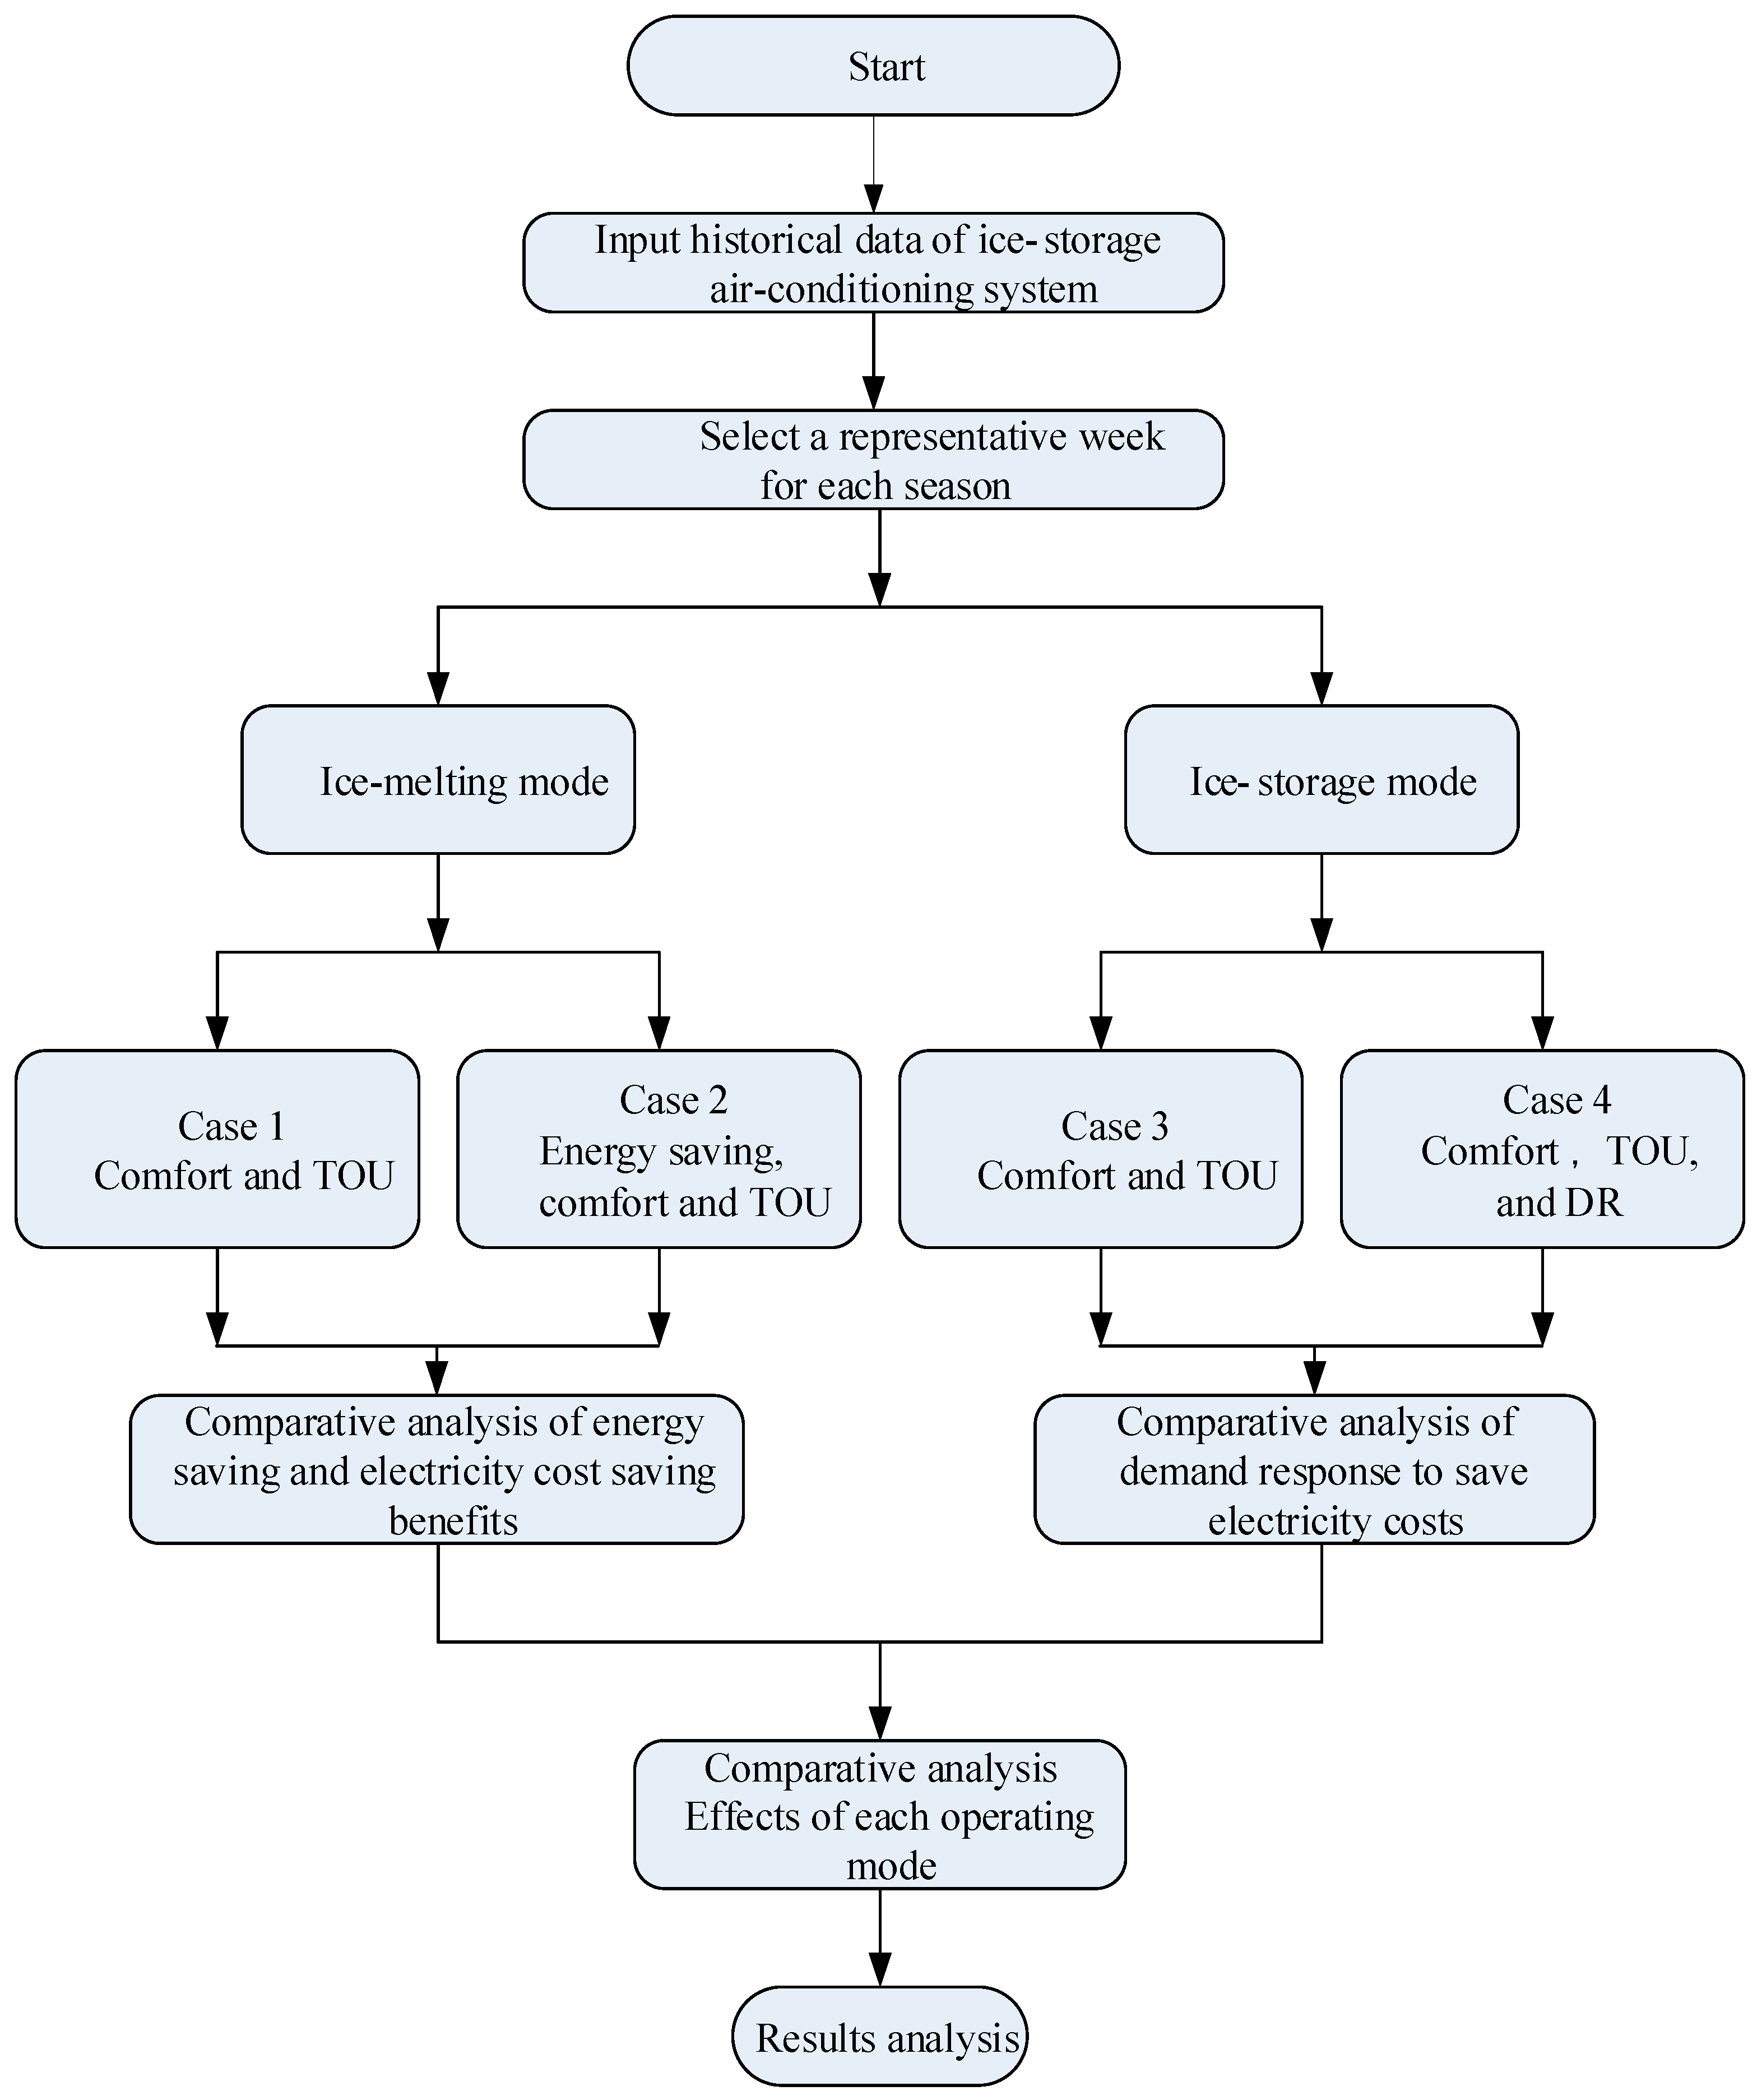
Figure 2, during peak electricity consumption periods when DR is activated, the system can stop the operation of the chiller and switch to the ice-melting mode. In this mode, the ice-storage tank provides the required cooling load instead of the chiller. Since electricity prices are relatively high during peak periods, the implementation of DR not only helps reduce electricity expenses but also allows users to receive bill deductions from the power company. First, the cost of operating in ice-melting mode under the DR schedule, as well as the corresponding bill deduction, is calculated. This cost is then compared with the operating cost of the air-conditioning mode without DR. The nodes with the lowest total cost are selected to determine the optimal operating strategy. The flowchart of the proposed algorithm is shown in
Figure 3.
4. Simulation Results
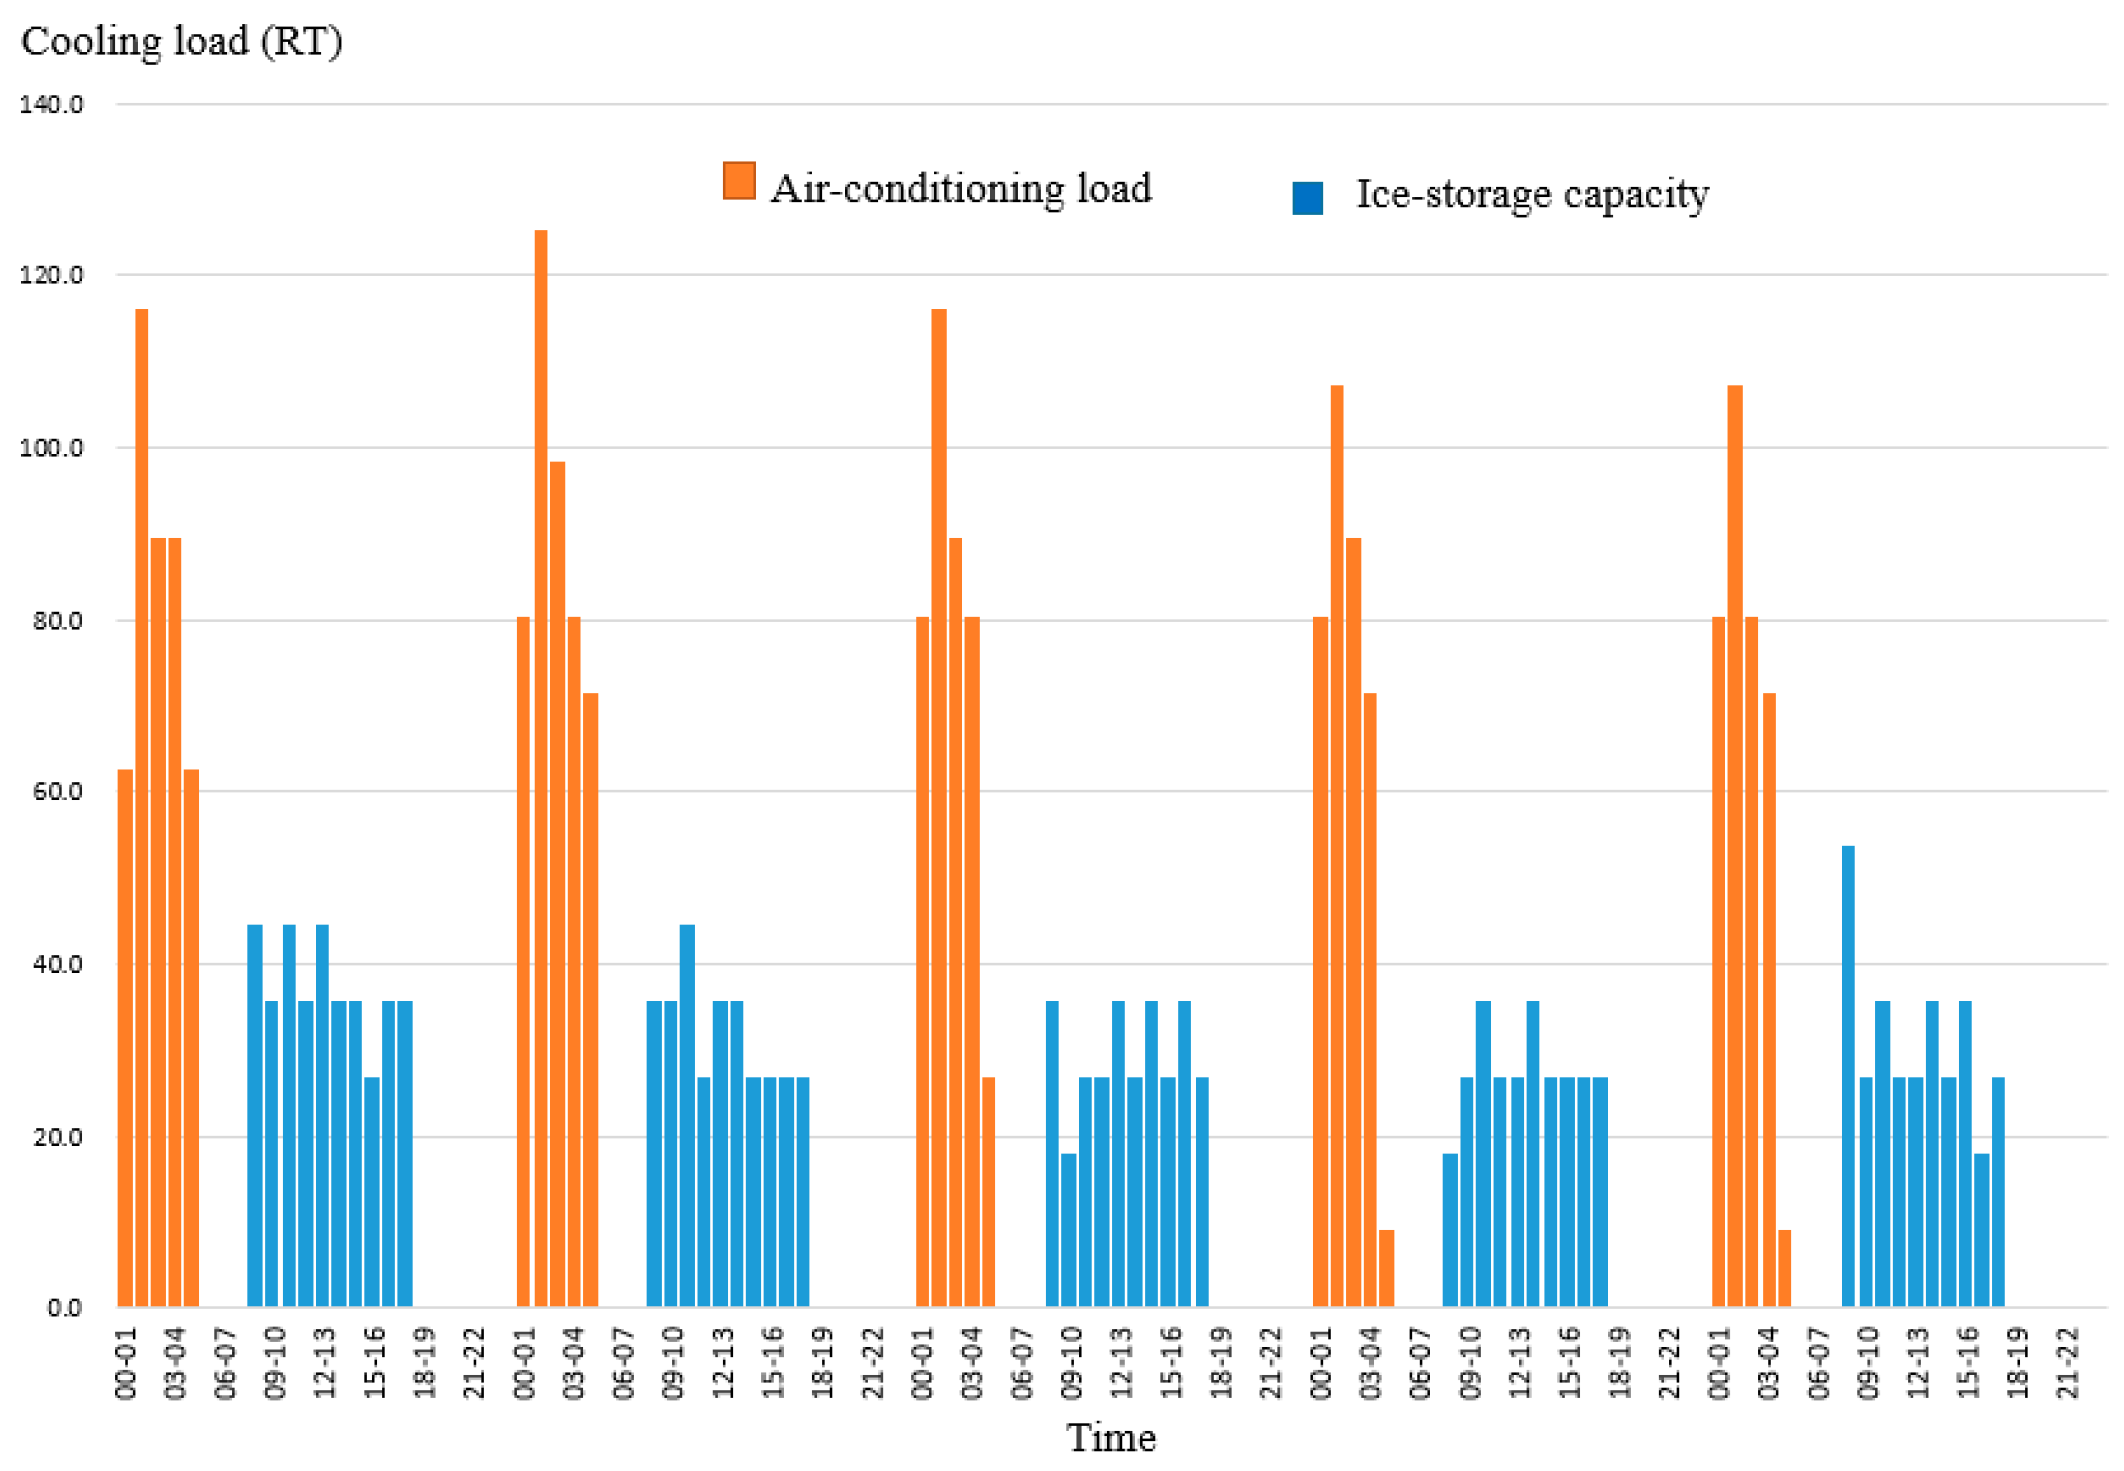
This study focuses on an office building located in Kaohsiung, Taiwan. The ice-storage air-conditioning system supplying the building is supported by two chillers, with a total power consumption of 300 kW. The operating characteristics of the system are analyzed based on selected representative weeks from different seasons: 8 April to 12 April for spring, 10 July to 14 July for summer, and 4 December to 8 December for winter. For autumn, October 16 was mistakenly mentioned earlier and has been corrected. The representative weeks used in this analysis are summarized in
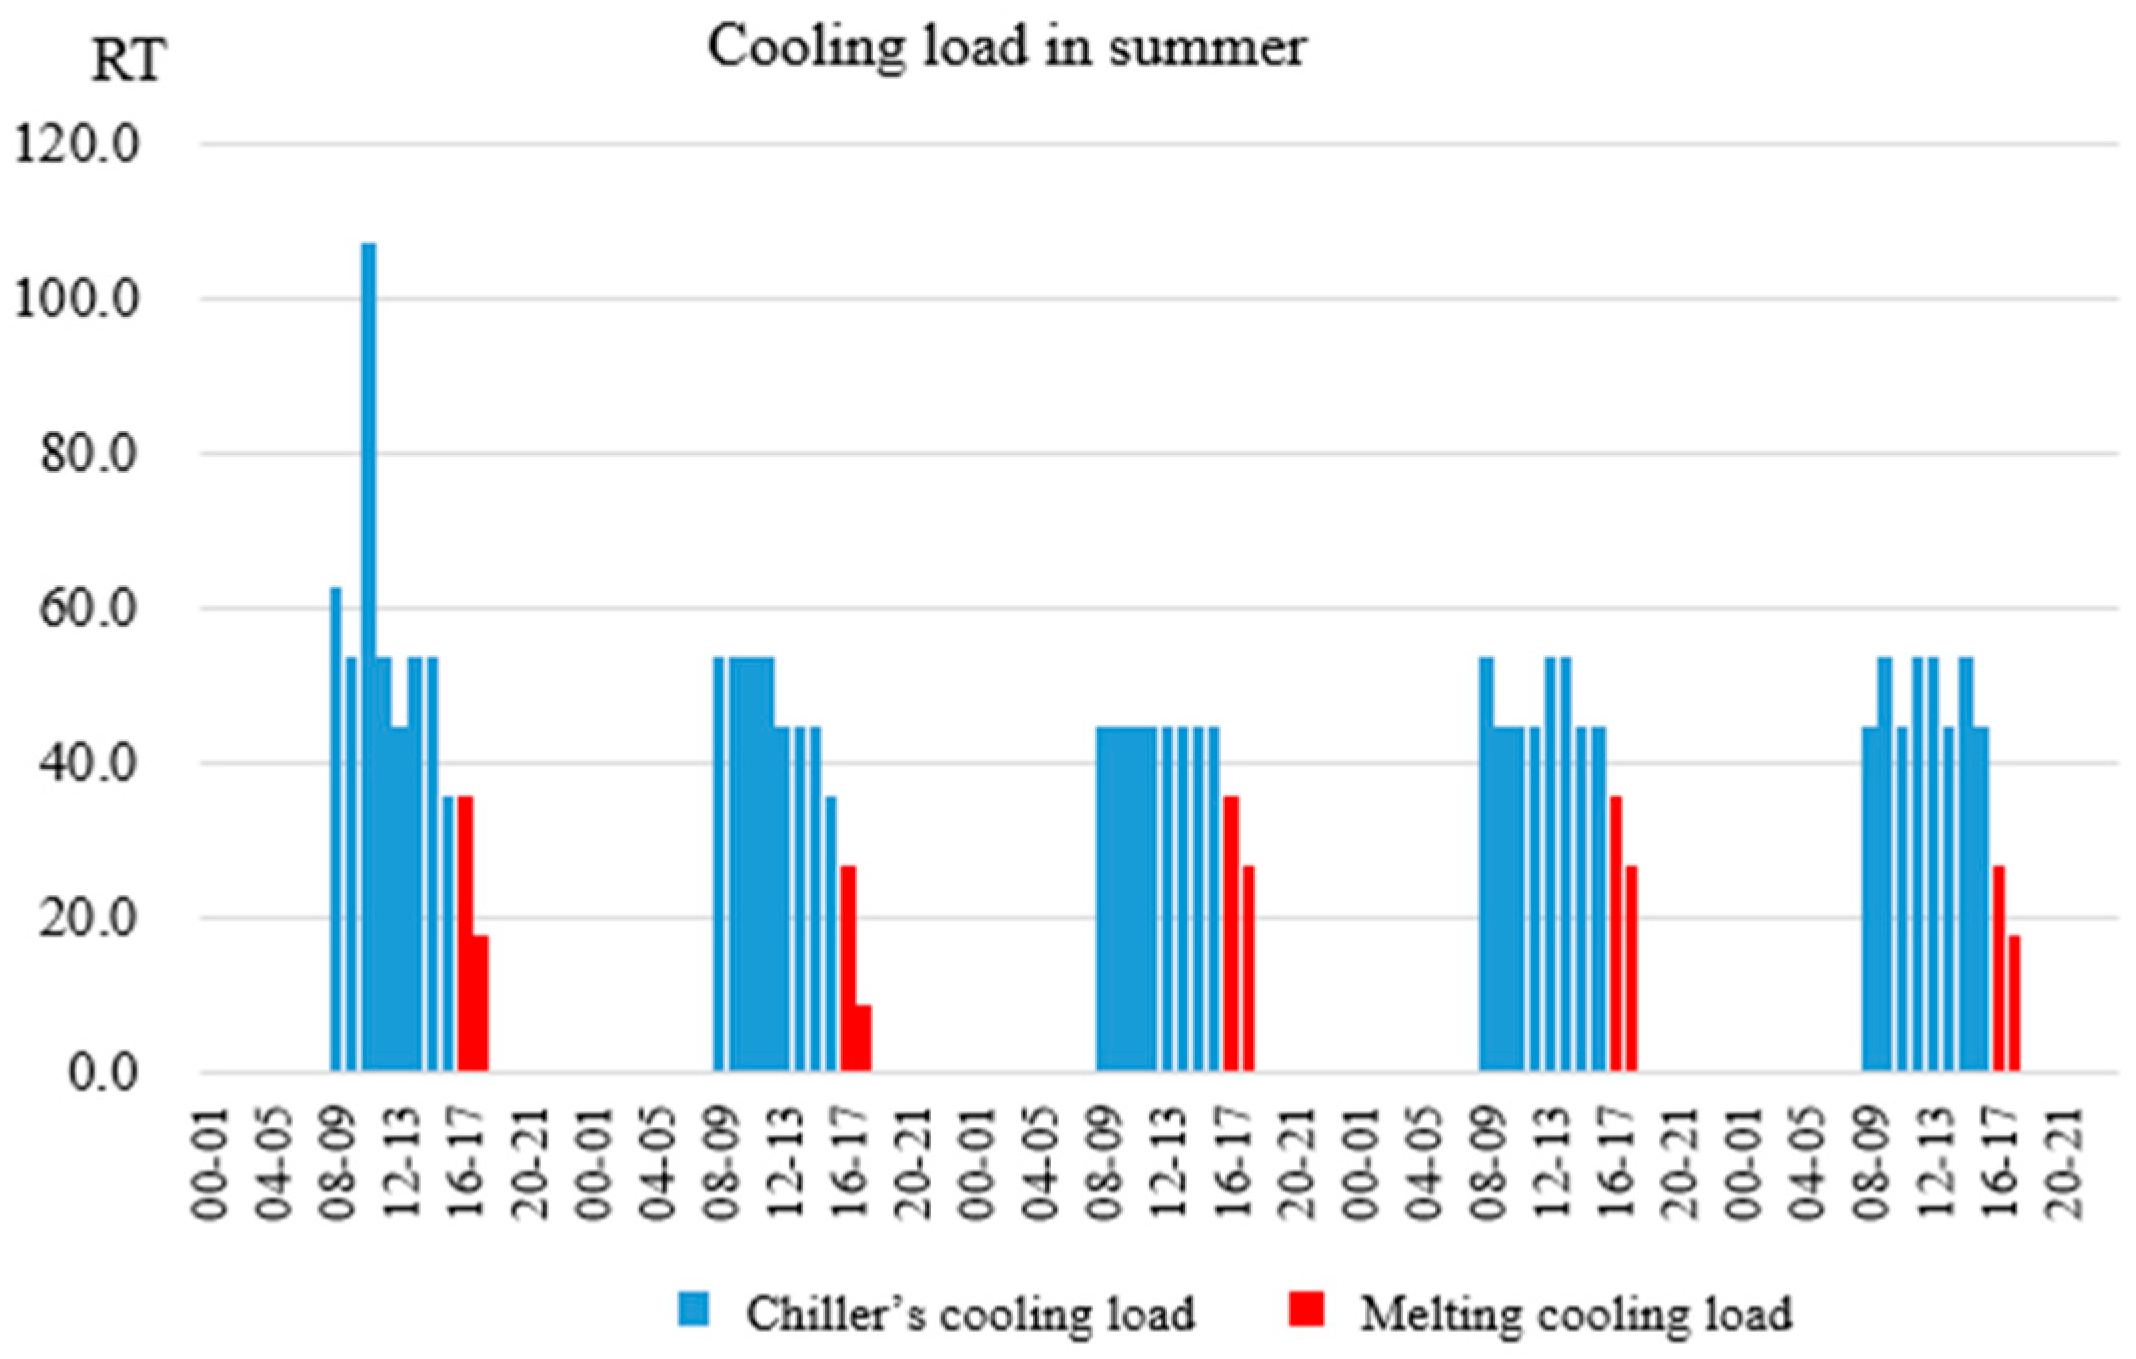
Table 6. A representative workweek (five working days) from each season is selected to evaluate the performance and benefits of the ice-storage air-conditioning system. The load characteristics for the summer week are illustrated in
Figure 4. Generally, both the air-conditioning load and the ice-storage demand are highest during the summer season. In fact, during summer, the air-conditioning load significantly exceeds the ice-storage capacity.
Four cases are simulated in ice-melting mode and air-conditioning mode. The contents of the four cases are assumed as follows.
Case-1 considers thermal comfort and TOU in ice-melting mode.
Case-2 considers thermal comfort, energy saving, and TOU in ice-melting mode.
Case-3 considers thermal comfort and TOU in air-conditioning mode.
Case-4 considers thermal comfort, DR, and TOU in air-conditioning mode.
4.1. Results of Case-1
Table 7 presents the summary results of Case-1, showing the one-week operating characteristics of the ice-storage air-conditioning system in ice-melting mode. In this study, the clothing surface area factor, indoor humidity, and indoor air velocity are assumed to be 0.6, 60%, and 0.1 m/s, respectively. The indoor air-conditioning set temperature for the office building is 26 °C. As shown in
Table 7, the power consumption in ice-storage mode is higher than in ice-melting mode across all seasons. Additionally, the total electricity bill under the three-section TOU pricing scheme is lower than that under the two-section TOU pricing scheme.
4.2. Results of Case-2
This section adopts the same operating characteristics as Case-1. In the energy-saving mode, the indoor air-conditioning set temperature is increased to 27 °C, which is 1 °C higher than that in Case-1.
Table 8 presents the summary results of Case-2. By applying energy-saving strategies, Case-2 reduces energy consumption by 6% compared to Case-1. In addition, the total electricity bill under the three-section TOU pricing scheme is lower than that under the two-section TOU pricing scheme.
4.3. Results of Case-3
This section uses the same air-conditioning load data as in Case-1. In the simulation test, the air-conditioning capacity is used to replace the ice-melting mode, while all other conditions remain the same as in Case-1. The summary results of Case-3 are presented in
Table 9. It is evident that the total electricity bill is higher than that in Case-1 and Case-2.
4.4. Results of Case-4
The simulation of Case-4 adopts the 4-h type under the “daily selection period” program offered by the power company, with the DR execution time set from 16:00 to 20:00. However, since the air-conditioning operating hours for the office building in this study are from 08:00 to 18:00, the effective DR period is limited to 2 h—from 16:00 to 18:00. Additionally, the executable months for the DR program under the “daily selection period” are from May to October, which corresponds to the summer electricity pricing period. Therefore, in this study, DR is executed from 16:00 to 18:00 each day during the selected representative week. During the two-hour DR period, the air-conditioning mode is used from 08:00 to 16:00, with the chillers supplying the cooling load. From 16:00 to 18:00, the system switches to the ice-melting mode, in which the ice-storage tank provides the cooling load, as illustrated in
Figure 5. As shown in
Figure 5, the cooling load between 16:00 and 18:00 each day is supplied by the ice-melting mode of the ice-storage air-conditioning system.
Table 10 shows the summary results of Case-4 in summer. Due to the bill deduction with DR, whether it is a two-section TOU or three-section TOU, the total bill is relatively low.
After the implementation of the TOU pricing scheme, the electricity bill under the three-section TOU is lower than that under the two-section TOU in all cases.
According to the results from Case-1 and Case-2 in
Table 7 and
Table 8, it can be observed that increasing the indoor temperature setting from 26 °C to 27 °C significantly reduces power consumption and electricity costs. However, the PMV value also increases, and on the five test days in summer and autumn, the thermal comfort level slightly exceeds the acceptable comfort threshold.
In Case-3, the chiller in air-conditioning mode replaces the ice-storage tank to provide the same cooling load. Under the same cooling demand, power consumption in air-conditioning mode is significantly lower. This indicates that the low-temperature ice-making process of the chiller during off-peak hours consumes a substantial amount of energy.
Although the power consumption of the chiller in Case-3 is high, the power company provides a 40% discount on electricity usage during off-peak hours. As a result, even with high power consumption, the electricity bill remains relatively low. Furthermore,
Table 9 shows that both the power consumption and total bill of Case-3 in winter are lower than those in Case-1 and Case-2. This suggests that when the cooling load is low, operating in air-conditioning mode is more cost-effective.
The Case-4 test is based on the DR strategy. In summer, the peak period is from 16:00 to 22:00, and Case-4 replaces the period from 16:00 to 18:00 with the ice-melting mode. As shown in
Table 10, the power consumption in Case-4, which considers DR, is higher than that in Case-3 (air-conditioning mode). However, the total electricity bill is lower than that of Case-3 due to DR incentives.
In
Table 10, Case-4 consumes less power than Case-1, and the total bill is also slightly lower. Notably, after applying the DR bill deduction, the total cost in Case-4 is slightly lower than that of the original ice-melting mode used in Case-1.
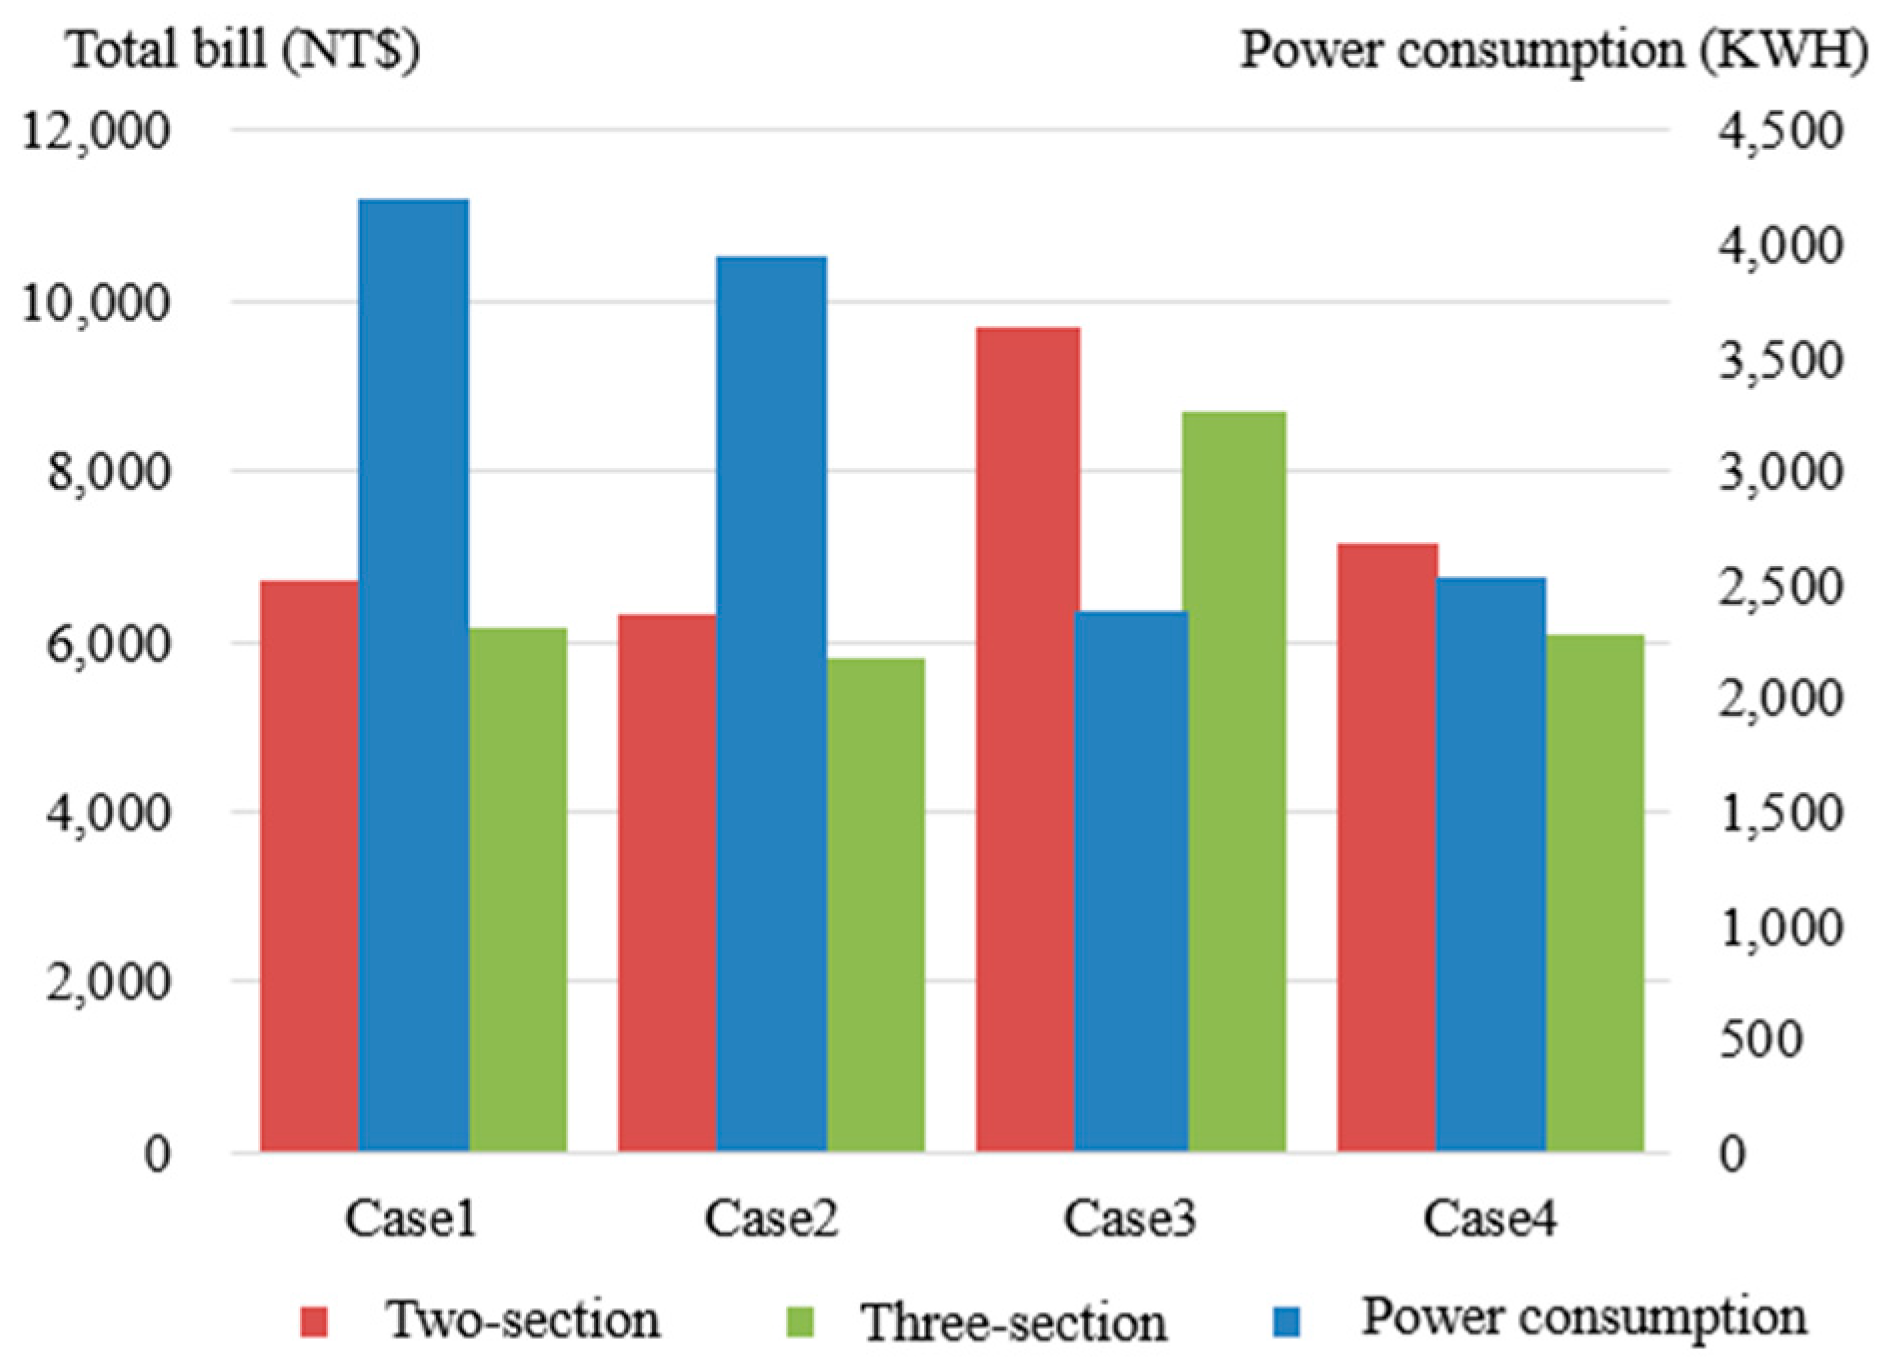
A key question is how to achieve the optimal DR strategy for the air-conditioning system without compromising thermal comfort. The simulation results of Case-1 through Case-4 are illustrated in
Figure 6. It can be concluded that the original cooling load and indoor comfort requirements can be met by using a high-COP (Coefficient of Performance) chiller, combined with DR bill deductions and a smaller-capacity ice-storage tank. This operational strategy not only reduces the electricity cost of the air-conditioning system but also contributes to the sustainable development goals of energy conservation and carbon reduction.
5. Conclusions
Implementing the DR strategy in the comfort air-conditioning system can significantly reduce energy consumption and improve the energy efficiency of the system. A reasonable DR strategy can not only save energy, but also ensure user thermal comfort, achieving a win–win situation of comfort and energy savings. However, while pursuing energy efficiency, attention must be paid to maintaining comfort. Over-tuning the system may affect the comfort of users, so it necessary to find a balance between comfort and energy efficiency. The operating efficiency of the ice-storage air-conditioning system adopted in this paper is calculated under different air-conditioning load conditions in four seasons, using the two-section TOU and three-section TOU pricing scheme to calculate the total bill of the ice-storage air-conditioning system. The comfort level and DR are considered simultaneously to analyze the benefits before and after the implementation of the electricity-saving mode and the optimal operation strategy. The results of this study have certain guiding significance and application value for energy conservation, emission reduction and the improvement of air-conditioning system efficiency. From the analysis and simulation results, it can be shown that energy usage can be managed more efficiently and energy waste can be reduced.
Possible future research directions are to investigate how to integrate artificial intelligence and machine learning techniques to further improve the efficiency and accuracy of DR in comfort air-conditioning systems; to explore how to integrate renewable energy into comfort air-conditioning systems for a more environmentally friendly and sustainable energy use model; and to research on how to implement DR management at the building or community level to achieve more precise and efficient energy use. This could include building regional energy networks and energy storage systems.


