Article

Multi-Level Dynamic Weight Optimization Scheduling Strategy for Flexible Interconnected Distribution Substations Based on Three-Port SNOPs

1
State Grid Changchun Power Supply Company, Changchun 130021, China
2
Key Laboratory of Modern Power System Simulation and Control & Renewable Energy Technology, Northeast Electric Power University, Jilin 132012, China
*
Author to whom correspondence should be addressed.
Energies 2025, 18(10), 2421; https://doi.org/10.3390/en18102421
Submission received: 2 April 2025 / Revised: 28 April 2025 / Accepted: 4 May 2025 / Published: 8 May 2025

Abstract

:
By using a soft normal open point (SNOP) to connect multiple distribution networks to form a flexible interconnected distribution system (FIDS), the power distribution can be flexibly and controllably regulated among distribution stations, but it is also necessary to ensure the system’s operational efficiency and maintain voltage quality when carrying out optimal scheduling. In this paper, a FIDS optimal scheduling strategy considering dynamic weight grading is proposed. By considering the voltage overrun status of each distribution station area, the voltage level of each distribution station area is divided into three voltage overrun situations, including normal operation, safe boundary, and protection boundary levels, and an optimal scheduling model applicable to the multi-level operation of the FIDS is constructed. In order to adapt to the coordinated optimal operation objectives under different overrun levels, an optimal operation strategy considering the dynamic weights of system operation cost, voltage deviation, customer satisfaction, and SNOP regulation capability is proposed and finally simulated and verified using the improved IEEE33 node arithmetic case. The results verify the effectiveness of the method proposed in this paper in improving the system’s operational efficiency and node voltage quality.

1. Introduction

The large-scale integration of distributed generation (DG) into the distribution network brings great challenges to the dispatch and operation of traditional distribution systems, as shown in [1,2,3]. The uncertainty of DG and the stochasticity of loads contribute to feeder voltage overruns and large fluctuations in feeder power [4]. Traditional distribution networks usually use contact switches and sectionalized switches to connect different feeders within the distribution network but cannot achieve the continuous regulation of power [5]. The use of SNOPs to realize multi-feeder interconnections facilitates active power transfer and reactive power support across different distribution stations, improves the overall current distribution of the system, and enhances the ability of the distribution system to cope with source load fluctuation states. SNOPs can also improve the efficiency of system operation by adopting appropriate optimal dispatch strategies when there is some kind of voltage overrun condition in the interconnected system [6,7]. Therefore, in order to fully utilize the significant advantages of SNOPs to cope with DG access and load access, it is necessary to conduct an in-depth study on coordinated operation strategies for FIDS.
At present, some scholars have carried out corresponding research on optimizing system economy, voltage quality, reliability, the DG absorption rate, and other aspects. The authors of [8] aimed to address the issues of voltage limit violations in distribution areas with a high proportion of new energy and electric vehicles and propose a master–slave game model of flexible interconnection considering economy and power supply capacity by studying the working principles of SOPs so as to achieve the goal of balancing the operation economy and power supply capacity of the system. The authors of [9] studied power electronic devices with intelligent soft switches, energy routers, and intelligent power/information exchange base stations to realize the flexible interconnection of multiple devices in the distribution network, discussed the significant advantages of SNOPs for power flow optimization, and pointed out future directions for the evolution of intelligent distribution networks. The authors of [10] proposed a cooperative optimization strategy for distribution network operation based on back-to-back interconnected converters to solve the operation scheduling problems caused by uncertainties in power generation and power factories, as well as grid-connected power factor limitations. By coordinating the active and reactive power output of the system, the optimal cost operation of the active distribution network system is realized. The authors of [11,12] analyzed the impact of SOPs on system operation network losses and node voltage magnitudes and constructed a multi-objective optimal dispatch model, which improves the economy and reliability of FIDS operation. The authors of [13,14,15,16] improved the economy and reliability of FIDS operation by exploring the DG system’s operating characteristics under conditions of output uncertainty and constructed a scheduling strategy with the optimization objective of reducing operating cost, thus improving the system’s operational efficiency. The authors of [17] proposed a two-stage robust optimization scheduling method for flexible interconnected distribution systems considering energy storage and dynamic reconfiguration. Through the real-time regulation and control of FIDS, the reliability and economy of the system operation were further enhanced. The authors of [18] established a two-layer optimization structure for different subjects of interest and considered system voltage safe in the upper layer optimization model to realize the stable operation of multi-microgrids by minimizing the fluctuations in power deficits. The authors of [19] took into account the volatility of the influence of DG output and load demand on the degree of customer satisfaction and added flexible loads by minimizing the loss of demand loads and the regulation cost of flexible loads to improve customer satisfaction. The authors of [20] took the maximized output of DG as the optimization objective function and improved the DG consumption rate. All of the above studies achieved good research results, but they mainly considered a single optimization objective that is not able to reflect the overall state of the demand of system operation. Therefore, there is an urgent need to construct a multi-objective function that can reflect the overall operational requirements of the system and realize a unified understanding of the voltage quality index, economic index, and reliability index of the FIDS.
In order to adapt to the above needs, the authors of [21] propose a voltage optimization strategy considering the randomness of the source load to ensure the safe and stable operation of AC/DC distribution networks with a high proportion of fluctuating new energy types and multiple types of random loads. The objective is to minimize the average values of node voltage deviation and voltage loss and obtain a comprehensive estimation of network loss. The purpose of improving the voltage level of the AC/DC distribution network and improving the response to source load uncertainty is realized. The authors of [22] propose an optimal scheduling model of a low-voltage AC/DC distribution network based on multi-mode flexible interconnections to solve the problems of load imbalances and power quality by minimizing multi-level load imbalances, network losses, and operating costs. In view of the uncertainty characteristics of distributed power supply (DG) and load in active distribution system, the authors of [23] proposed a configuration scheme based on SNOPs, taking into account concepts such as power flow parameters of distribution network lines and aiming to minimize network loss and voltage deviation, realizing the purpose of SNOP configuration optimization and joint operation optimization on multiple time scales. The authors of [24,25] also take the voltage deviation and network loss as the objective function and adopt the hierarchical analysis method to determine the weights of the two, so as to achieve the synergistic optimization of the system economy and the voltage deviation, but the method is subjected to subjective human factors. The authors of [26] propose an adaptive optimal scheduling method for dividing the operating states, but the method does not consider the influence of SNOP regulation capability on its voltage deviation and system operation economy regulation effect. In addition, most of the SOPs in distribution network operation optimization in the above studies stay in two-end SOP interconnection distribution networks, and there are few studies on SOP optimization and regulation grading considering multiple ports. Compared to two ends, multiple-end SOPs have more advantages in coping with the coordinated optimization process, with higher reliability, and after a port failure, the system can still maintain economic operation and a reasonable voltage deviation range by reasonably switching the SOP operation mode.
In summary, in order to ensure the economic operation of the system, and at the same time to improve the system voltage quality and the regulation ability of the system to cope with the uncertainty of the source load, this paper proposes a FIDS optimal dispatching strategy that considers dynamic weight grading. Firstly, the multi-terminal SNOP structure is modeled and analyzed; secondly, by considering the influence of FIDS real-time working state on the system optimal dispatch demand decision, the system working state is divided into different overrun levels according to the voltage level of each distribution station. Then, a dynamic weight coefficient determination method of FIDS considering customer satisfaction, voltage deviation, system operation cost, and SNOP residual capacity regulation ability as the objective function is proposed for the main demands of coordinated operation under different overrun states, and finally, a simulation verification is carried out using three IEEE 33-node distribution stations interconnected with three-terminal SNOPs to prove the accuracy and effectiveness of the proposed method.

2. SNOP-Based Flexible Interconnected Distribution Network

2.1. Form of FIDS

The current SNOP is primarily implemented using a voltage source converter back-to-back (B2B VSC) structure. The DC sides of each VSC unit are interconnected via a common DC bus, while the AC sides are connected to the feeder ends of different distribution networks. Here, Gi represents the 10 kV distribution network; Ti denotes the transformer with a ratio of 10.5/0.4 kV; Psnop,i indicates the transmitted active power of the VSC in the ith distribution table of the SNOP; PV refers to the photovoltaic power generation device; and ESS stands for the energy storage system. The three-terminal SNOP access to multiple distribution tables is illustrated in Figure 1. In contrast to traditional distribution networks, the SNOP replaces contact switches and sectional switches, enabling rapid control of each port through low-latency information interactions facilitated by its device-level control system. This capability allows the SNOP to dynamically regulate both active and reactive power at each port, fundamentally altering the traditional "closed-loop design and open-loop operation" power supply mode of distribution networks and significantly enhancing their rapidity and real-time control capabilities [27] (i = 1, 2, 3).
When the multi-distribution station area interconnected by the three-port SNOP flexible interconnection is in normal operation, it is essential to ensure the stability of DC voltage and maintain a balanced transmission power control. To achieve this, at least two VSC ports must have control variables that include active power (P), while one port should incorporate the DC voltage (Udc). Each port has the capability to simultaneously control two variables; thus, reactive power (Q) or AC-side voltage (uac) can also be selected as an additional control variable. Depending on these control variables, each port can be classified as either a P-V or P-Q node. Specifically, one end operates under constant DC bus voltage control (Udc-Q mode), while the other two ends function in constant power control (P-Q mode). The three station networks connected via SNOPs are capable of rapidly and accurately adjusting network currents, thereby enhancing current distribution within the system and further improving operational stability.

2.2. The SNOP Model

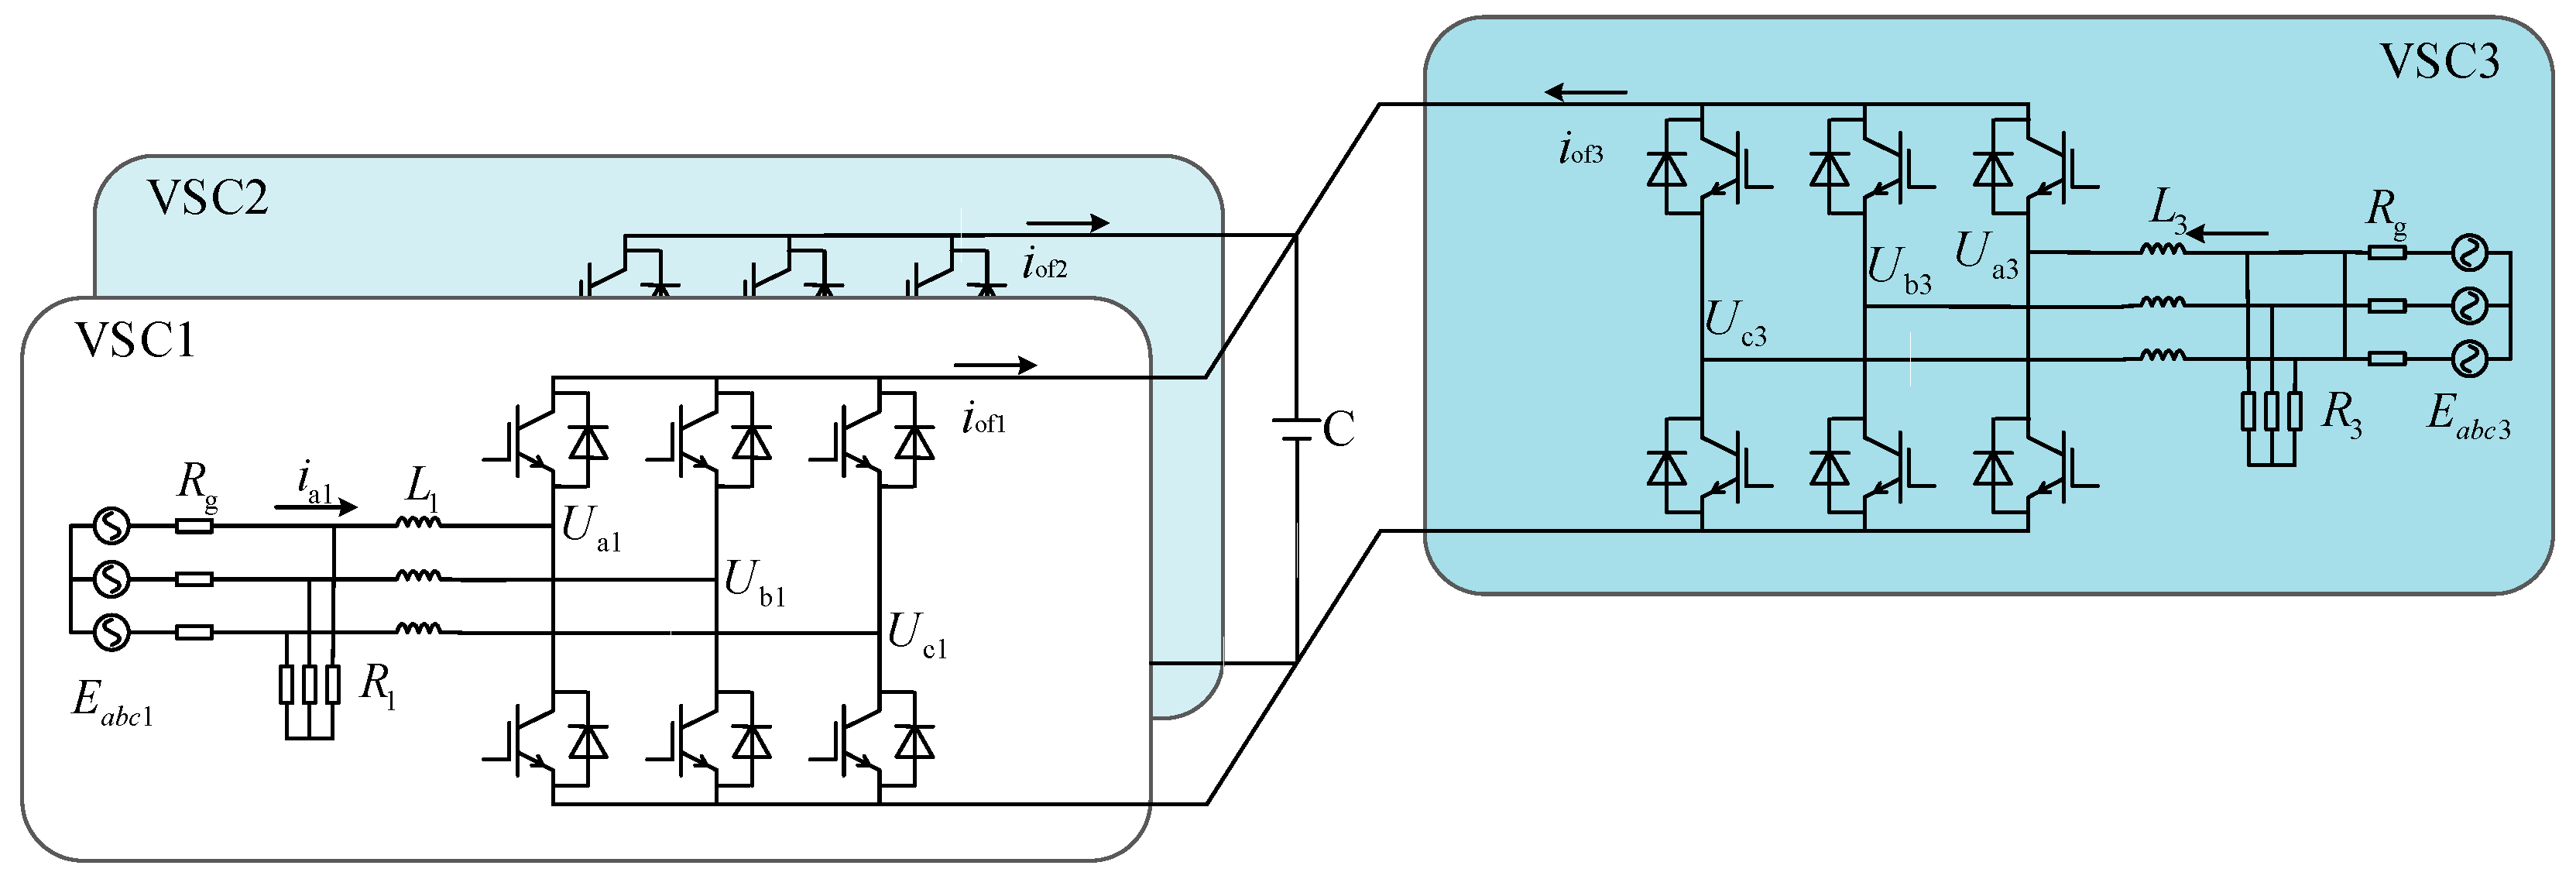
The presence of power loss in power electronic devices constitutes a significant component of the overall network loss within interconnected systems. The primary contributors to converter losses include conduction losses associated with switches, switching losses, and capacitor losses. Figure 2 illustrates the fundamental structure of a three-port SNOP.
In this paper, the loss model of VSCj is developed using the active power P and reactive power Q output from VSCj as control variables:
P l o s s , j ( t ) = η ( P s n o p , j ( t ) ) 2 + ( Q s n o p , j ( t ) ) 2 ( j = 1 , 2 , 3 )
where: Ploss,j(t) denotes the active power loss at port j of the SNOP at time t; η is the loss coefficient at port j, which is taken as 2%; Psnop,j(t) and Qsnop,j(t) denote the active and reactive power outputs from port j of the flexible multi-state switch at time t, respectively.
This paper examines the capability of the SNOP to regulate tidal currents and optimize voltage during the normal operation of distribution substations. To ensure the stability of the DC bus voltage within the SNOP, it is essential that each port adheres to the active power balance constraint, which can be expressed as follows:
j = 1 , 2 , 3 ( P s n o p . j ( t ) + P l o s s . j ( t ) ) = 0
While satisfying the active power balance constraints, each port VSC of the SNOP should also satisfy its own capacity constraints, as well as the port reactive power limitations:
P s n o p .1 ( t ) + j Q s n o p .1 ( t ) S s n o p . n 1 P s n o p .2 ( t ) + j Q s n o p .2 ( t ) S s n o p . n 2 P s n o p .3 ( t ) + j Q s n o p .3 ( t ) S s n o p . n 3
Q s n o p .1 d n ( t ) Q s n o p .1 ( t ) Q s n o p .1 h g ( t ) Q s n o p .2 d n ( t ) Q s n o p .2 ( t ) Q s n o p .2 h g ( t ) Q s n o p .3 d n ( t ) Q s n o p .3 ( t ) Q s n o p .3 h g ( t )
where Ssnop,nj denotes the rated capacity of the VSC port at distribution station area j of the SNOP; Ssnop,jdn denotes the lower limit of reactive power emitted from the VSC port at distribution station area j of the SNOP, and Ssnop,jhg denotes the upper limit of reactive power emitted from the VSC port at distribution station area j (j = 1,2,3).

3. Multi-Level Optimal Dispatch Model of FIND

3.1. Classification of Voltage Overrun

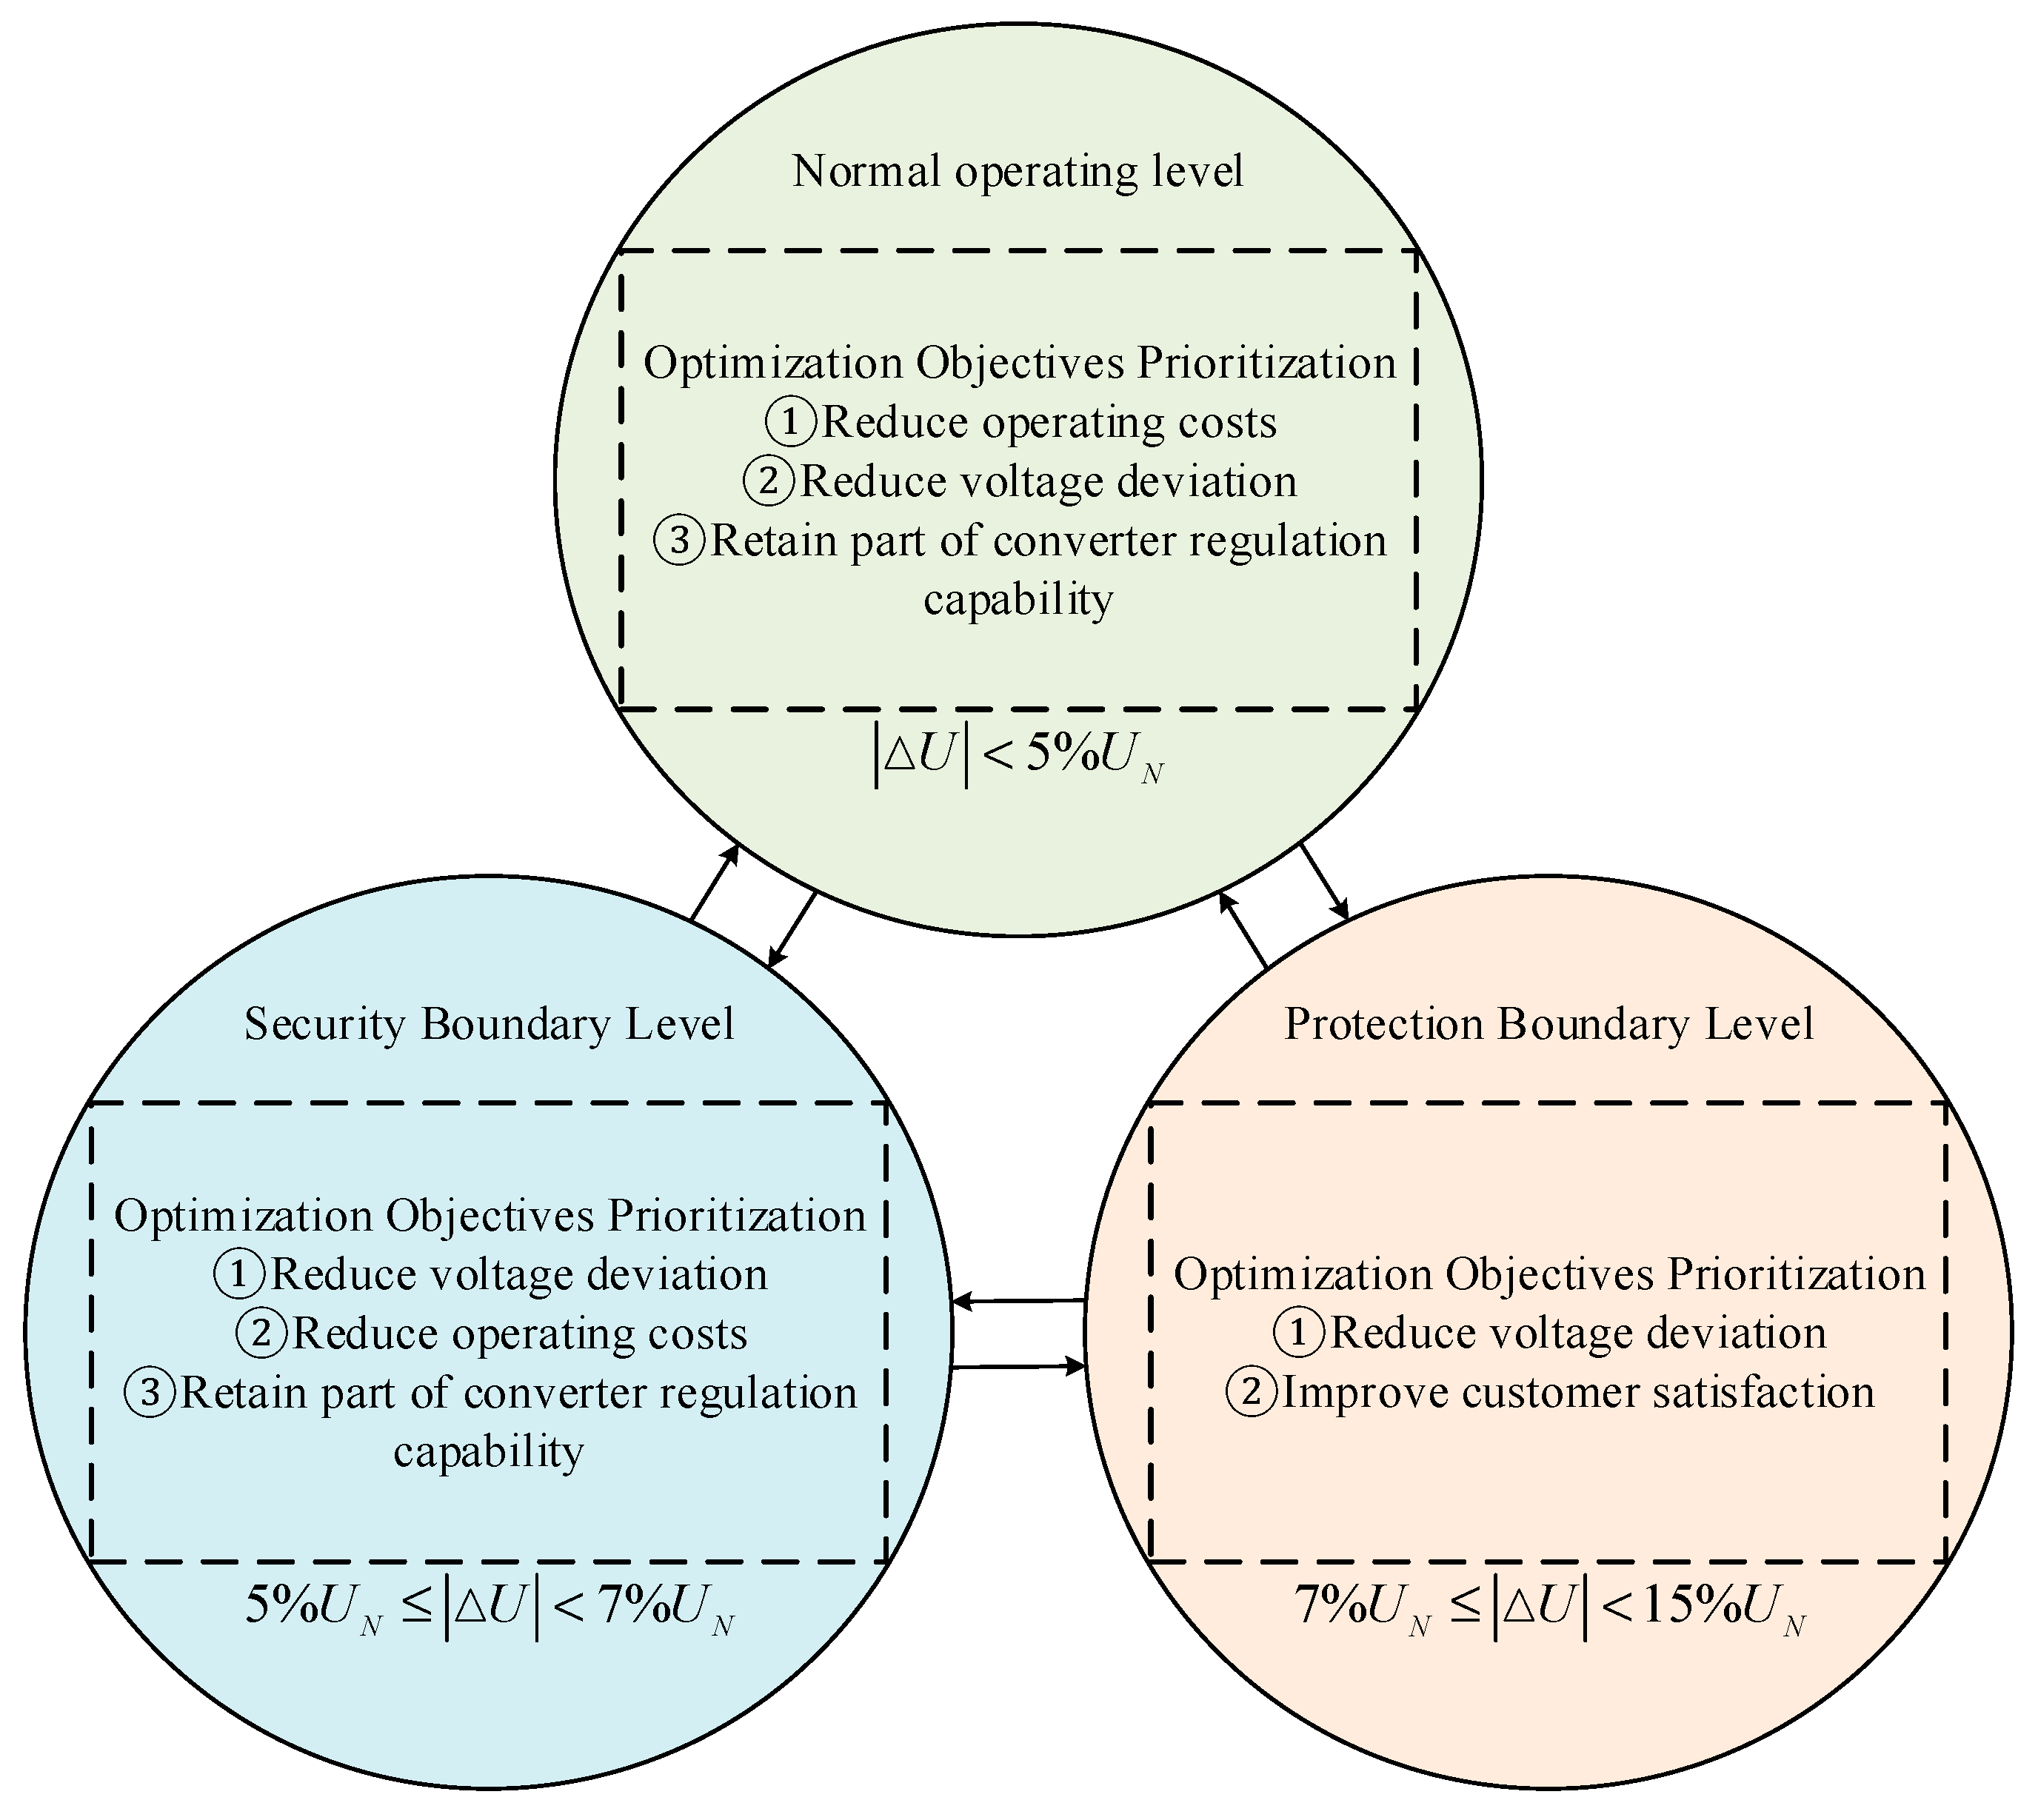
The voltage on the high-voltage side of the main transformer Tj in each AC distribution station area represents the initial stage of the power supply system when electricity enters the distribution station. This voltage is subsequently transmitted to various nodes within the distribution station area, thereby influencing the overall voltage quality across the entire region. By taking into account the impact of real-time operating states of FIDS on system-optimized dispatch demand decisions, we categorize the system’s operational state into three scenarios: normal operation level, safe boundary level, and protection boundary level. These classifications are based on the voltage overrun levels observed at each distribution substation.
(1) Normal Operation Level: The station operates within the normal level when the voltage deviation remains within the range of (−5%, +5%) UN (where UN represents the rated voltage on the AC side). Under these conditions, the station can tolerate fluctuations of up to 5% of its rated voltage. Voltage variations at this level are minimal, ensuring stable system operation. Furthermore, there is a sufficient power regulation margin for the SNOP, and its regulatory capability is adequate to manage minor fluctuations.
(2) Safe Boundary Level: The safe boundary level is defined by voltage deviations in the ranges of (−7%, −5%) UN and (+5%, +7%) UN. At this stage, while the station’s voltage deviation remains within acceptable limits, it approaches the threshold of safe operation. Consequently, even slight power fluctuations may result in voltages exceeding permissible limits.
(3) Protection Boundary Level: When voltage deviations fall within (−15%, −7%) UN and (+7%, +15%) UN, the station enters a protection boundary level. If the absolute value of system voltage deviation reaches 0.15 times the rated UN, an undervoltage or overvoltage protection device will activate a warning signal, indicating that the system is experiencing more severe operational conditions.
Based on these delineated levels of operation, this paper categorizes distribution station area operational modes as illustrated in Table 1. In this context, UN denotes the rated voltage value for the 10 kV side of the main transformer located in the distribution station area; △UN signifies voltage deviation.

3.2. FIND Multi-Level Optimal Scheduling Model Framework

In order to address the multivariable operating states of interconnected systems resulting from real-time fluctuations in source–load dynamics, this paper proposes an optimal scheduling model that is applicable to various operational levels. This model facilitates multi-objective collaborative optimization by analyzing the demands associated with different voltage crossing levels. Compared to single-objective optimization strategies, this approach effectively reduces discrepancies in optimization coefficients across diverse operation modes, thereby enhancing the system’s flexibility and adaptability while better meeting scheduling requirements under complex operational scenarios. Furthermore, the proposed framework integrates coordinated control of distributed power sources and energy storage systems, ensuring economic efficiency while considering voltage stability and network losses. It offers a more efficient scheduling scheme for future power systems characterized by a high penetration of renewable energy resources. In summary, the multi-level optimal dispatch framework introduced in this paper is illustrated in Figure 3. In this figure, under normal operating conditions, priority can be given to economic operations while also accounting for voltage deviation levels and maintaining certain converter regulation capabilities. Under safe boundary conditions, greater emphasis should be placed on voltage quality alongside appropriate consideration of system operational economy; it is essential to retain some converter regulation capability to prevent further deterioration. At protection boundary levels, more proactive measures are necessary to restore voltage levels—this should be achieved through SNOPs by swiftly coordinating power flow within distribution stations, mitigating voltage deviations while taking customer satisfaction into account. If required, non-essential loads or excessive distributed generation output may need to be curtailed in order to alleviate local load pressure, quickly restore voltage levels, and avert further degradation of voltage quality.

3.3. Optimization Objectives

(1) Customer satisfaction objective function
FIDS incorporating SNOPs demonstrates high reliability in power supply. Its capability to accurately regulate system currents allows it to prioritize the provision of reliable power for critical system users. Consequently, this paper categorizes loads and classifies distribution loads into three categories: one category of essential loads, two categories of transferable loads, and three categories of controllable loads. This classification is based on the demands for power supply reliability as well as the losses and impacts associated with interruptions in power supply on personal safety, politics, and the economy. Among these classifications, it is imperative to ensure a continuous power supply for essential loads; failure to do so could pose significant risks to national politics and economic stability. For the second and third categories of loads, after establishing a scheduling agreement with the power supply unit, they may independently engage in optimizing trends within the distribution network. If necessary, these loads can be temporarily disconnected from the power supply to maintain system stability. Therefore, this paper takes the power fluctuation (ΔPfu,l) of two and three types of loads as the user satisfaction index, where the smaller the fluctuation, the more satisfied users are with the quality of power supply, based on which the corresponding objective function is established:
f 1 = Δ P fu , l ( t ) = P add 2 t , l ( t ) P dec 2 t , l ( t ) P cut 3 t , l ( t )
where: f1 represents the power fluctuation size of distribution station l at time t, P1t,ladd is the optimization to obtain the second type of transferable load increased by distribution station l at time t, P2t,ldec is the optimization to obtain the second type of transferable load decreased by distribution station l at time t, and P3t,lcut is the optimization to obtain the third type of cut-off load at distribution station l at time t. l is the number of distribution station l (l = 1,2,3).
(2) Voltage deviation objective function
Voltage deviation is a critical factor influencing system stability and power quality. This paper assumes that the uabc of each VSC-connected distribution station area is in a balanced state. It primarily discusses the advantages of the voltage deviation index within the proposed optimal scheduling and control strategy aimed at mitigating the risk of exceeding interconnected system voltage limits. Furthermore, an objective function for voltage deviation can be formulated as follows:
f 2 = j = 1 n j , l U j , l 2 ( t ) 1   , j l
where: Uj,l (t) for the lth distribution station area transformer high-voltage side voltage at the moment of t; nj,l for the total number of stations.
(3) System operation cost objective function
In FIDS, the operational cost of the system serves as a crucial indicator of economic performance, directly influencing both the sustainable development of the grid and users’ power experience. With the widespread integration of DG and diverse load types, system operation costs encompass not only traditional power purchase expenses but also additional factors such as wind and solar curtailment costs, transmission losses, energy storage charging and discharging costs, among others. To optimize these operational costs effectively and maximize the economic benefits derived from the distribution grid, it is essential to consider power purchase expenditures at both this level of the grid and its higher tiers when formulating an objective function for system operation cost optimization.
f 3 = D DG + D ESS + D PS + D LOSS
D DG = χ D G m = 1 n d g P m , t , l d g r e f P m , t , l d g , n d g l D ESS = χ E S S w = 1 n e s s P w , t , l d i s + P w , t , l c w , n e s s l D PS = χ t , l P t , l b y D LOSS = χ t , l i , j l I i j , t , l 2 r i j , l
where: DDG is the cost of wind and light abandonment, DESS is the cost of storage operation, DPS power purchase cost, DLOSS is the cost of network loss, χDG is the penalty price of wind and light abandonment, χESS is the coefficient of the cost of storage operation, χt,l is the real-time price of electricity in the l-distribution station area at the moment of t, ndg, ness are the total number of DGs and storage in the l-distribution station area, respectively, Pdgrefm,t,l is the active power emitted from the mth DG of the l-distribution station area, Pdgm,t,l is the active power actually utilized by the mth DG in the l-station area, Pdisw,t,l and Pcww,t,l are the charging and discharging power of the wth energy storage device in the l-station area, Pbyt,l is the active power transmitted from the upper grid in the l-station area, and Iij,t,l and rij,l are the current and resistance on the line i-j in the l-station area, respectively.
(4) Objective function of the remaining capacity regulation capability of SNOP ports
When power coordination is implemented in interconnected distribution stations containing SNOPs to regulate voltage deviations across various operational modes, it is essential to retain a certain amount of residual adjustable capacity for the VSC port within the SNOP. This ensures that the VSC port maintains a degree of power regulation capability, thereby preventing situations where changes in real-time system operations result in an inability of the VSC port to coordinate system power effectively. Such scenarios could lead directly to the disconnection of DG or load operations. Consequently, the objective function for regulating the remaining capacity at the SNOP port can be defined as follows:
f 4 = S s n o p N , l 2 P s n o p N , l 2 ( t ) Q s n o p N , l 2 ( t ) S s n o p N , l
where PsnopN,l is the rated capacity of the VSC connected to the l-distribution station area, Psnop,l(t) is the active power transmitted at the moment t of the VSC connected to the l-distribution station area, and Qsnop,l(t) is the reactive power emitted at the moment t of the VSC connected to the l-distribution station area.
In view of the numerical differences between different optimization objectives, it is necessary to normalize them before weighted summation, and its overall optimization objective function is expressed as:
min F = l 3 ε 1 , l t f 1 , l + ε 2 , l t f 2 , l + ε 3 , l t f 3 , l ε 4 , l t f 4 , l
where: f1′, f2′, f3′, f4′ are respectively l-station area for customer satisfaction, voltage deviation, system operating cost, SNOP port residual capacity regulation ability after normalization of the objective function value; ɛ1,l(t), ɛ2,l(t), ɛ3,l(t), ɛ4,l(t) are for the moment t l-distribution station area of the different optimization objectives of the weight coefficients.

4. Principles for Determining Multi-Objective Dynamic Weighting Coefficients

The optimization model proposed in this paper addresses the multi-objective optimization problem, enabling synergistic optimization among various objectives through weighted summation and dynamic coordination. To mitigate the influence of subjective human factors on the optimization outcomes, we introduce a method for determining dynamic weighting coefficients that takes into account the system’s overrun level. In normal operational mode, when AC voltage deviation is minimal, priority can be given to the economic operation of the system while retaining a certain margin for SNOP capacity regulation. Concurrently, to uphold voltage quality during interconnected system operations, it is essential that, as voltage fluctuations increase, the weight coefficient associated with voltage deviation rises progressively while the weight coefficient related to SNOP port capacity regulation retention margin decreases correspondingly. Based on actual conditions regarding voltage deviations, power mutualization among each distribution station must be permitted. Building upon this analysis allows us to calculate the degree of deviation of node voltages on the 10 kV side of main transformers within low-voltage distribution station areas from their reference values and construct an expression for dynamic weight coefficients applicable under normal operating levels as follows:
ε 1 t = 0 ε 2 t = λ 1 + 0.45 λ 1 U max , l ( t ) 1 0.05 ε 3 t = λ 2 λ 2 0.5 U max , l ( t ) 1 0.05 ε 1 t + ε 2 t + ε 3 t + ε 4 t = 1
where: λ1, λ2 are the linearization coefficients of the weighting coefficients. λ1 ensures that the system gives priority to economy under normal operation, and at the same time reserves a certain amount of weight for the voltage regulation, which takes the value of 0.2, and as the voltage deviation rises, the enhancement of the voltage quality becomes the main concern, which should be given a higher weight, so the value of λ2 takes the value of 0.7; Umax,l(t) is the high-voltage side voltage of the transformer in the distribution station l at time t; and SsnopN,l is the rated capacity of the connected VSCs of the distribution station l.
As the voltage deviation increases, when the system operates within a safe boundary level, it approaches the limits of safe operation despite the voltage deviation remaining within acceptable threshold values. In this mode, even minor power fluctuations may result in voltage overruns. Therefore, it is imperative for the system to prioritize voltage quality while also considering operational economy and the residual regulation capacity at the VSC ports to prevent further deterioration. A systematic approach is required to restore voltage deviations back to within normal boundary ranges. At this juncture, as voltage deviations rise, it is essential to enhance the dynamic weight coefficient associated with these deviations. Concurrently, there should be a reduction in both the corresponding dynamic weight of system operational costs and that of SNOP port residual capacity margins. The expression for constructing an appropriate weight coefficient under conditions of safe boundary level operation can be articulated as follows:
ε 1 t = 0 ε 2 t = λ 2 + 0.15 U max , l ( t ) 1 0.05 0.02 ε 4 t = λ 1 λ 3 U max , l ( t ) 1 0.05 0.02 ε 1 t + ε 2 t + ε 3 t + ε 4 t = 1
where: λ3 is the linearization factor of the weighting coefficients. λ3 is a regulating capacity indicator that ensures that the SNOP has the capacity to cope with contingencies and takes the value of 0.1.
When the FIDS voltage overrun enters the protection boundary level mode, it signifies that the system is in a more critical operational state. Consequently, proactive measures must be implemented to restore the voltage level. In this scenario, economic considerations of the system are no longer prioritized; instead, adjustments should be made to appropriately reduce the remaining capacity margin weight of the SNOP port to facilitate voltage restoration as much as possible based on its own capacity. Simultaneously, it is essential for both second and third type load sides to engage in cooperative scheduling. As voltage deviation increases, dynamic weights that account for this deviation should also rise. Additionally, user satisfaction weights ought to be considered judiciously. If feasible, some remaining capacity margin weights of the SNOP port should be preserved as much as possible. The expression for the weight coefficient in protection boundary level mode can thus be formulated as:
ε 3 t = 0 ε 4 t = 0 ε 2 t = λ 2 + λ 1 + λ 3 U max , l ( t ) 1 0.07 0.08 ε 1 t + ε 2 t + ε 3 t + ε 4 t = 1
According to the above analysis, FIDS is able to dynamically select the weight coefficient expression and realize the weight coefficient redistribution by real-time monitoring of the main transformer high-voltage-side voltage in different distribution stations. When all distribution stations in FIND are in normal operation level mode, it is judged that the interconnected system has high power supply reliability and small voltage deviation, and the dynamic weight coefficients of system operation cost should be increased, and the weight coefficients of the optimization objectives in this state are determined by Equation (11). At this time, the system is dominated by economic optimization; when the maximum voltage deviation Umax is detected in the l-station area and l(t) is increased, the voltage deviation weight coefficient ɛ2(t) increases slowly, and the economic weight ɛ3(t) decreases dynamically with the increase in ɛ2(t). When the maximum voltage deviation Umax is detected in l-station and l(t) increases more than 1.05 times the rated UN, the system enters the safe boundary level mode, and the weight coefficients of the different optimization objectives are determined by Equation (12).
Since the optimization objectives of the system are not the same under different operation levels, the demand for voltage safety is greater in the safe boundary level, and its weight coefficient follows the trend of voltage deviation more obviously, and the voltage weight increases significantly compared with the normal operation level. With the further expansion of the maximum voltage deviation Umax, l(t) in the l-station area, the distribution station area enters the protection boundary level operation and, at this time, the system is able to quickly adjust the optimization objective according to Equation (13) and improve the voltage quality during system operation by using the adjustable second and third flexible loads, and the weights of the voltage quality and the customer satisfaction are able to track the voltage fluctuation and realize the dynamic adjustment.
In summary, through the dynamic weight coefficient model proposed in this paper, its optimization weight coefficients and optimization objectives can be adjusted in time for multi-distribution stations containing three-terminal SNOPs to meet the optimization demand under different class mode divisions and achieve synergistic optimization of system economy, voltage quality, and system reliability.

5. Constraints and Conversion

5.1. Constraints

According to the optimal scheduling model proposed in this paper, its constraints mainly include system current constraints, operational safety constraints, DG output constraints, and energy storage constraints, and the relevant constraints of SNOPs have been mentioned in Section 2.2 of this paper, so we will not repeat them in this section. The relevant constraints are as follows:
(1) System tidal current constraints
The Distflow model is used to describe the system tidal flow constraints:
P i , l ( t ) = j Ω i P i j , l ( t ) k Φ i ( P k i , l ( t ) R k i , l I k i , l 2 ( t ) ) Q i , l ( t ) = j Ω i Q i j , l ( t ) k Φ i ( Q k i , l ( t ) X k i , l I k i , l 2 ( t ) )
P i , l t = P DG i , l t + P snop i , l t + P ESS in , l t P Load , i , l t P ESS o u t , l t Q i , l t = Q DG i , l t + Q snop i , l t Q Load , i , l t
U i , l 2 ( t ) U j , l 2 ( t ) = 2 R i j , l P i j , l ( t ) + X i j , l Q i j , l ( t ) + I i j , l 2 R i j , l 2 + X i j , l 2
I i j , l 2 ( t ) U i , l 2 ( t ) P i j , l 2 ( t ) Q i j , l 2 ( t ) = 0
where Pij,l(t) and Qij,l(t) are the active and reactive power of nodes i-j of distribution station area l, respectively; Rki,l and Xki,l are the resistance and reactance of the branch circuit of distribution station area l, respectively; Pi,l and Qi,l are the active and reactive power injected into distribution station area l, respectively; PDGi,l and QDGi,l are the active and reactive power injected into station area l by DG, respectively; Psnop,l and Qsnop,l are the active and reactive power injected by SNOPs into station l, respectively; PLoad,i,l and QLoad,i,l are the active and reactive power required by the loads in distribution station l, respectively; Ωi,l is the set of first-end nodes that branch off from the end node with i as the end node within the distribution station l and Φi,l is the set of end nodes that branch off from the end node with i as the first-end end node within the distribution station l set; PESSin,l and PESSout,l are the charging and discharging power of the energy storage injection station l, respectively.
(2) Branch current constraints
0 I i j , l 2 t I i j , l , max 2 U i , l , min 2 U i , l 2 ( t ) U i , l , max 2
where Iij,max is the upper limit of the transferable current of the line in station l; Ui,max and Ui,min are the upper and lower limits of the voltage at node i in station l, respectively.
(3) PV outflow constraints
0 P DG , l P DGref , l
where PDGref, l is the maximum value of active power transmitted by DG at distribution station l.
(4) Energy storage constraint
E h , l ( t ) = E h , l ( t 1 ) + η essin , l P h , l in ( t ) Δ t P h , l out ( t ) Δ t η essout , l
where ηessin,l and ηessout,l are the charging and discharging conversion efficiencies of the energy storage at distribution station l, respectively; ∆t is the scheduling time interval.
E h , l ( 0 ) = E h , l ( 24 ) E h , l , min E h , l ( t ) E h , l , max
where Eh,l(t) is the SOC value of energy storage in the l distribution area; Eh,l,max and Eh,l,min are the upper and lower limits of the energy storage capacity in the l distribution area, respectively.
0 P Ein , h , l ( t ) λ Ein , h , l ( t ) P Einmax , h , l 0 P Eout , h , l ( t ) λ Eout , h , l ( t ) P Eoutmax , h , l λ Ein , h , l ( t ) + λ Eout , h , l ( t ) 1
where PEinmax,h,l and PEoutmax,h,l are the maximum values of the charging and discharging power of the energy storage in the l-distribution area; λEin.h,l and λEout.h,l are the charging and discharging states of the energy storage in the l-distribution area, respectively.
(5) Load constraints
P Load , i , l ( t ) = P i , l , load ( t ) + P add 2 t , l ( t ) P dec 2 t , l ( t ) P cut 3 t , l ( t )
t = 1 24 P add 2 t , l ( t ) = t = 1 24 P dec 2 t , l ( t ) 0 P add 2 t , l ( t ) P max 2 t , l 0 P dec 2 t , l ( t ) P max 2 t , l P min 3 t , l P cut 3 t , l ( t ) P max 3 t , l
where Pi,l,load is the required active power value of the station before load transfer; P2t,lmax is the upper limit of the second type of transferable load; and P3t,lmax and P3t,lin are the upper and lower limits of the three types of removable load, respectively.

5.2. Model Second-Order Cone Processing

The optimization model proposed in this paper belongs to the non-convex non-linear mixed integer model which is difficult to solve. Therefore, a model transformation process is required before solving:
(1) The primary term variables U′(t) and I′(t) are used to replace the square term variables U2(t) and I2(t), respectively, which can improve the speed of model solving without affecting the optimization results;
(2) In order to deal with the absolute value term in the optimization objective function, this paper introduces the auxiliary variable Vi(t) and adds the corresponding linearization constraints, so as to achieve the same constraint effect as that of the absolute value term.
After the above treatment, for the constraints with non-convex non-linear characteristics, the second-order cone relaxation is chosen for the treatment. Introducing auxiliary variables to replace the absolute value terms and adding constraints ensure that the auxiliary variables are equivalent to the absolute value results when the optimization objective is optimal. The relaxation transformation results are:
P i , l ( t ) = j Ω i P i j , l ( t ) k Φ i ( P k i , l ( t ) R k i , l I k i , l ( t ) ) Q i , l ( t ) = j Ω i Q i j , l ( t ) k Φ i ( Q k i , l ( t ) X k i , l I k i , l ( t ) )
U i , l ( t ) U j , l ( t ) = 2 R i j , l P i j , l ( t ) + X i j , l Q i j , l ( t ) + I i j , l R i j , l 2 + X i j , l 2
0 I i j , l t I i j , l , max 2 U i , l , min 2 U i , j ( t ) U i , l , max 2
f 2 = j = 1 n j , l V j , l t   , j l
V j , l t 1 U j , l 2 ( t ) V j , l t U j , l 2 ( t ) 1
2 P k i , l ( t ) 2 Q k i , l ( t ) I k i , l ( t ) U i , l ( t ) I k i , j ( t ) + U i , l ( t )
Convert SNOP port capacity constraints to rotational axis cone constraints:
P s n o p .1 ( t ) 2 + Q s n o p .1 ( t ) 2 2 S s n o p . n 1 2 S s n o p . n 1 2 P s n o p .2 ( t ) 2 + Q s n o p .2 ( t ) 2 2 S s n o p . n 2 2 S s n o p . n 2 2 P s n o p .3 ( t ) 2 + Q s n o p .3 ( t ) 2 2 S s n o p . n 3 2 S s n o p . n 3 2
After the above steps, the solution is performed in a MATLAB R2023a environment using Yalmip programming and through the Gurobi solver. The objective function and constraints are linearized and convexified, respectively, and this convex model has a unique global optimal solution.

6. Example Analysis

6.1. Example Data

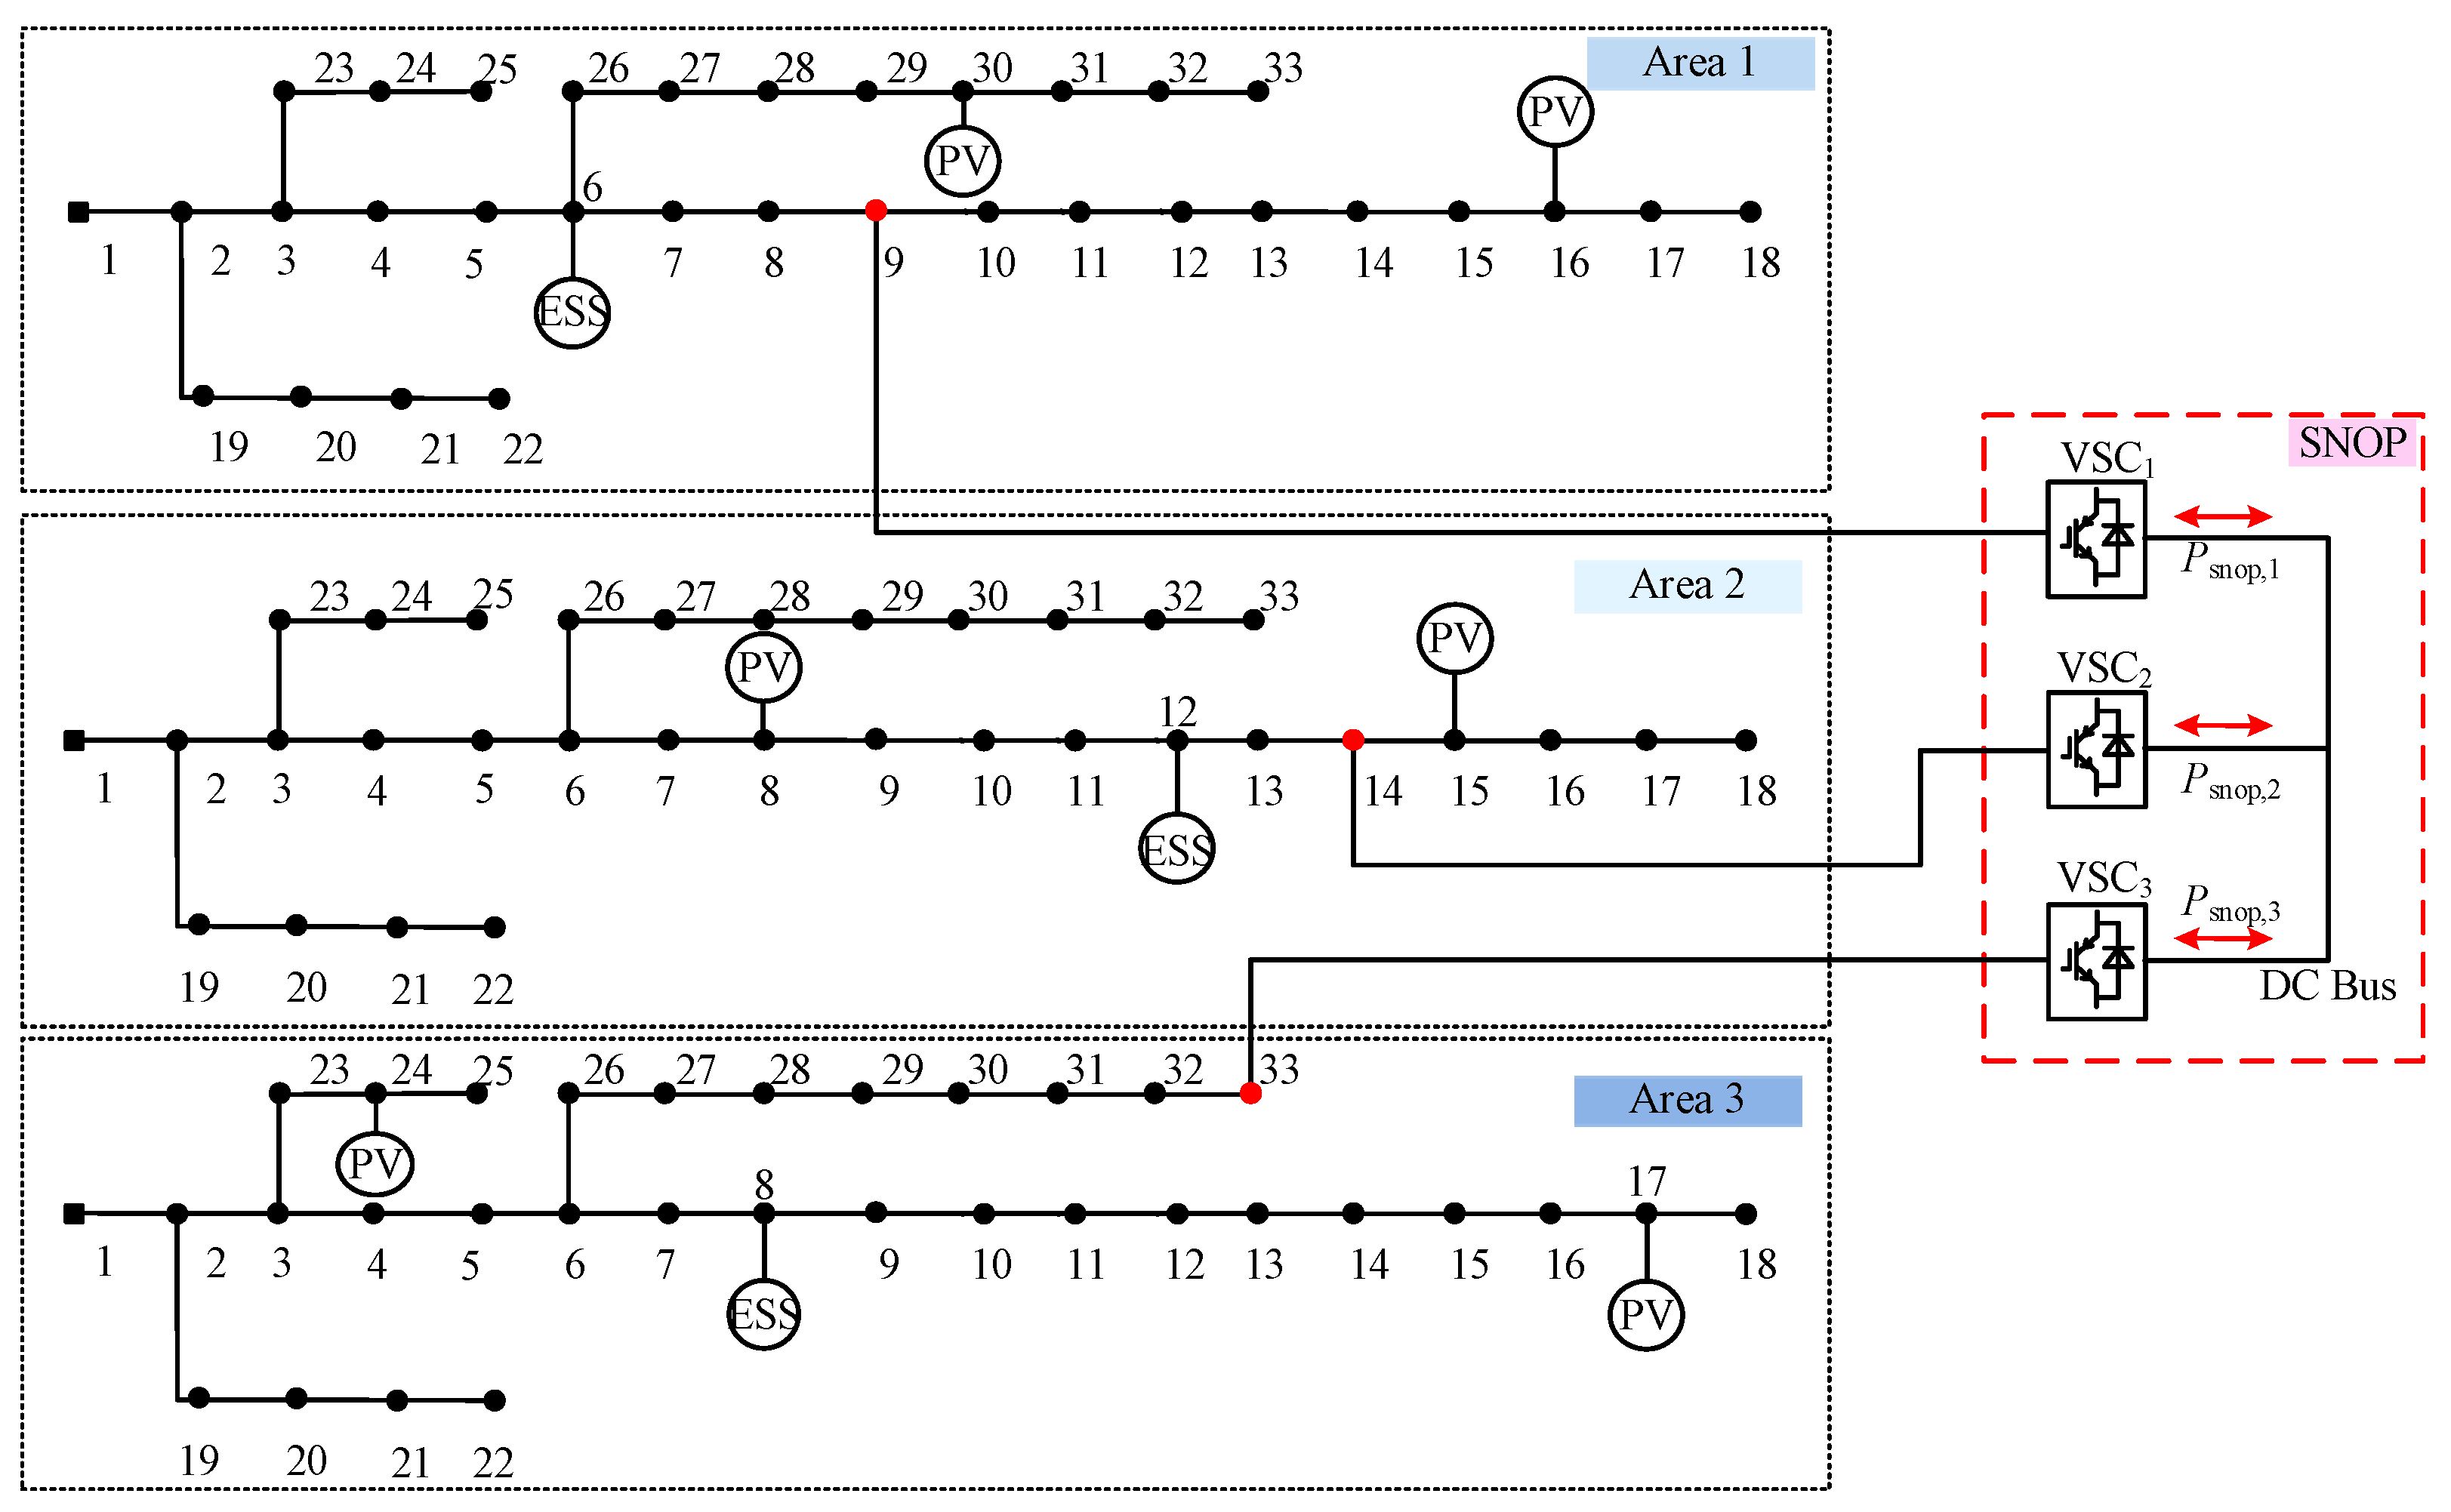
The method proposed in this paper is validated and analyzed by establishing a flexible interconnection with 3-port SNOPs and 3 regular IEEE 33 nodes (99 nodes in total) as a simulation example, the structure of which is shown in Figure 4.
Among them, the initial node 1 of each distribution station area is connected to the higher-level grid as a balancing node, and the rest of the nodes are the access nodes on the high-voltage side of the transformers of different distribution stations, and the transformer ratios Tl of each station area are 10/0.4 kV; 3-port SNOP flexible interconnection devices are accessed at the 9 nodes of the No.1 station area, the 14 nodes of the No.2 station area, and the 33 nodes of the No.3 station area; the PV devices with capacities of 2500 kW, 2500 kW, 1000 kW, 2000 kW, 800 kW, and 800 kW and 24 nodes are accessed at the 16 nodes of the No.1 station area, the 15 nodes of the No.8 station area, and the 17 nodes of the No.3 station area, respectively. Nodes 16 and 30 of station area 1, nodes 8 and 15 of station area 2, and nodes 17 and 24 of station area 3 are connected to photovoltaic devices, with capacities of 2500 kW, 2500 kW, 1000 kW, 2000 kW, 800 kW, and 800 kW, respectively; node 6 of station area 1, node 12 of station area 2, and node 8 of station area 3 are connected to energy storage devices, with rated capacities of 500 kW, 800 kW, and 600 kW, respectively; the output power and voltage amplitude in this paper adopt the standardized value. In this paper, time-sharing tariffs are used in the calculation of costs to improve the accuracy of the model and the effect of the actual application process.

6.2. Comparison and Analysis of Example Results

In order to verify the effectiveness and superiority of the proposed dynamic weights multi-level optimization scheduling strategy, this paper designs a total of three application scenarios for comparative analysis of different scheduling schemes under three different transgression levels.
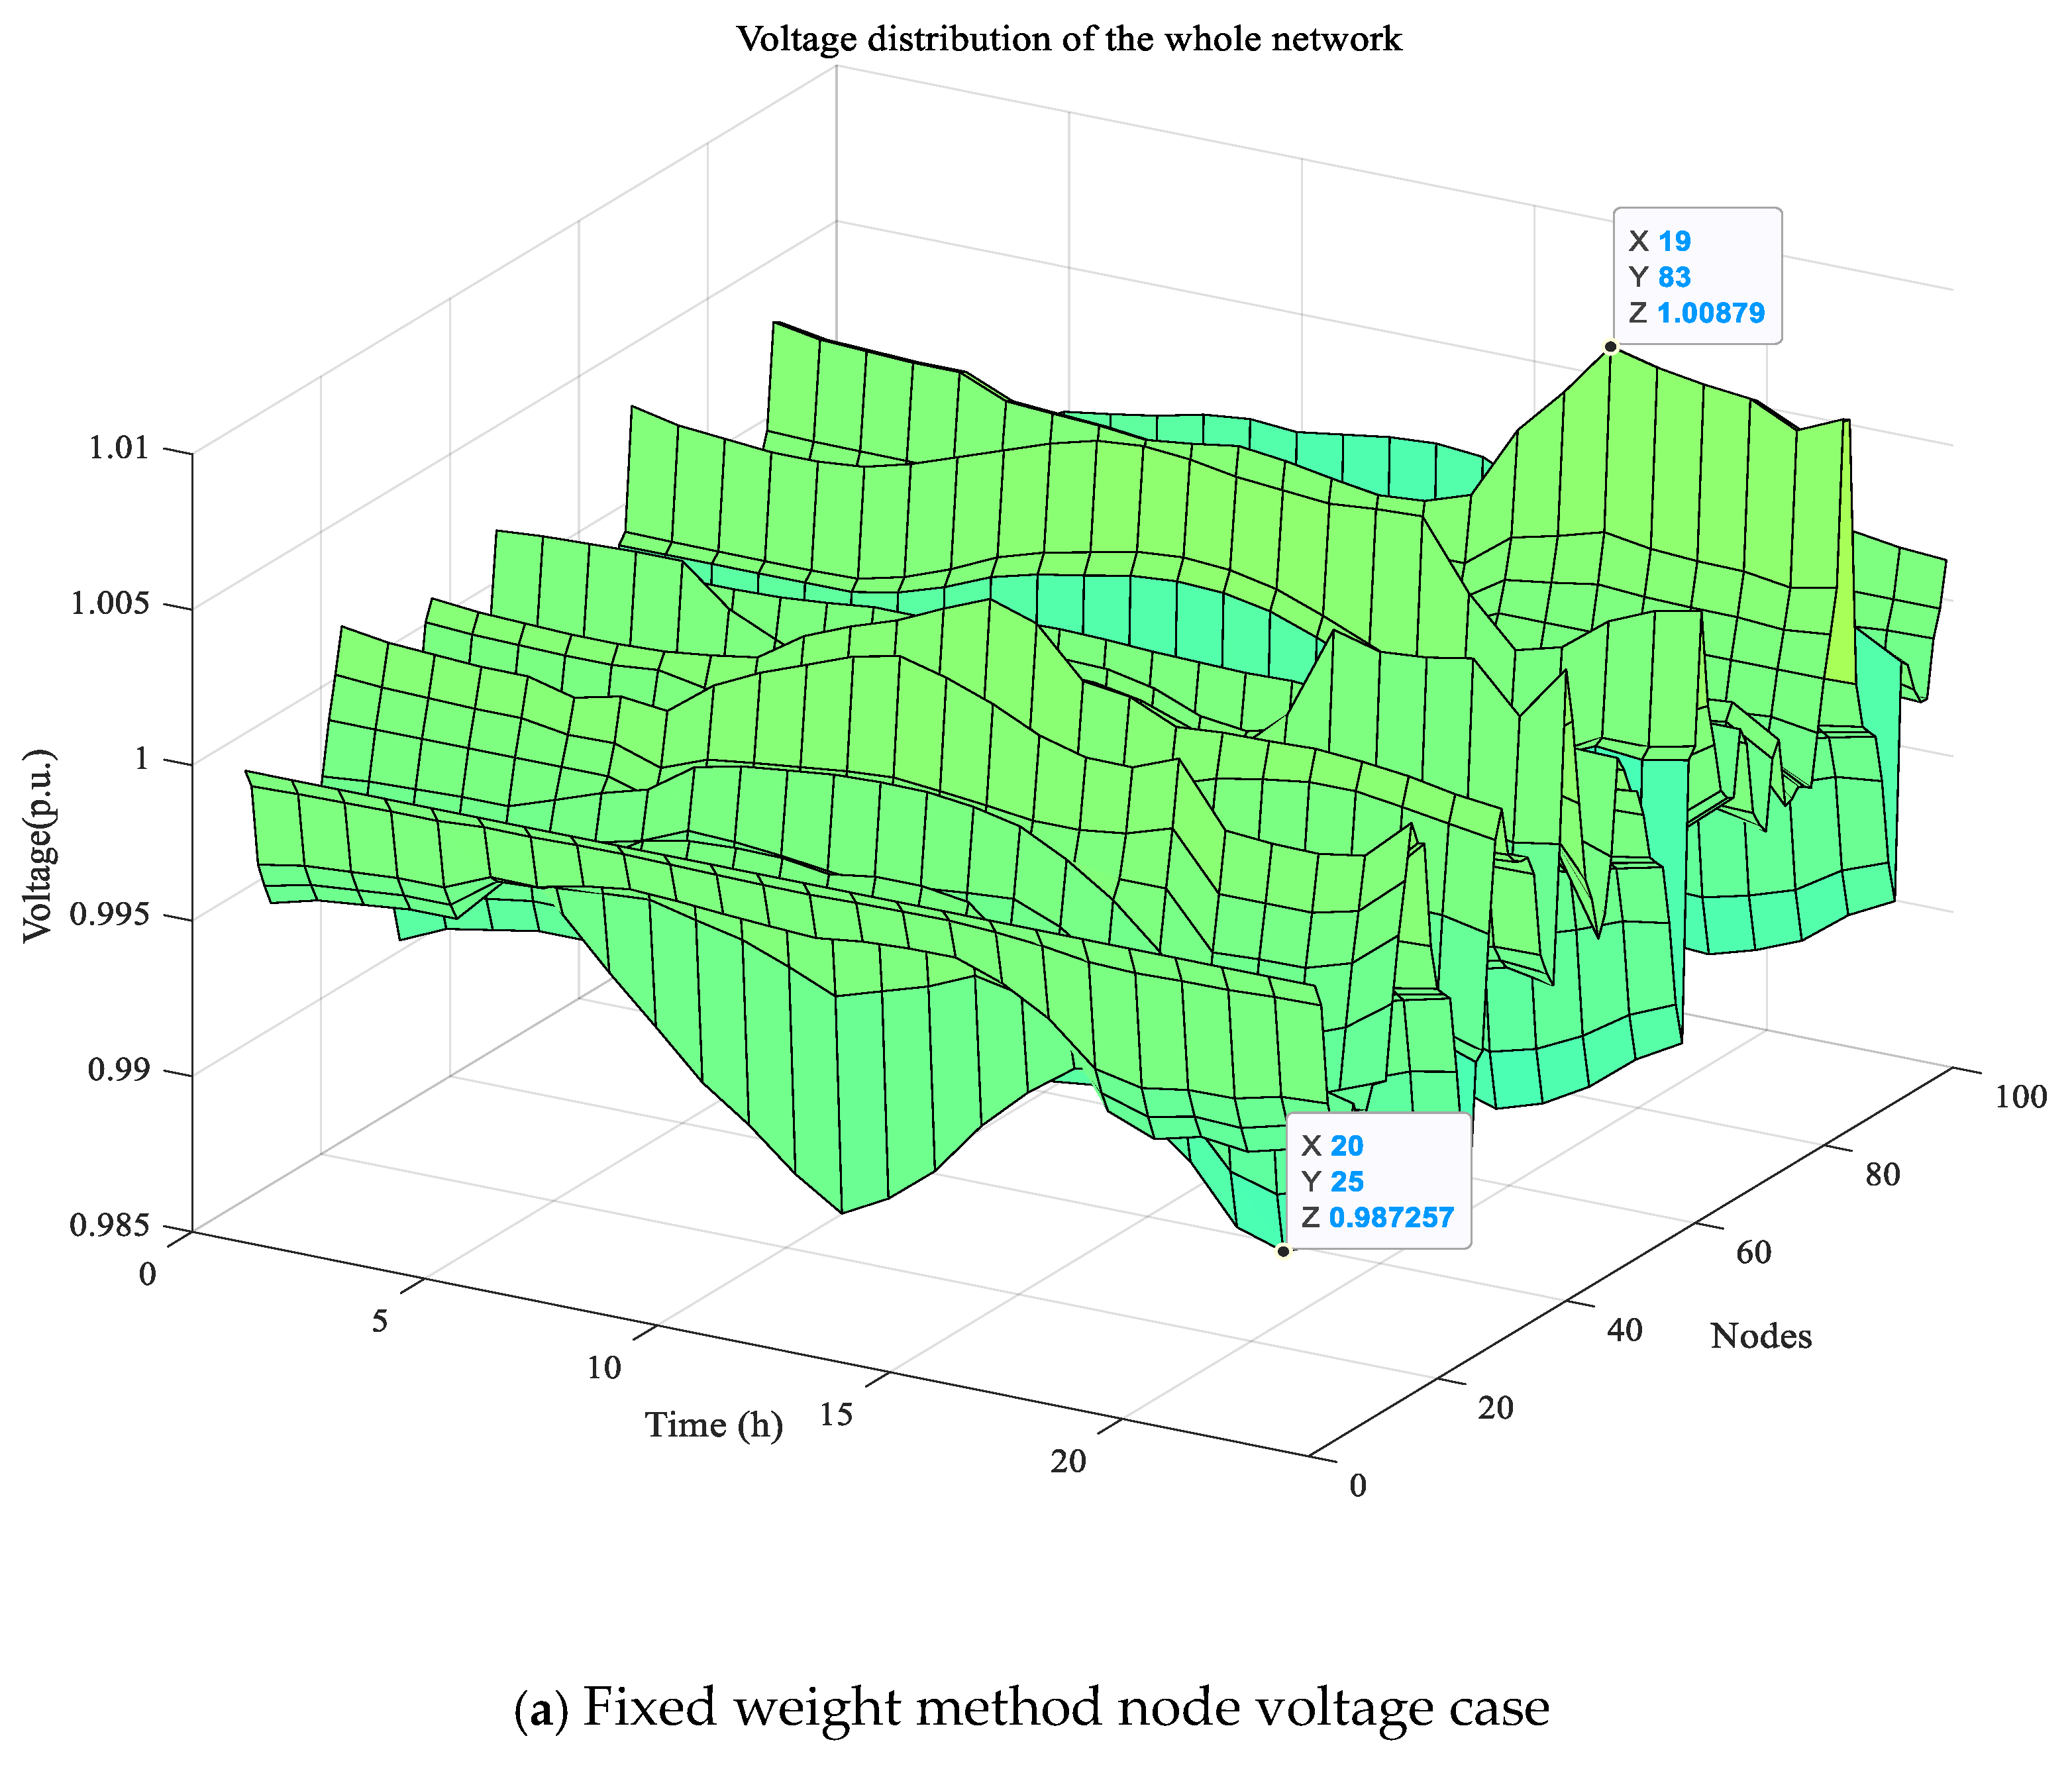
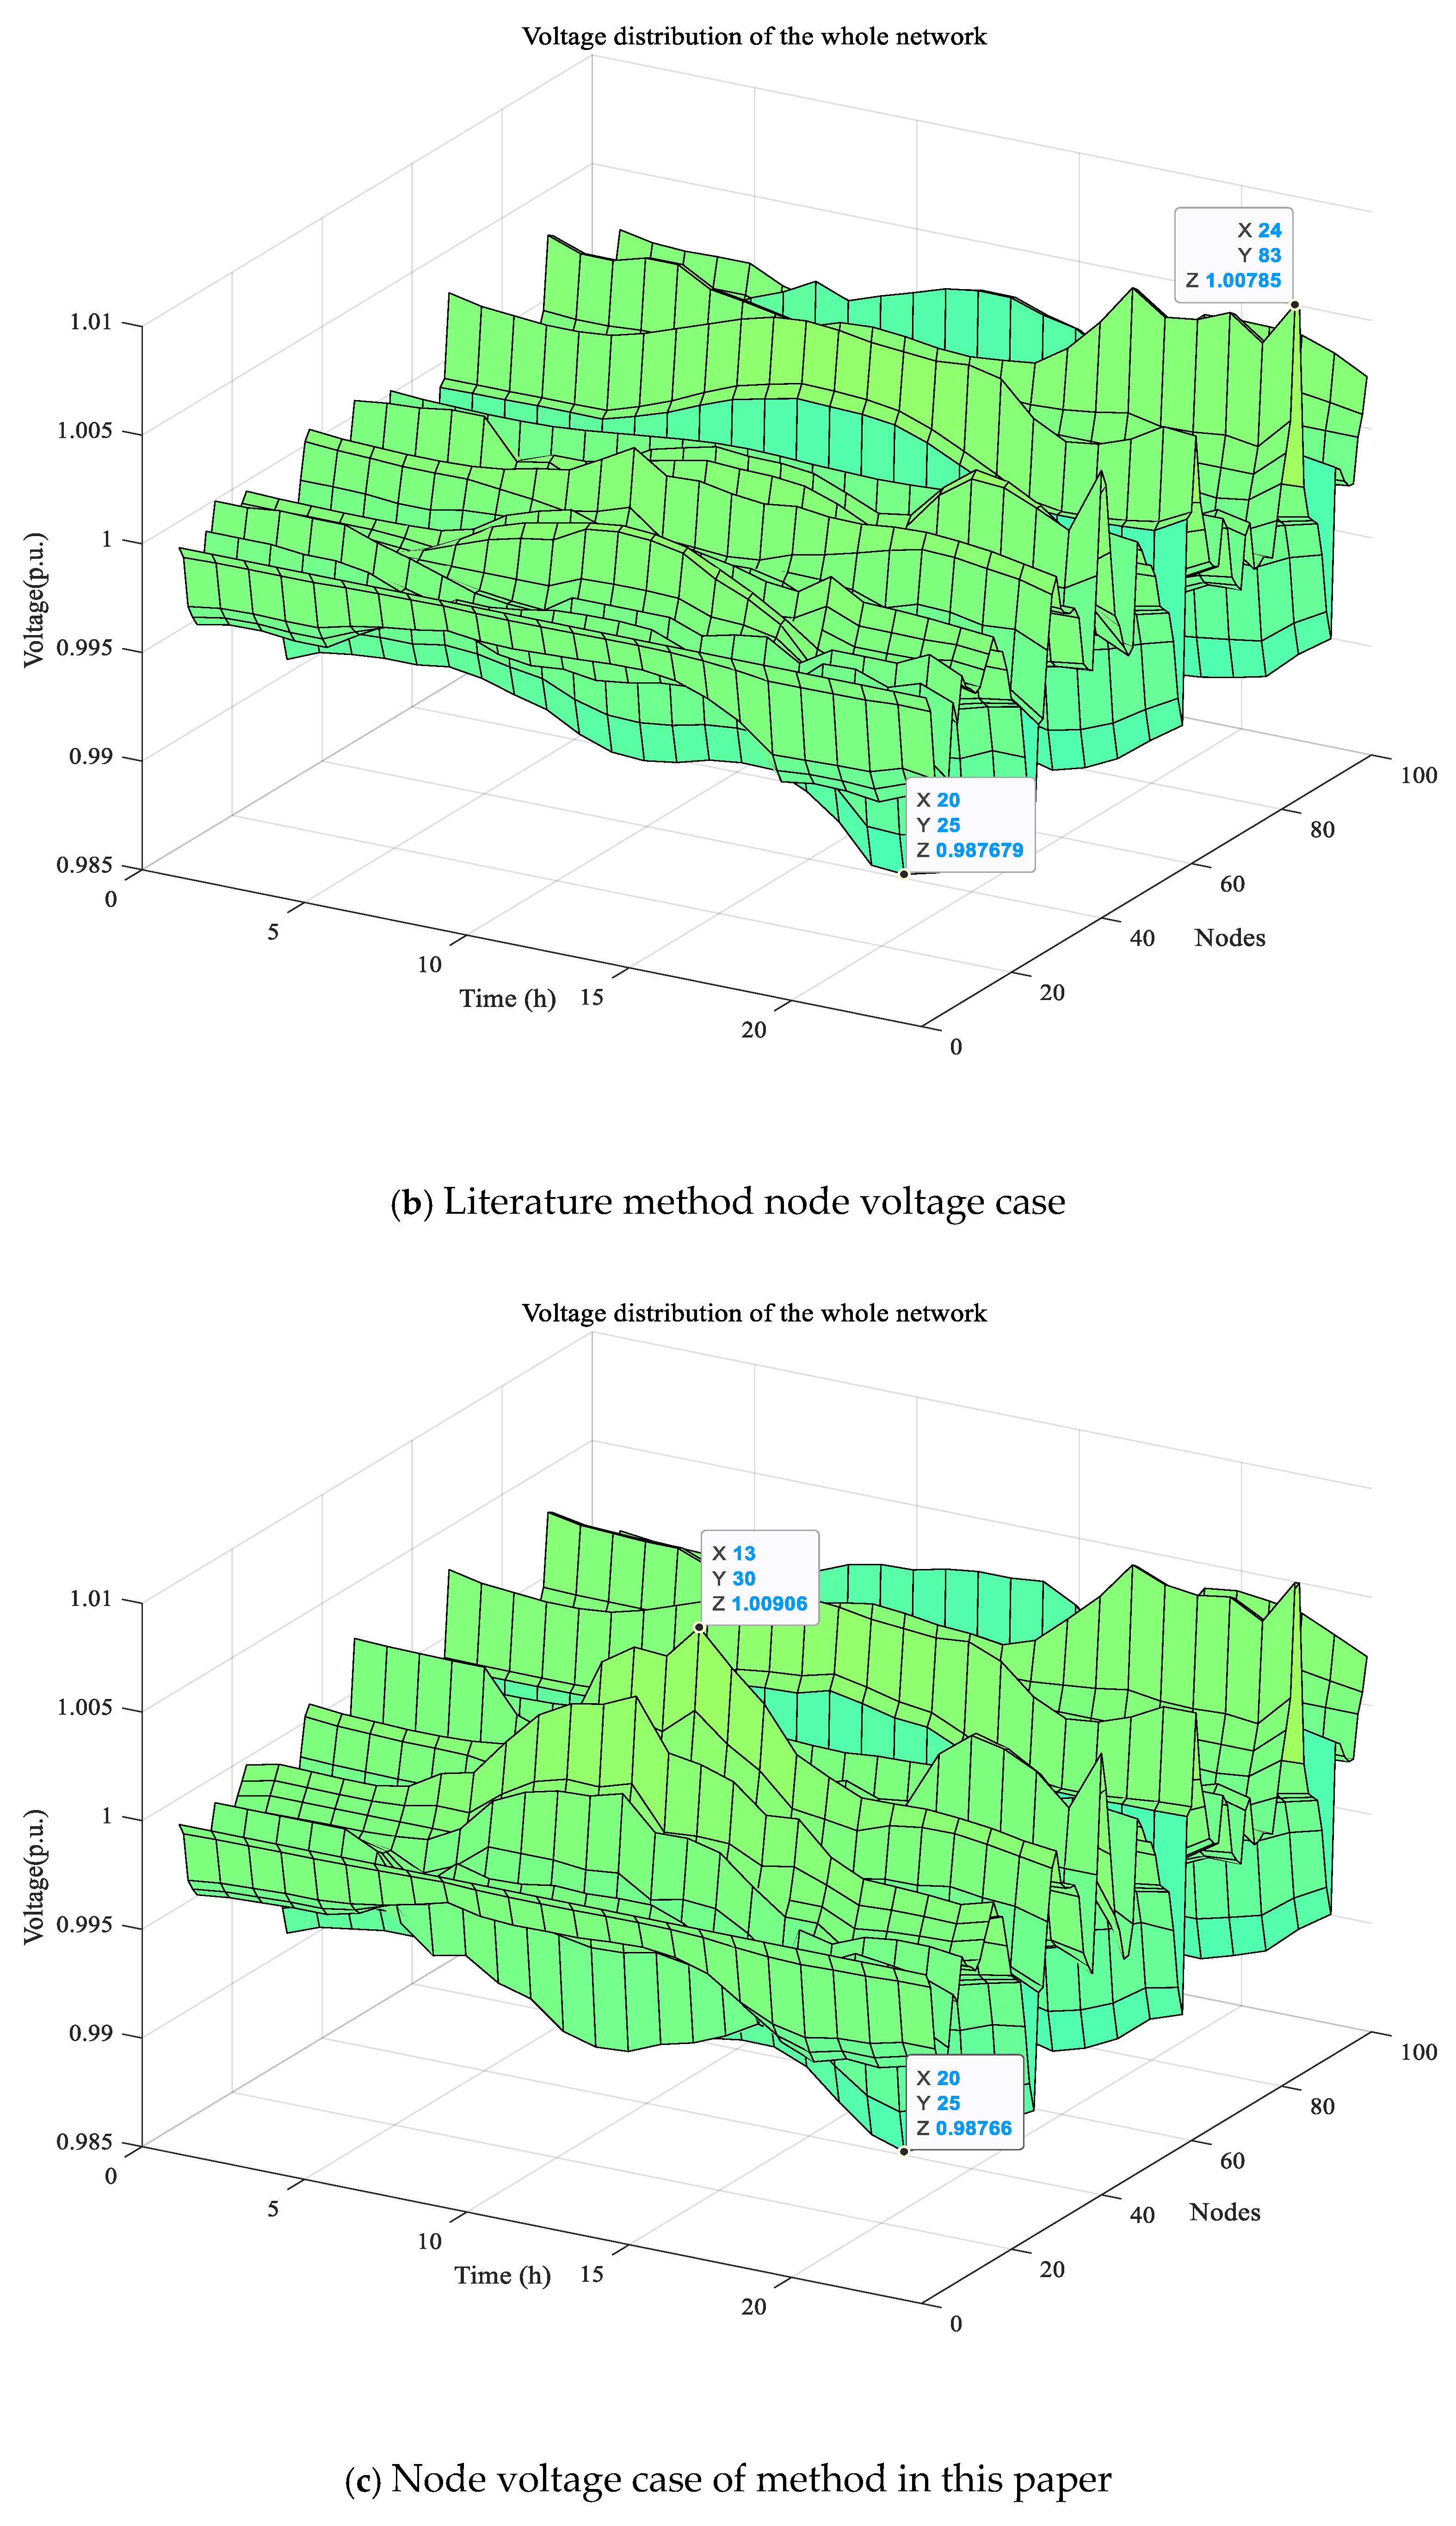
(1) Scenario 1: When the load and DG are normally connected, the flexible interconnected distribution station area is always at the normal operation level when the voltage deviation is within ±5% of the rated voltage UN, and the highest node voltage is 1.048 UN and the lowest node voltage is 0.952 UN. Using the optimized scheduling method of the fixed equal weight coefficients, the adaptive weight optimized scheduling method of the literature [26] and the optimization proposed by this paper’s scheduling strategy are compared, and the voltage of each node is shown in Figure 5a–c.
As can be seen from the figure, the highest node voltages of the three optimized scheduling methods, respectively, are 1.0088 UN, 1.0079 UN, and 1.0088 UN, and the lowest lower limit is also maintained at the level of 0.987 UN, and there is almost no difference between the voltage deviation levels of the three methods at this operation level; the total system regulation capability indexes in each method are 0.697, 0.350, and 0.691, respectively. It indicates that the SNOP in this paper’s method is more involved in the power support of each distribution station compared to the fixed weight method. In addition, the total system cost, total time used, and convergence are shown in Table 2.
According to the optimization results in the table, the total system operation cost of this paper’s optimal scheduling method under this operation level is CNY 65,768.22, with a total of 20 iterations, and the convergence interval is 0.0000716% at 41.79 s, which ensures that the voltages of each node are at the normal operation level, and at the same time, it improves the economy of the system operation compared to the other two methods and guarantees the interconnection system operation time requirements and convergence requirements.
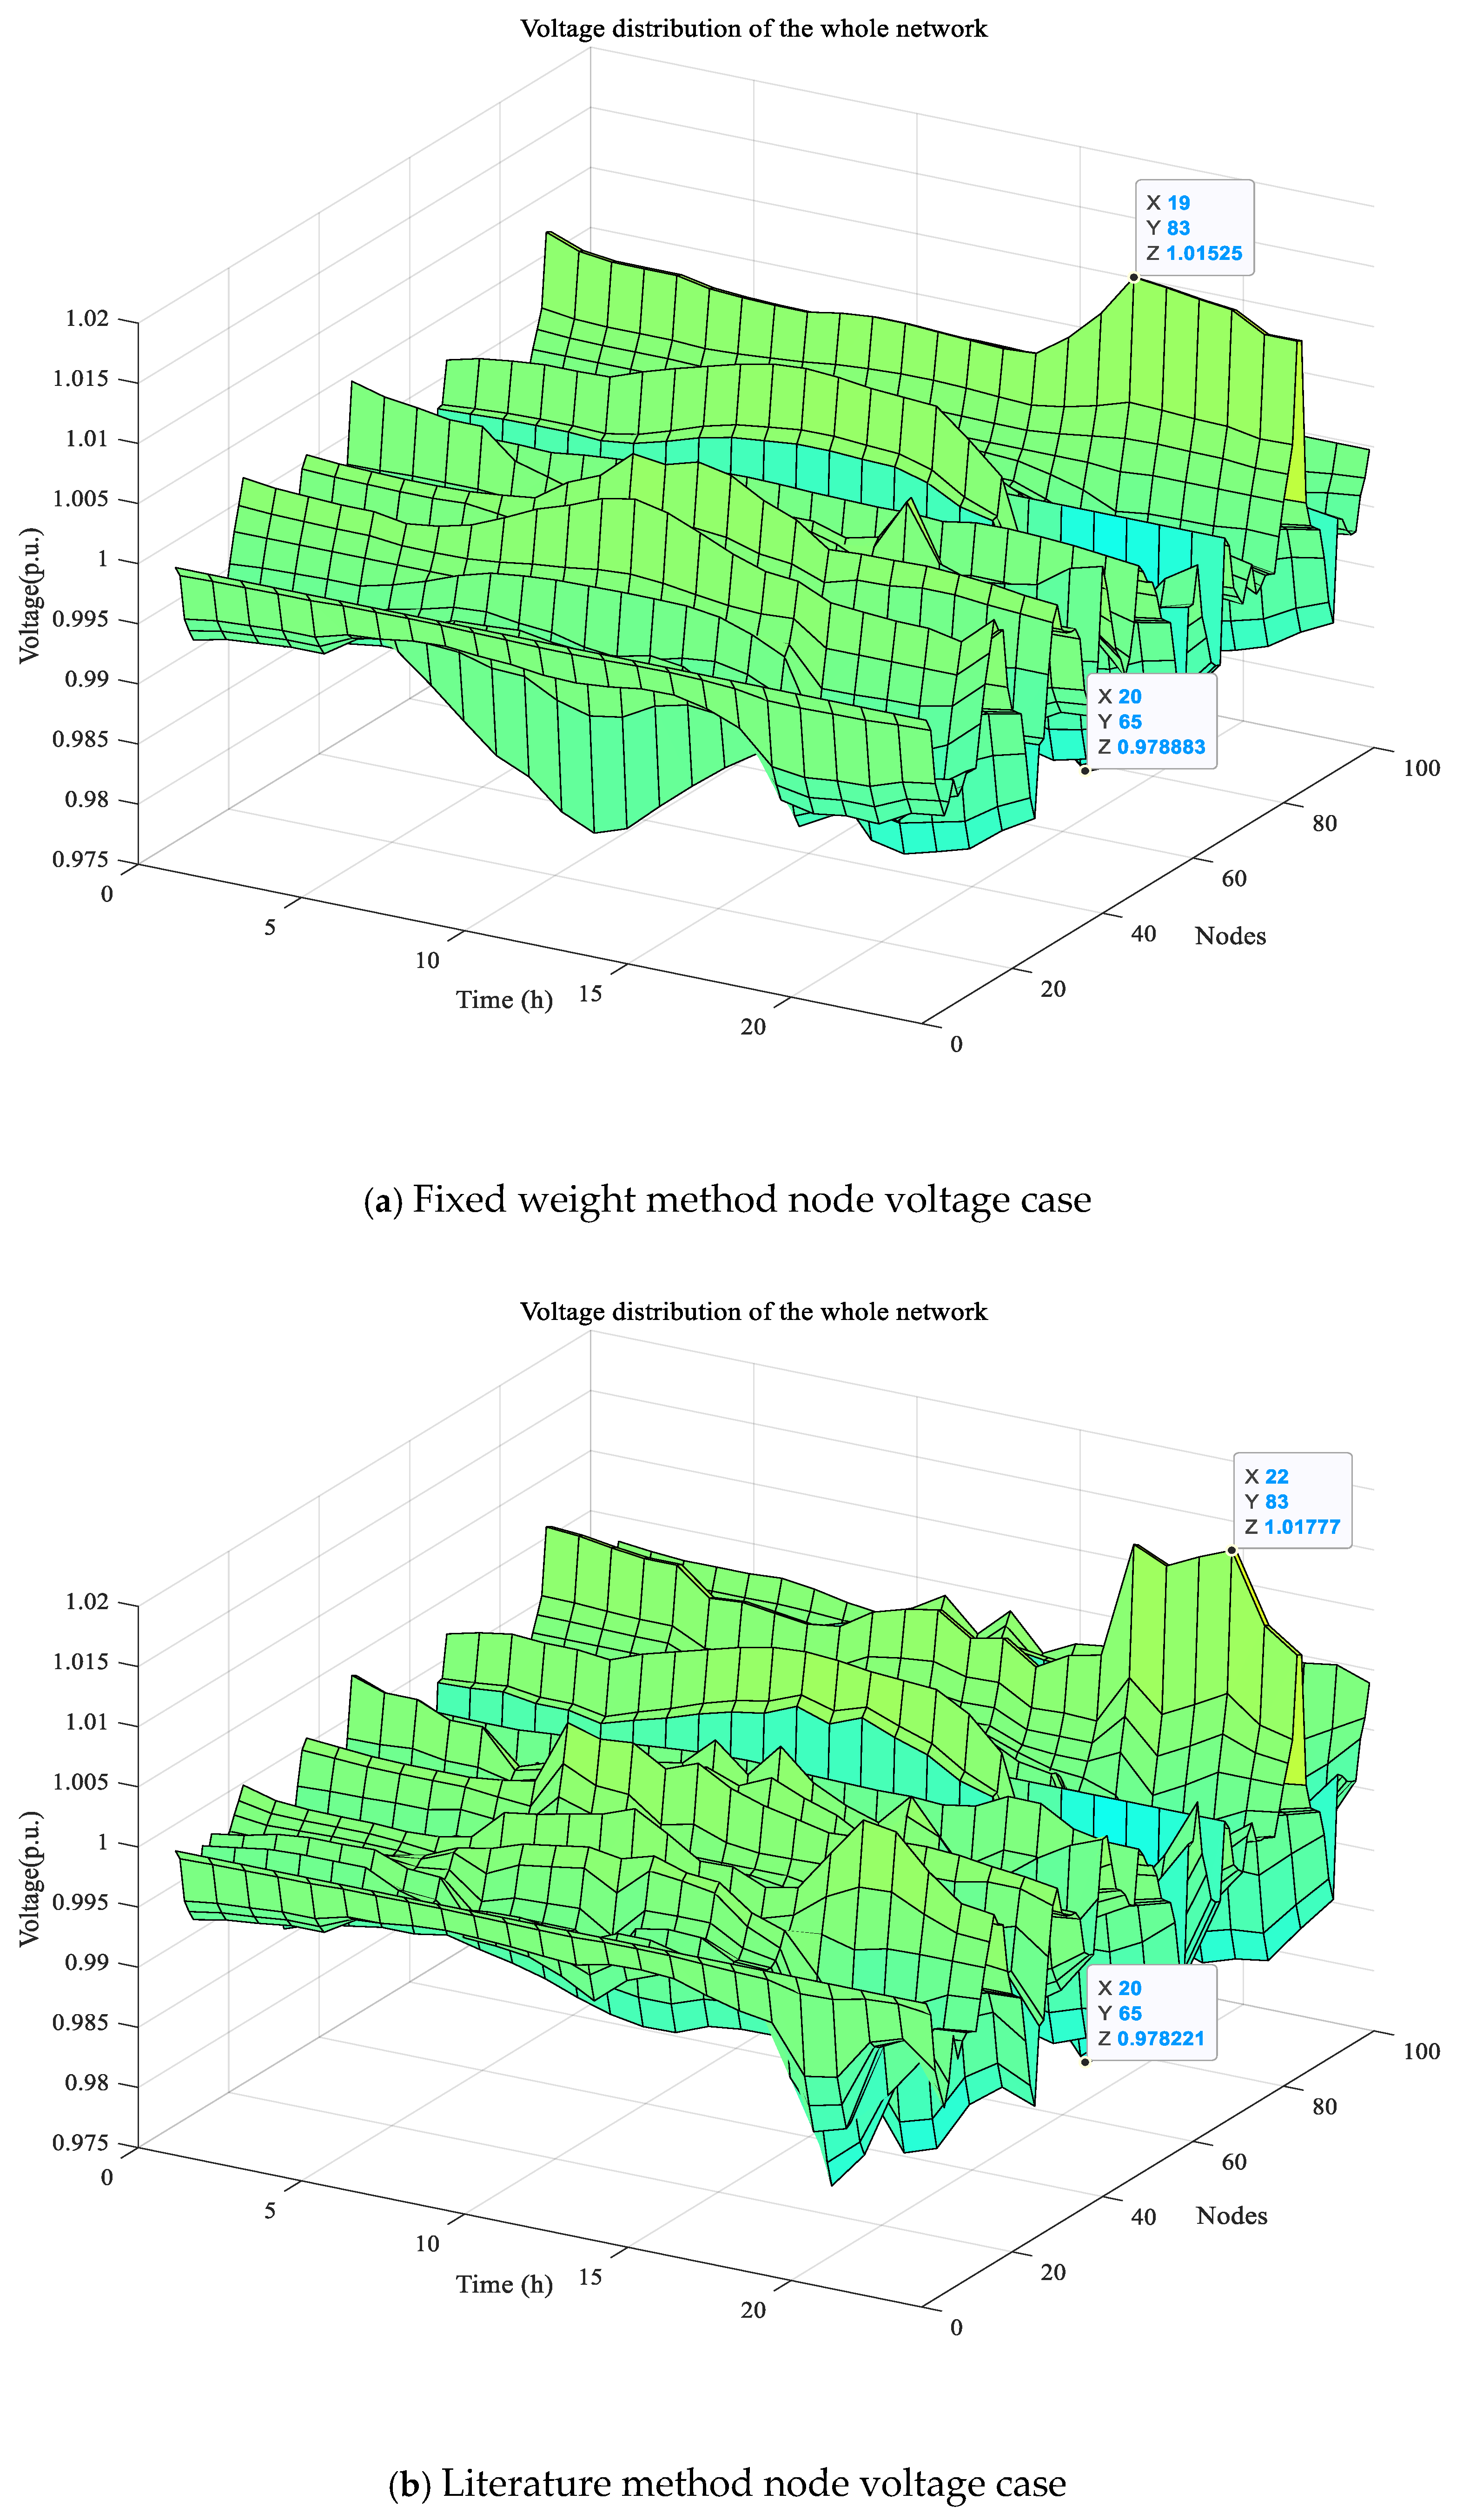
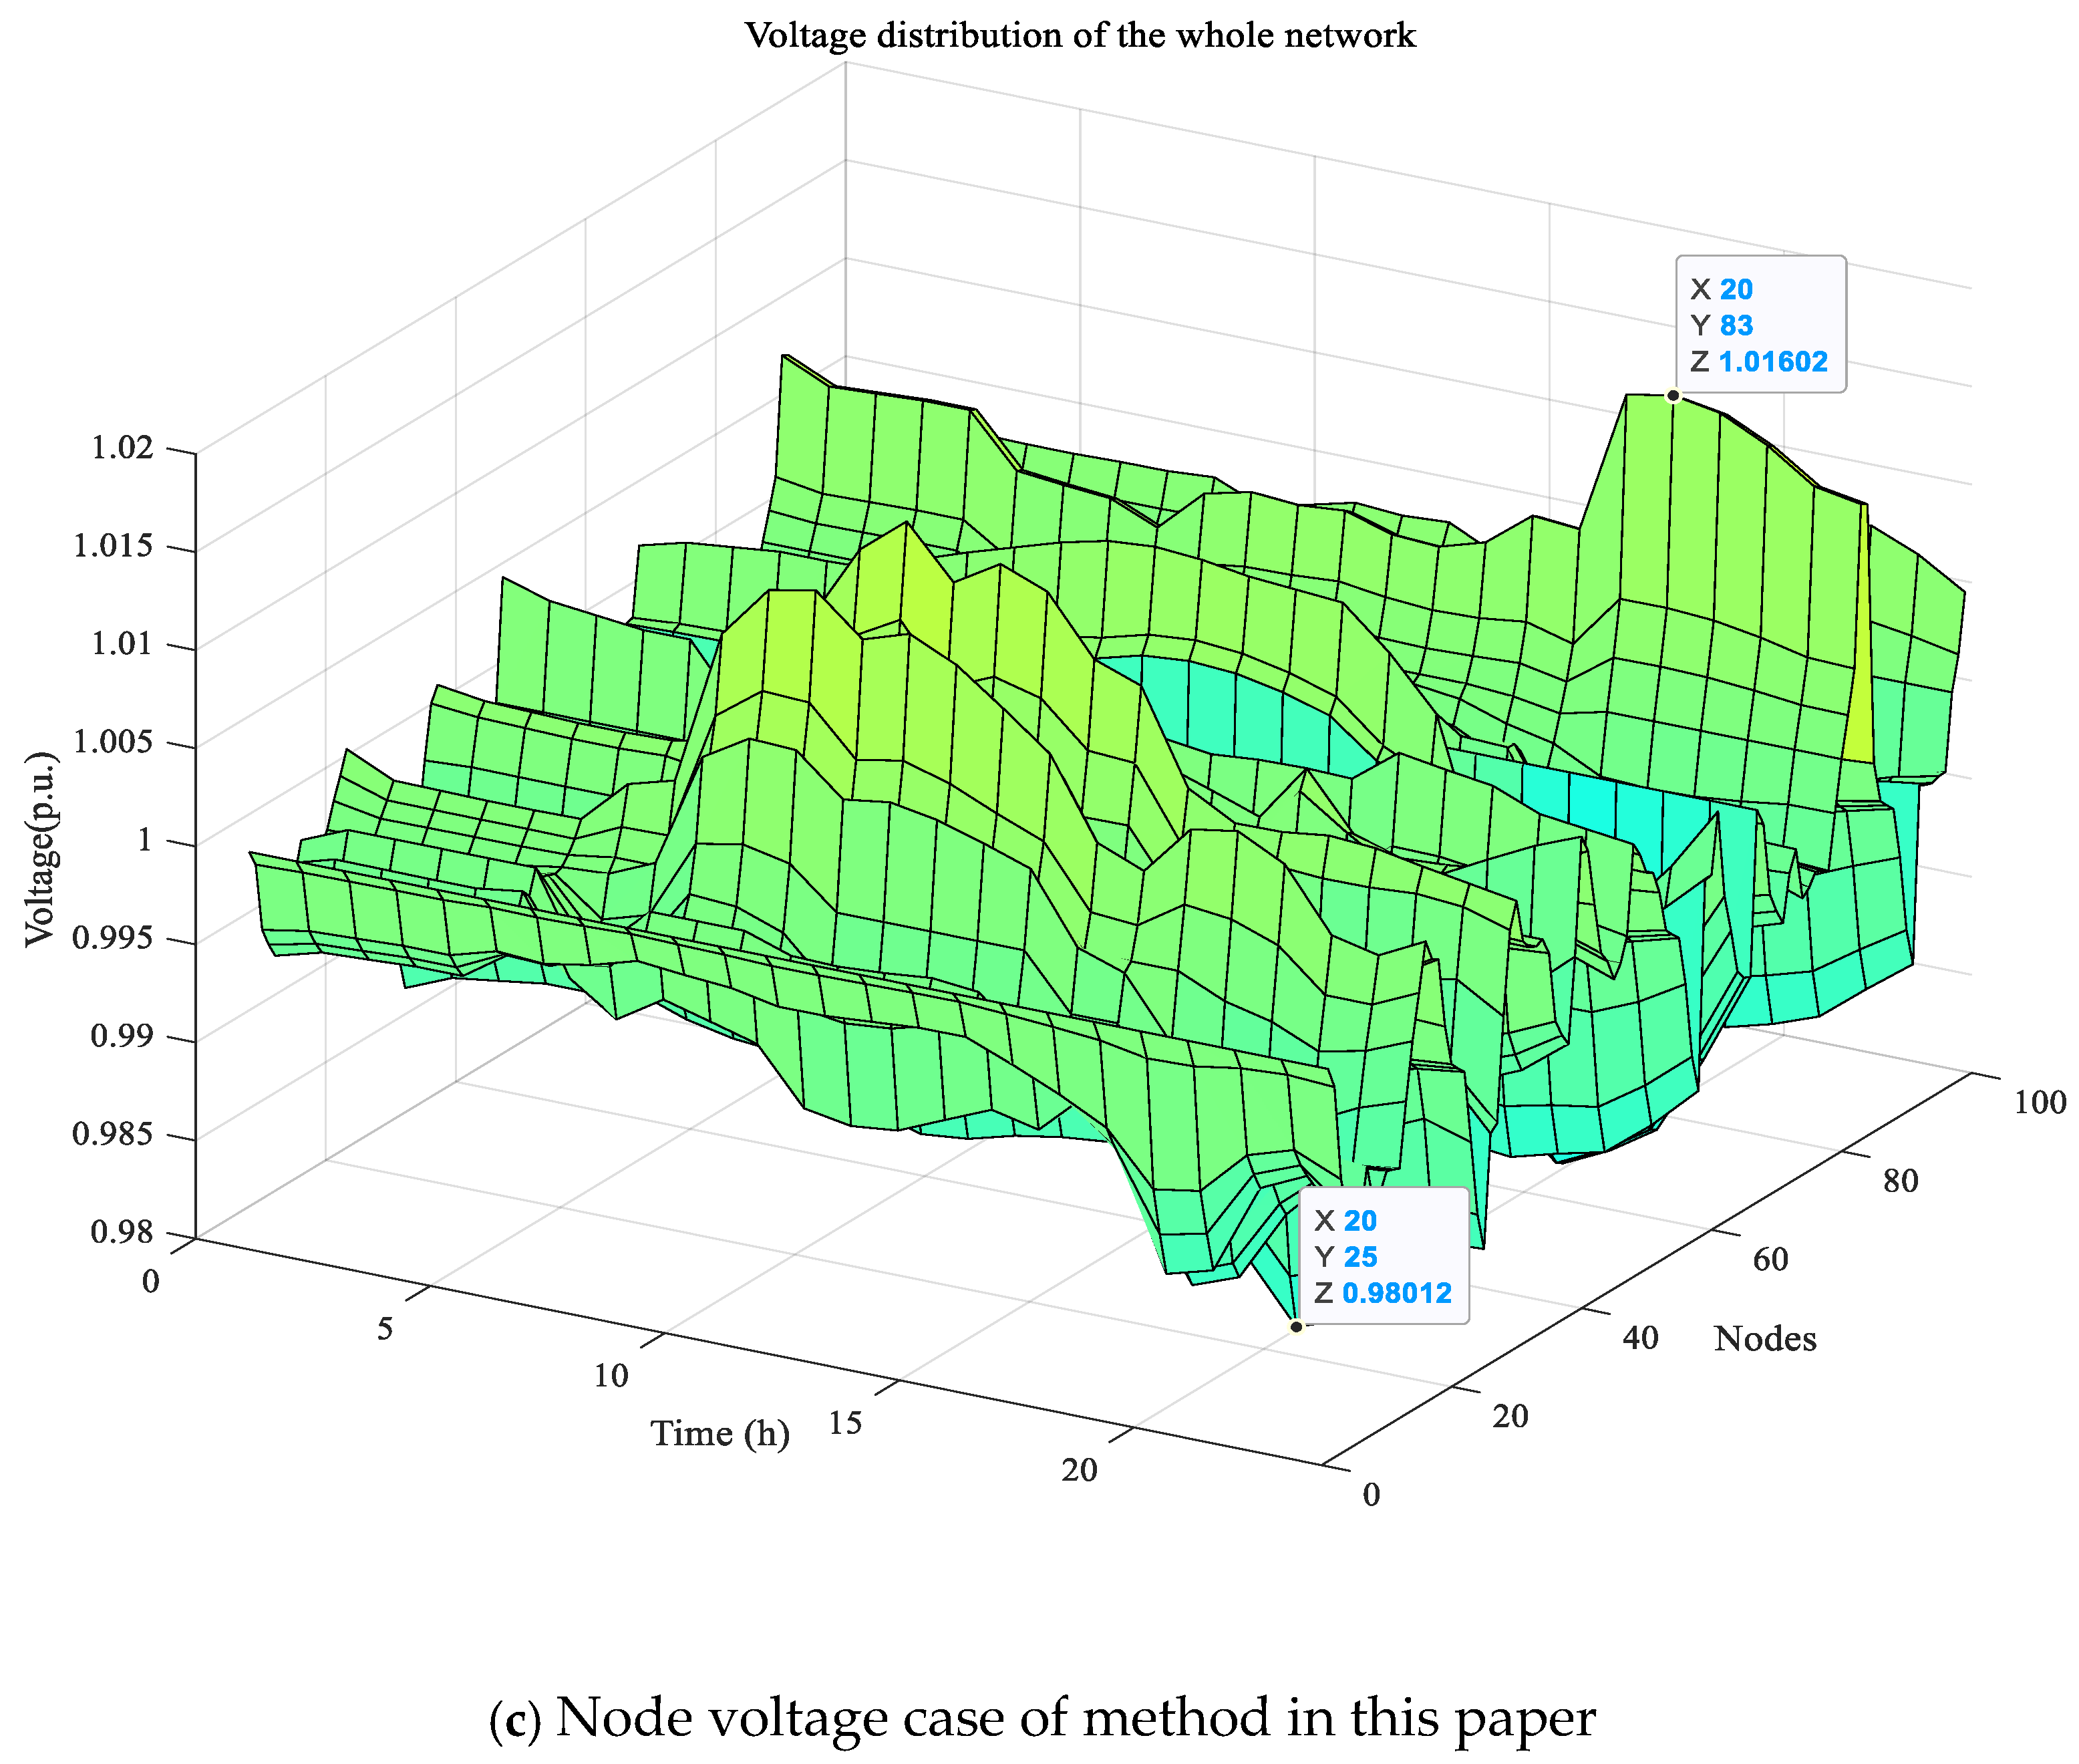
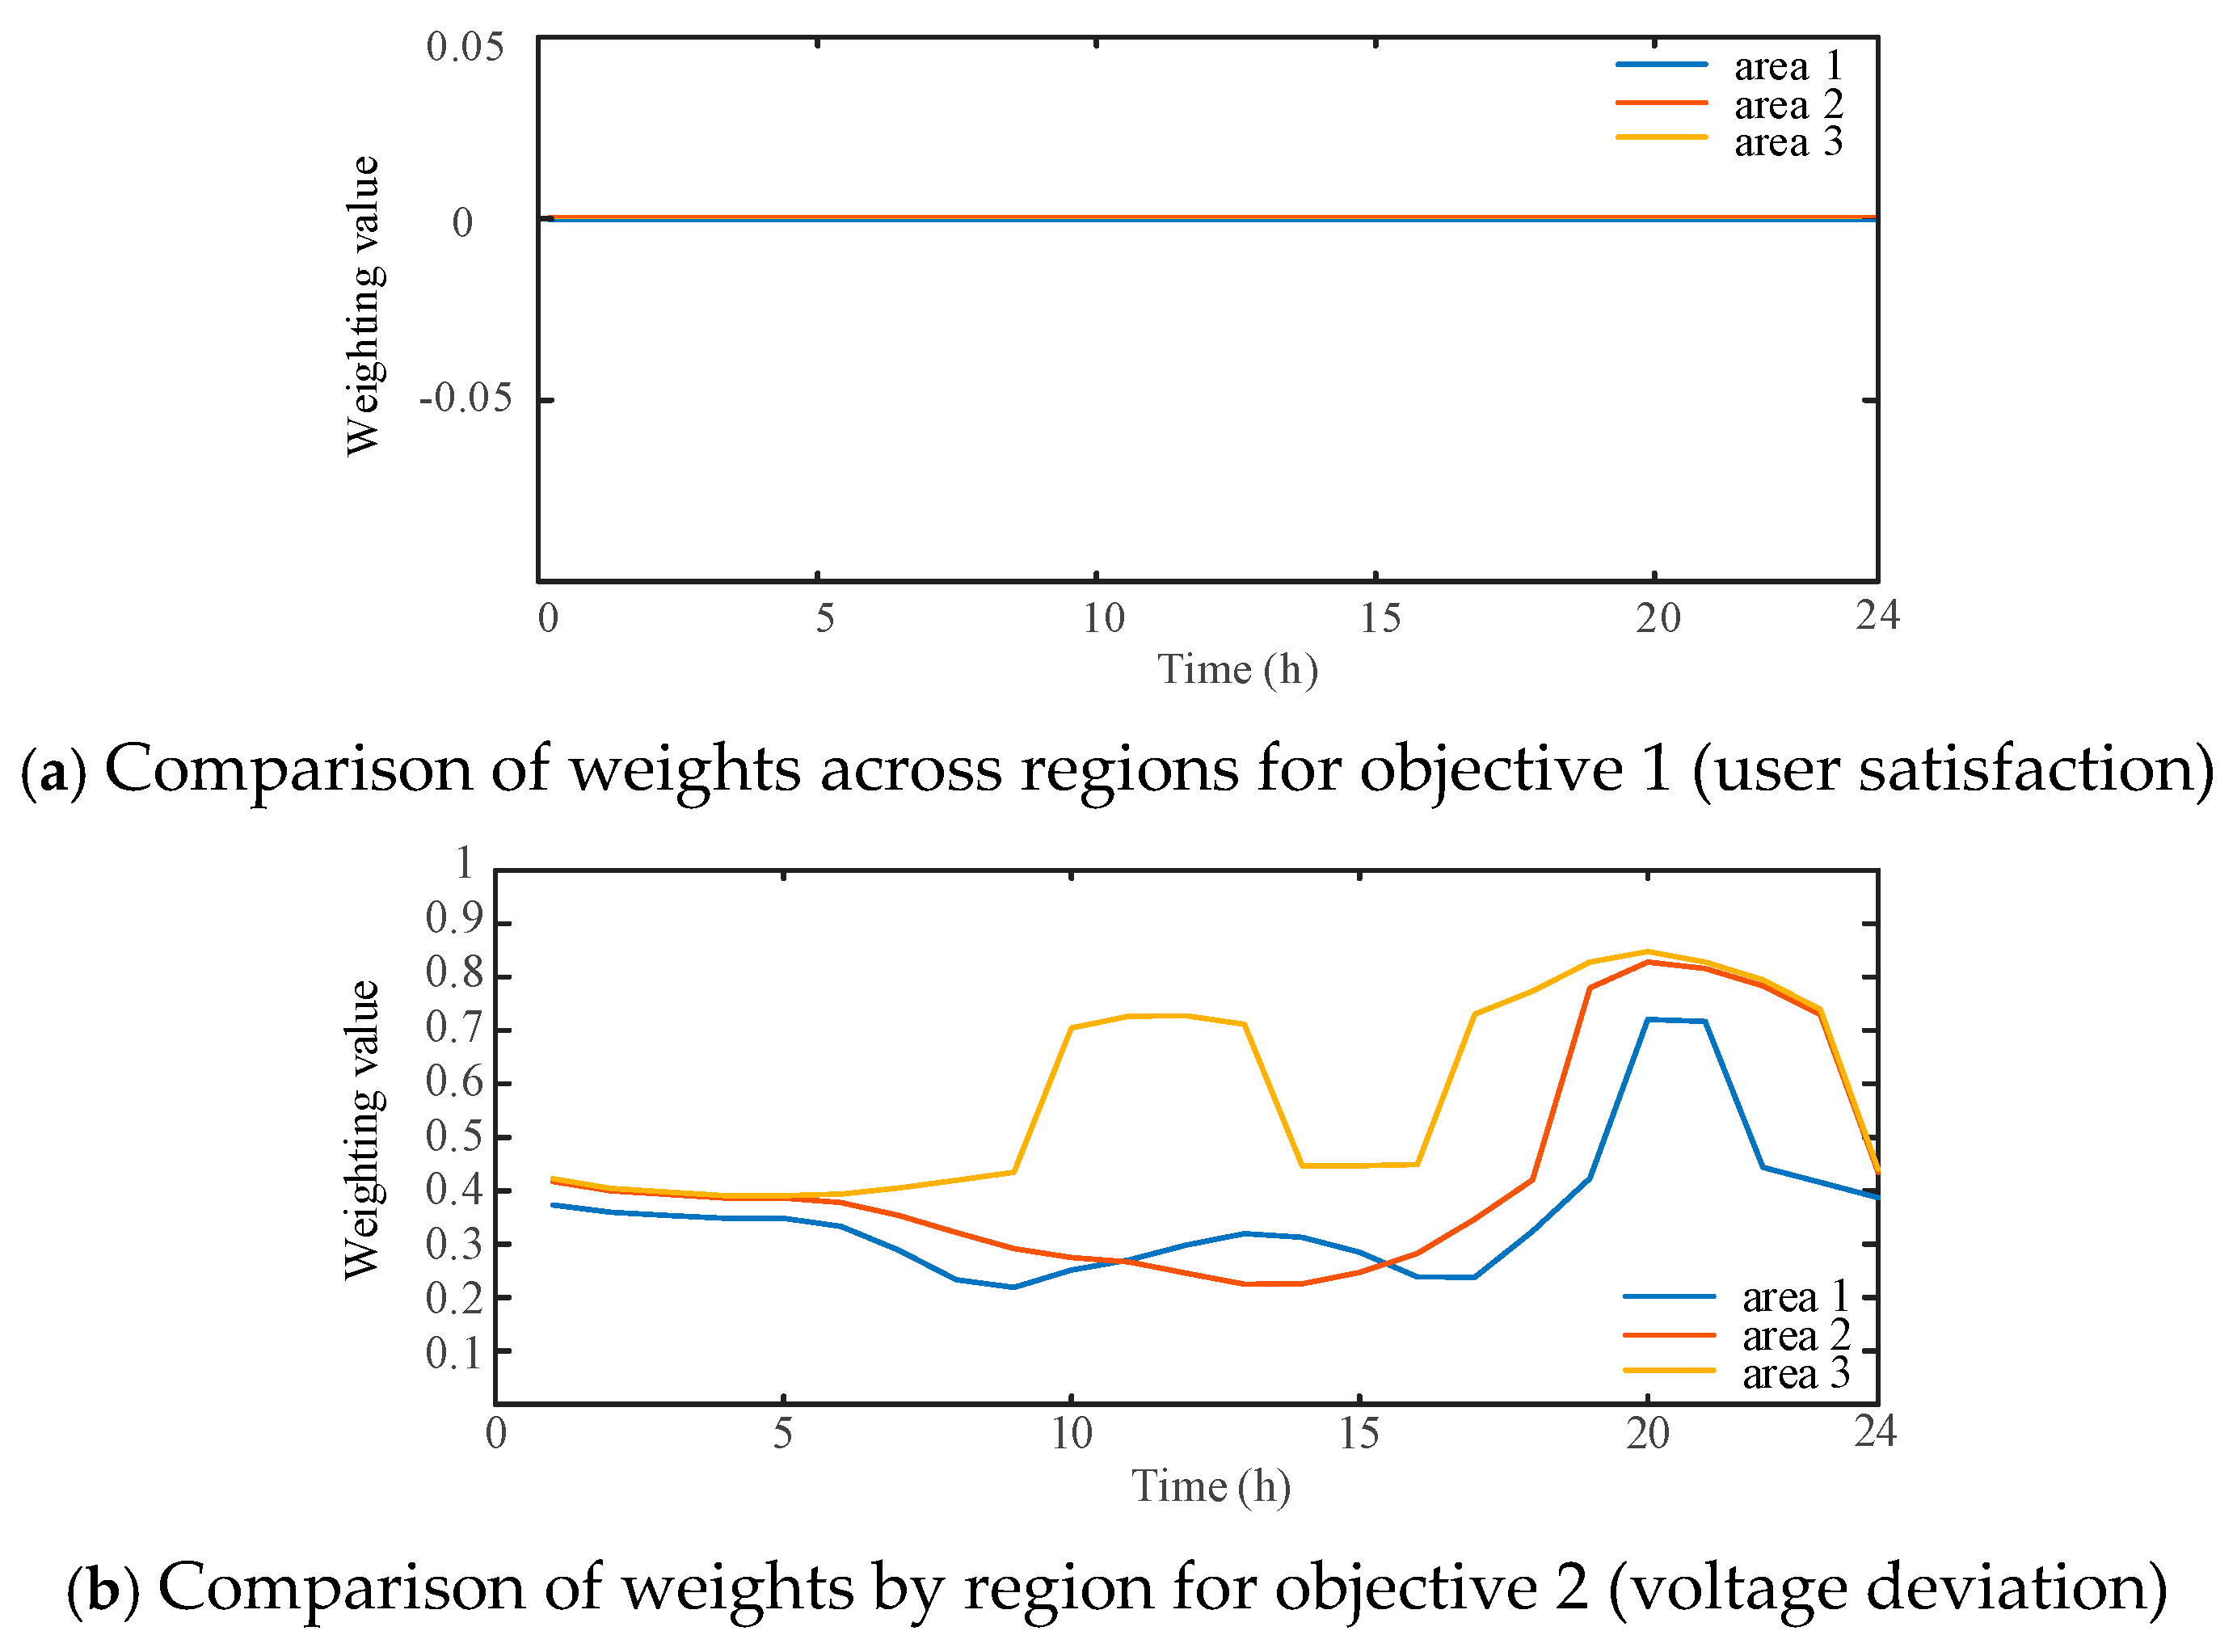
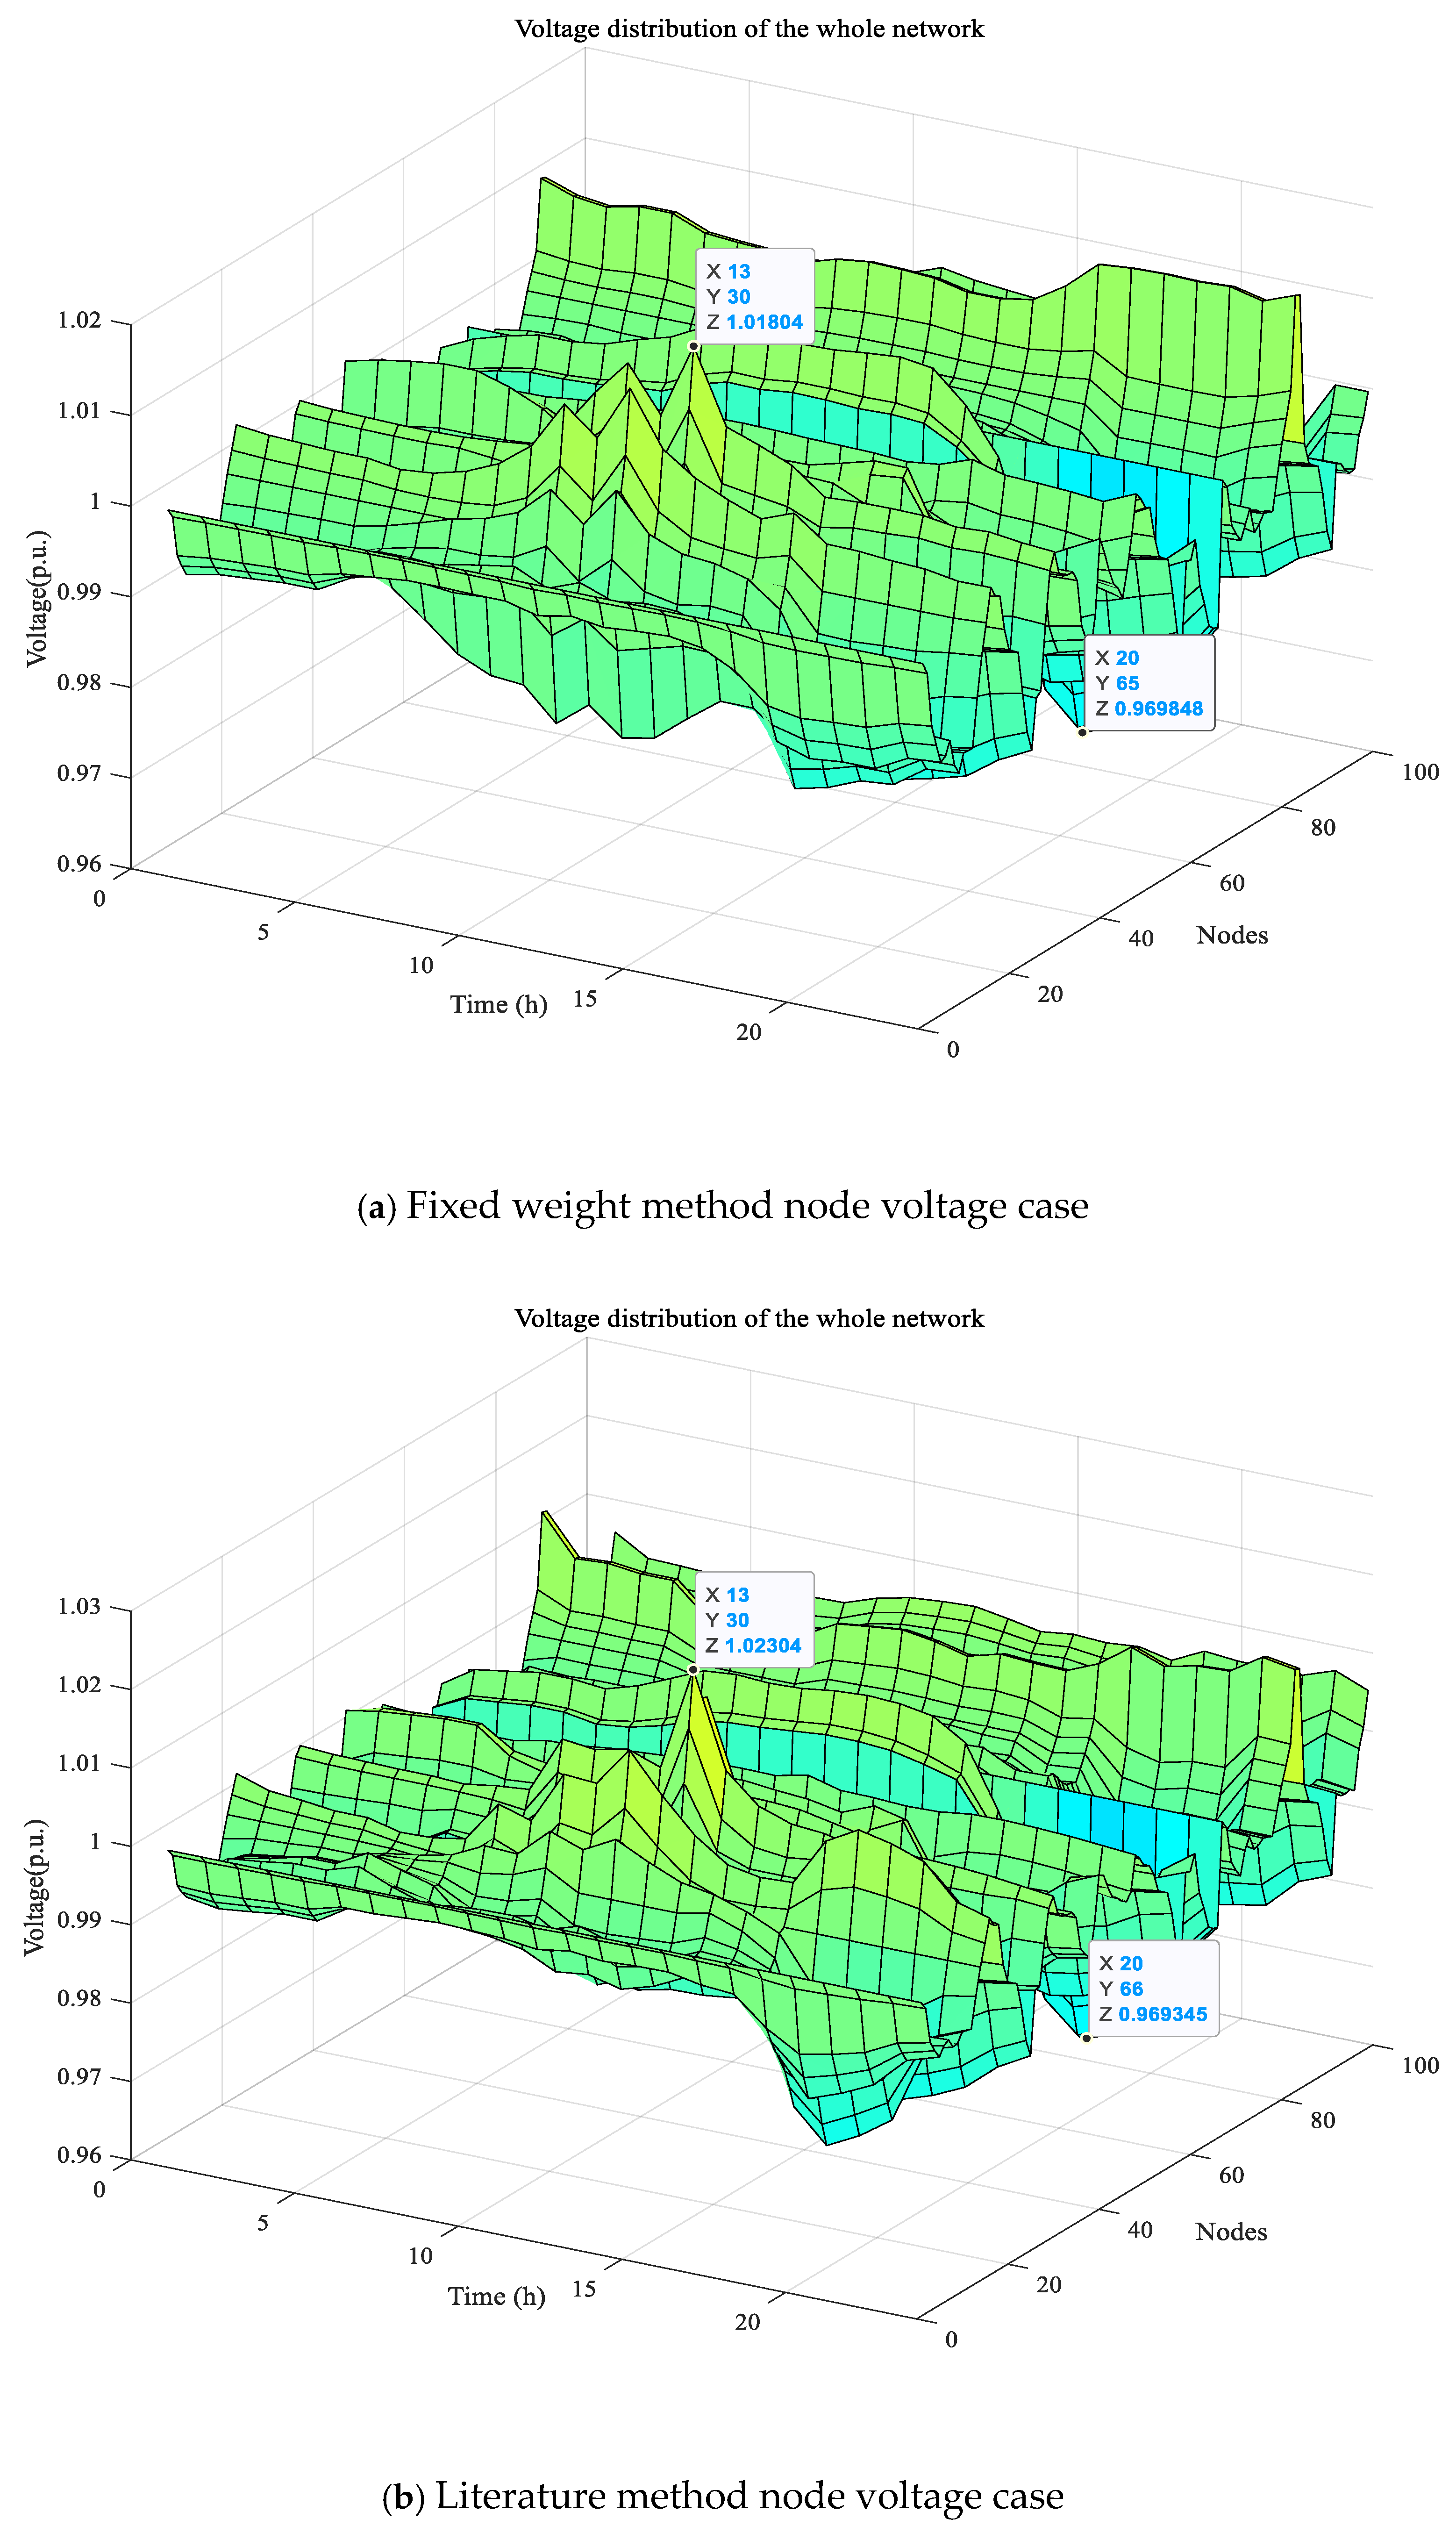
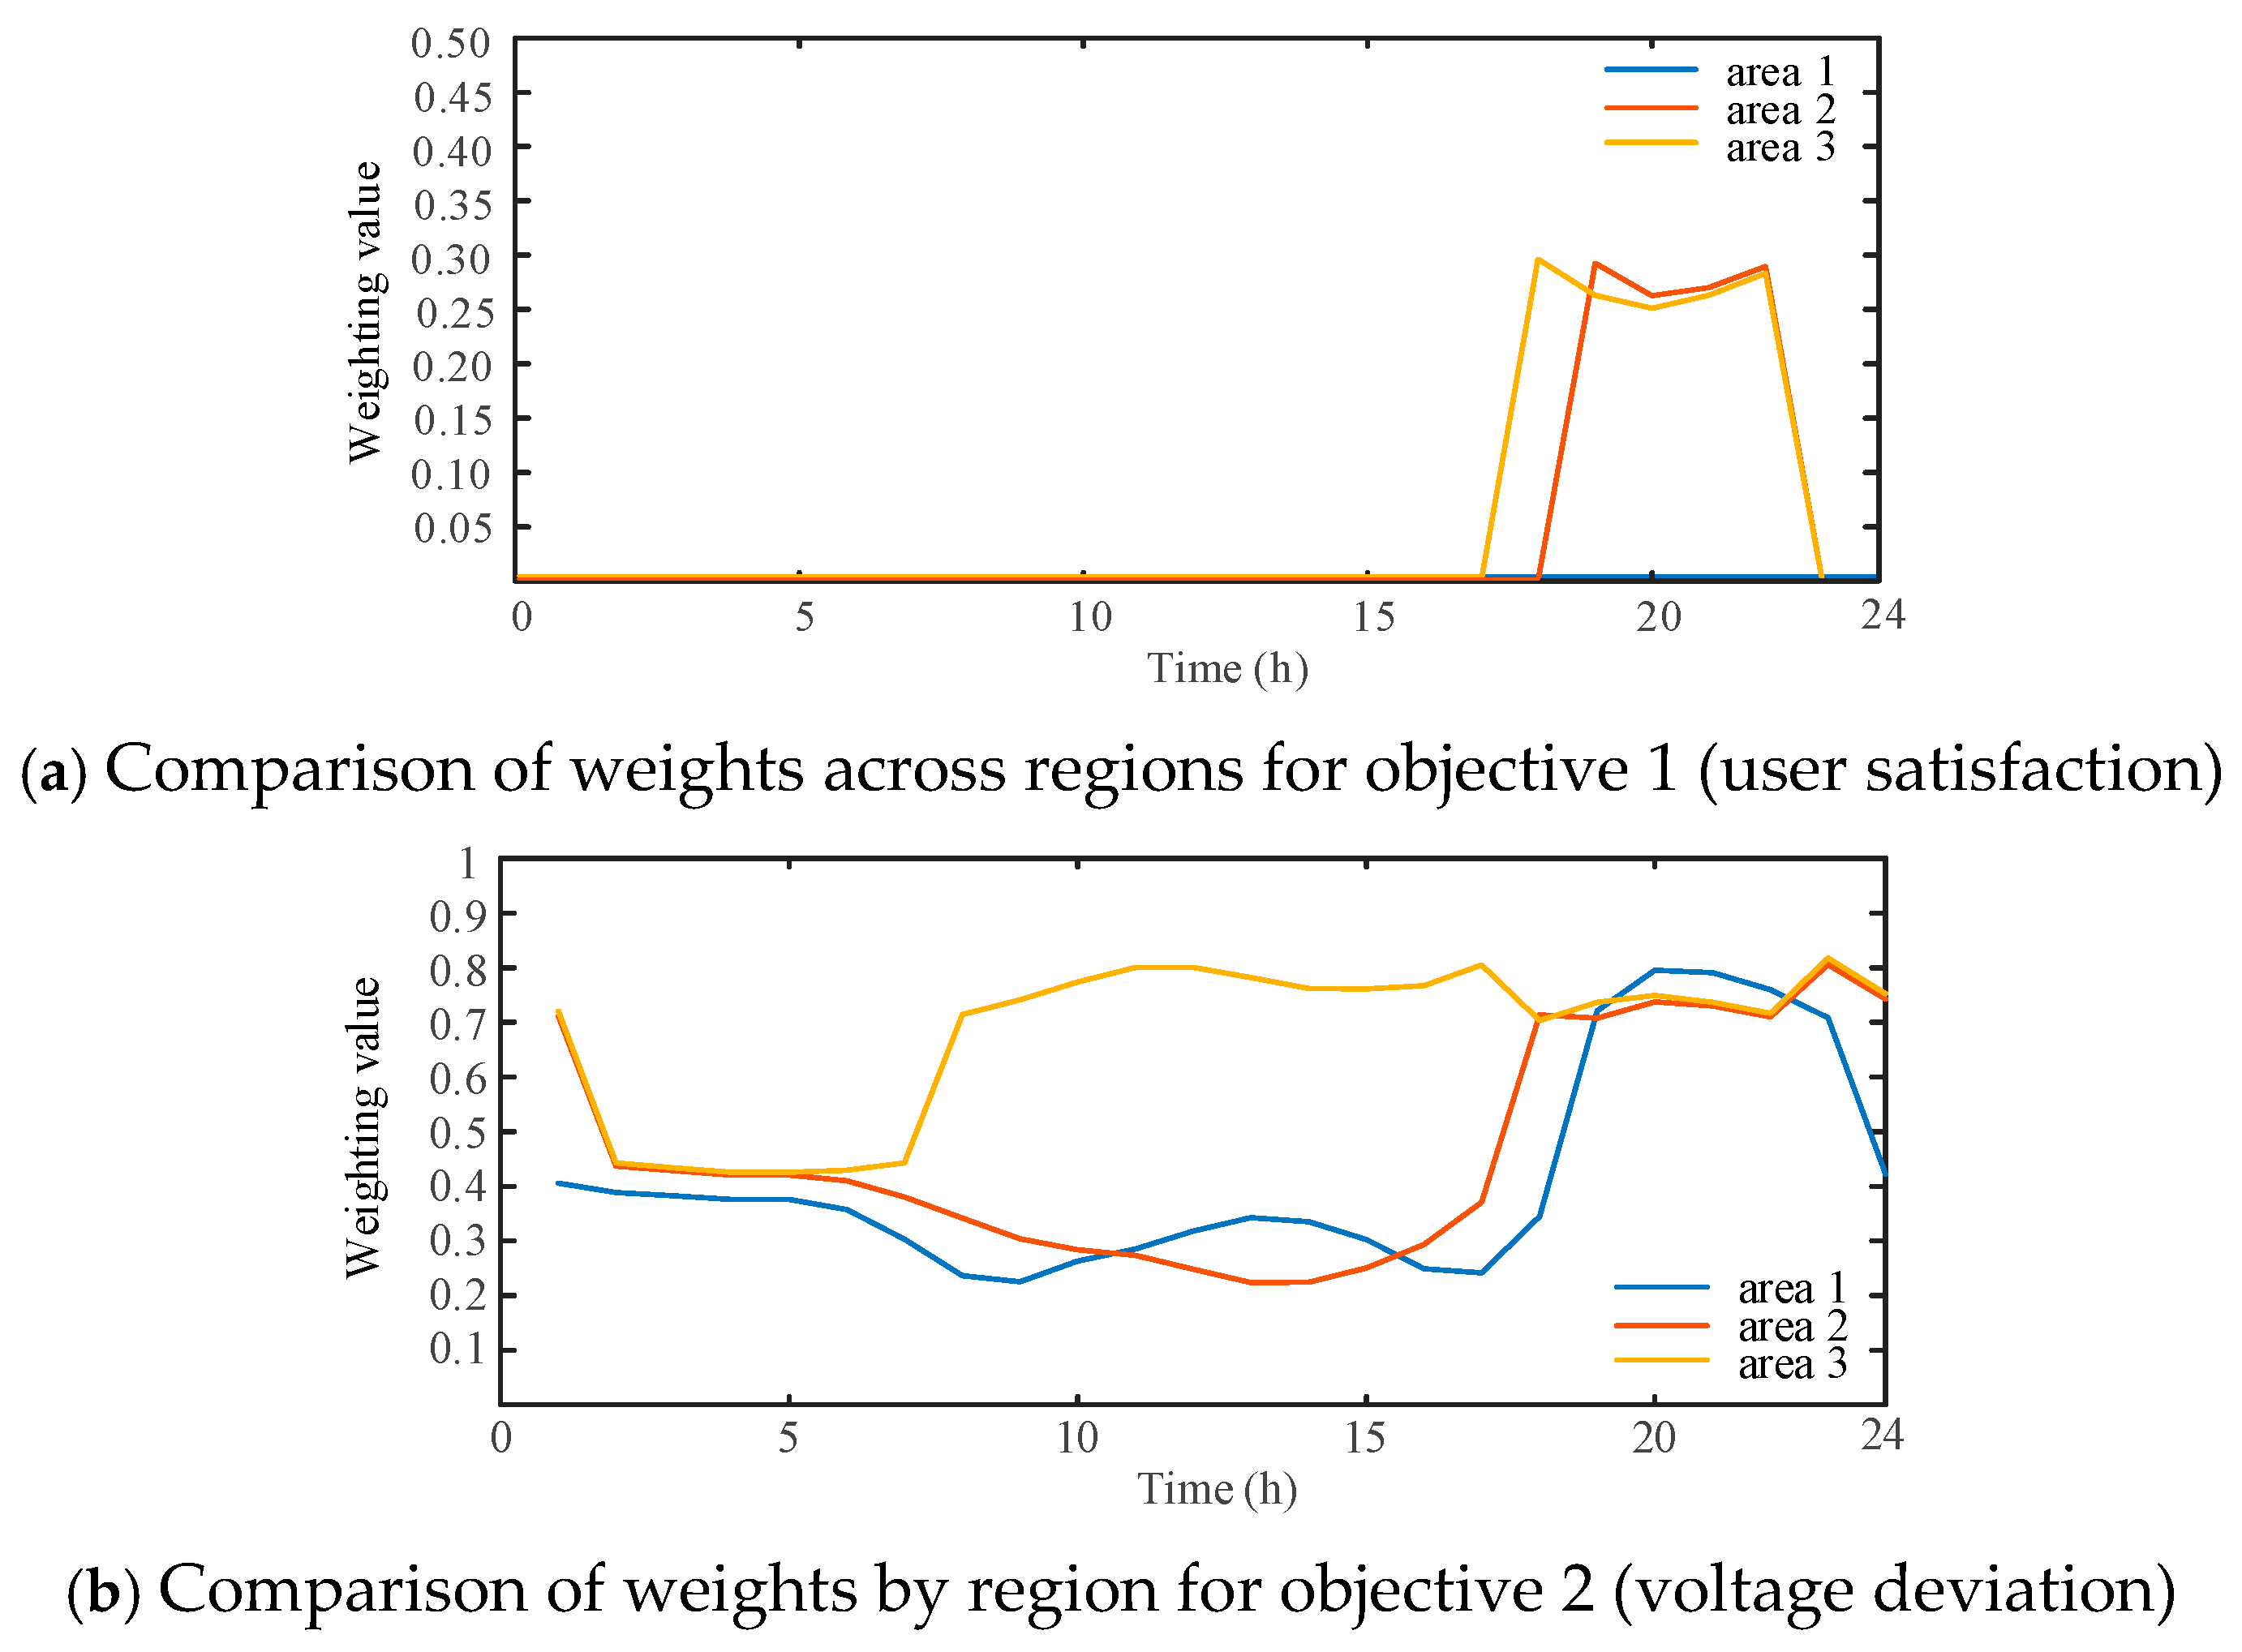
(2) Scenario 2: When the load and DG show some fluctuation, at this time, the voltage crossing of the flexible interconnected distribution station area is at the safe boundary level, the highest node voltage is 1.067 UN, and the lowest node voltage is 0.933 UN, and the fixed equal weight coefficients optimization scheduling method, the adaptive weight optimization scheduling method of the literature [26], and the optimization scheduling strategy proposed in this paper are used for comparison. The voltage situation of each node and the dynamic weight coefficients of each region are shown in Figure 6a–c and Figure 7a–d.
From the figure, it can be seen that the weight of the voltage deviation consideration rises and the cost weight decreases with the method of this paper, and the highest point of the node voltage decreases to 1.016 UN, and the voltage level of the node of the lower voltage limit increases to more than 0.980 UN; meanwhile, the fixed weight method decreases the highest point of the node voltage to 1.015 UN, but there are more nodes whose voltages are at the lower voltage limit of 0.978 UN. The literature [26] method reduces the highest point of node voltage to 1.018 UN, but there are some nodes whose voltages are at the lower voltage limit of 0.978 UN. Therefore, it is more advantageous to use this paper’s method to regulate the voltage level of each node. Secondly, the total system regulation capability indexes of this paper’s method and the other two methods are 0.686, 0.35, and 0.695, respectively, and the regulation capability of both methods decreases compared to the normal operation mode, but the SNOP in this paper’s method is still more involved in the power regulation of each distribution station. In addition, the total system cost, total time used and convergence are shown in Table 3.
According to the optimization results, the total system operation cost of this paper’s optimal scheduling method under the safe boundary level is CNY 98,660.59, with a total of 21 iterations, and the convergence interval is 0.0001118% at 43.09 s, which ensures that the voltage of each node is back under the normal operation level, and at the same time, it also ensures the economy of the system operation and reduces the interconnection system operation time compared to the other two methods’ requirements and meets the convergence requirements.
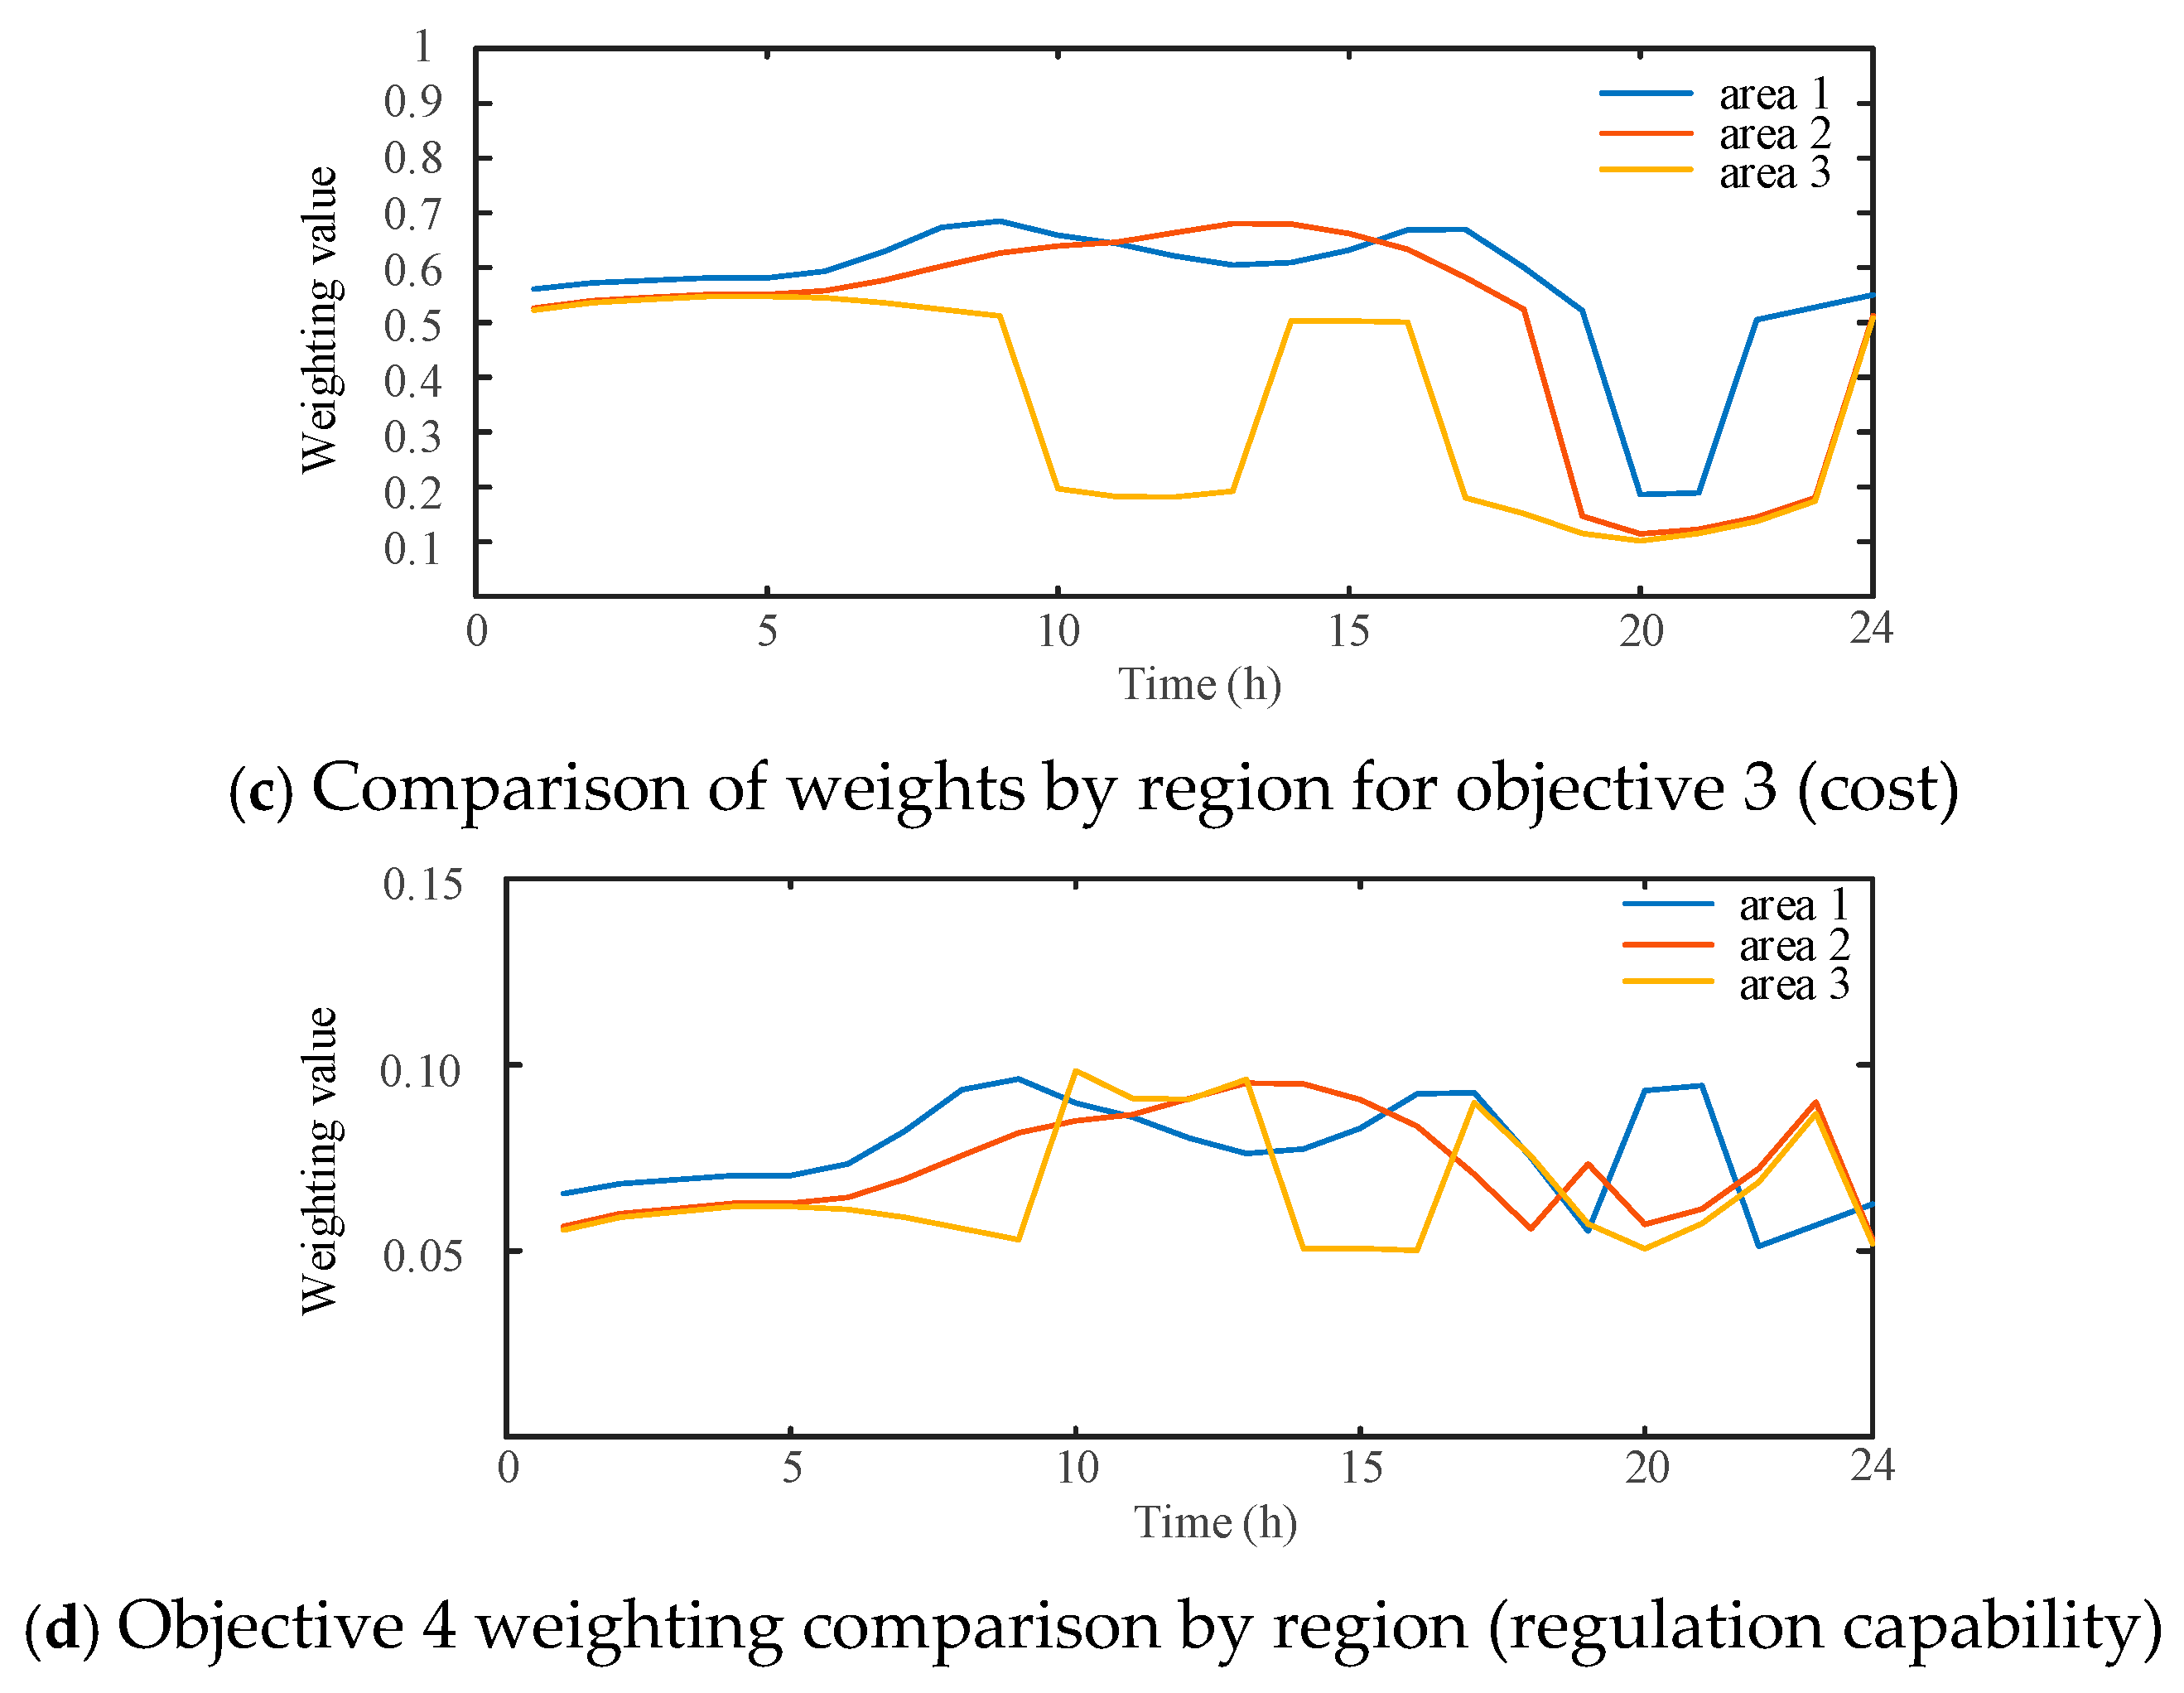
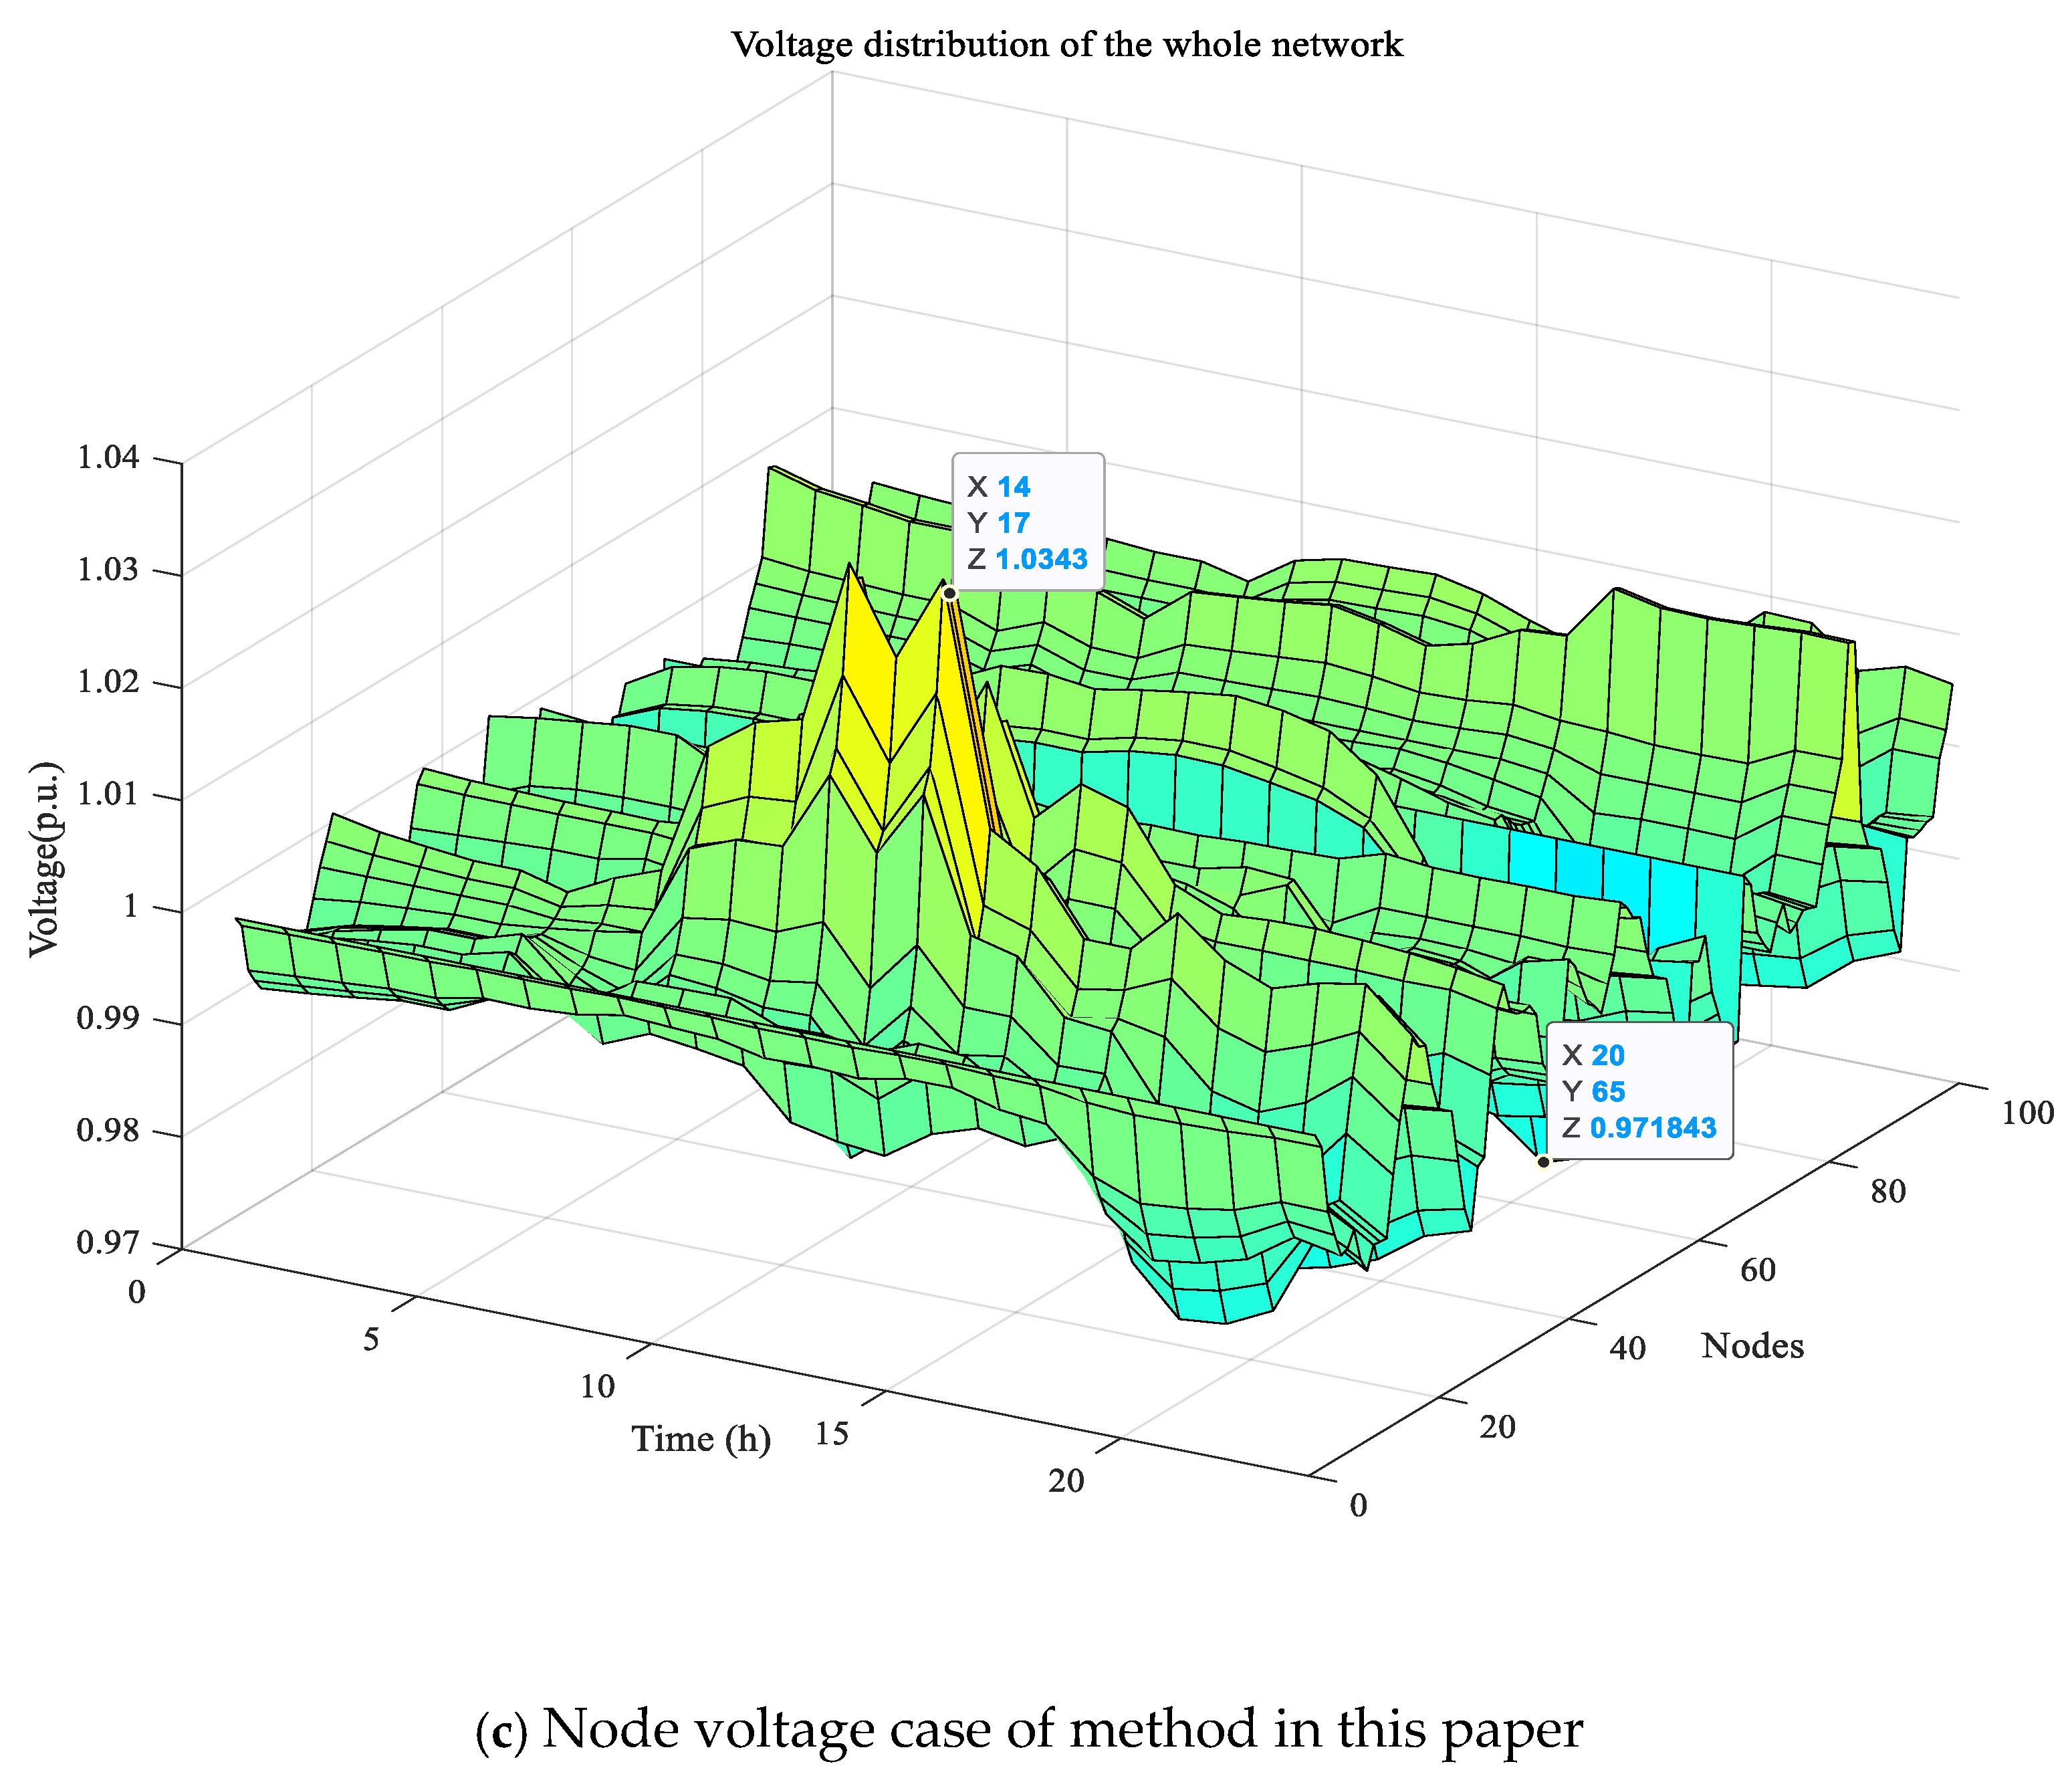
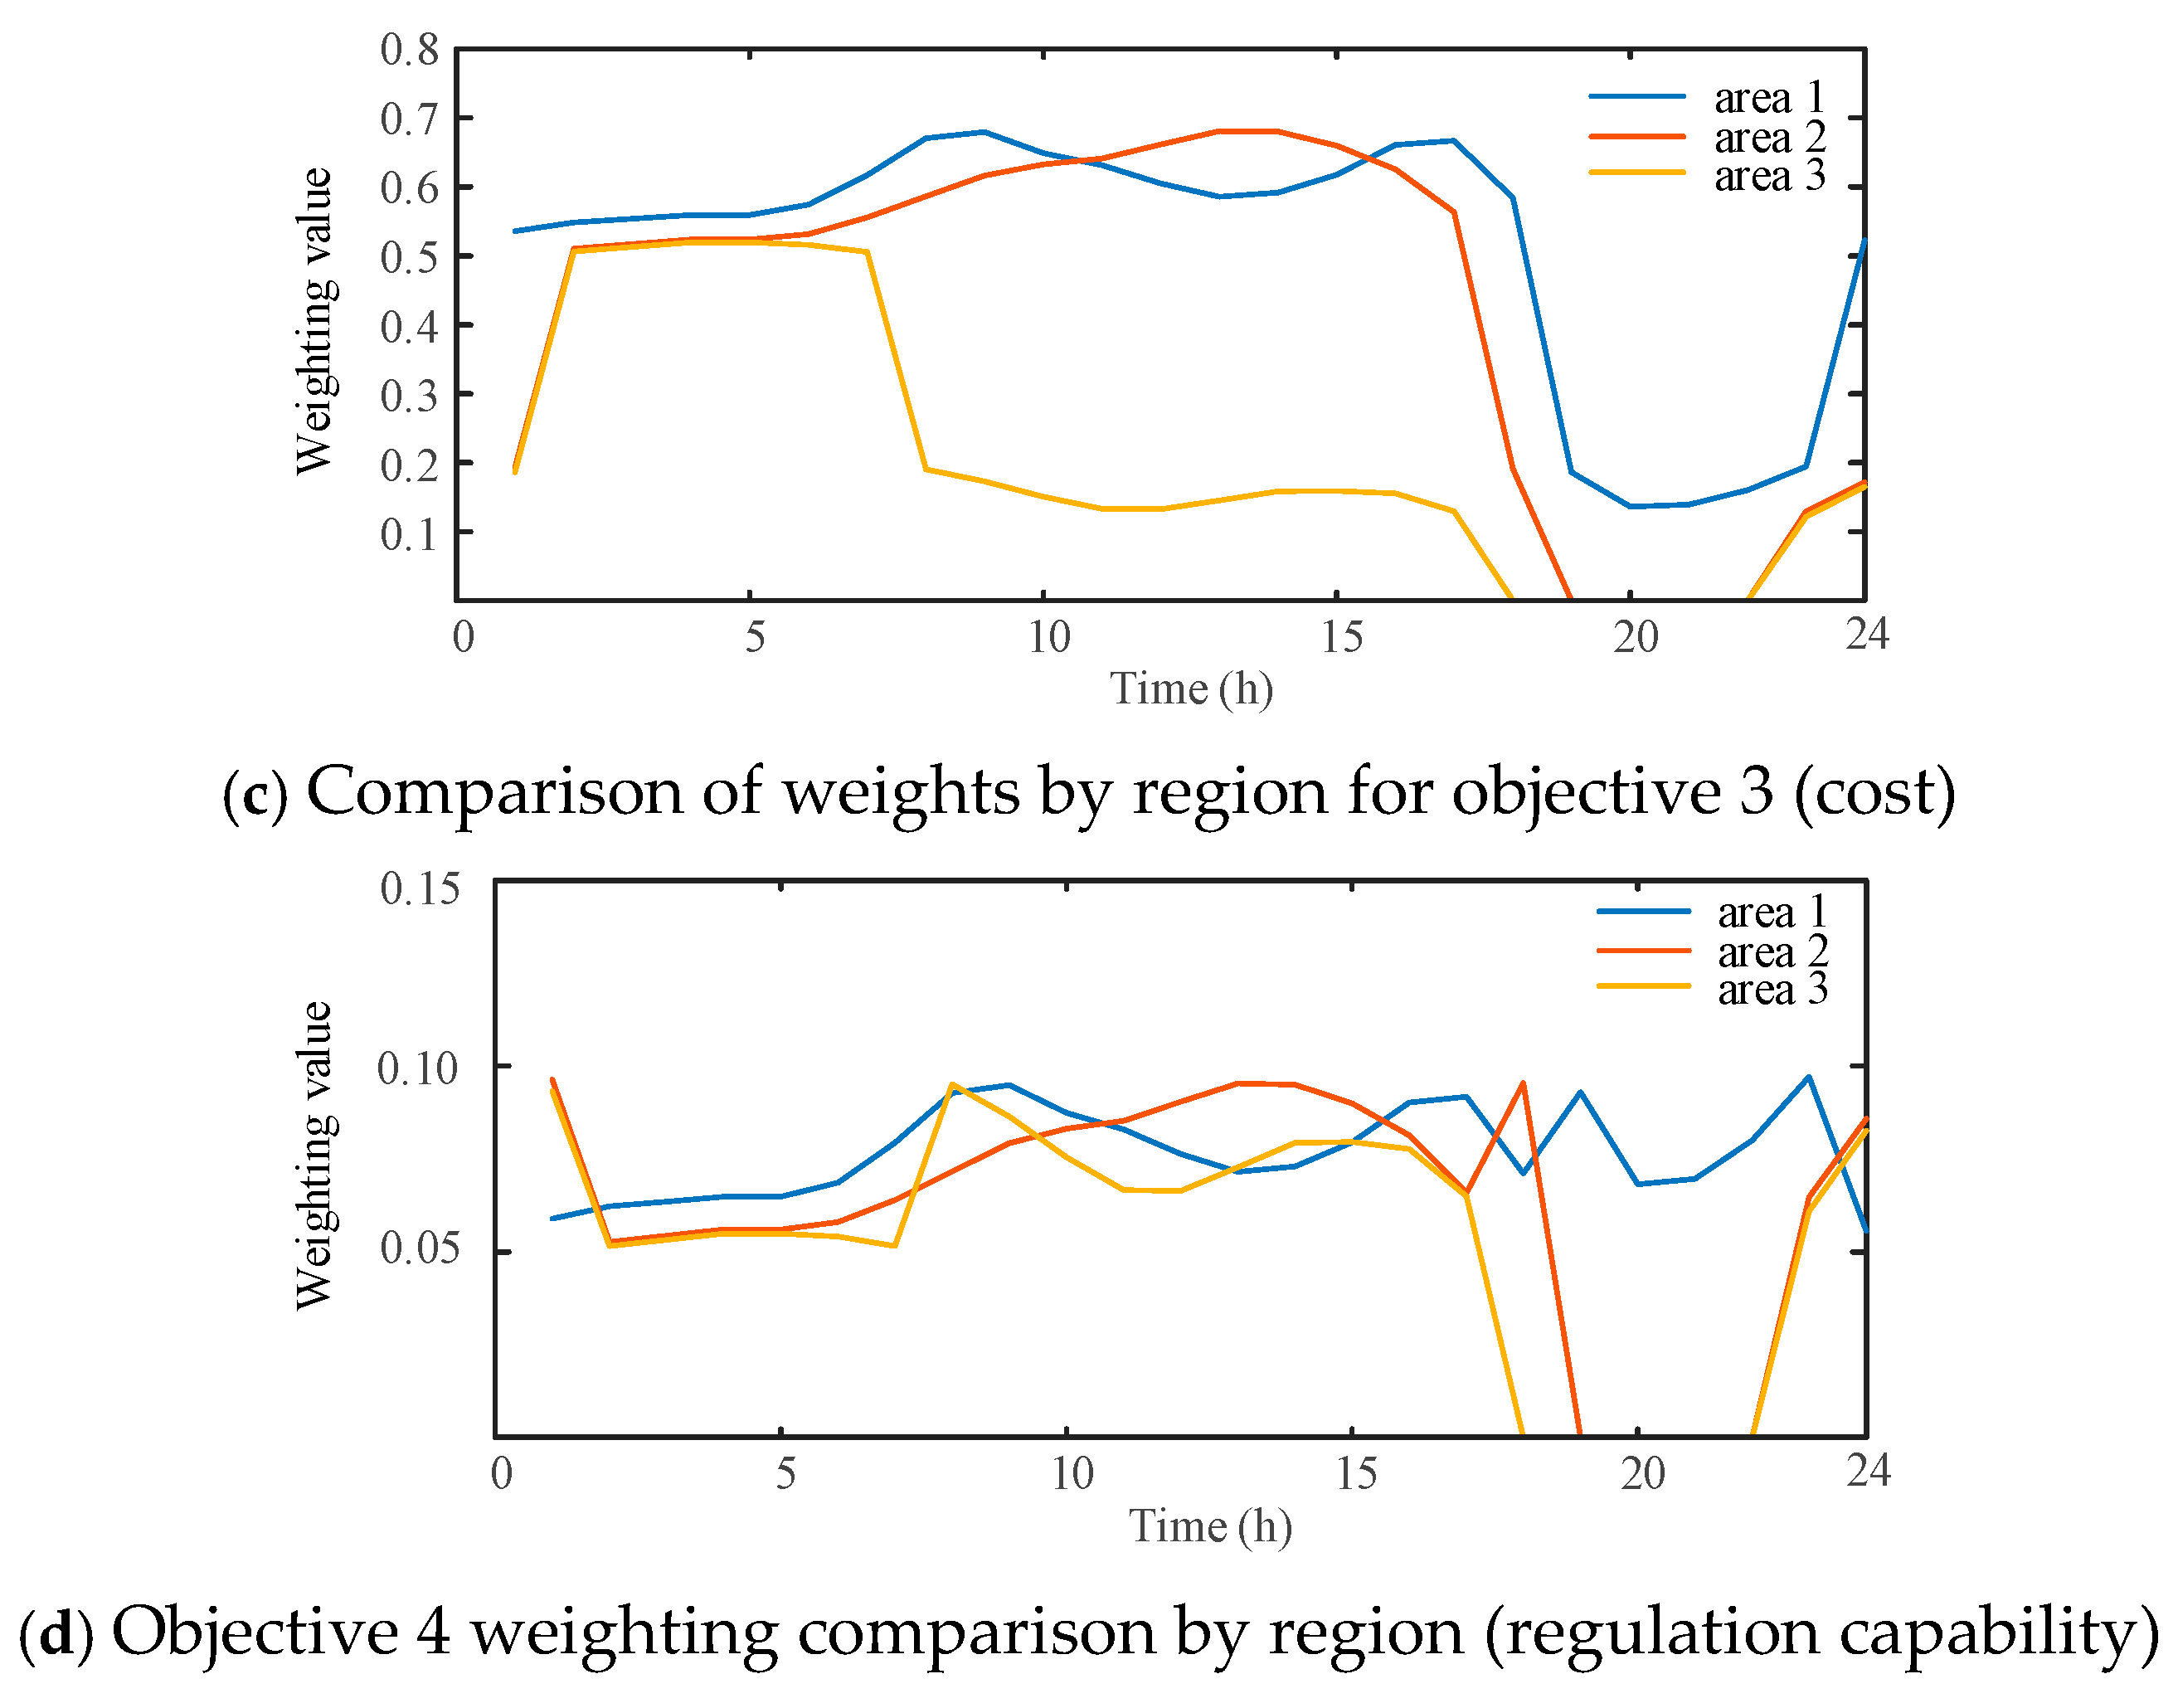
(3) Scenario 3: When the load or DG shows a larger range of fluctuations, at this time, the flexible interconnection distribution station area voltage overrun upper limit and lower limit are at the protection boundary level, the voltage upper limit reaches 1.08 UN, the voltage lower limit is 0.917 UN, and the fixed equal weight coefficients optimization scheduling method, adaptive weight optimization scheduling method of the literature [26], and the optimization scheduling strategy proposed in this paper are compared. When the optimal scheduling method of this paper is used, the system voltage is adjusted as far as possible to keep the voltage of each node away from the protection boundary level and avoid the protection action, which causes the risk of loss of power in the distribution station area, by greater enhancement of the weight of the voltage deviation in the system operation, considering a certain degree of user satisfaction and no longer taking into account the economy and the regulation ability of the SNOP. The fixed weight coefficient method is compared with the optimal scheduling strategy proposed in this paper. The dynamic weight coefficients of each node voltage and each area are shown in Figure 8a–c and Figure 9a–d.
From the figure, it can be seen that the optimal scheduling strategy proposed in this paper can better improve the node voltage level, so that the system is out of the protection boundary level and returns to the normal operation level. The highest point of node voltage in this paper’s method decreases to 1.034 UN, and the lower limit of node voltage improves to more than 0.972 UN. Meanwhile, the fixed weight scheme decreases the upper limit of the node voltage to 1.018 UN, but there are still many node voltages in the vicinity of 0.970 UN, and its ability to regulate the system voltage is not enough, and although it retains some of the regulation ability of the SNOP, it does not play a role in the regulation of the system power by the SNOP. Secondly, the total system regulation capability indexes of this paper’s method and the fixed weight optimal scheduling method, as well as the method of the literature [26], are 0.649, 0.694, and 0.35, respectively. Compared with the safe boundary level, the regulation capability of this paper’s method continues to decrease in order to restore the system voltage level, which makes the SNOP provide more power support, whereas the fixed weight method, which is designed to retain regulation capability, also does not regulate the system voltage more, illustrating the greater flexibility of this paper’s method. In addition, the total system cost, total time used, and convergence are shown in Table 4.
According to the optimization results, it can be obtained that the total cost of running the system of this paper’s optimal scheduling method under the protection boundary level is CNY 118,535.88, with a total of 23 iterations, and the convergence interval is 0.0000667% at 44.32 s, which ensures that the voltage of each node returns to under the normal operation level, and it is more economical compared to the other two methods, reducing the running time of the interconnected system, while also meeting the convergence accuracy requirement.

7. Conclusions

In this paper, a dynamic weight optimization scheduling strategy based on a three-port SNOP is proposed for multi-level flexible interconnected distribution stations. This strategy enhances the system’s ability to handle multiple voltage overruns by establishing an optimal scheduling framework tailored to different voltage deviation levels. Additionally, by incorporating dynamic weight coefficients, the strategy achieves coordination among various optimization objectives. The conclusions drawn from the results and analysis are as follows:
(1) The proposed optimal scheduling strategy, designed for multiple voltage overrun levels, develops a scheduling framework suited to the operating conditions of distribution stations. It ensures coordinated multi-objective optimization, thereby enhancing the economic operation of each station in the distribution area and its ability to manage source–load uncertainties.
(2) The dynamic weight coefficient determination method effectively leverages the regulation capabilities of the SNOP flexible interconnection device by real-time monitoring of voltage fluctuations in each distribution station area. This enables precise, rapid, and flexible system trend adjustments, ensuring economic and reliable system operation. At different voltage overrun levels, the method enhances the economic efficiency of the system within a controllable range while mitigating voltage fluctuations, thereby improving the power supply reliability of interconnected distribution stations and preventing the system from falling into an unstable fault state.
(3) The proposed multi-level dynamic weight optimization scheduling strategy ensures both independence and interconnection among distribution stations. By calculating the target weights of each distribution station separately, the strategy enables each station to regulate voltage deviations of other stations via the SNOP flexible interconnection device. This approach prevents large-scale system-wide scheduling adjustments that arise from calculating a uniform weight system, thus maintaining stability and efficiency.

Author Contributions

D.P.: data curation; formal analysis; methodology; software; writing—original draft; writing—review and editing. Z.W. (Zhipeng Wang): data curation; formal analysis; investigation; X.S.: methodology; software; writing—review and editing. J.G.: writing—review and editing; Z.W. (Zhenhao Wang): methodology; H.Y.: funding acquisition; supervision; Y.Z.: software; Y.Y.: writing—review and editing. W.W.: writing—review and editing. All authors have read and agreed to the published version of the manuscript.

Funding

This research was funded by the project supported by the Science and Technology Project of State Grid Corporation of China (SGJLCC00KJJS2203595).

Data Availability Statement

The original contributions presented in the study are included in the article; further inquiries can be directed to the corresponding author.

Acknowledgments

Thanks to the project supported by the Science and Technology Project of State Grid Jilin Electric Power Company.

Conflicts of Interest

Dan Pang, Zhipeng Wang, Hongyin Yi, and Yan Zhuang were employed by State Grid Corporation of China. The above authors have no financial relationship with the company or competitive interests to disclose.

References

  1. Yin, X.; Lai, J.; Yin, X.; Wang, Y.; Yin, Y.; Hu, J. Hybrid interlinking transformer and its fault blocking coordination control for microgrid. Electr. Power Autom. Equip. 2023, 43, 145–151+207. [Google Scholar]
  2. Li, J.; Wang, D.; Fan, H.; Yang, D.; Fang, R.; Sang, Z. Hierarchical optimal control method for active distribution network with mobile energy storage. Autom. Electr. Power Syst. 2022, 46, 189–198. [Google Scholar]
  3. Xue, J.; Wang, D.; Yu, Z.; Li, H.; Zhu, X.; Dou, C. Optimized dispatch of wind-diesel storage based on wind power adjustable uncertainty cost. J. Zhengzhou Univ. 2019, 40, 73–79. [Google Scholar]
  4. Liu, L.; Zhang, Y.; Xu, Q. An Interval Optimal Scheduling Method Considering the Influence of Power Uncertainty and the Flexibility of Distribution Network. J. Power Grid Technol. 2020, 44, 4654–4664. [Google Scholar]
  5. Rueda-Medina, A.C.; Padilh-Feltrin, A. Distributed generators as providers of reactive power support—A market approach. IEEE Trans. Power Syst. 2013, 28, 490–502. [Google Scholar] [CrossRef]
  6. Liang, X.; Saaklayen, A.; Igder, M.A.; Shawon, S.M.R.H.; Faried, S.O.; Janbakhsh, M. Planning and service restoration through microgrid formation and soft open points for distribution network modernization: A review. IEEE Trans. Ind. Appl. 2022, 58, 1843–1857. [Google Scholar] [CrossRef]
  7. Jiang, X.; Zhou, Y.; Ming, W.; Yang, P.; Wu, J. An overview of soft open points in electricity distribution networks. IEEE Trans. Smart Grid 2022, 13, 1899–1910. [Google Scholar] [CrossRef]
  8. Zheng, G.; Zhu, E.; Zhang, H.; Liu, Y.; Li, Z. Flexible interconnection planning for distribution station areas of high-ratio photovoltaic based on master-slave game. Electr. Power Constr. 2024, 45, 100–110. [Google Scholar]
  9. Hu, P.; Zhu, N.; Ji, D.; Ju, P.; Li, Y. Research Progress and Prospects of Key Technologies of Flexible Interconnected Smart Distribution Network. Autom. Electr. Power Syst. 2021, 45, 2–12. [Google Scholar]
  10. Zheng, S.; Liao, K.; Yang, J. Active-reactive Power Robust Collaborative Optimization Strategy for Active Distribution System with Multi-microgrids Based on Back-to-back Converter Interconnection. Power Syst. Technol. 2023, 47, 5005–5017. [Google Scholar]
  11. Sun, S.; Zhang, Y.; Qi, X. Optimized scheduling of low-voltage AC/DC distribution network considering the uncertainty of source and load. Distrib. Util. 2023, 40, 25–32. [Google Scholar]
  12. Zhang, S.; Yang, Y.; Pei, W. Research and comparative analysis of different port flexible multi-state switches for regulation and control of distribution network operation. High Volt. Eng. 2019, 45, 3120–3129. [Google Scholar]
  13. Gao, H.; Liu, J.; Wang, L.; Wei, Z. Decentralized energy management for networked microgrids in future distribution systems. IEEE Trans. Power Syst. 2018, 33, 3599–3610. [Google Scholar] [CrossRef]
  14. Zhao, J.; Zhang, M.; Zhang, S.; Yang, Q. Optimizationstrategy of multi-microgrid cooperative operation considering carbon trading and renewable energy uncertainties. Electr. Power 2023, 56, 62–71. [Google Scholar]
  15. Dong, Z.; Xu, T.; Li, Y. Multi-time Scale Optimal Scheduling of Active Distribution Network Considering Source Load Storage Coordination. J. Sci. Technol. Eng. 2024, 24, 10321–10329. [Google Scholar]
  16. Yang, Y.; Yang, P.; Zhao, Z.; Lai, L.L. A multi-timescale coordinated optimization framework for economic dispatch of micro-energy grid considering prediction error. IEEE Trans. Power Syst. 2024, 39, 3211–3226. [Google Scholar] [CrossRef]
  17. Liang, D.; Guo, Y.; Wang, X.; Liu, Q.; Wang, S. Two-Stage Robust Optimization for Flexible Interconnected Distribution Systems Considering Energy Storages and Dynamic Reconfiguration. J. Electr. Power Constr. 2022, 43, 94–103. [Google Scholar]
  18. Veisi, M.; Adabi, F.; Kavousi-Fard, A.; Karimi, M. A framework of electricity market based on two-layer stochastic power management for microgrids. IEEE Access 2022, 10, 41047–41063. [Google Scholar] [CrossRef]
  19. Zhu, X.; Jiang, Q.; Liu, M. Two-stage optimal scheduling of integrated energy system considering source-load uncertainty. Electr. Power Autom. Equip. 2023, 43, 9–16, 32. [Google Scholar]
  20. Ding, T.; Li, C.; Yang, Y.; Jiang, J.; Bie, Z.; Blaabjerg, F. A two-stage robust optimization for centralized-optimal dispatch of photovoltaic inverters in active distribution networks. IEEE Trans. Sustain. Energy 2017, 8, 744–754. [Google Scholar] [CrossRef]
  21. Wang, S.; Li, Q.; Zhao, Q.; Lin, Z.; Wang, K. Improved particle swarm algorithm for multi-objective optimization of AC/DC distribution network voltage taking into account source-load stochasticity. J. Power Syst. Autom. 2021, 33, 10–17. [Google Scholar]
  22. Xie, M.; Zhang, S.; Li, Y. Optimal dispatch of AC/DC hybrid low-voltage distribution network based on multi-mode flexible interconnection. Autom. Electr. Power Syst. 2023, 47, 79–89. [Google Scholar]
  23. Yan, Y.; Liao, Q.; Liu, D.; Hu, J. Power flow between ness based SNOP allocation and active distribution network optimization. South. Power Syst. Technol. 2015, 9, 92–98. [Google Scholar]
  24. Zhao, J.; Li, Y.; Li, P.; Ji, H.; Wang, C.; Wu, J. Sequential voltage regulation of soft normally open point in active distribution network based on second-order cone programming. High Volt. Eng. 2016, 42, 2134–2141. [Google Scholar]
  25. Zhu, G.; Zhang, Y.; Ge, L.; Wang, L. Multi time-scale voltage optimization of flexible interconnected distribution network with self-energy storage. Autom. Electr. Power Syst. 2021, 45, 71–79. [Google Scholar]
  26. Wang, Y.; Liu, S.; Wang, Y.; Lv, Z.; Liang, J. Adaptive optimal scheduling of flexible interconnected stations based on operation state classification. Power Autom. Equip. 2024, 44, 10–17. [Google Scholar]
  27. Wang, C.; Sun, C.; Li, P.; Wu, J.; Xing, F.; Yu, Y. SNOP-based operation optimization and analysis of distribution networks. Autom. Electr. Power Syst. 2015, 39, 82–87. (In Chinese) [Google Scholar]
Figure 1. Schematic diagram of three-terminal SNOP access to multiple distribution stations.
Energies 18 02421 g001
Figure 2. Basic structure of three-port SNOP.
Energies 18 02421 g002
Figure 3. Framework of proposed optimal scheduling model.
Energies 18 02421 g003
Figure 4. Structure of SNOP connecting three 33-node IEEE distribution stations.
Energies 18 02421 g004
Figure 5. The 24 h distribution station voltage amplitude for three optimized scheduling methods in Scenario 1.
Energies 18 02421 g005aEnergies 18 02421 g005b
Figure 6. The 24 h distribution station voltage amplitude for three optimized scheduling methods in Scenario 2.
Energies 18 02421 g006aEnergies 18 02421 g006b
Figure 7. Comparison of each weight for each region under Scenario 2.
Energies 18 02421 g007aEnergies 18 02421 g007b
Figure 8. The 24 h distribution station voltage amplitude for three optimized scheduling methods in Scenario 3.
Energies 18 02421 g008aEnergies 18 02421 g008b
Figure 9. Comparison of each weight for each region under scenario 3.
Energies 18 02421 g009aEnergies 18 02421 g009b
Table 1. Classification of transgression levels.
Voltage Overrun Level Voltage   Overrun   Size / Δ U N
Normal operation 5 % , + 5 %
Safe Boundary 7 % , 5 % + 5 % , + 7 %
Protection Boundary 15 % , 7 % + 7 % , + 15 %
Table 2. Comparison of different optimized scheduling strategies in Scenario 1.
Optimized
Scheduling Strategy
Fixed WeightingLiterature
Method
Method of
This Paper
Weighting factor
Total system cost (¥)
Total time spent (s)
1:1:1:1
68,749.54
43.2543
Adaptive weighting
65,802.34
44.8289
Dynamic weighting
65,768.22
41.7904
Iterations
Convergence interval (%)
21
0.000123
20
0.0000719
20
0.0000716
Table 3. Comparison of different optimized scheduling strategies in Scenario 2.
Optimized
Scheduling Strategy
Fixed WeightingLiterature
Method
Method of
This Paper
Weighting factor
Total system cost (¥)
Total time spent (s)
1:1:1:1
104,051.95
44.1464
Adaptive weighting
102,846.66
44.3285
Dynamic weighting
98,660.59
43.0962
Iterations
Convergence interval (%)
21
0.000083
21
0.0000834
21
0.0001118
Table 4. Comparison of different optimized scheduling strategies in Scenario 3.
Optimized
Scheduling Strategy
Fixed Weighting Literature
Method
Method of
This Paper
Weighting factor
Total system cost (¥)
Total time spent (s)
1:1:1:1
125,877.10
44.6357
Adaptive weighting
122,202.83
45.0877
Dynamic weighting
118,535.88
44.3198
Iterations
Convergence interval (%)
20
0.000135
22
0.000058
23
0.0000667
Disclaimer/Publisher’s Note: The statements, opinions and data contained in all publications are solely those of the individual author(s) and contributor(s) and not of MDPI and/or the editor(s). MDPI and/or the editor(s) disclaim responsibility for any injury to people or property resulting from any ideas, methods, instructions or products referred to in the content.