
Experimental and Kinetic Simulation Study of the High-Temperature Pyrolysis of 1,2,4-Trimethylbenzene, 1,3,5-Trimethylbenzene and n-Propylbenzene

 ,
,  and
and
Abstract
1. Introduction
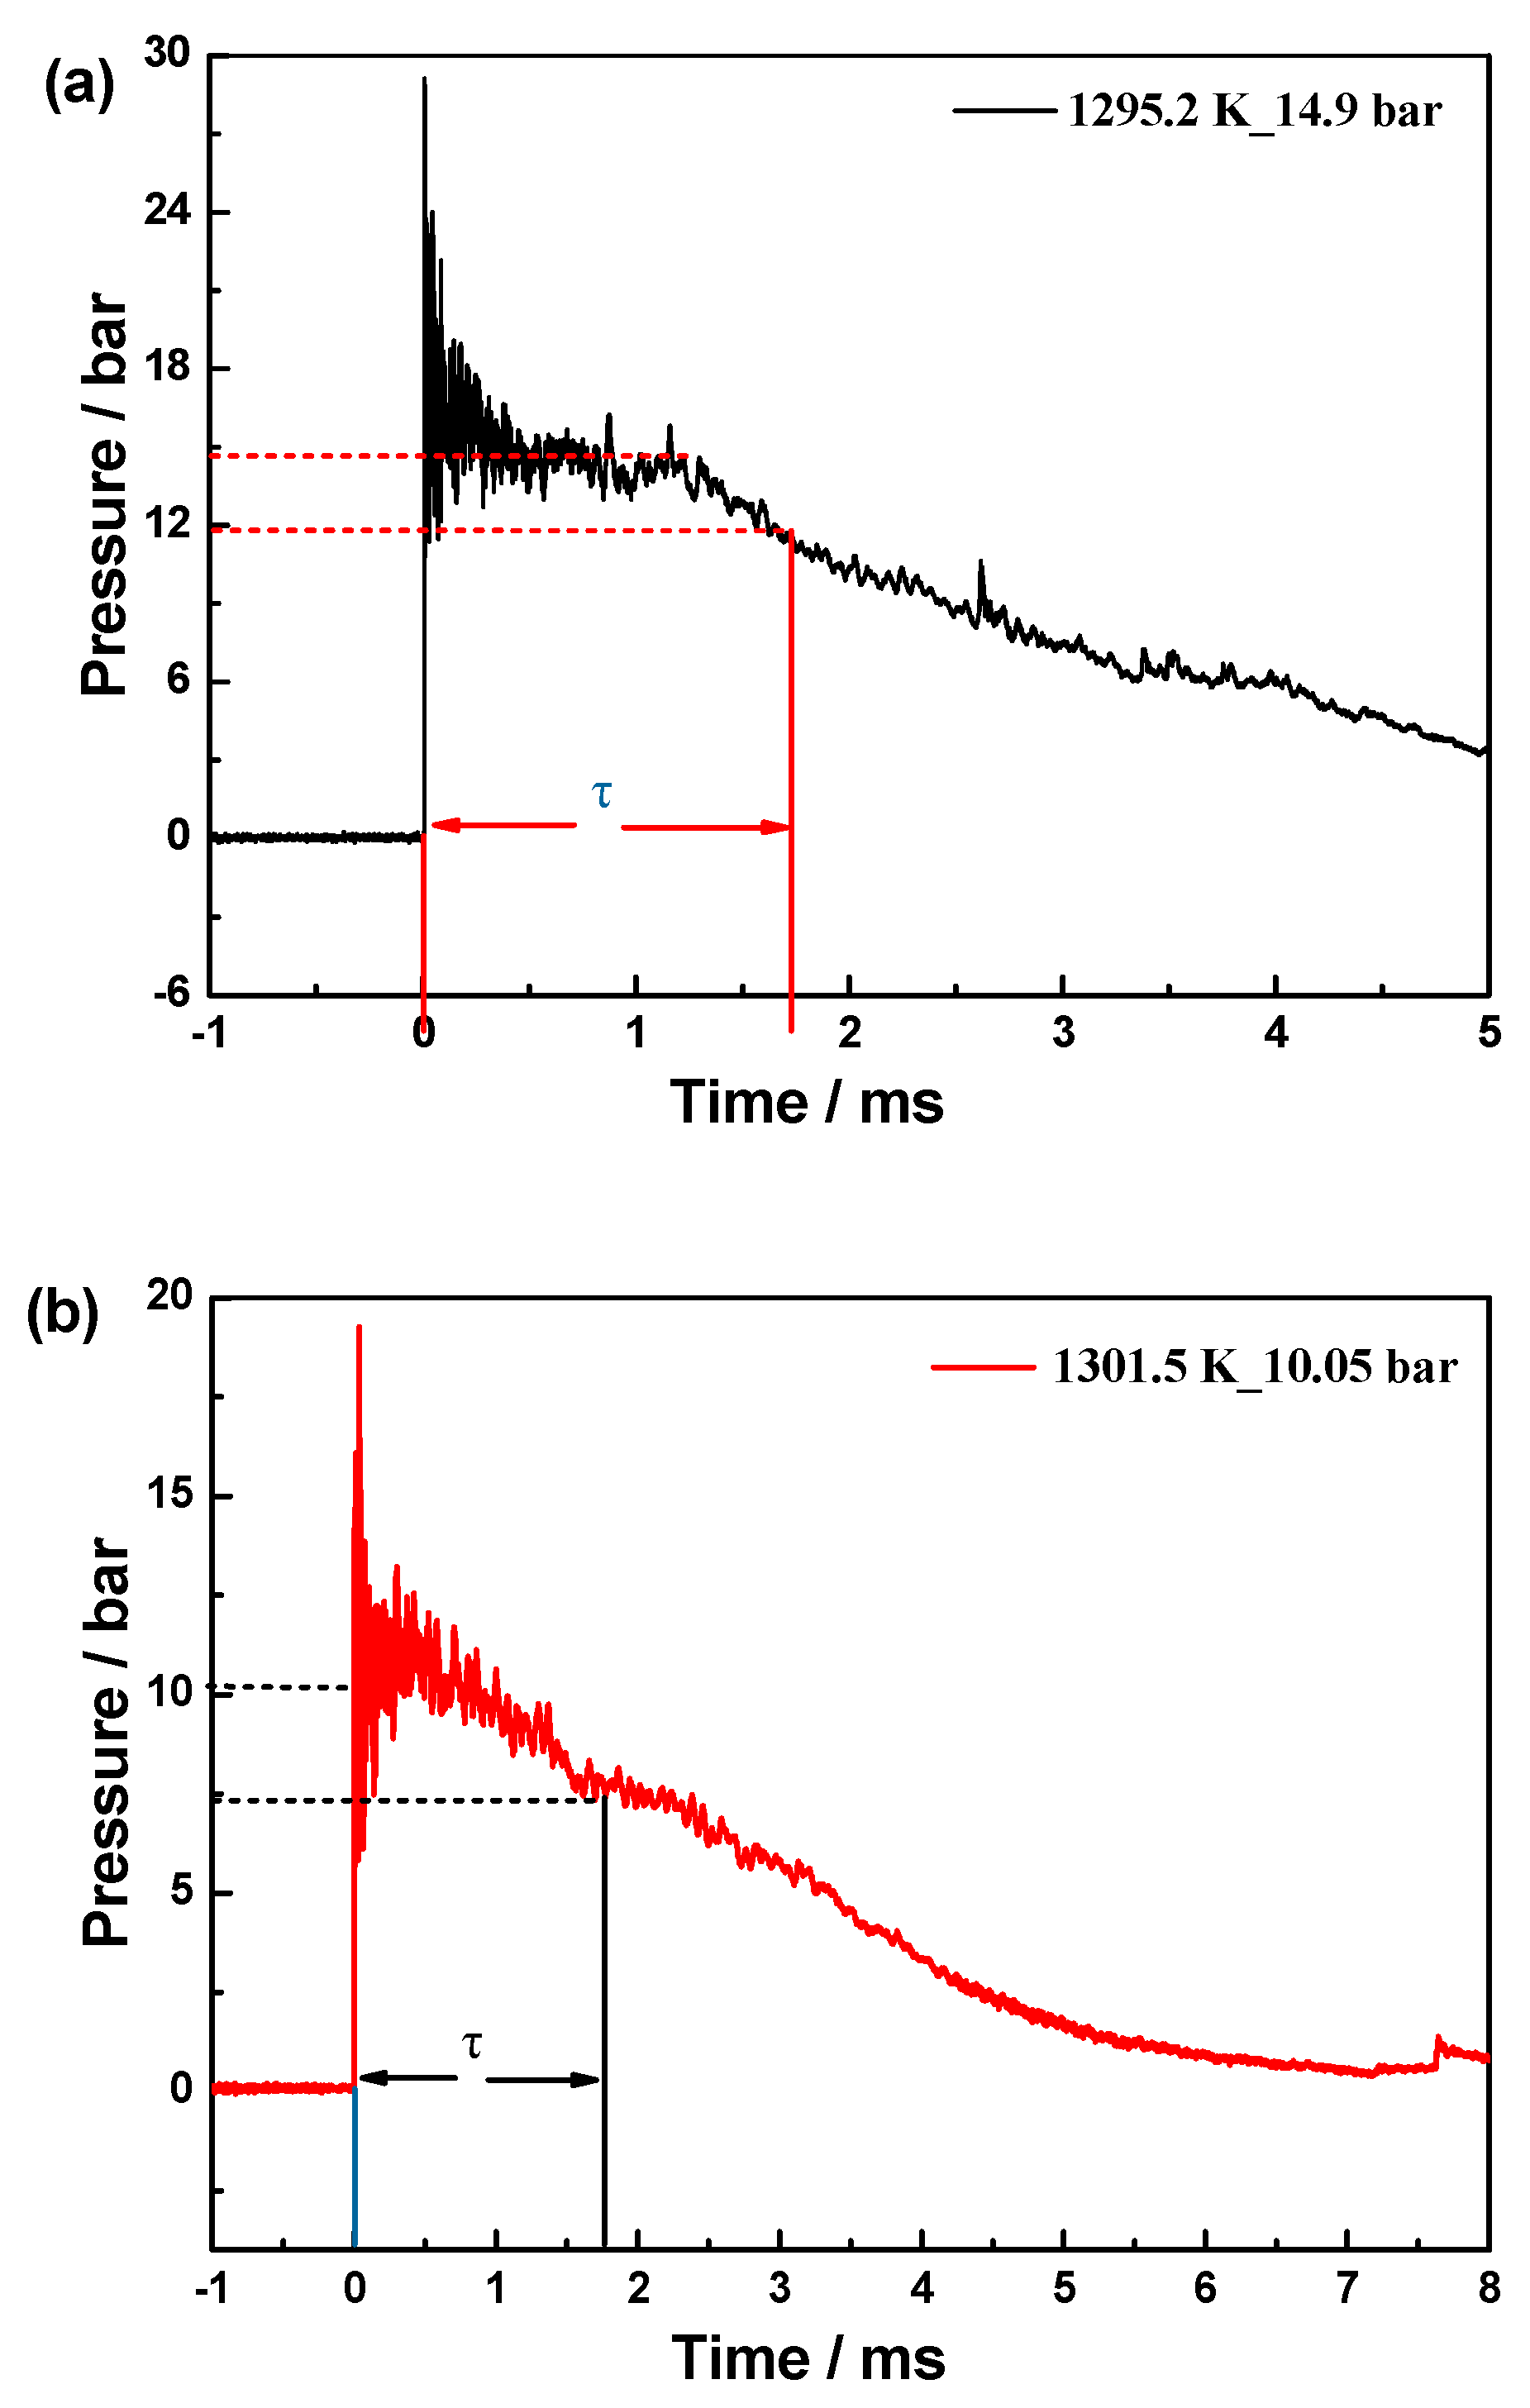
2. Experimental Methods
3. Kinetic Modeling
4. Results and Discussions
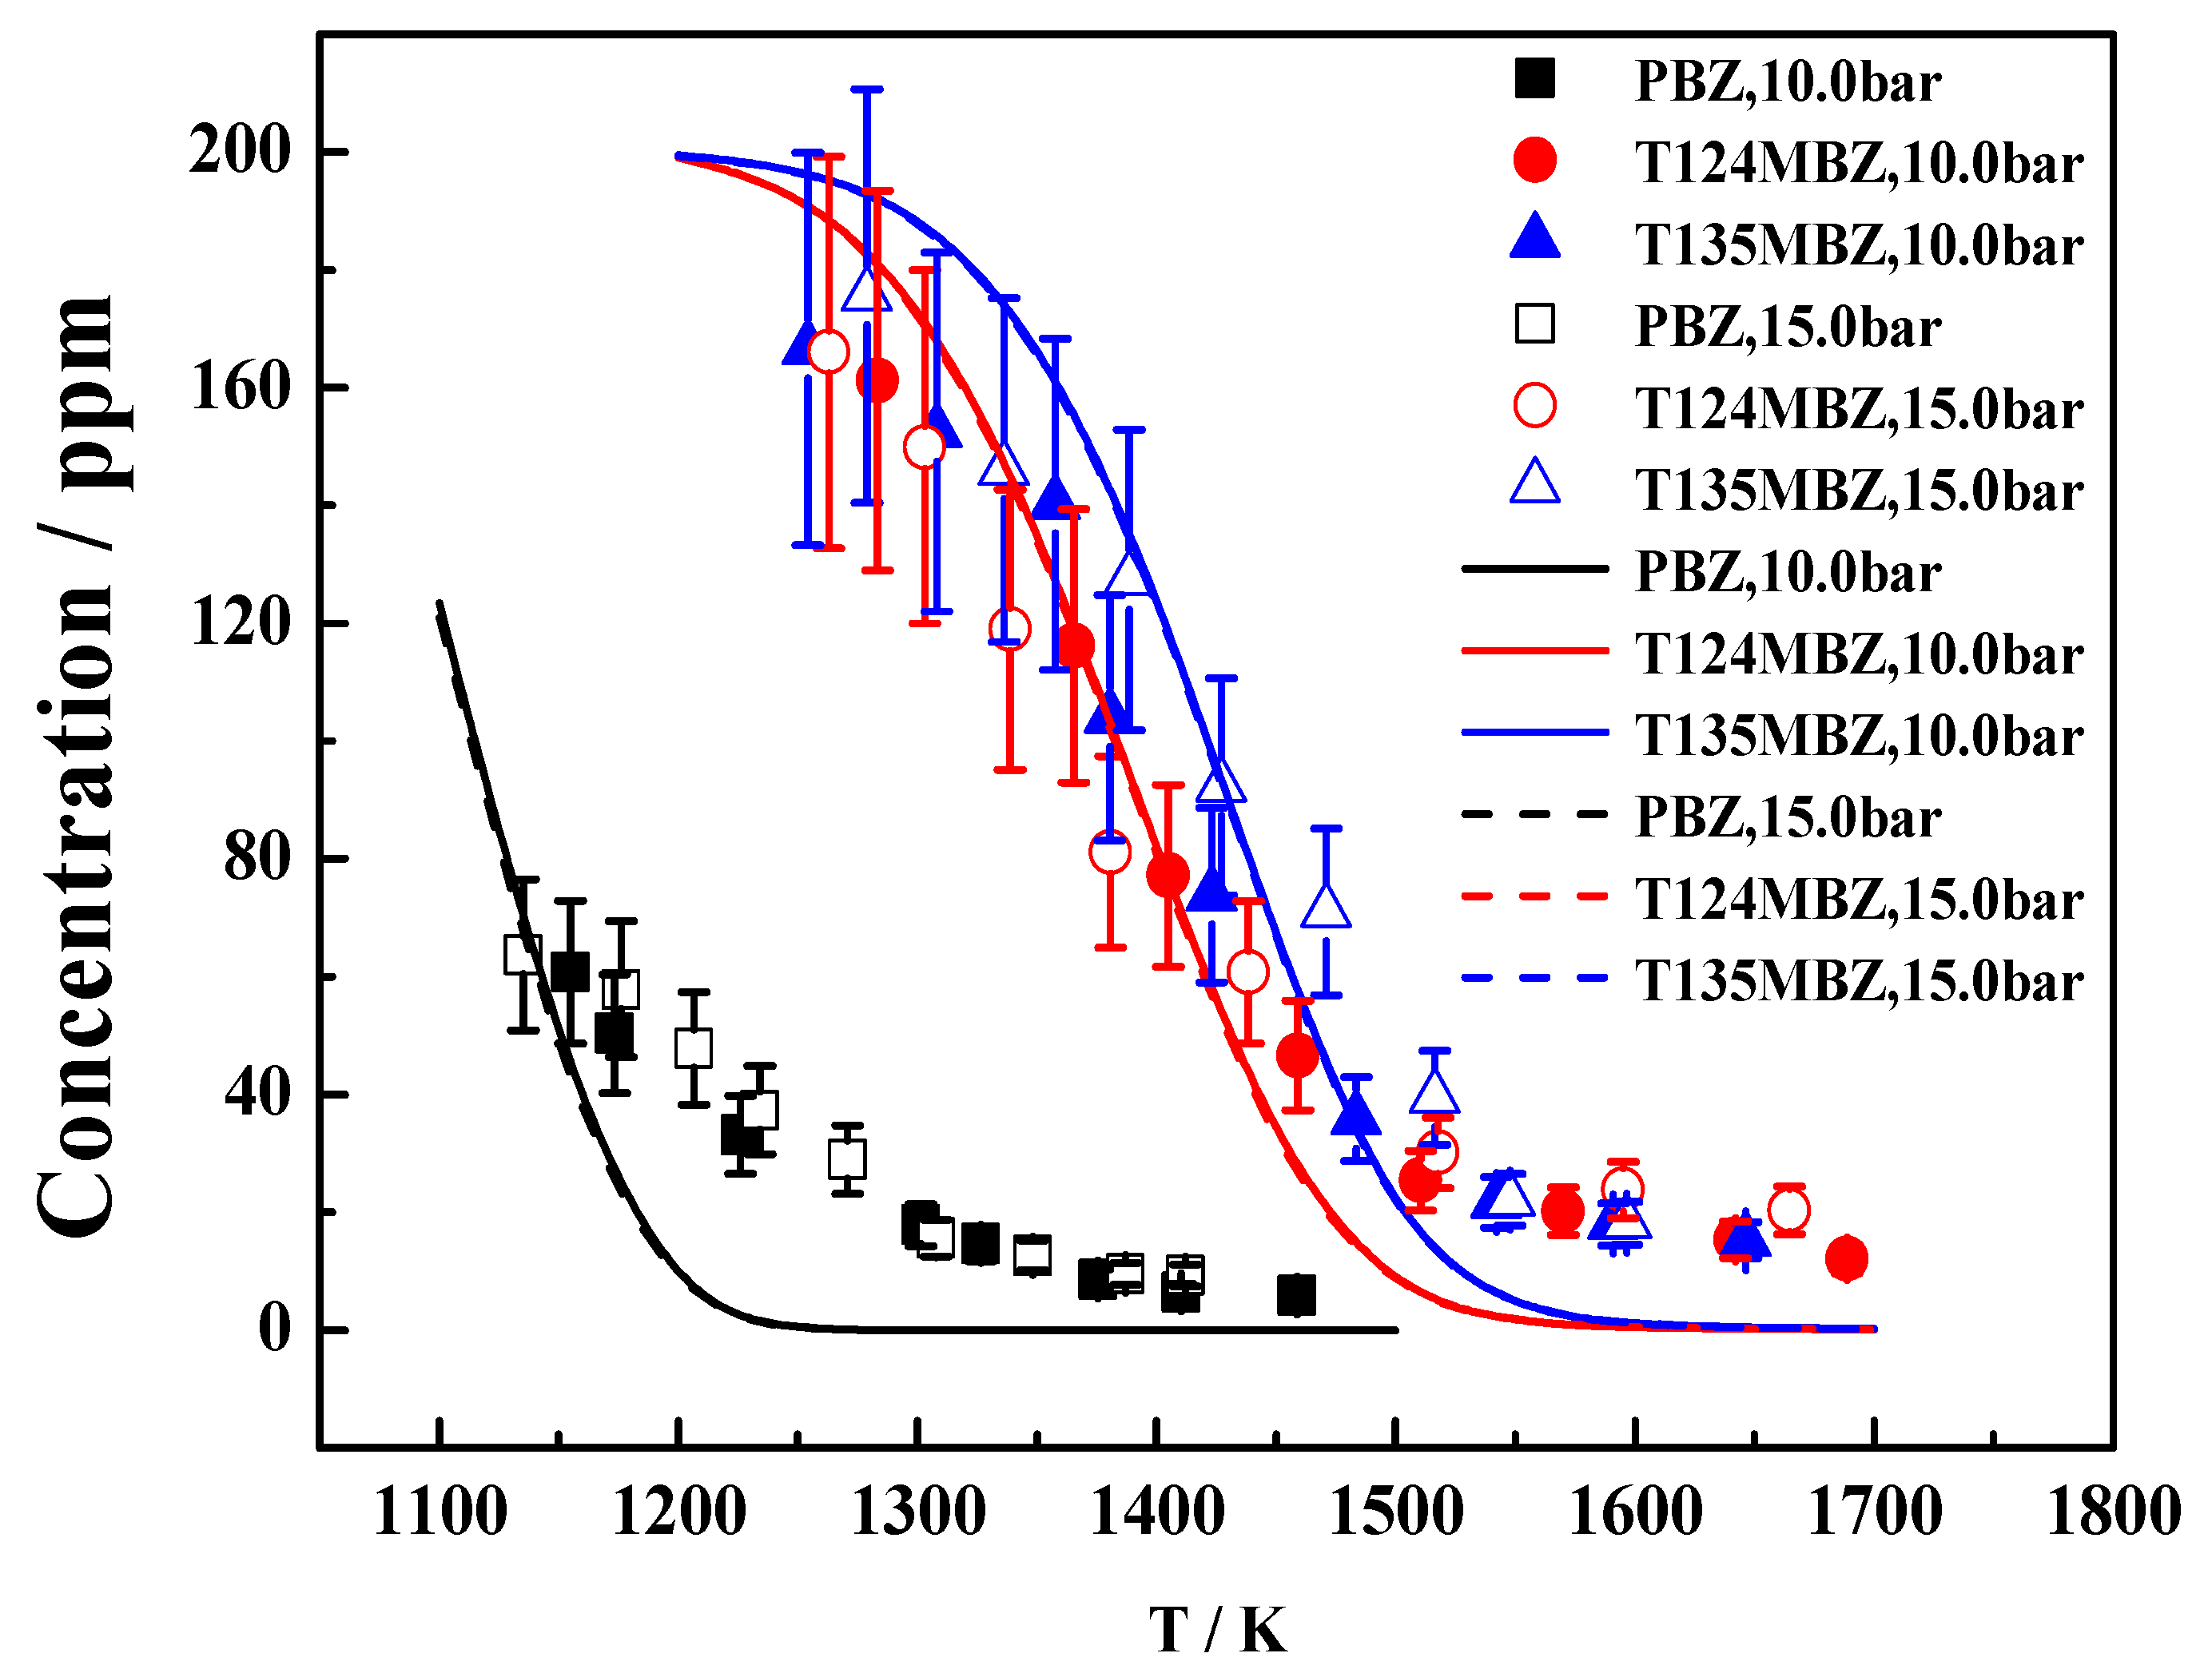
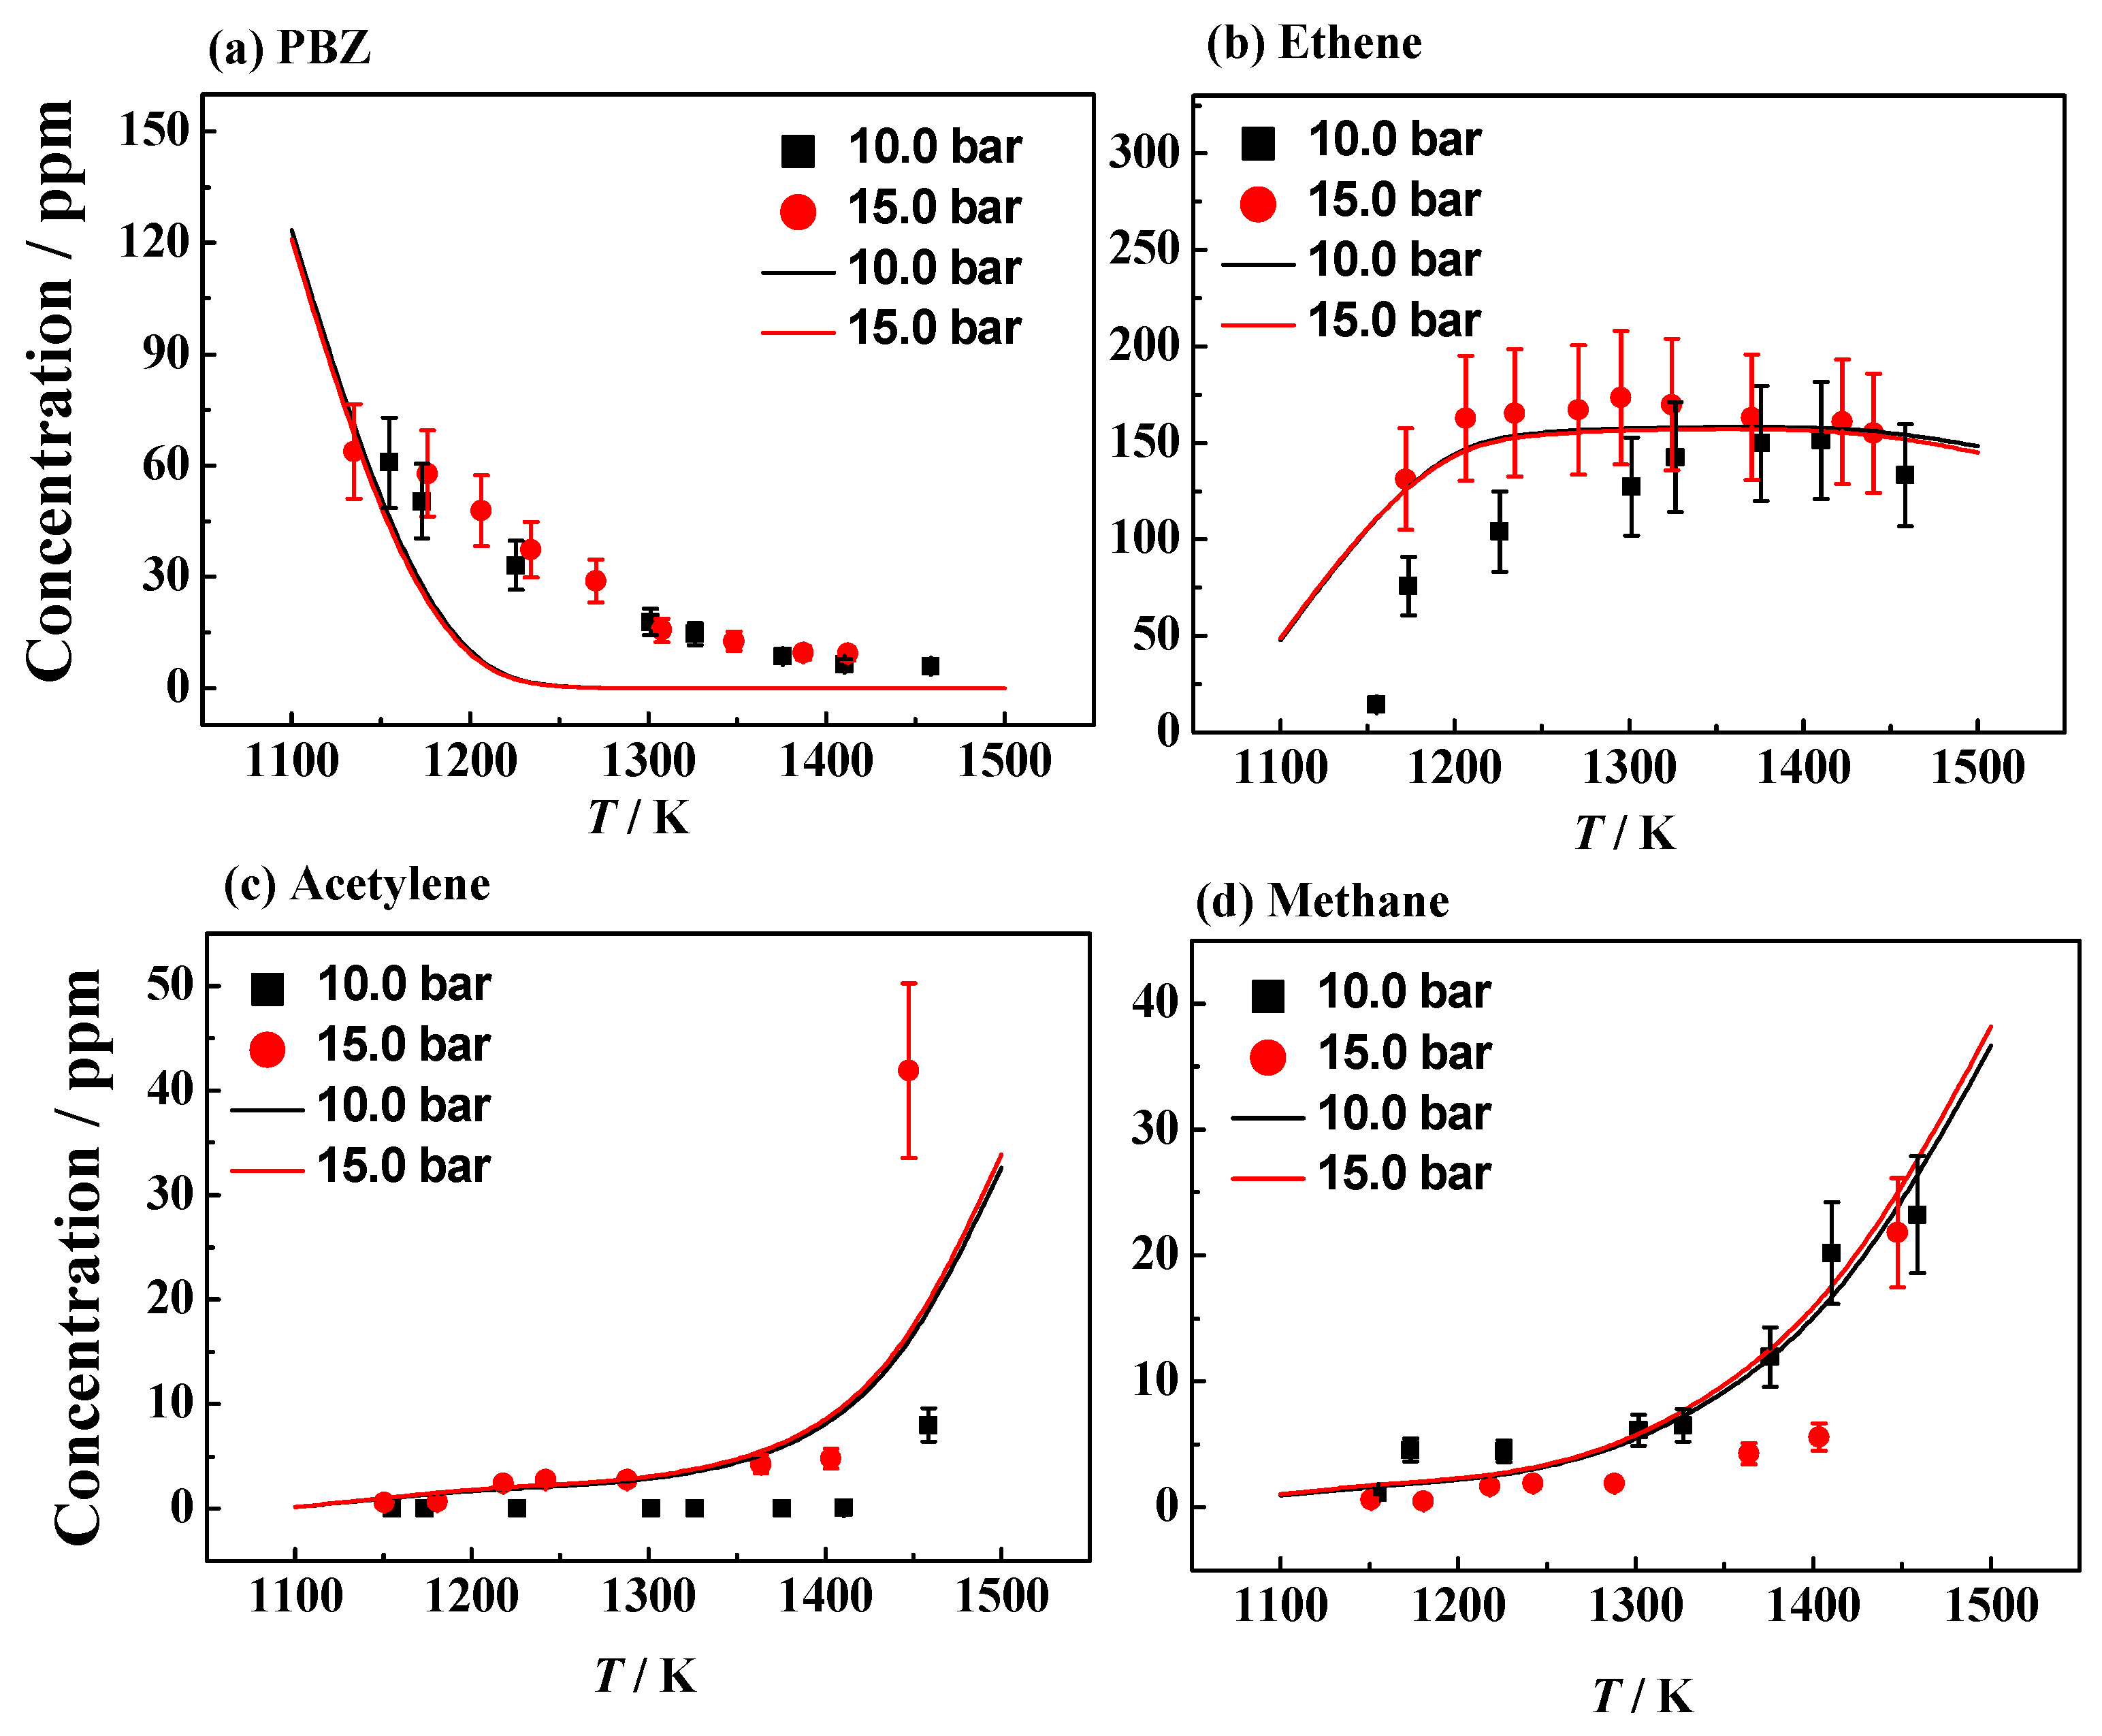
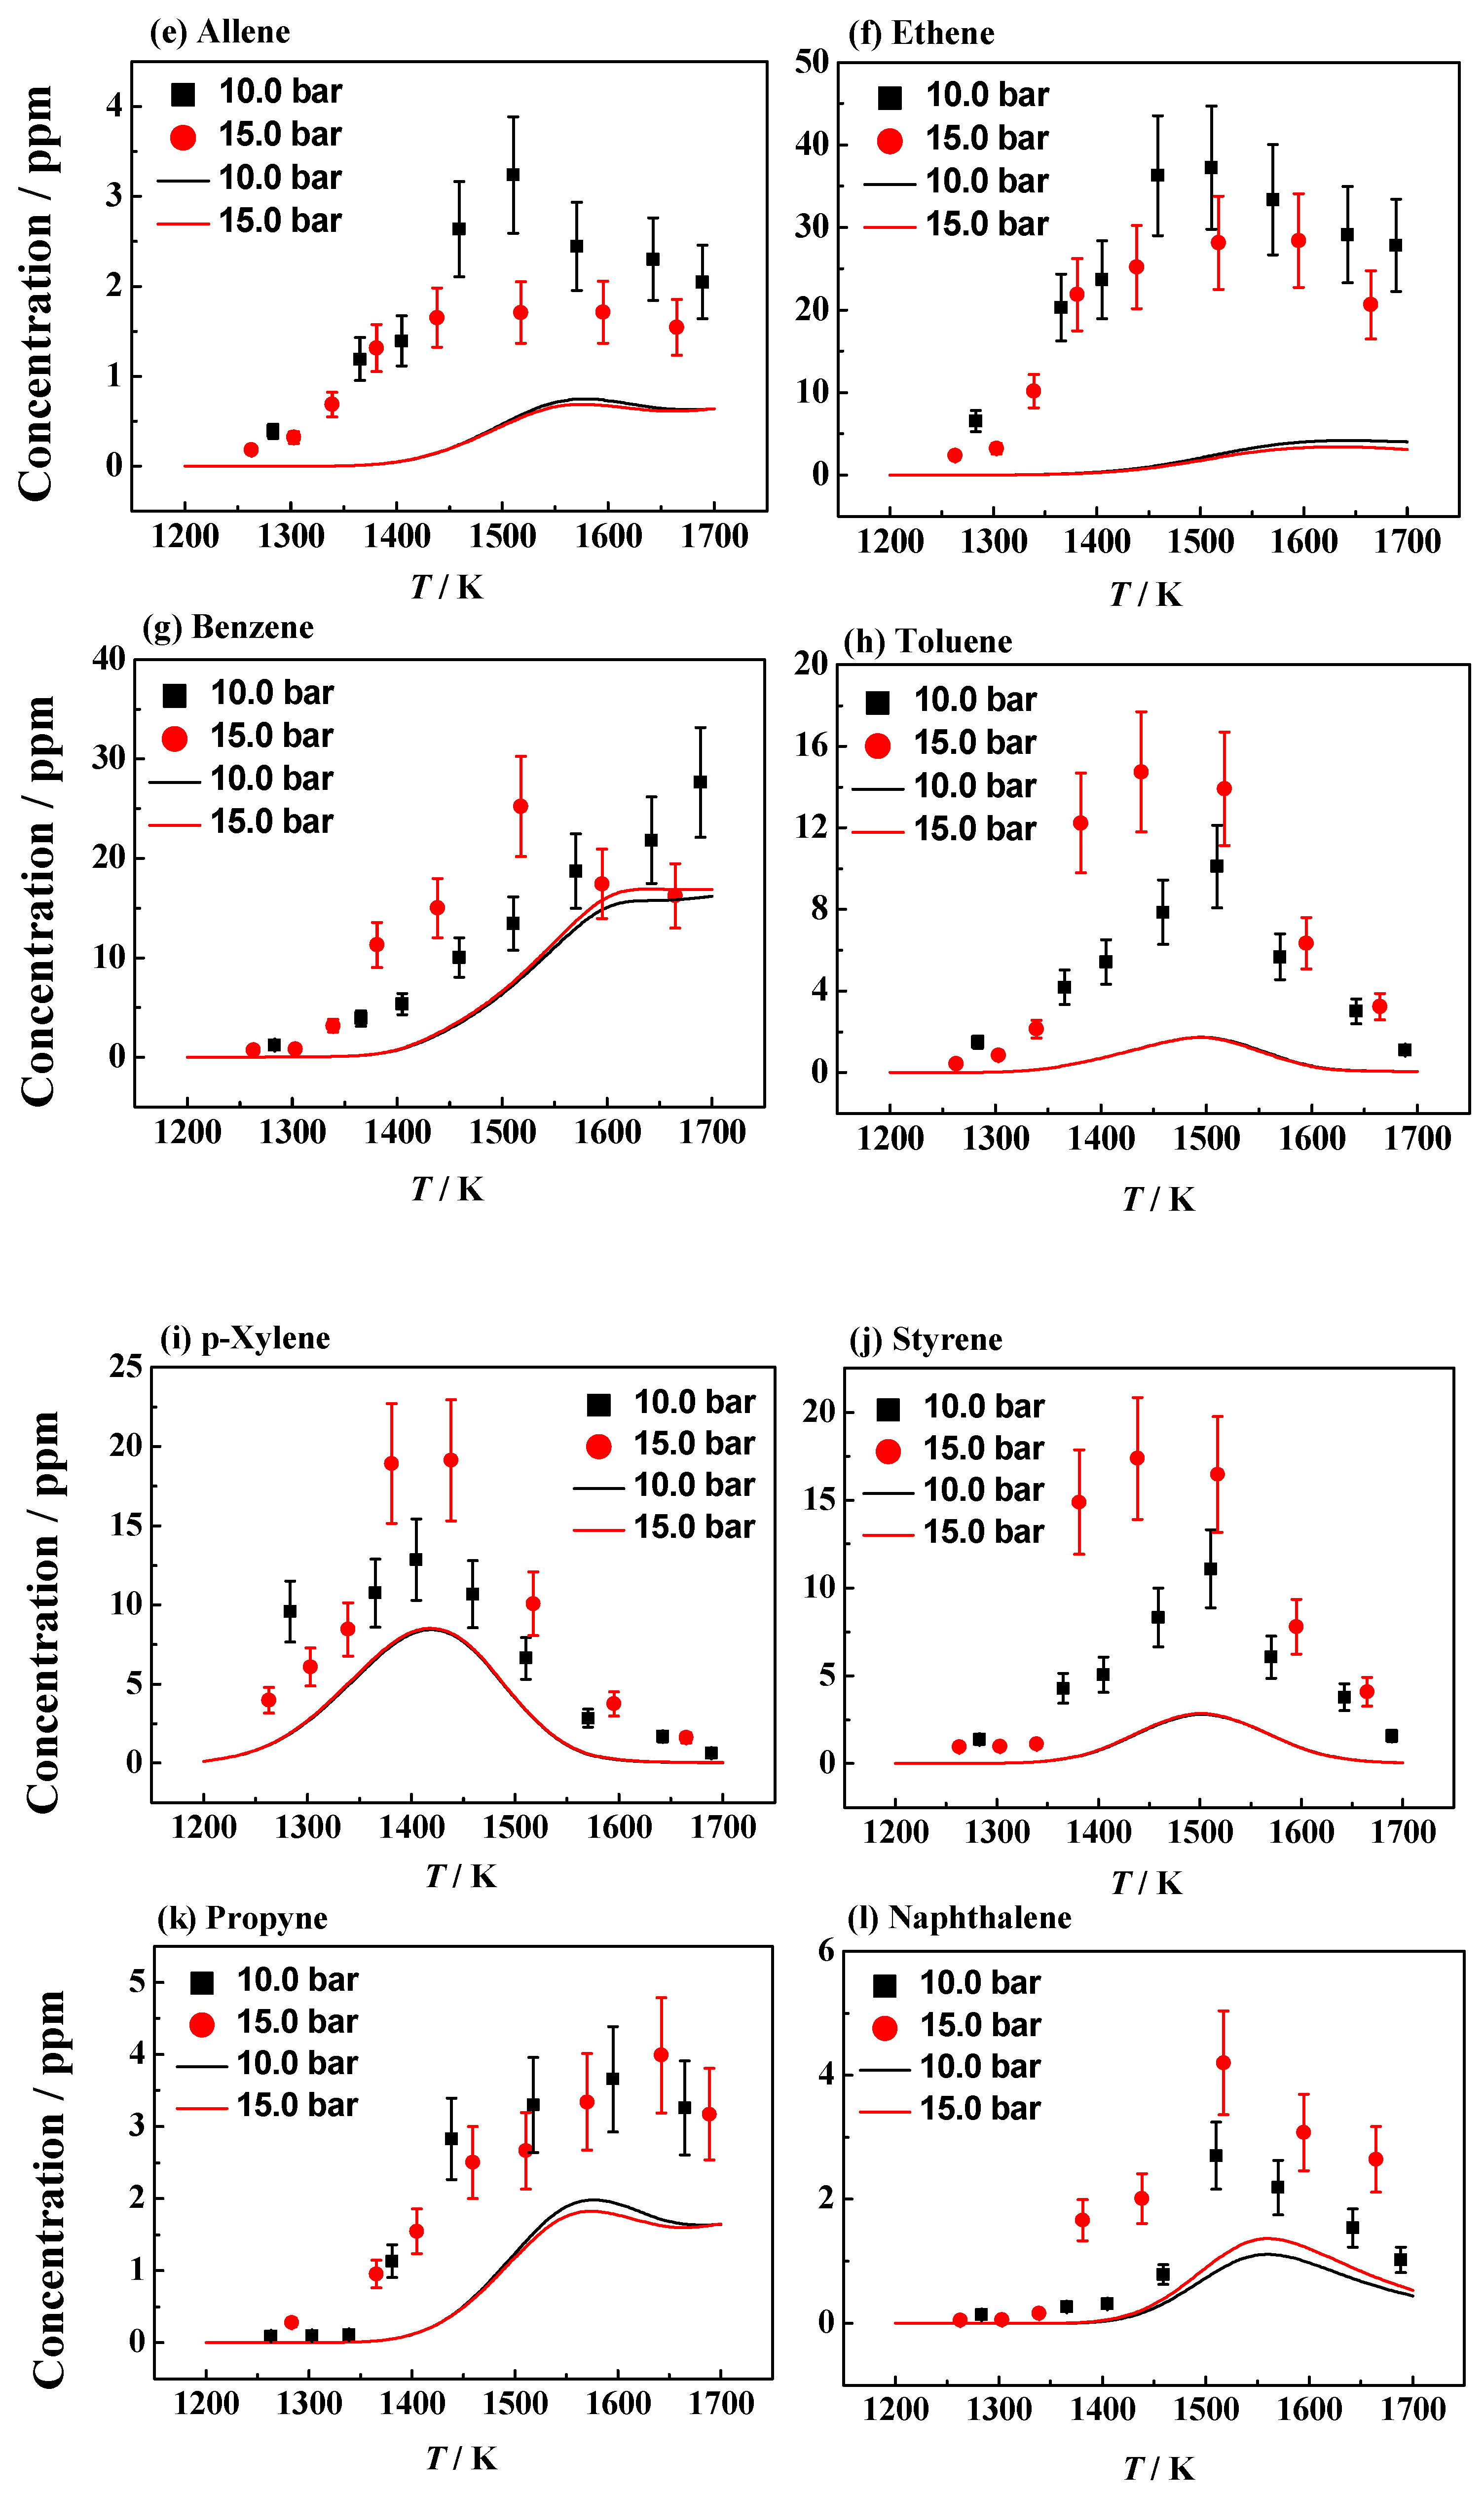
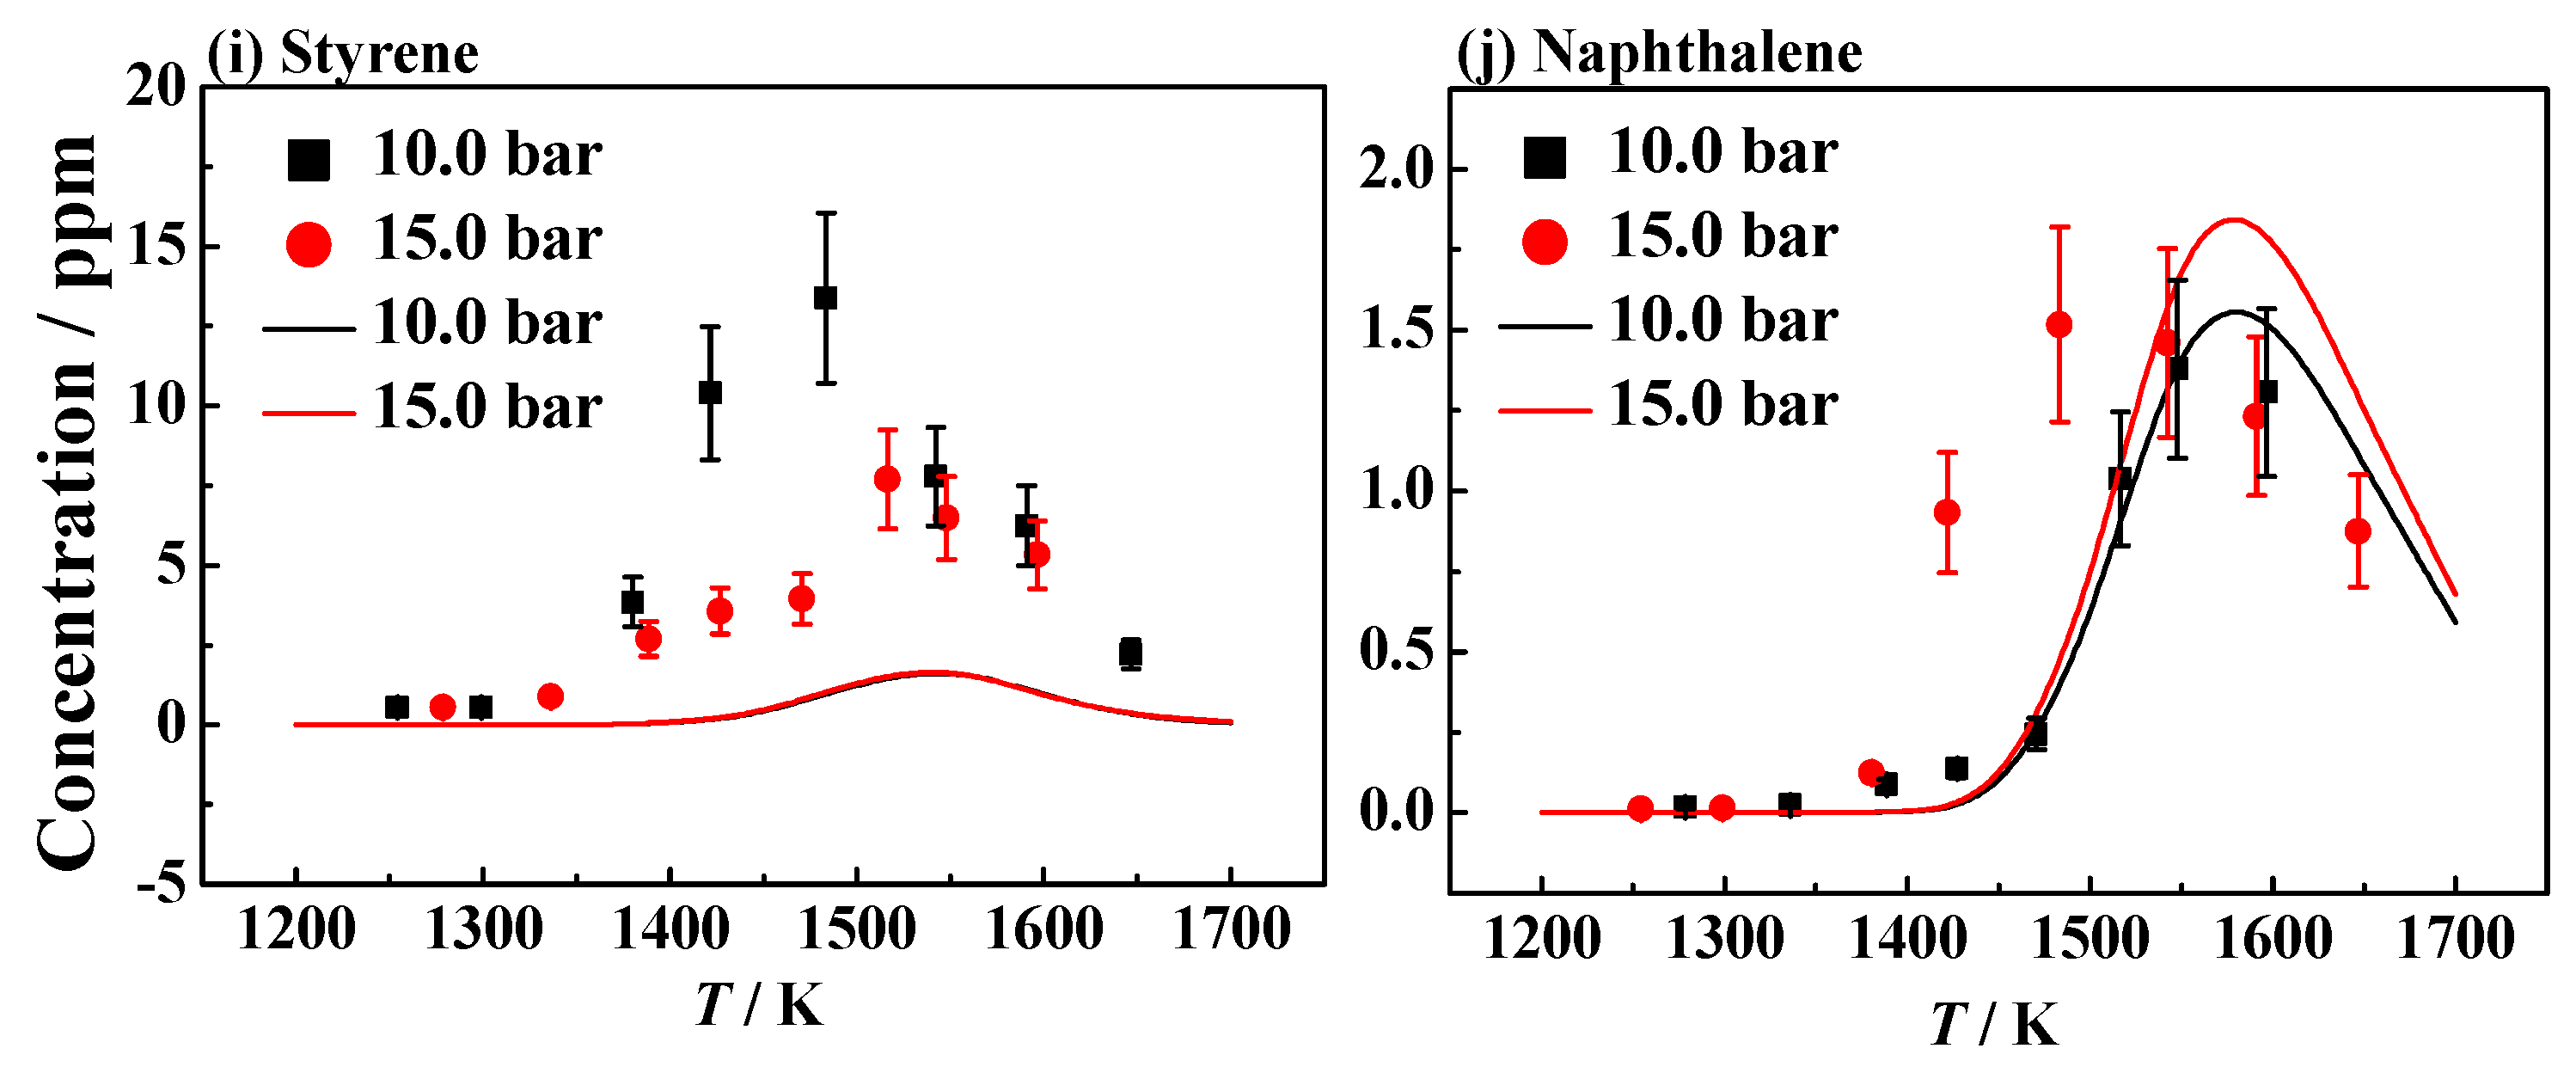
4.1. Experimental and Simulation Results
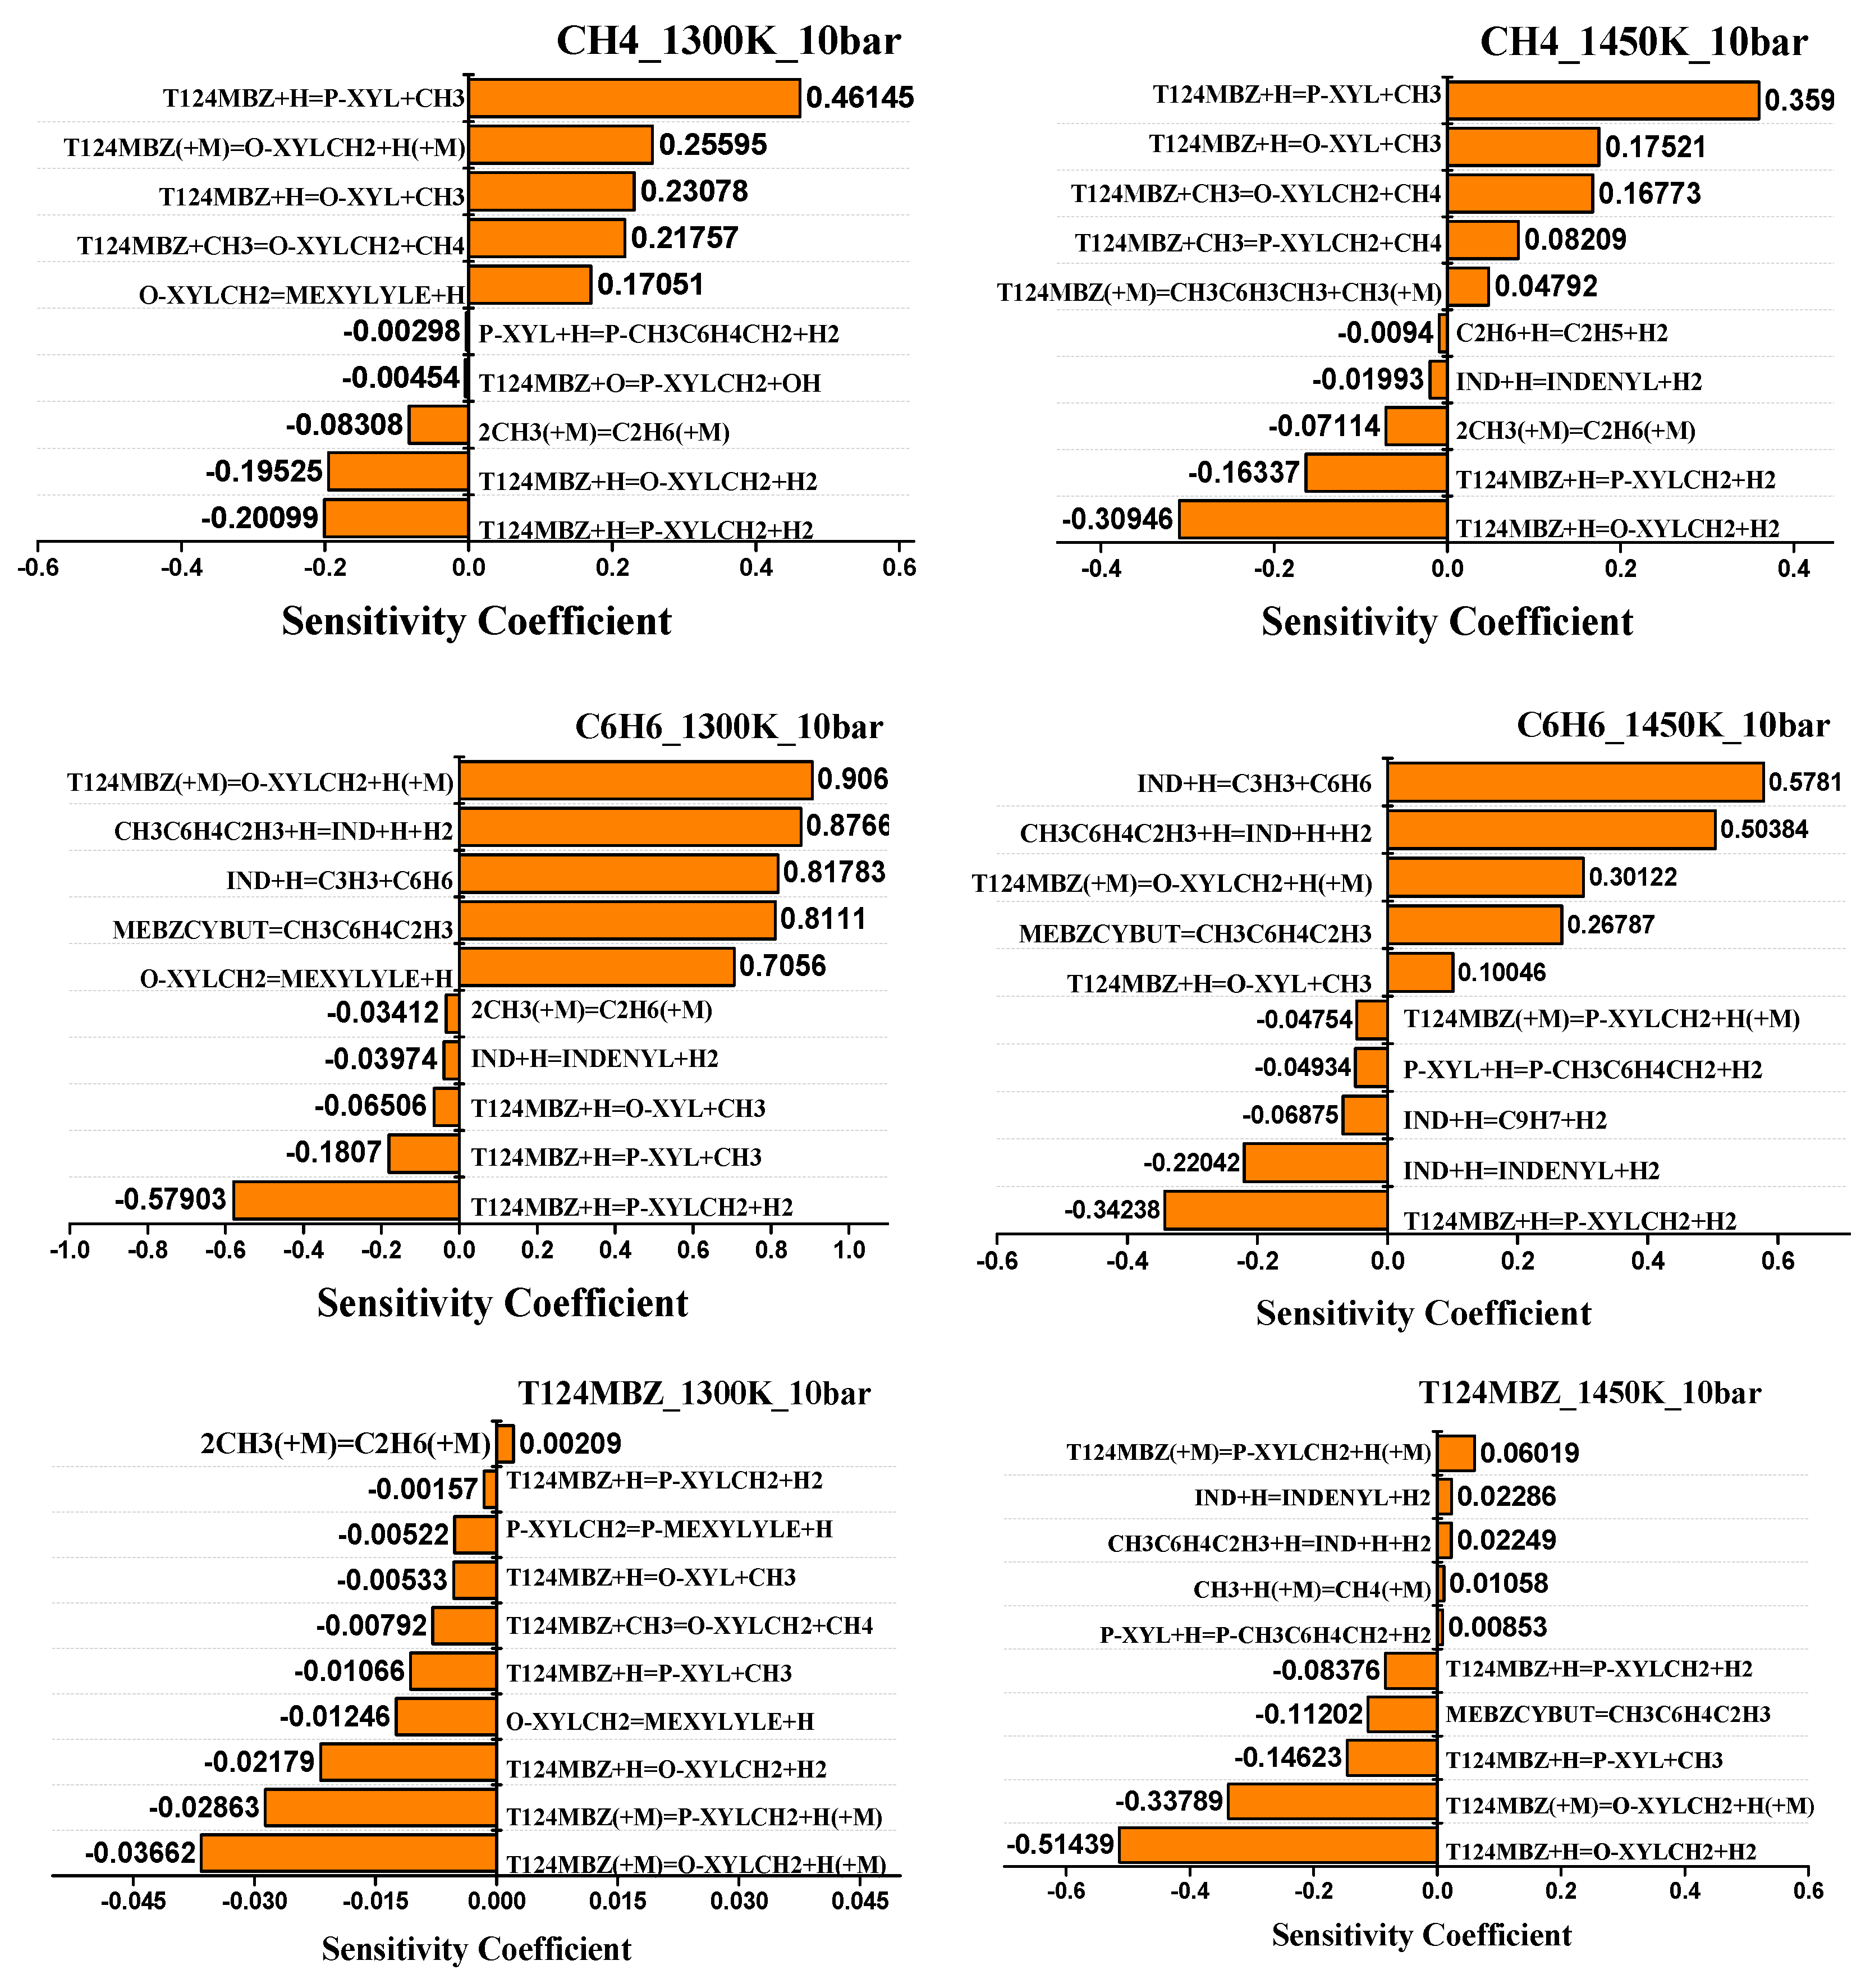
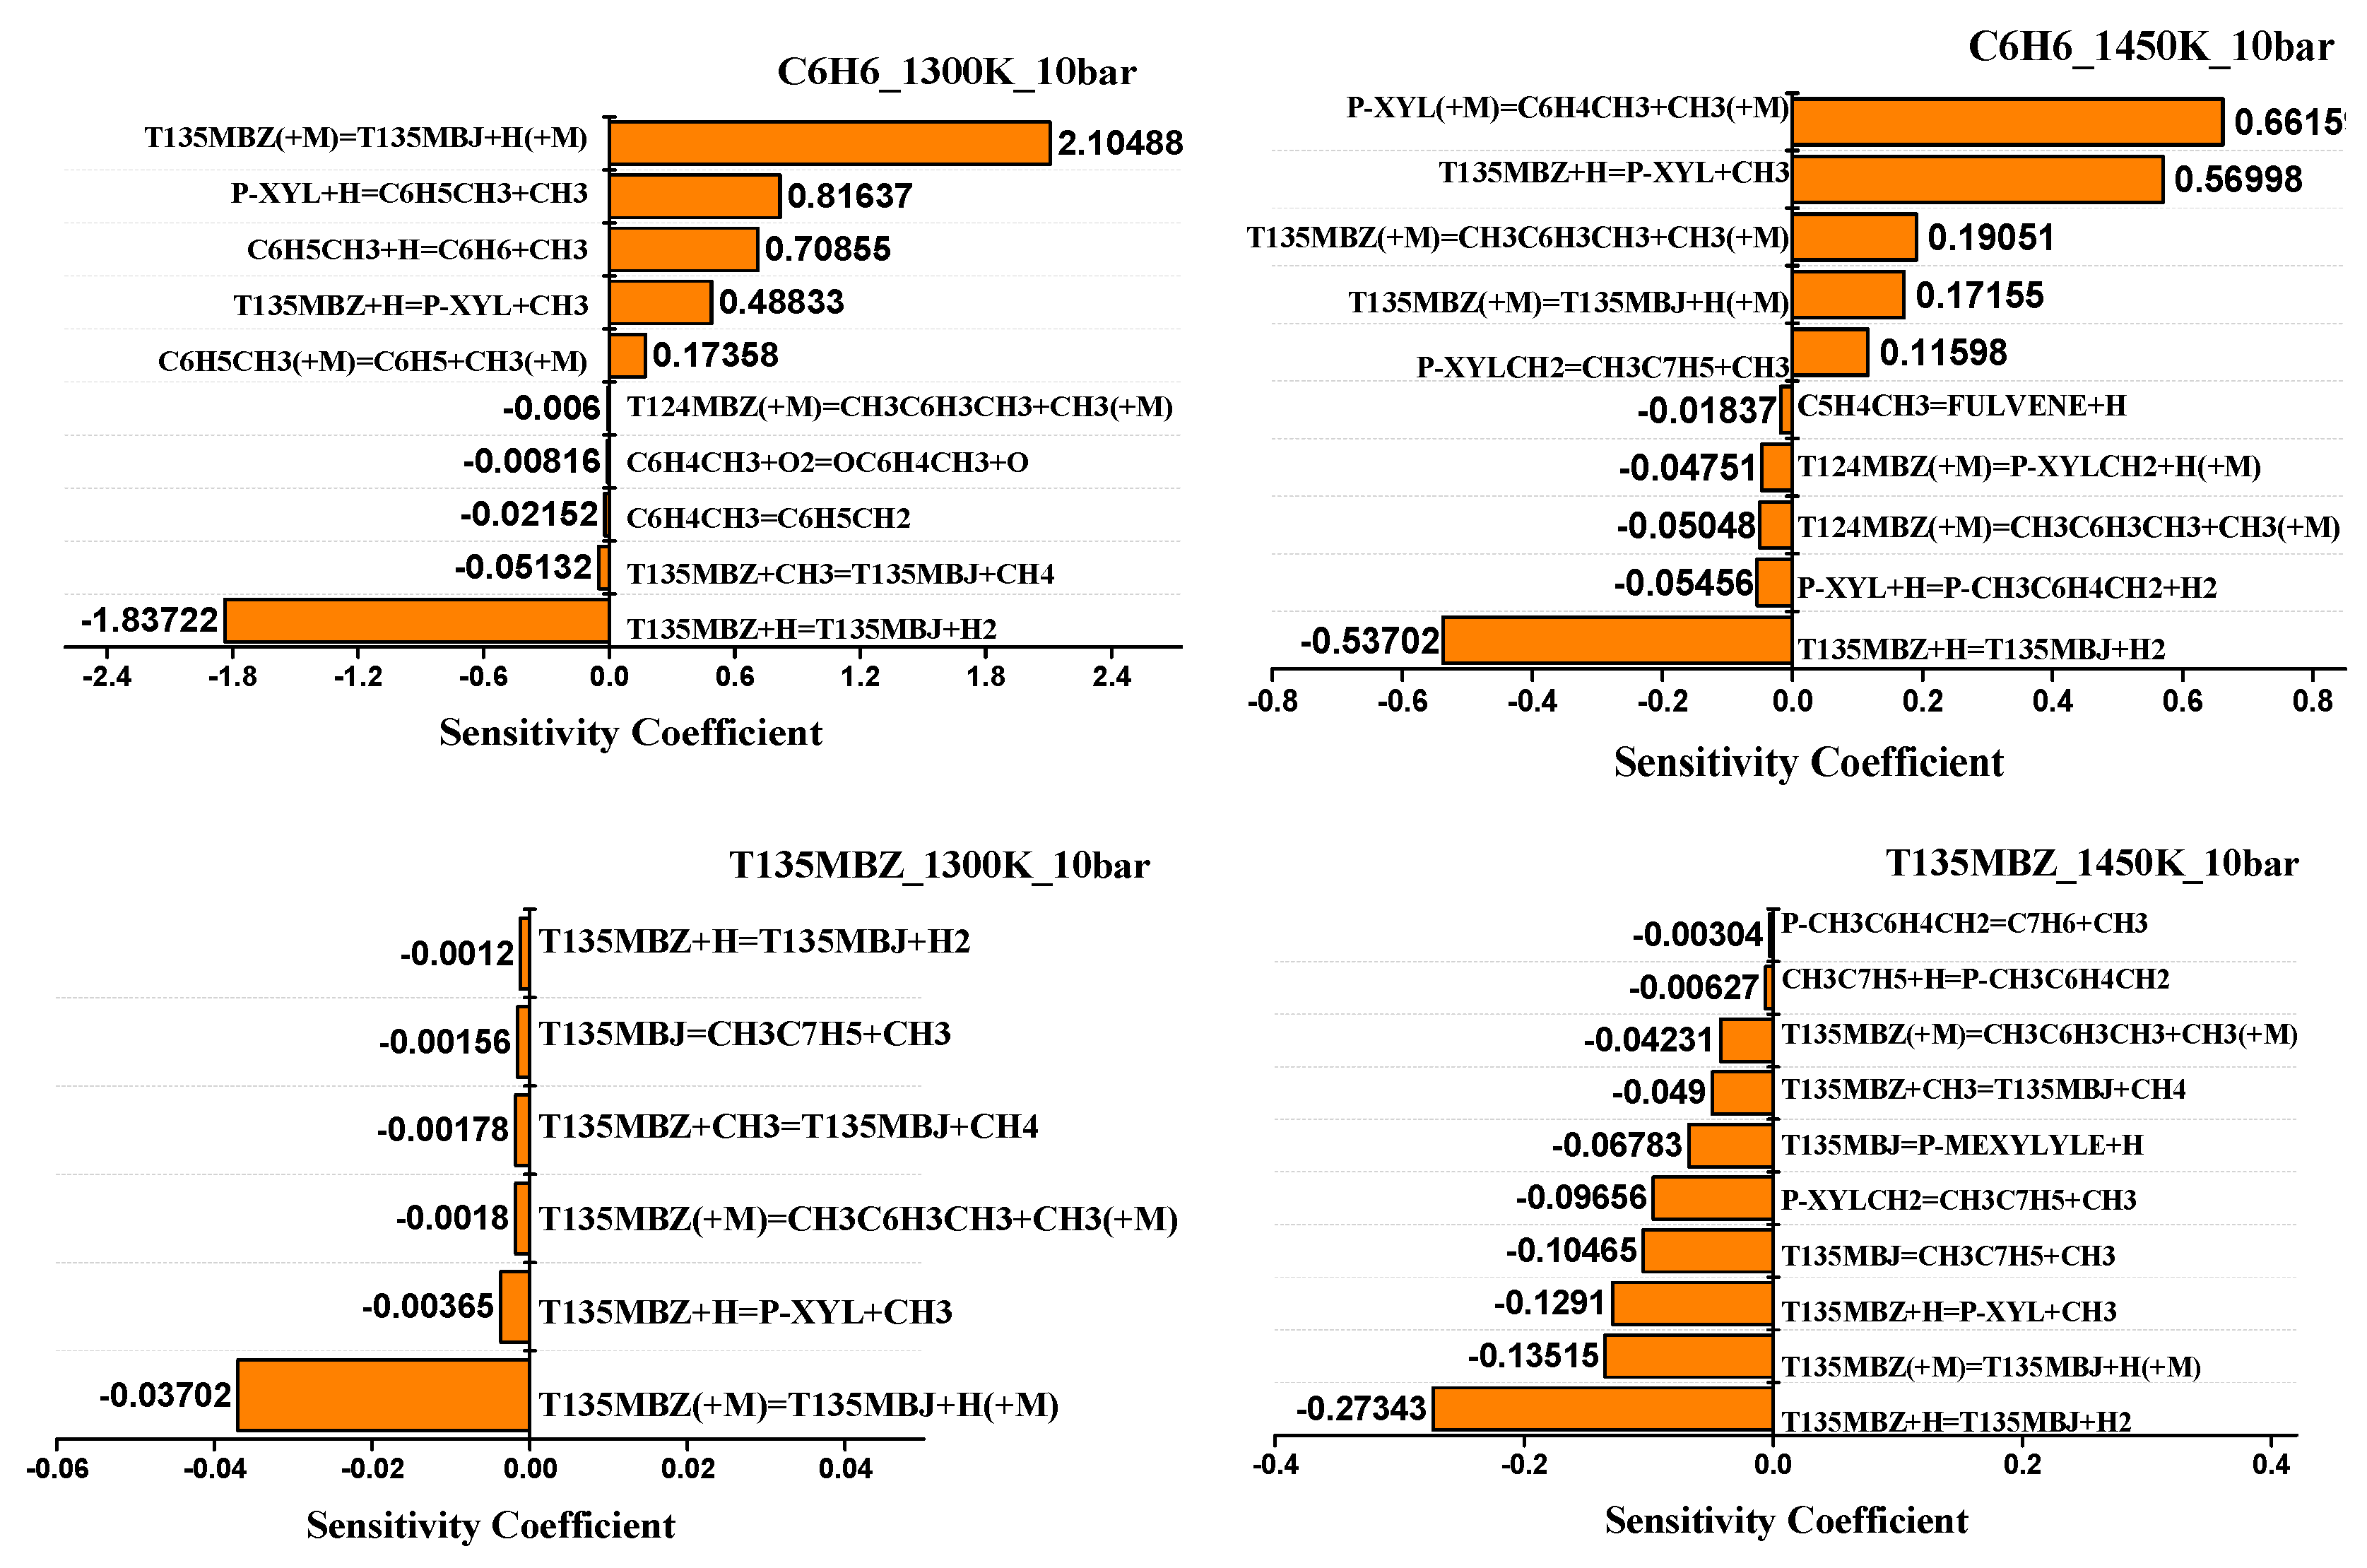
4.2. Sensitivity Analysis
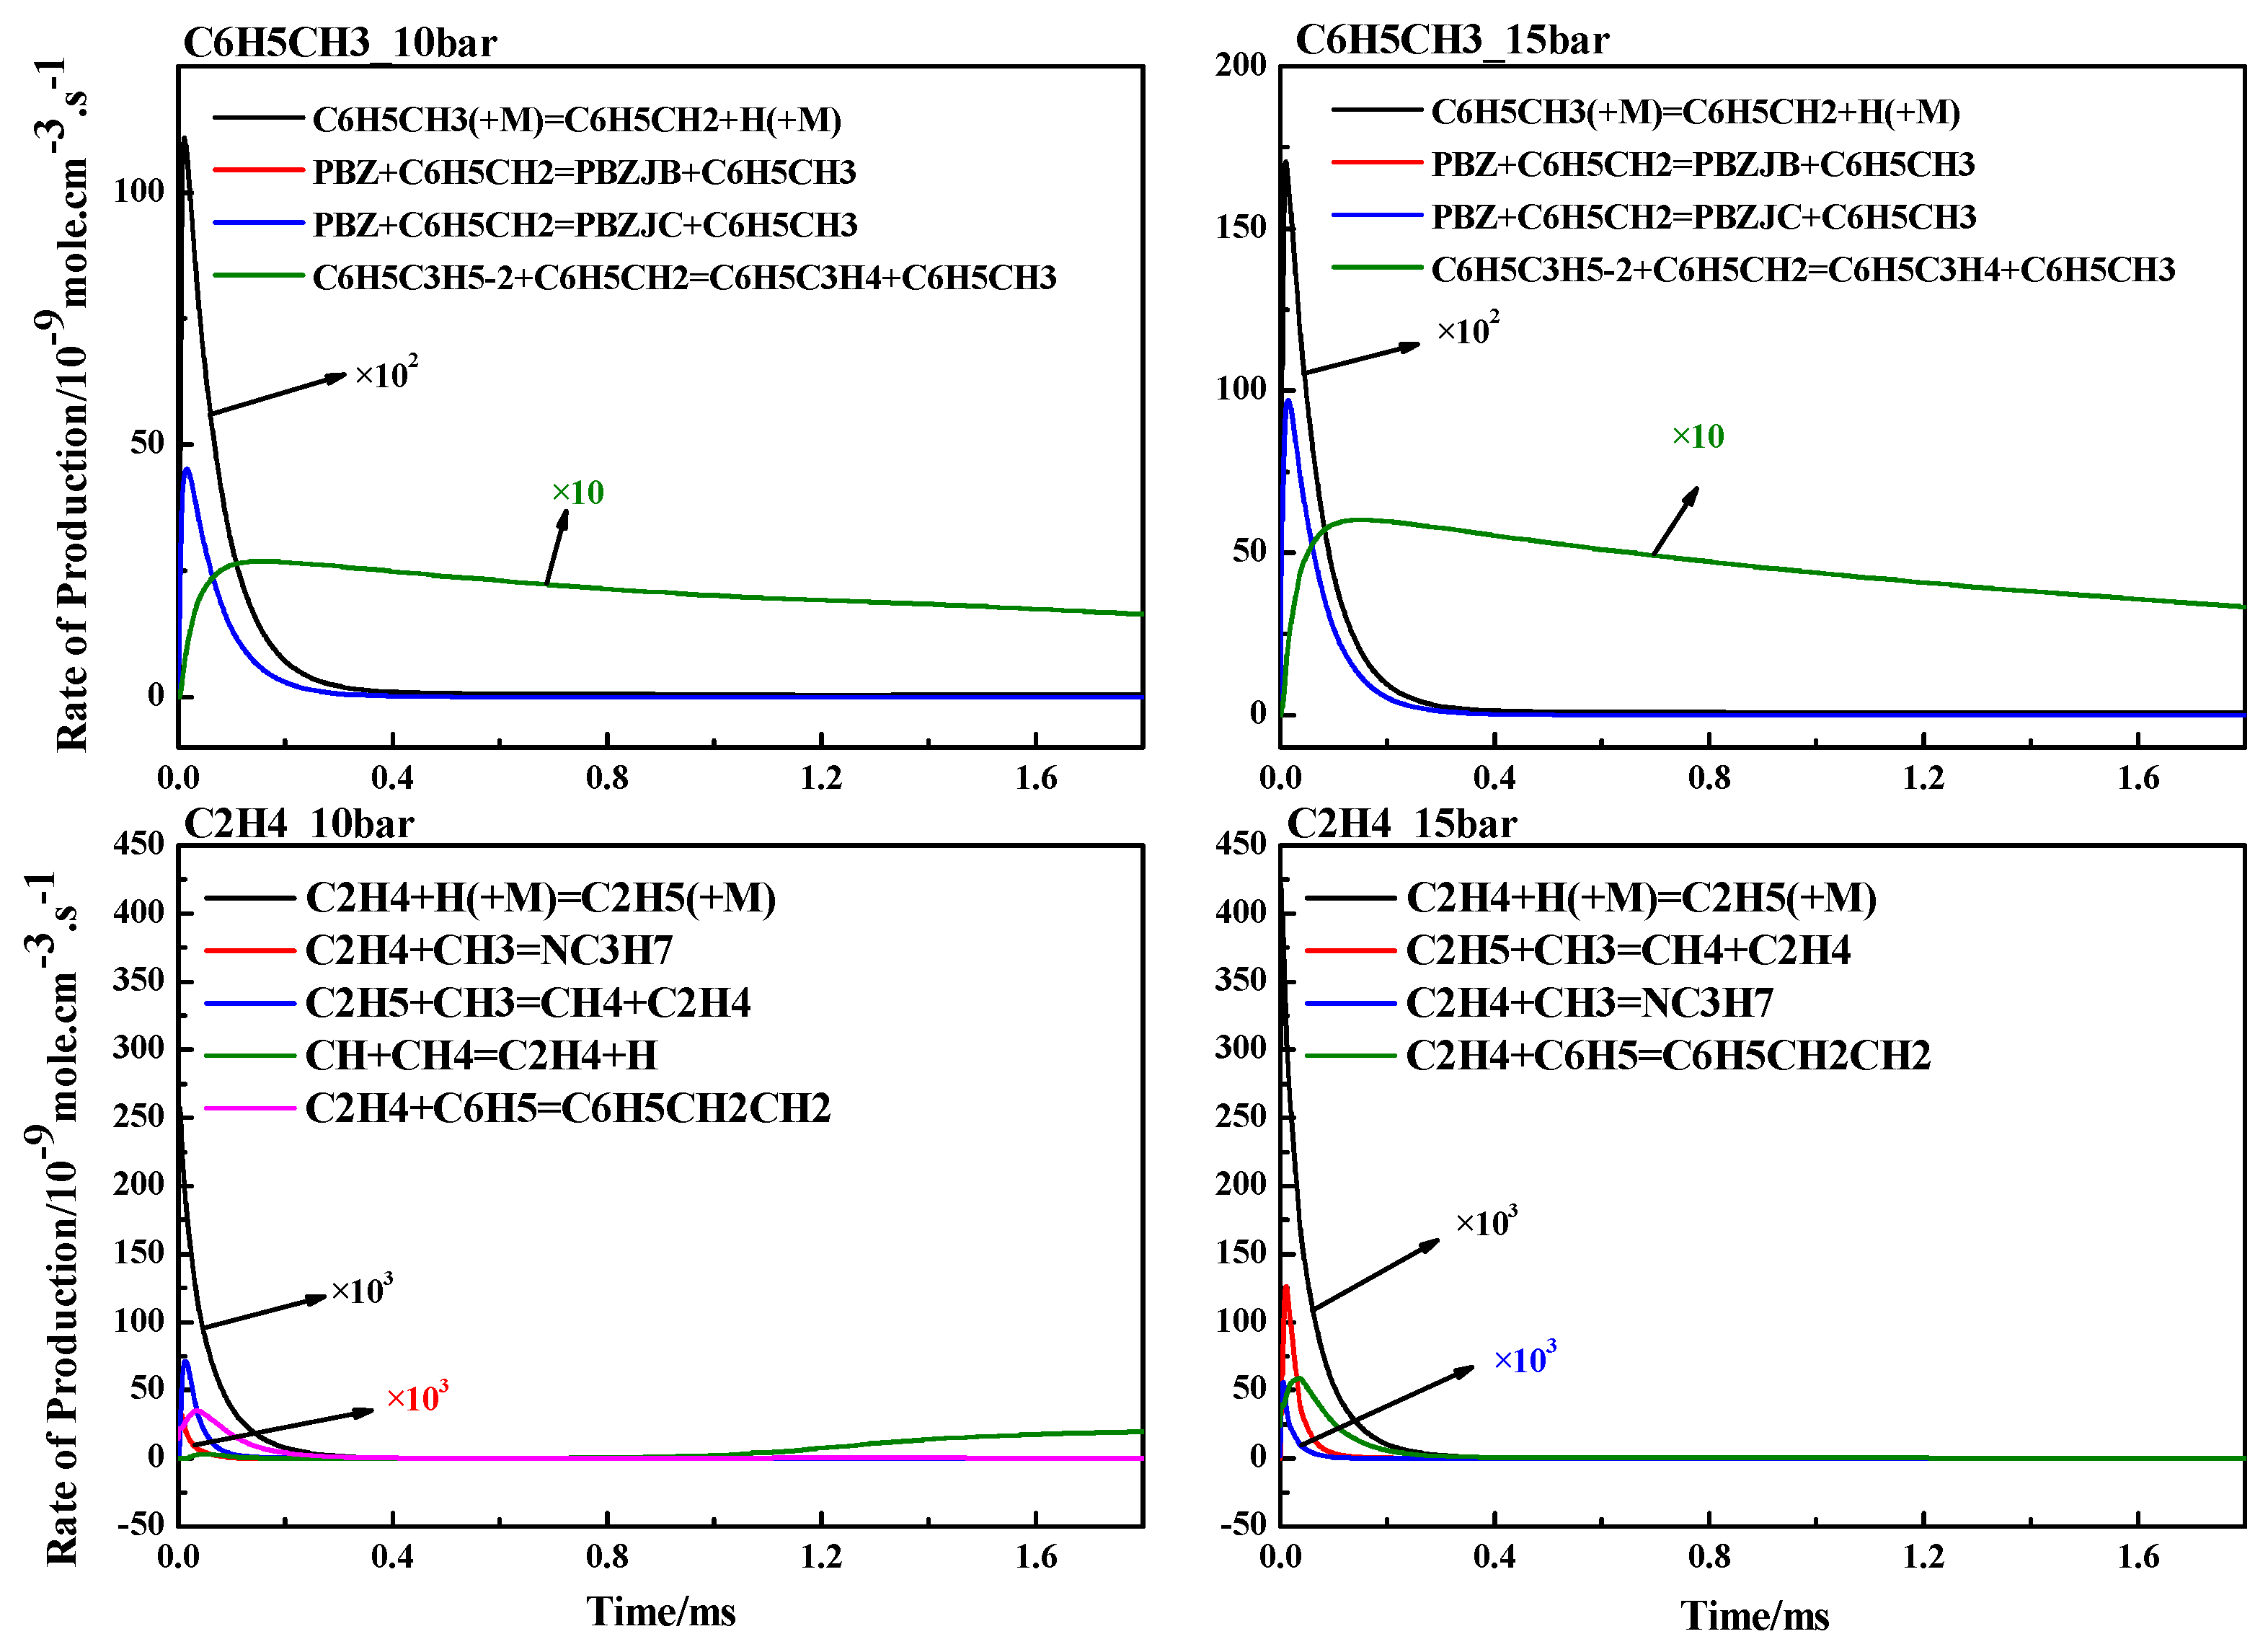
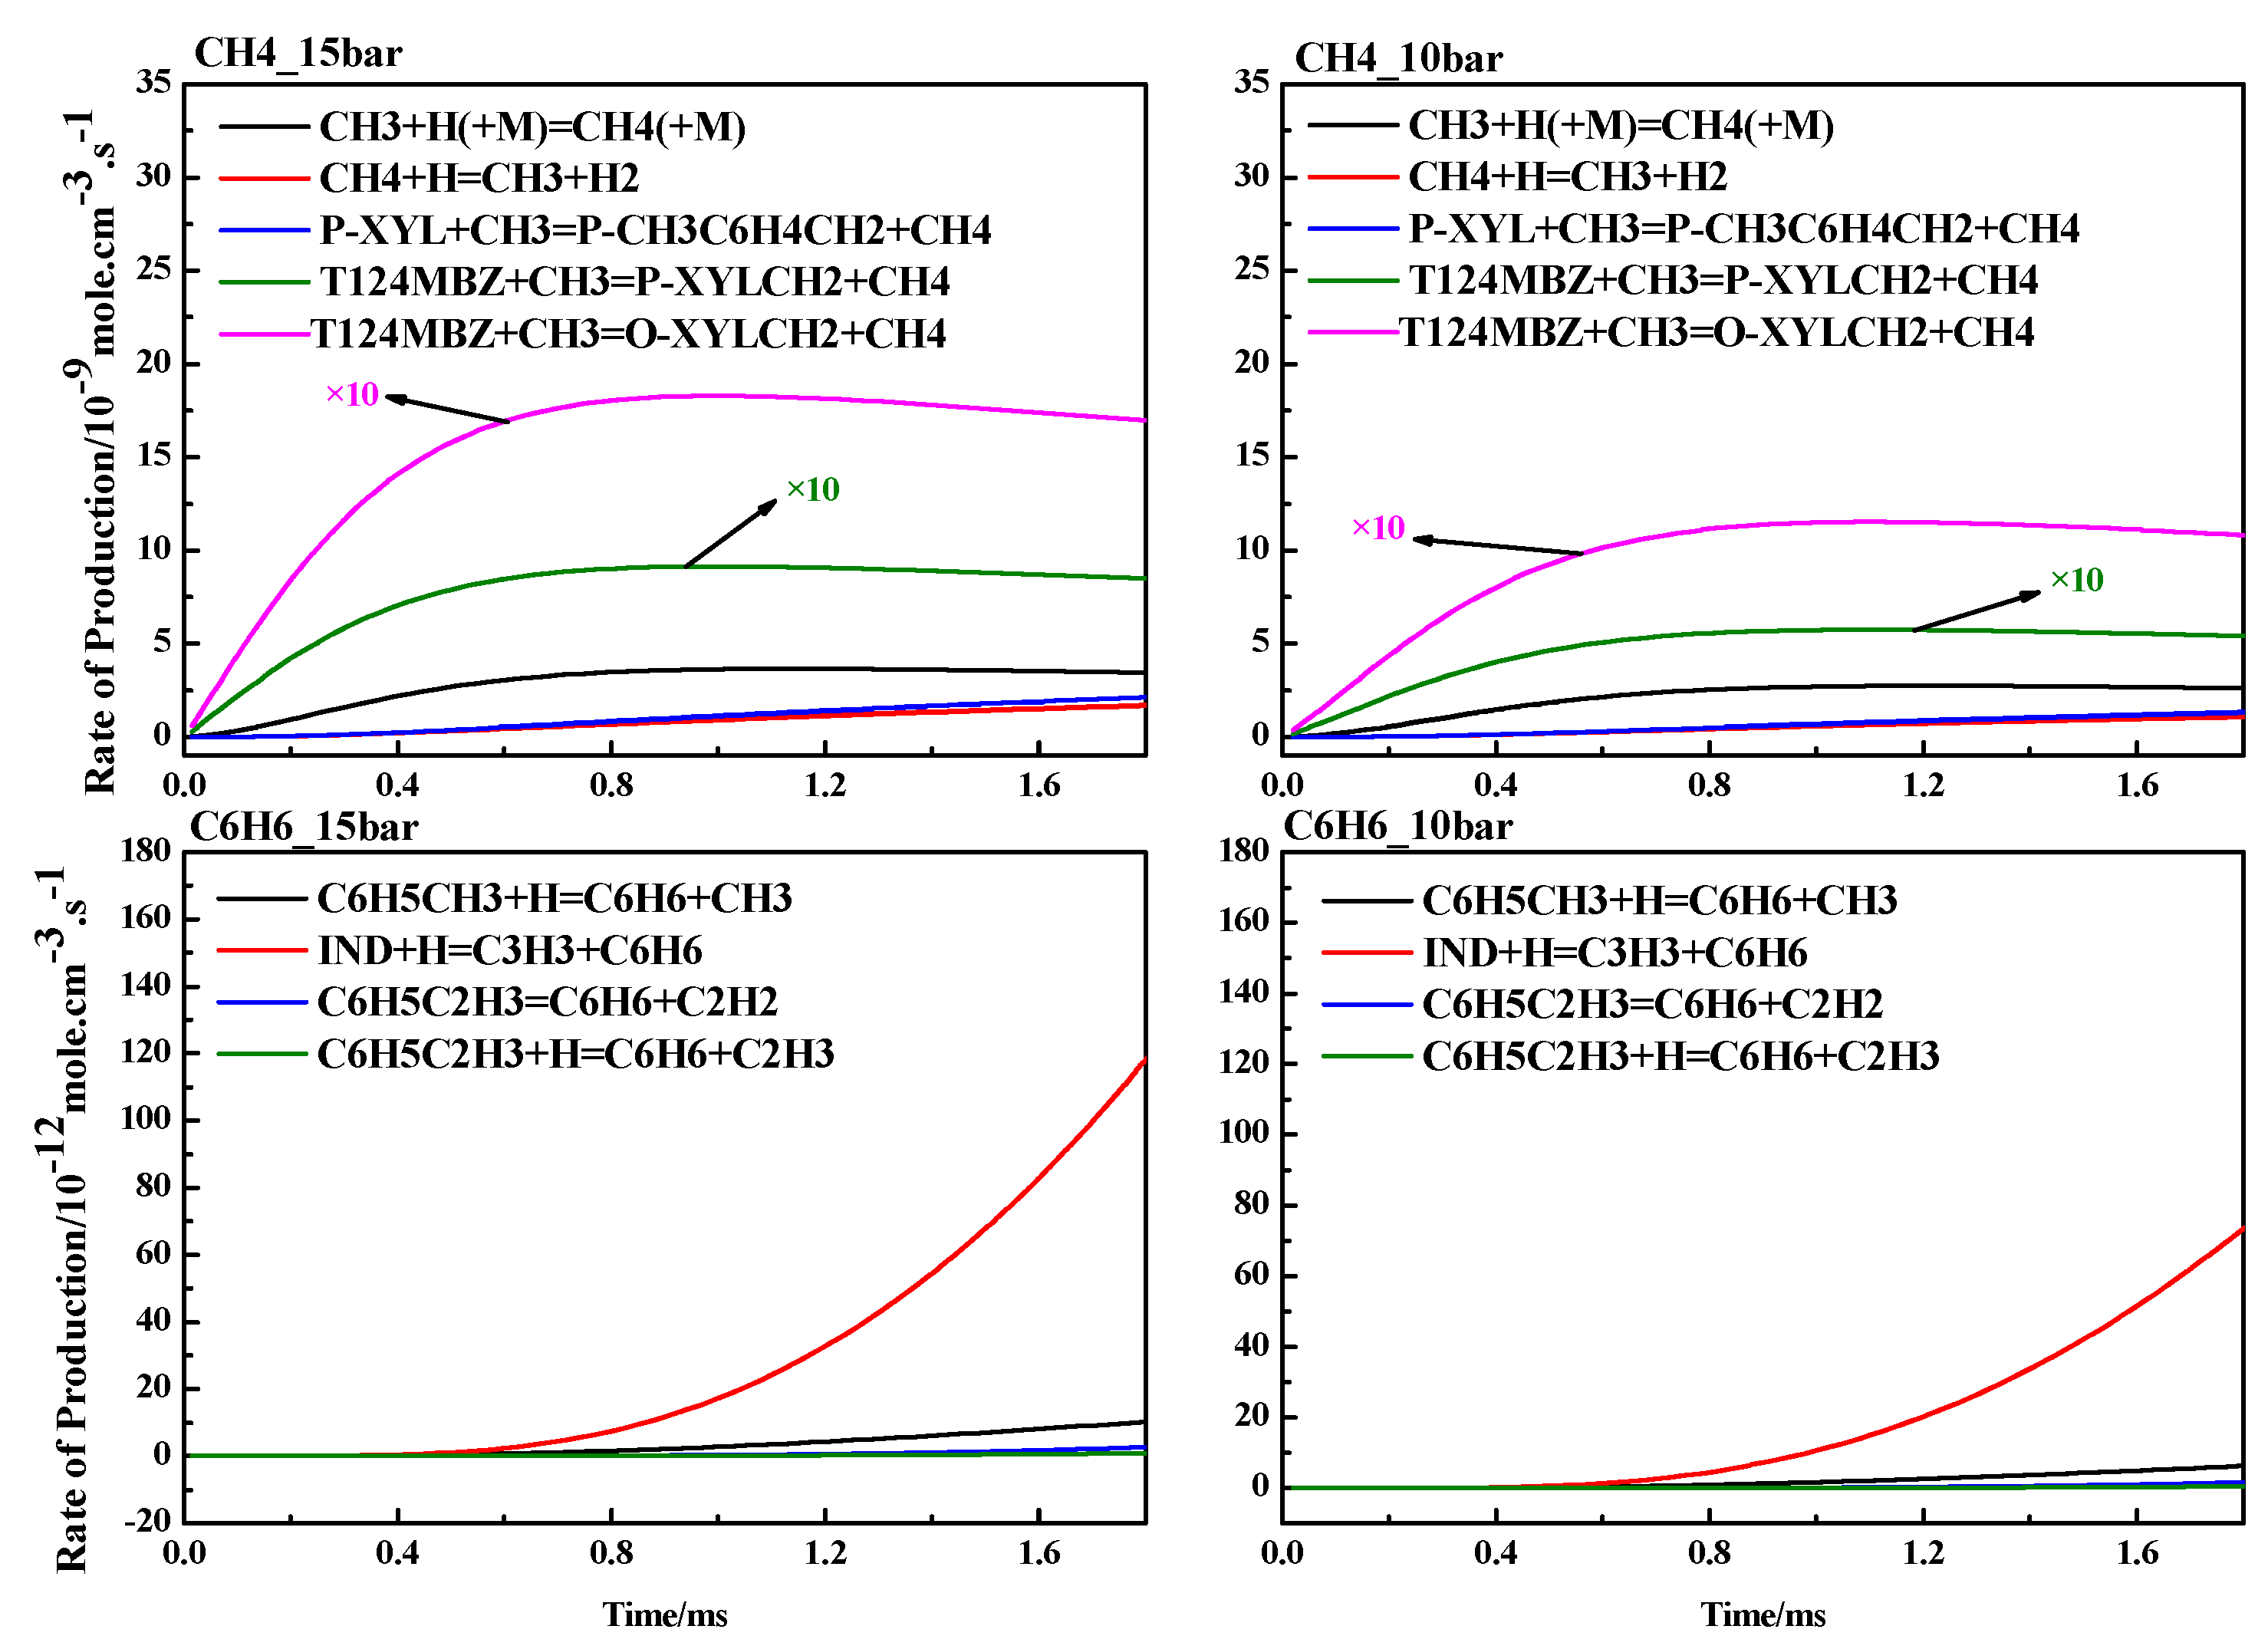
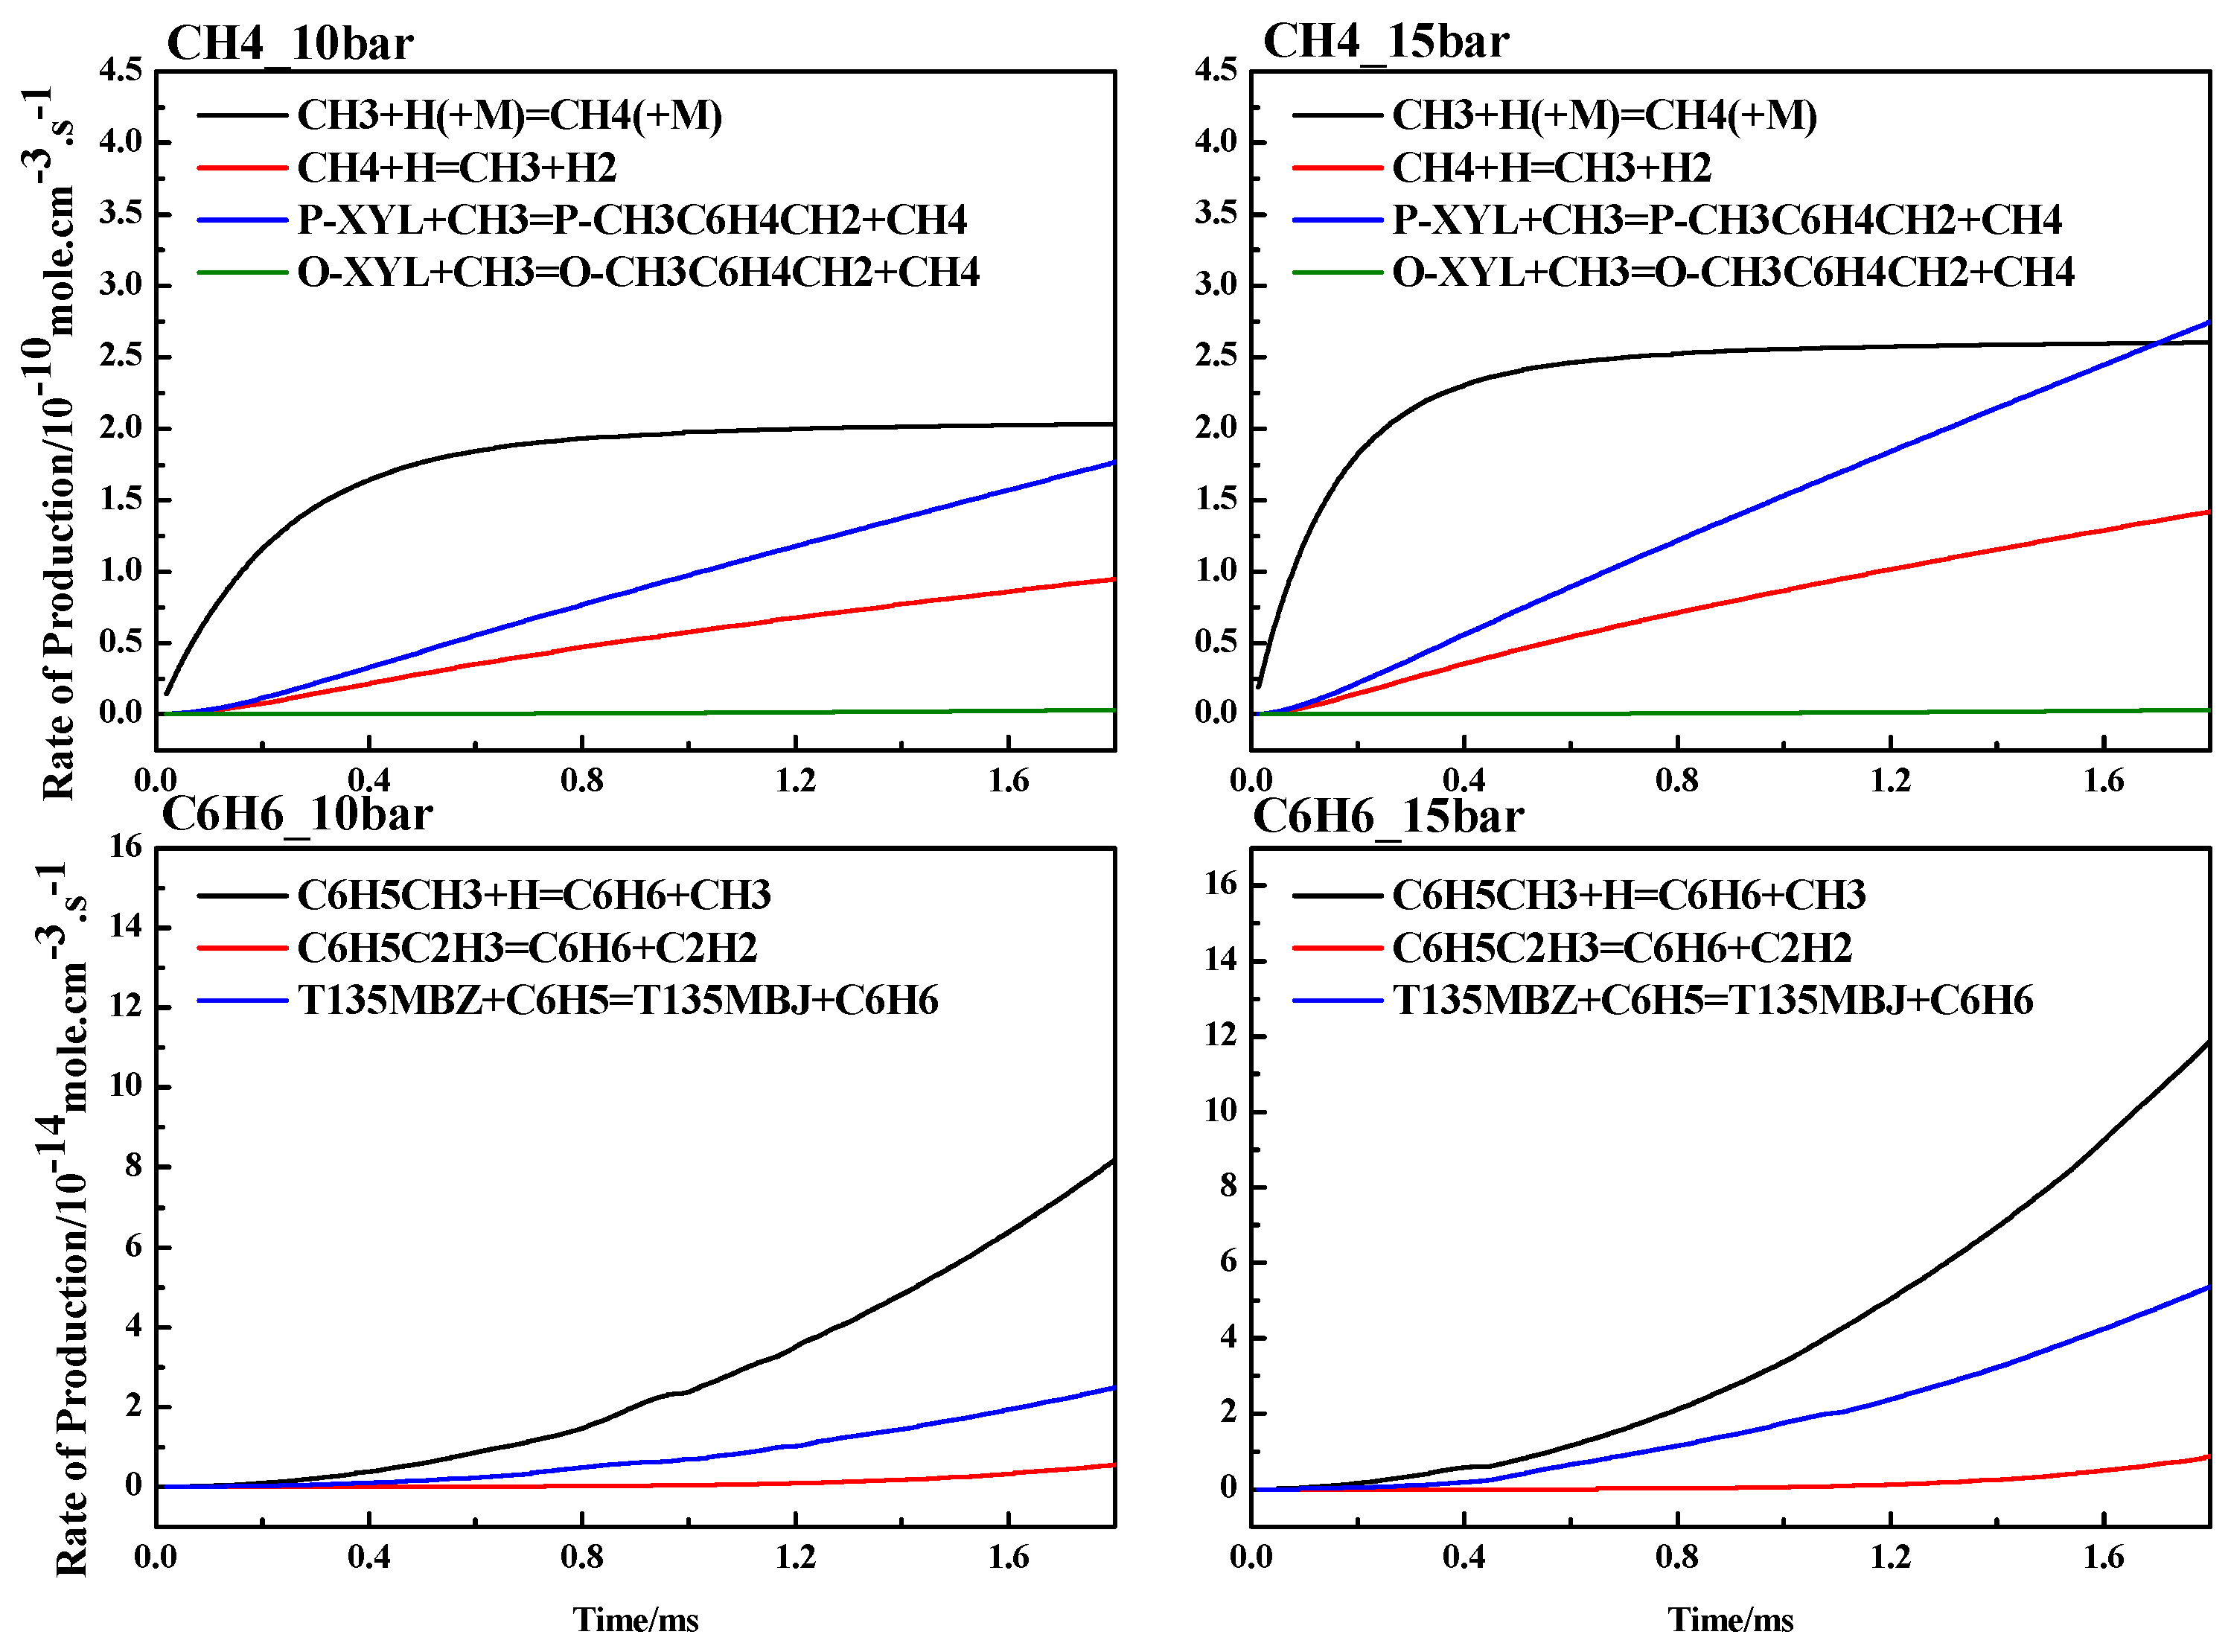
4.3. ROP Analysis
5. Conclusions
Supplementary Materials
Author Contributions
Funding
Data Availability Statement
Acknowledgments
Conflicts of Interest
References
- Battin-Leclerc, F. Detailed chemical kinetic models for the low-temperature combustion of hydrocarbons with application to gasoline and diesel fuel surrogates. Prog. Energy Combust. Sci. 2008, 34, 440–498. [Google Scholar] [CrossRef]
- Dagaut, P.; Cathonnet, M. The ignition, oxidation, and combustion of kerosene: A review of experimental and kinetic modeling. Prog. Energy Combust. Sci. 2006, 32, 48–92. [Google Scholar] [CrossRef]
- Pitz, W.J.; Mueller, C.J. Recent progress in the development of diesel surrogate fuels. Prog. Energy Combust. Sci. 2010, 37, 330–350. [Google Scholar] [CrossRef]
- Sarathy, S.M.; Farooq, A.; Kalghatgi, G.T. Recent progress in gasoline surrogate fuels. Prog. Energy Combust. Sci. 2018, 65, 67–108. [Google Scholar] [CrossRef]
- Nawaz, A.; Razzak, A.S. Co-pyrolysis of biomass and different plastic waste to reduce hazardous waste and subsequent production of energy products: A review on advancement, synergies, and future prospects. Renew. Energy. 2024, 224, 120103. [Google Scholar] [CrossRef]
- Xu, J.-Q.; Guo, J.-L.; Liu, A.-K.; Wang, J.-L.; Tan, N.-X.; Li, X.-Y. Construction of Autoignition Mechanisms for the Combustion of RP-3 Surrogate Fuel and Kinetics Simulation. Acta Phys.-Chim. Sin. 2015, 31, 643–652. [Google Scholar]
- Dooley, S.; Won, S.H.; Heyne, J.; Farouk, T.I.; Ju, Y.; Dryer, F.L.; Kumar, K.; Hui, X.; Sung, C.-J.; Wang, H.; et al. The experimental evaluation of a methodology for surrogate fuel formulation to emulate gas phase combustion kinetic phenomena. Combust. Flame 2012, 159, 1444–1466. [Google Scholar] [CrossRef]
- Honneta, S.; Seshadrib, K.; Niemannb, U.; Petersa, N. A surrogate fuel for kerosene. Proc. Combust. Inst. 2009, 32, 485–492. [Google Scholar] [CrossRef]
- Das, D.D.; John, P.C.S.; McEnally, C.S.; Kim, S.; Pfefferle, L.D. Measuring and predicting sooting tendencies of oxygenates, alkanes, alkenes, cycloalkanes, and aromatics on a unified scale. Combust. Flame 2018, 190, 349–364. [Google Scholar] [CrossRef]
- Liu, Y.-X.; Wang, B.-Y.; Weng, J.-J.; Yu, D.; Richter, S.; Kick, T.; Naumann, C.; Braun-Unkhoff, M.; Tian, Z.-Y. A wide-range experimental and modeling study of oxidation and combustion of n-propylbenzene. Combust. Flame 2018, 191, 53–65. [Google Scholar] [CrossRef]
- Yuan, W.-H.; Li, Y.-Y.; Dagaut, P.; Wang, Y.-Z.; Wang, Z.-D.; Qi, F. A comprehensive experimental and kinetic modeling study of n -propylbenzene combustion. Combust. Flame 2017, 186, 178–192. [Google Scholar] [CrossRef]
- Zhou, Z.; Wang, S.; Huang, D.; Liu, B.; Ning, H. Molecular Dynamics Simulation Study on High Temperature Oxidation Mechanism of n-Propylbenzene. Chem. J. Chin. Univ. 2023, 44, 20230276. [Google Scholar] [CrossRef]
- Johnston, R.J.; Farrell, J.T. Laminar burning velocities and Markstein lengths of aromatics at elevated temperature and pressure. Proc. Combust. Inst. 2004, 30, 217–224. [Google Scholar] [CrossRef]
- Mehl, M.; Herbinet, O.; Dirrenberger, P.; Bounaceur, R.; Glaude, P.-A.; Battin-Leclerc, F.; Pitz, W.J. Experimental and modeling study of burning velocities for alkyl aromatic components relevant to diesel fuels. Proc. Combust. Inst. 2015, 35, 341–348. [Google Scholar] [CrossRef]
- Liang, J.-H.; Li, F.; Cao, S.-T.; Li, X.-L.; Jia, M.-X.; Wang, Q.-D. Comparative study on ignition characteristics of n-propylbenzene, 1,3,5-trimethylbenzene and 1,2,4-trimethylbenzene behind reflected shock waves. Fuel 2022, 325, 124940. [Google Scholar] [CrossRef]
- Roubaud, A.; Minetti, R.; Sochet, L.R. Oxidation and combustion of low alkylbenzenes at high pressure: Comparative reactivity and auto-ignition. Combust. Flame 2000, 121, 535–541. [Google Scholar] [CrossRef]
- Liu, Y.; Tang, C.; Wu, Y.; Yang, M.; Huang, Z. Low temperature ignition delay times measurements of 1,3,5-trimethylbenzene by rapid compression machine. Fuel 2019, 241, 637–645. [Google Scholar] [CrossRef]
- Gudiyella, S.; Brezinsky, K. High pressure study of 1,3,5-trimethylbenzene oxidation. Combust. Flame 2012, 159, 3264–3285. [Google Scholar] [CrossRef]
- Hui, X.; Das, A.K.; Kumar, K.; Sung, C.-J.; Dooley, S.; Dryer, F.L. Laminar flame speeds and extinction stretch rates of selected aromatic hydrocarbons. Fuel 2012, 97, 695–702. [Google Scholar] [CrossRef]
- Hui, X.; Sung, C.-J. Laminar flame speeds of transportation-relevant hydrocarbons and jet fuels at elevated temperatures and pressures. Fuel 2013, 109, 191–200. [Google Scholar] [CrossRef]
- Liu, Y.-X.; Tian, Z.-Y. Oxidation Chemistry of Four C9h12 Isomeric Transportation Fuels: Experimental and Modeling Studies. Combust. Flame 2019, 205, 165–179. [Google Scholar] [CrossRef]
- Zhao, P.-C.; Li, T.; Li, A.; Ma, Y.-Z.; Fang, M.-M.; Li, X.-L. Comprehensive study on particle size distribution, MAH and PAH profiles during alkylbenzene pyrolysis. Fuel 2023, 352, 129099. [Google Scholar] [CrossRef]
- Gudiyella, S.; Brezinsky, K. The high pressure study of n -propylbenzene pyrolysis. Proc. Combust. Inst. 2013, 34, 1767–1774. [Google Scholar] [CrossRef]
- Sun, W.; Hamadi, A.; Abid, S.; Chaumeix, N.; Comandini, A. A comparative kinetic study of C8–C10 linear alkylbenzenes pyrolysis in a single-pulse shock tube. Combust. Flame 2020, 221, 136–149. [Google Scholar] [CrossRef]
- Fusetti, L.; Behar, F.; Bounaceur, R.; Marquaire, P.; Grice, K.; Derenne, S. New insights into secondary gas generation from the thermal cracking of oil: Methylated monoaromatics. A kinetic approach using 1,2,4-trimethylbenzene. Part I: A mechanistic kinetic model. Org. Geochem. A Publ. Int. Assoc. Geochem. Cosmochem. 2010, 41, 146–167. [Google Scholar] [CrossRef]
- Ji, C.; Dames, E.; Wang, H.; Egolfopoulos, F.N. Propagation and extinction of benzene and alkylated benzene flames. Combust. Flame 2012, 159, 1070–1081. [Google Scholar] [CrossRef]
- Panigrahy, S.; Liang, J.-H.; Ghosh, M.K.; Wang, Q.-D.; Zuo, Z.-H.; Nagaraja, S.; Mohamed, A.A.E.-S.; Kim, G.; Vasu, S.S.; Curran, H.J. An experimental and detailed kinetic modeling study of the pyrolysis and oxidation of allene and propyne over a wide range of conditions. Combust. Flame 2021, 233, 111578. [Google Scholar] [CrossRef]
- Rao, P.N.; Kunzru, K. Thermal cracking of JP-10: Kinetics and product distribution. J. Anal. Appl. Pyrolysis 2006, 76, 154–160. [Google Scholar]
- Mohamed, A.A.E.-S.; Sahu, A.B.; Panigrahy, S.; Baigmohammadi, M.; Bourque, G.; Curran, H. The effect of the addition of nitrogen oxides on the oxidation of propane: An experimental and modeling study. Combust. Flame 2022, 245, 112306. [Google Scholar] [CrossRef]
- Nagaraja, S.S.; Power, J.; Kukkadapu, G.; Dong, S.; Wagnon, S.W.; Pitz, W.J.; Curran, H.J. A single pulse shock tube study of pentene isomer pyrolysis. Proc. Combust. Inst. 2021, 38, 881–889. [Google Scholar] [CrossRef]
- Panigrahy, S.; Liang, J.; Nagaraja, S.S.; Zuo, Z.; Kim, G.; Dong, S.; Kukkadapu, G.; Pitz, W.J.; Vasu, S.S.; Curran, H.J. A comprehensive experimental and improved kinetic modeling study on the pyrolysis and oxidation of propyne. Proc. Combust. Inst. 2021, 38, 479–488. [Google Scholar] [CrossRef]
- Petersen, E.L.; Rickard, M.J.A.; Crofton, M.W.; Abbey, E.D.; Traum, M.J.; Kalitan, D.M. A facility for gas- and condensed-phase measurements behind shock waves. Meas. Sci. Technol. 2005, 16, 1716–1729. [Google Scholar] [CrossRef]
- Nagaraja, S.S.; Kukkadapu, G.; Panigrahy, S.; Liang, J.; Lu, H.; Pitz, W.J.; Curran, H.J. A pyrolysis study of allylic hydrocarbon fuels. Int. J. Chem. Kinet. 2020, 52, 964–978. [Google Scholar] [CrossRef]
- He, R. Research on the High—Temperature Pyrolysis Characteristics of Allene and Propyne Based on a Single—Pulse Shock Tube. Master’s Thesis, North University of China, Taiyuan, China, 2022. [Google Scholar] [CrossRef]
- Wang, H.; Dames, E.; Sirjean, B.; Sheen, D.A.; Tango, R.; Violi, A.; Lai, J.Y.W.; Egolfopoulos, F.N.; Davidson, D.F.; Hanson, R.K.; et al. A High-Temperature Chemical Kinetic Model of n-Alkane (Up to n-Dodecane), Cyclohexane, and Methyl-, Ethyl-, n-Propyl and n-Butyl-cyclohexane Oxidation at High Temperatures, JetSurF. version 2.0. 2010. Available online: http://web.stanford.edu/group/haiwanglab/JetSurF/JetSurF2.0/index.html (accessed on 19 September 2010).
- Kukkadapu, G.; Kang, D.; Wagnon, S.W.; Zhang, K.; Mehl, M.; Monge-Palacios, M.; Wang, H.; Goldsborough, S.S.; Westbrook, C.K.; Pitz, W.J. Kinetic modeling study of surrogate components for gasoline, jet and diesel fuels: C7-C11 methylated aromatics. Proc. Combust. Inst. 2019, 37, 521–529. [Google Scholar] [CrossRef]
- Nagaraja, S.S.; Sahu, A.B.; Panigrahy, S.; Curran, H.J. A fundamental study on the pyrolysis of hydrocarbons. Combust. Flame 2021, 233, 111579. [Google Scholar] [CrossRef]
- Wang, Q.-D.; Panigrahy, S.; Yang, S.-Y.; Martinez, S.; Liang, J.-H.; Curran, H.J. Development of Multipurpose Skeletal Core Combustion Chemical Kinetic Mechanisms. Energy Fuels 2021, 35, 6921–6927. [Google Scholar] [CrossRef]
- Ramalingam, A.; Panigrahy, S.; Fenard, Y.; Curran, H.; Heufer, K.A. A chemical kinetic perspective on the low-temperature oxidation of propane/propene mixtures through experiments and kinetic analyses. Combust. Flame 2021, 223, 361–375. [Google Scholar] [CrossRef]
- Nagaraja, S.S.; Liang, J.-H.; Dong, S.-J.; Panigrahy, S.; Sahu, A.; Kukkadapu, G.; Wagnon, S.W.; Pitz, W.J.; Curran, H.J. A hierarchical single-pulse shock tube pyrolysis study of C2–C6 1-alkenes. Combust. Flame 2020, 219, 456–466. [Google Scholar] [CrossRef]
- Wang, Y.; Wang, J.-B.; Li, X.-Y. Low and intermediate-temperature mechanism and simulation for the combustion of RP-3 Kerosene. Chem. Res. Appl. 2018, 30, 946–952. [Google Scholar]
- Malewicki, T.; Gudiyella, S.; Brezinsky, K. Experimental and modeling study on the oxidation of Jet A and the n-dodecane/iso-octane/n-propylbenzene/1,3,5-trimethylbenzene surrogate fuel. Combust. Flame 2013, 160, 17–30. [Google Scholar] [CrossRef]
- Robert, J. CHEMKIN-II: A FORTRAN Chemical Kinetics Package for the Analysis of Gas-Phase Chemical Kinetics; Office of Scientific and Technical Information: Oak Ridge, TN, USA, 1989. [Google Scholar]
- Lutz, A.E. SANKIN: A Fortran Program for Predicting Homogeneous Gas Phase Chemical Kinetcs with Sensitivity Analysis; Report; Sandia National Laboratories: Albuquerque, NM, USA, 1987. [Google Scholar]
- Zeng, M.-R.; Liu, P.-Q.; Gao, J.-G.; Xiong, Z.-L.; Zhou, Z.-Y.; Yang, J.-Z.; Yuan, W.-H. Revealing the low to moderate temperature oxidation kinetics of 1,2,4-trimethylbenzene sensitized by dimethyl ether. Combust. Flame 2024, 261, 113285. [Google Scholar] [CrossRef]
- Gao, X.; Wang, D.; Yu, X.P.; Zhang, Y.N.; Tian, Z.Y. Experimental and kinetic modeling study of 1,3,5-trimethylbenzene oxidation at elevated pressure. Combust. Flame 2024, 265, 113503. [Google Scholar] [CrossRef]


| Fuel | XFuel | T5 (K) | P5 (bar) | XKr | XAr | Reaction Time (ms) |
|---|---|---|---|---|---|---|
| PBZ | 0.02% | 1100–1500 | 10.0, 15.0 | 0.2% | 99.78% | 1.8 |
| T124MBZ | 1200–1700 | |||||
| T135MBZ | 1200–1700 |
| Abbreviation | P-XYL | O-XYL | IND | MEXYLYLE | MEBZCYBUT |
|---|---|---|---|---|---|
| Chemical structural formula | 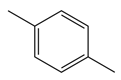 |  | 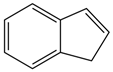 |  |  |
| Abbreviation | T135MBJ | FULVENE | PBZJA | PBZJB | PBZJC |
| Chemical structural formula | 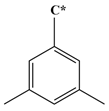 | 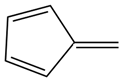 |  | 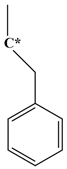 | 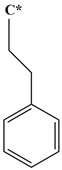 |
Disclaimer/Publisher’s Note: The statements, opinions and data contained in all publications are solely those of the individual author(s) and contributor(s) and not of MDPI and/or the editor(s). MDPI and/or the editor(s) disclaim responsibility for any injury to people or property resulting from any ideas, methods, instructions or products referred to in the content. |
© 2025 by the authors. Licensee MDPI, Basel, Switzerland. This article is an open access article distributed under the terms and conditions of the Creative Commons Attribution (CC BY) license (https://creativecommons.org/licenses/by/4.0/).
Share and Cite
Feng, Y.; Li, J.; Liu, G.; Yao, D.; Li, J.; Wang, Q.-D.; Wang, Z.; Liang, J. Experimental and Kinetic Simulation Study of the High-Temperature Pyrolysis of 1,2,4-Trimethylbenzene, 1,3,5-Trimethylbenzene and n-Propylbenzene. Energies 2025, 18, 2419. https://doi.org/10.3390/en18102419
Feng Y, Li J, Liu G, Yao D, Li J, Wang Q-D, Wang Z, Liang J. Experimental and Kinetic Simulation Study of the High-Temperature Pyrolysis of 1,2,4-Trimethylbenzene, 1,3,5-Trimethylbenzene and n-Propylbenzene. Energies. 2025; 18(10):2419. https://doi.org/10.3390/en18102419
Chicago/Turabian StyleFeng, Yujia, Jing Li, Gengqi Liu, Da Yao, Jinhua Li, Quan-De Wang, Zhaowen Wang, and Jinhu Liang. 2025. "Experimental and Kinetic Simulation Study of the High-Temperature Pyrolysis of 1,2,4-Trimethylbenzene, 1,3,5-Trimethylbenzene and n-Propylbenzene" Energies 18, no. 10: 2419. https://doi.org/10.3390/en18102419
APA StyleFeng, Y., Li, J., Liu, G., Yao, D., Li, J., Wang, Q.-D., Wang, Z., & Liang, J. (2025). Experimental and Kinetic Simulation Study of the High-Temperature Pyrolysis of 1,2,4-Trimethylbenzene, 1,3,5-Trimethylbenzene and n-Propylbenzene. Energies, 18(10), 2419. https://doi.org/10.3390/en18102419