Article

Study on Improving Recovery of Highly Heterogeneous Reservoirs by Unsteady Water Injection Technology

1
PetroChina Research Institute of Petroleum Exploration & Development, China National Petroleum Corporation, Beijing 100083, China
2
College of Petroleum Engineering, China University of Petroleum, Beijing 102249, China
*
Author to whom correspondence should be addressed.
Energies 2025, 18(1), 159; https://doi.org/10.3390/en18010159
Submission received: 23 June 2024 / Revised: 23 August 2024 / Accepted: 14 September 2024 / Published: 3 January 2025
(This article belongs to the Special Issue Advances in the Development of Geoenergy: 2nd Edition)

Abstract

:
Unstable water injection can effectively improve the recovery ratio of reservoirs with strong heterogeneity. However, the oil displacement mechanism and the determination method of unstable water injection parameters still need to be clarified, especially for complex fracture reservoirs, which greatly restrict the popularization and development of unstable water injection technology. This paper studies unstable water injection technology in highly heterogeneous reservoirs from the core and reservoir scales, utilizing many displacement experiments and numerical simulations. The differences in oil displacement efficiency, remaining oil distribution, pressure field, and streamlines between continuous water injection and unstable water injection are compared and evaluated. Five flow stages of unstable injection and production are precisely divided, and the microscopic and macroscopic displacement mechanism is clarified. A numerical model of two injection wells and one production is established to determine the best time to implement unstable water injection technology. Based on the principle of pressure superposition, the expression of pressure field distribution between injection and production well in each period of unstable water injection is analytically solved. This formula has provided a new development parameter optimization method aiming at the maximum pressure fluctuation range and optimized the development technology parameters in the water injection process. The results show that precise control injection and production parameters can expand water swept volume, effectively improve the degree of reserve utilization, and improve the recovery of complex reservoirs by 3–7%, which provides a reliable basis for the practical implementation of unstable water injection technology.

1. Introduction

Unstable water injection is a kind of development mode known as intermittent water injection. Unstable water injection creates an unstable pressure field in the reservoir by changing the injection rate periodically and stimulates the fluid exchange between layers with different permeability or fracture matrices [1]. The basic principle of cyclic water injection is as follows: With the increase of the water injection rate, the pressure rise of the high permeability layer is fast. Under the action of additional pressure difference, part of the fluid flows from the high permeability layer to the low permeability layer; when the water well stops injection, the high permeability layer depressurizes quickly, and under the action of reverse pressure difference, part of the fluid flows back from the low permeability layer to the high permeability layer and is extracted by a production well [2,3].
At the end of the 1950s, after implementing unstable waterflooding in the reservoirs of the Pingguogu B2 oilfield, the former Soviet Union proposed for the first time that it was effective in carrying out unstable water injection in reservoirs [4,5]. In the early 1960s, the United States carried out unstable water injection in the driver area of the Spraberry oilfield, but no obvious effect was achieved at the beginning [6,7,8]. Since 1965, Cenkova et al. of all Soviet Academy of Petroleum Sciences have established the mathematical model of unstable water injection: unstable water injection is more suitable for the reservoir with strong heterogeneity and good connectivity between intervals. The results show that the earlier the time is, the greater the water injection intensity is, and the better the effect of unstable water injection is [9,10]. In the late 1980s, unstable water injection was applied to China’s Jiang Han, Yu Men, Daqing, and other oilfields. Since the 1990s, with the popularization of EOR technology, the research on unstable water injection has gradually decreased [11,12,13]. In 2001, Zhang et al. discussed the mechanism for improving the recovery of heterogeneous reservoirs through periodic waterflooding and the optimization of engineering parameters for unstable waterflooding [14]. Dang Wei and Jiang Ruizhong used a numerical simulation method to evaluate the feasibility of unstable water injection [15,16,17]. Wang et al. conducted a study on the mechanism of unstable waterflooding in the Gudong oilfield using physical models, numerical simulations, seepage mechanics, and reservoir engineering methods. The study concluded that the reservoir of Gudong oilfield is suitable for unstable waterflooding and determined relevant technical limits [18].
In 2011, Li found that the asynchronous injection and production of waterflood can improve the development effect of fractured bottom water reservoirs in the late stage of waterflood development [19]. Su and Zhu divided the percolation into four stages: dormancy, start-up, peak infiltration, and ceasing, according to the characteristics of matrix infiltration. On this basis, the unstable water injection strategy of fractured buried hill reservoir has been made [20]. In 2021, Danial Arab studied some new insights on the effect of injection velocity and oil viscosity on waterflooding of oil-wet reservoirs [21]. Dong Wensheng has studied comprehensive adjustment of asynchronous injection-production measures and optimization of injection production [22]. Since 2023, Xuan Wenbin has studied the mechanism and development parameters optimization of unstable injection and production technology in the later stage of low-permeability reservoir development [23]. Since 2024, Ma Kuiqian and Fang Na have provided three types of unstable water injection modes based on three distinct reservoir models [24]. Since 2024, Song Xinmin and Li Yong provided three types of balanced waterflooding modes/techniques to improve the recovery of the reserves of thick and complex carbonate reservoirs [25].
The understanding of the mechanism of unstable waterflooding is not sufficiently deep. A set of suitable screening conditions for unstable waterflooding reservoirs has not been established, and the optimization of unstable waterflooding development parameters lacks a theoretical basis. These limitations restrict the popularization and development of unstable waterflooding. In light of these challenges, the oil displacement mechanism and adaptation conditions of unstable waterflooding are analyzed at both the core and reservoir scales. Additionally, an optimization method for unstable waterflooding development parameters is established to provide theoretical guidance for the popularization and development of this technique.

2. Experimental Study on the Mechanism of Unstable Waterflooding in Highly Heterogeneous Reservoirs

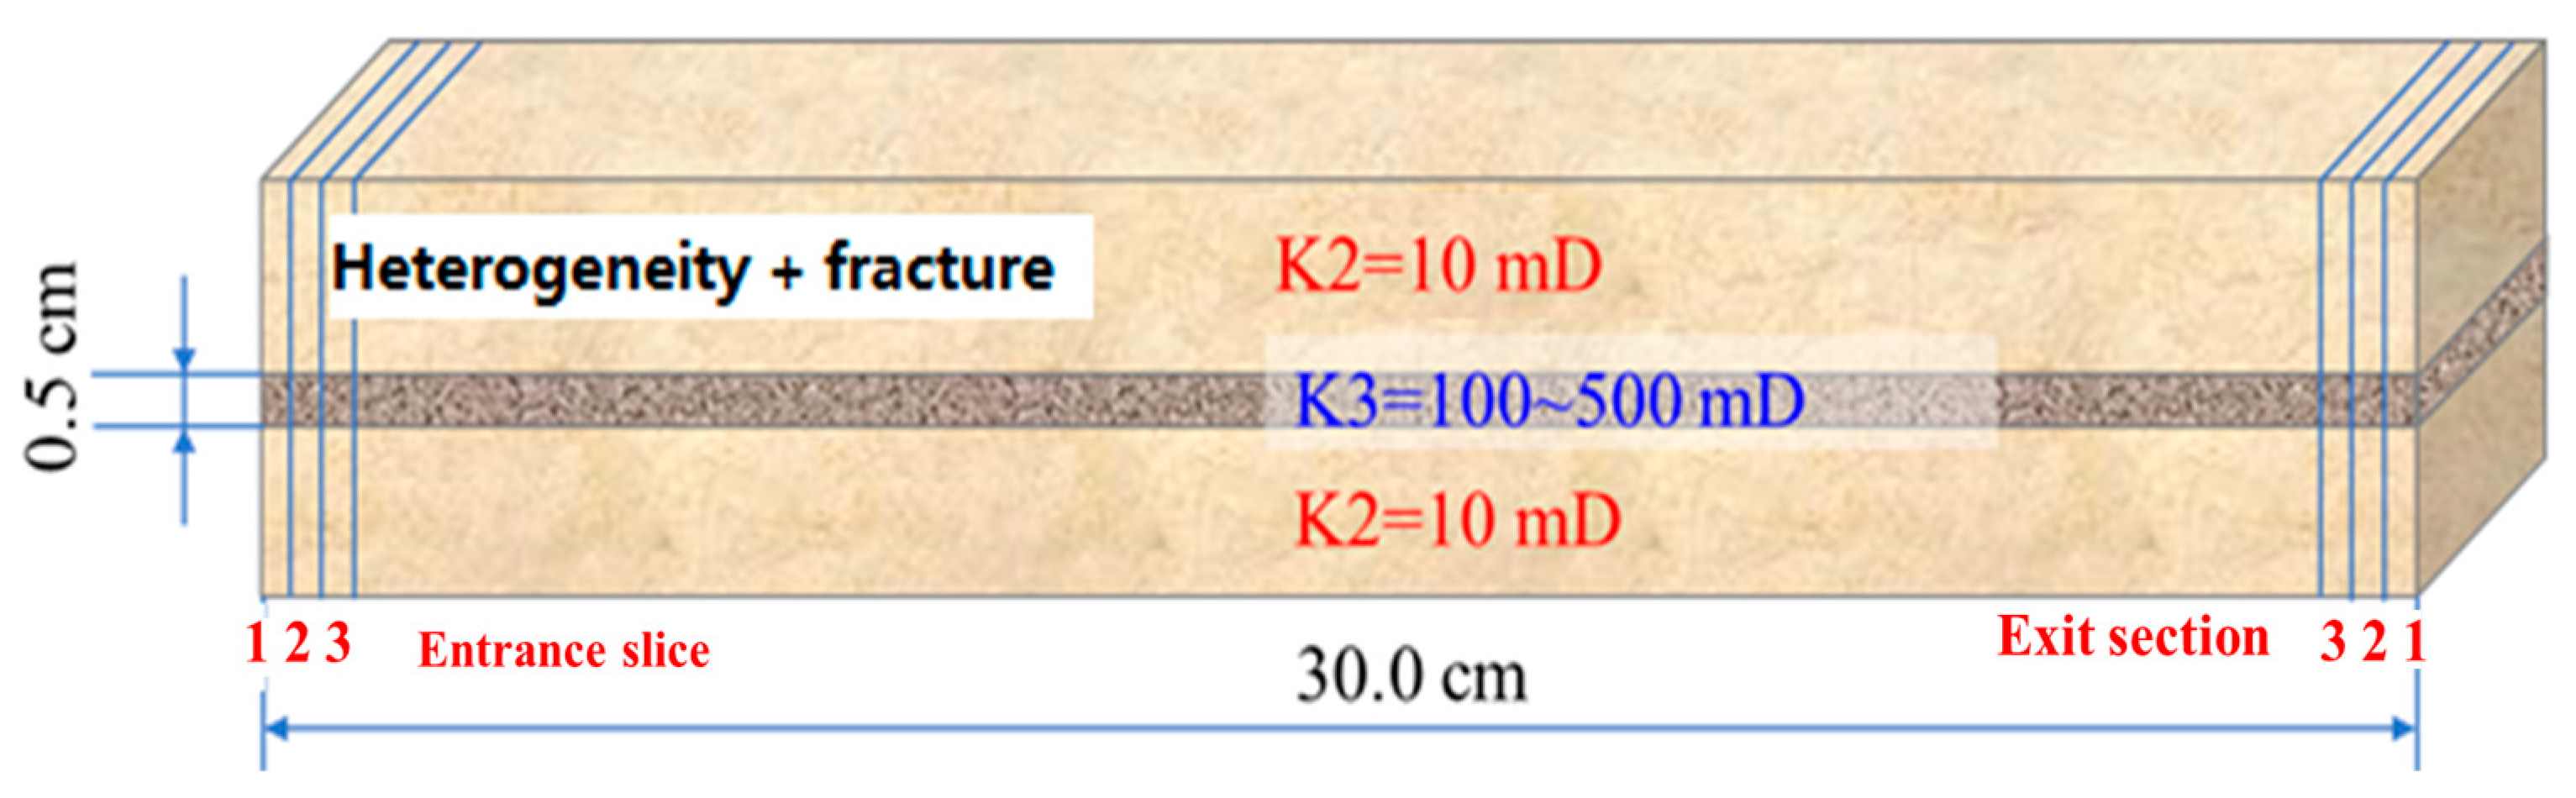
2.1. Experimental Material and Equipment

In order to reflect the displacement phenomenon more directly between high and low permeability of unstable water injection, the core used in the experiment is a block core with a size of 45 mm × 45 mm × 30 cm, and there is no interlayer between layers. The permeability is 10 × 10−3, 100 × 10−3, and 10 × 10−3 μm2 from top to bottom to simulate the fractured core, as shown in Figure 1.
In addition to the conventional displacement experiment, the core displacement experiment method based on CT scanning is also used in the experiment. The experimental equipment is shown in Figure 2. The whole displacement process is carried out in the CT scanner. This scanner can obtain the fluid distribution data in the core in real time, and the fluid replacement law between high and low permeability can be analyzed during unstable water injection.

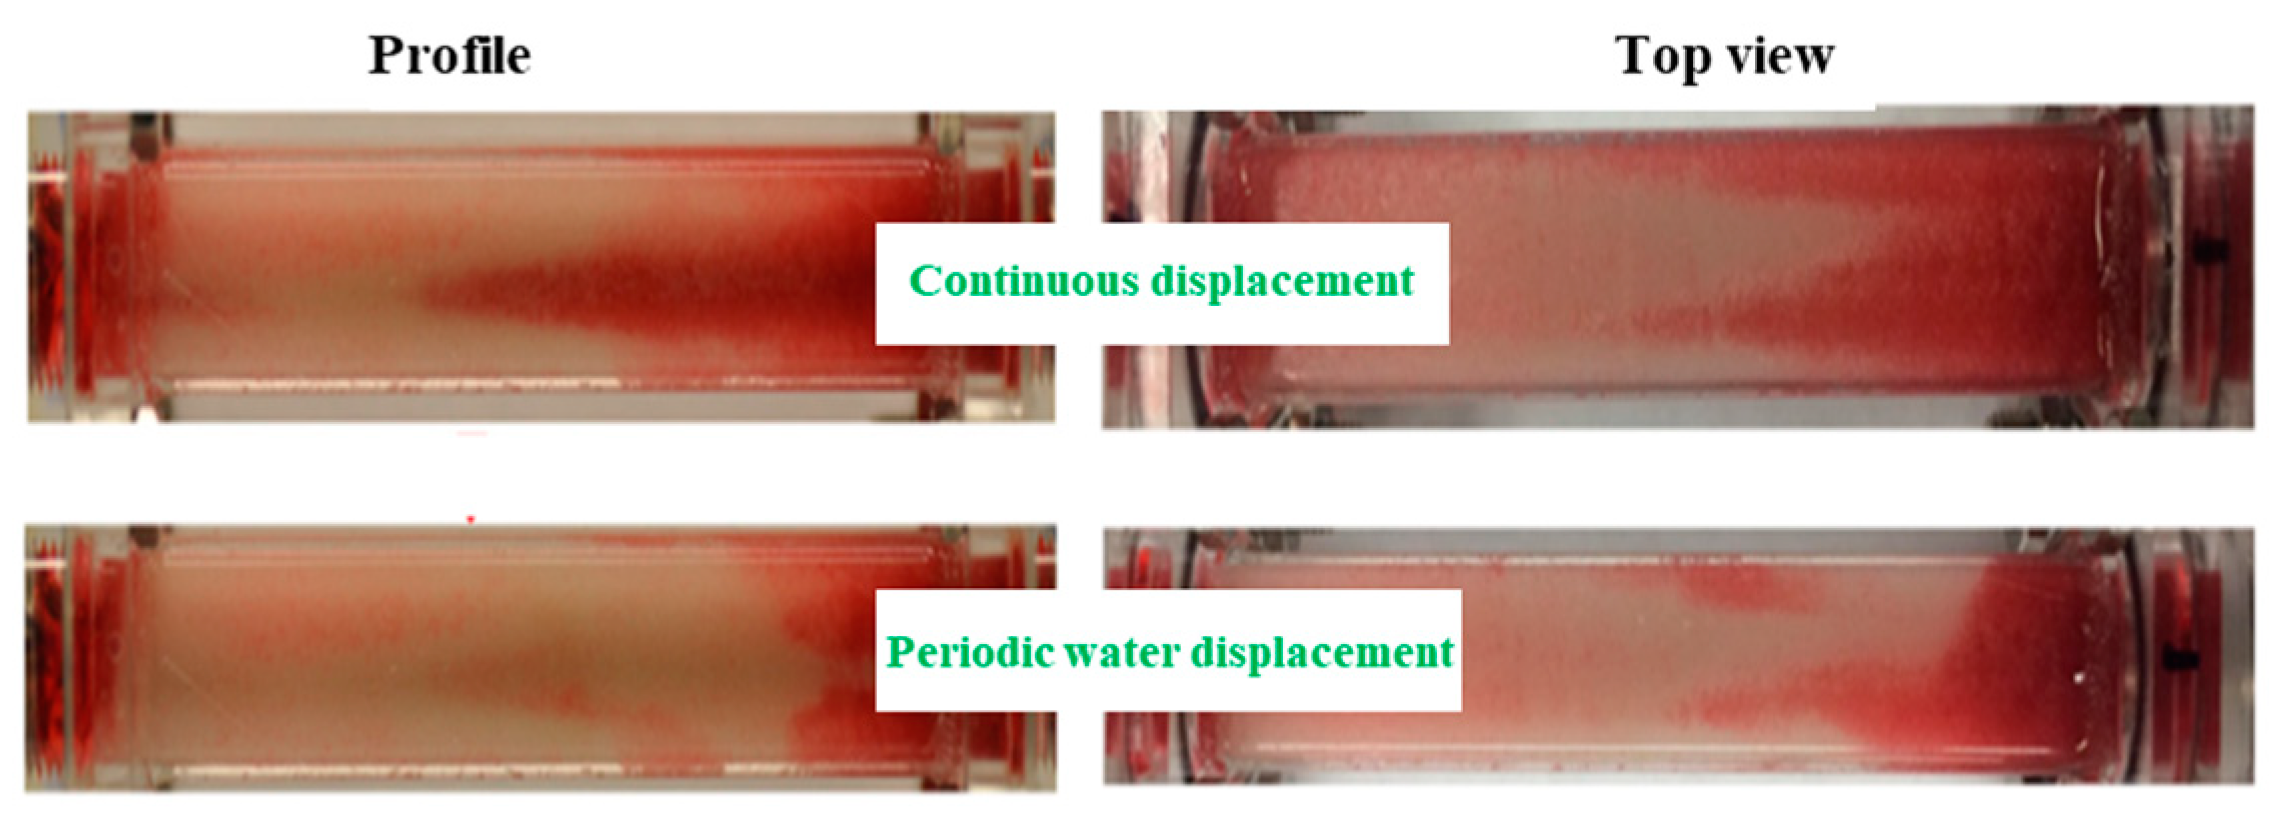
2.2. Analysis of Conventional Displacement Experiment Results

According to conventional displacement experiment specifications, the process involves dry core measurement, followed by saturated water and oil displacement to form bound water, and then a water displacement oil test. Continuous water injection and periodic water injection are carried out at constant rates of 2 mL/min and 4 mL/min, respectively. The displacement process concludes when the injection volume reaches 20 PV, with a duration of approximately 15 h, as indicated in Table 1. According to the experimental results, the final recovery of conventional water drive can reach 30%. When the water cut is 40%, the final recovery degree is 34.1%, 4.1% higher than conventional waterflooding. When the water cut is 60% and 80%, the recovery degree is increased by 7% and 5.6%, respectively, which shows that the unstable water injection has a better development effect. Moreover, the EOR effect of cyclic water injection differs at different water saturation, so there is a reasonable injection time for unstable water injection.

2.3. Analysis of Core Displacement Experiment Results Based on CT Scanning

The profile and top view of the displacement process can be obtained. The displacement process of crude oil can be seen by comparing the images, as shown in Figure 3 (the left side is the side view, and the right side is the top view):
The dark red part in the Figure shows the distribution of remaining oil, while the white part shows the distribution characteristics of injected water. It can be seen from Figure 3 that the remaining oil is mainly distributed around the high permeability zone at the end of continuous water injection development. After changing the working system and adopting unstable water injection, the remaining oil content around the high permeability zone becomes less, the injection water wave and range become more extensive, and the final remaining oil is less than that of continuous water injection. This indicates that unstable water injection can expand the swept volume of water and improve oil recovery.

3. Mechanism Analysis of Unstable Waterflooding

3.1. Microscopic Oil Displacement Mechanism Analysis of Unstable Water Injection

Based on the above laboratory experiments, the block core simulation model is established by the reservoir numerical simulation method, and the simulation model is corrected by fitting the experimental data. The simulation model analyzes the action mechanism of fluid force in each stage of unstable water injection, and the oil displacement mechanism of unstable water injection is analyzed. In the simulation process, the water saturation variation law of the low permeability zone in the injection and stop injection stage is shown in Figure 4.
It can be seen from Figure 4 that within one cycle of unstable water injection, the variation law of water saturation in a low permeability area can be divided into five stages. Stage I: water injection. The displacement force is the main driving force, and the capillary force is the resistance. Stage II: water injection. The pressure difference between high and low permeability is small, capillary force is the main driving force, displacement force becomes weak, and imbibition plays a role. stage III: stop injection. The pressure difference between high permeability and low permeability is slight. Capillary force is the driving force, which shows imbibition. stage IV: stop injection. The pressure difference between high and low permeability is large, the elastic pressure difference is the main driving force, and the capillary force is mainly the binding force. Stage V: stop injection. The pressure difference between high and low permeability is small, and capillary force is the driving force at this time, showing the imbibition effect.
It can be seen from the analysis that stages I and IV are the main stages affecting the effect of unstable water injection, and the main action stages of imbibition are stages II, III, and V. The imbibition mainly occurs when the pressure difference between high and low permeability is small. The simulation results reveal that cyclic water injection can produce low permeability reserves and expand the swept volume.

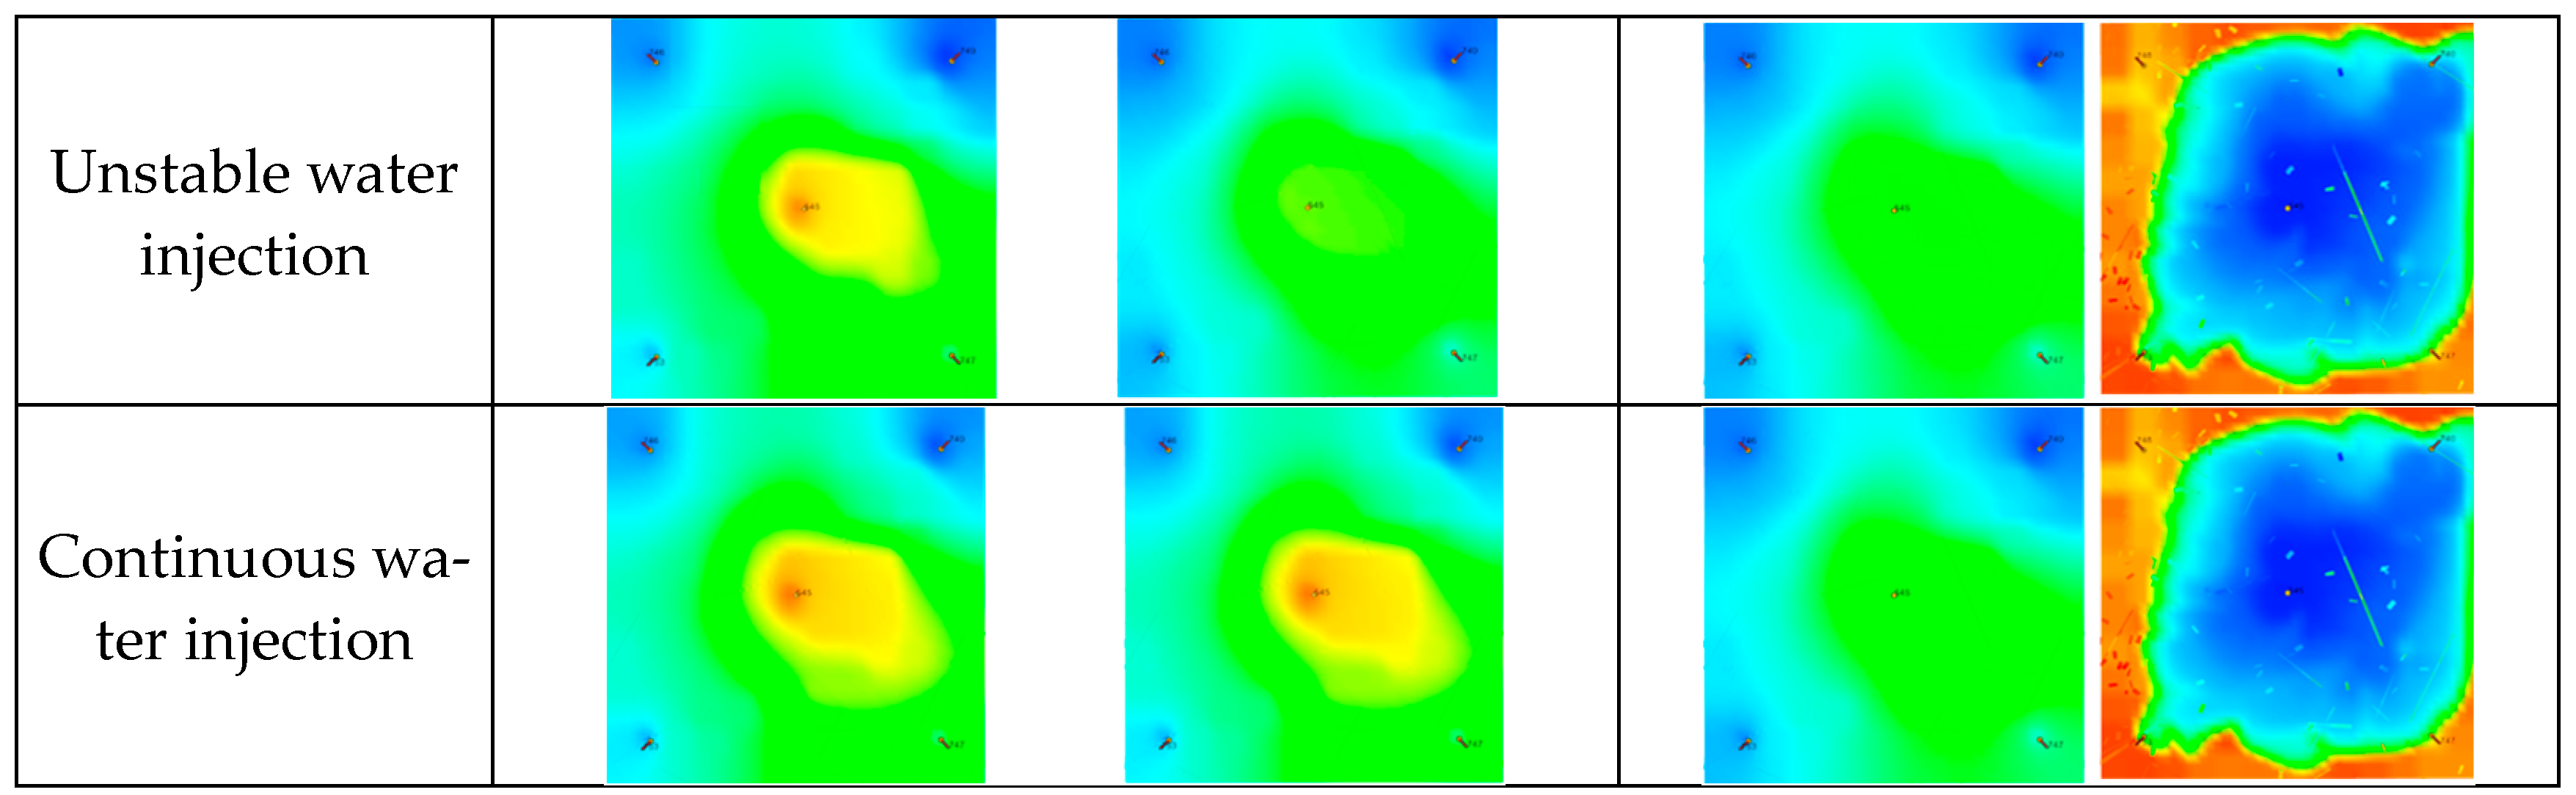
3.2. Analysis of Unstable Water-Flooding Mechanism at Reservoir Scale

Taking a typical well group in a fractured reservoir as an example, the reservoir numerical simulation model is established to analyze the macro mechanism of EOR by unstable water injection from the reservoir scale. The simulation model is shown in Figure 5, which has lots of fractures.
The simulation results are shown in Figure 6. According to the distribution characteristics of the pressure field, it can be seen that the pressure field of unstable water injection and continuous water injection is slightly different, and the pressure field of unstable water injection is slightly higher than that of continuous water injection. The pressure field of unstable water injection is reduced in the stage of stopping injection, which can form effective pressure differences and realize fluid across different permeability zones. From the distribution characteristics of the water saturation field, it can be seen that the water saturation of unstable water injection is better than that of continuous water injection in the injection stage, and the average water saturation of periodic water injection continues to increase because fluid crosses different permeability zones in the stop injection stage. From the simulation result, the unstable water injection can improve the sweep ability of the water drive to a certain extent and effectively improve the oil recovery.
Rock wettability refers to the distribution of liquid on the surface of reservoir rocks due to molecular interactions. This phenomenon can be categorized into three types: hydrophilic, neutral, and oil-wet. Hydrophilic rocks disperse water, which is beneficial for crude oil recovery, while oil-wet rocks cause water to form droplets, leading to increased resistance in oil recovery efforts. The wettability of the rock was changed for further simulation. According to the numerical simulation results, Figure 7 shows that unstable water injection has a good development effect in reservoirs with different wettability, indicating that unstable water injection suits any wettability reservoir. The development effect is slightly better when reservoirs are hydrophilic.

4. Study on Optimization Method of Unstable Waterflooding Development Parameters

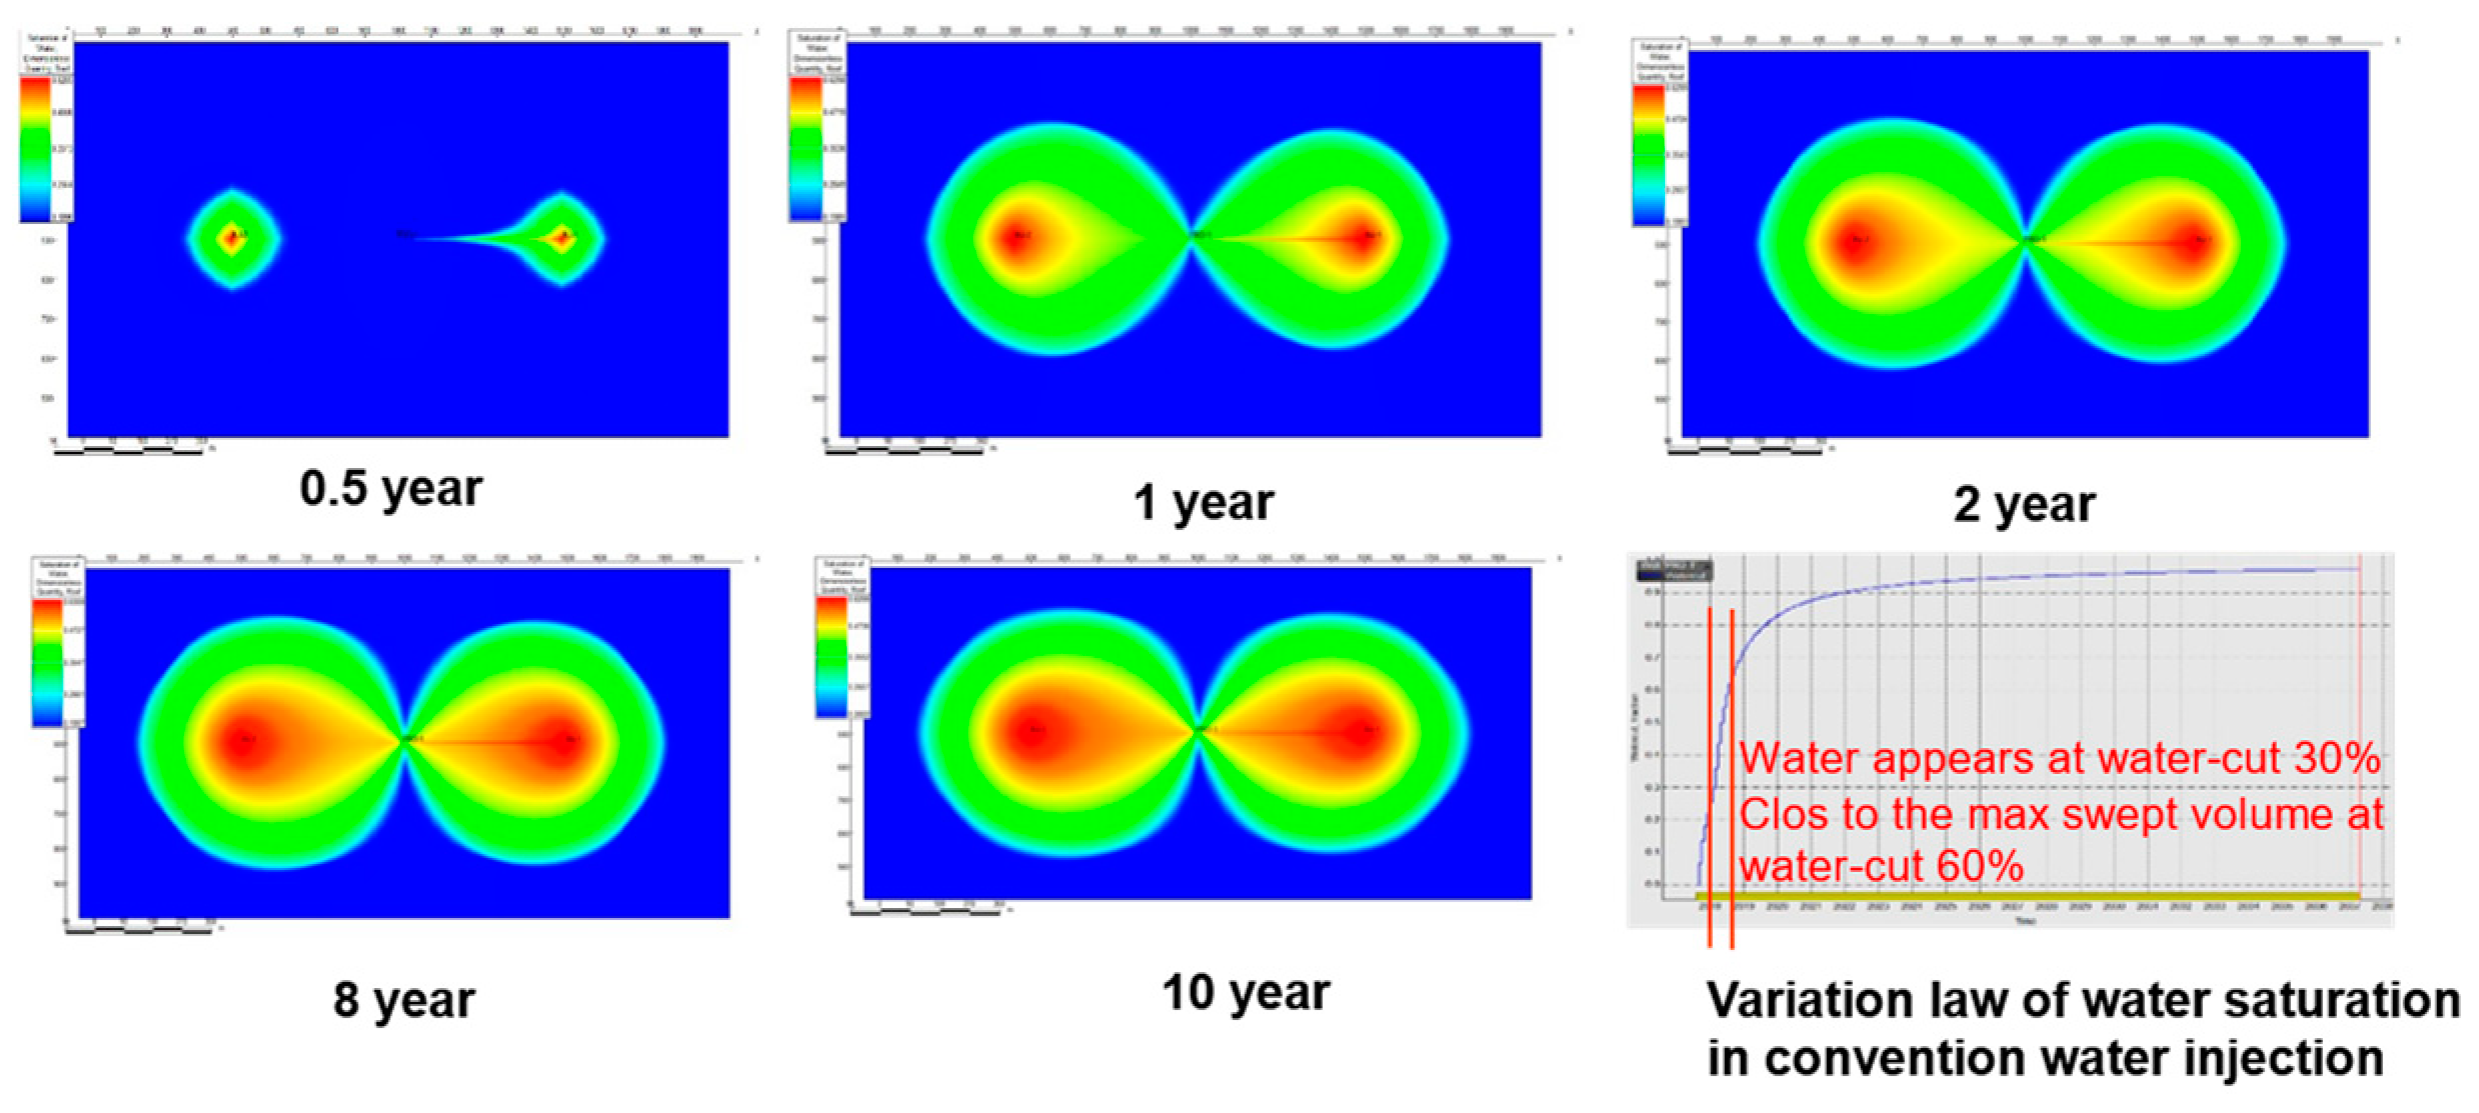
4.1. Research on Implementation Timing of Unstable Water Injection

As shown in Figure 8, a numerical simulation model of two injection wells and one production well reservoir is established to compare the development effects of conventional and unstable water injection, and the main control factors affecting unstable water injection are analyzed. The simulation results show that the water injection wave and capacity gradually increase in the conventional water injection development, and the sweep ability gradually weakens in the later stage. The swept volume almost does not change at last, indicating a maximum water injection wave and volume in water injection development. When water breakthrough occurs in the oil well, the water cut is 30%. When it is close to the maximum swept volume, the water cut is 60%, and the water cut will continue to rise.
Under different water cut conditions, an unstable water injection simulation is carried out to compare the development effect. The simulation results are shown in Figure 9. It can be seen from the increase in the final recovery rate (relative to water drive) that the final development effect of unstable water injection increases first and then decreases with water cut. When the water cut is around 60%, the development effect is the best, and the water injection wave and volume are close to the maximum swept volume. The effective time of unstable water injection in different water cut stages is quite different. Figure 10 shows that when the water cut is low, the effective time is extended. With the increased water cut, the effective time of unstable water injection becomes shorter. When the water cut is 60%, the implementation of unstable water injection will be effective in the same month. Therefore, it is the best time to implement unstable water injection when the water injection wave and volume are close to the maximum swept volume.

4.2. Determination Method of Unstable Water Injection Development Parameters

An analytical method is used to determine the reasonable control parameters of cyclic water injection development by analyzing the pressure field distribution characteristics in the injection and stop injection stages.

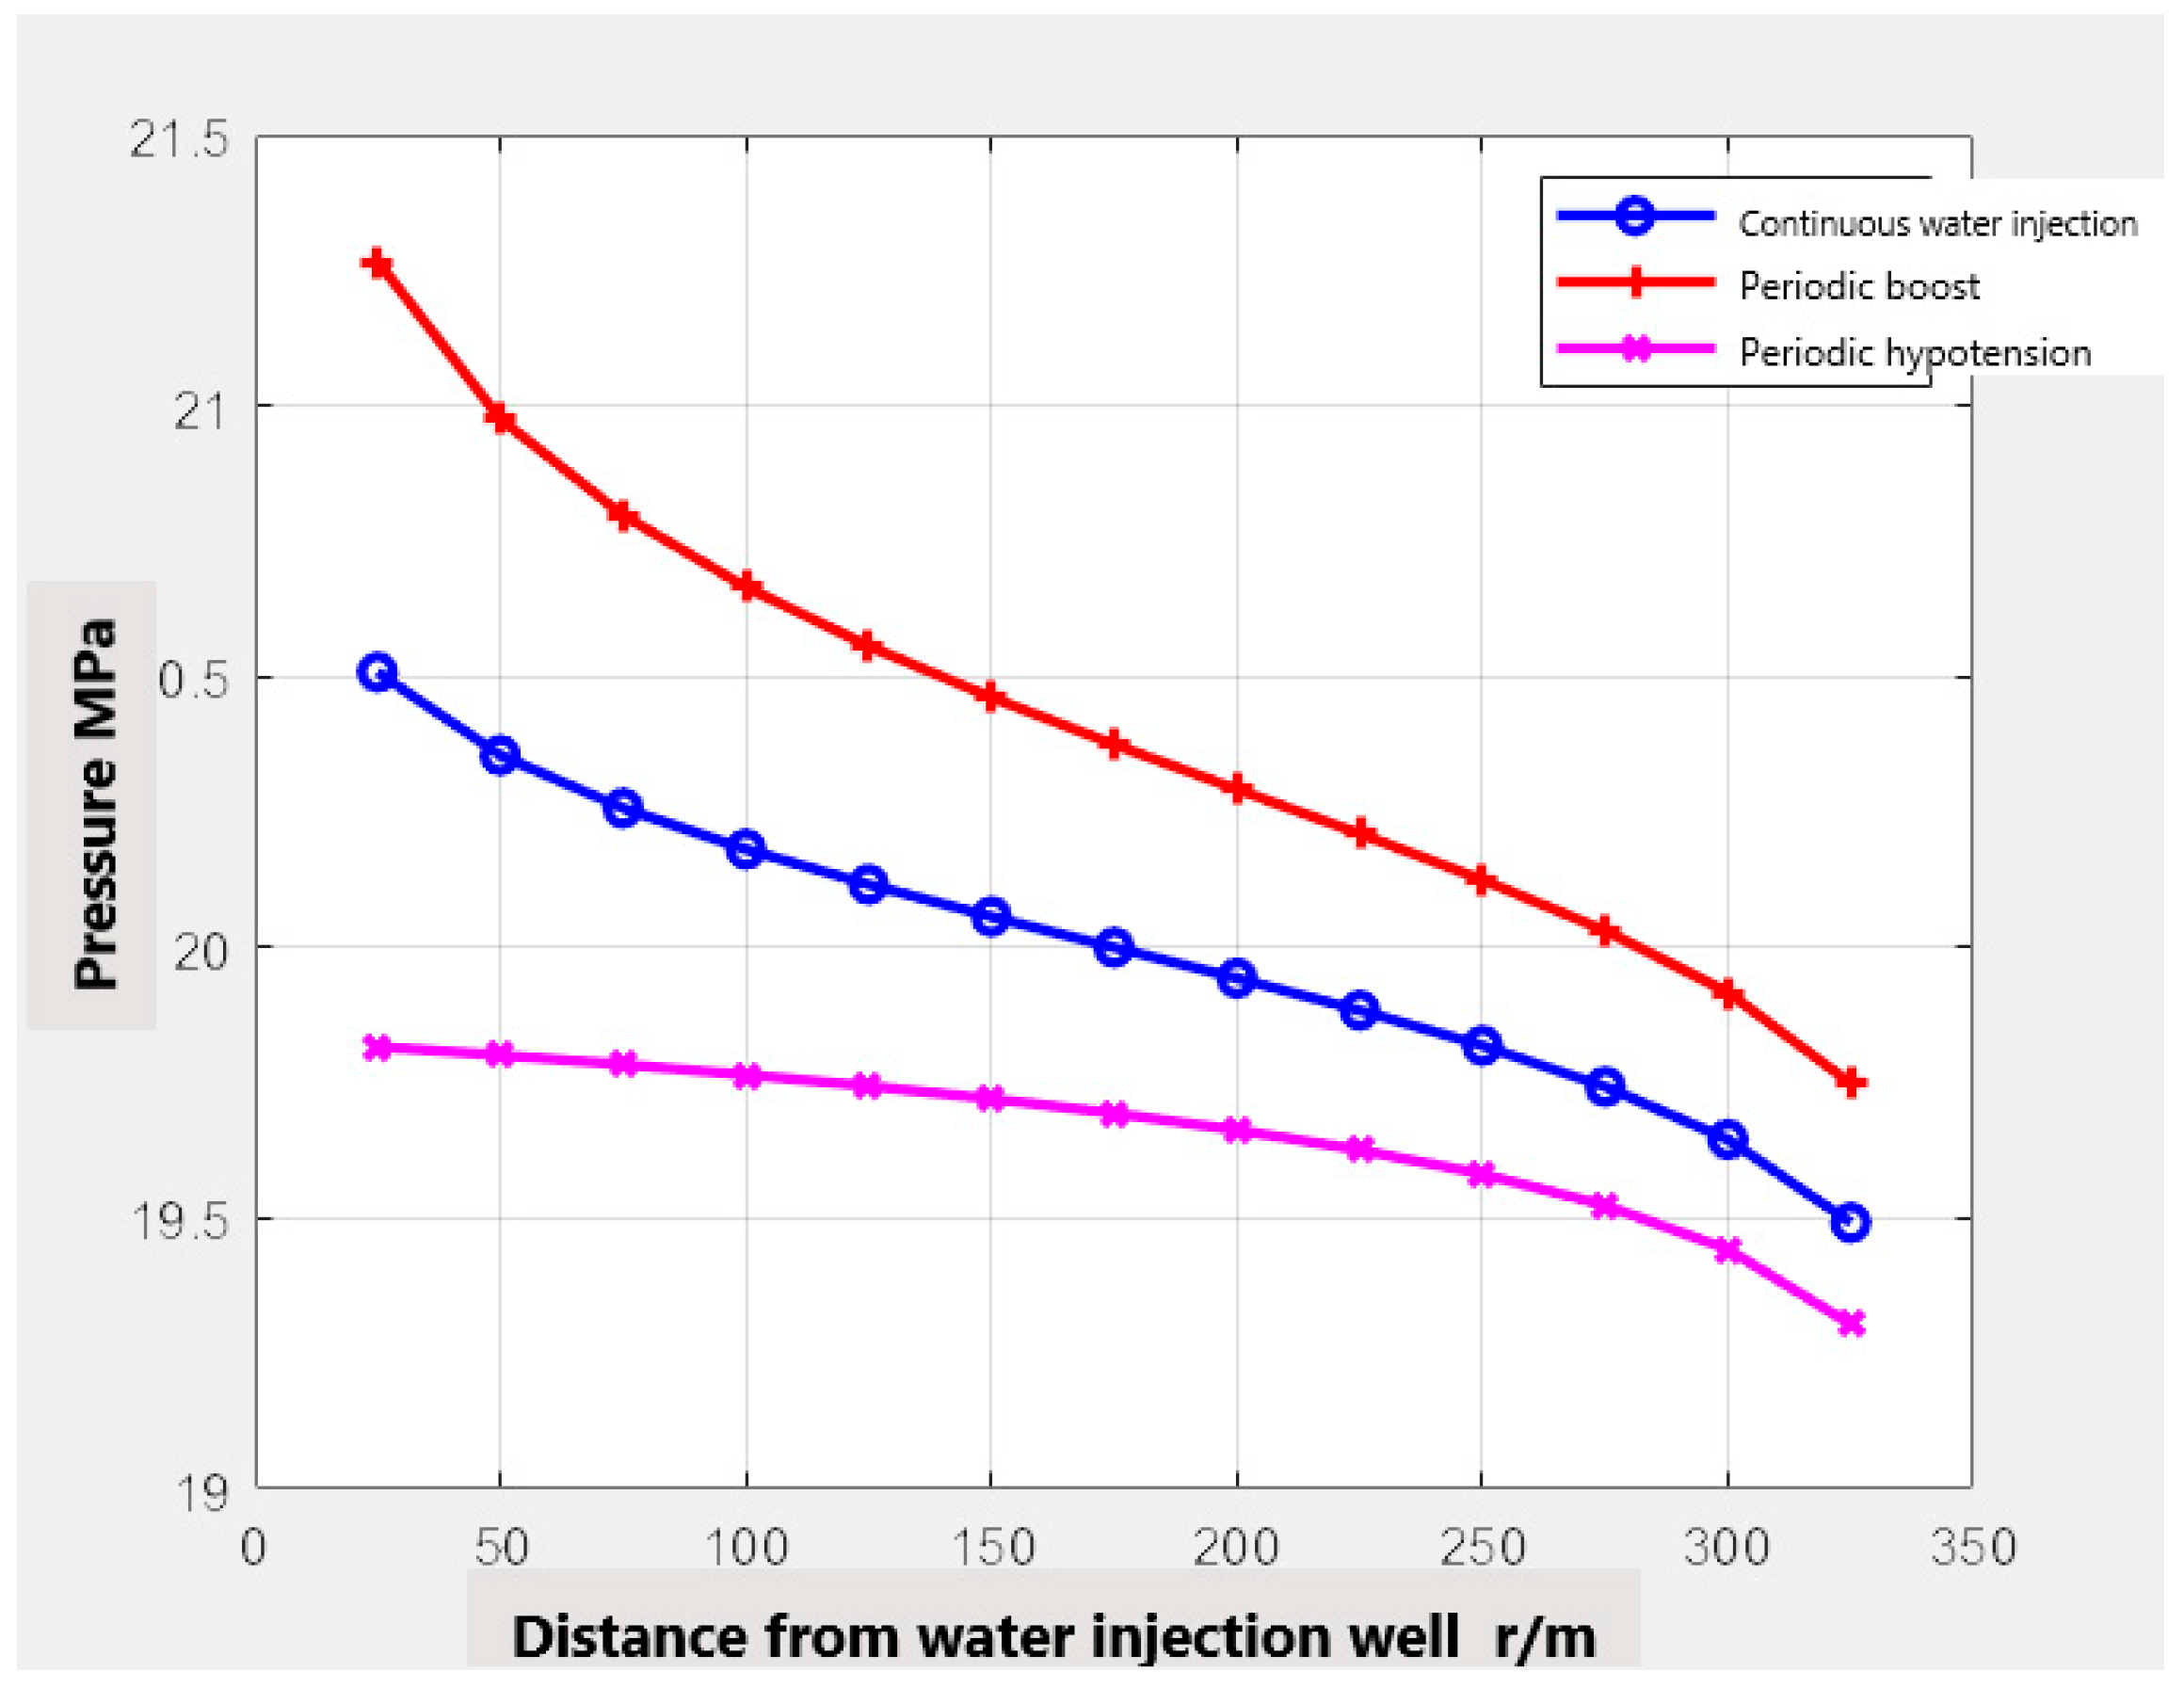
4.2.1. The Mathematical Solution of Pressure Field Distribution

An elastic unsteady flow model considering fracture development is established and solved.
p f i p f i 1 Δ x k f h w f u = x i 1 x i q f ( x , t ) d x i = 1 , 2 n 1 r D r D ( r D P ¯ 1 D r D ) = u P ¯ 1 D ( 1 r D r f D ) 1 r D r D ( r D P ¯ 2 D r D ) = u M 12 W 12 P ¯ 2 D ( r f D < r D ) ,
Using the solution of the above formula and the principle of pressure superposition, the distribution law of formation pressure in one injection and one production system can be obtained:
(1)
The formation pressure distribution of continuous water injection:
P = P i Q 1 μ 4 π K f h I n 4 η f t r 2 + E i α η f k m ω ( 1 ω ) k f t E i α η f k m ( 1 ω ) k f t 0.577 + Q 2 μ 4 π K f h I n 4 η f t ( L r ) 2 + E i α η f k m ω ( 1 ω ) k f t E i α η f k m ( 1 ω ) k f t 0.577
(2)
The pressure distribution of cyclic water injection:
P = P i Q μ 4 π K ħ I n 4 η f t T 2 r 2 + E i α η K n ω ( 1 ω ) K t t T 2 E i α η K n ( 1 ω ) K f t T 2 0.577 + Q μ 4 π K h I n 4 η f t T 2 ( L r ) 2 + E i α η K n ω ( 1 ω ) K t T 2 E i α η K m ( 1 ω ) K f t T 2 0.577
(3)
The pressure distribution in the decompression stage of cyclic water injection:
P = P i Q 1 μ 4 π K f h I η 4 η f t r 2 + E i α η f k m ω 1 ω k f t E i α η f k m 1 ω k f t 0.577 + Q 2 μ 4 π K f h I η 4 η f t ( L r ) 2 + E i α η f k m ω ( 1 ω ) k f t E i α η f k m ( 1 ω ) k f t 0.577 Q 2 μ 4 π K f h I η 4 η f t T 2 r 2 + E i α η f k m ω ( 1 ω ) k f t T 2 E i α η f k m ( 1 ω ) k f t T 2 0.577
where,
η f = K f μ φ f C t f + φ m C t m ,
λ = α r w 2 K m K f
According to the above analytical solution, the pressure field distribution in different injection stages can be obtained.
When the control parameters are properly developed, the distribution characteristics of the pressure field are shown in Figure 11. The pressure difference between the injection stage and the stop injection stage can reach the maximum, which provides sufficient pressure field conditions for fluid displacement between high and low permeability.

4.2.2. Determination of Injection-Production Ratio

According to the above formula, the distribution characteristics curves of the pressure field between injection wells and production wells with different injection-production ratios are shown in Figure 12. When the injection-production ratio is less than 1, the average formation pressure will decrease in the process of cyclic water injection. While the injection-production ratio is greater than 1, the average formation pressure will increase. However, at the same time, the pressure drop will be small during the stopping injection, affecting the cross permeability of fluid. Therefore, the reasonable injection-production ratio should be 1.

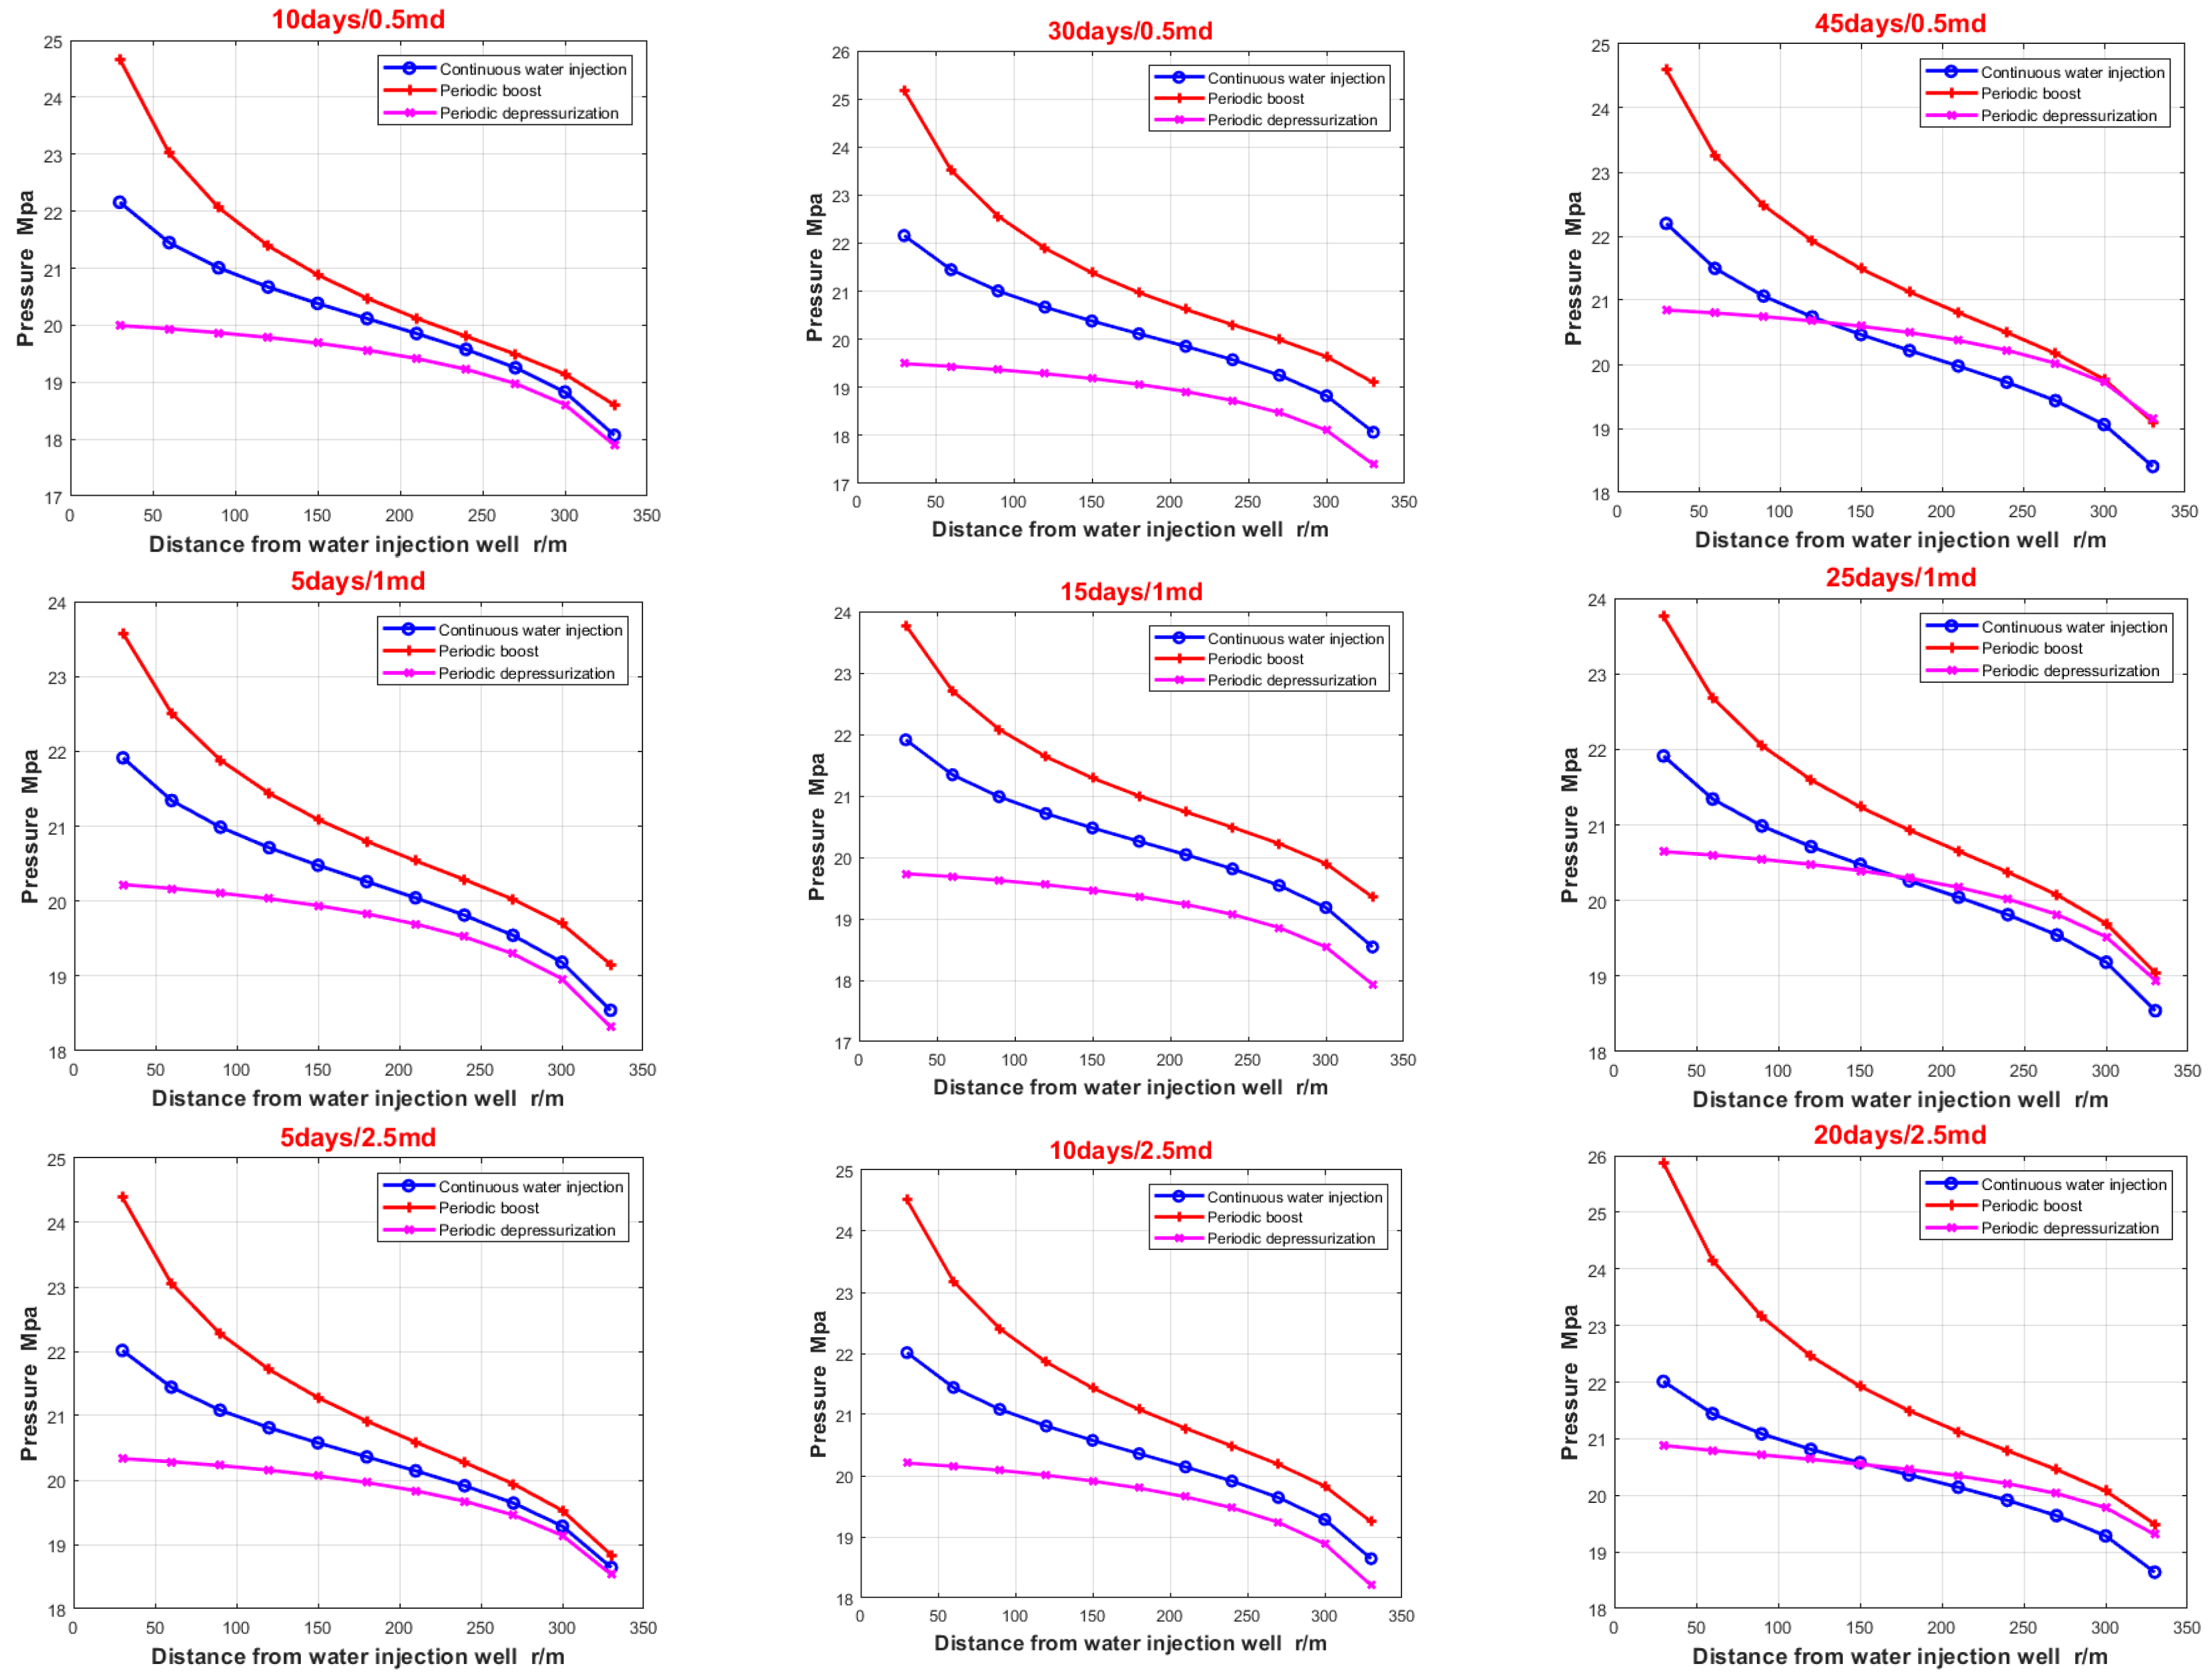
4.2.3. Determination Method of Injection Time and Injection Stop Time

If the stop injection time is too short, the pressure swept range will be short, leading to a small range of unstable pressure difference, and the effect of periodic water injection will be relatively poor. However, if the injection stop time is too long, the pressure near the injection well does not drop rapidly, but the production well pressure rises instead. The effective cross permeability time becomes shorter, and the development effect is relatively poor.
As shown in Figure 13, the distribution characteristics of the pressure field under different injection production parameters are obtained by substituting the reservoir parameters into the established analytical method. According to the principle of maximizing the differential pressure envelope between injection pressure rise and shut-down pressure reduction, reasonable parameters can be determined under different reservoir conditions.

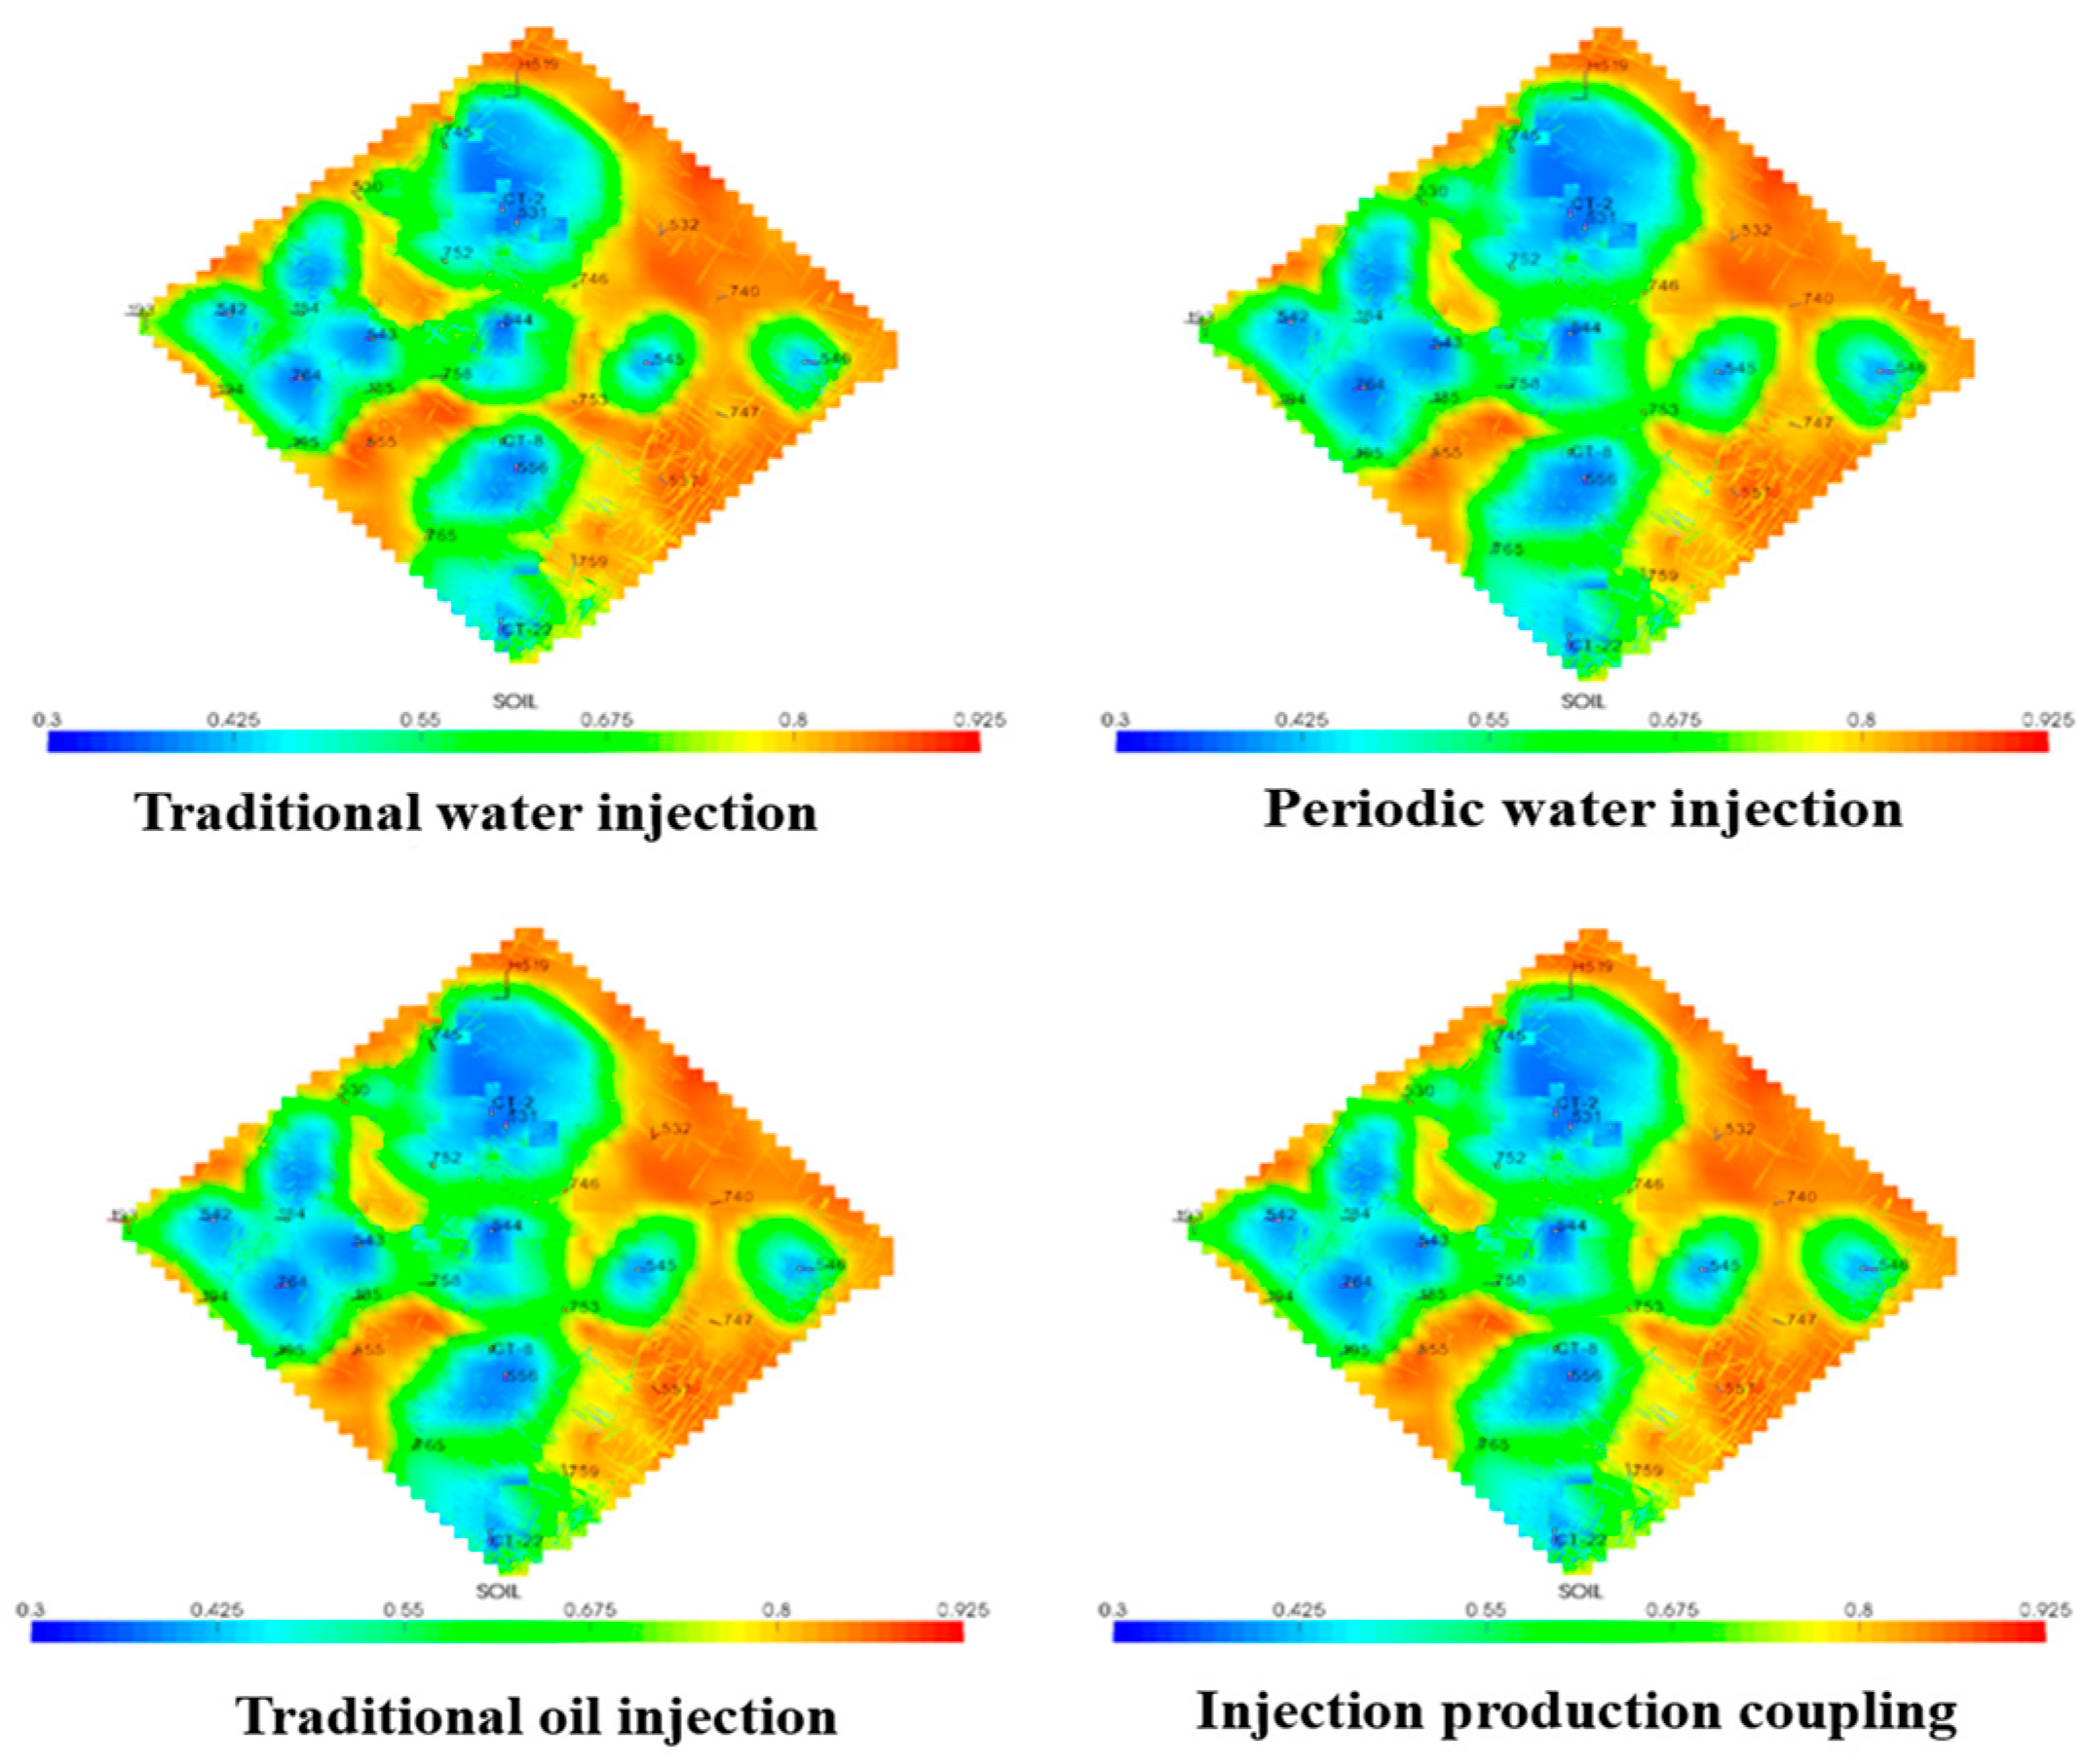
4.3. Effect Evaluation of Cyclic Water Injection

Taking a typical reservoir as an example, the development effect of cyclic water injection is evaluated [16]. Figure 14 shows the reservoir has strong heterogeneity and fractures, mainly showing the characteristics of rapid water cut rising, uneven pressure field distribution, and complex remaining oil distribution. It can be seen from Figure 15 that the reservoir can be divided into five zones by permeability.
Three unstable injection and production systems are applied to shut in the well when the water cut is 90%, and the indexes such as sweep extent, water cut, and recovery factor are compared. Figure 16 shows that the plane sweep extent of unstable injection production is better than that of conventional water injection, and the injection production coupling effect is the best.
The comparison of recovery levels of different systems is shown in Figure 17. The recovery factor of an unstable injection production system is improved to a certain extent, and the effect of injection production coupling is the best. With this technology, the degree of recovery can be increased by almost 2%. Through this method, 30 years of production, 15 years of water injection operation for water injection wells, and 15 years of production operation for oil production wells have saved a lot of manpower and material resources. For example, the injection production coupling method has saved 320,000 tons of water injection.

5. Discussion on EOR Capability of Cycle Water Injection and Its Difference with Other EOR

According to the previous research results, cyclic water injection can improve the waterflooding development effect and oil recovery. However, the range of EOR is limited. According to the previous research results, under laboratory conditions, the EOR range of cyclic water injection is about 3–7%, and the EOR range calculated by the reservoir numerical simulation method is 3–5%. Other conventional EOR methods such as polymer flooding, surfactant flooding, gas flooding, etc., can enhance oil recovery by 10–30%.
Although the conventional EOR method has strong EOR capability, it needs significant investments and strict adaptability. However, the investment in cyclic water injection is small, and its application range is wide. Therefore, under the condition of abundant funds and conditions, conventional EOR methods can be selected. If the cost is limited and the recovery is enhanced correctly, cyclic water injection is one of the best choices.

6. Conclusions

(1)
The results of CT scanning experiment, displacement experiment, and numerical simulation show that cyclic water injection can increase the swept volume of water drive, produce the reserves that cannot be produced by conventional water drive, and improve the development effect of water drive.
(2)
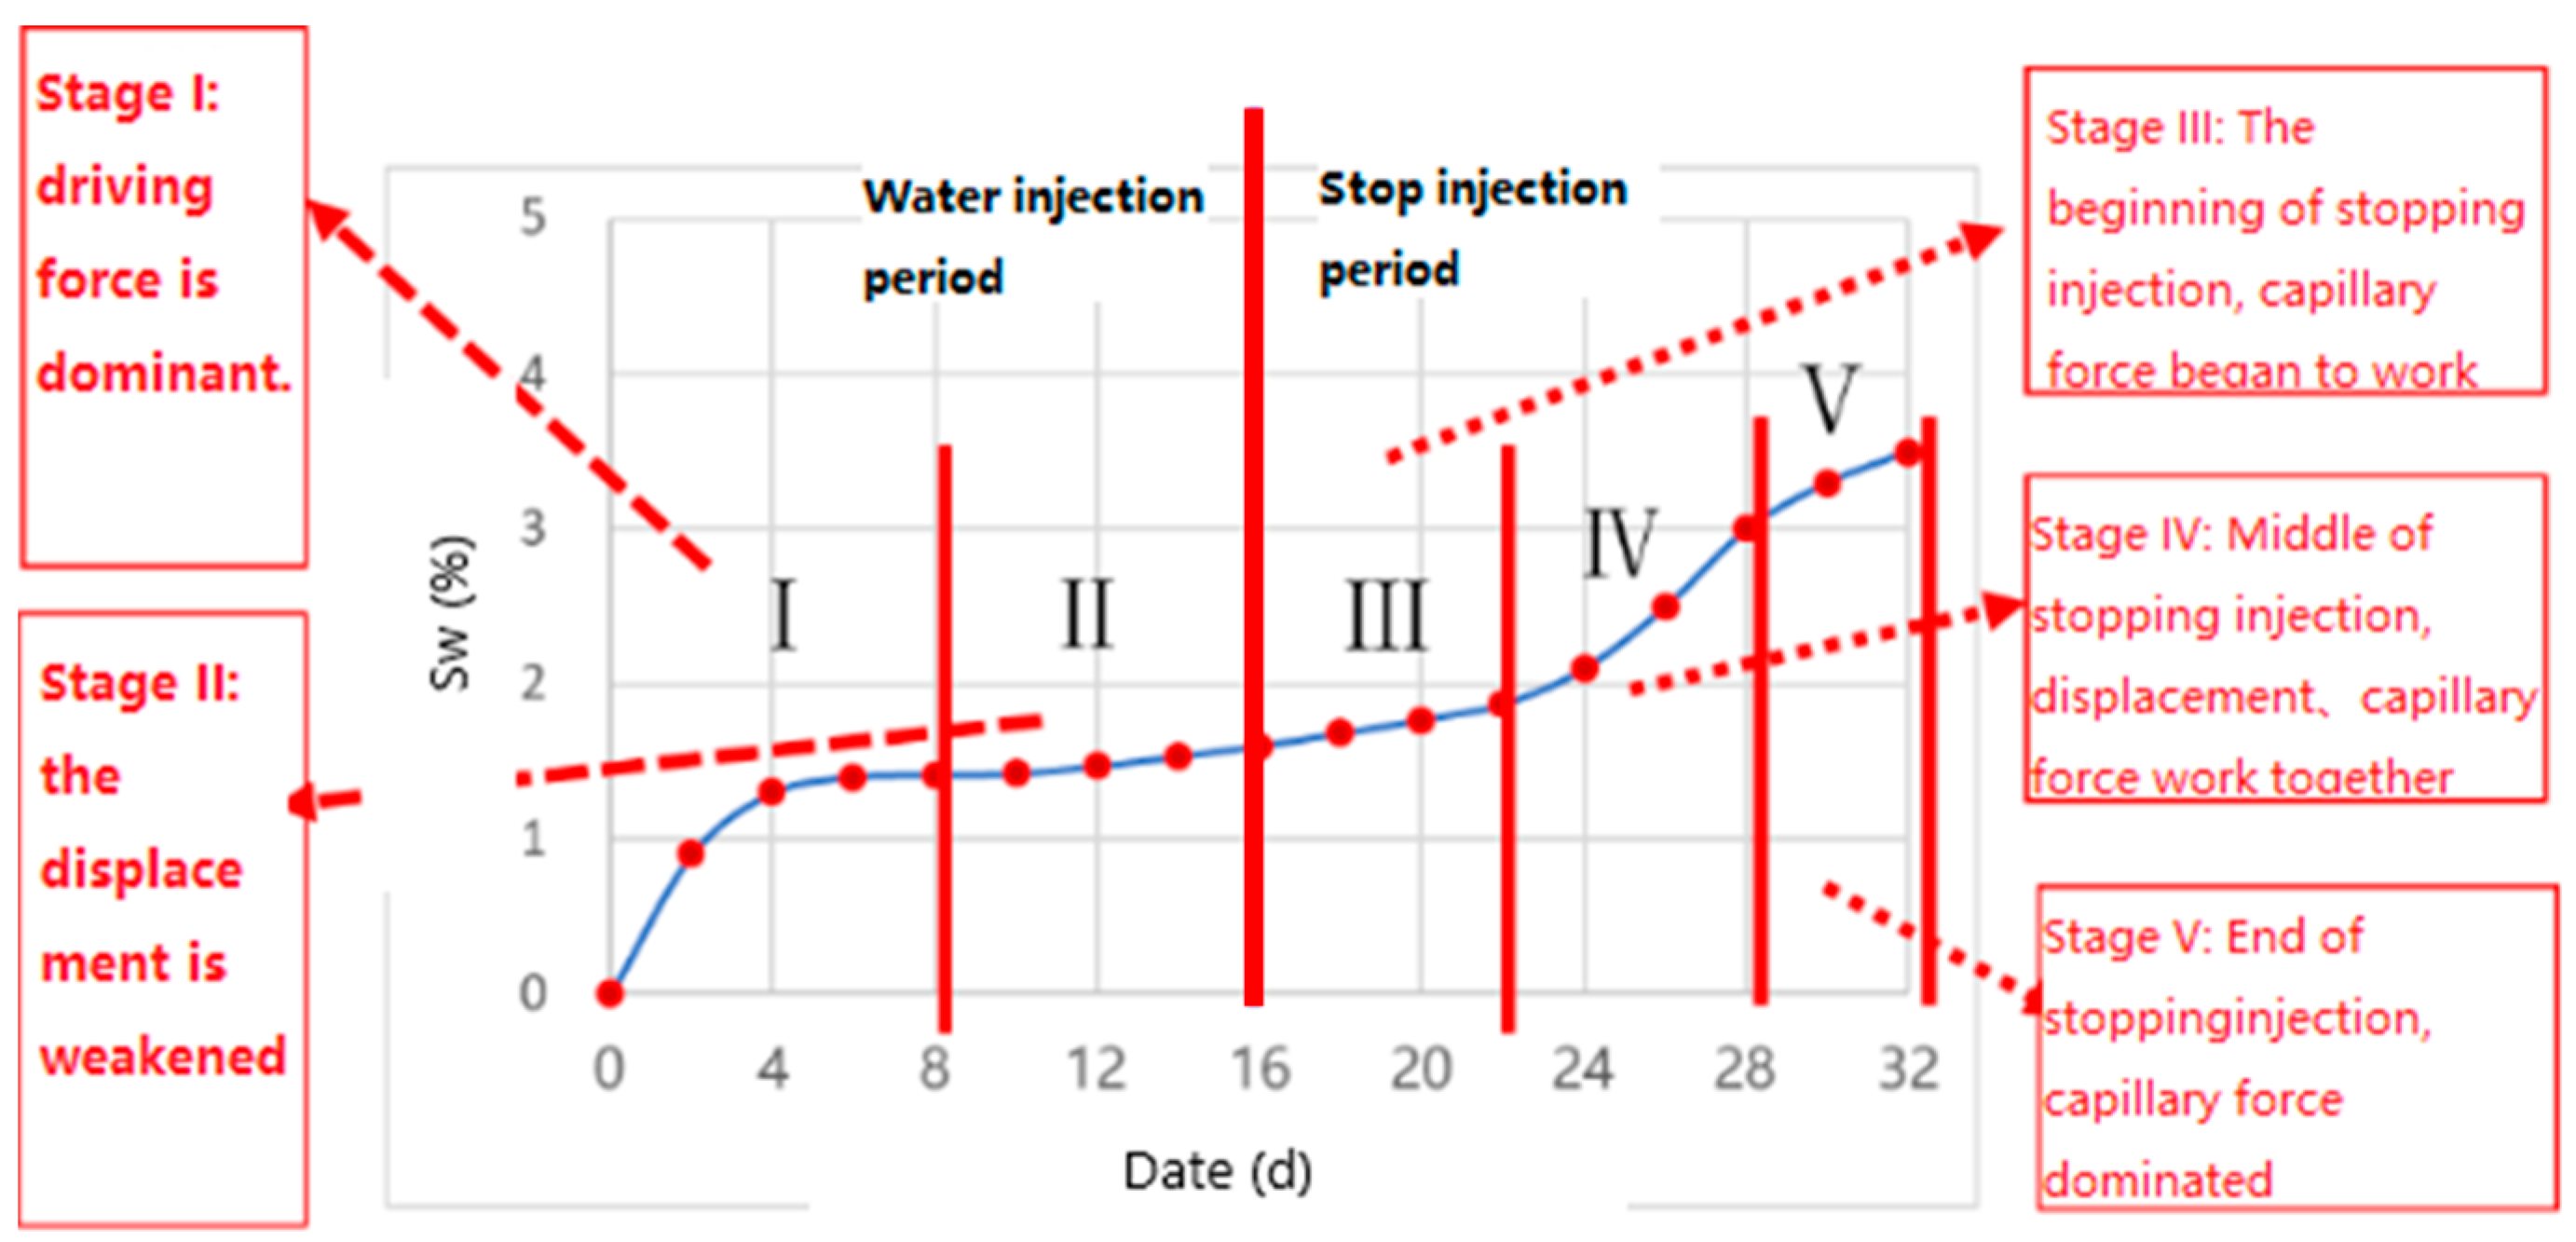
The cyclic water injection displacement process can be divided into five stages. The pressure difference is the main force of cyclic water injection, and the imbibition mainly occurs when the pressure difference is small between high and low permeability.
(3)
When the water injection wave and volume are close to the maximum swept volume, it is the best time to implement periodic water injection. Based on the analytical model of the pressure field between injection-production wells, the optimum injection-production ratio is determined to 1, and the injection time and injection stop time are provided.
(4)
Unstable water injection offers the advantages of requiring a small investment, simple operation, and wide application. Considering economic factors, unsteady water injection stands out as one of the best choices for improving recovery.
(5)
Compared to other methods, the recovery rate of unstable waterflooding is limited. To significantly enhance the recovery rate, it is necessary to consider adopting or collaborating with methods that involve higher investment costs. Additionally, the impact of unstable waterflooding on improving development effectiveness is greater in reservoirs with stronger heterogeneity, while its effect is not remarkable for reservoirs with weak heterogeneity.

Author Contributions

Conceptualization, W.Z. and L.Z.; methodology, W.Z. and J.W.; software, H.M.; validation, M.S. and Y.L.; formal analysis, H.M. and X.Z.; investigation, M.S.; writing—original draft preparation, W.Z.; writing—review and editing, H.M.; visualization, M.S. and Y.L.; funding acquisition, L.Z. All authors have read and agreed to the published version of the manuscript.

Funding

This work was funded by Basic and Prospective Project of “14th Five-Year Plan” of PetroChina Company Limited: Research and Application of Key Technologies for Oil Stability and Water Control in Central Asian Fractured Porous Carbonate Reservoirs (2022DJ3210).

Data Availability Statement

The original contributions presented in the study are included in the article.

Conflicts of Interest

The authors declare no conflicts of interest.

Nomenclature

Pthe pressure at a distance r from the water injection well at time t, MPa
Piinitial formation pressure, MPa
Qinjection rate or production rate, m3/day
μviscosity, mpa.s
kmmatrix permeability, mD
kffracture permeability, mD
hformation thickness, m
ttime, day
ηfPressure conduction coefficient,
φffracture porosity, %
φmmatrix porosity, %
Ctffracture elastic compression coefficient, MPa−1
Ctmmatrix elastic compression coefficient, MPa−1
λflow capacity ratio
αform factor
ωstorativity ratio
Tinjection and production ratio, day

References

  1. Yu, Q.; Zhang, S. Numerical simulation of reservoir with periodic water injection. Pet. Explor. Dev. 1993, 20, 46–53. [Google Scholar]
  2. Yu, Q.; Zhang, S. A second report on the study for the cyclic flooding by numerical reservoir simulation. Pet. Explor. Dev. 1994, 21, 56–61. [Google Scholar]
  3. Meng, J. Theory and practice of oilfield periodic water injection. Yunnan Chem. Ind. 2018, 45, 161–162. [Google Scholar]
  4. Sharbatova, I.N.; Surguchev, M.L. Periodic Water Injection Development of Layered Heterogeneous Oil Reservoirs; Petroleum Industry Press: Beijing, China, 1988. [Google Scholar]
  5. Meijerbauer, B.H. Characteristics of Fractured Oilfield Development; Petroleum Industry Press: Beijing, China, 1986. [Google Scholar]
  6. Eright, R.J. Spraberry cyclic technique may get 500 million bbl of oil. Oil Gas J. 1962, 8, 30–34. [Google Scholar]
  7. Elkins, L.F.; Skov, A.M. Cyclic water flooding the Spraberry utilizes “End Effects” to increase oil production rate. J. Pet. Technol. 1963, 15, 877–884. [Google Scholar] [CrossRef]
  8. Guidroz, G.E.T. O’Daniel Project A successful Spraberry flood. J. Pet. Technol. 1967, 19, 1137–1140. [Google Scholar] [CrossRef]
  9. Yu, G. Numerical simulation of cyclic water injection mechanism in vertical heterogeneous sandstone reservoir. J. Southwest Pet. Univ. (Sci. Technol. Ed.) 1997, 19, 64–68. [Google Scholar]
  10. Huang, Y.; Shang, G. Study on the mechanism of cyclic water flooding by nuclear magnetic resonance imaging. Acta Pet. Sin. 1995, 16, 62–67. [Google Scholar]
  11. Tian, P.; Xu, A.; Zhang, X.; He, E. Evaluation on the effect of unstable water injection in the late development period of Renqiu oilfield. Acta Pet. Sin. 1999, 20, 38–42. [Google Scholar]
  12. Hu, S.; Zhang, L.; Feng, Y. Research on stable production technology of low permeability complex fault block reservoir in high water cut period. J. Southwest Pet. Univ. 2007, 29, 86–88. [Google Scholar]
  13. Zhang, J.; Bai, S.; Zhang, Y.; Ban, Y. Experimental study on cyclic water injection and mechanism of oil increase. Acta Petrol. Sin. 2003, 24, 76–80. [Google Scholar]
  14. Zhang, Y.; Zhang, J.; Wang, G. Study and application of unsteady water injection techniques in Shengli oilfield. J. Oil Gas Technol. 2000, 1, 49–52. [Google Scholar]
  15. Dang, W. Mechanism and Application of Cyclic Water Injection. Master’s Thesis, China University of Petroleum, Beijing, China, 2011. [Google Scholar]
  16. Huang, L. Mechanism and mode of cyclic water injection. Inn. Mong. Petrochem. 2014, 16, 121–122. [Google Scholar]
  17. Jiang, R.; Wei, X.; Wang, S.; Jiang, Y.; Shan, L.; Wang, R. Numerical simulation of cyclic water injection mechanism considering capillary lag. Pet. Geol. Oil Recovery 2013, 20, 49–52. [Google Scholar]
  18. Wang, X.; Zeng, L.; Gu, J.; Yao, J.; Shen, G. Unstable water injection mechanism and its field application in loose sandstone reservoir. Pet. Geol. Oilfield Dev. Daqing 2008, 3, 59–630. [Google Scholar]
  19. Li, Y. The application of asynchronous injection and production in the Dongshegnbao buried hill. Pet. Geol. Eng. 2011, 25, 16–17. [Google Scholar]
  20. Su, Y.; Zhu, Z. Percolation characteristics and unstable water injection strategy of fractured buried hill reservoirs: Taking the buried hill reservoir in Bohai JZ25-1S oilfield as an example. China Offshore Oil Gas 2019, 31, 78–85. [Google Scholar]
  21. Arab, D.; Kantzas, A.; Torsæter, O.; Akarri, S.; Bryant, S.L. A crucial role of the applied capillary pressure in drainage displacement. SPEJ 2021, 26, 2148–2166. [Google Scholar] [CrossRef]
  22. Dong, W. Study on Mechanism and Parameter Optimization of Asynchronous Injection and Production in G693 Horizontal Well. Master’s Thesis, Northeast Petroleum University, Daqing, China, 2022. [Google Scholar]
  23. Xuan, W. Study on the Method for Determining the Adaptability Conditions and Reasonable Development Parameters of Unstable Injection and Production in Low Permeability Reservoirs. Master’s Thesis, China University of Petroleum, Beijing, China, 2023. [Google Scholar]
  24. Ma, K.; Fang, N.; Lv, Z.; Yue, B. Quantitative study and application of unstable water injection in buried hill fractured reservoir. Nat. Gas Oil 2023, 41, 44–49. [Google Scholar]
  25. Song, X.; Li, Y.; Li, F.; Yi, L.; Song, B.; Zhu, G.; Su, H.; Wei, L.; Yang, C. Separate-layer balanced waterflooding development technology for thick and complex carbonate reservoirs in the Middle East. Pet. Explor. Dev. 2024, 51, 578–587. [Google Scholar] [CrossRef]
Figure 1. 3D schematic diagram of experimental model.
Energies 18 00159 g001
Figure 2. CT core scanning displacement system.
Energies 18 00159 g002
Figure 3. Comparison chart of the degree of spread in each stage.
Energies 18 00159 g003
Figure 4. Variation law of water saturation in the low permeability area at each stage of periodic water injection.
Energies 18 00159 g004
Figure 5. The typical fractured reservoir simulation model.
Energies 18 00159 g005
Figure 6. Cycle water injection simulation results for typical reservoirs.
Energies 18 00159 g006
Figure 7. Simulation results of periodic water injection in different wettability reservoirs.
Energies 18 00159 g007
Figure 8. Distribution of water saturation and water injection swept volume change law.
Energies 18 00159 g008
Figure 9. Development effect of periodic water injection at different water cuts.
Energies 18 00159 g009
Figure 10. The effective time of periodic water injection at different water cuts.
Energies 18 00159 g010
Figure 11. Distribution characteristics of the pressure field at a reasonable injection and stop injection time.
Energies 18 00159 g011
Figure 12. Pressure distribution at different injection-production ratios in the continuous injection phase, water injection boost phase, and stop injection pressure reduction phase.
Energies 18 00159 g012
Figure 13. Distribution characteristics of the pressure field at different injection and stop injection times.
Energies 18 00159 g013
Figure 14. A reservoir development status field diagram.
Energies 18 00159 g014
Figure 15. Development mode partition.
Energies 18 00159 g015
Figure 16. Comparison chart of plane spread degree of different systems.
Energies 18 00159 g016
Figure 17. Comparison of recovery levels of different systems.
Energies 18 00159 g017
Table 1. Periodic water injection experiment results.
NoInitial Water Cut (%)Recovery Degree of Waterflooding (%)Recovery Degree of Cyclic Water Injection (%)Increase Range (%)
1--30
2402034.14.1
3602737.07.0
4802835.65.6
Disclaimer/Publisher’s Note: The statements, opinions and data contained in all publications are solely those of the individual author(s) and contributor(s) and not of MDPI and/or the editor(s). MDPI and/or the editor(s) disclaim responsibility for any injury to people or property resulting from any ideas, methods, instructions or products referred to in the content.

