Abstract
The combined heating method of seat heating and air conditioning (A/C) was applied in the passenger compartment under different experiment conditions, using thermocouples to continuously measure the wall surfaces and air temperatures in the passenger compartment and the passengers’ skin temperatures of 17 segments. Meanwhile, a subjective evaluation questionnaire survey was conducted using a nine-point evaluation scale on the local and overall thermal sensation and thermal comfort of the passengers, and the data from the questionnaire were analyzed with the ANOVA method. The results showed that the use of the heating pad directly affected the changes in human skin temperature, which in turn affected the local and overall thermal sensation and thermal comfort. For the two thermally stimulated segments of the back and under the thighs, the skin temperature of the back was higher than that of the thighs. Using the heating pad resulted in a rapid increase in the mean skin temperature in the early period of the experiment. Thermal sensation of the back and under-thighs shifted rapidly towards the hot zone in the first 10 min, and then settled around +3, with even more significant differences between the groups. Thermal sensations in non-thermally stimulated segments changed in relation to their position on the heating pad, with slower changes in those at the “distal” end of the body, the head and the feet. Continued use of the heating pads at lower ambient temperatures maintained overall thermal comfort at a neutral level in the range of 0–1, whereas at higher ambient temperatures there was a gradual deterioration of local and overall thermal comfort.
1. Introduction
With the development of industrialization, the use of automobiles has gradually increased in human life, and how to balance the two seemingly contradictory goals between energy efficiency and thermal comfort of automobiles has become the focus of research, namely, exploring the thermal environment control strategies that optimize the thermal comfort of the passenger while reducing the energy consumption to ensure a good driving performance. A/C plays an important role in improving passenger thermal comfort. In the current trend of transitioning from traditional internal combustion engines (ICE) vehicles to electric vehicles (EVs), as the A/C system of pure EVs contributes to 60% to 70% of the energy consumption of the auxiliary system [1], turning on the A/C will have a great impact on the EV’s mileage. Energy-saving strategies of electric vehicle A/C systems have shifted from regular optimization of system components to improvement methods sought toward occupant compartment environmental control, such as reducing vehicle A/C demand by using a zoned and individualized control method [2].
Compared with the building environment, due to the small and complex space of the vehicle passenger compartment, the air flow organization has a high degree of non-uniformity and transient. The distribution characteristics of the thermal-fluid field define the heat transfer between the environment and humans, and it is challenging to predict and improve the passenger compartment thermal environment to ensure passenger thermal comfort. Early studies were limited by experimental limitations and mostly focused on testing and analyzing the interior heat flow field using numerical methods and simplified models [3,4]. With the advancement of research tools, the thermal-fluid field characteristics in compartments have been widely studied experimentally and numerically. Sevilgen [5] described a three-dimensional vehicle cabin model to determine the airflow and heat transfer characteristics during the transient heating period, and applied the constant heat flux boundary conditions to the manikin surfaces. The numerical results were consistent with the available experimental and theoretical data from the literature, indicating that the flow and temperature fields reached steady-state conditions at about 30 min, and non-uniform temperature distributions were presented in the cabin and manikin surfaces. Alahmer et al. [6] demonstrated through a set of hot soaking experiments aided by thermography measurement that non-uniformities of thermal environments in the passenger compartment are associated with the high localized air velocity, air temperature distribution, solar flux, radiation heat flux from surrounding interior surfaces. Torregrosa-Jaime [7] presented a lumped-parameter thermal model of the passenger compartment of a vehicle validated with experimental data to integrate with an A/C system mode to reduce the overall energy consumption. To study the influence of a change in the vertical guide vane angle on the temperature and velocity distributions within a vehicle cabin subjected to solar radiation, Bandi [8] performed a 3D non-stationary numerical simulation of the cabin. The analysis of unsteady fluctuations in the flow field at different locations has indicated the existence of a dominant low-frequency oscillation of a period of approximately 50 s throughout the cabin, indicating the transient characteristics of the flow in the cabin. Zhang et al. [9] conducted an outdoor parking temperature rise test with an SUV as the research object, provided boundary conditions and validation data for the numerical simulation, and proposed an evaluation index for the average cooling rate.
Thermal comfort is defined in general as the condition of mind that expresses satisfaction when considering the thermal environment in an occupied zone [10]. The human body thermoregulatory model can theoretically study the heat exchange between the body and the surrounding environment, the human body’s own thermal characteristics and the thermal responses. Stolwijk [11] simplified the human body with a model of six segments and introduced feedback mechanisms into the human thermophysiological regulation process. The Fiala model builds on this foundation by dividing the human body into 15 segments, categorized into passive and active systems, and is able to predict the thermal response in both steady-state and transient conditions [12,13,14]. Compared with the Stolwijk model, the Berkeley Comfort Model, with its unlimited body segments and improved blood flow model, can better describe the physiological differences between individuals and predict the human responses to thermal environments, and can be widely used in transient and non-homogeneous environments [15]. In order to predict human thermal comfort in transient non-uniform thermal environments such as automobiles, Rugh and Bharathan [16] developed a thermal comfort tool that includes a 126-segment sweating manikin, a finite element physiological model of the human body, and a psychological model based on human testing to transfer data from the physiological model to the psychological model in order to predict both local and overall thermal comfort. The human thermophysiological regulation model analyzes the human body temperature regulation process through physiological data, so as to determine the heat exchange between body segments and the environment. There are many factors affecting the human body’s thermal comfort and the relationship is complex, for the evaluation of comfort is mainly divided into objective and subjective evaluation. Such as the most classic PMV-PPD model, based on the heat balance equation and subjective questionnaire survey, can evaluate the overall thermal state of a person in a steady and uniform thermal environment [17]. Other models have also been developed, such as the equivalent homogeneous temperatures method, which can measure the local thermal comfort in non-uniform environments [18], and the Berkeley Comfort Model, which utilizes thermal response parameters including skin temperature/core temperature and its derivatives to evaluate local and whole-body thermal comfort and thermal sensation in transient environments [19]. Thermal comfort studies of passengers have been conducted mainly through a combination of simulation and experimental methods, applying various human thermoregulation models and thermal comfort evaluation methods [20,21,22,23]. Khatoon et al. [24] compared the numerical results of three thermal comfort models, Fanger’s model, the equivalent temperature model and the modified Fanger’s model, using a 3-D numerical analysis method, and considered the effect of environmental heat load on thermal comfort. Lahlou et al. [25] proposed a real-time thermal comfort management strategy to regulate thermal comfort based on the energy available for operating the HVAC system, achieving a balance between energy consumption and occupant thermal comfort in electric vehicles. And there is also some work that attempts to directly correlate passenger thermal comfort with physiological parameters through experimentation. Cengiz et al. [26] used a subjective questionnaire to investigate the passenger local thermal comfort in various segments under real traffic conditions. Lee [27] investigated the effect of a three-dimensional air-conditioning system on cabin thermal comfort to reduce the difference in thermal comfort between the front and rear seats by equipping the rear passengers with an auxiliary blower. Yun et al. [28] focused their study on female passengers by conducting long-term outdoor experiments, and based on the experimental data, derived predictive equations for the overall thermal sensation (OTS) of female automobile users under transient and steady-state conditions.
The personal comfort system (PCS) is able to autonomously adjust itself to changes in the thermal environment and to one’s own needs, thus keeping thermal comfort at a high level. Fanger first introduced the concept of personalized air (PA), creating microenvironments with high comfort at low air supply [29]. PCS acts on a single individual, focusing on human thermal sensation and thermal comfort, eliminating partial discomfort in sensitive areas through localized heating or cooling, which can satisfy the requirements of human comfort and air-conditioning energy consumption compared to the whole space temperature control. Zhang et al. [30] tested four different seat temperatures in 11 climate chambers with 24 subjects and evaluated them using the ASHRAE 7-point scale. The results showed that the percentage dissatisfaction is a second-order polynomial function of local heat flow, and that provision of an optimal seat temperature would extend the conventional 80% acceptable range of air temperature for drivers and passengers in vehicle cabins by 9.38 °C downwards and by 6.48 °C upwards. Watanabe [31] conducted a study on the performance of an Individually Controlled System (ICS) in various heating combinations and the calibration of the experimental data using a thermal manikin with Equivalent Temperature (ET), proved that both the heating and the cooling capacity of the ICS need to be increased in order to satisfy the majority of passengers in practice, and defined the whole-body ET to be 21.6–29.7 °C. Tan [32] studied the changes in physiological parameters and thermal sensations under different convection–radiation heating modes by developing an optimized radiant–convective combined personal heater PHSR+C, and verified the superiority of the energy-saving effect of this heater in terms of both the perspective of subjective ratings and physiological responses. Compared with traditional personal heaters, PHSR+C can save energy by 27.6%. Oi [33] investigated the effects of automotive heated seats and foot heaters on human thermal sensation and thermal comfort through subjective experiments under 12 different conditions. The results show that heated seats and foot heaters improve the subjective response of passengers in cold environments, and simulation results showed that heated seats and foot heaters reduce the vehicle’s total heater energy consumption. Enescu et al. [34] investigated the heat transfer mechanism of a wearable thermoelectric generator in direct contact with human skin as a versatile and adaptable solution to meet individual thermal needs in local environments, improve local thermal comfort and increase energy efficiency. As the research progressed, the development of PCS was gradually broadened from buildings to vehicles due to the need for energy efficiency. Similarly, the application of PCS in vehicles mainly involves air-conditioning ventilation and seat heating. Jeffers [35] used a human physiology model in combination with a zone-cooling configuration to adjust the airflow distribution to deliver cool air to different segments of the driver, and the results showed that zone cooling provided equal or better cooling to the driver and was able to reduce air conditioning energy consumption about 5.5% to 28.5% for 20 min of transient cooling. Much of the research on PCS has focused on experiments in buildings or through artificial climate chambers, using indexes applicable to steady environments to evaluate human thermal sensation [30,31,32,33]. Some studies have demonstrated differences in OTS caused by the use of PCS in steady thermal environments through analysis of variance (ANOVA) [33,36].
Most of the studies on the thermal environment and passenger thermal comfort in vehicles focus on the combined simulation and experimental methods of the cooling process in summer, and there is a lack of research on the warming-up process of electric vehicles, which currently consume a large amount of energy in winter. Personal comfort systems (PCS) provide transient changes in local skin temperature by controlling the thermal environment around the human body, and such transient local thermal environment changes are closely related to the body’s thermal response. Most studies of personal comfort systems have been conducted in highly controlled environments and it is common to use ASHRAE 7-point scales to evaluate human thermal sensation. This method of studying PCS in a steady-state environment is not applicable to passenger compartments where the space is small and the thermal environment is complex.
In this paper, the parameters of the thermal environment in the cabin were measured under different PCS+A/C heating combinations. Considering the extreme thermal sensations that may occur when using the heating device, a subjective questionnaire on the overall and local thermal sensations and thermal comfort was conducted using a 9-point evaluation scale. A 13-point formula including the heated segments was used to calculate the mean skin temperature (MST), and the correlations and intergroup differences between environmental parameters and MST, OTS, and OTC were investigated through Spearman’s correlation heat map. Based on the results of the subjective questionnaire, the study focused on the changes in the human’s local thermal sensation and thermal comfort during the transient heating phase. As well as the effects caused by PCS on thermal sensation, thermal comfort and the energy-saving potential of the combined heating methods.
2. Experiment Method
2.1. Experiment Set Up
The experiment was conducted at the parking lot of Shanghai Automotive Wind Tunnel Center, Shanghai, China (121°26′ E, 31°39′ N), in February 2023. To minimize the interference of the external environment, the experiment was chosen to be carried out in an indoor room after 7:00 p.m. The experimental test vehicle was a SAIC Volkswagen Lavida 280tsi. (SAIC Volkswagen, Shanghai, China) the engine model was EA211-DJS, a 1.4 T turbocharged engine with a rated power/ maximum power of 96/110 kW, the A/C heating system was a conventional waste heat system.
In order to study the effects of different heating modes on the thermal environment of the passenger compartment and the thermal comfort of the occupants, three heating modes are used as shown in Table 1, of which Case 1 is the control experiment under the air-conditioning heating mode, with automatic A/C set to 26 °C with no heating device, and Case 2 and 3 are the combined heating modes, with the air temperatures set to 22 °C and 26 °C, and the heating pads at the back and the under-thighs are all set to a constant temperature of 33 °C.

Table 1.
Experimental conditions.
2.2. Subjects
The number of subjects was 20 (10 males and 10 females), and the basic information is shown in Table 2. For all conditions, the subjects were required to dress in typical clothing ensembles in ASHRAE standard 55 [10], including long underwear, socks, shoes, trousers, t-shirts and sweaters, and jackets, with a total clothing thermal resistance of 1.3 clo.

Table 2.
Characteristics of subjects.
2.3. Experiment Procedure
Before the experiment, the subjects were required to stay in the preparation room with a set temperature of 26 °C and 50% relative humidity for 30 min to ensure that their physical condition was good, their mind was relaxed, and their thermal sensation was maintained in a neutral state.
The testing time was 1 h and the vehicle was stationary during the experiment. Two subjects sat quietly in the driver’s seat and passenger’s seat, the thermal environment of the passenger compartment and the subjects’ skin temperature changes were measured by thermocouples, and subjective questionnaires were used to evaluate the changes in the subjects’ local and overall thermal sensations and thermal comfort.
The three groups of tests were conducted sequentially in the order shown in Table 1, with a time interval of 40 min between each two tests, during which the passenger compartment thermal environment was restored to the initial state by physical cooling methods. The experiment set-up is shown in Figure 1.
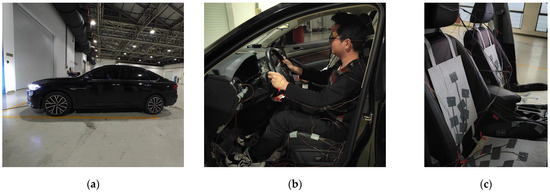
Figure 1.
(a) Experiment vehicle. (b) Experiment subject. (c) Measured points in the cabin.
2.4. Measurement
2.4.1. Environmental Parameters
The air and wall temperatures in the passenger compartment were measured with thermocouples TTK-24-SLE (±0.4% special limits of error). The air temperature measurement points included four air outlet temperatures, air temperatures at the breathing points, chest, and feet of the four seating positions, and outside ambient temperatures, and the wall temperatures measurement points included the instrument panel, the front windshield, and the roof of the vehicle. As shown in Figure 2, in order to study the effect of local heating devices on thermal sensation and thermal comfort in cold weather, the heating pads were placed on the driver’s and passenger’s seats, each with a rated power of 40 W and a size of 280 mm × 380 mm, and five thermocouples were arranged on the pads, respectively, in order to measure the uniformity of the temperatures and the thermal storage situation during the experiment. Measurement of air velocity of the outlets using the Emprise impeller anemometers with rated uncertainty of ±0.5% of the readings. Temperature and air velocity data were collected with the imc SPARTAN-T128-CAN.
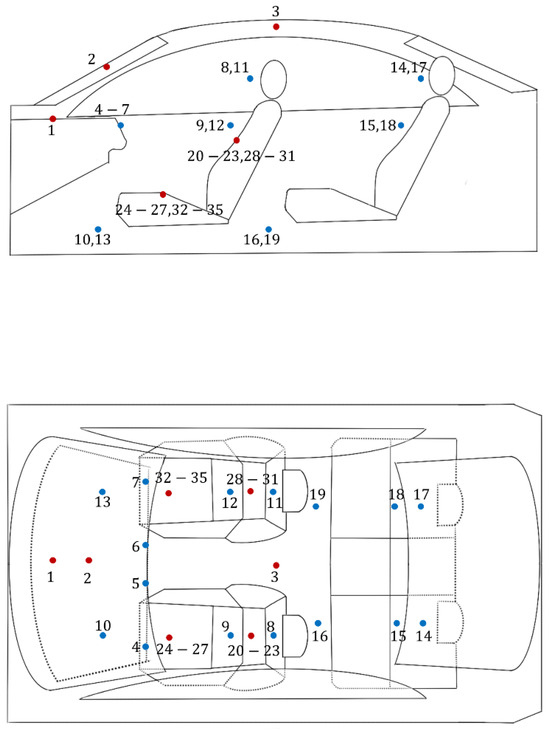
Figure 2.
Experimental measuring points in cabin.
2.4.2. Human Body Temperature
The thermocouple TT-K-36-SLE (±0.4% special limits of error) was used to measure the occupant’s body temperature. The human body was divided into 17 sections, with three measurement points on the back, the right under-thigh and the left under-thigh in contact with the heating pad, and the other sections were divided into the head, the chest, the right upper arm, the right lower arm, the right hand, the left upper arm, the left lower arm, the left hand, the right upper-thigh, the right calf, the right foot, the left upper-thigh, the left calf, and the left foot, and the temperature measurement points were arranged at the center of each section with adhesive tapes conducting heat, as shown in Figure 3. Mean skin temperature (MST) is an important parameter reflecting the status of heat exchange between the human body and the environment, in order to show the effect of localized heating of the human body on the overall skin temperature, 13-point formula [37]. was chosen to calculate the MST, and the 13-point calculation method involves the temperature measurement parts and weighting factors as shown in Equation (1).
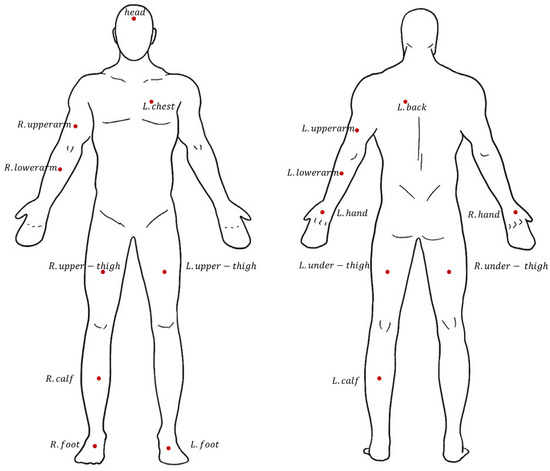
Figure 3.
Experimental measuring points on human body surface.
2.4.3. Thermal Comfort Evaluation
Since the experiment was conducted in the passenger compartment in winter, where human thermal sensation and thermal comfort are more prone to extremes than in the built environment, the BERKELEY 9-point scale was used for this evaluation, with the addition of two extreme conditions, “very cold” and “very hot”, to the ASHRAE 7-point scale, as shown in Figure 4. The length of each test was 1 h, which was divided into transient and quasi-steady states according to the heat-up state of the passenger compartment, with the transient questionnaire filled out in the first 30 min and the steady state questionnaire filled out in the last 30 min. The specific time intervals for filling in the questionnaire are shown in Figure 5. The questionnaire was filled in every two minutes from 0 to 10 min, every five minutes from 10 to 30 min, and every 10 min from 30 to 60 min. The questionnaires included thermal sensation and thermal comfort of the occupant’s body segments and the whole body. Due to the limitation of the filling time, the transient questionnaire divided the body into head, back, upper body (unheated part), under-thighs, lower body (unheated part), feet, and the whole body, and the steady-state questionnaire corresponded to the temperature measurement points and subdivided the body regions into head, chest, back, right upper arm, right lower arm, right hand, left upper arm, left lower arm, left hand, right upper-thigh, right under-thigh, left upper-thigh, left under-thigh, right calf, left calf, right foot, and left foot. The specific questions in the questionnaire are shown in Figure A1 and Figure A2 in Appendix A.
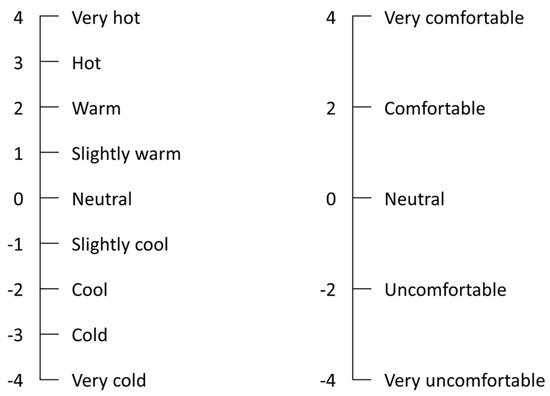
Figure 4.
Scales of thermal sensation and thermal comfort.

Figure 5.
Questionnaire procedure.
3. Results and Discussion
3.1. Thermal Environment Characteristics
The measurement of the external ambient temperature is shown in Figure 6, where the range of the external ambient temperature is 0.8–1.5 °C.
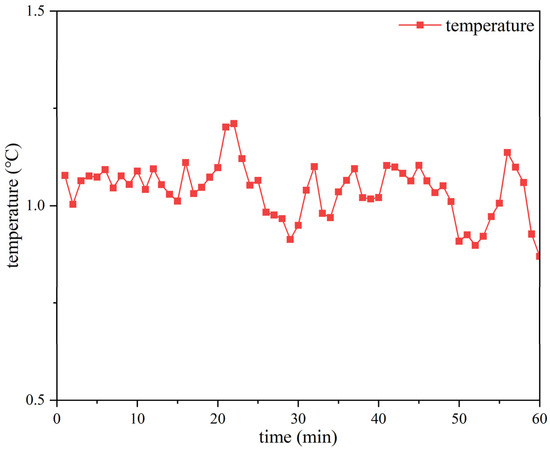
Figure 6.
External ambient temperature.
Figure 7 and Figure 8 show the average air supply conditions under different test modes, including air supply temperature and air supply velocity. Air vents 1 and 2 are the air vents on the driver and passenger side by the window, and air vents 3 and 4 are for the driver and passenger’s foot side. For the air supply temperature, the temperature of the two side vents was higher than that of the foot vents under different conditions. When the auto A/C was set to 26 °C, the air supply temperature dropped sharply in the first 20 min of the experiment, and in the later period, the air temperatures of the side vents stabilized at about 40 °C, and the temperatures of the foot vents stabilized at about 33 °C. For the condition where the auto A/C was set to 22 °C, the difference in temperature between the air outlet on both sides and that at the foot side was about 6 °C. As for the air supply speed, it is higher at the foot outlet than at the side outlets, and the air supply speed gradually becomes stable after 30 min from the beginning of the experiment, but there are still fluctuations.

Figure 7.
Air supply temperature at different heating modes. (a) 26 °C no heating. (b) 22 °C with heating. (c) 26 °C with heating.

Figure 8.
Air supply velocity at different heating modes. (a) 26 °C no heating. (b) 22 °C with heating. (c) 26 °C with heating.
Figure 9 shows the changes in the wall surface temperature of the passenger compartment under different heating modes. The wall surface temperature is mainly affected by the A/C air supply condition. When the A/C temperature is set to 26 °C, the time for each wall surface temperature to reach the quasi-steady state is about 20 min, and when the A/C setting temperature is lowered to 22 °C, the setting temperature is closer to the initial ambient temperature, and the reduction in the temperature difference shortens the time for the wall surface temperature to reach the quasi-steady state. Due to the different wall materials and spatial location of different wall surfaces, the temperature behavior under the influence of different heating modes is different, with the instrument panel and roof warming up at a higher rate than the windshield. The final thermal equilibrium temperature is higher than that of the windshield, with a difference of 4–6 °C.

Figure 9.
Wall surface temperature inside cabin at different heating modes. (a) 26 °C no heating. (b) 22 °C with heating. (c) 26 °C with heating.
As shown in Figure 10, when the heating pad was not turned on, the temperature increased due to the heat storage property of the material, and the temperature difference before and after the test was about 3 °C. Setting the temperature of the heating pad at 33 °C, the A/C setting had no effect on the heating pad, and with the change of time, the heating rate slowed down, and the passenger back heating pad obtained the highest temperature before and after the test, where the difference was about 6.5 °C.

Figure 10.
Heating pad temperature at different heating modes. (a) 26 °C no heating. (b) 22 °C with heating. (c) 26 °C with heating.
In winter, the automobile A/C air supply is mainly in the feet-blowing mode, so the air temperature of the front passenger’s feet, which is closest to the air outlet, is higher than the other measurement points. Due to thermal expansion and contraction, the warm air moves upward and backward from the air vents, so the air temperature around the head is higher, and the front row air temperature is higher than the back row air temperature. That is, for the front row, the foot air temperature > the head air temperature > the chest air temperature, and for the back row, the head air temperature > the chest air temperature > the foot air temperature.
Figure 11 shows that when the A/C is turned on in winter, the air temperature in the passenger compartment can be rapidly increased in a short period of time, but the thermal environment is extremely inhomogeneous in both the longitudinal and transverse dimensions of the space. Zhang classified the air temperature change in the passenger compartment during the heating period into three phases, which are rapid temperature change, slow change and steady state, the rapid transient change phase in the front row occurs within the first 5 min, and the rapid transient change phase in the rear row lasts for about 10 min; the air temperature in the front row reaches the steady state in about 15 min, and in the rear row, it takes more than 20 min [38]. In the present study, arithmetic averaging of temperatures at different air points showed that the phases of air temperature change are consistent with the fact that differences in the size of the passenger compartment led to differences in the form of airflow organization, and the relatively small size of our vehicle shortens the time for the air temperature to reach quasi-steady state.

Figure 11.
Air temperature with different measurement points at different heating modes. (a) 26 °C no heating. (b) 22 °C with heating. (c) 26 °C with heating.
3.2. Skin Temperature
3.2.1. Local Skin Temperature
In order to investigate the effects of vertical and horizontal temperature differences in the compartment on the thermal response of the passenger during the experiment, Figure 12 shows the arithmetic mean temperatures of seven different body segments of the occupant under the three heating modes. When the heating pads were not turned on, the temperatures of each body part were significantly different in the vertical distribution, and the temperatures of each segment of the upper body were higher than those of the lower body segments, with the highest temperatures in the back and the upper body, where the segment area was larger, and the fastest warming rate was observed in the hands located at the end of the body, with the temperature difference before and after the test being 5.4 °C. This is attributed to the fact that the hands have a high density of blood vessels, which, compared with the other parts of the body, have a larger change in blood flow, with more heat sensitivity. The human body actively uses the diastole and contraction of blood vessels in the hands to regulate heat loss [39].

Figure 12.
Local skin temperature at different heating modes. (a) Head, upper body and hand temperature. (b) Back and under-thigh temperature. (c) Lower body and foot temperature.
When the heating device was turned on and the A/C temperature was set to 22 °C, the magnitude of temperature change in each segment of the body was not significant, but the temperature difference between the back and the chest, and between the upper and under thighs, increased under the influence of the heating device. Setting a higher A/C temperature effectively reduced the differences in temperature between the segments, and in the longitudinal distribution, there was no longer a significant difference in temperature between the upper and lower half of the body. Tamura et al. conducted a test on the distribution of warm spots in different parts of the human body by using a 40 °C stimulator, and the results showed that the density of warm spots on the back was larger than that on the thigh, which can be inferred that the back is more thermally sensitive and is more prone to responding to changes in temperature [40].
3.2.2. Mean Skin Temperature
Figure 13 shows the difference in human mean skin temperature under the three heating modes. When the automatic A/C set temperature was 26 °C, turning on the heating pad led to a rapid increase in the MST in the early period, which was mainly caused by the increase in the skin temperature of the segments in contact with the heating pad. The difference in MST between Case 1 and 3 was 0.66 °C before the experiment, and the difference increased to 1 °C about 10 min from the experiment. The use of the heating pad shortened the time it took for the MST to reach a steady state, and also reduced the difference in MST between Case 1 and 3 to 0.23 °C at the end of the experiment.
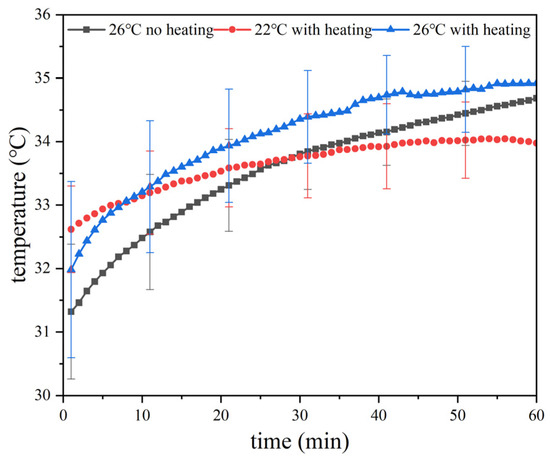
Figure 13.
Mean skin temperature at different heating modes.
When turning on the heating pad, the change in the A/C setting temperature causes the air flow in the passenger compartment to change, so when the A/C was set to 22 °C, the time for the MST to reach steady was shorter, and the temperature rise in skin temperature at the end of the test was about 1.4 °C. When the automatic A/C was 26 °C, the average human skin temperature increased by about 3.5 °C in an hour. Oi et al. [41] applied heated seats within a constant temperature test, and the MST increased more quickly when the air setting temperature was higher. This is similar to the results measured in this paper in a real vehicle. Yutani et al. [42] investigated the effect of localized heating on whole-body skin temperature. They conducted a subjective experiment in which they examined the heating of seven areas of the body at 28 °C. They reported that heating the back and buttocks was the most effective in increasing whole-body skin temperature, and a significant increase in foot skin temperature was observed by heating the buttocks.
3.3. Thermal Sensation and Thermal Comfort
3.3.1. Overall Thermal Sensation and Thermal Comfort
Figure 14 shows the changes in the overall thermal sensation (OTS) and overall thermal comfort (OTC) of the passengers during the experiment. In the first 10 min of the transient process, the use of the heating pad caused the thermal sensation of the human body to continue to move to the “hot” zone, and as the A/C temperature was set to 26 °C, the OTS changed faster, 10–30 min, the two cases in which the A/C temperature was set to 26 °C, the OTS continued to move to the hot zone, while the case in which the A/C temperature was set to 22 °C, the OTS basically remained at +2. For the OTC of the occupants, Case 1 and Case 2 maintained a comfortable state during the test, with Case 2 being closer to the neutral state, and Case 3 gradually moved out of the comfort zone in the quasi-steady state stage. Zhang et al.’s results from the heated seat test in a climatic chamber showed that the human’s overall thermal sensation stabilized within 11 min for those who used heated seats, effectively shortening the time to stability for those using A/C only [30]. In this study, on the other hand, the continuous heating of the seat resulted in a rapid improvement in thermal comfort during the initial period followed by a sharp increase in discomfort. Just as Oi’s study showed, the use of a heated seat with constant power at a steady state temperature of 20 °C is not appropriate because the seat is too hot [33].
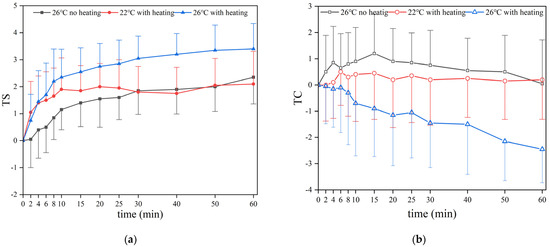
Figure 14.
(a) Overall thermal sensation (OTS) at different heating modes. (b) Overall thermal comfort (OTC) at different heating modes.
Figure 15 shows the correlation between different environmental parameters and mean skin temperature, overall thermal sensation, and overall thermal comfort. Spearman correlation can be used to analyze the degree of correlation between two non-normally distributed variables. The numbers in Figure 15 indicate the correlation coefficients: red represents positive correlation and blue represents negative correlation, and the darker the color is, the stronger the correlation. Meanwhile, the p-value is used to indicate the significant difference between the parameters. When the p-value ≤ 0.05, it is considered that there is a difference between the parameters, and the closer the p-value is to 0, the more obvious the difference is. The correlation between wall temperature and air temperature is the most obvious, with a coefficient of 0.83. As the air supply velocity directly changes the turbulence of the air flow in the passenger compartment, resulting in a strong convective heat transfer between the wall and the hot air, similarly, the air supply velocity affects the convection heat transfer intensity between the human body and the air. As can be seen in Figure 7, there is a large difference between the air temperature at the feet and the air temperature at the sides, and we averaged the air temperatures of the four vents, which is why the correlation between the air temperature and the wall temperature does not show a significant correlation. There were significant between-group differences between wall temperature and MST, OTS, and OTC, and strong positive correlations with air temperature, MST, and OTS with positive correlation coefficients of 0.83, 0.71, and 0.53, respectively. OTS was very sensitive to temperature perception, while OTC was negatively correlated with all other parameters.
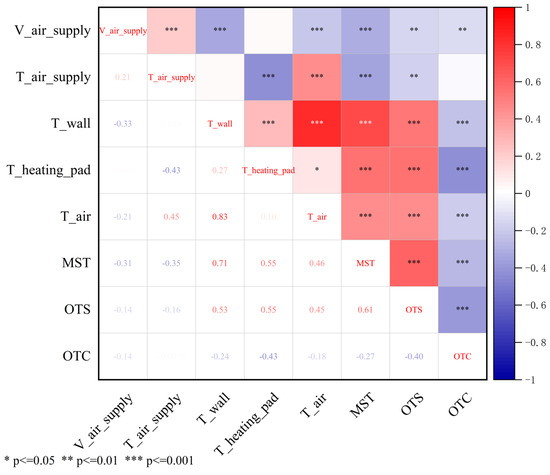
Figure 15.
Spearman’s correlation heat map.
3.3.2. Thermal Sensation and Thermal Comfort of Non-Thermally Stimulated Segments
In order to assess the effects of A/C temperature changes and the use of heating pads during the experiment, Analysis of Variance (ANOVA) was used to analyze the significance of the between-group differences in thermal sensation and thermal comfort at different cases, Post Hoc were chosen to see the specific differences, and the p-value was used as a probability to measure the evidence against the original hypothesis. The significance level was set at 95%, if p > 0.05, the difference between groups is not statistically significant, when p < 0.05, the difference between groups is statistically significant, and the closer the p-value is to 0, the more pronounced this difference is. In Figure 16, * for p < 0.05, ** for p < 0.01 and *** for p < 0.001.
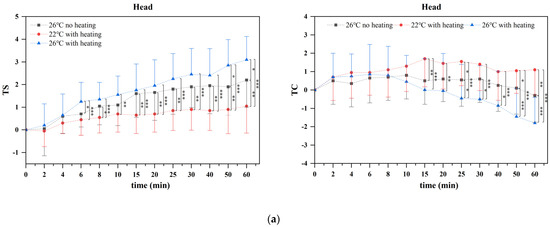
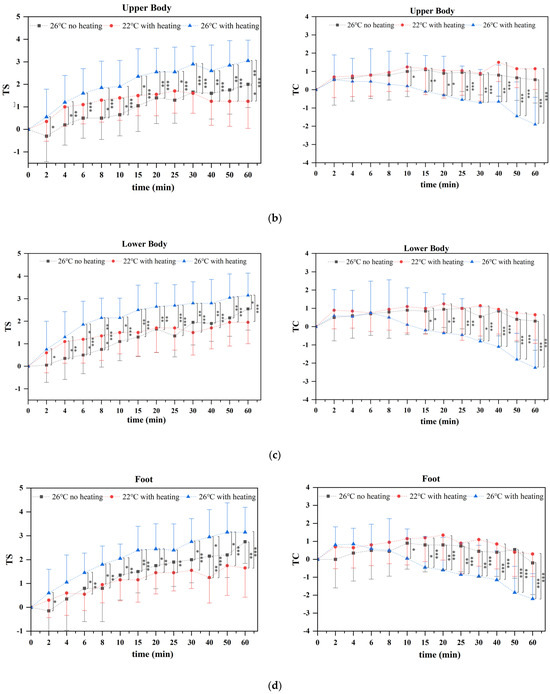
Figure 16.
Thermal sensation (TS) and thermal comfort (TC) of non-thermally stimulated segments. (a) Head’s TS and TC. (b) Upper body’s TS and TC. (c) Lower body’s TS and TC. (d) Foot’s TS and TC.
Changes in thermal sensation and thermal comfort in the head, upper body (unheated part), lower body (unheated part) and feet of the subjects are shown in Figure 16. An arithmetic mean was performed on the chest, upper and lower arms and hands from the quasi-steady state questionnaire to obtain the thermal sensation and thermal comfort for the upper body (unheated part), and also on the upper thighs, calves and feet to obtain the thermal sensation and thermal comfort for the lower body (unheated part).
Without turning on the heating pad, the thermal sensation and thermal comfort of each section had a similar trend, with the thermal sensation vote between 0 and 30 min gradually shifting from the “neutral” state of 0 to the hot zone, reaching +1 at about 10 min and +2 at about 30 min, with less variability among the last three votes. Thermal comfort varied between 0 and 1, showing a rising and then falling trend. When the heating pad was turned on, the thermal sensation shifted more obviously toward the hot zone, even in the part that was not in contact with the heating pad, and did so more quickly. With the A/C at 26 °C, the last thermal sensation vote of each section was about +3, and the thermal comfort was only maintained at 0 for the first 10 min, and then shifted to the uncomfortable state. The thermal comfort of the head and feet, located at the end of the body and far away from the heating area, was at −2 at the end of the test. Meanwhile, the upper body and the lower body adjacent to the heating area were more obviously affected, and the thermal comfort state was close to “very uncomfortable”. With the A/C at 22 °C, the thermal sensation and thermal comfort of the head did not change significantly, and the thermal sensation increased slightly in the first 10 min of the experiment, but stayed in the range of 0–1. The thermal comfort shifted from the neutral state to the comfort zone in the first 30 min, and finally remained near +1. The trend of thermal sensation in the feet was similar to the other segments but the changing rate was slower [43].
Based on the ANOVA results, the variability of thermal sensation between different cases was reflected at the beginning of the experiment, while the variability of thermal comfort mainly appeared after 10 min of the experiment. For the head and feet, the intergroup variability of thermal sensation was mainly between Cases 2 and 3, i.e., with the use of heating pads, the change in air conditioning temperature caused significant differences in thermal sensation. The variability in thermal comfort was then reflected between Cases 1 and 2, and between Cases 2 and 3. For the upper and lower body, the variability of thermal sensation from 0 to 30 min was mainly between Case 1 and 3, which means that the use of the heating pad was the main reason for the differences in thermal sensation, while those caused by different A/C temperatures were even more pronounced from 30 to 60 min of the test.
3.3.3. Thermal Sensation and Thermal Comfort of Thermally Stimulated Segments
Figure 17 shows the changes in thermal sensation and thermal comfort of the thermally stimulated segments during the experiment. When the heating pad was off, the thermal sensation on the back and under-thighs shifted to “hot” slowly, and the thermal comfort was maintained in the range 0–1. Contact with the heating pad caused the thermal sensation on the back and thighs to rapidly shift to “hot” in a short time when the heating pad was turned on Since the sensitivity of the thermal response to temperature changes is different among different body segments [40], the thermal sensation of the back was maintained at about +2.5 and that of the thighs at about +2.8 in Case 2, and that of the back and thighs was maintained at about +3.5 in Case 3. Unlike the thermal comfort in Case 3, which rapidly shifted to “uncomfortable”, the thermal comfort of the back and under-thighs in Case 2 basically remained in the range −1 to 1. Based on the results of ANOVA, it can be seen that compared with the non-stimulated segments, the differences in thermal sensation between Case 1 and 2, and Case 1 and 3 are more obvious, and the differences in thermal comfort are shown faster, and the differences in thermal comfort from 0 to 10 min mainly appeared between Case 1 and 3.
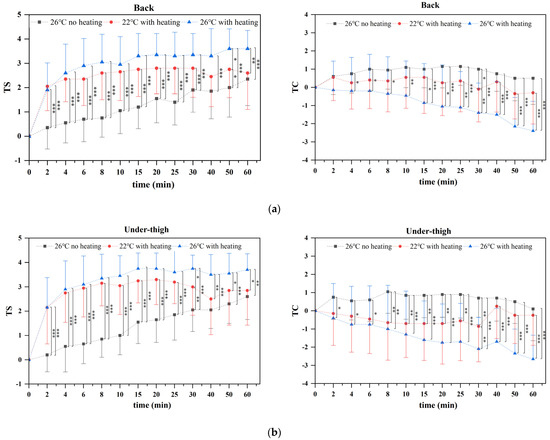
Figure 17.
Thermal sensation (TS) and thermal comfort (TC) of thermally stimulated segments. (a) Back’s TS and TC. (b) Under-thigh’s TS and TC. * for p < 0.05, ** for p < 0.01 and *** for p < 0.001.
Yang investigated intergroup differences in TS between heated and unheated seats in different body segments at 14 °C, 16 °C and 18 °C in a steady thermal environment. For the back and buttocks, which are in direct contact with the heated chair, intergroup differences were found only at 14 °C. The stomach and thigh, which are near to heating chair, showed a significant increase in TS in the heating period, although this increase only occurred at 14 °C [44]. In this study, comparing Cases 1 and 3, it was found that intergroup differences occurred in all segments. The reason for the difference in results is that the thermal environment in this study was at a higher temperature, but the similarity between the two is that the distance of the different segments from the heating device determines the level of intergroup differences.
3.3.4. Analysis of Energy Consumption in the Quasi-Steady State
Since the experiment was carried out at night, the influence of solar radiation was ignored, and in order to compare the energy consumption of the heating pad with that of A/C, the human body heat dissipation could be excluded. The simplified winter automotive A/C load calculation formula is shown in Equation (2).
where: is the A/C heat consumption, W; is the roof heat consumption, W; is the vehicle body heat consumption, W; is the interior floor heat consumption, W; is the heat loss from the window glass, W; is the fresh air heat consumption, W.
Simplifying the roof, vehicle body and floor as a multi-layer flat model, and simplifying the window as a flat single pane of glass, the heat transfer coefficient for the walls of the vehicle is calculated as shown in Equation (3).
where: K is the heat transfer coefficient, ; is the convection heat transfer coefficient between the external surface of the vehicle and the air, ; is the convection heat transfer coefficient of the internal surface of the vehicle, ; is the sum of thermal conductivity resistance of single-layer materials, ; is the thickness of each layer of the vehicle, m; is the thermal conductivity of each layer of material, .
, can be determined respectively by Equations (4) and (5).
According to Equations (3)–(5) and the parameters of each vehicle body structure layer [45,46], the heat transfer coefficients of the test vehicle were calculated, as shown in Table 3. and can be obtained under different experiment conditions according to the steady state heat transfer Equation (6).
where: F is the structural heat transfer area, ; is the temperature inside the vehicle, °C; is the outside ambient temperature, °C.

Table 3.
Structural parameters of the test vehicle.
In order to ensure a good ride for the passenger, a portion of fresh air needs to be brought into the cabin. The heat load of fresh air can be obtained from Equation (7).
where: is the total fresh air volume, 30 , is the air density, 1.29 , and C is the specific heat of air, 1.005 .
The heat load of the passenger compartment in the quasi-steady state phase under different experimental conditions is shown in Figure 18 when the two heating pads are operated at the rated power of 40 W. The total heat load of Case 1 is 1557 W, and that of Case 3 is 1646 W. Since the A/C temperature is the same in the two cases, the difference between the air temperatures inside and outside the vehicle is small when it comes to the quasi-steady phase. The difference in the total heat load lies in the use of the two heating pads. The total heat load of Case 2 with the A/C set to 22 °C and the heating pads on is 1307 W. Moreover, Figure 14 shows that when the experiment reaches the quasi-steady state, the thermal sensation and thermal comfort of Case 1 and Case 2 are basically the same. The energy-saving potential of these two conditions was analyzed, and when the thermal sensation and thermal comfort were the same, the energy-saving efficiency of using the heating pad was 16%.
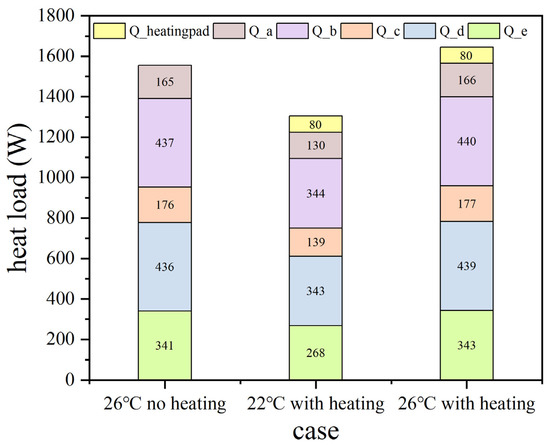
Figure 18.
Heat consumption of different structures.
4. Conclusions
In this paper, the personal comfort system is combined with the traditional automobile A/C heating mode. Through the experimental study, the changes in the thermal environment during the warming process, the thermal sensation and thermal comfort of the passengers, and the energy-saving characteristics under different PCS+A/C heating combinations are analyzed, providing a strategy for the energy-saving and human comfort solution for automobiles in winter. The main conclusions are as follows:
- (1)
- The mean skin temperature obtained from the 13-point formula shows that the temperature difference before and after the experiment was 3.4 °C when the A/C was set to 26 °C. After the heating pad was turned on, the MST increased by about 2 °C and the temperature difference narrowed down to 2.8 °C. The Spearman’s correlation heat map shows a positive correlation between MST and OTS with a coefficient of 0.61, with a negative correlation between MST and OTC. There was a strong positive correlation between the wall temperature and the air temperature, MST, and OTS, with correlation coefficients of 0.83, 0.71, and 0.53, respectively.
- (2)
- The heating pad was able to rapidly improve OTC in the first 10 min of the test, and continued heating of the seat at elevated ambient temperatures resulted in a significant decrease in OTC, while TS in the back and under-thigh reached +3 within 10 min. For the non-thermally excitation segments, A/C temperature was the significant cause of inter-group differences in TS with p ≤ 0.001. On the other hand, TC had a hysteresis, with p ≤ 0.001 due to A/C temperature in 10–30 min, and the effect of heating pad temperature on TC becoming progressively larger in a quasi-steady state. For the thermally stimulated segments, the hysteresis of intergroup differences in TC was eliminated, with p ≤ 0.05 at the initial stage of the experiment.
- (3)
- In the quasi-steady state, when the A/C is set to 26 °C and when the A/C is set to 22 °C with the heating pad on, both thermal sensation and thermal comfort were around +2 and +0.5, respectively, and the heating heat loads were 1557 W and 1307 W. In other words, when the thermal sensation and thermal comfort were the same, the energy-saving efficiency of using the heating pad was 16%.
The experiment was conducted in a semi-open parking lot, which still resulted in differences in temperature and air velocity compared to the outdoor location. The use of thermostatically controlled heating devices can satisfy the OTC requirements of the human body in a very short time, but can exacerbate discomfort in the later stages of the experiment, and the non-uniformity of the human skin temperature also means that this control strategy is unable to satisfy the TC requirements of some segments. In future research, negative feedback regulation of the heating device can be carried out by utilizing the changes in skin temperature in each segment of the human body, and energy saving under different heating conditions in the passenger compartment can be investigated as well.
Author Contributions
Conceptualization, Y.H., X.X. and G.W.; methodology, Y.H., X.X. and G.W.; formal analysis, Y.H.; investigation, X.X.; resources, X.X.; data curation, Y.H. and G.W.; writing—original draft preparation, Y.H.; writing—review and editing, Y.H. and L.Z.; visualization, Y.H.; supervision, L.Z.; project administration, L.Z.; funding acquisition, Z.Y. All authors have read and agreed to the published version of the manuscript.
Funding
This research is supported by National Key R&D Program of China (2022YFE0208000), the Fundamental Research Funds for the Central Universities.
Data Availability Statement
Data are contained within the article.
Conflicts of Interest
The authors declare no conflict of interest.
Abbreviation
| A/C | air conditioning |
| ICE | internal combustion engines |
| EV | electric vehicle |
| HVAC | heating, ventilation and air conditioning |
Appendix A
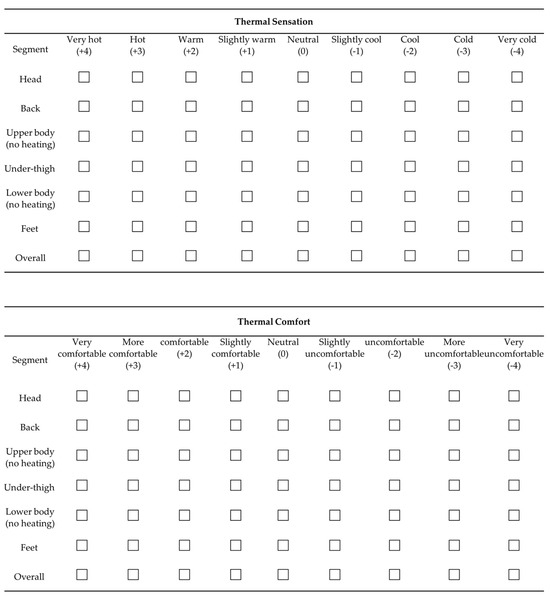
Figure A1.
Transient State Questionnaire for Thermal Sensation and Thermal Comfort Evaluation.
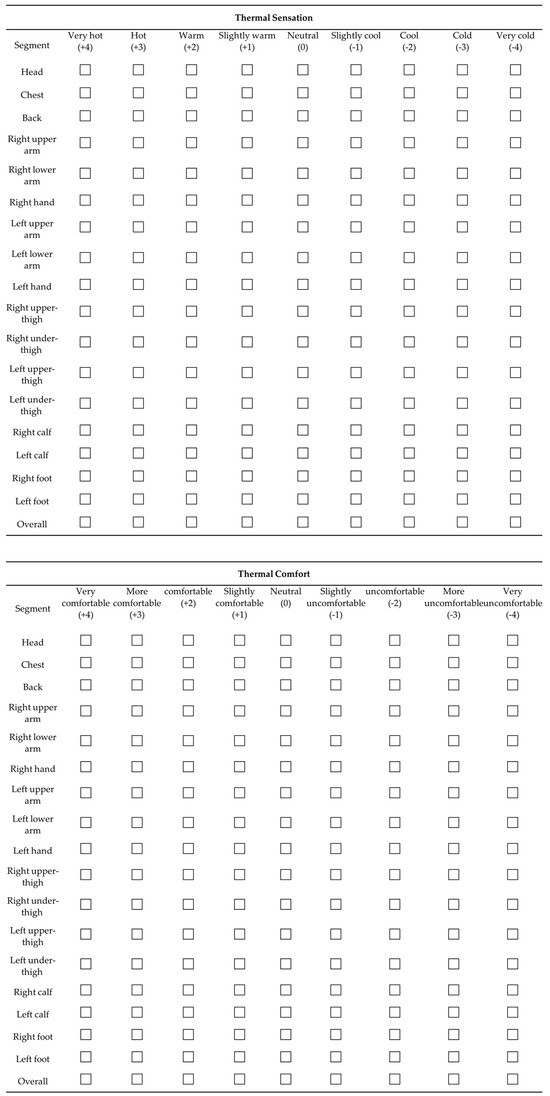
Figure A2.
Quasi-Steady State Questionnaire for Thermal Sensation and Thermal Comfort Evaluation.
References
- Zhang, Z.; Wang, J.; Feng, X.; Chang, L.; Chen, Y.; Wang, X. The solutions to electric vehicle air conditioning systems: A review. Renew. Sustain. Energy Rev. 2018, 91, 443–463. [Google Scholar] [CrossRef]
- Marshall, G.J.; Mahony, C.P.; Rhodes, M.J.; Daniewicz, S.R.; Tsolas, N.; Thompson, S.M. Thermal Management of Vehicle Cabins, External Surfaces, and Onboard Electronics: An Overview. Engineering 2019, 5, 954–969. [Google Scholar] [CrossRef]
- Komoriya, T. Analysis of vehicle passenger compartment ventilation using experimental and numerical model. SAE Trans. 1989, 98, 392–400. [Google Scholar]
- Lin, C.-H.; Lelli, M.A.; Han, T.; Niemiec, R.; Hammond, D.C. An Experimental and Computational Study of Cooling in a Simplified GM-10 Passenger Compartment. In Proceedings of the SAE International Congress & Exposition, Detroit, MI, USA, 25 February–1 March 1991; 31p. [Google Scholar]
- Sevilgen, G.; Kılıç, M. Transient numerical analysis of airflow and heat transfer in a vehicle cabin during heating period. Int. J. Veh. Des. 2010, 52, 144–159. [Google Scholar] [CrossRef]
- Alahmer, A.; Abdelhamid, M.; Omar, M. Design for thermal sensation and comfort states in vehicles cabins. Appl. Therm. Eng. 2012, 36, 126–140. [Google Scholar] [CrossRef]
- Torregrosa-Jaime, B.; Bjurling, F.; Corberán, J.M.; Di Sciullo, F.; Payá, J. Transient thermal model of a vehicle’s cabin validated under variable ambient conditions. Appl. Therm. Eng. 2015, 75, 45–53. [Google Scholar] [CrossRef]
- Bandi, P.; Manelil, N.P.; Maiya, M.P.; Tiwari, S.; Thangamani, A.; Tamalapakula, J.L. Influence of flow and thermal characteristics on thermal comfort inside an automobile cabin under the effect of solar radiation. Appl. Therm. Eng. 2022, 203, 117946. [Google Scholar] [CrossRef]
- Zhang, Y.; Li, Z.; Liu, S.; Wang, G.; Chang, H. A Study of Passenger Car Cabin Pre-Ventilation under the Sun. Energies 2023, 16, 7154. [Google Scholar] [CrossRef]
- ANSI/ASHRAE Standard 55-2013; Thermal Environmental Conditions for Human Occupancy. ASHRAE: Peachtree Corners, GA, USA, 2013.
- Stolwijk, J.A.J. A mathematical model of physiological temperature regulation in man. In Proceedings of the National Aeronautics and Space Administration, Washington, DC, USA, 1 August 1971. [Google Scholar]
- Fiala, D.; Psikuta, A.; Jendritzky, G.; Paulke, S.; Nelson, D.A.; Lichtenbelt, W.D.v.M.; Frijns, A.J.H. Physiological modeling for technical, clinical and research applications. Front. Biosci. 2010, 2, 939–968. [Google Scholar] [CrossRef]
- Fiala, D.; Lomas, K.; Stohrer, M. A computer model of human thermoregulation for a wide range of environmental conditions: The passive system. J. Appl. Physiol. 1999, 87, 1957–1972. [Google Scholar] [CrossRef]
- Fiala, D.; Lomas, K.; Stohrer, M. Computer prediction of human thermoregulatory and temperature response to a wide range of environmental conditions. Int. J. Biometeorol. 2001, 45, 143–159. [Google Scholar] [CrossRef] [PubMed]
- Huizenga, C.; Hui, Z.; Arens, E. A model of human physiology and comfort for assessing complex thermal environments. Build. Environ. 2001, 36, 691–699. [Google Scholar] [CrossRef]
- Rugh, J.; Bharathan, D. Predicting Human Thermal Comfort in Automobiles; SAE Technical Papers; 2005-01-2008; SAE International: Warrendale, PA, USA, 2005. [Google Scholar] [CrossRef]
- Shaw, E.W. Thermal Comfort: Analysis and applications in environmental engineering, by P. O. Fanger. 244 pp. Danish Technical Press. Copenhagen, Denmark, 1970. Danish Kr. 76, 50. J. R. Soc. Promo. Health. 1972, 92, 164. [Google Scholar] [CrossRef]
- Nilsson, H. Thermal comfort evaluation with virtual manikin methods. Build. Environ. 2007, 42, 4000–4005. [Google Scholar] [CrossRef]
- Han, T.; Huang, L. A Model for Relating a Thermal Comfort Scale to EHT Comfort Index. In Proceedings of the SAE 2004 World Congress & Exhibition, Detroit, MI, USA, 8–11 March 2004; SAE Technical Paper 2004-01-0919. 12p. [Google Scholar] [CrossRef]
- Kaynakli, O.; Pulat, E.; Kilic, M. Thermal comfort during heating and cooling periods in an automobile. Heat Mass Transf. 2005, 41, 449–458. [Google Scholar] [CrossRef]
- Moon, J.H.; Lee, J.; Jeong, C.H.; Lee, S. Thermal comfort analysis in a passenger compartment considering the solar radiation effect. Int. J. Therm. Sci. 2016, 107, 77–88. [Google Scholar] [CrossRef]
- Huo, W.; Cheng, Y.; Jia, Y.; Guo, C. Research on the thermal comfort of passenger compartment based on the PMV/PPD. Int. J. Therm. Sci. 2023, 184, 107876. [Google Scholar] [CrossRef]
- Zhang, W.; Liu, J. Investigation on the Temporal Surface Thermal Conditions for Thermal Comfort Researches Inside A Vehicle Cabin Under Summer Season Climate. MATEC Web Conf. 2016, 51, 03004. [Google Scholar] [CrossRef]
- Khatoon, S.; Kim, M.-H. Thermal Comfort in the Passenger Compartment Using a 3-D Numerical Analysis and Comparison with Fanger’s Comfort Models. Energies 2020, 13, 690. [Google Scholar] [CrossRef]
- Lahlou, A.; Ossart, F.; Boudard, E.; Roy, F.; Bakhouya, M. A Real-Time Approach for Thermal Comfort Management in Electric Vehicles. Energies 2020, 13, 4006. [Google Scholar] [CrossRef]
- Cengiz, T.; Babalik, F. An on-the-road experiment into the thermal comfort of car seats. Appl. Ergon. 2007, 38, 337–347. [Google Scholar] [CrossRef]
- Lee, D.W. Impact of a three-dimensional air-conditioning system on thermal comfort: An experimental study. Int. J. Automot. Technol. 2015, 16, 411–416. [Google Scholar] [CrossRef]
- Yun, S.; Chun, C.; Kwak, J.; Park, J.; Kwon, C.; Kim, S.; Seo, S. Prediction of thermal comfort of female passengers in a vehicle based on an outdoor experiment. Energy Build. 2021, 248, 111161. [Google Scholar] [CrossRef]
- Ole Fanger, P. Human requirements in future air-conditioned environments. Int. J. Refrig. 2001, 24, 148–153. [Google Scholar] [CrossRef]
- Zhang, Y.; Wyon, D.; Fang, L.; Melikov, A. The influence of heated or cooled seats on the acceptable ambient temperature range. Ergonomics 2007, 50, 586–600. [Google Scholar] [CrossRef]
- Watanabe, S.; Melikov, A.K.; Knudsen, G.L. Design of an individually controlled system for an optimal thermal microenvironment. Build. Environ. 2010, 45, 549–558. [Google Scholar] [CrossRef]
- Tan, J.; Liu, J.; Liu, W.; Yu, B.; Zhang, J. Performance on heating human body of an optimised radiant-convective combined personal electric heater. Build. Environ. 2022, 214, 108882. [Google Scholar] [CrossRef]
- Oi, H.; Yanagi, K.; Tabata, K.; Tochihara, Y. Effects of heated seat and foot heater on thermal comfort and heater energy consumption in vehicle. Ergonomics 2011, 54, 690–699. [Google Scholar] [CrossRef]
- Enescu, D. Heat Transfer Mechanisms and Contributions of Wearable Thermoelectrics to Personal Thermal Management. Energies 2024, 17, 285. [Google Scholar] [CrossRef]
- Jeffers, M.A.; Chaney, L.; Rugh, J.P. Climate Control Load Reduction Strategies for Electric Drive Vehicles in Cold Weather. SAE Int. J. Passeng. Cars Electron. Electr. Syst. 2016, 9, 75–82. [Google Scholar] [CrossRef]
- He, Y.; Wang, X.; Li, N.; He, M.; He, D. Heating chair assisted by leg-warmer: A potential way to achieve better thermal comfort and greater energy conservation in winter. Energy Build. 2018, 158, 1106–1116. [Google Scholar] [CrossRef]
- Liu, W.W. Study on Objective Evaluation Index of Human Thermal Comfort. Ph.D. Thesis, Shanghai Jiaotong University, Shanghai, China, 2007. [Google Scholar]
- Zhang, W.; Chen, J.; Lan, F. Experimental study on occupant’s thermal responses under the non-uniform conditions in vehicle cabin during the heating period. Chin. J. Mech. Eng. 2014, 27, 331–339. [Google Scholar] [CrossRef]
- Humphreys, M.A.; Nicol, J.F.; Mccartney, K.J.; Raja, I.A. An analysis of some observation of figure temperature and thermal comfort of office worker. In Proceedings of the Indoor Air-99, Edinburgh, UK, 9–13 August 1999; pp. 602–607. [Google Scholar]
- Tamura, T.; Uk-Ja, L. Thermal Spot over Human Body Surface (Part II): Regional Difference in Warm Spot Distribution. J. Hum. Living Environ. 1995, 2, 37–42. [Google Scholar]
- Oi, H.; Tabata, K.; Naka, Y.; Takeda, A.; Tochihara, Y. Effects of heated seats in vehicles on thermal comfort during the initial warm-up period. Appl. Ergon. 2011, 43, 360–367. [Google Scholar] [CrossRef]
- Yutani, M.; Shim, B.; Tamura, T.; Watanabe, M. Effects of regional heating upon skin temperature of whole body. Jpn. J. Cloth. Res. 1982, 25, 15–20. [Google Scholar]
- Brooks, J.E.; Parsons, K.C. An ergonomics investigation into human thermal comfort using an automobile seat heated with encapsulated carbonized fabric (ECF). Ergonomics 1999, 42, 661–673. [Google Scholar] [CrossRef]
- Yang, H.; Cao, B.; Zhu, Y. Study on the effects of chair heating in cold indoor environments from the perspective of local thermal sensation. Energy Build. 2018, 180, 16–28. [Google Scholar] [CrossRef]
- Sun, L.; Li, H.; Cheng, R.; Ma, T. An Experimental Study on the Load Characteristics of A/C System in Pure Electric Vehicle. Automot. Eng. 2014, 36, 1014–1018. [Google Scholar]
- Yang, Z.; Wang, Y.; Liu, L.; Cao, J. Analysis and Calculation of Automotive Air Conditioning Cold Load. Automob. Appl. Technol. 2023, 48, 88–94. [Google Scholar] [CrossRef]
Disclaimer/Publisher’s Note: The statements, opinions and data contained in all publications are solely those of the individual author(s) and contributor(s) and not of MDPI and/or the editor(s). MDPI and/or the editor(s) disclaim responsibility for any injury to people or property resulting from any ideas, methods, instructions or products referred to in the content. |
© 2024 by the authors. Licensee MDPI, Basel, Switzerland. This article is an open access article distributed under the terms and conditions of the Creative Commons Attribution (CC BY) license (https://creativecommons.org/licenses/by/4.0/).