Article

Demand Time Series Prediction of Stacked Long Short-Term Memory Electric Vehicle Charging Stations Based on Fused Attention Mechanism

School of Resources and Environment Engineering, Wuhan University of Technology, Wuhan 430070, China
*
Author to whom correspondence should be addressed.
Energies 2024, 17(9), 2041; https://doi.org/10.3390/en17092041
Submission received: 23 March 2024 / Revised: 22 April 2024 / Accepted: 24 April 2024 / Published: 25 April 2024
(This article belongs to the Topic Electric Vehicles Energy Management, 2nd Volume)

Abstract

:
The layout and configuration of urban infrastructure are essential for the orderly operation and healthy development of cities. With the promotion and popularization of new energy vehicles, the modeling and prediction of charging pile usage and allocation have garnered significant attention from governments and enterprises. Short-term demand forecasting for charging piles is crucial for their efficient operation. However, existing prediction models lack a discussion on the appropriate time window, resulting in limitations in station-level predictions. Recognizing the temporal nature of charging pile occupancy, this paper proposes a novel stacked-LSTM model called attention-SLSTM that integrates an attention mechanism to predict the charging demand of electric vehicles at the station level over the next few hours. To evaluate its performance, this paper compares it with several methods. The experimental results demonstrate that the attention-SLSTM model outperforms both LSTM and stacked-LSTM models. Deep learning methods generally outperform traditional time series forecasting methods. In the test set, MAE is 1.6860, RMSE is 2.5040, and MAPE is 9.7680%. Compared to the stacked-LSTM model, MAE and RMSE are reduced by 4.7%and 5%, respectively; while MAPE value decreases by 1.3%, making it superior to LSTM overall. Furthermore, subsequent experiments compare prediction performance among different charging stations, which confirms that the attention-SLSTM model exhibits excellent predictive capabilities within a six-step (2 h) window.

1. Introduction

In response to the global challenge of climate change, a coalition of over 190 nations collectively ratified the “Paris Climate Agreement” in 2015. The transportation sector, identified as a primary contributor to carbon emissions, constitutes approximately 25% of the overall global emissions [1,2]. Countries worldwide are actively pursuing ambitious low-carbon objectives through the deployment of cutting-edge energy technologies and the electrification of vehicular systems. China, recognized as the world’s foremost carbon emitter, has noted that the transportation sector contributes approximately 11% to its national carbon emissions [3]. In pursuit of its national dual-carbon goals during the “13th Five-Year” period, new energy vehicles were designated as one of the eight strategic emerging industries. Consequently, China has experienced rapid advancements in the field of new energy vehicles, accumulating a total of 16.2 million units by the end of June 2023. Presently, the construction of pertinent facilities, such as charging stations, is insufficient [4], leading to a disparity between the existing charging infrastructure and the burgeoning demand. Consequently, it is imperative to put forth judicious strategies for the allocation and planning of charging infrastructure. This is essential for fostering the adoption of electric vehicles (EVs) and effectively managing urban fundamental charging service facilities. At present, commonly utilized charging facilities can be categorized into two main types: fast-charging stations and slow-charging stations [5]. The charging duration at slow-charging stations typically spans from 7 to 10 h, rendering it suitable for electric vehicle users with ample free time. However, despite the potential for congestion and queues at fast-charging stations [6], a majority of electric vehicle (EV) users exhibit a preference for them. This inclination could potentially exacerbate “range anxiety” among users [7] and consequently impede the widespread acceptance of electric vehicles by new consumers, thus constraining their promotion and adoption [8]. Accurate forecasting of the demand for EV charging stations holds the potential to mitigate issues related to user waiting times [9], providing operators with invaluable insights for configuring and adjusting urban fundamental charging service facilities. This research assumes significant importance in addressing these challenges.
Presently, the urban basic charging service facilities’ distribution and planning primarily center around the “supply and demand” dynamics. Numerous scholars have extensively investigated the charging load of charging stations, engaging in macro-level charging demand modeling and assessing these stations’ impact on the power network through regional charging load predictions [10,11]. Traditional electric load forecasting methods typically hinge on weather factors (such as temperature and humidity) [12], whereas forecasting for charging stations is more significantly influenced by user behavior and flexibility factors associated with charging [13,14]. Scholars predominantly focus on spatiotemporal load information related to electric vehicle (EV) charging [15]. Building upon this foundation, many researchers have applied artificial neural networks [16], support vector machines [17], deep learning techniques [18,19], and other methodologies to achieve precise and efficient prediction of charging loads. They have also proposed strategic layouts [20] for charging stations and intelligent management systems [21,22] for optimized grid stability and security enhancement purposes [23,24,25].
Other scholars focus on modeling and predicting the allocation of usage at charging stations, aiming to address the challenges of distributing and planning basic charging service facilities through effective and coordinated management strategies [26,27,28]. Research on charging demand typically estimates the electric vehicle (EV) charging needs of a region from a long-term perspective, taking into account factors such as traffic and user behavior, which have proven effective for infrastructure planning and policy making. For instance, some studies have utilized the charging prices at stations, expected waiting times, and detour distances to construct fluid dynamic traffic models [29], assessing the capacity allocation of fast-charging stations to identify stations that require additional charging piles and areas that would benefit from them. Additionally, research based on EV user travel, parking, and charging behaviors has developed dynamic stochastic simulation models [30], which perform well in infrastructure planning and the allocation of EVs. The comprehensive modeling of environmental and user behavior factors has shown reliable performance in mining spatiotemporal features and estimating site-level charging demands [31,32,33].
Increasingly, scholars are focusing on site-level charging demand studies. For example, some have employed deep learning methods like Sequence to Sequence (Seq2Seq) for multi-step predictions of monthly charging demands, although the spatiotemporal resolution in charging demand modeling needs further optimization due to the sparsity of the dataset [34]. Other studies have implemented Random Forest algorithms for short-term predictions at individual charging stations, primarily discussing performances over 15 min intervals [35]. Further research using traditional methods such as logistic regression [36], Markov chain models [37], and autoregressive integrated moving average models (ARIMA) [38] has explored the occupancy status of charging piles at different time resolutions. However, due to the limited and irregular nature of charging session data, these studies show room for improvement in data organization and choice of prediction methods, and they lack discussions on appropriate time interval settings, showing certain limitations.
From the perspective of EV stakeholders (planners, infrastructure operators, and grid operators), short-term demand prediction is crucial for the operation of charging facilities. Since most charging events last less than an hour, discussions on suitable time intervals can help devise more efficient and coordinated management strategies. Accurate short-term predictions of charging demand can greatly assist grid operators in efficiently managing power generation resources and maintaining grid stability. In practice, by strategically allocating the electricity produced by various interconnected units during peak demand periods, the load on the grid can be balanced. As integral components of the transportation network, electric vehicles and charging stations play a crucial role. Accurate short-term predictions of their charging demands are essential for building an efficient and secure power grid [39]. The charging quality at charging stations is a crucial component of coordinated management strategies, playing a significant role in accurately controlling charging loads and effectively suppressing fault currents during short circuits [40]. For infrastructure operators, accurate short-term predictions of charging demand can facilitate adjustments to management strategies. The power supply system is often complex, nonlinear, and uncertain; having precise and efficient control over EV charging demand contributes to the development of robust, high-quality current control strategies [41]. For electric vehicle users, the primary concern is whether their charging needs can be met within a certain future period, and they are particularly eager to find suitable charging stations promptly. Appropriate scheduling of charging resources can further help maximize battery storage utilization in electric vehicles [42].
The allocation and planning of urban basic charging service facilities present a comprehensive challenge, involving multi-source data and complex scenarios. With the growing adoption of deep learning (DL) methods, research findings in time series forecasting have found extensive applications across diverse domains, including demand forecasting [43], stock trend forecasting in financial markets [44], power load forecasting [45], traffic flow forecasting [46], energy consumption forecasting [47], and more. Statistical-based time series prediction methods are commonly employed for linear time series modeling; however, real-world research reveals nonlinear characteristics within these time series. Deep learning (DL) techniques, such as feedforward neural networks (NNs) and recurrent neural networks (RNNs), can effectively handle nonlinear time series analysis. Nevertheless, challenges arise concerning capturing long-term dependencies or addressing gradient vanishing issues [48]. Long short-term memory recurrent neural network (LSTM) models [49] have proven to be effective extensions of RNNs for accurate time series prediction tasks. Attention mechanisms are considered crucial components within neural networks to enhance the model’s ability to differentiate input data, often utilized in natural language processing (NLP). Some scholars have explored the performance of combining attention mechanisms with deep learning methods for temporal prediction tasks [50] and confirmed that introducing an attention mechanism into deep learning models significantly improves their performance in temporal prediction tasks. The application of attention mechanisms aids the model in handling distant dependencies within sequences more effectively while enhancing its expressive capabilities; moreover, it enhances interpretability by selectively focusing on relevant input data.
Henceforth, we introduce an attention-SLSTM (stacked long short-term memory) prediction framework that incorporates an attention mechanism to address the challenges associated with electric vehicle (EV) charging station demands. The utilization of an LSTM model enables accurate forecasting of demands at urban basic charging service facilities. To enhance feature extraction capabilities within a single-layer LSTM architecture, we introduce a stacked-LSTM (SLSTM) approach for predicting time series data related to the occupancy status at these stations. Furthermore, the integration of a self-attention mechanism in our proposed framework prioritizes critical information, thereby improving its ability to represent data accurately. This facilitates precise demand forecasting and contributes to the effective configuration and planning of urban basic charging service facilities.

2. Data Collection and Preprocessing

2.1. Dataset

The research paper presents historical operational data from five charging stations located in the central area of Wuhan City, Hubei Province, China. The dataset encompasses information collected at 20 min intervals between 1 March 2023 and 30 April 2023. It includes details regarding the charging stations’ locations, the number and power of charging piles, as well as the status of each pile. Within the study area, two types of charging piles are observed: slow-charging piles (7 kW) and fast-charging piles (≥60 kW). The dataset comprises a total of 123 fast-charging piles and 14 slow-charging piles. Importantly, there is a significant disparity in construction scale between fast chargers and slow chargers, indicating a clear preference among electric vehicle users for fast-charging options. Please refer to Figure 1 for comprehensive statistics. Fast-charging piles exhibit notably high average daily utilization rates with a maximum daily utilization rate reaching up to 48.79%. On average, all the charging stations collectively demonstrate an overall utilization rate of approximately equal to 37.72%. Furthermore, it is worth mentioning that users display distinct preferences for different charging station choices; usage rates vary by nearly 20% between the most frequently used and least frequently used stations within this study.
In this paper, we have selected Charging Station No. 1 as an illustrative example due to its highest occupancy rate over one week (refer to Figure 2). The operating status showcases discernible peak and trough periods despite variations in daily usage patterns at this specific station.

2.2. Data Preprocessing

The historical operational data of five charging stations are collected in this paper. Each row represents a charging session event, while each column contains different information related to the charging sessions and charging piles. To address missing data, the average value calculated from preceding and succeeding charging session data was used for completion [51]. In order to ensure consistent data input, the occupancy rate was employed to characterize the usage status of charging piles, resulting in a final collection of 4492 groups of charging session data.

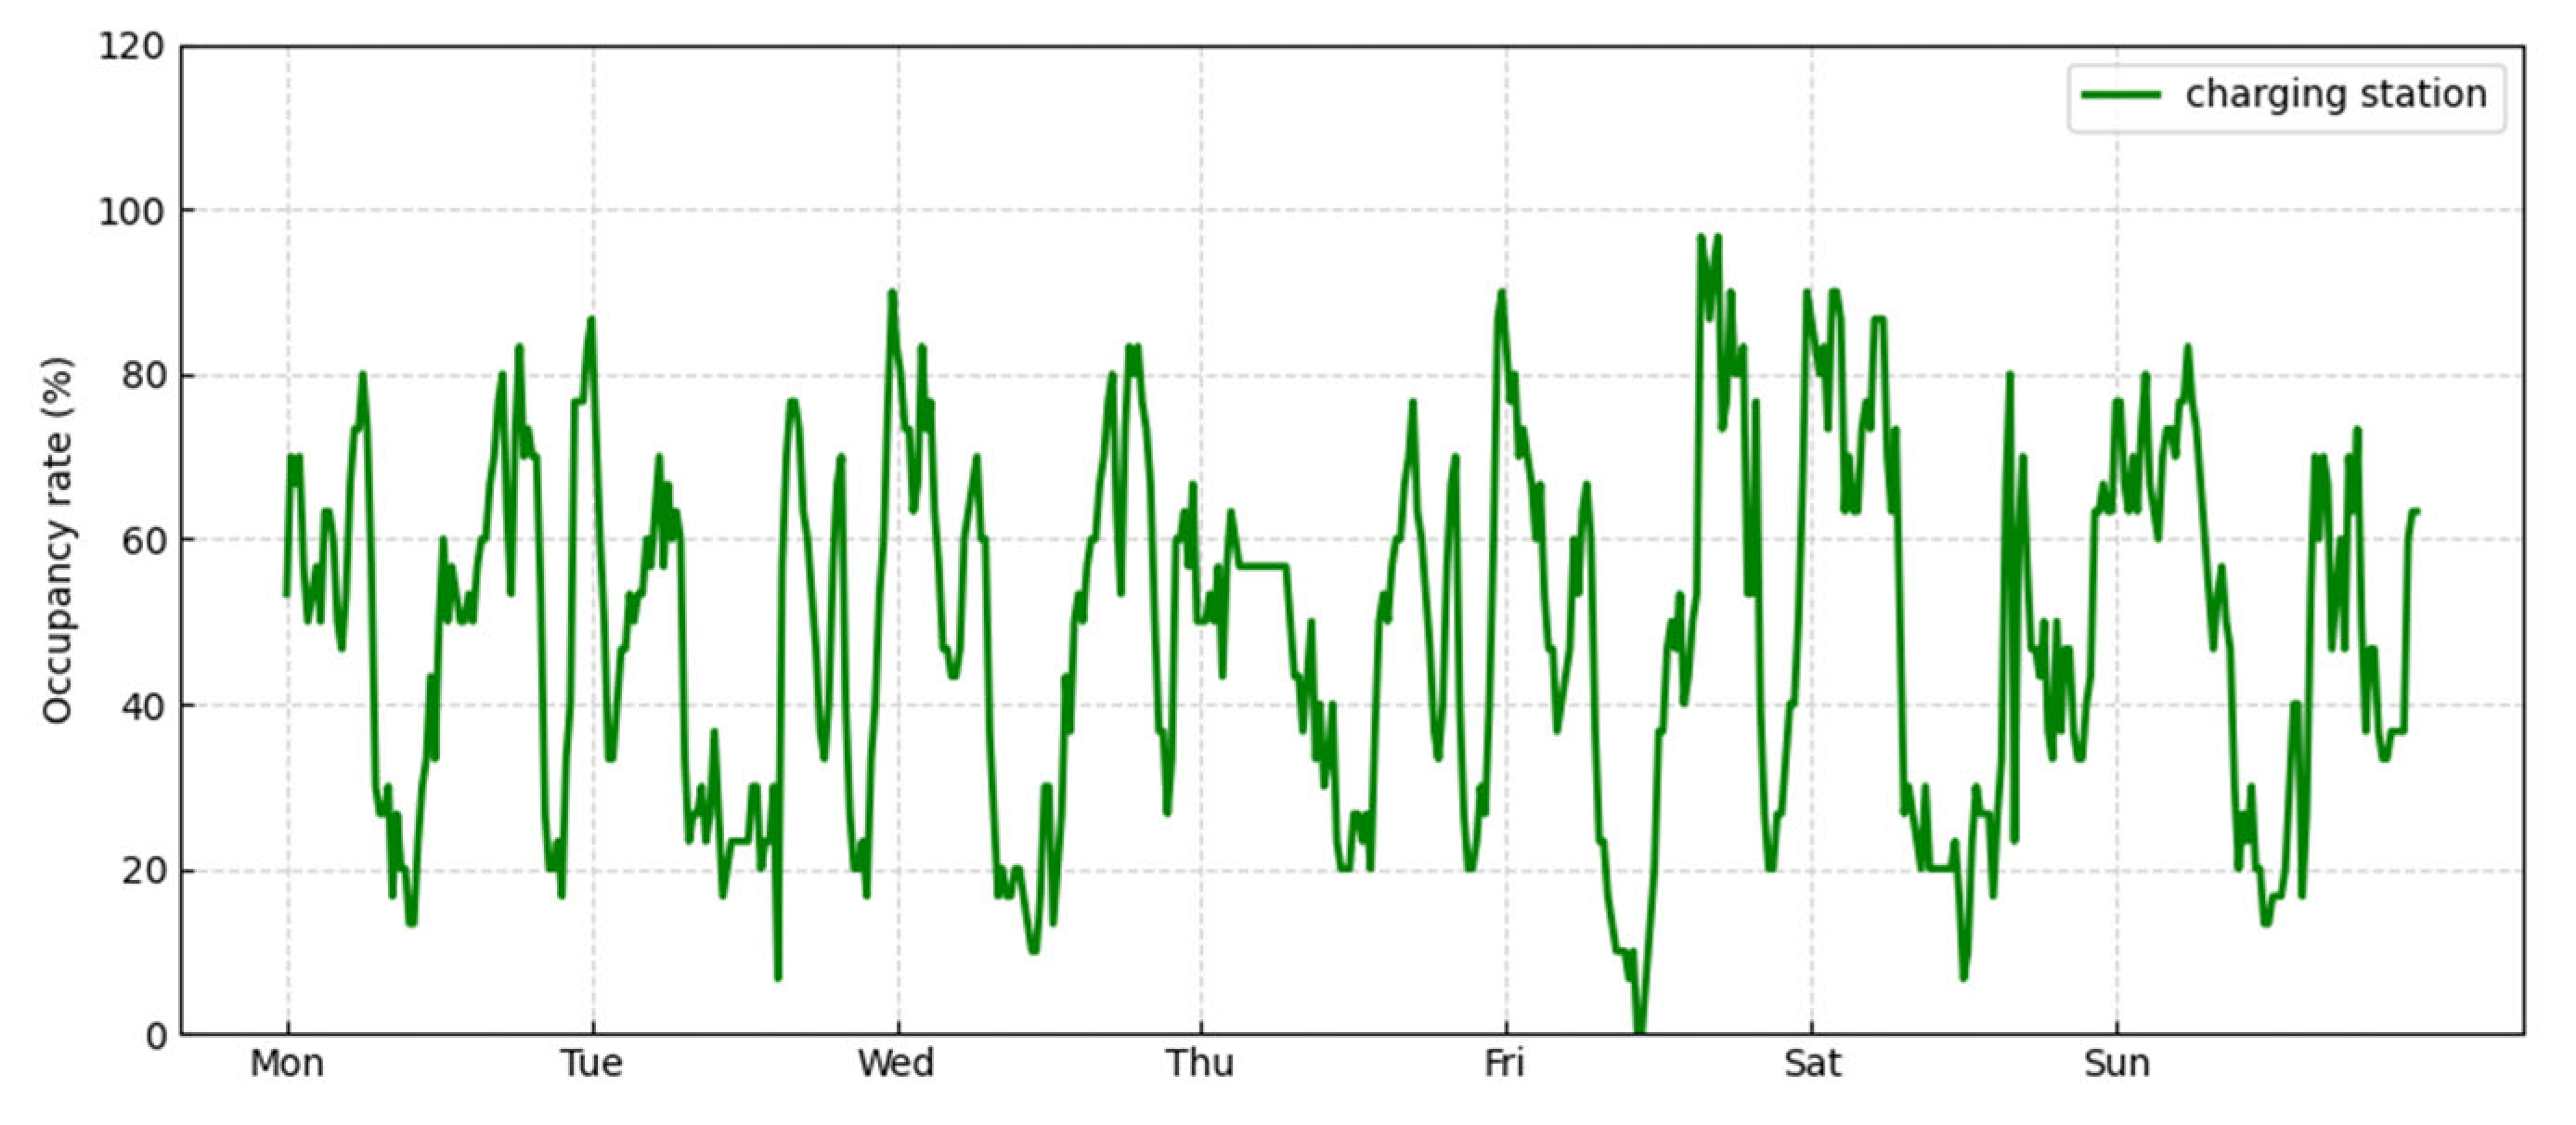
2.3. Usage Characteristics of Fast-Charging Stations

Accurate prediction of the operational status of charging stations is crucial for devising effective charging strategies, and the occupancy of these stations is influenced by various factors. Some researchers [52] have proposed a solution for predicting the occupancy of charging piles based on Monte Carlo simulation, which comprehensively considers variables such as time (hour, day, month), weather conditions, and historical charging session data. Considering the limited available data fields in the dataset, this paper introduces electricity price data for charging piles and evaluates its correlation using the Pearson correlation coefficient (PCC) method as shown in Equation (1).
r x y = i = 1 n x i x ¯ y i y ¯ i = 1 n x i x ¯ 2 i = 1 n y i y ¯ 2  
The mean values of variables X and Y are denoted by x ¯ and y ¯ , respectively. As shown in Figure 3, the data on charging stations and charging pile prices exhibit a strong negative correlation, which aligns with the strategy of ensuring grid stability and security. By implementing higher electricity prices during peak consumption periods to reduce grid usage, the grid load is further decreased. Additionally, incorporating electricity price data provides supplementary information for predictive tasks.
The generated features utilized for modeling the charger occupancy status comprise time of day, day of the week, weekend classification, past charging occupancy data, and charging pile price data for different periods throughout the day. Modeling discrete data for time series prediction presents a challenging problem. In this study, discrete data are organized by dividing the time index [53].
The objective is to predict the charging occupancy status profile of each charger for multiple future time steps ranging from 20 min to several hours. To achieve this goal, we divide a day (24 h) into 72 distinct time periods separated by intervals of 20 min; weekdays and weekends are represented as values between 0 and 6 with workdays denoted as 0 and weekends denoted as 1, respectively. Historical occupancy rate data are represented by the past k-time step’s occupancy rate starting from the t-time step. Figure 4 shows an autocorrelation diagram of historical occupancy data in which it can be observed that there exists a strong correlation between the current state at t-1 or t-2 and previous states; thus, the first two current states can be used as input variables in our model. Time of day, day of week, workday, or weekend are rule-based generated features intended to aid in better understanding temporal structure and periodicity within our dataset. The entire dataset was divided into training (70% total) and test datasets (30% remaining).

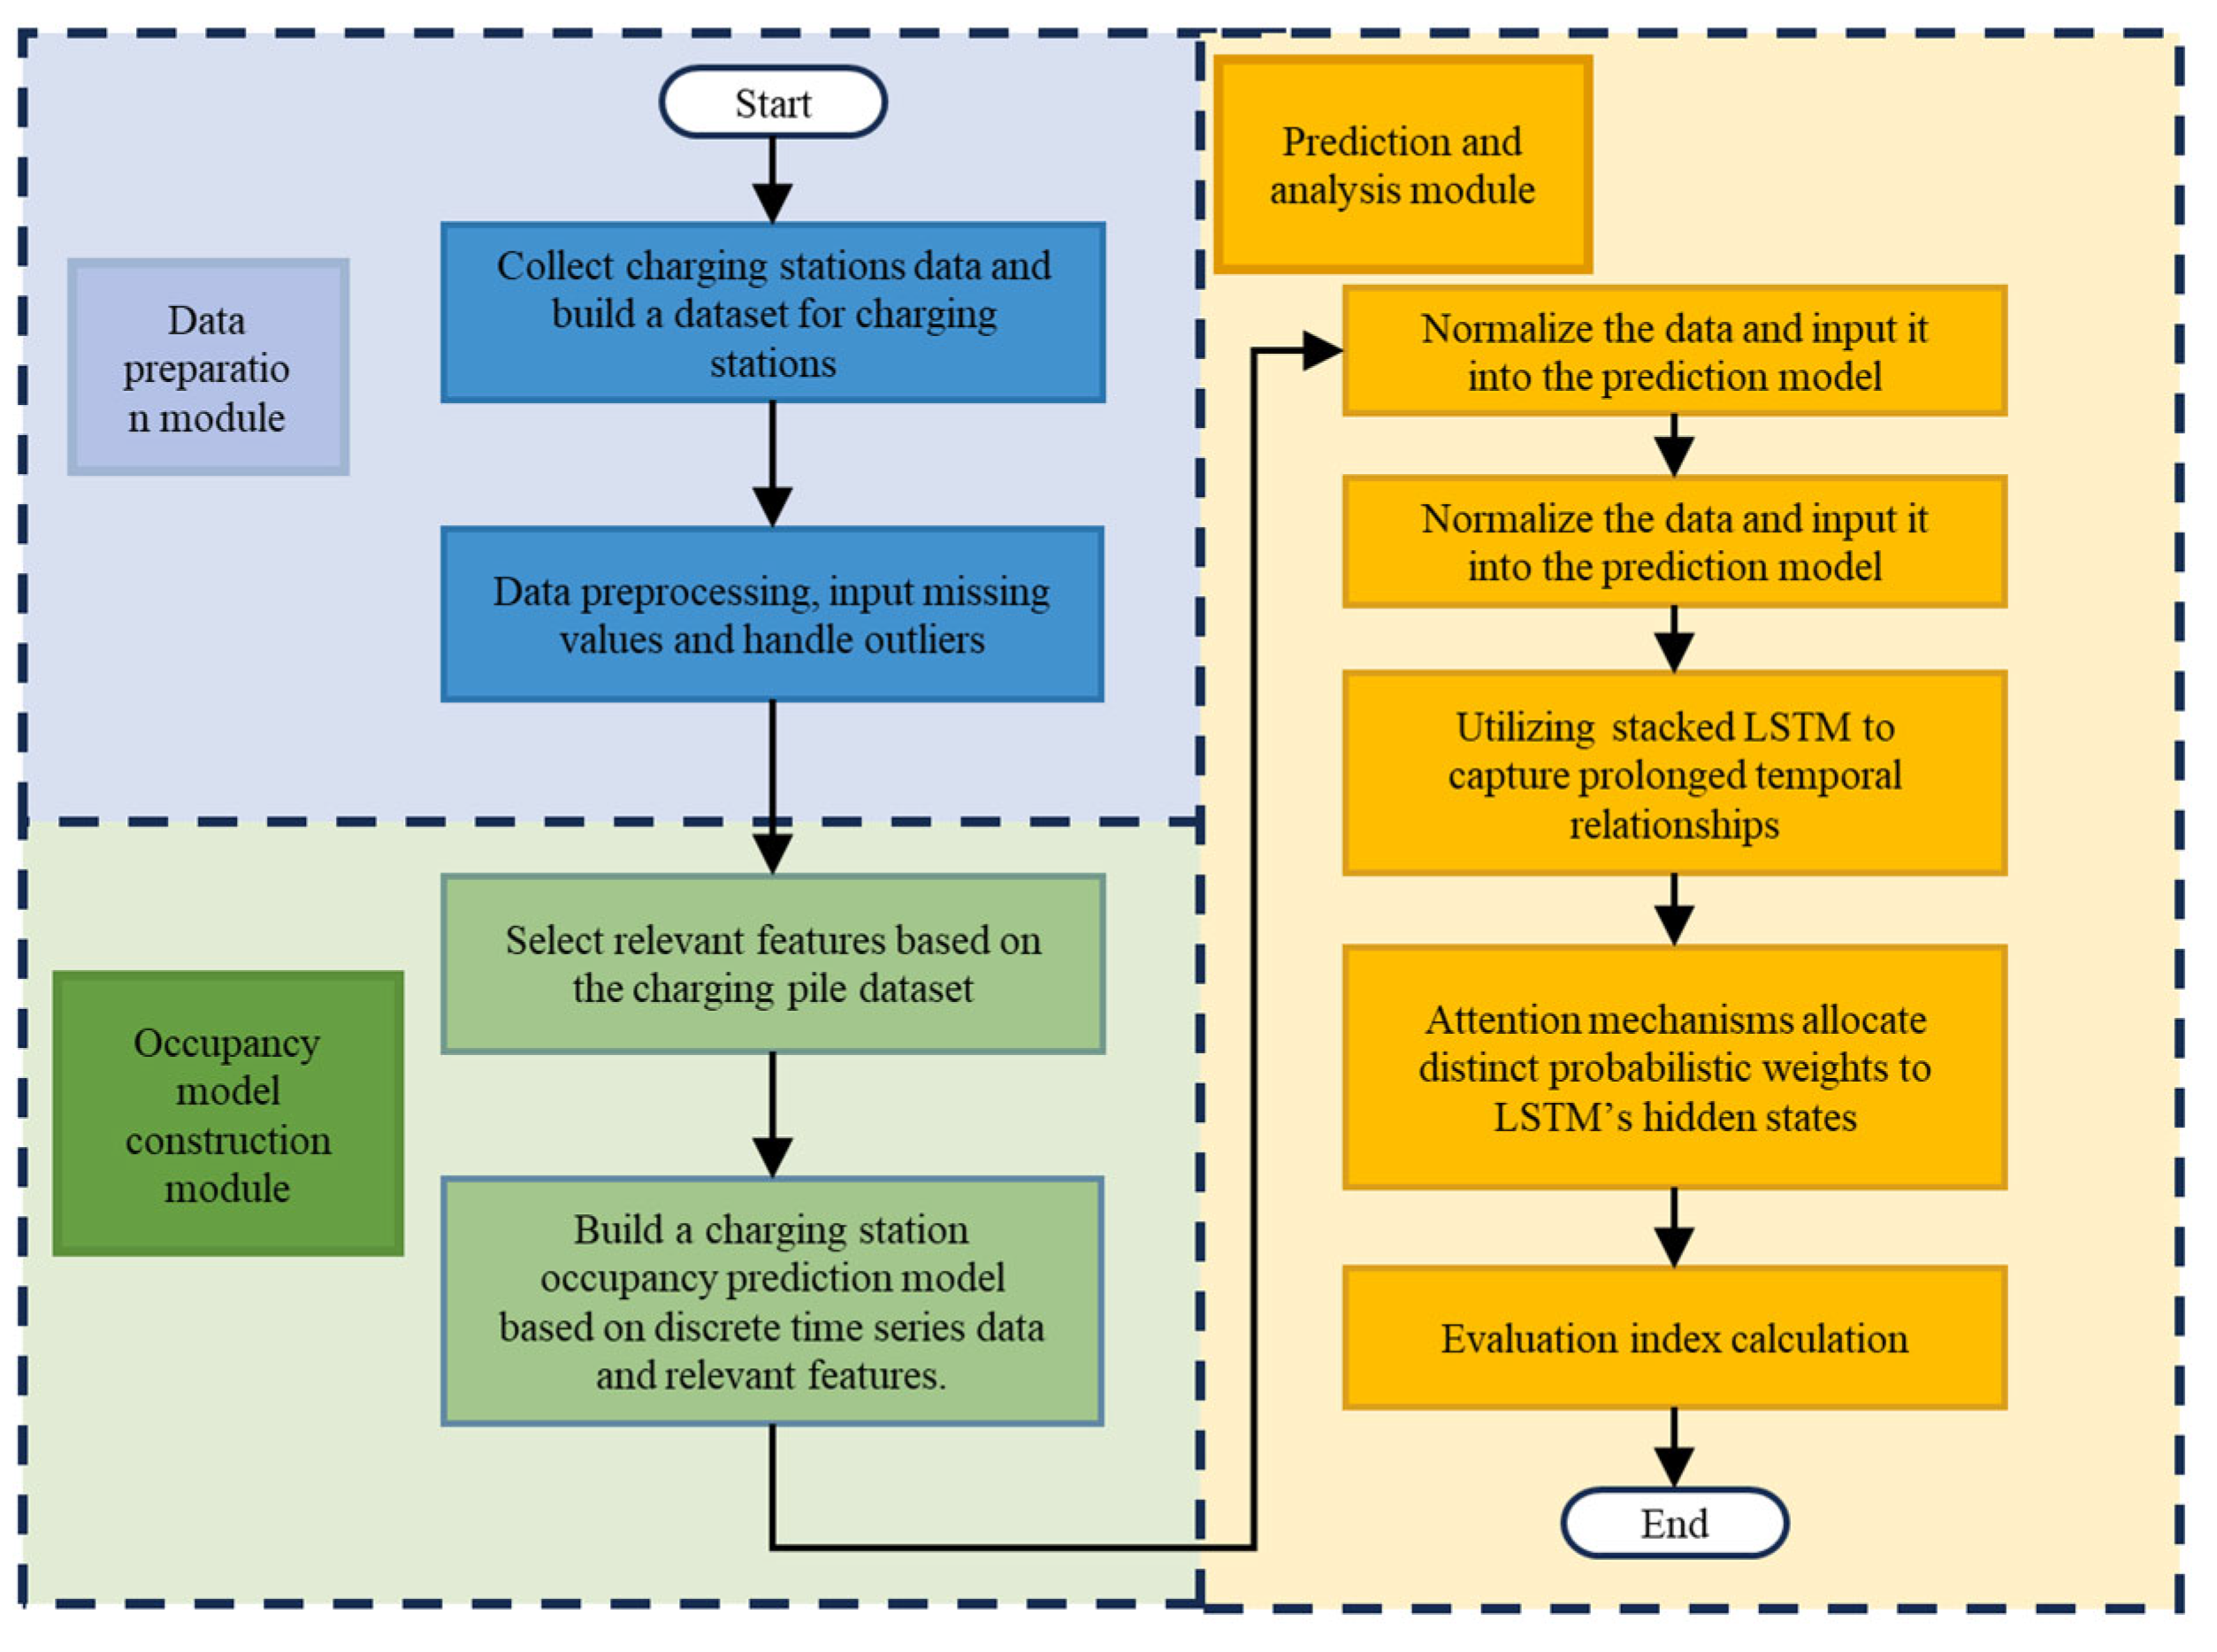
3. Charging Station Occupancy State Prediction Model

3.1. Attention-SLSTM Model
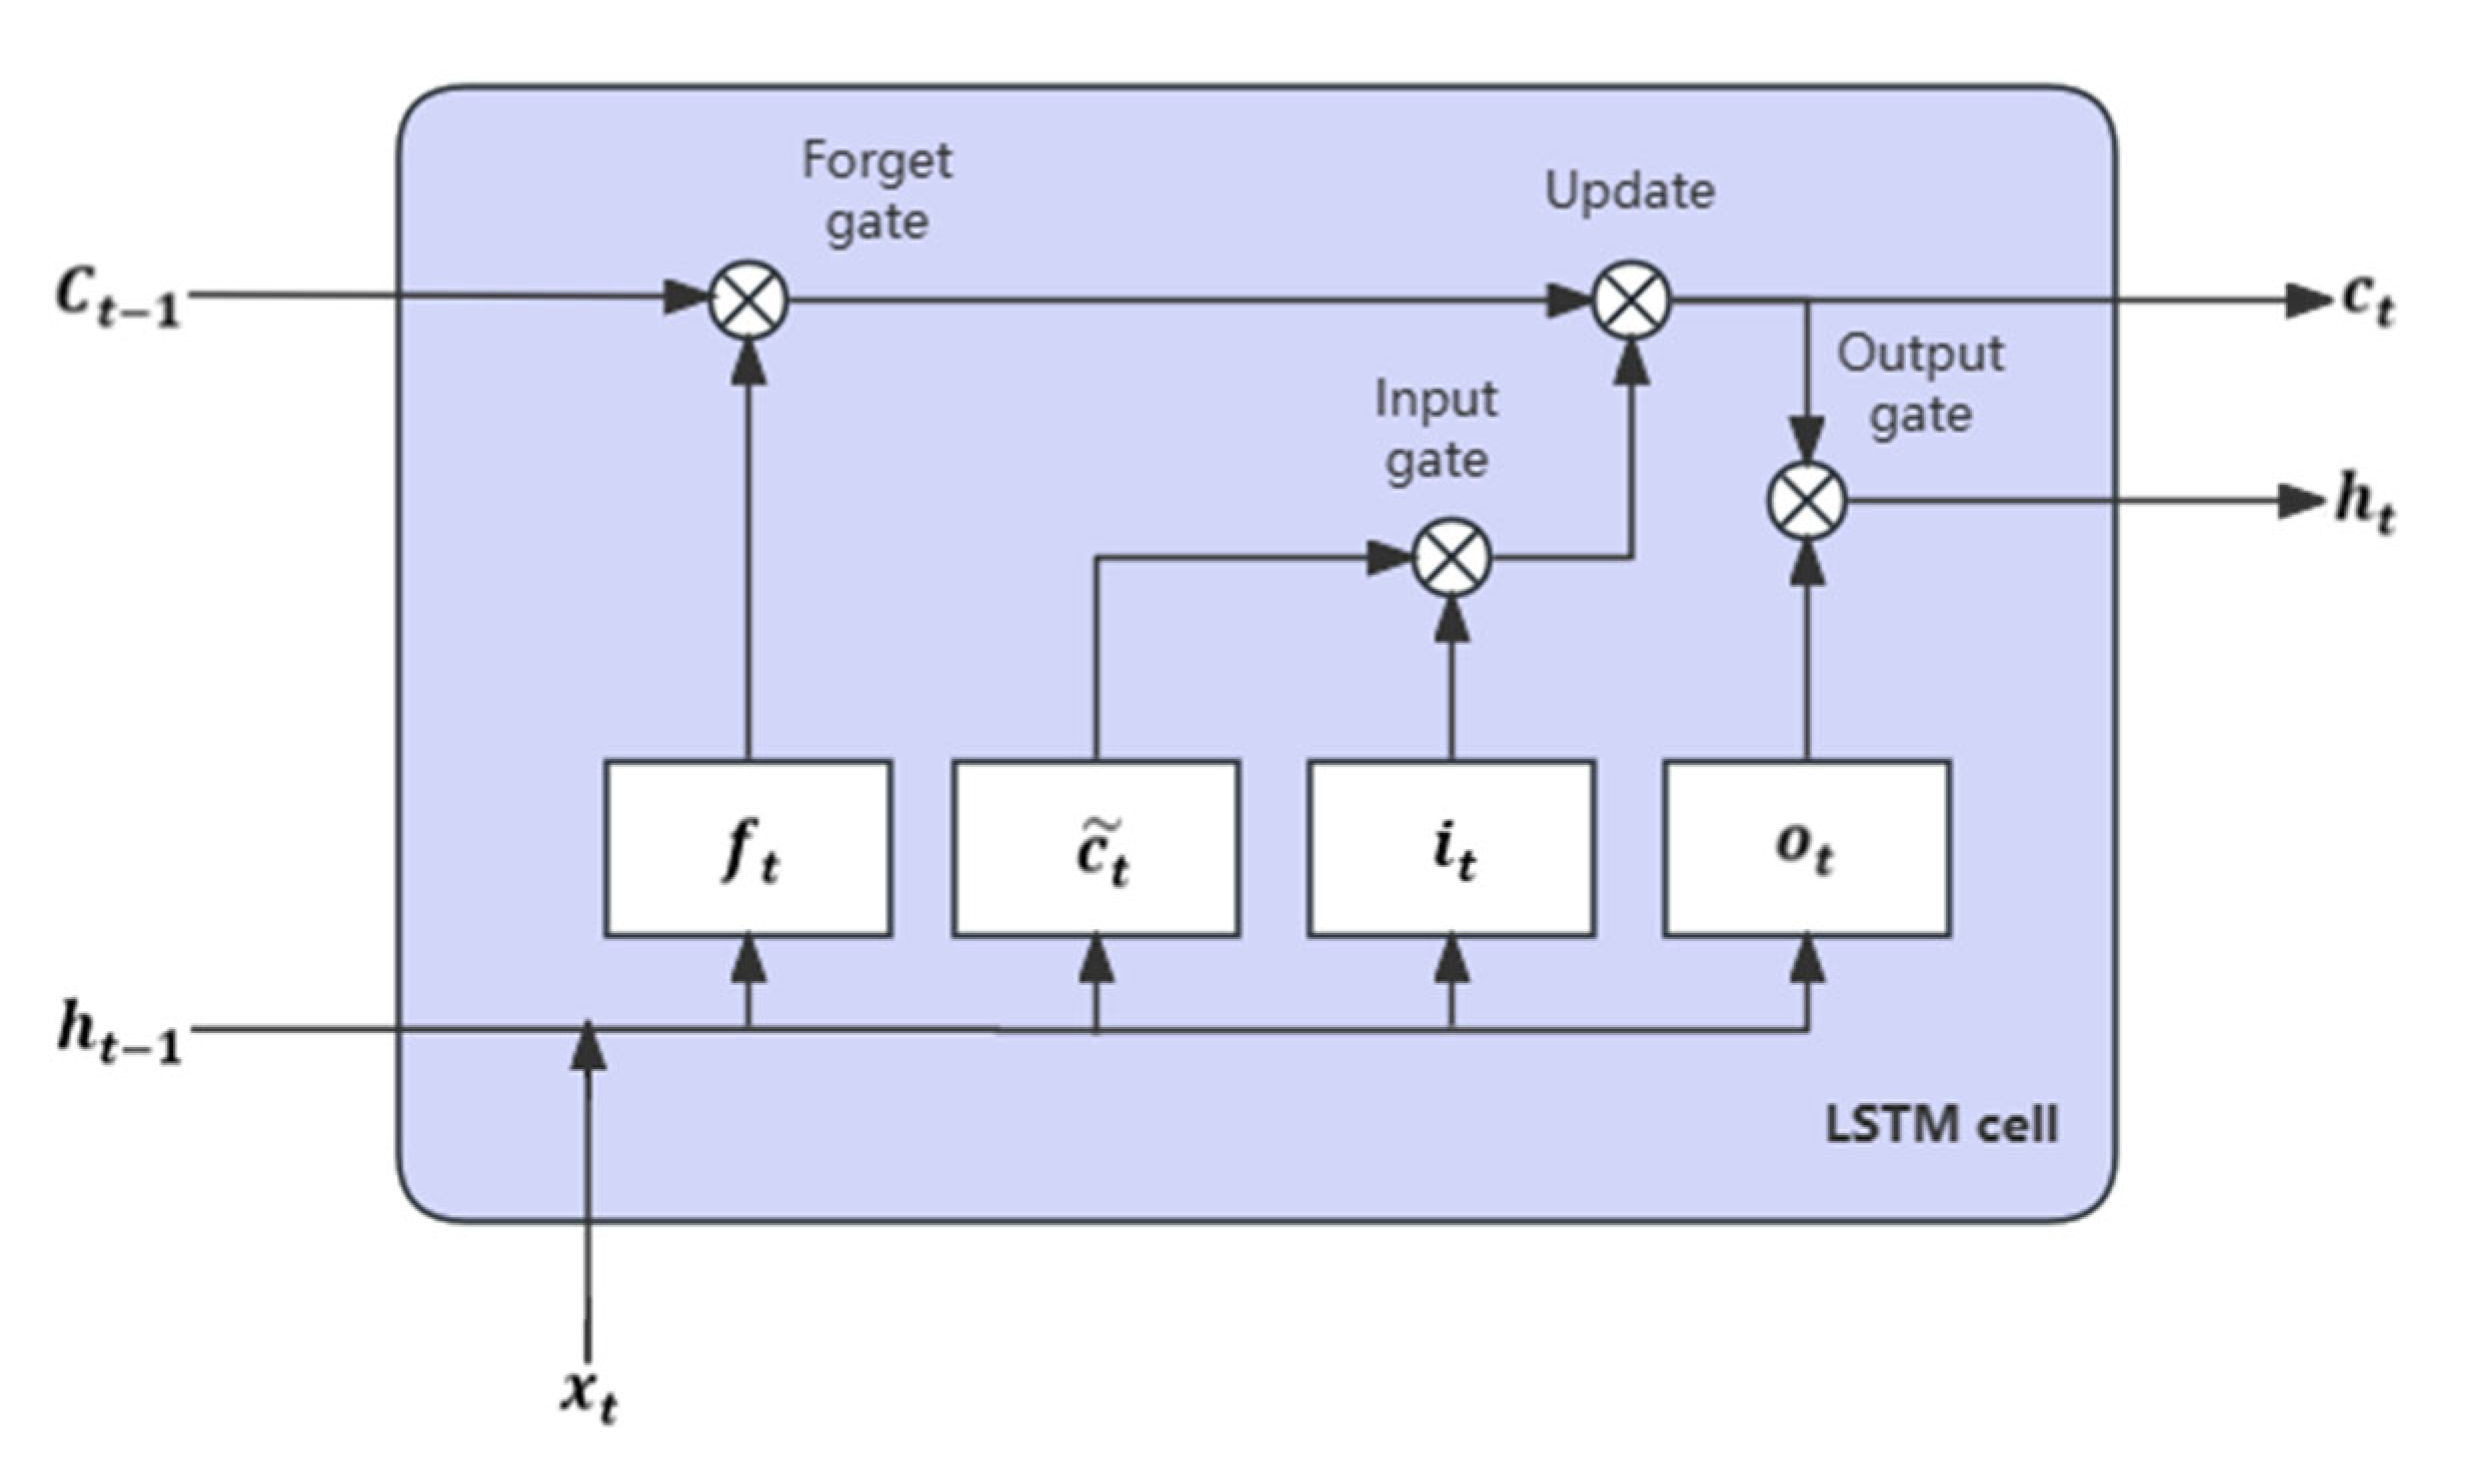
The forecasting process of the occupancy status of the charging station is shown in Figure 5, which mainly includes three modules: data preparation module, occupancy model building module, and prediction analysis module. The data preparation module includes data acquisition and preprocessing. The occupancy model building module identifies the factors that affect the occupancy status of charging stations. The predictive analysis module uses stacked LSTM to capture long-term features, integrates the attention mechanism to give different weights to different influencing factors, and integrates the dropout layer to mitigate the impact of overfitting the model.
The attention-SLSTM model is composed of four essential components, as depicted in the structural diagram shown in Figure 6. The input layer plays a crucial role in transforming preprocessed data into a format that the model can understand and process. The SLSTM module processes the input data, encompassing diverse influencing factors, and extracts corresponding feature information. Utilizing a set of learned attention coefficients, the attention mechanism calculates filtered feature information. Finally, the fully connected layer processes this information to generate the ultimate prediction result. To address concerns related to overfitting, dropout is employed in this study.
Attention-SLSTM models exhibit several noteworthy characteristics. Firstly, accurately predicting time series data poses challenges due to their varying temporal patterns, such as random customer travel patterns or charging times at specific stations. By stacking multiple LSTM layers, LSTM can acquire more intricate feature representations, effectively handling long-term dependencies in highly irregular time series prediction tasks. Secondly, introducing an attention mechanism enhances adaptability to irregular time series data, further improving the model’s ability to handle long-term dependencies. Additionally, this flexible framework allows for improved prediction accuracy by incorporating additional LSTM modules or interleaved attention mechanisms. However, challenges such as vanishing or exploding gradients, overfitting issues, and increased training costs need to be addressed accordingly.

3.2. LSTM

The basic LSTM network is composed of a sequential arrangement of multiple memory neurons, and the structure of the LSTM block is illustrated in Figure 7. Within an LSTM block, three crucial components exist: an input gate, a forget gate, and an output gate. The operations performed by the LSTM are defined by Equations (2)–(7) [54].
The input gate (Equation (2)) combines the input vector x t ( x t = X 1 t ) with its preceding hidden state vector h t 1 at time t−1. The forget gate (Equation (3)) selectively filters long-term information for retention. Utilizing a sigmoid activation function, the output gate (Equation (4)) determines which information should be propagated to the cell state. Equation (5) computes a temporary cell state based on both the current input and hidden states at time t−1. Subsequently, the cell state is updated by combining the previous state C t 1 and the temporary state C ~ t at time t using Equation (6). Finally, considering o t and C t as inputs, Equation (7) governs control over the final output generation from the cell at time t.
i t = σ W x i x t + W h i h t 1 + b i ,  
f t = σ W x f x t + W h f h t 1 + b f ,
o t = σ W x 0 x t + W h 0 h t 1 + b 0 ,
C ~ t = t a n h W x c X t + W h c h t 1 + b c ,
C t = f t C t 1 + i t C ~ t ,
h t = o t t a n h C t
The weights W x and W h are associated with the input vector x t and the previous hidden state h t 1 , respectively. The bias terms correspond to b i , b f , b 0 , b c , respectively. denotes element-wise multiplication. i t represents the input gate that determines which information to retain; f t signifies the forget gate that decides which information to discard; o t controls the output gate that regulates the information transmitted at each time step; C t is the cell state vector updated at time step t; h t denotes the output of the LSTM block at time step t. σ and tanh refer to the Sigmoid and hyperbolic tangent activation functions, respectively. LSTM employs a gated structure for information propagation. This paper capitalizes on this characteristic by stacking LSTM modules to enhance the model’s capacity for learning more intricate feature representations while effectively handling long-term temporal dependencies.

3.3. Attention

The attention mechanism [55] is introduced in this paper to enhance the learning effectiveness of the model by allowing the network to concentrate on specific segments of the encoded output, rather than relying solely on the content vector. The structure is illustrated in Figure 8. By examining the output vector of the LSTM module [ h t s + 1 , , h t 1 , h t ] , attention coefficients [ α t s + 1 , , α t s + 1 , a t ] are obtained, indicating the significance of each hidden state. Finally, a weighted sequence H is derived by summing up these hidden states with appropriate weights, as defined by Equations (8)–(10):
e t = V T tanh W h t + b
α t = s o f t m a x e t
H = i = t s + 1 t α i h i
Here, V and W denote the weight matrices, b represents the bias term, and e i represents the intermediate value of attention coefficient α i at time t. By incorporating the attention mechanism, the model can autonomously learn the significance of each state and extract salient information from complex data.

3.4. Model Evaluation Metrics

In this study, we utilize three commonly used evaluation metrics: mean absolute error (MAE), root mean square error (RMSE), and mean absolute percentage error (MAPE) to comprehensively assess the predictive performance of the model. The equations for calculating these metrics are provided as follows:
M A E = 1 n t = 1 n y ^ t y t
R M S E = 1 n t = 1 n y ^ t y t 2
M A P E = 100 % n t = 1 n y t ^ y t y t
Here, y ^ t represents the predicted occupancy data, and y t denotes the actual occupancy data of the charging station at time t. MAE quantifies the forecasting error of EV charging demand, while RMSE is particularly sensitive to outliers. A significant deviation between prediction and observation would yield a high RMSE value, indicating inadequate model performance. Conversely, MAPE serves as a widely adopted statistical metric for measuring prediction accuracy, with lower values signifying reduced errors.

4. Experiments and Analysis

4.1. Model Parameters and Evaluation Criteria

The attention-SLSTM model in this study is implemented using the Keras 2.4.3 framework of TensorFlow 1.15.0 in Python-3, with hyperparameters manually adjusted through rough parameter tuning [56,57]. This strategy of hyperparameter adjustment significantly reduces training time and yields highly accurate results. The optimization algorithm employed is Adam, with a learning rate set to 0.001. To mitigate overfitting, a random dropout layer with a parameter value of 0.2 is added to the model architecture. In order to enhance training efficiency, batch training methodology is adopted where each batch consists of 32 data groups. A smaller batch size ensures greater stability during the training process, and the number of iterations is set at 20 as detailed in Table 1. The LSTM module takes into account the previous 18 charging states as input, corresponding to a duration of 6 h for charging pile data analysis; different time steps are considered to evaluate prediction performance.

4.2. Model Parameters and Evaluation Criteria

In addition to the attention-SLSTM model, other classic time series forecasting methods and deep learning approaches were set up as baseline methods for comparative experiments, including ARIMA, LSTM [58], and stacked LSTM [59]. To mitigate the impact of random errors on the experimental results, each method was repeated 10 times with identical parameter settings, and the final outcome was obtained by averaging these 10 results. Taking charging pile No. 1 as an example, the model predicted occupancy data for 72 time steps (equivalent to 24 h), and a comparison of the outcomes is presented in Figure 9.
Compared to the actual value, the predicted values of the four prediction models exhibit a consistent overall trend, with the attention-SLSTM model in this study demonstrating closer proximity to the actual value. This can be attributed primarily to leveraging multiple stacked-LSTM layers, enabling enhanced learning of intricate feature representations. Additionally, incorporating an attention mechanism enhances model adaptability towards irregular time series data and further improves its ability to handle long-term dependencies.
To further compare model performance, the metrics of the five charging stations were averaged and presented in Table 2. The attention-SLSTM model proposed in this study outperformed other prediction models across all indicators. Deep learning methods generally outperform traditional time series forecasting methods. In the test set, MAE was 1.6860, RMSE was 2.5040, and MAPE was 9.7680%. Compared to the traditional time series forecasting method ARIMA, the LSTM deep learning approach has reduced MAE and RMSE by 28% and 20%, respectively, and the MAPE value has decreased by 1.7%. Compared to LSTM models, stacked LSTM reduced MAE by 18% and RMSE by 12%, while introducing an attention mechanism further reduced MAE by 4.7% and RMSE by 5%, with a decrease in MAPE value by 1.3%. These results demonstrate that the attention mechanism plays an important role in improving model performance.

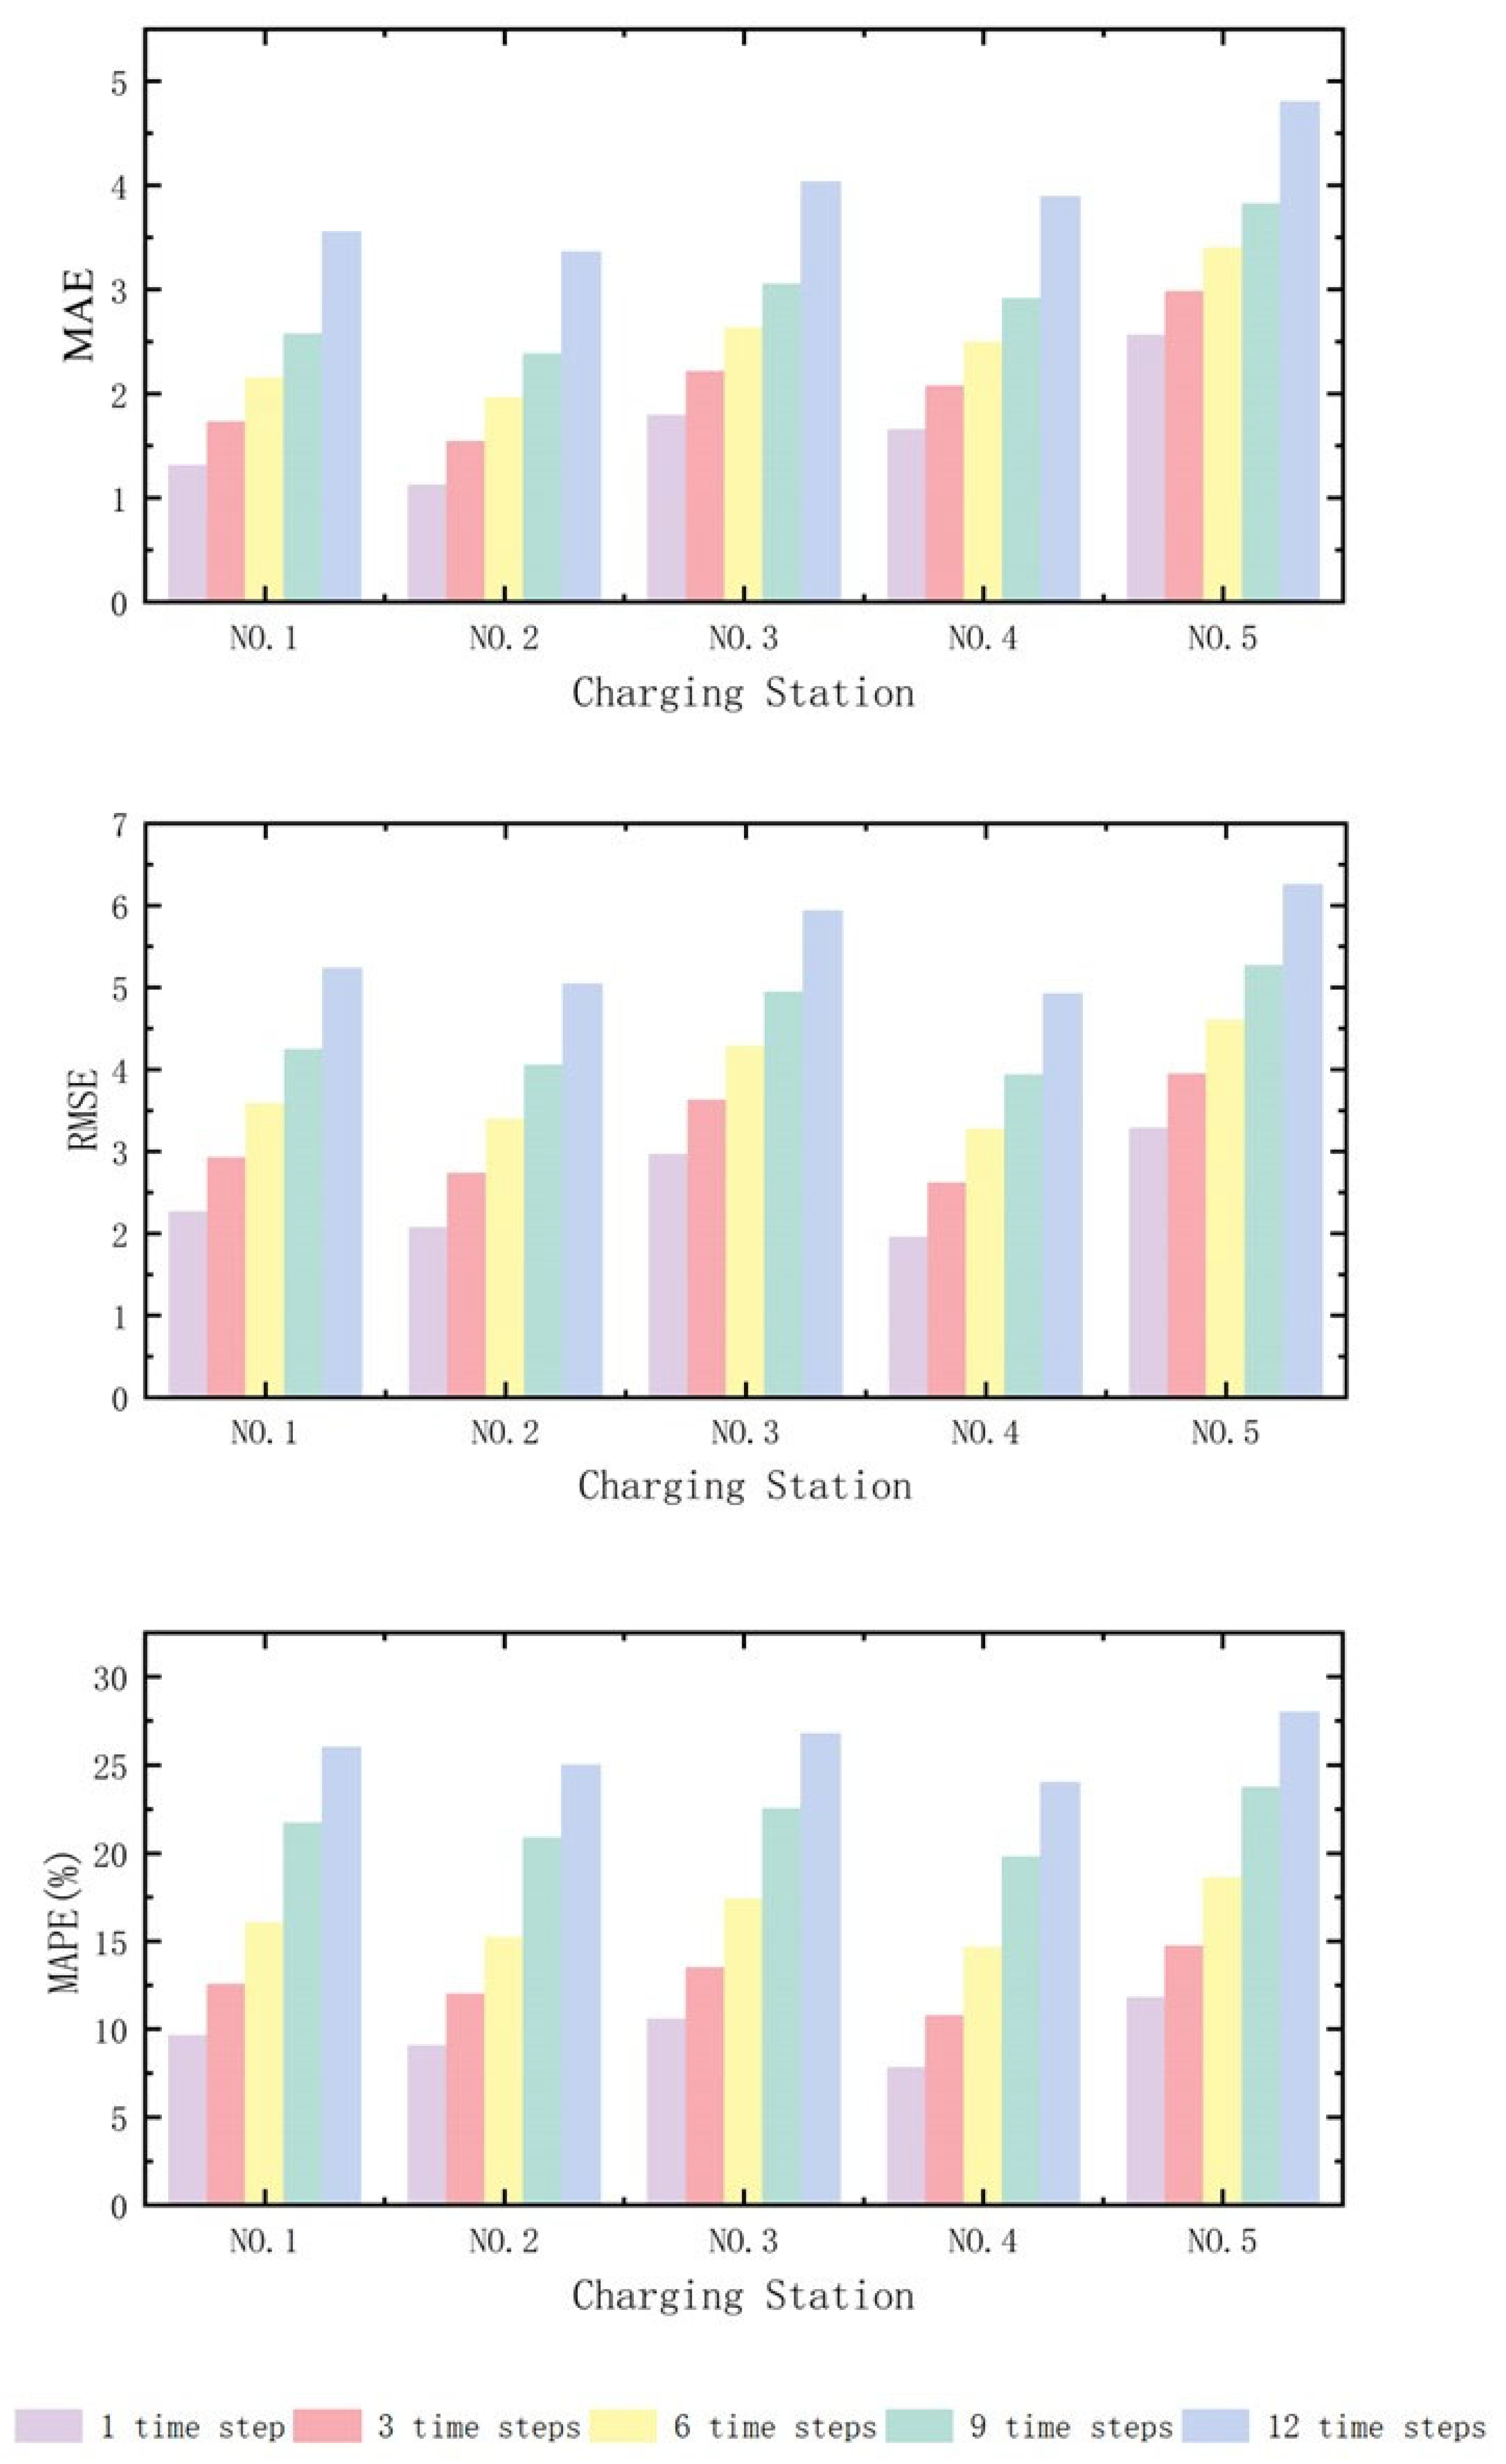
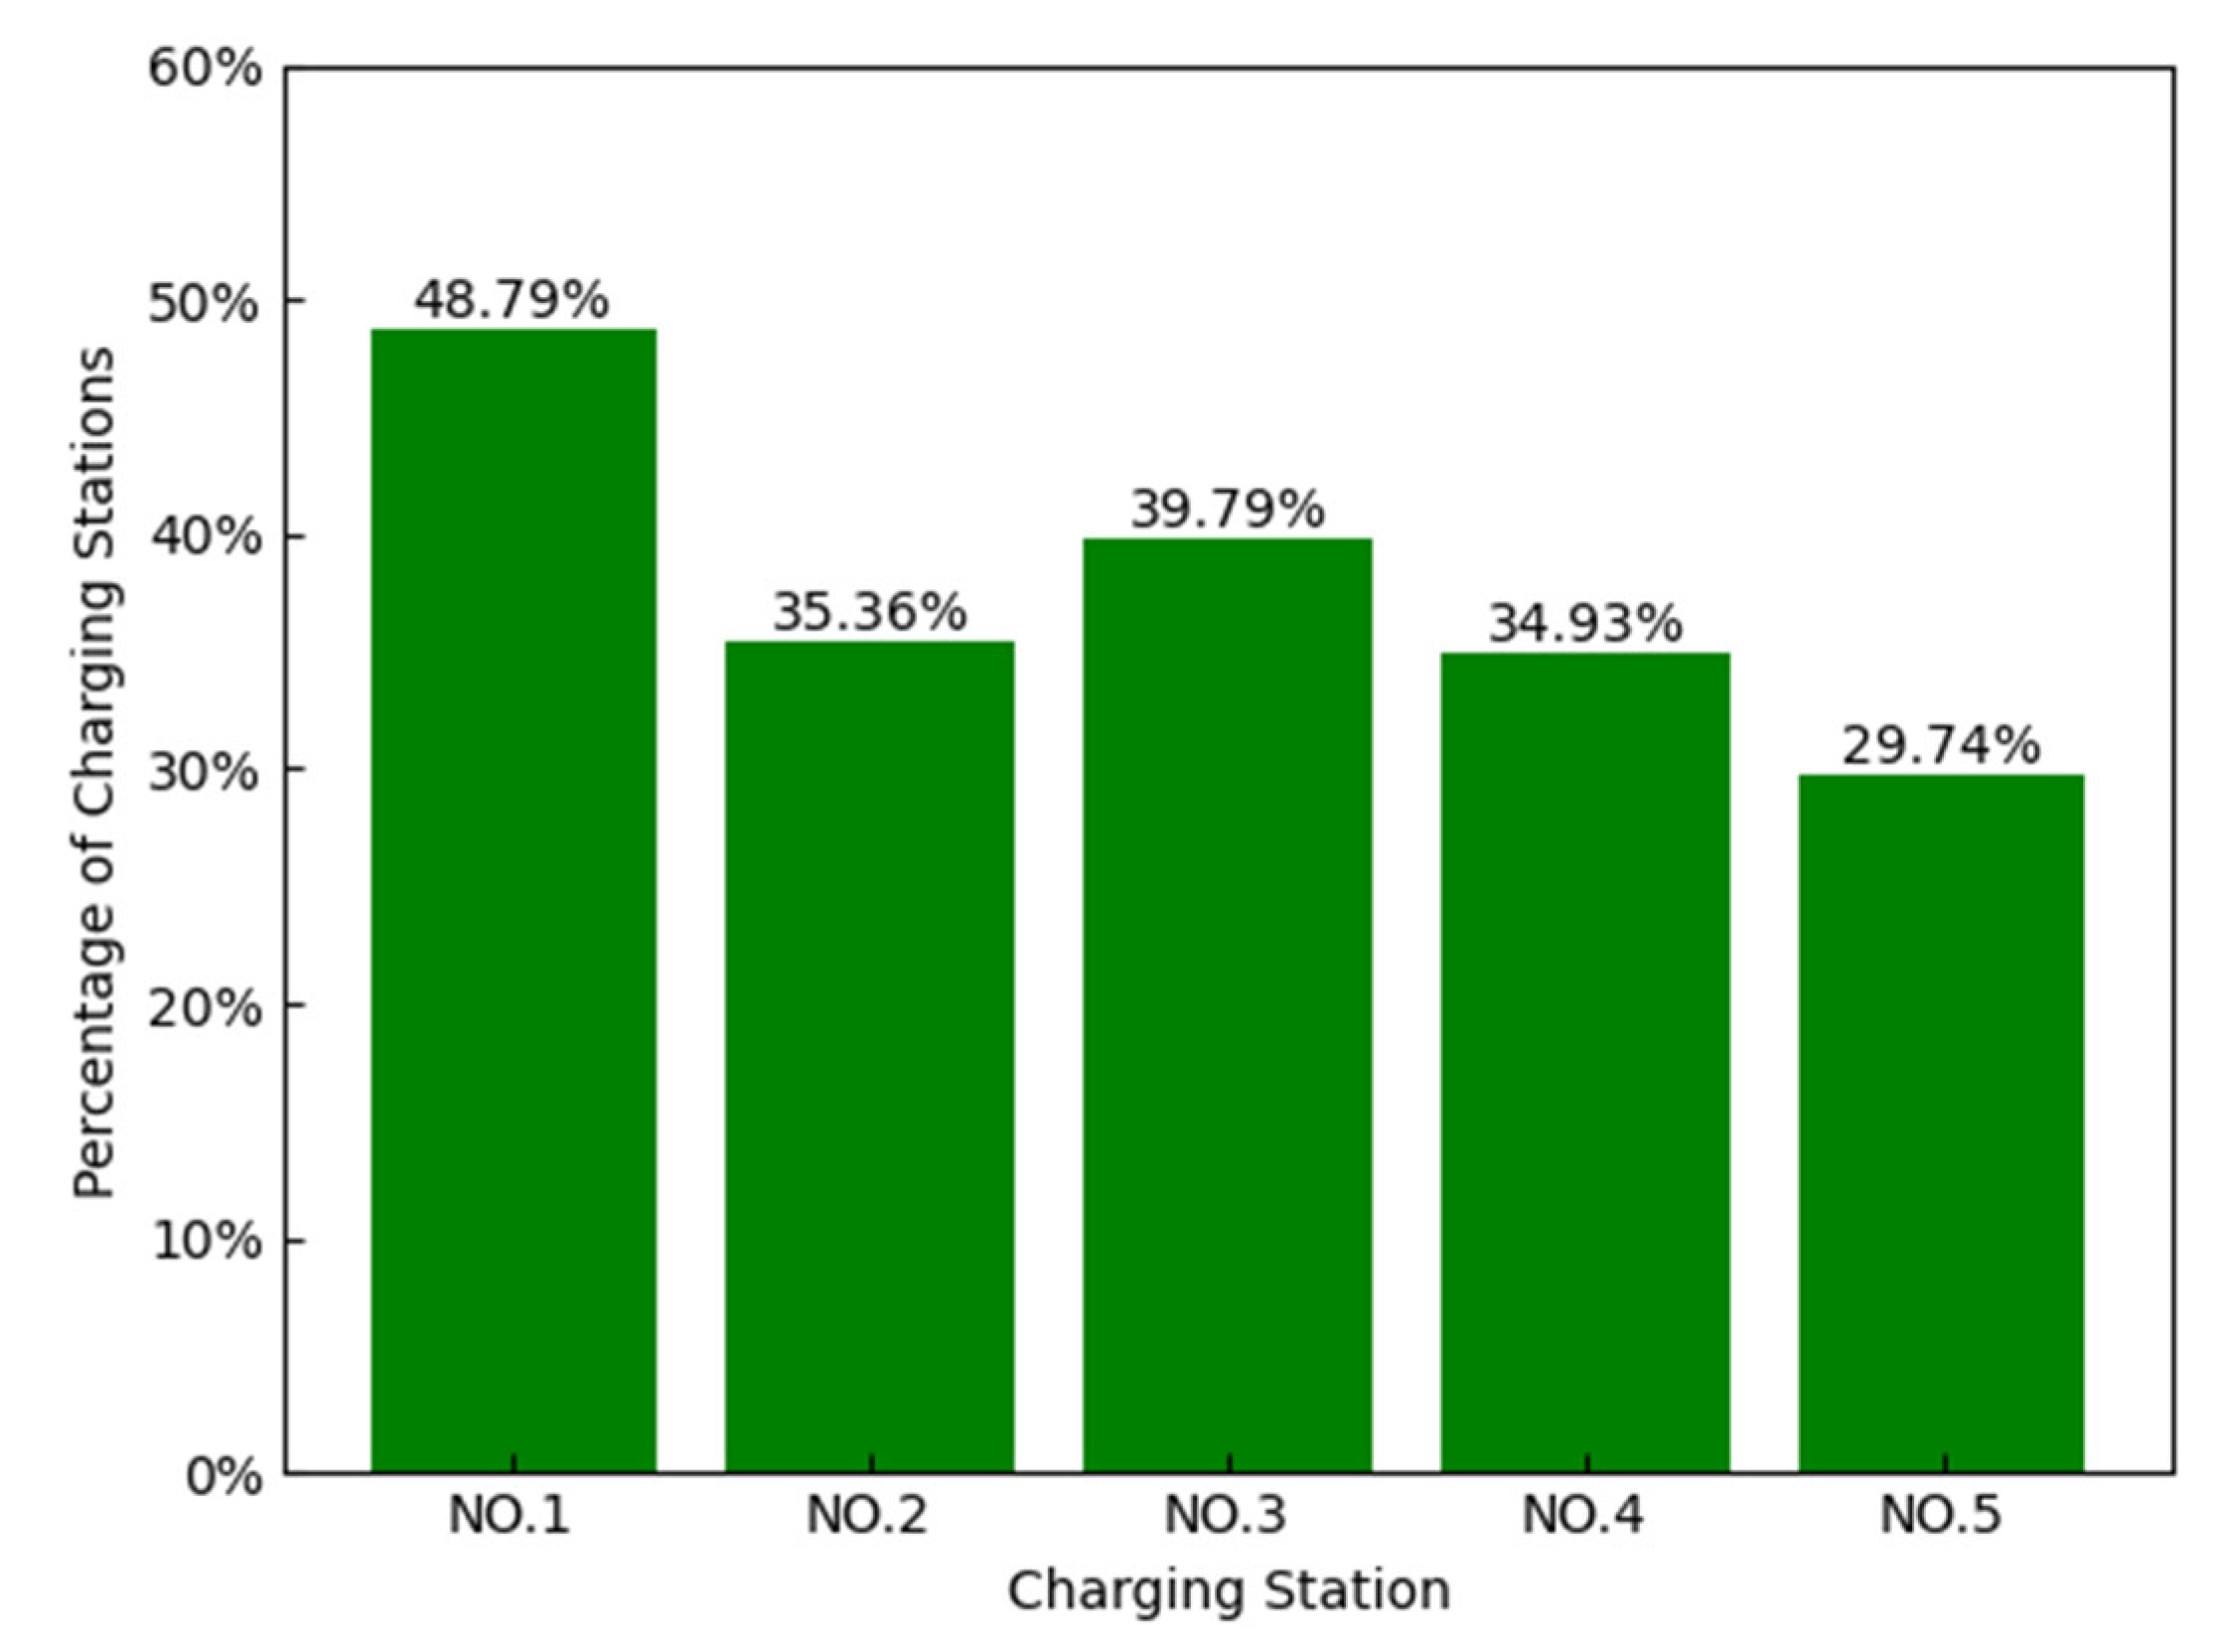
4.3. Results Analysis

To further investigate the model’s performance, experiments were conducted to assess different models across various time steps and presented in Table 3. Overall, the attention-SLSTM model exhibited superior performance in multi-time step prediction tasks with smaller prediction errors. As the time interval between predictions increased, it was observed that these three metrics gradually increased as well. Notably, despite a noticeable decrease in prediction accuracy when using a six-step prediction window (equivalent to 2 h), the mean absolute percentage error (MAPE) remained below 20%. This finding suggests that the model maintains satisfactory performance for practical purposes and can accurately predict over a 2 h time horizon. In summary, longer time intervals can be effectively predicted given an adequately broad dataset.
The prediction performance of the attention-SLSTM model among charging station groups is also examined, with visualization of the prediction results for each station from 1 to 12 time steps, as depicted in Figure 10. Within the prediction range of 20 min to 4 h, Charging Station No. 4 exhibits a MAPE value ranging from 7% to 23%, indicating its superior predictive capability. Similarly, Charging Station No. 5 demonstrates a MAPE value ranging from 11% to 27%. The difference in prediction performance at different time steps is attributed to factors related to the charging pile itself, such as the location of the charging pile, nearby traffic flow, and user preferences.
Furthermore, all five charging piles exhibit MAPE values below 20% within the six-step (equivalent to 2 h) prediction window, further affirming that the model maintains good performance when forecasting over a 2 h time horizon.
This paper investigates the predictive performance of our model over different time horizons ranging from 1 (equivalent to 20 min) to 12 (equivalent to 4 h) time steps. Figure 6 illustrates the prediction errors for three key indicators. Overall, there is a gradual increase in these metrics as the time step between predictions increases. Notably, when using a six-step prediction window (equivalent to 2 h), there is an obvious decrease in prediction accuracy; however, the mean absolute percentage error (MAPE) remains at only 19.05%. Only Charging Station No. 4 exhibits a MAPE value exceeding this threshold at 21.88%. These findings suggest that our model continues performing well even when making predictions over extended periods.

5. Conclusions

The short-term prediction of charging pile occupancy is valuable for the effective management and allocation of charging resources, especially concerning the planning and provision of urban basic charging service facilities. To tackle the temporal dynamics of electric vehicle (EV) charging station occupancy, this paper proposes a stacked-LSTM prediction model integrated with an attention mechanism. The model utilizes the LSTM module to capture multi-dimensional features and addresses its limitations through the attention mechanism, allowing for intricate information screening. Experimental results showcase the significant advantages of LSTM in time prediction problems. The introduction of the attention mechanism automatically focuses on crucial historical moments, enhancing prediction accuracy. Furthermore, compared to four other common prediction methods, our proposed model demonstrates higher reliability in predictions. Analysis reveals that within a six-time step (2 h) prediction window—a timeframe aligned with users’ and managers’ concerns regarding short-term occupancy trends—our proposed model performs well, underscoring its practical significance. In application scenarios involving nonlinear time series data from multiple sources, our attention-based time series prediction model has demonstrated excellent performance and interpretability advantages, making it an ideal choice for addressing complex scenarios such as power load forecasting, traffic flow analysis, and energy consumption estimation. Accurate predictions in these fields can assist relevant enterprises and institutions in resource allocation and management optimization efforts aimed at improving efficiency while reducing costs.
The dataset used in this study, which includes data from various charging stations, is limited by the available fields. Future work will aim to enrich this dataset with more comprehensive data. To overcome the limitations of LSTM in predicting electric vehicle (EV) charging demands and improve predictive accuracy, we plan to integrate spatial factors into our predictive model. Specifically, this will involve incorporating data on facilities surrounding the charging stations and precise geographic locations. This approach is expected to enhance the model’s adaptability and accuracy in real-world applications. Additionally, we will introduce additional datasets to validate the model’s generalizability across different geographic and market conditions. These steps are intended to significantly improve the model’s practicality and efficiency in forecasting EV charging demands.

Author Contributions

Conceptualization, C.Y. and J.H.; methodology, C.Y., H.Z. and J.H.; software, C.Y.; validation, C.Y.; formal analysis, C.Y.; investigation, C.Y.; resources, C.Y.; data curation, C.Y.; writing—original draft preparation, C.Y.; writing—review and editing, C.Y., H.Z., X.C. and J.H.; visualization, C.Y.; supervision, H.Z. and J.H.; project administration, H.Z. and J.H. All authors have read and agreed to the published version of the manuscript.

Funding

This research received no external funding.

Data Availability Statement

The original contributions presented in the study are included in the article, further inquiries can be directed to the corresponding author.

Conflicts of Interest

The authors declare no conflicts of interest.

References

  1. Liu, Z.; Sun, T.; Yu, Y.; Ke, P.; Deng, Z.; Lu, C.; Huo, D.; Ding, X. Near-real-time carbon emission accounting technology toward carbon neutrality. Engineering 2022, 14, 44–51. [Google Scholar] [CrossRef]
  2. Li, R.; Wang, Q.; Liu, Y.; Jiang, R. Per-capita carbon emissions in 147 countries: The effect of economic, energy, social, and trade structural changes. Sustain. Prod. Consum. 2021, 27, 1149–1164. [Google Scholar] [CrossRef]
  3. Fang, K.; Li, C.; Tang, Y.; He, J.; Song, J. China’s pathways to peak carbon emissions: New insights from various industrial sectors. Appl. Energy 2022, 306, 118039. [Google Scholar] [CrossRef]
  4. Ji, Z.; Huang, X. Plug-in electric vehicle charging infrastructure deployment of China towards 2020: Policies, methodologies, and challenges. Renew. Sustain. Energy Rev. 2018, 90, 710–727. [Google Scholar] [CrossRef]
  5. Metais, M.O.; Jouini, O.; Perez, Y.; Berrada, J.; Suomalainen, E. Too much or not enough? Planning electric vehicle charging infrastructure: A review of modeling options. Renew. Sustain. Energy Rev. 2022, 153, 111719. [Google Scholar] [CrossRef]
  6. Bautista, P.B.; Cárdenas, L.L.; Aguiar, L.U.; Igartua, M.A. A traffic-aware electric vehicle charging management system for smart cities. Veh. Commun. 2019, 20, 100188. [Google Scholar]
  7. Chakraborty, P.; Parker, R.; Hoque, T.; Cruz, J.; Du, L.; Wang, S.; Bhunia, S. Addressing the range anxiety of battery electric vehicles with charging en route. Sci. Rep. 2022, 12, 5588. [Google Scholar] [CrossRef] [PubMed]
  8. Wang, Y.; Chi, Y.; Xu, J.H.; Yuan, Y. Consumers’ attitudes and their effects on electric vehicle sales and charging infrastructure construction: An empirical study in China. Energy Policy 2022, 165, 112983. [Google Scholar] [CrossRef]
  9. Feng, H.J.; Xi, L.C.; Jun, Y.Z.; Ling, X.L.; Jun, H. Review of electric vehicle charging demand forecasting based on multi-source data. In Proceedings of the 2020 IEEE Sustainable Power and Energy Conference (iSPEC), Chengdu, China, 23–25 November 2020; pp. 139–146. [Google Scholar]
  10. de Quevedo, P.M.; Muñoz-Delgado, G.; Contreras, J. Impact of electric vehicles on the expansion planning of distribution systems considering renewable energy, storage, and charging stations. IEEE Trans. Smart Grid 2017, 10, 794–804. [Google Scholar] [CrossRef]
  11. Lazarou, S.; Vita, V.; Ekonomou, L. Protection schemes of meshed distribution networks for smart grids and electric vehicles. Energies 2018, 11, 3106. [Google Scholar] [CrossRef]
  12. Zhu, J.; Yang, Z.; Guo, Y.; Zhang, J.; Yang, H. Short-term load forecasting for electric vehicle charging stations based on deep learning approaches. Appl. Sci. 2019, 9, 1723. [Google Scholar] [CrossRef]
  13. Kancharla, S.R.; Ramadurai, G. Electric vehicle routing problem with non-linear charging and load-dependent discharging. Expert Syst. Appl. 2020, 160, 113714. [Google Scholar] [CrossRef]
  14. Zhang, J.; Wang, Z.; Miller, E.J.; Cui, D.; Liu, P.; Zhang, Z. Charging demand prediction in Beijing based on real-world electric vehicle data. J. Energy Storage 2023, 57, 106294. [Google Scholar] [CrossRef]
  15. Aduama, P.; Zhang, Z.; Al-Sumaiti, A.S. Multi-Feature Data Fusion-Based Load Forecasting of Electric Vehicle Charging Stations Using a Deep Learning Model. Energies 2023, 16, 1309. [Google Scholar] [CrossRef]
  16. Park, D.C.; El-Sharkawi, M.A.; Marks, R.J.; Atlas, L.E.; Damborg, M.J. Electric load forecasting using an artificial neural network. IEEE Trans. Power Syst. 1991, 6, 442–449. [Google Scholar] [CrossRef]
  17. Sun, Q.; Liu, J.; Rong, X.; Zhang, M.; Song, X.; Bie, Z.; Ni, Z. Charging load forecasting of electric vehicle charging station based on support vector regression. In Proceedings of the 2016 IEEE PES Asia-Pacific Power and Energy Engineering Conference (APPEEC), Xi’an, China, 25–28 October 2016; pp. 1777–1781. [Google Scholar]
  18. Zhu, J.; Yang, Z.; Mourshed, M.; Guo, Y.; Zhou, Y.; Chang, Y.; Wei, Y.; Feng, S. Electric vehicle charging load forecasting: A comparative study of deep learning approaches. Energies 2019, 12, 2692. [Google Scholar] [CrossRef]
  19. Zhou, D.; Guo, Z.; Xie, Y.; Hu, Y.; Jiang, D.; Feng, Y.; Liu, D. Using bayesian deep learning for electric vehicle charging station load forecasting. Energies 2022, 15, 6195. [Google Scholar] [CrossRef]
  20. Deb, S.; Tammi, K.; Kalita, K.; Kalita, K.; Mahanta, P. Impact of electric vehicle charging station load on distribution network. Energies 2018, 11, 178. [Google Scholar] [CrossRef]
  21. Mao, T.; Zhang, X.; Zhou, B. Intelligent energy management algorithms for EV-charging scheduling with consideration of multiple EV charging modes. Energies 2019, 12, 265. [Google Scholar] [CrossRef]
  22. Mohamed, A.; Salehi, V.; Ma, T.; Mohammed, O. Real-time energy management algorithm for plug-in hybrid electric vehicle charging parks involving sustainable energy. IEEE Trans. Sustain. Energy 2013, 5, 577–586. [Google Scholar] [CrossRef]
  23. Buzna, L.; De Falco, P.; Ferruzzi, G.; Khormali, S.; Proto, D.; Refa, N.; Straka, M.; Poel, G. An ensemble methodology for hierarchical probabilistic electric vehicle load forecasting at regular charging stations. Appl. Energy 2021, 283, 116337. [Google Scholar] [CrossRef]
  24. Das, S.; Thakur, P.; Singh, A.K.; Singh, S.N. Optimal management of vehicle-to-grid and grid-to-vehicle strategies for load profile improvement in distribution system. J. Energy Storage 2022, 49, 104068. [Google Scholar] [CrossRef]
  25. von Bonin, M.; Dörre, E.; Al-Khzouz, H.; Braun, M.; Zhou, X. Impact of dynamic electricity tariff and home PV system incentives on Electric Vehicle Charging Behavior: Study on potential grid implications and economic effects for households. Energies 2022, 15, 1079. [Google Scholar] [CrossRef]
  26. Che, S.; Chen, Y.; Wang, L. Electric Vehicle Charging Station Layout for Tourist Attractions Based on Improved Two-Population Genetic PSO. Energies 2023, 16, 983. [Google Scholar] [CrossRef]
  27. Kchaou-Boujelben, M. Charging station location problem: A comprehensive review on models and solution approaches. Transp. Res. Part C Emerg. Technol. 2021, 132, 103376. [Google Scholar] [CrossRef]
  28. Unterluggauer, T.; Rich, J.; Andersen, P.B.; Hashemi, S. Electric vehicle charging infrastructure planning for integrated transportation and power distribution networks: A review. ETransportation 2022, 12, 100163. [Google Scholar] [CrossRef]
  29. Li, H.; Wang, J.; Bai, G.; Hu, X. Exploring the distribution of traffic flow for shared human and autonomous vehicle roads. Energies 2021, 14, 3425. [Google Scholar]
  30. Sun, M.; Shao, C.; Zhuge, C.; Wang, P.; Yang, X.; Wang, S. Uncovering travel and charging patterns of private electric vehicles with trajectory data: Evidence and policy implications. Transportation 2021, 31, 5403504. [Google Scholar] [CrossRef]
  31. Soldan, F.; Bionda, E.; Mauri, G.; Celaschi, S. Short-term forecast of EV charging stations occupancy probability using big data streaming analysis. arXiv 2021, arXiv:2104.12503. [Google Scholar]
  32. Huang, N.; He, Q.; Qi, J.; Hu, Q.; Wang, R.; Cai, G.; Yang, D. Multinodes interval electric vehicle day-ahead charging load forecasting based on joint adversarial generation. Int. J. Electr. Power Energy Syst. 2022, 143, 108404. [Google Scholar] [CrossRef]
  33. Su, S.; Li, Y.; Chen, Q.; Xia, M.; Yamashita, K.; Jurasz, J. Operating status prediction model at EV charging stations with fusing spatiotemporal graph convolutional network. IEEE Trans. Transp. Electrif. 2022, 9, 114–129. [Google Scholar] [CrossRef]
  34. Yi, Z.; Liu, X.C.; Wei, R.; Chen, X.; Dai, J. Electric vehicle charging demand forecasting using deep learning model. J. Intell. Transp. Syst. 2022, 26, 690–703. [Google Scholar] [CrossRef]
  35. Lu, Y.; Li, Y.; Xie, D.; Wei, E.; Bao, X.; Chen, H.; Zhong, X. The application of improved random forest algorithm on the prediction of electric vehicle charging load. Energies 2018, 11, 3207. [Google Scholar] [CrossRef]
  36. Bi, J.; Wang, Y.; Sun, S.; Guan, W. Predicting charging time of battery electric vehicles based on regression and time-series methods: A case study of Beijing. Energies 2018, 11, 1040. [Google Scholar] [CrossRef]
  37. Gruosso, G.; Mion, A.; Gajani, G.S. Forecasting of electrical vehicle impact on infrastructure: Markov chains model of charging stations occupation. ETransportation 2020, 6, 100083. [Google Scholar] [CrossRef]
  38. Amini, M.H.; Karabasoglu, O.; Ilić, M.D.; Boroojeni, K.G.; Sitharama, S.L. ARIMA-based demand forecasting method considering probabilistic model of electric vehicles’ parking lots. In Proceedings of the 2015 IEEE Power & Energy Society General Meeting, Xi’an, China, 25–28 October 2016; pp. 1–5. [Google Scholar]
  39. Hu, J.; Sun, Q.; Wang, R.; Wang, B.; Zhai, M.; Zhang, H. Privacy-preserving sliding mode control for voltage restoration of AC microgrids based on output mask approach. IEEE Trans. Ind. Inform. 2022, 18, 6818–6827. [Google Scholar] [CrossRef]
  40. Liu, Z.K.; Liu, W.D.; Zhang, Y.; Qian, L.Q.; Zheng, W.Y.; Yu, Z.R.; Li, H.H.; Wu, G.; Liu, H.; Chen, Y.; et al. Enhancing the DC voltage quality in EV charging station employing SMES and SFCL devices. IEEE Trans. Appl. Supercond. 2021, 31, 5403504. [Google Scholar] [CrossRef]
  41. Liu, L.; Zhang, Z.; Yin, Y.; Li, Y.; Xie, H.; Zhang, M.; Zhao, Y. A robust high-quality current control with fast convergence for three-level NPC converters in micro-energy systems. IEEE Trans. Ind. Inform. 2023, 19, 10716–10726. [Google Scholar] [CrossRef]
  42. Xue, X.; Ai, X.; Fang, J.; Cui, S.; Jiang, Y.; Yao, W.; Chen, Z.; Wen, J. Real-time schedule of microgrid for maximizing battery energy storage utilization. IEEE Trans. Sustain. Energy 2022, 13, 1356–1369. [Google Scholar] [CrossRef]
  43. Abbasimehr, H.; Shabani, M.; Yousefi, M. An optimized model using LSTM network for demand forecasting. Comput. Ind. Eng. 2020, 143, 106435. [Google Scholar] [CrossRef]
  44. Fischer, T.; Krauss, C. Deep learning with long short-term memory networks for financial market predictions. Eur. J. Oper. Res. 2018, 270, 654–669. [Google Scholar] [CrossRef]
  45. Jawad, S.; Liu, J. Electrical Vehicle Charging Load Mobility Analysis Based on a Spatial–Temporal Method in Urban Electrified-Transportation Networks. Energies 2023, 16, 5178. [Google Scholar] [CrossRef]
  46. Davidich, N.; Galkin, A.; Davidich, Y.; Schlosser, T.; Capayova, S.; Nowakowska-Grunt, J.; Kush, Y.; Thompson, R. Intelligent Decision Support System for Modeling Transport and Passenger Flows in Human-Centric Urban Transport Systems. Energies 2022, 15, 2495. [Google Scholar] [CrossRef]
  47. Kampik, M.; Bodzek, K.; Piaskowy, A.; Pilśniak, A.; Fice, M. An analysis of energy consumption in railway signal boxes. Energies 2023, 16, 7985. [Google Scholar] [CrossRef]
  48. Sun, Y.; He, J.; Ma, H.; Yang, X.; Xiong, Z.; Zhu, X.; Wang, W. Online chatter detection considering beat effect based on Inception and LSTM neural networks. Mech. Syst. Signal Process. 2023, 184, 109723. [Google Scholar] [CrossRef]
  49. Aghsaee, R.; Hecht, C.; Schwinger, F.; Figgener, J.; Jarke, M.; Sauer, D.U. Data-Driven, Short-Term Prediction of Charging Station Occupation. Electricity 2023, 4, 134–153. [Google Scholar] [CrossRef]
  50. Abbasimehr, H.; Paki, R. Improving time series forecasting using LSTM and attention models. J. Ambient Intell. Humaniz. Comput. 2022, 13, 673–691. [Google Scholar] [CrossRef]
  51. Verma, A.; Asadi, A.; Yang, K.; Maitra, A.; Asgeirsson, H. Analyzing household charging patterns of Plug-in electric vehicles (PEVs): A data mining approach. Comput. Ind. Eng. 2019, 128, 964–973. [Google Scholar] [CrossRef]
  52. Yi, T.; Zhang, C.; Lin, T.; Liu, J. Research on the spatial-temporal distribution of electric vehicle charging load demand: A case study in China. J. Clean. Prod. 2020, 242, 118457. [Google Scholar] [CrossRef]
  53. Aït-Sahalia, Y. Telling from discrete data whether the underlying continuous-time model is a diffusion. J. Financ. 2002, 57, 2075–2112. [Google Scholar] [CrossRef]
  54. Hochreiter, S.; Schmidhuber, J. Long short-term memory. Neural Comput. 1997, 9, 1735–1780. [Google Scholar] [CrossRef]
  55. Logan, G.D. The CODE theory of visual attention: An integration of space-based and object-based attention. Psychol. Rev. 1996, 103, 603. [Google Scholar] [CrossRef] [PubMed]
  56. Zhang, Q.; Wang, H.; Dong, J.; Zhong, G.; Sun, X. Prediction of sea surface temperature using long short-term memory. IEEE Geosci. Remote Sens. Lett. 2017, 14, 1745–1749. [Google Scholar] [CrossRef]
  57. Ma, T.Y.; Faye, S. Multistep electric vehicle charging station occupancy prediction using hybrid LSTM neural networks. Energy 2022, 244, 123217. [Google Scholar] [CrossRef]
  58. Yu, Y.; Si, X.; Hu, C.; Zhang, J. A review of recurrent neural networks: LSTM cells and network architectures. Neural Comput. 2019, 31, 1235–1270. [Google Scholar] [CrossRef]
  59. Ojo, S.O.; Owolawi, P.A.; Mphahlele, M.; Adisa, J.A. Stock market behaviour prediction using stacked LSTM networks. In Proceedings of the 2019 International Multidisciplinary Information Technology and Engineering Conference (IMITEC), Vanderbijlpark, South Africa, 21–22 November 2019; pp. 1–5. [Google Scholar]
Figure 1. Usage patterns of the charging stations.
Energies 17 02041 g001
Figure 2. Weekly operating status at No. 1 charging station.
Energies 17 02041 g002
Figure 3. Feature correlation.
Energies 17 02041 g003
Figure 4. The autocorrelations of the charging occupancy states.
Energies 17 02041 g004
Figure 5. Flow chart of the study.
Energies 17 02041 g005
Figure 6. Attention-SLSTM model architecture.
Energies 17 02041 g006
Figure 7. The LSTM block architecture.
Energies 17 02041 g007
Figure 8. Attention mechanism structure.
Energies 17 02041 g008
Figure 9. Comparison of results from different prediction models.
Energies 17 02041 g009
Figure 10. Changes of evaluation indicators at different prediction steps.
Energies 17 02041 g010
Table 1. Hyperparameter settings for the attention-SLSTM model.
HyperparameterValue
Learning rate0.001
Number of training epochs20
RegularizationDropout (0.2)
Batch size32
OptimizerAdam
Table 2. Comparison of results from different prediction models.
IndicatorsARIMALSTMStacked-LSTMATT-SLSTM
MAE2.78912.16981.77011.6860
RMSE3.61202.99632.63662.5040
MAPE14.595412.883011.06809.7680
Table 3. Prediction result of different models.
ModelIndicatorsTime Steps
1 Time Step3 Time Steps6 Time Steps9 Time Steps12 Time Steps
MAE2.7893.2153.6774.1074.712
ARIMARMSE3.6124.1554.8945.6666.212
MAPE14.59518.81122.73125.88130.788
MAE2.1702.6103.2843.5164.348
LSTMRMSE2.9963.7134.7475.1205.948
MAPE12.88314.24618.71523.78928.948
MAE1.7702.4222.7873.3044.038
Stacked-LSTMRMSE2.6373.5994.1644.6335.807
MAPE11.06812.94617.84122.80126.881
MAE1.6862.1062.5262.9463.926
Attention-SLSTMRMSE2.5043.1643.8244.4845.474
MAPE9.76812.68816.37421.71425.94
Disclaimer/Publisher’s Note: The statements, opinions and data contained in all publications are solely those of the individual author(s) and contributor(s) and not of MDPI and/or the editor(s). MDPI and/or the editor(s) disclaim responsibility for any injury to people or property resulting from any ideas, methods, instructions or products referred to in the content.

