
Flow Characteristic Analysis of the Impeller Inlet Diameter in a Double-Suction Pump


Abstract
1. Introduction
2. Pump Design
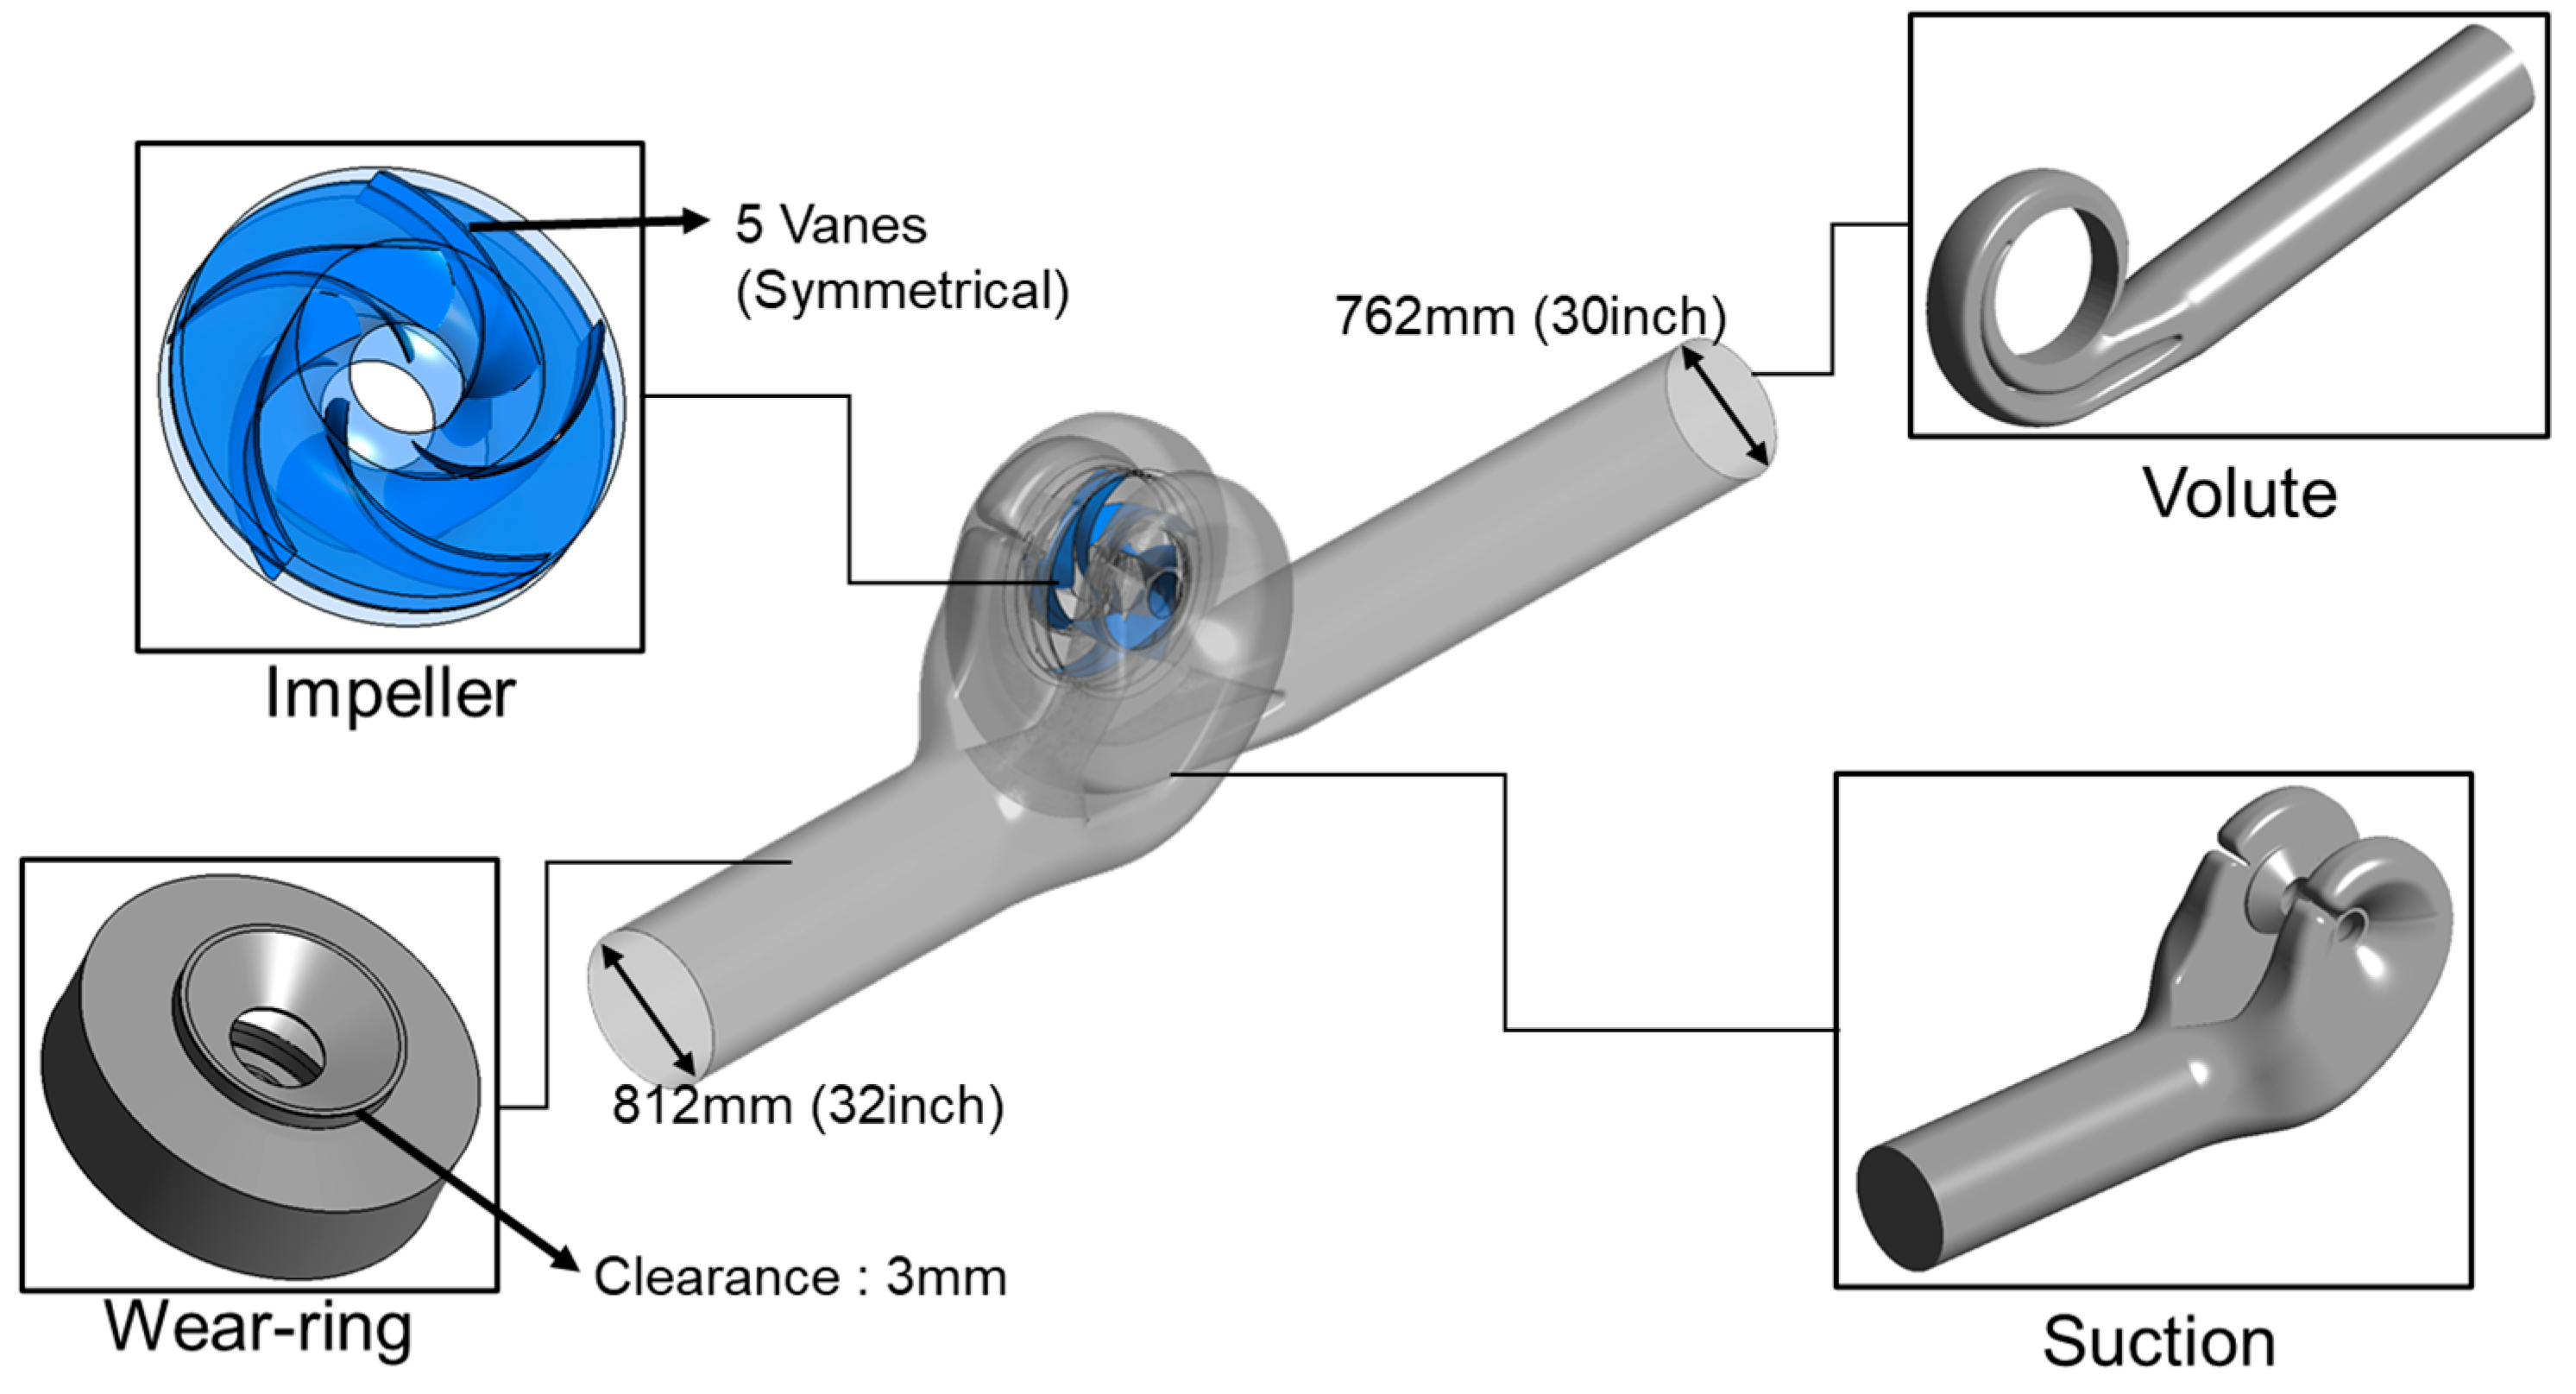
2.1. Geometry
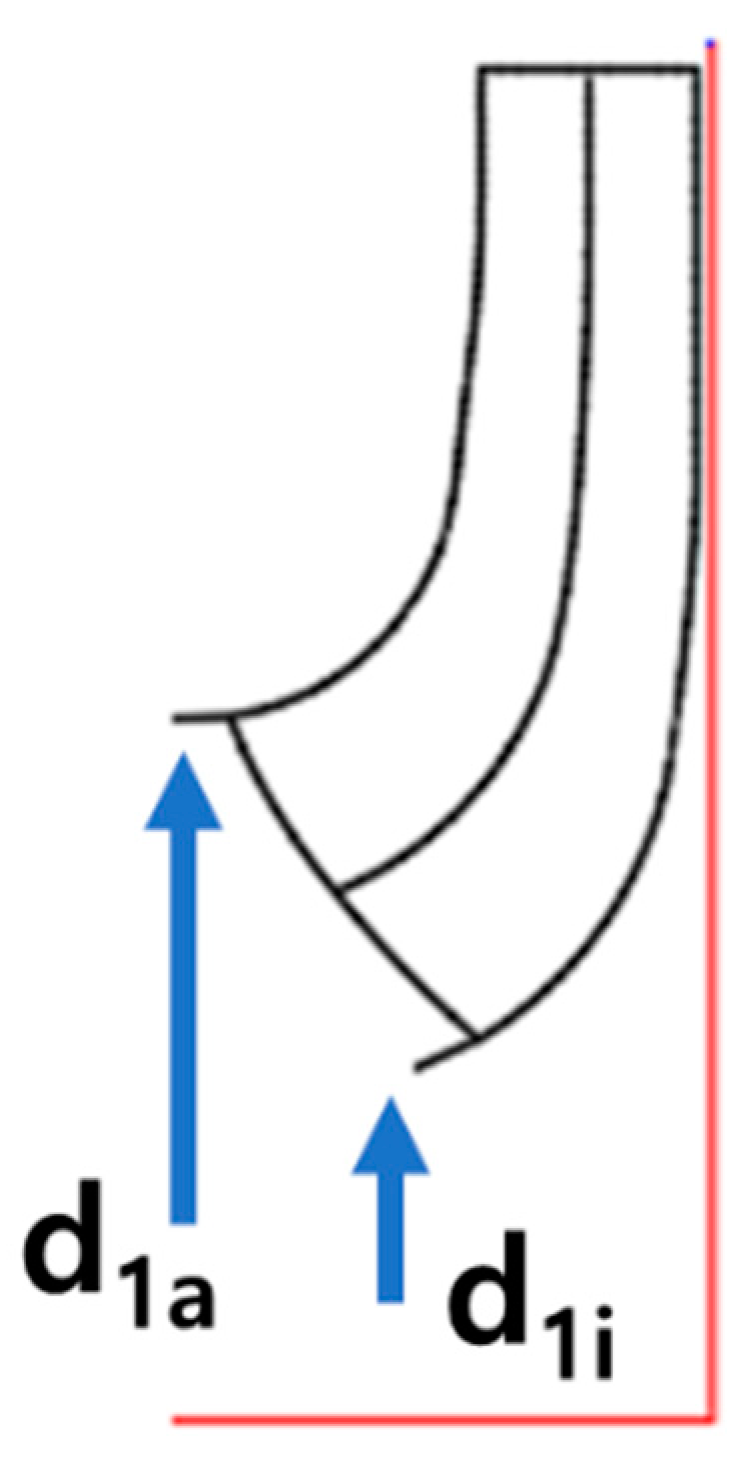
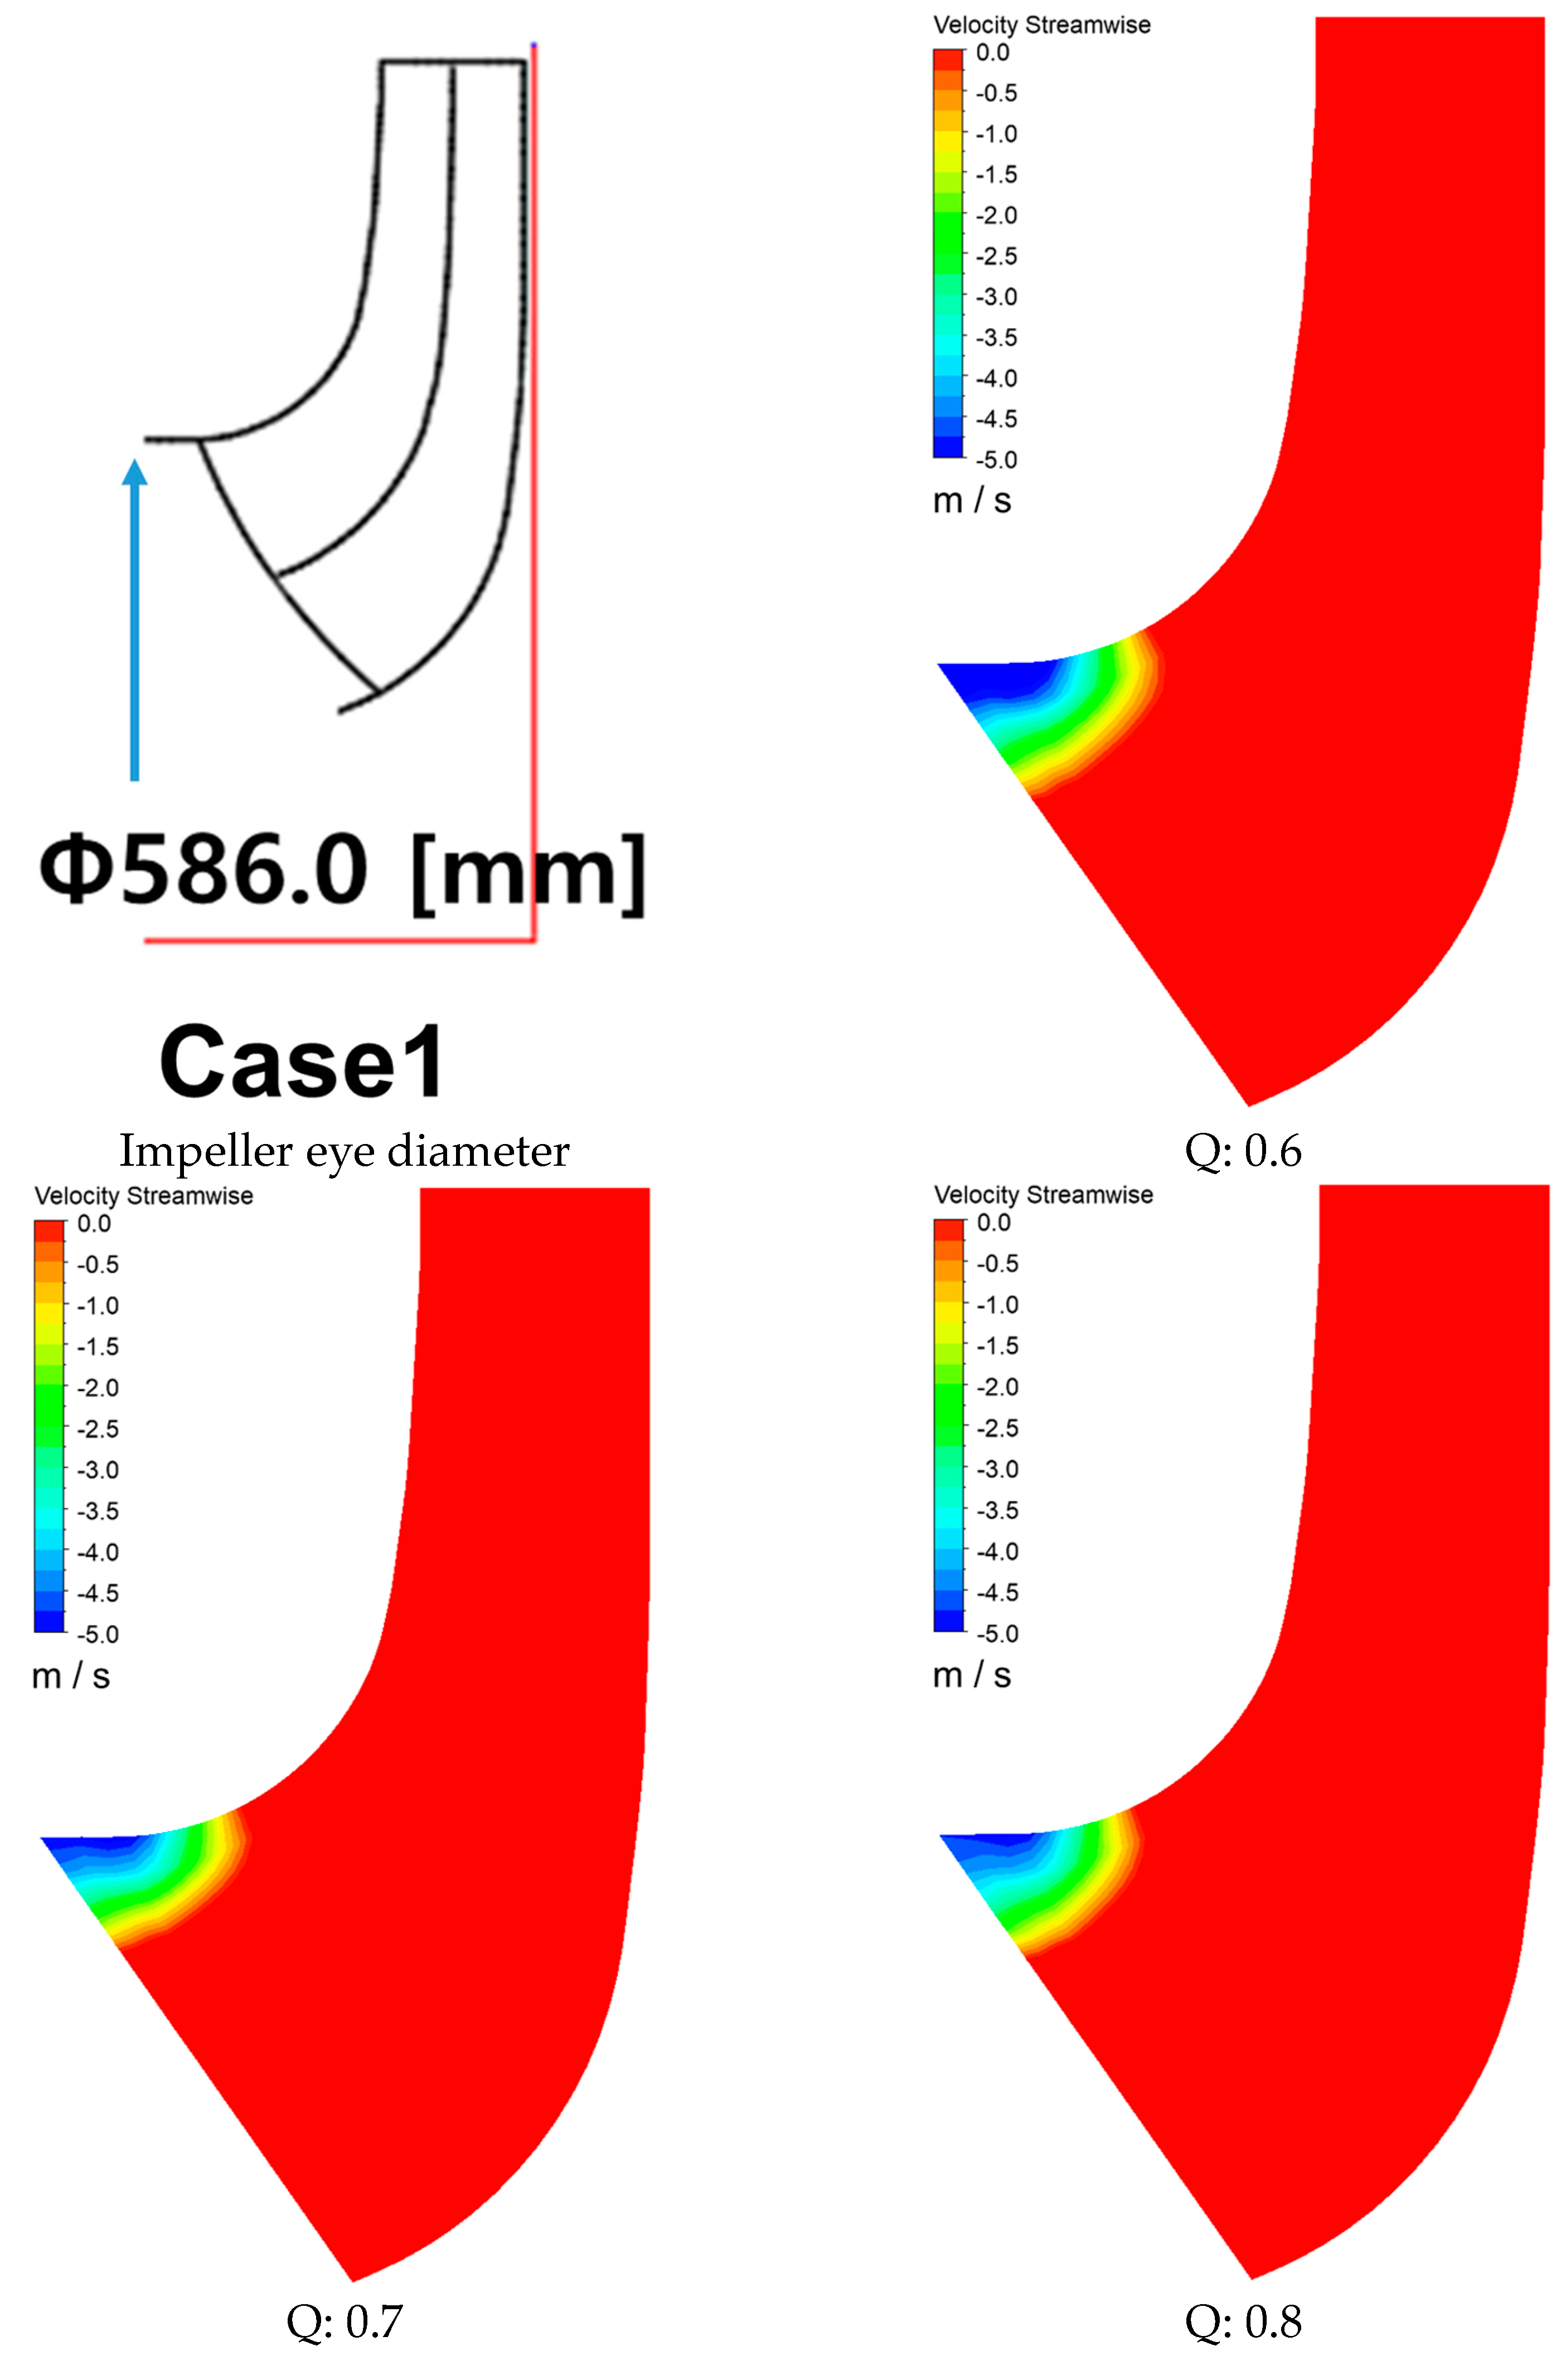
2.2. Design of the Impeller Inlet
- QLa: Flow rate through impeller: QLa = Q + Qsp + QE + Qh = Q/ηv
- -
- Q: Flow rate, volumetric flow
- -
- Qsp: Leakage flow rate through the seal at the impeller inlet
- -
- QE: Flow rate through axial-thrust-balancing device
- -
- Qh: Flow rate through auxiliaries (mostly zero)
- -
- ηv: Volumetric efficiency
- fq: Impeller eyes per impeller: single-entry fq = 1; double-entry fq = 2
- n: Rotational speed (revolutions per minute)
- kn: Blockage caused by hub: kn = 1 − dn2/d12
- dn: Hub diameter
- α1: Angle between directions of circumferential and absolute velocity, 1: impeller blade’s leading edge
- β1: Angle between relative velocity vector and the negative direction of circumferential velocity, 1: impeller blade’s leading edge
- : Impeller’s outer diameter
- : Impeller’s outer diameter tip speed,
- -
- : The values computed using a Stepanoff chart. [34]
- -
- H: Head, (m)
- -
- : Gravitational acceleration ()
- -
- : Liquid density ()
3. Numerical and Experimental Methods
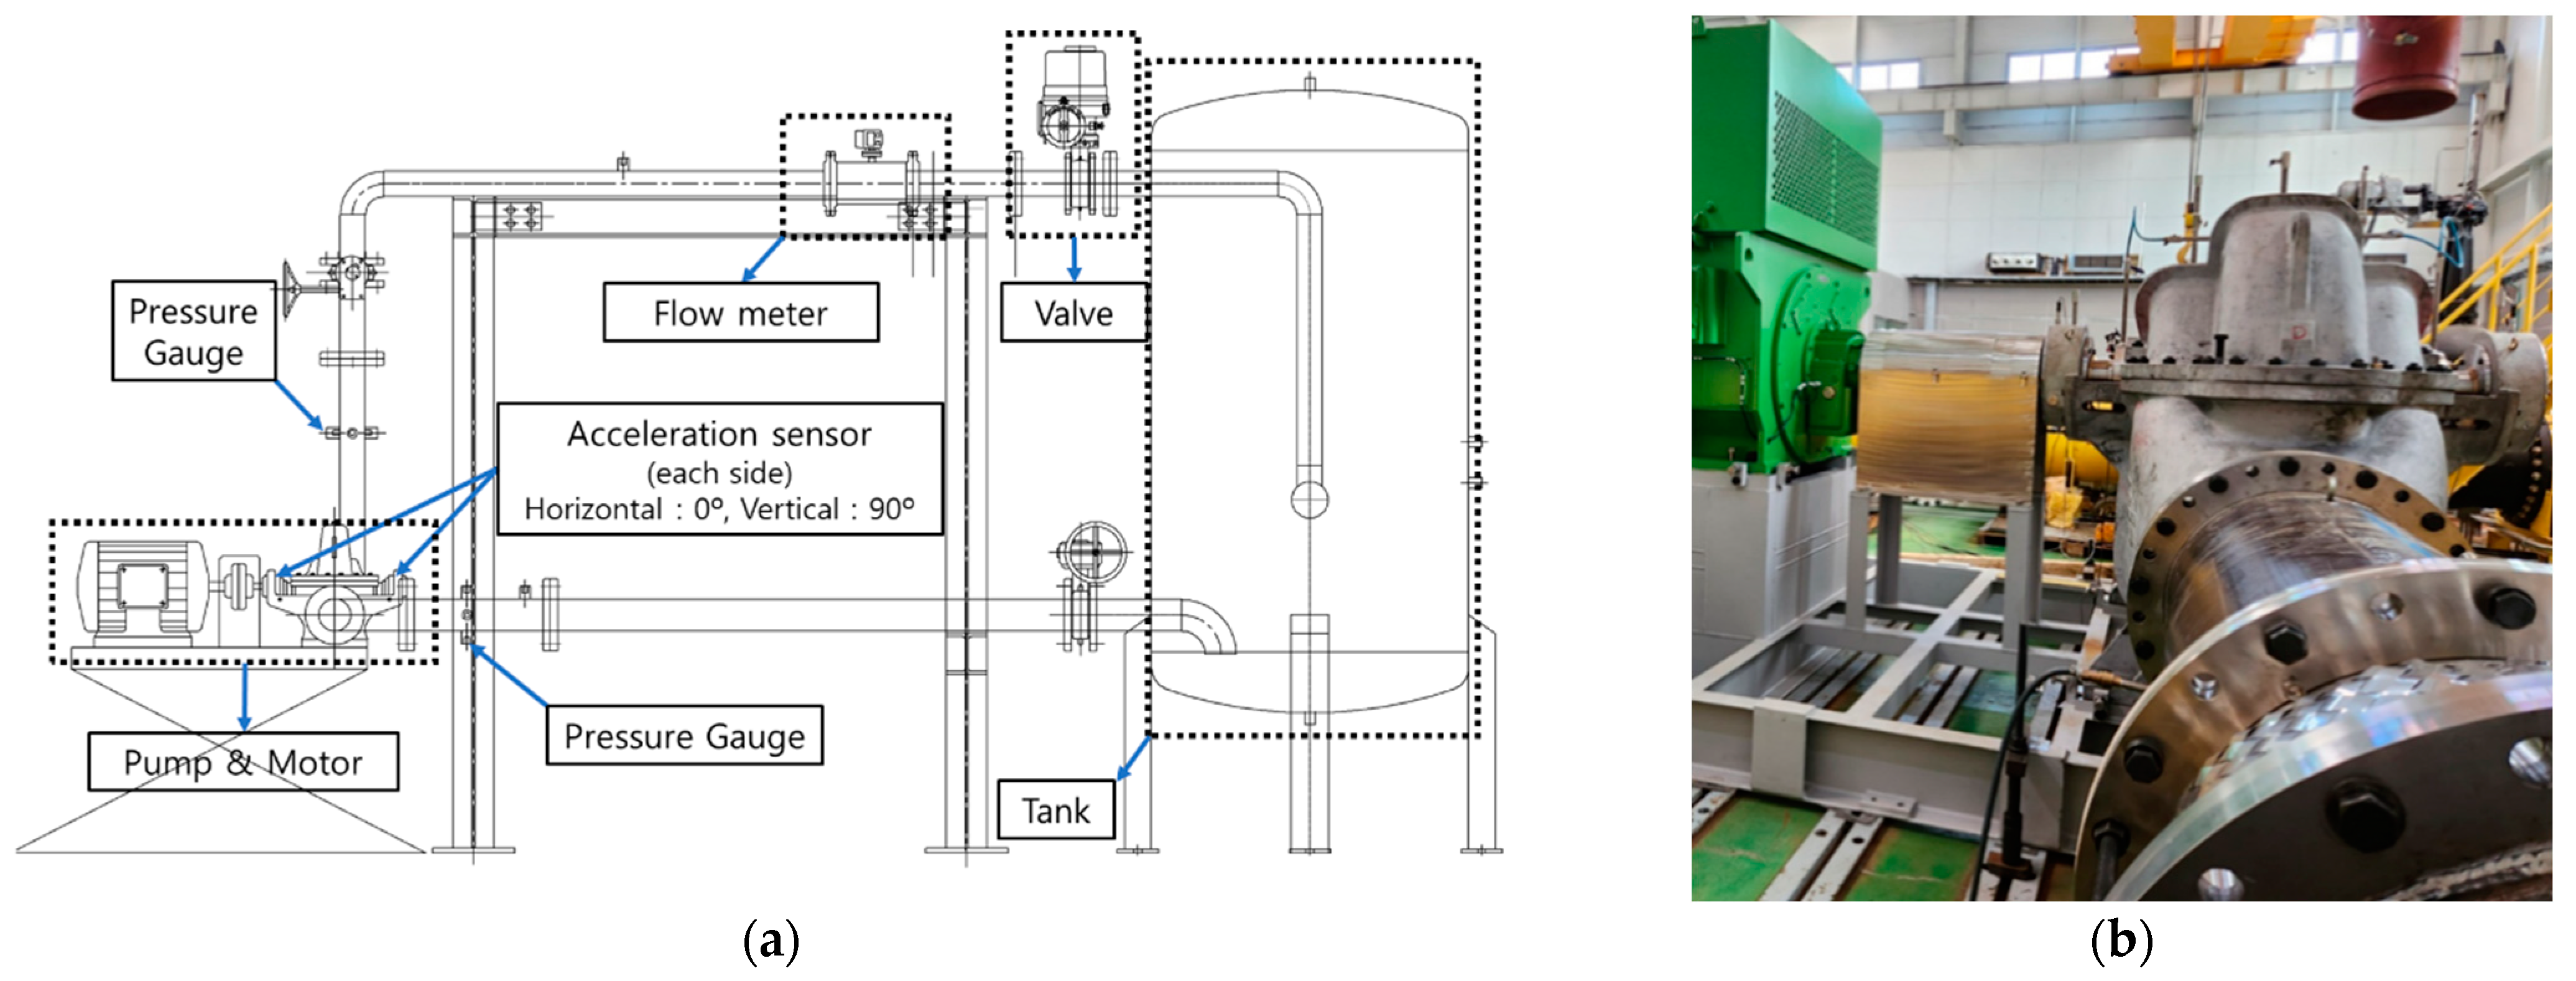
3.1. Experimental Method
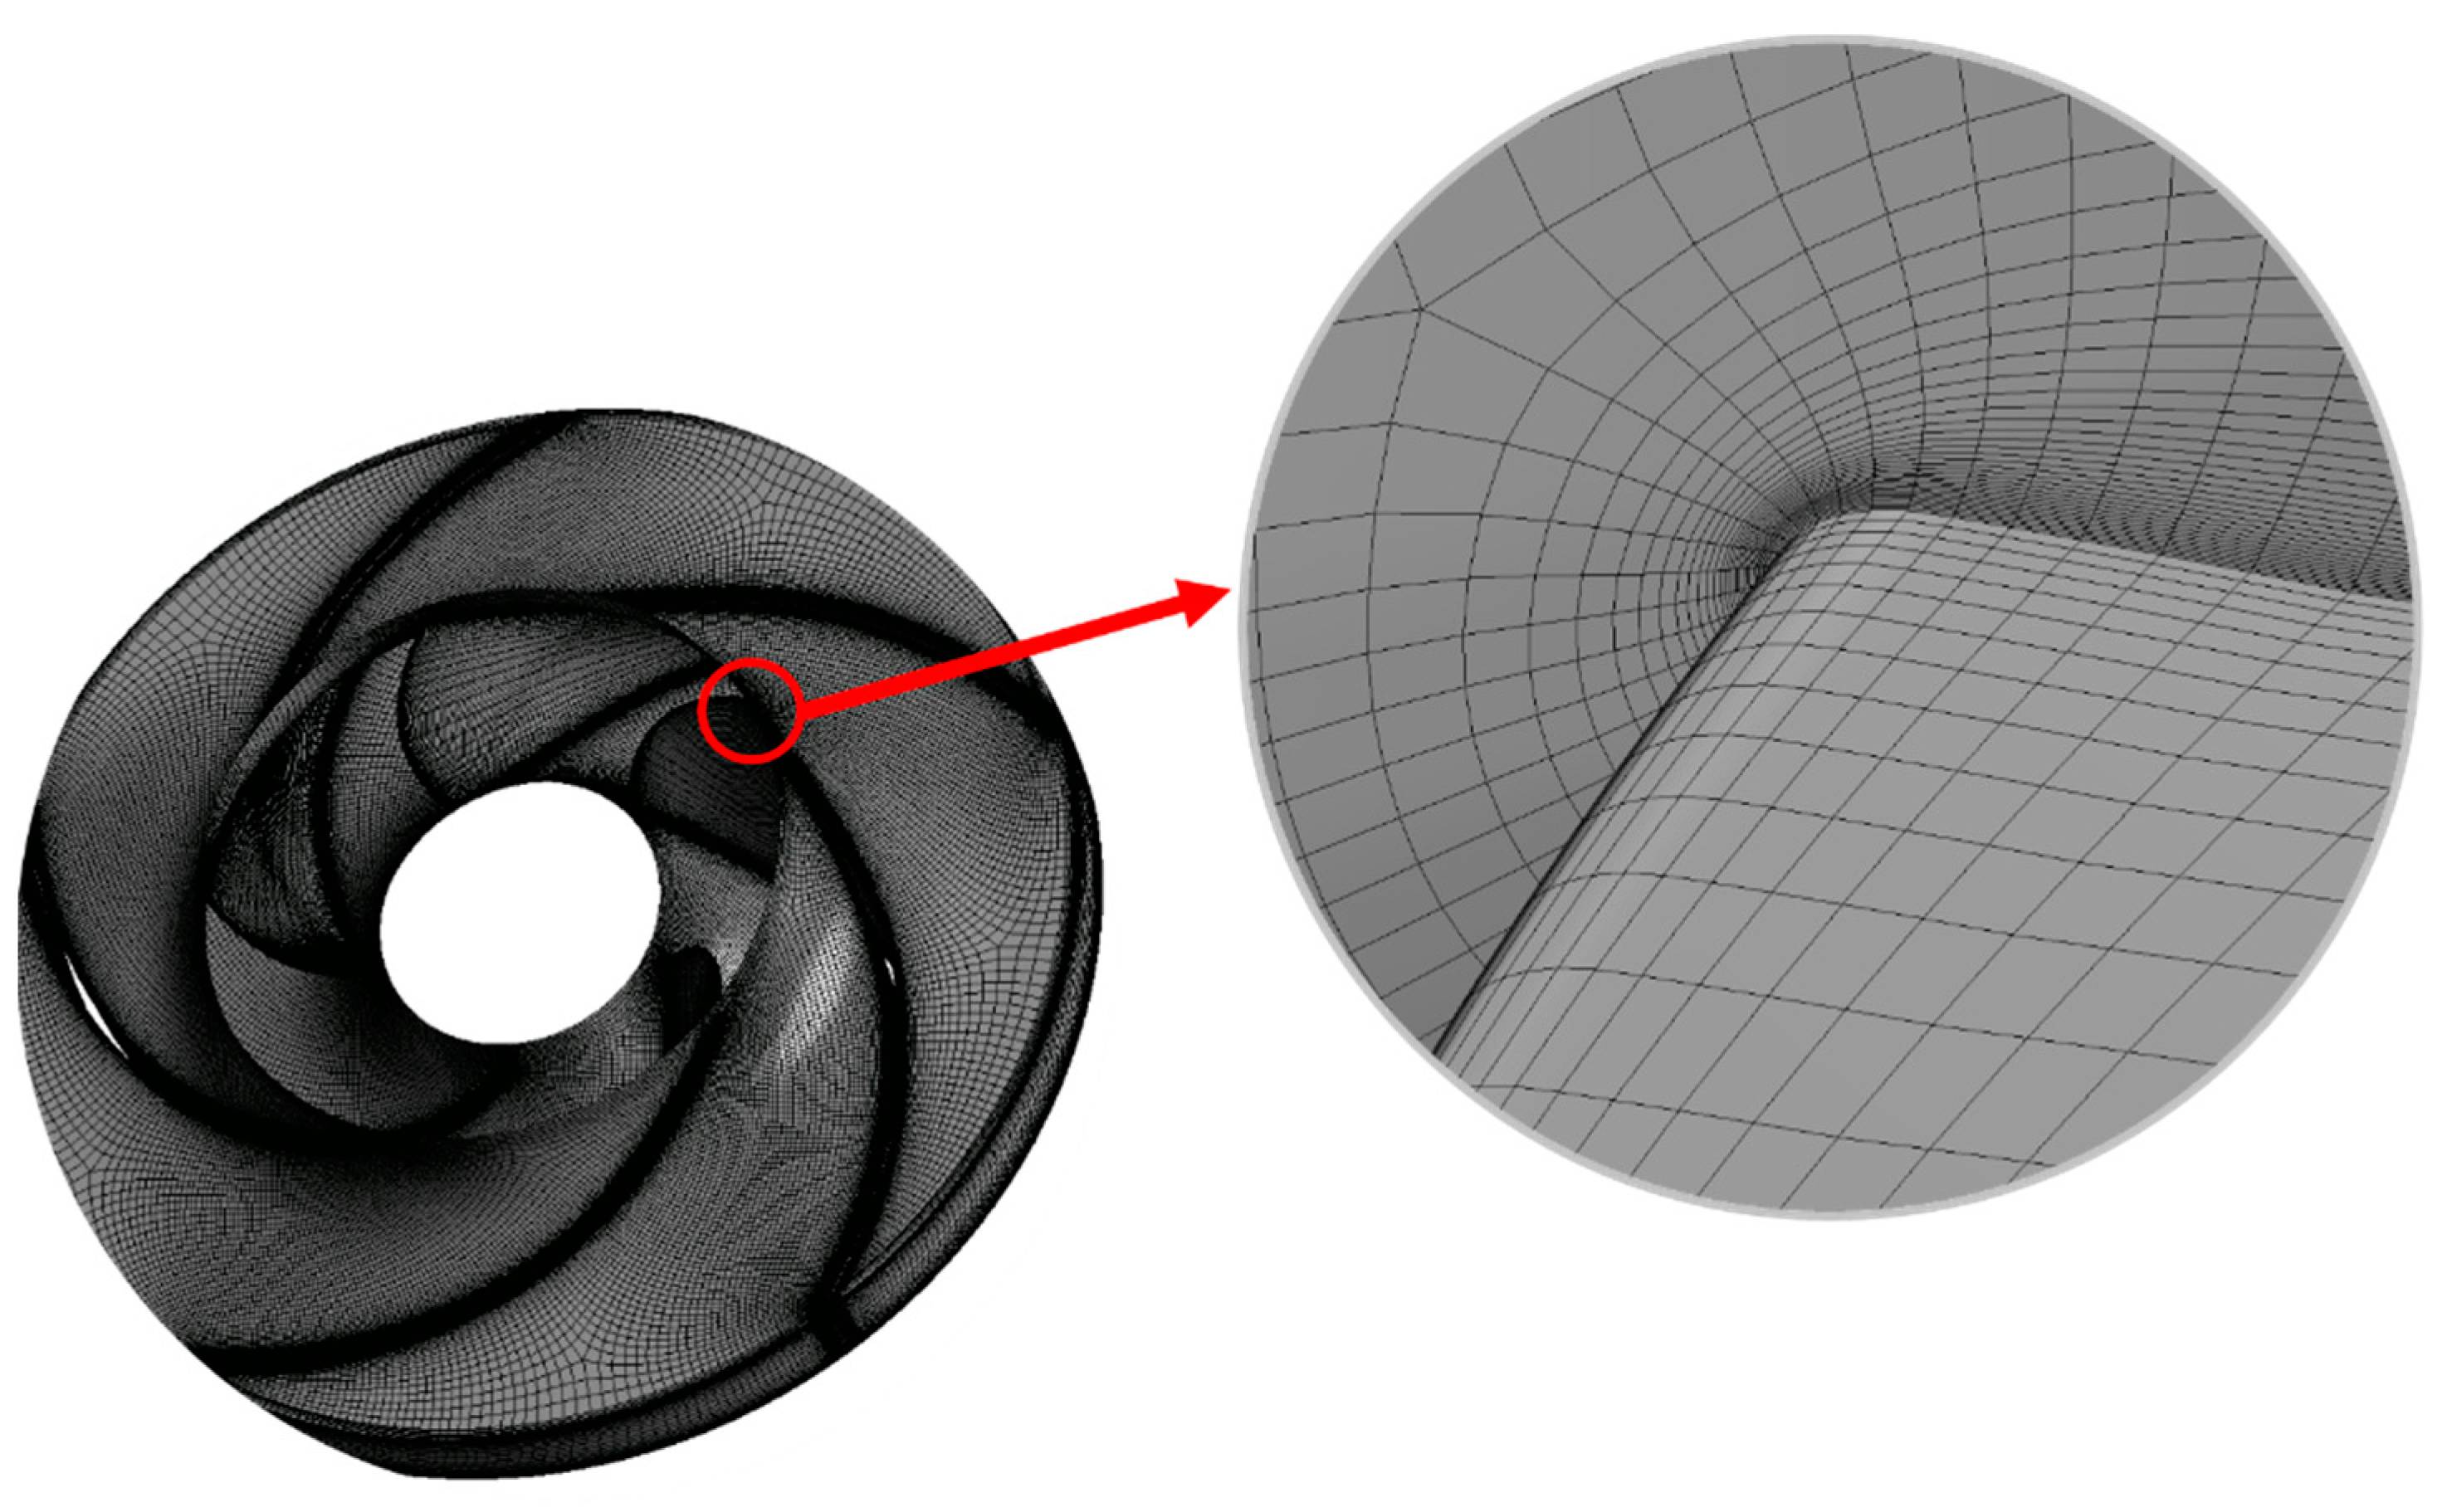
3.2. Flow Analysis Verification with a Numerical Method
4. Results
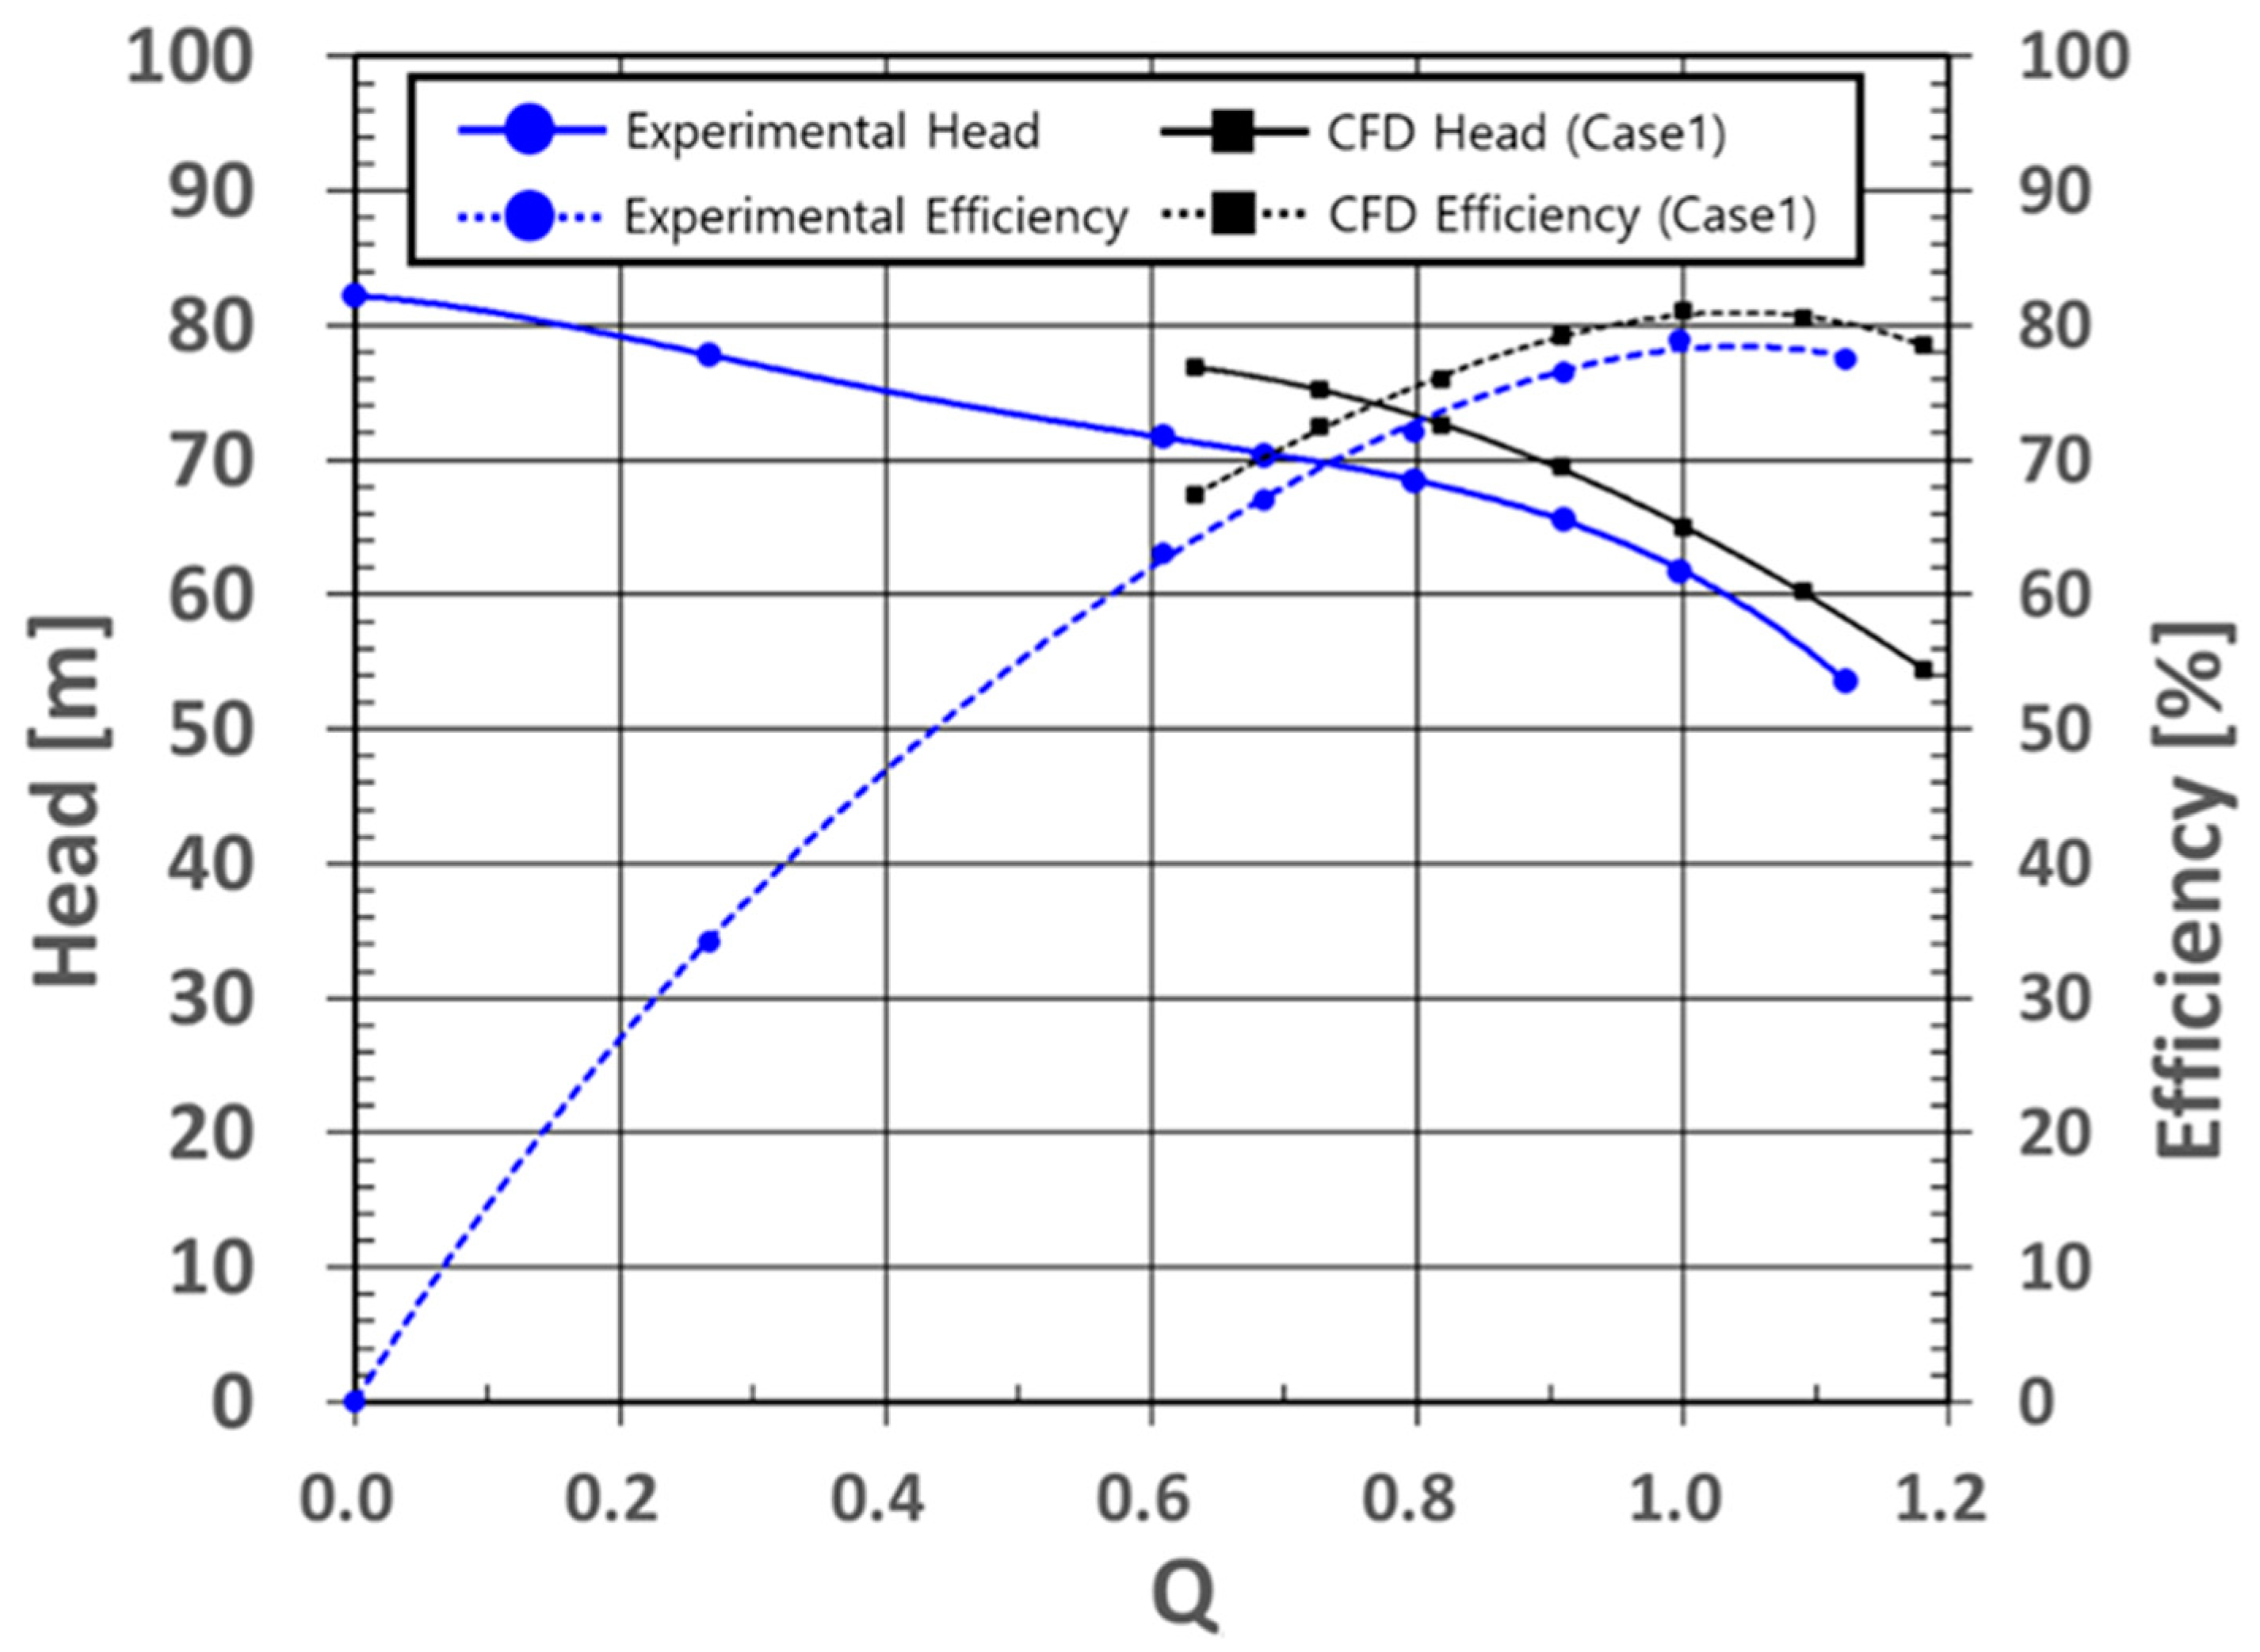
4.1. Performance Analysis
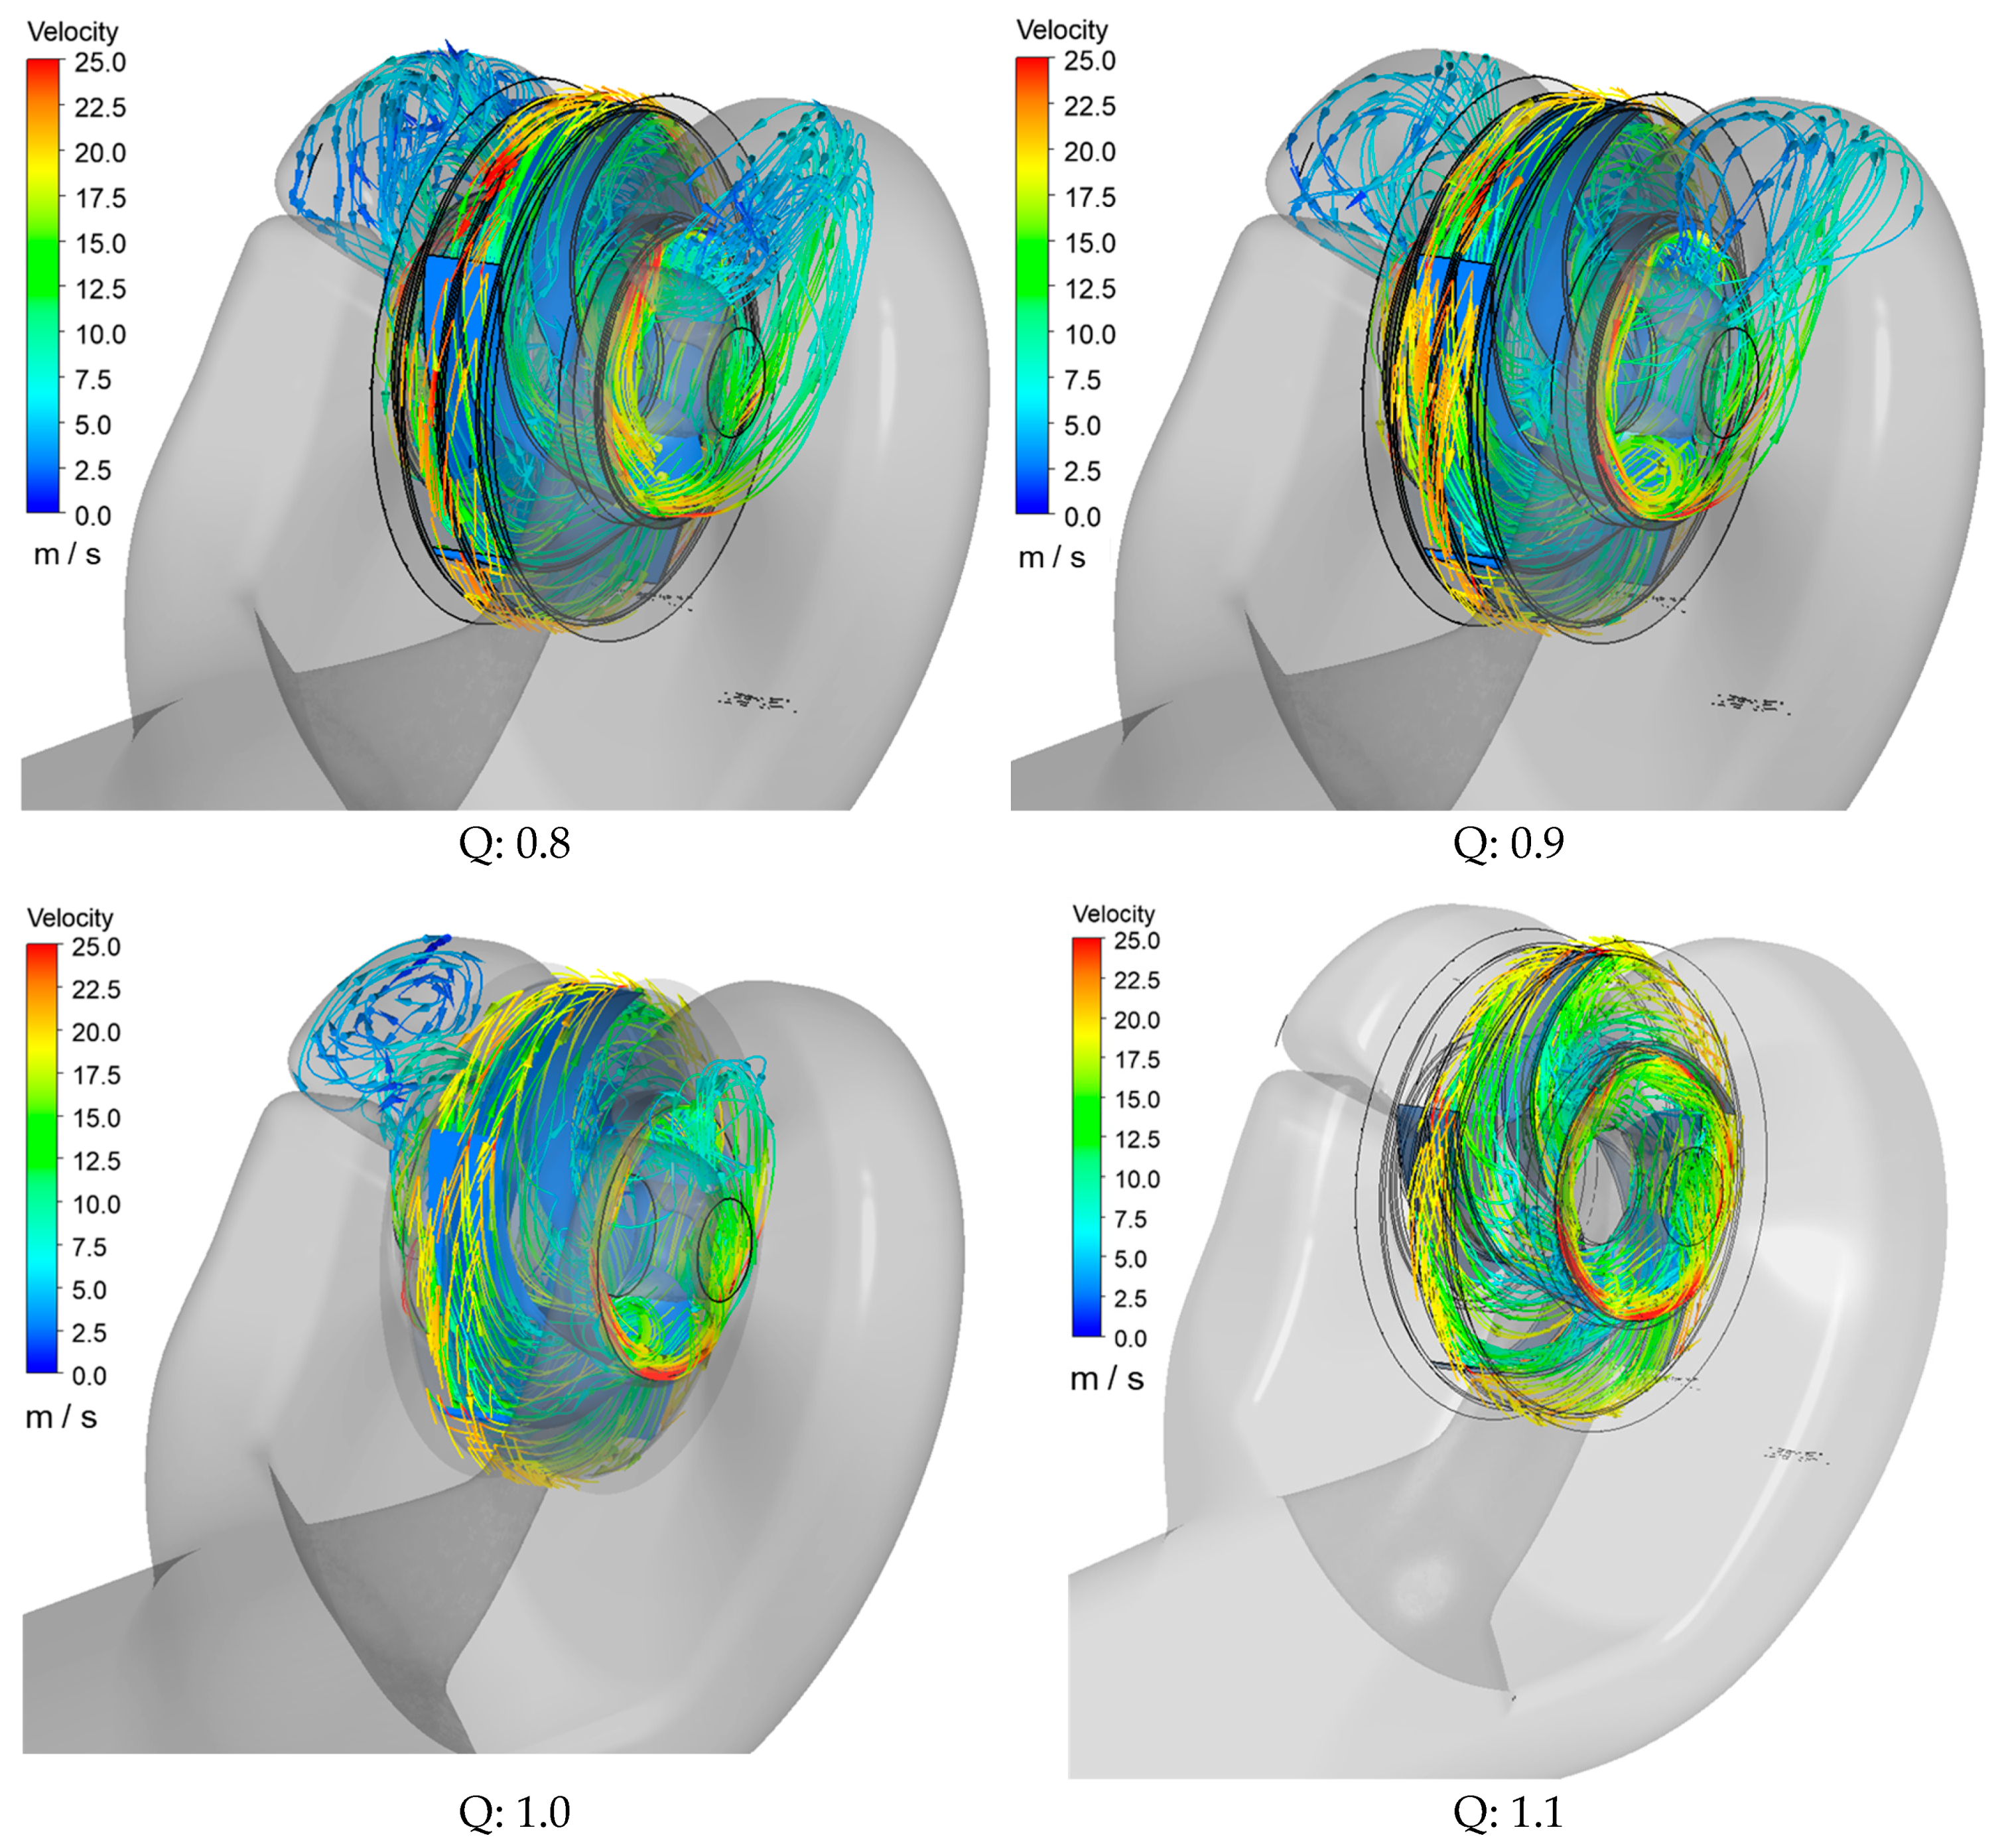
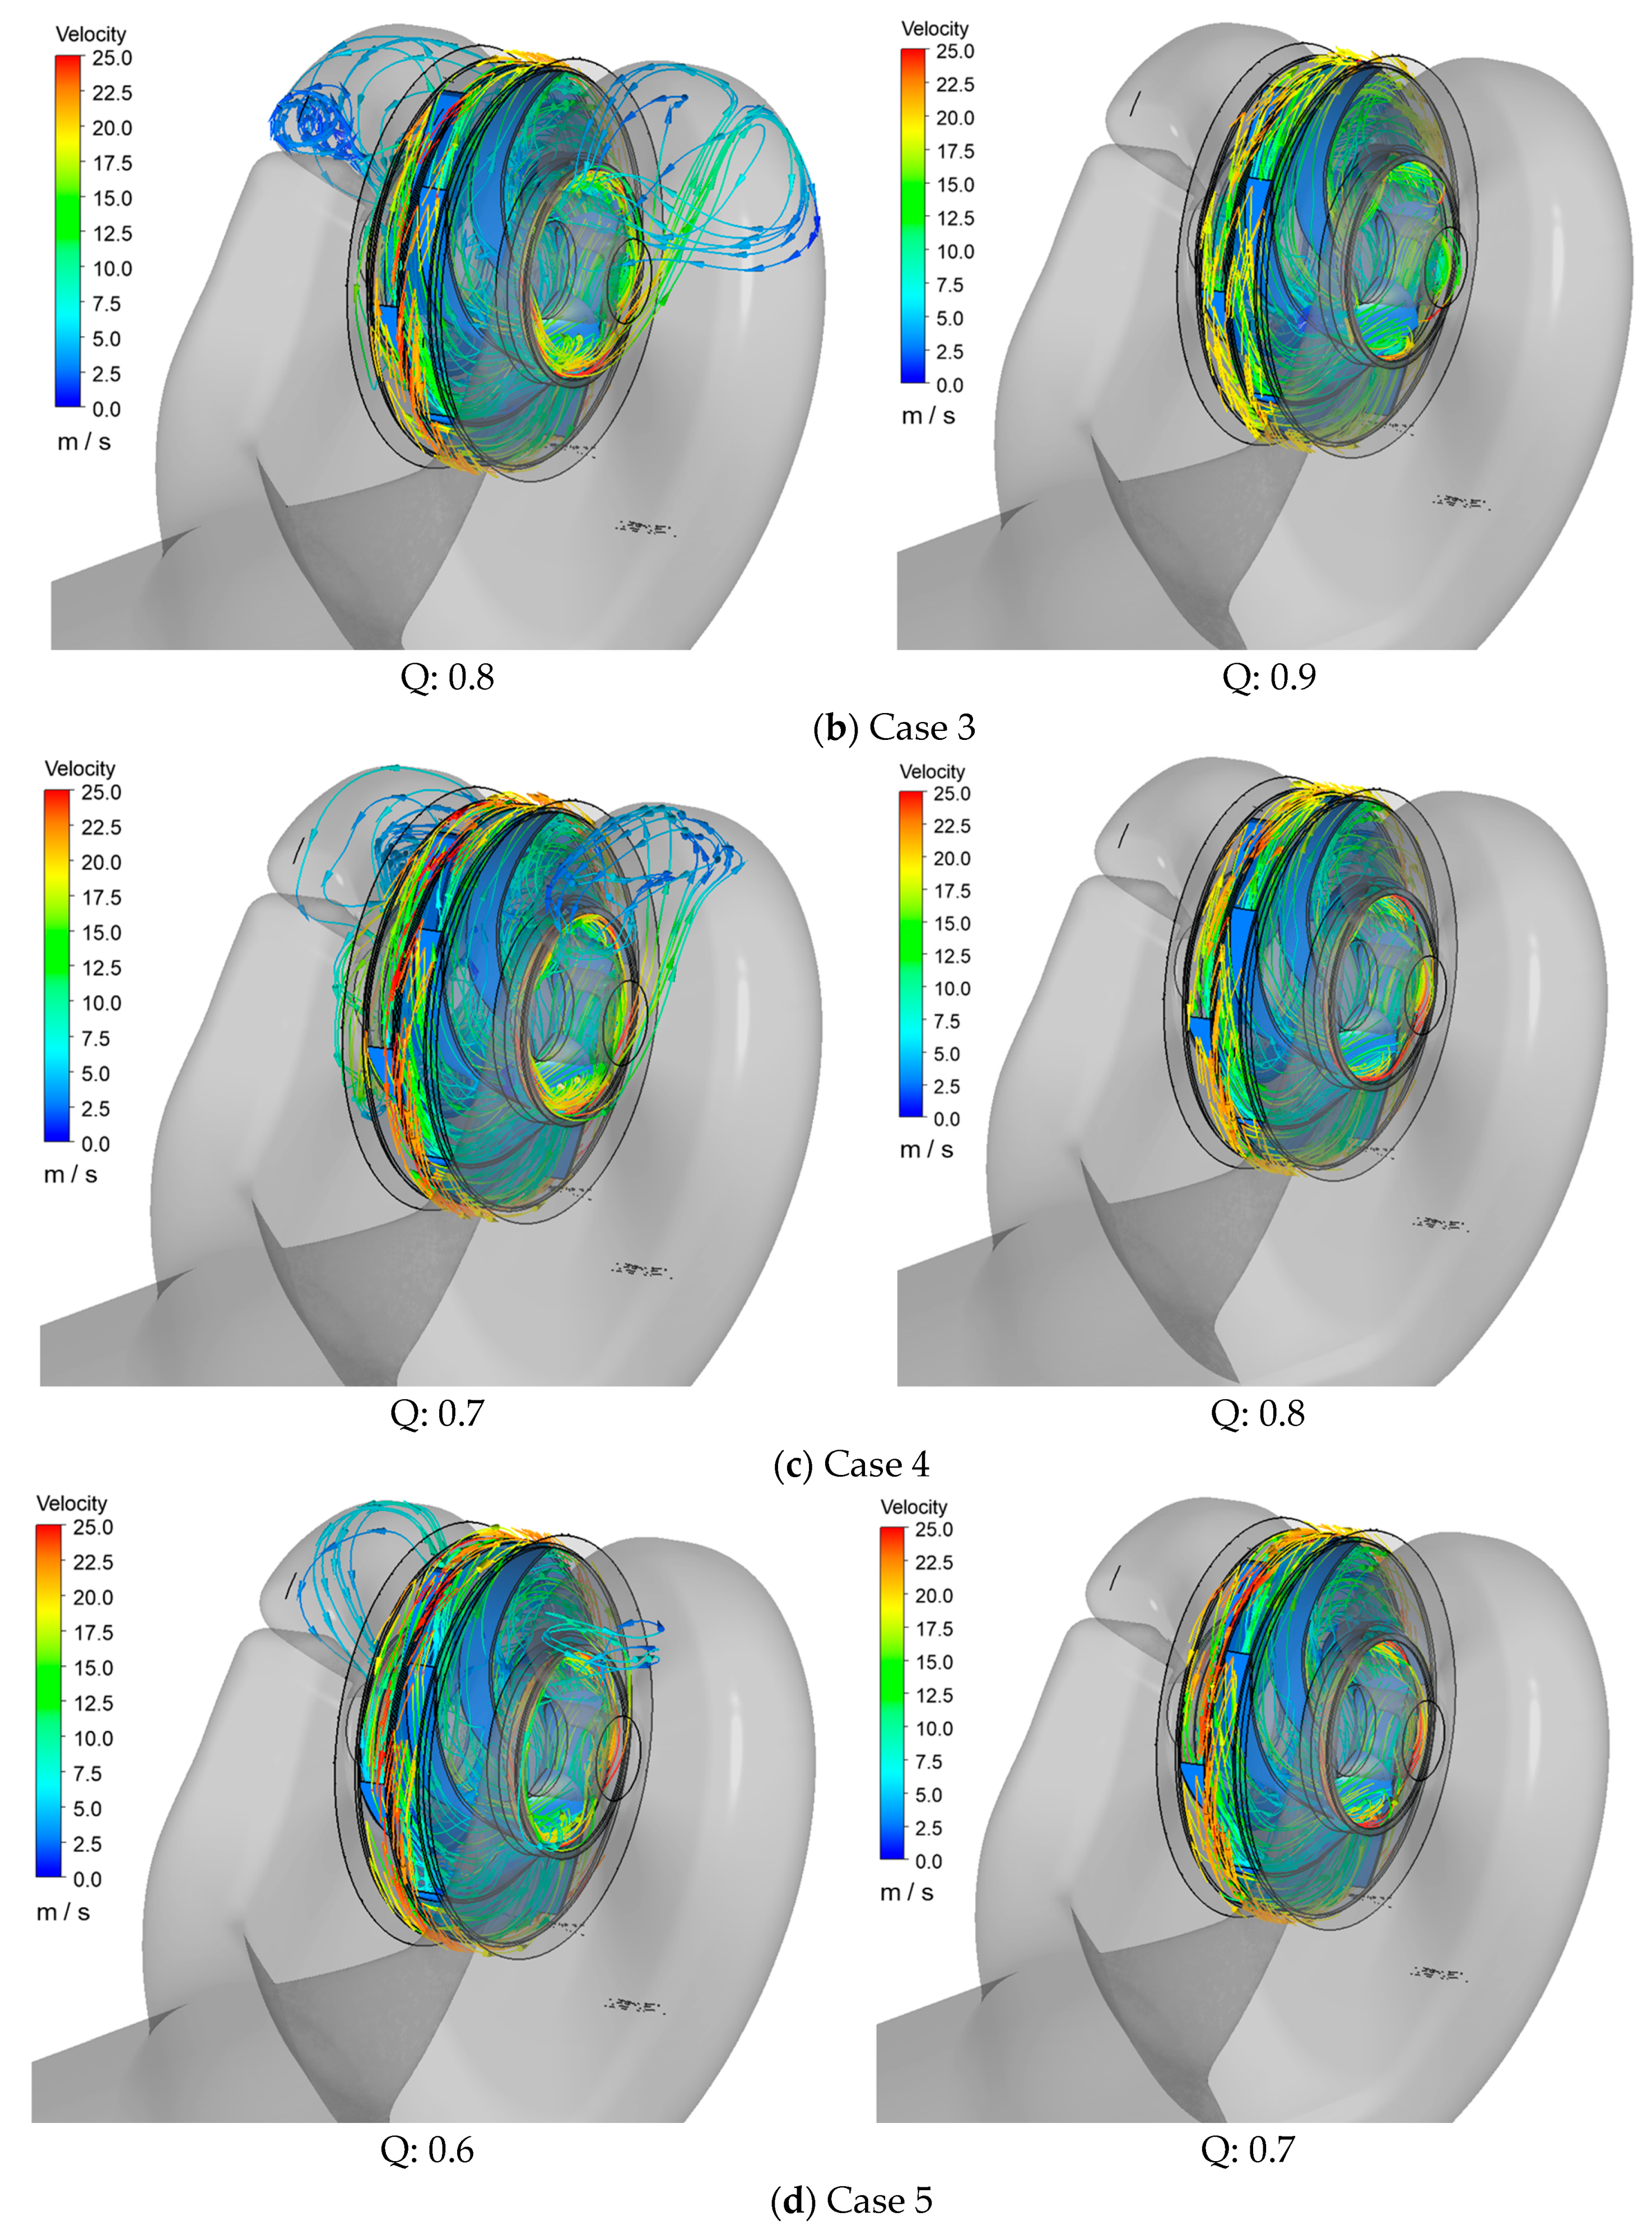
4.2. Suction Recirculation Analysis
5. Conclusions
Author Contributions
Funding
Data Availability Statement
Conflicts of Interest
Nomenclature
| Abbreviation | Description |
| AOR | Allowable Operating Region |
| BB | Between-Bearing |
| BEP | Best Efficiency Point |
| CFD | Computational Fluid Dynamics |
| LE | Leading Edge |
| NPSH | Net Positive Suction Head |
| OH | Overhung |
| POR | Preferred Operating Region |
| RANS | Reynolds-Averaged Navier–Stokes |
| SST | Shear Stress Transport |
| VPF | Vane-Passing Frequency |
| Parameter | Description |
| d1a | Shroud diameter and eye diameter (mm) |
| dn | Hub diameter (mm) |
| fq | Impeller eyes per impeller: single entry fq = 1; double entry fq = 2 |
| kn | Blockage caused by hub: kn = 1 − dn2/d12 |
| n | Rotational speed (rpm) |
| Q | Volumetric flow rate, flow (m3/h) |
| QE | Flow rate through axial-thrust-balancing device (m3/h) |
| Qh | Flow rate through auxiliaries (m3/h) |
| Qla | Total flow rate through impeller: QLa = Q + Qsp + QE + Qh = Q/ηv (m3/h) |
| Qsp | Leakage flow rate through seal at impeller inlet (m3/h) |
| α1 | Angle between directions of circumferential and absolute velocity, 1: impeller blade’s leading edge (o) |
| β1 | Angle between relative velocity vector and the negative direction of circumferential velocity, 1: impeller blade’s leading edge (o) |
| ηv | Volumetric efficiency (%) |
| Impeller’s outer diameter [mm] | |
| Impeller outer diameter tip speed, (m/s) | |
| The values computed using a Stepanoff chart [34] | |
| H | Head, (m) |
| Gravitational acceleration () | |
| Liquid density () |
References
- API610; Centrifugal Pumps for Petroleum, Petrochemical and Natural Gas Industries. 6.9 Dynamics, Table 8 Vibration Limits for Overhung and Between-Bearing Pumps. American Petroleum Institute: Washington, DC, USA, 2010.
- Wu, D.; Ren, Y.; Mou, J.; Gu, Y. Investigation of the correlation between noise & vibration characteristics and unsteady flow in a circulator pump. J. Mech. Sci. Technol. 2017, 31, 2155–2166. [Google Scholar]
- Nelson, W.E. Pump vibrations. In Proceedings of the 9th International Pump Users Symposium; Turbomachinery Laboratories, Department of Mechanical Engineering, Texas A&M University: College Station, TX, USA, 1992. [Google Scholar]
- Fraser, W.H. Recirculation Centrifugal Pumps. In Proceedings of the 10th Turbomachinery Symposium; Turbomachinery Laboratories, Texas A&M University: College Station, TX, USA, 1981; pp. 95–100. [Google Scholar]
- Breugelmans, F.A.; Sen, M. Prerotation and Fluid Recirculation in the Suction Pipe of Contrifugal Pumps. In Proceedings of the 11th Turbomachinery Symposium; Turbomachinery Laboratories, Texas A&M University: College Station, TX, USA, 1982; pp. 165–180. [Google Scholar]
- Ashihara, K.; Goto, A.; Kamijo, K. Improvements of Inducer Inlet Backflow Characteristics Using 3-D Inverse Design Method. In Proceedings of the 38th AIAA/ASME/SAE/ASEE Joint Propulsion Conference & Exhibit, Indianapolis, IN, USA, 7–10 July 2002; AIAA: Reston, VA, USA, 2002; p. 4158. [Google Scholar]
- Mousmoulis, G.; Karlsen-Davies, N.; Aggidis, G.; Anagnostopoulos, I.; Papantonis, D. Experimental analysis of cavitation in a centrifugal pump using acoustic emission, vibration measurements and flow visualization. Eur. J. Mech.-B/Fluids 2019, 75, 300–311. [Google Scholar] [CrossRef]
- Nelson, W. Pump vibration analysis for the amateur. In Proceedings of the 4th International Pump Users Symposium; Turbomachinery Laboratories, Department of Mechanical Engineering, Texas A&M University: College Station, TX, USA, 1987. [Google Scholar]
- Kushwaha, T.N. CW pump fluid induced vibration troubleshooting methodology. Procedia Eng. 2016, 144, 274–282. [Google Scholar] [CrossRef][Green Version]
- Yamanishi, N.; Fukao, S.; Qiao, X.; Kato, C.; Tsujimoto, Y. LES Simulation of Backflow Vortex Structure at the Inlet of an Inducer. ASME J. Fluids Eng. 2007, 129, 587–594. [Google Scholar] [CrossRef]
- Kang, D.; Yonezawa, K.; Ueda, T.; Yamanishi, N.; Kato, C.; Tsujimoto, Y. Large Eddy Simulation of the Dynamic Response of an Inducer to Flow Rate Fluctuations. Int. J. Fluid Mach. Syst. 2009, 2, 431–438. [Google Scholar] [CrossRef][Green Version]
- Shim, H.-S.; Kim, K.-Y.; Choi, Y.-S. Three-objective optimization of a centrifugal pump to reduce flow recirculation and cavitation. J. Fluids Eng. 2018, 140, 091202. [Google Scholar] [CrossRef]
- Capurso, T.; Bergamini, L.; Torresi, M. Design and CFD performance analysis of a novel impeller for double suction centrifugal pumps. Nucl. Eng. Des. 2019, 34, 155–166. [Google Scholar] [CrossRef]
- Yao, Z.; Wang, F.; Qu, L.; Xiao, R.; He, C.; Wang, M. Experimental investigation of time-frequency characteristics of pressure fluctuations in a double-suction centrifugal pump. J. Fluids Eng. 2011, 133, 101303. [Google Scholar] [CrossRef]
- Wang, Z.; Qian, Z.; Lu, J.; Wu, P. Effects of flow rate and rotational speed on pressure fluctuations in a double-suction centrifugal pump. Energy 2019, 170, 212–227. [Google Scholar] [CrossRef]
- Hatano, S.; Kang, D.; Kagawa, S.; Nohmi, M.; Yokota, K. Study of cavitation instabilities in double-suction centrifugal pump. Int. J. Fluid Mach. Syst. 2014, 7, 94–100. [Google Scholar] [CrossRef]
- Matlakala, M.E.; Kallon, D.V.V.; Mogapi, K.E.; Mabelane, I.M.; Makgopa, D.M. Influence of Impeller Diameter on the Performance of Centrifugal pumps. IOP Conf. Ser. Mater. Sci. Eng. 2019, 655, 012009. [Google Scholar] [CrossRef]
- Al-Obaidi, A.; Qubian, A. Effect of outlet impeller diameter on performance prediction of centrifugal pump under single-phase and cavitation flow conditions. Int. J. Nonlinear Sci. Numer. Simul. 2022, 23, 1203–1229. [Google Scholar] [CrossRef]
- Shi, W.; Zhou, L.; Lu, W.; Pei, B.; Lang, T. Numerical prediction and performance experiment in a deep-well centrifugal pump with different impeller outlet width. Chin. J. Mech. Eng. 2013, 26, 46–52. [Google Scholar] [CrossRef]
- Reddy, S.T.C.; Ramana Murty, G.V.; Prasad, M.V.S.S.S.M.; Reddy, D.N. Experimental studies on the effect of impeller width on centrifugal compressor stage performance with low solidity vaned diffusers. Proc. Inst. Mech. Eng. Part A J. Power Energy 2007, 221, 519–533. [Google Scholar] [CrossRef]
- Tan, M.G.; Liu, H.L.; Yuan, S.Q.; Wang, Y.; Wang, K. Effects of blade outlet width on flow field and characteristic of centrifugal pumps. In Proceedings of the ASME Fluids Engineering Division Summer Conference, Vail, CO, USA, 2–6 August 2009; pp. 51–60. [Google Scholar]
- Zhu, D.; Tao, R.; Xiao, R. Anti-cavitation design of the symmetric leading-edge shape of mixed-flow pump impeller blades. Symmetry 2019, 11, 46. [Google Scholar] [CrossRef]
- Sano, T.; Iino, M.; Maeda, S. Effect of Leading Edge Profile on Cavitation Performance of Mixed Flow Impeller. J. Phys. Conf. Ser. 2021, 1909, 012018. [Google Scholar] [CrossRef]
- Balasubramanian, R.; Bradshaw, S.; Sabini, E. Influence of impeller leading edge profiles on cavitation and suction performance. In Proceedings of the Middle East Turbomachinery Symposia—2013 Proceedings, Doha, Qatar, 17–20 March 2013; Turbomachinery Laboratory, Texas A&M Engineering Experiment Station: College Station, TX, USA, 2013. [Google Scholar]
- Dönmez, A.H.; Yumurtacı, Z.; Kavurmacıoğlu, L. Influence of Inlet Vane and Wrap Angles on Cavitation Behavior of a Centrifugal Pump. J. Appl. Fluid Mech. 2023, 16, 519–531. [Google Scholar]
- Luo, X.; Zhang, Y.; Peng, J.; Xu, H.; Yu, W. Impeller inlet geometry effect on performance improvement for centrifugal pumps. J. Mech. Sci. Technol. 2008, 22, 1971–1976. [Google Scholar] [CrossRef]
- Shukla, S.N.; Kshirsagar, J. Numerical prediction of cavitation in model pump. In Proceedings of the ASME International Mechanical Engineering Congress and Exposition, Boston, MA, USA, 31 October–6 November 2008; Volume 48739. [Google Scholar]
- Ceyrowsky, T.; Hildebrandt, A.; Schwarze, R. Numerical investigation of the circumferential pressure distortion induced by a centrifugal compressor’s external volute. In Proceedings of the Turbo Expo 2018: Turbomachinery Technical Conference & Exposition, Oslo, Norway, 11–15 June 2018. ASME paper GT2018-75919. [Google Scholar]
- Cravero, C.; Marsano, D.; Sishtla, V.; Halbe, C.; Cousins, W.T. Numerical investigations of near surge operating conditions in a two-stage radial compressor with refrigerant gas. J. Eng. Gas Turbines Power 2024, 146, 021010. [Google Scholar] [CrossRef]
- Li, L.; Xu, W.; Tan, Y.; Yang, Y.; Yang, J.; Tan, D. Fluid-induced vibration evolution mechanism of multiphase free sink vortex and the multi-source vibration sensing method. Mech. Syst. Signal Process. 2023, 189, 110058. [Google Scholar] [CrossRef]
- Xia, L.; Zou, Z.J.; Wang, Z.H.; Zou, L.; Gao, H. Surrogate model based uncertainty quantification of CFD simulations of the viscous flow around a ship advancing in shallow water. Ocean Eng. 2021, 234, 109206. [Google Scholar] [CrossRef]
- Cravero, C.; De Domenico, D.; Marsano, D. Uncertainty Quantification Analysis of Exhaust Gas Plume in a Crosswind. Energies 2023, 16, 3549. [Google Scholar] [CrossRef]
- Gülich, J.F. Centrifugal Pumps, 3rd ed.; Springer: Berlin, Germany, 2014; pp. 375–396. ISBN 978-3-642-40114-5. [Google Scholar]
- Stepanoff, A.J. Centrifugal and Axial Flow Pumps. Theory, Design, and Application; John Wiley & Sons Inc.: New York, NY, USA, 1957. [Google Scholar]
- Menter, F.R. Two-equation eddy-viscosity turbulence models for engineering applications. AIAA J. 1994, 32, 1598–1605. [Google Scholar] [CrossRef]
- Bardina, J.E.P.G.; Huang, P.; Coakley, T.; Bardina, J.; Huang, P.; Coakley, T. Turbulence modeling validation. In Proceedings of the 28th Fluid Dynamics Conference, Snowmass Village, CO, USA, 29 June–2 July 1997; p. 2121. [Google Scholar]
- Shim, H.S.; Afzal, A.; Kim, K.Y.; Jeong, H.S. Three-Objective Optimization of a Centrifugal Pump with Double Volute to Minimize Radial Thrust at Off-Design Conditions. Proc. Inst. Mech. Eng. Part A J. Power Energy 2016, 236, 598–615. [Google Scholar] [CrossRef]
- Wang, Y.; Liu, H.; Yuan, S.; Tan, M.; Shu, M. Applicability of turbulence models on characteristics prediction of centrifugal pumps. In Proceedings of the Fluids Engineering Division Summer Meeting, Reno, NE, USA, 8–11 January 2011; Volume 44403, pp. 1295–1301. [Google Scholar]
- Wang, S.; Tan, J.; Yu, Z. Comparison and experimental validation of turbulence models for an axial flow blood pump. J. Mech. Med. Biol. 2019, 19, 1940063. [Google Scholar] [CrossRef]
- Osman, F.K.; Zhang, J.; Lai, L.; Kwarteng, A.A. Effects of turbulence models on flow characteristics of a vertical fire pump. J. Appl. Fluid Mech. 2022, 15, 1661–1674. [Google Scholar]
- Zhou, L.; Bai, L.; Li, W.; Shi, W.; Wang, C. PIV validation of different turbulence models used for numerical simulation of a centrifugal pump diffuser. Eng. Comput. 2018, 35, 2–17. [Google Scholar] [CrossRef]
- ANSYS CFD-Post User Guide; Release 2021R2; ANSYS Inc.: Canonsburg, PA, USA, 2021; pp. 373–407.


| d1a Decrease Ratio | d1a [mm] | d1i [mm] | d1a/d1i | |
|---|---|---|---|---|
| Case 1 | 1.00 | 586.0 | 266.6 | 2.20 |
| Case 2 | 0.97 | 566.0 | 2.12 | |
| Case 3 | 0.94 | 548.0 | 2.06 | |
| Case 4 | 0.91 | 534.0 | 2.00 | |
| Case 5 | 0.88 | 514.0 | 1.93 |
| Material | Water 25 [°C] (997.0 [kg/m3]) |
| Heat Transfer | None |
| Reference Pressure | 1.0 [atm] |
| Turbulence | Shear Stress Transport (SST) |
| Rotation Speed | 710 [rpm] |
| Inlet | 0 [Pa] |
| Outlet | Mass flow rate [kg/s] |
| Walls | No Slip |
| Part | Mesh Type | Number of Nodes |
|---|---|---|
| Suction | Tetra-Prism | 2,720,313 |
| Impeller (10ea) | Hexahedral | 6,641,940 |
| Wear-ring | Hexahedral | 2,880,960 |
| Volute | Tetra-Prism | 447,787 |
| Total | - | 12,691,000 |
Disclaimer/Publisher’s Note: The statements, opinions and data contained in all publications are solely those of the individual author(s) and contributor(s) and not of MDPI and/or the editor(s). MDPI and/or the editor(s) disclaim responsibility for any injury to people or property resulting from any ideas, methods, instructions or products referred to in the content. |
© 2024 by the authors. Licensee MDPI, Basel, Switzerland. This article is an open access article distributed under the terms and conditions of the Creative Commons Attribution (CC BY) license (https://creativecommons.org/licenses/by/4.0/).
Share and Cite
Jang, H.; Suh, J. Flow Characteristic Analysis of the Impeller Inlet Diameter in a Double-Suction Pump. Energies 2024, 17, 1989. https://doi.org/10.3390/en17091989
Jang H, Suh J. Flow Characteristic Analysis of the Impeller Inlet Diameter in a Double-Suction Pump. Energies. 2024; 17(9):1989. https://doi.org/10.3390/en17091989
Chicago/Turabian StyleJang, Hyunjun, and Junho Suh. 2024. "Flow Characteristic Analysis of the Impeller Inlet Diameter in a Double-Suction Pump" Energies 17, no. 9: 1989. https://doi.org/10.3390/en17091989
APA StyleJang, H., & Suh, J. (2024). Flow Characteristic Analysis of the Impeller Inlet Diameter in a Double-Suction Pump. Energies, 17(9), 1989. https://doi.org/10.3390/en17091989