Abstract
Many onshore oil fields currently adopt water flooding as a means to supplement reservoir energy. However, due to reservoir heterogeneity, significant differences in permeability exist not only between different reservoirs but also within the same reservoir across different planar orientations. After prolonged fluid flushing in the near-wellbore zone of injection wells, the resulting increased flow resistance between layers exacerbates inefficient and ineffective circulation. A considerable amount of remaining oil is left unexploited in untouched areas, significantly impacting the overall recovery. To investigate the multiscale plugging mechanisms of fracture-dominated pore channels in high-water-cut oil reservoirs and achieve efficient management of fractured large channels, this study explores the formation of the fracture-flushing zone-low saturation oil zone. A physical experimental model with fractures and high-intensity flushing is established to analyze changes in pore structure, mineral composition, residual oil distribution, and other characteristics at different positions near the fractures. The research aims to clarify the mechanism behind the formation of large channels with fracture structures. The results indicate that under high-intensity water flushing, cementing materials are washed away by the flowing water, clay particles are carried to the surface with the injected fluid, and permeability significantly increases, forming high-permeability zones with fracture structures. In the rock interior away from the fracture end, channels, corners, and clustered oil content noticeably decrease, while the content of film-like oil substantially increases, and clay minerals are not significantly washed away. Under strong flushing conditions, the number of residual clay particles near the fracture end is mainly influenced by flow velocity and flushing time; thus, the greater the flushing intensity, the faster the water flow, and the longer the flushing time, the fewer residual clay particles near the fracture end.
1. Introduction
After prolonged development of water-flooded oilfields, injecting water near the wellbore area can easily lead to the formation of relatively complex high-permeability zones. Particularly, following extended water flooding, differences in the structure and saturation levels of fractures and surrounding pore channels (dominant fluid flow pathways within the reservoir) can establish dominant flow pathways, significantly impacting the development efficiency of water flooding [1,2,3,4,5,6,7,8]. Through research, scholars have primarily focused on the formation, distribution status, and identification methods of large channels within actual formations. However, there has been a lack of further investigation into the mechanisms behind their formation, and a clear classification of large channels primarily dominated by fractures has not been established [9,10,11,12,13,14,15].
The current research on large channels can be traced back to the 1950s. In the United States, well-to-well tracer technology was employed to study the heterogeneity of reservoirs, which used tracer curves to invert corresponding logging features of the reservoir. Curve characteristics were utilized to calculate the variations in permeability, thereby reflecting the thickness and depth positions of high-permeability layers in the formation. In summary, early research on large channels primarily relied on logging methods to explore and calculate reservoirs, drawing conclusions based on exploration results [10,16,17]. Brigham et al. [18] utilized well-to-well tracer technology to describe the reservoir’s heterogeneity, obtaining logging features of small layers through tracers and predicting changes in permeability to identify high-permeability zones within the layers. In 1966, Thomas M. Garland [19] proposed selecting injection wells during profile control to avoid damage to the formation. In 1973, Vatkins and Y.P. Richard [20] suggested two more precise methods for identifying large channels: using water-absorption profile data combined with production logging data and combining porosity gamma-ray logging data with injection volume data. In 1987, K.S. Chan [21] established a material balance equation for particle transport, incorporating different sedimentation and release rates, forming a complete model for particle transport. This laid the theoretical foundation for the identification mechanism of dominant flow pathways.
Furthermore, some experts and scholars have not only conducted research on the identification of dominant flow pathways but have also expanded their research focus to the study of inter-well connectivity. The study of inter-well connectivity is based on the concept of system analysis, which utilizes production dynamic data and combining geological statistical foundations to evaluate inter-well connectivity [22]. In 2005, Yousef AA [23] established a novel volumetric model for inferring inter-well connectivity that considers compressibility and conduction effects. This method has three advantages: it can be applied to wells that have been shut in or have been producing for an extended period; it is suitable for regions producing primarily residual oil; and it can be combined with bottomhole pressure data to enhance the understanding of inter-well connectivity.
In terms of quantifying dominant flow pathways, researchers have also conducted studies. In 1979, Felsenthal [24], building on planar radial flow, treated injection wells and production wells as sources and sinks of fluid flow, respectively, to establish a simple model for calculating high-permeability zones. In 1983, Maghsood Abbaszadeh-Dehghani [10] used inter-well tracer methods to invert bottom-layer parameters for identifying dominant flow pathways. In 2009, C.S. Kabir [25] proposed an improved Hall curve method to identify dominant flow pathways and quantitatively calculate parameters such as pore radius, permeability, effective thickness, and more. In 2010, Shawket Ghedan et al. [26], through a study on a fan-shaped model of heterogeneous carbonate reservoirs, determined the impact of varying reservoir heterogeneity parameters on the formation of dominant channels, including parameters such as horizontal permeability and thickness. The study also explored the effect of gravity on leakage. In 2012, Saeid Sadeghnejad [27] used flow theory to quantify connectivity between injection and production wells in such systems, considering hydraulic conductivity and breakthrough time behavior. The study considered a three-dimensional overlapping sand body model and validated the permeation method based on the Burgn offshore reservoir dataset. Compared to computer-calculated results, this method demonstrated good application effectiveness. In 2016, Ding S.W. [28] proposed a model based on reservoir information for each grid, utilizing automatic history matching and fuzzy methods to determine the depth and parameters of different regions in the reservoir.
At present, the identification methods of large pores can be divided into four categories: inter-well tracer monitoring method, well test method, logging data interpretation method, and reservoir engineering synthesis method [29,30,31]. Inter-well tracer monitoring method is to inject tracer from the well, then monitor whether the produced liquid contains tracer, and draw a curve according to the tracer production concentration and time and use the result curve given by the tracer to analyze the underground reservoir parameters more carefully. The well test method reflects the development of large pores through the changes in pressure and production parameters, and can predict whether there are large pores in the formation through the changes. Log interpretation data method is used to determine whether there is a large hole by logging methods, without complicated calculation or numerical simulation. Based on relevant logging data and logging curve waterlogging characteristics, formation development can be predicted. Reservoir engineering synthesis method is to combine mathematical model, laboratory experiment, and field data, analyze these data comprehensively to judge whether there are large pores in the formation, and calculate the characteristic parameters of large pores [32]. In conclusion, the inter-well tracer monitoring method has the advantage of relatively accurately determining the direction of large channels. However, this method involves complex on-site processes, high costs, and substantial workload. The logging interpretation data method can determine the development of large channels at different periods, and it is relatively simple to apply. Nevertheless, this method is influenced by factors such as geological conditions, construction techniques, and logging instruments, resulting in ambiguity and uncertainty in the interpretation results. Reservoir engineering methods involve multiple factors, exhibit ambiguity, and most existing data focus on large channel identification methods related to reservoirs, lacking mechanistic analysis of laboratory-based physical models. Further analysis of the characteristics of large channels is necessary.
Therefore, in order to understand the development effect of fractured large channels after water drive development and analyze the formation mechanism of fracture-erosion zone-low saturation oil zone in injection wells of high-water-cut reservoirs, this paper establishes a high-intensity water drive erosion experimental model with fractures. By means of scanning electron microscope, X-ray diffractometer, and constant velocity mercury injection instrument, the variation characteristics of mineral composition, pore structure, and microscopic pore characteristics at different locations under strong scour conditions were analyzed so as to clarify the formation mechanism of fracture-scour zone and low-saturation zone in high-water reservoir, and provide theoretical basis for subsequent efficient treatment.
2. Materials and Methods
2.1. Materials
The experimental materials include the following: Berea sandstone cores (with a permeability of 500 × 10−3 μm2), crude oil (from the Daqing Oilfield South Block, Daqing, China), kerosene, xylene, distilled water, sodium chloride, potassium chloride, calcium chloride, sodium carbonate, sodium bicarbonate, and sodium sulfate.
Prior to the experiment, Berea sandstone cores with a permeability of 500 × 10−3 μm2 were selected. Using a core-cutting machine, the cores were cut into two blocks with dimensions of 15 cm in length and 4.5 cm in height. The dry weight of the cores was measured using a balance. Subsequently, the cores were vacuum-saturated with formation water using a vacuum pump, followed by oil saturation simulation using a cubic core holder. Finally, the cores were removed, and the rock specifications were adjusted using the core-cutting machine.
2.2. Experimental Apparatus and Methods
2.2.1. High Intensity Water Drive Core Scour Facility
An experimental model of fractured high-intensity water flooding was established to analyze the change in characteristics of pore structure, mineral composition, and remaining oil distribution at different locations near fractures. The experimental process is shown in Figure 1.
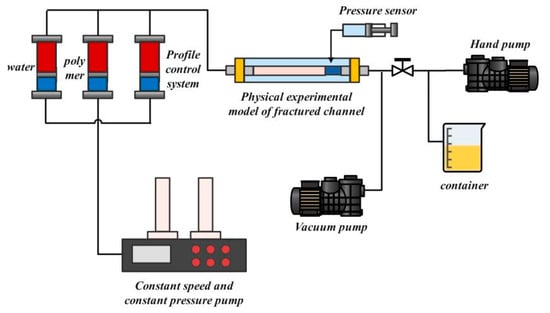
Figure 1.
Flow chart of high strength erosion core experiment.
The experiment equipment included a fractured pore channel simulation device, a cuboid core holder, a vacuum pump, a core-cutting machine, ASPE-730 Automatic Pore Structure Tester (constant-rate mercury injection apparatus), the instruments purchased from Beijing Bida Xingye Technology Development Co., Ltd. (Beijing, China) X-ray diffractometer, fluorescence microscope, scanning electron microscope, gas permeameter, balance, ISCO pump, among others.
In the high-strength scour core experiment with cracks, the core was split from the middle by the core splitting device, the cut core was fitted into the core holder, and it was sealed well, and the overlying rock pressure was set at 10 MPa (simulating the actual overlying rock pressure). The 50 PV simulated formation water was displaced at a high flow rate of 3 mL/min.
2.2.2. Pore Structure Types of Fractured Channels
The pore structure size and type of the core were observed by scanning electron microscopy. Before the scanning electron microscope test, the core after high intensity washing was cut by a cutting machine, and the core pieces of 5~10 mm were polished and sprayed with gold. The core sample was placed on a conductive adhesive and placed inside a scanning electron microscope instrument for observation.
2.2.3. Core Mineral Composition Analysis
The mineral composition and relative content of the rock were analyzed using X-ray diffraction (XRD) to determine the lithology of different regions within the fractured pore channels. After cutting the core into sections at different positions, some crushed samples were powdered and added to a glass slide circular groove. Another glass slide was used to compact the powder, ensuring a smooth surface. The XRD instrument was then activated and adjusted to analyze the mineral composition in the rock samples.
2.2.4. Microscopic Pore Size Distribution Characteristics of Fractured Channels
The crude oil inside the core was washed with xylene, and the mineral composition and pore structure of the core were observed by mercury injection at constant rate after treatment. In the constant velocity mercury injection experiment, the mercury injection was carried out at a rate of 0.00005 mL/s. The change in pore shape at the leading edge of mercury would cause the change in meniscus shape and lead to the change in capillary pressure in the system. In the experiment, the changes in pressure and the volume of mercury liquid were recorded constantly, and the data were used to analyze the core at different locations.
2.2.5. Residual Oil Observation Experiment
The core was taken out after the high intensity water drive core scour experiment, and the changes in remaining oil in the core at different positions were observed by fluorescence microscope.
A microscopic approach was employed to study the distribution of residual oil. The rock cores, subjected to high-intensity flushing, were cut into slices of approximately 5 mm at different positions. These slices were frozen, sealed, and stored for 24 h. Thin sections of 0.05 mm were prepared by polishing the slices, and the residual oil inside the rock cores was observed using a fluorescence microscope.
2.3. Numerical Simulations
2.3.1. Geometric Model
However, due to the limited experimental conditions, it was impossible to accurately describe the factors affecting the formation of fracture-scour zone and low-saturation zone in high-water reservoir. Using finite element simulation methods, fluid flow characteristics near the fracture tip were simulated, and the fluid flow and clay particle transport characteristics within the fracture-flushing zone and the flushing zone-low saturation zone were investigated. The simulation of the porous media and mesh division is illustrated in Figure 2.
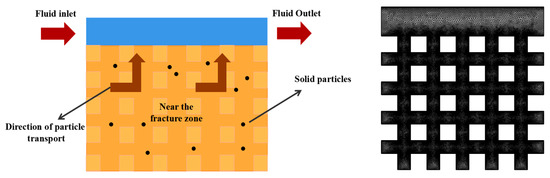
Figure 2.
Simulation using geometric models and mesh division results.
2.3.2. Theoretical Model
Considering the actual movement of fluids and clay particles within the fractures and flushing zones, the model accounts for the flow of fluids within the fractures, the carrying force of fluids on particles, and factors such as the gravity and buoyancy of clay particles. The specific model is as follows:
- (1)
- Flow of fluid within the fracture
During the sand flushing process, the flow of fluid within the fracture is generally laminar. The flow of fluid can be represented by Equations (1) and (2):
where P—the movable cemented clay microparticle diameter, m; F—the volume force exerted on the fluid, N/m3; —gravity acceleration, N/kg; —pressure of fluid inside the fracture, Pa; —temperature, K; —non-dimensional time; —fluid flow velocity within the fracture, m/s; ρ—fluid density, kg/m3; and μ—fluid viscosity, Pa·s.
- (2)
- The carrying force of fluid on particles
- (3)
- Inter-particle collision force.
Force of gravity and buoyancy acting on the particles:
where Fg—buoyancy acting on movable cemented clay microparticles, N; FG—gravity acting on movable cemented clay microparticles, N.
- (4)
- Initial conditions
Initial conditions for the fluid:
where —pressure caused by the gravitational effect on the fluid, Pa.
Initial conditions for particles:
- (5)
- Boundary conditions
Fluid at the crack surface:
where —fluid flow velocity at the wall position, m/s.
Rebound of movable cemented clay microparticles at the crack surface:
where —velocity of movable cemented clay microparticles, m/s; —velocity of movable cemented clay microparticles before colliding with the crack surface, m/s; and —number of collisions of movable cemented clay microparticles.
2.3.3. Boundary Condition
The flow velocity of the fluid under strong flushing conditions was set at 0.05 m/s, with pore throat size of 4 μm, rock particle size of 5 μm × 5 μm, model size of 50 μm × 50 μm, 500 clay particles, release time of 0 s, clay particle density of 2200 kg/m3, diameter of 2 μm, and the injected fluid is water with a density of 1000 kg/m3. The simulation time was set to 5000 μs with a time step of 1 μs.
3. Results and Discussion
3.1. Analysis of Microscopic Structural Characteristics of Near-Fracture Pore Channels
Six core samples from the strong flushing zone, low-saturation oil zone, and deep matrix zone were selected for microscopic structure observation. For rocks at different locations, the internal pore structure was observed through scanning electron microscopy (SEM). The observed pore types in the core samples were recorded, as shown in Table 1. Samples 1 and 2 belong to the core of strong erosion zone, samples 3 and 4 belong to the core of low saturation oil, and samples 5 and 6 belong to the core of matrix penetration zone.

Table 1.
Data table of pore parameters and pore types in core samples.
The changes in pore structure size and types of the core under the scanning electron microscope (SEM) are shown in Figure 3. By observing with SEM, the pore size of the core can be roughly inferred. The micro-pore structure inside the rock will undergo significant changes under different flushing conditions. A comparison of each core sample allows observation of different positions within the core.
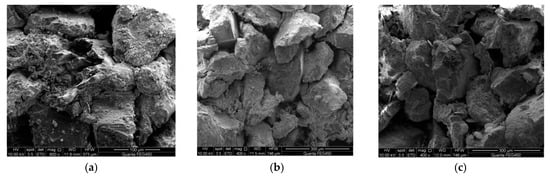
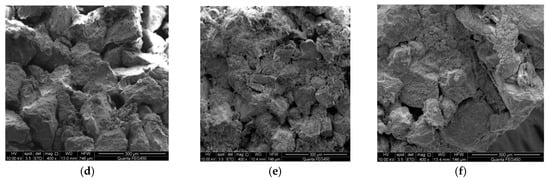
Figure 3.
Microscopic pore structure of rock at different positions. (a) 1#: 0.5 cm from the fracture; (b) 2#: 1.5 cm from the fracture; (c) 3#: 2.5 cm from the fracture; (d) 4#: 3.5 cm from the fracture; (e) 5#: Matrix rock; (f) 6#: Matrix rock.
Comparing sample 1# with samples 5# and 6#, it is evident that the cement content of the rock in the near-fracture area significantly decreases due to the influence of fluid flushing. This indicates that although there is a fracture structure in the formation, the cementation of the rock near the fracture is washed away and carried by the high-intensity water drive flushing. The gaps between rock particles increase, causing clay particles to move with the injected fluid, forming a high-permeability zone centered around the fracture. Comparing rock samples 1# to 4#, it is observed that the closer to the fracture, the stronger the flushing effect. This is because the fluid in the near-fracture area is less affected by the flow resistance, and as the fluid passes through the fracture, it also extends to the surrounding area. This leads to a larger displacement of the fluid near the fracture end, resulting in a stronger flushing effect on the matrix.
In summary, during the water flooding process, clay minerals undergo physical and chemical reactions due to differences in acidity and alkalinity between the injected water and formation water. Eventually, they decompose, and the partially decomposed clay mineral fragments are transported to the surface with the injected water, leading to a reduction in the total amount of clay minerals. To verify this hypothesis, rocks from different locations were selected, and their mineral composition changes were analyzed using X-ray diffraction. The X-ray diffraction patterns for rocks from different locations are shown in Figure 4. Additionally, based on the X-ray diffraction patterns, the mineral compositions of rocks at different locations were analyzed, and the results are presented in Table 2.
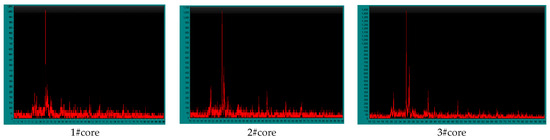
Figure 4.
The X-ray diffraction patterns of cores from different locations.
Table 2.
Mineral composition of cores from different locations.
According to Table 2, it can be observed that the clay mineral content in sample 1# is relatively low, at 19.4%; and the content of quartz and calcite is higher, both above 30%. In sample 2#, the clay mineral content is 23%, significantly higher than in 1#, while the content of quartz and calcite is notably lower. This indicates that the clay minerals, mainly composed of cementitious materials, have been severely flushed in the near-fracture area. Comparing with sample 3#, the clay mineral content is even higher, indicating that the closer to the fracture, the more severe the flushing effect. As the clay on the pore walls is peeled off and transported with the injected fluid, some throats are transformed into pores, further increasing the throat diameter of the pores in the water flow channel, shortening the flow path, and leading to a decrease in tortuosity and an increase in permeability.
3.2. Analysis of Microscopic Pore Size Distribution Characteristics of Fractured Pore Channels
The loss of clay minerals can lead to significant changes in the pore structure and pore throat size of rocks within the formation. Therefore, the use of constant-rate mercury injection experiments was employed to analyze the variation patterns in pore structure at different locations in the rock cores. Based on the constant-rate mercury injection results, curves depicting pore throat radius against the frequency of pore throat distribution were plotted, as shown in Figure 5.
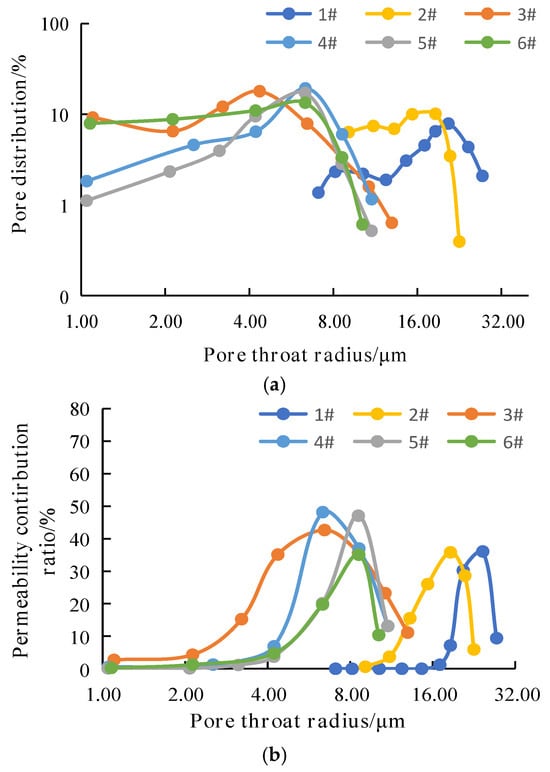
Figure 5.
Mercury injection results of the rock core. (a) Curve of pore throat radius distribution frequency; (b) Curve of pore throat radius contribution to permeability.
The results from Figure 5 reveal that the permeability of rock cores 1# to 6# varies, and there are significant differences in pore radius distribution. For rock cores with lower permeability, the pore radius distribution tends to concentrate in the low-value zone, with a narrow spread range and a higher peak in the curve. Conversely, for higher permeability rock cores, the pore radius distribution extends towards the high-value zone, with a wider spread range and a lower peak in the curve.
It is evident that the pore radius constrains the permeability of the rock core. Rock cores with smaller permeability exhibit symmetric shapes in the contribution rate curve. Different pore radii significantly impact the permeability, with a higher permeability resulting in a wider span in the contribution rate curve, and the peak shifts towards the high-value zone.
Further analysis of the pore structure variations in different locations of the rock cores is presented in Table 3. From Table 3, it can be observed that the permeability, porosity, and average pore radius of the rock cores at different distances from the fracture edge have undergone significant changes. As the distance from the fracture edge decreases, parameters such as permeability, porosity, and average pore radius of the rock increase significantly. The reason for this phenomenon is that the rock framework of the reservoir is damaged under the prolonged scouring effect of injected water. Previously, the weak points with relatively fragile particle support were opened up, leading to an increase in the number of large channels and improved connectivity. At a distance of 0.5 cm from the fracture, the permeability of the rock core can reach 2533.24 × 10−3 μm2, porosity can reach 33.77%, and the average pore radius is 20.32 μm. This indicates that after a long period of water flooding development, the properties of the matrix rock near the fracture in the formation will also undergo changes, significantly increasing the permeability, forming a high-permeability zone with a fractured structure. However, when the distance from the fracture reaches 2.5 cm, the permeability, porosity, and pore radius of the rock show no significant changes compared to the matrix rock. This suggests that, influenced by factors such as injection intensity, the area of the high-permeability zone is limited. After the formation of large channels, the supporting part of the rock framework particles is mostly destroyed, resulting in a huge difference in pore sizes.
Table 3.
Constant-speed mercury injection experiment data.
3.3. Residual Oil Characteristics Analysis in Rock under Strong Jetting State
According to the study in Section 3.1, under strong jetting conditions, the clay minerals cemented in the rock within the formation are severely flushed, and fine particles are easily carried away by the strong entraining fluid. This leads to an increase in the pores of the rocks near the fracture. To further investigate the characteristics of the fracture-jetting zone and the low-saturation oil area in high-water-cut oil reservoirs, an analysis of the microscopic residual oil changes in the rock under strong jetting conditions was conducted. The appearance of the rock cores at different distances from the fracture was observed, as shown in Figure 6.
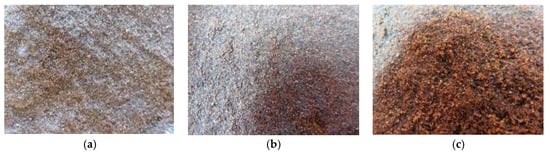
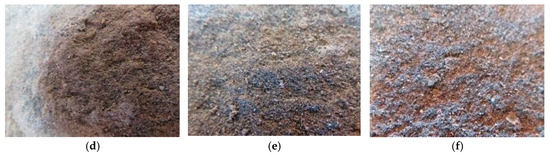
Figure 6.
The surface structures of the rock cores at different distances from the fracture. (a) 1#; (b) 2#; (c) 3#; (d) 4#; (e) 5#; (f) 6#.
Through the observation of the cross-sectional appearance of the cores in Figure 6, it can be seen that the residual oil content in cores 1# and 2# is relatively less compared to cores 3# to 6#. However, a small amount of residual oil can still be observed. Cores 1# and 2# are located in the strong flushing zone, while the other cores are located in the matrix permeation zone and the low-saturation oil zone. It is inferred that cores 1# and 2# may have experienced a reduction in residual oil content due to the high-intensity injection, making it difficult to observe residual oil on the rock surface.
To quantitatively study the characteristics of residual oil in different regions, microscopic observations of residual oil are needed for analysis. The comparative microscopic observations of cores from different regions are shown in Figure 7.
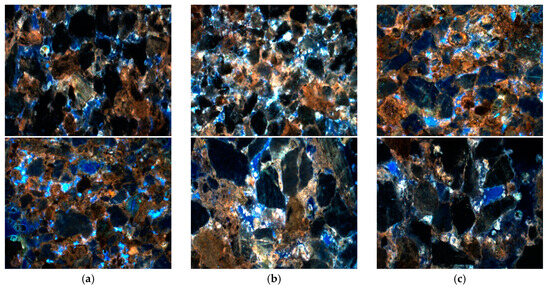
Figure 7.
Distribution of remaining crude oil in different locations of the rock core. (a) Strong flushing zone; (b) Low saturation oil zone; (c) Matrix permeation zone.
The microscopic observations of different regions of the rock cores reveal that the matrix permeability zone has a higher crude oil content with a significant amount of blue water phase, indicating a higher residual oil content. In the low-saturation oil zone, there is a considerable variation in oil phase content, with an increase in the blue area. The water phase is observed in the form of droplets on the rock surface, resulting in a lower residual oil content compared to the matrix permeability zone. Observations of the intense flushing zone show that due to the flushing of the internal cementitious materials, the blue water phase areas have formed continuous sheets, creating high-permeability flow channels. The injected fluid flows through these channels, avoiding areas with lower permeability, further exacerbating the generation of low-efficiency or ineffective cycling bands.
In order to further quantitatively study the distribution of residual oil inside the rock cores at different locations, the results were summarized and analyzed, resulting in the distribution of residual oil content at various locations within the rock cores, as shown in Figure 8.
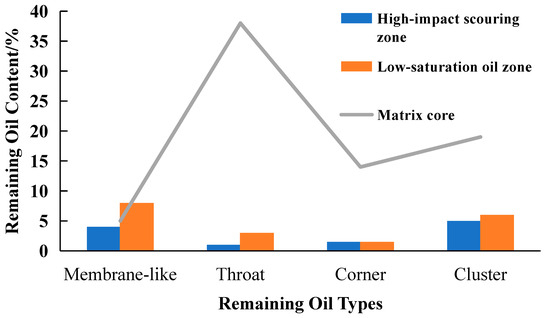
Figure 8.
Distribution of different types of remaining crude oil in cores at different locations.
From Figure 8, it can be observed that, for the matrix core, it is mainly dominated by throat and cluster oil. This is because the oil inside the throat remains stable without displacement, resulting in a higher oil content. Clustered oil is formed during the saturation process where oil and water shear each other in the porous medium. Film oil occurs after displacement, where some oil is adsorbed on the rock surface due to adsorption, contributing to the lower content of film oil in the matrix core.
In the strong flushing zone and low saturation oil area, the distribution of oil in cores is primarily composed of film and clustered residual oil, with less content of throat-type and corner-type residual oil. For the low saturation area, the content of throat, corner, and clustered oil inside the rock significantly decreases due to the impact of water flooding. The adsorption effect between the rock and crude oil during water flooding results in a substantial increase in the content of film oil. In the strong flushing zone, the content of various types of oil is very low. This is attributed to the intense flushing effect of water flow, causing different types of oil inside the rock to be carried away under the strong drag force. Compared to other regions, there is almost no oil present in the strongly flushed area.
3.4. The Formation Mechanism and Influencing Factors of Fracture-Flush Zone-Low Saturation Area
Based on the results of the previous section, the formation mechanism of the fracture-flush zone-low saturation area in high-water content oil reservoirs was preliminarily determined. However, due to limited experimental conditions, it was challenging to accurately describe the influencing factors in the formation of the fracture-flush zone-low saturation area in high-water content oil reservoirs. Therefore, in this section, finite element simulation methods are employed to simulate the fluid flow and clay particle migration characteristics within the fracture-flush zone and the flush zone-low saturation area. The established porous media simulation and grid partitioning are illustrated in Figure 9.
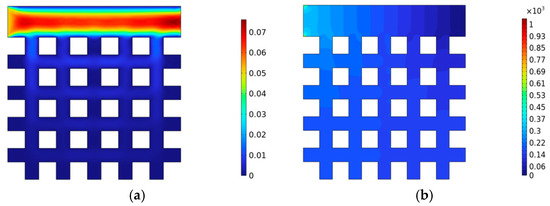
Figure 9.
Variations in fluid flow velocity and pressure during the flushing process. (a) Variations in flow velocity during the flushing process; (b) Changes in pressure during the flushing process.
Through simulation, it can be assumed that the fluid velocity and pressure remain stable during the flushing process, with relatively small variations over time. Additionally, from Figure 9, it can be observed that the fluid velocity at the crack end is relatively high, reaching up to 0.075 m/s, while the fluid velocity at the far end of the crack is relatively small, with local fluid velocity in surrounding dead pores being 0 m/s. The significant difference in fluid velocity between different regions indicates that the flow of fluid at the crack end affects the flow state of the fluid near the crack end.
The simulation has confirmed that the flow of fluid in the porous medium affects the flow state of the fluid near the crack end. It is necessary to further analyze the movement of clay particles near the crack end. The movement patterns of clay particles near the crack end at different times are illustrated in Figure 10.
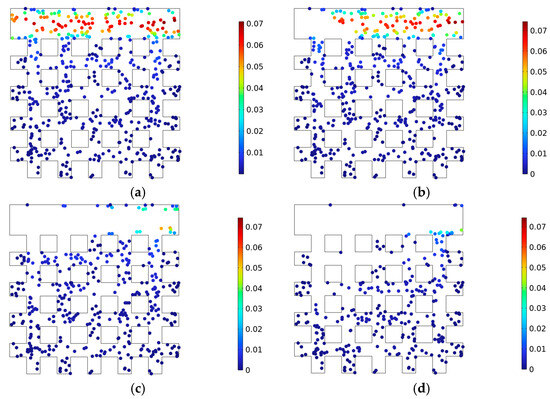
Figure 10.
The distribution patterns of clay particles near the crack end at different times. (a) 0 μs; (b) 208 μs; (c) 500 μs; (d) 5000 μs.
From Figure 10, it can be observed that with the increase in simulation time, the distribution state of clay particles near the crack end undergoes significant changes. The clay particles near the crack end are carried away by the incoming fluid, flowing out through the exit crack. Moreover, the closer to the entrance, the stronger the fluid’s carrying capacity. In contrast, the clay particles in the pores located at the far end of the crack show no significant changes. This indicates that the flow of fluid within the crack does have an impact on poorly cemented clay particles, causing them to detach from the originally stable cemented surface and enter the crack. This ultimately results in an increase in pore size near the crack end, forming a high-permeability zone.
To further quantitatively study the movement characteristics of clay particles near the crack end, the impact of different parameters such as flow velocity, fluid viscosity, and clay particle density on the carrying capacity was analyzed, as shown in Figure 11.
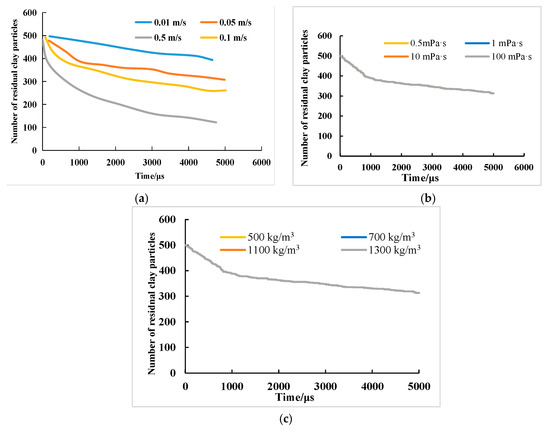
Figure 11.
Impact of different parameters on the number of residual clay particles. (a) Variation in the number of residual clay particles under different flow velocities; (b) change in the number of residual clay particles under different fluid viscosities; (c) change in the number of residual clay particles under different particle densities.
From Figure 11, it can be observed that under strong flushing conditions, the number of residual clay particles is mainly influenced by flow velocity and flushing time. In other words, the greater the flushing intensity, the faster the water flow velocity, and the longer the flushing time, the fewer residual clay particles near the fracture. However, the viscosity of the flushing fluid and the density of clay particles have no effect on the flushing efficiency, and the number of residual clay particles remains unchanged.
In summary, the formation mechanism of high-water content oil reservoirs, including fractures, flushing zones, and low-saturation zones, can be outlined as follows (Figure 12): Under the influence of strong water flow, the fluid velocity within the fractures is high, subsequently driving the flow of fluid in the surrounding pores near the fractures. On one hand, this reduces the saturation of oil near the fractures. Simultaneously, under the strong drag force, the cementing materials in the rock and fine clay minerals are also carried away, leading to the formation of high-permeability bands near the fractures. The pore structure and throat size significantly increase. Additionally, under the action of the flushing zone’s liquid flow, the oil within the rocks at the far end of the fractures is also carried away by the drag force. This results in a decrease in oil saturation, reduced flow resistance, and ultimately the formation of the fracture-flushing zone-low saturation oil region.
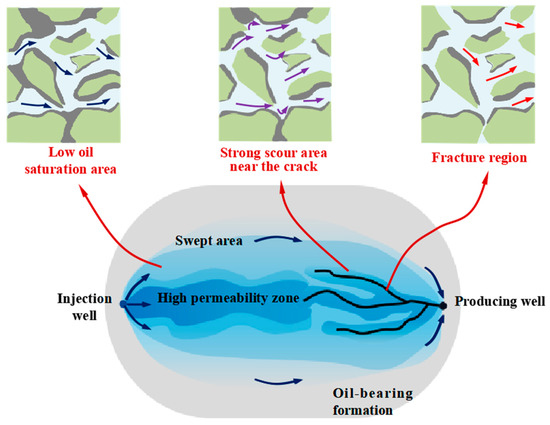
Figure 12.
Characteristics of high-water content fracture-type pore zones.
4. Conclusions
- (1)
- It was found that the pore structure and mineral content in different regions are different by simulating the formation of the dominant porous channel of fracture type in the laboratory. After long-term water flooding development, the intense water flushing near the fracture washes away the cementing materials of the rocks, causing changes in the properties of the matrix rocks near the fracture. The gaps between rock particles increase, and clay particles are transported to the surface with the injected fluid. The permeability capacity significantly increases, forming a high-permeability band with a fractured structure. This is also one of the reasons for the formation of fractured pores.
- (2)
- The remaining oil content is different in different areas, and the remaining oil types are mainly throat and cluster oil. In the low-saturation region, the content of pores, corners, and clustered oil within the rocks significantly decreases, while the content of lamellar oil increases substantially. Clay minerals are not severely flushed, and there is almost no original oil present in the intensely flushed area.
- (3)
- The lower the core permeability, the more concentrated the distribution of throat radius in the low-value zone, with a narrower distribution range and higher peak values. Comparing core parameters at different distances from the fracture, it is observed that after a certain period of water flooding, the properties of the matrix rocks near the fracture change, and the permeability significantly increases, forming a high-permeability band with a fractured structure. However, when the distance from the fracture reaches 2.5 cm, the parameters such as permeability, porosity, and throat radius of the rock do not change significantly compared to the matrix rocks, indicating that the area of the high-permeability band is limited, influenced by factors such as injection intensity.
- (4)
- Mathematical models of fluid flow and clay particle migration in fissure-scour zone and scour zone-low saturation zone were established. Under intense flushing conditions, the number of residual clay particles is primarily influenced by flow velocity and flushing time. In other words, the greater the flushing intensity, the faster the water flow, and the longer the flushing time, the fewer clay particles are left near the fracture end. The viscosity of the flushing liquid and the density of clay particles have no significant impact on the flushing effect.
Author Contributions
Conceptualization, N.Z.; formal analysis, T.L.; supervision, D.Y.; validation, G.C.; writing—original draft, N.Z. All authors have read and agreed to the published version of the manuscript.
Funding
This research was funded by the National Natural Science Foundation of China (No. 51574089).
Data Availability Statement
The data that support the findings of this study are available from the corresponding author upon reasonable request.
Conflicts of Interest
The authors declare no conflict of interest.
References
- Chen, C.; Han, X.; Yang, M.; Zhang, W.; Wang, X.; Dong, P. A New Artificial Intelligence Recognition Method of Dominant Channel Based on Principal Component Analysis. In Proceedings of the SPE/IATMI Asia Pacific Oil & Gas Conference and Exhibition of the Society of the Petroleum Engineers, Bali, Indonesia, 29–31 October 2019. Paper SPE-196295-MS. [Google Scholar]
- Skjaerstein, A.; Tronvoll, J.; Santarelli, F.J.; Jøranson, H. Effect of Water Breakthrough on Sand Production: Experimental and Field Evidence. In Proceedings of the SPE Annual Technical Conference and Exhibition of the Society of the Petroleum Engineers, San Antonio, TX, USA, 5–8 October 1997. Paper SPE-38806-MS. [Google Scholar]
- Zhang, M.; Fan, J.; Zhang, Y.; Liu, Y. Study on the relationship between the water cutting rate and the remaining oil saturation of the reservoir by using the index percolating saturation formula with variable coefficients. J. Pet. Explor. Prod. Technol. 2020, 10, 3649–3661. [Google Scholar] [CrossRef]
- Bridge, J.S. The interaction between channel geometry, water flow, sediment transport and deposition in braided rivers. Geol. Soc. Lond. Spec. Publ. 1993, 75, 13–71. [Google Scholar] [CrossRef]
- Sugiura, S.; Nakajima, M.; Iwamoto, S.; Seki, M. Interfacial tension driven monodispersed droplet formation from microfabricated channel array. Langmuir 2001, 17, 5562–5566. [Google Scholar] [CrossRef]
- Monty, J.P.; Hutchins, N.; Ng, H.; Marusic, I.; Chong, M. A comparison of turbulent pipe, channel and boundary layer flows. J. Fluid Mech. 2009, 632, 431–442. [Google Scholar] [CrossRef]
- Trallero, J.L.; Sarica, C.; Brill, J.P. A Study of Oil/Water Flow Patterns in Horizontal Pipes. SPE Prod. Facil. 1997, 12, 165–172. [Google Scholar] [CrossRef]
- Hoefner, M.L.; Fogler, H.S. Pore evolution and channel formation during flow and reaction in porous media. AIChE J. 1988, 34, 45–54. [Google Scholar] [CrossRef]
- Fulcher, R.A., Jr.; Ertekin, T.; Stahl, C.D. Effect of Capillary Number and Its Constituents on Two-Phase Relative Permeability Curves. J. Pet. Technol. 1985, 37, 249–260. [Google Scholar] [CrossRef]
- Abbaszadeh-Dehghani, M.; Brigham, W.E. Analysis of well-to-well tracer flow to determine reservoir layering. J. Pet. Technol. 1984, 36, 1753–1762. [Google Scholar] [CrossRef]
- Alabert, F.G.; Modot, V. Stochastic models of reservoir heterogeneity impact on connectivity and average permeabilities. In Proceedings of the SPE Annual Technical Conference and Exhibition, Washington, DC, USA, 4–7 October 1992. SPE-24893-MS. [Google Scholar]
- Draper, N.; Smith, H. Applied Regression Analysis; Wiley: New York, NY, USA, 1998. [Google Scholar]
- Gentil, P. The Use of Multilinear Regression Models in Patterned Waterfloods. Master’s Thesis, University of Texas, Austin, TX, USA, 2005. [Google Scholar]
- Hird, K.B.; Dubrule, O. Quantification of Reservoir Connectivity for Reservoir Description Applications. SPE Res. Eval. Eng. 1995, 1, SPE-30571-MS. [Google Scholar] [CrossRef]
- Hocking, R. Technometrics; Wiley: New York, NY, USA, 1983. [Google Scholar]
- Abbaszadeh-Dehghani, M. Analysis of Unit Mobility Ratio Well-to-Well Tracer Flow to Determine Reservoir Heterogeneity. Ph.D. Thesis, Stanford University, Stanford, CA, USA, 1983. [Google Scholar]
- Coutinho, A.; Dias, C.M.; Alves, J.L.D.; Landau, L.; Loula, A.F.D.; Malta, S.M.C.; Castro, R.G.S.; Garcia, E.L.M. Stabilized methods and post-processing techniques for miscible displacements. Comput. Methods Appl. Mech. Eng. 2004, 193, 1421–1436. [Google Scholar] [CrossRef]
- Brigham, W.E.; Maghsood, A.D. Tracer Testing for Reservoir Description. J. Pet. Technol. 1987, 39, 519–527. [Google Scholar] [CrossRef]
- Garland, T.M. Selective Plugging of Water Injection Wells. Soc. Pet. Eng. 1966, 18, 1550–1560. [Google Scholar] [CrossRef]
- Vatkins, Y.P.R. How to Diagnose a Thief Zone. Soc. Pet. Eng. 1973, 25, 839–840. [Google Scholar]
- Chan, K.S.; Yortsos, Y.C. Transport of Particulate Suspensions in Porousmedia Model Formulation. AIChE J. 1987, 33, 1636–1643. [Google Scholar]
- Naides, C.; Paris, J.M. Identification of Water-Bearing Layers with Resistivity Image Logs. In Proceedings of the SPE Latin American Caribbean Petroleum Engineering Conference, Rio de Janeiro, Brazil, 20–23 June 2005. [Google Scholar]
- Yousef, A.A.; Gentil, F. A Capacitance Model to Interwell Connectivity Form Production and Injection Rate Fluctuations. In Proceedings of the SPE Annual Technical Conference and Exhibition, Dallas, TX, USA, 9–12 October 2005. [Google Scholar]
- Felsenthal, M. A Statistical Study of Some Vaterflood Parameters. Soc. Pet. Eng. 1979, 31, 1303–1304. [Google Scholar]
- Izgec, B.; Kabir, S. Identification arid Characterization of High-Conductive Layers in VPaterfloods. Soc. Pet. Eng. 2009, 14, 113–119. [Google Scholar]
- Shawket, G.; Younes, B.; Moutaz, S. Thief Zones and Effectiveness of Water Shut-Off Treatments under Variable Levels of Gravity and Reservoir Heterogeneity in Carbonate Reservoirs. In Proceedings of the SPE EUROPEC/EAGE Annual Technical Conference and Exhibition, Barcelona, Spain, 14–17 June 2010. SPE-131055-MS. [Google Scholar]
- Sadeghnejad, S.; Masihi, M.; Shojaei, A.; Pishvaie, M.; King, P.R. Field Scale Characterization of Geological Formations Using Percolation Theory. Transp. Porous Media 2012, 92, 357–372. [Google Scholar] [CrossRef]
- Ding, S.; Jiang, H.; Liu, G.; Sun, L.; Zhao, L. Determining the Levels and Parameters of Thief Zone Based on Automatic History Matching and Fuzzy Method. J. Pet. Sci. Eng. 2016, 138, 138–152. [Google Scholar] [CrossRef]
- Xue, L.; Liu, P.; Zhang, Y. Status and Prospect of Improved Oil Recovery Technology of High Water Cut Reservoirs. Water 2023, 15, 1342. [Google Scholar] [CrossRef]
- Feng, G.; Zhou, Y.; Yao, W.; Liu, L.; Feng, Z.; Yi, Y.; Feng, Y. Countermeasures to decrease water cut and increase oil recovery from high water cut, narrow-channel reservoirs in Bohai Sea. Geofluids 2021, 2021, 6671098. [Google Scholar] [CrossRef]
- Wang, Y.; Jiang, H.; Wang, Z.; Diwu, P.; Li, J. Study on the Countermeasures and Mechanism of Balanced Utilization in Multilayer Reservoirs at Ultra-High Water Cut Period. Processes 2023, 11, 3111. [Google Scholar] [CrossRef]
- Tan, J.; Liu, Y.-X.; Li, Y.-L.; Liu, C.-Y.; Mou, S.-R. Study on oil displacement efficiency of offshore sandstone reservoir with big bottom water. J. Pet. Explor. Prod. Technol. 2021, 11, 3289–3299. [Google Scholar] [CrossRef]
Disclaimer/Publisher’s Note: The statements, opinions and data contained in all publications are solely those of the individual author(s) and contributor(s) and not of MDPI and/or the editor(s). MDPI and/or the editor(s) disclaim responsibility for any injury to people or property resulting from any ideas, methods, instructions or products referred to in the content. |
© 2024 by the authors. Licensee MDPI, Basel, Switzerland. This article is an open access article distributed under the terms and conditions of the Creative Commons Attribution (CC BY) license (https://creativecommons.org/licenses/by/4.0/).