Article

Determination of an Optimal Parameter Combination for Single PEMFC Using the Taguchi Method and Orthogonal Array

1
Division of Cadet Training, Mokpo National Maritime University, Mokpo 58628, Republic of Korea
2
Division of Marine Engineering, Mokpo National Maritime University, Mokpo 58628, Republic of Korea
*
Author to whom correspondence should be addressed.
Energies 2024, 17(7), 1690; https://doi.org/10.3390/en17071690
Submission received: 23 February 2024 / Revised: 21 March 2024 / Accepted: 30 March 2024 / Published: 2 April 2024
(This article belongs to the Special Issue Advances in Fault Diagnosis and Modeling of Fuel Cells)

Abstract

:
In this study, the optimization of the operational parameters for a single proton exchange membrane fuel cell (PEMFC) was carried out using the Taguchi method and orthogonal array. The operating parameters were H2 stoichiometry, air stoichiometry, cell temperature, and back pressure of the anode∙cathode, each with three levels. The performance of the PEMFC, operated according to the L9 orthogonal arrangement, was evaluated through I–V curves at a step-up current loading ranging from 0.1 to 0.7 A/cm2. The results indicated that the anode∙cathode back pressure had the greatest sensitivity to the output voltage compared to the other operating parameters. Increasing the back pressure resulted in higher current output densities at higher values than those applied in the orthogonal arrangement. As the back pressure increased, the output voltage tended to increase at each current density. However, for operating conditions above 150 kPa, the improvement in cell performance was either not significant or tended to decrease. Therefore, it can be concluded that the Taguchi method and orthogonal array are effective tools for selecting the optimal operating conditions for PEMFC.

1. Introduction

The utilization of renewable energy sources for power generation has gained significant attention in recent years due to increasing concern over environmental and climate issues worldwide. Notably, hydrogen fuel cells (FC) represent a power generation system that directly converts the chemical energy of hydrogen into electricity, offering high efficiency and environmental friendliness in energy conversion. The FC is a key supplement to conventional renewable energy sources like solar and wind. These cells efficiently store and release energy, compensating for the fluctuating output of solar and wind power. Hydrogen, generated via electrolysis powered by renewable energy, acts as a dynamic energy medium. It delivers consistent and uninterrupted power, effectively filling the gaps in energy supply due to the variable nature of solar and wind resources. This integration is instrumental in promoting the widespread use of renewable energy and contributes to the overall stability of the electrical grid. Furthermore, the ability of hydrogen to be stored and transported enhances its functionality, extending its application beyond regions that rely solely on direct electrical supply. Therefore, hydrogen fuel cells play an indispensable role in driving us toward a sustainable and decarbonized energy future. Thus, the FC is widely acknowledged as a potential power source for commercial power generation facilities and transportation power systems such as ships and automobiles.
The proton exchange membrane fuel cell (PEMFC), which operates at low temperatures, has several advantages such as its high power density, ease of operation and safety, and ease of miniaturization. Because of its high power density and ability to operate at low temperatures, PEMFC is currently being evaluated as a power source for transportation. Despite the considerable advantages of PEMFC, it encounters numerous technical and economic barriers that require resolution to realize its commercialization and extensive adoption. Current research and development are driving the evolution of various strategies and innovations to enhance the performance metrics of PEMFC. At the same time, research is ongoing to ensure reliability and efficiency, especially under conditions of high load and environmental variability.
The PEMFC performance is affected by a range of operational parameters including relative humidity (RH), back pressure, hydrogen and air stoichiometric ratios, and cell temperature; these factors can significantly affect the PEMFC output. Numerous researchers have sought to achieve the optimal PEMFC performance by controlling the operational parameters experimentally. For example, Hu et al. [1] explored the correlation between automotive PEMFC power and temperature and subsequently determined that the efficiency of PEMFC increased by 28.7% at optimal temperatures. Wang et al. [2] investigated the impact of RH on PEMFC performance at the anode∙cathode electrode and observed that the RH of hydrogen had no significant effect on performance. Jang et al. [3] were able to improve the performance of PEMFC by regulating the cell temperature. Kim et al. [4] proposed the optimal air stoichiometric ratio and excess rate for stable PEMFC output under load variation conditions. Additionally, Zhang et al. [5] performed a comprehensive study on the effects of the operating parameters on performance and found that an increase in back pressure led to stable performance in the high current density range. Therefore, it can be concluded that the performance of PEMFC is dependent on the optimization of various operational parameters. Consequently, achieving an optimal combination of these parameters is necessary to achieve the desirable performance across various power intervals. Notably, operational parameter optimization and data acquisition are essential to PEMFC applications and fuel cell manufacturers to validate and improve their models [6].
The optimal combination requires the consideration of a large number of operating parameters and their levels, which entails significant human and economic costs. Therefore, to overcome these limitations and determine the optimal combination of PEMFC, a systematic and comprehensive study of operating parameters is important. Furthermore, an efficient methodology should be applied to identify and evaluate the optimal combinations in the overall operating parameter. In general, the Design of Experiments, computer simulation, Taguchi methodology, response surface methodology, and Monte Carlo methods are widely used as methodologies for engineering design and variable combinations. In this study, the Taguchi method and orthogonal array (OA) design were applied from among the various available methodologies.
The Taguchi method and OA can be used, which allow for an independent evaluation of the effects of different parameters as well as a significant reduction in the number of required experiments. The Taguchi methodology is one of the experimental design methodologies primarily utilized in the field of quality engineering. It was developed by the Japanese statistician, Genichi Taguchi, in the 1980s. The principal objective of this methodology is to identify the optimal conditions to minimize variability in manufacturing processes and mitigate quality losses. Additionally, the Taguchi methodology incorporates a statistical technique known as an orthogonal array (OA), which reduces the number of required experiments while assessing the interactions between multiple variables. An orthogonal array guarantees that each experimental condition is uniformly distributed, facilitating an effective evaluation of the impact of various factors. This methodology leverages statistical techniques to scrutinize the intricate interactions between distinct factors and their levels, and the ensuing results enable the determination of the optimal operating conditions. Consequently, this allows for the enhancement in product quality and the diminution of associated costs. This approach is effective in terms of manpower, cost, and human resources, and has been applied in various fields such as engineering, biotechnology, and manufacturing [7,8,9,10].
Some researchers have conducted studies on the optimization of the operating parameters of PEMFC by applying the Taguchi methodology and OA [11,12,13,14,15,16]. However, the models and configuration of PEMFC used in these studies are very broad, and the operating parameters and their levels vary widely. Because of this, there is limited research on PEMFC operating parameter optimization.
This study aims to determine the optimal operating parameter combination that produces the highest output voltage in a specific current density range for a single PEMFC. The operating parameters consist of four variables: the hydrogen and air stoichiometric ratio, cell temperature, and anode·cathode back pressure, each with three levels. The optimal operating parameters were determined by first minimizing the number of experiments required for selection using the orthogonal array (OA) method. Then, the sensitivity of each parameter was investigated using the Taguchi method, and the optimal combination of parameters was selected. This study presents the effectiveness of the optimal combination of the parameters for the PEMFC through the Taguchi method and OA.

2. Materials and Methods

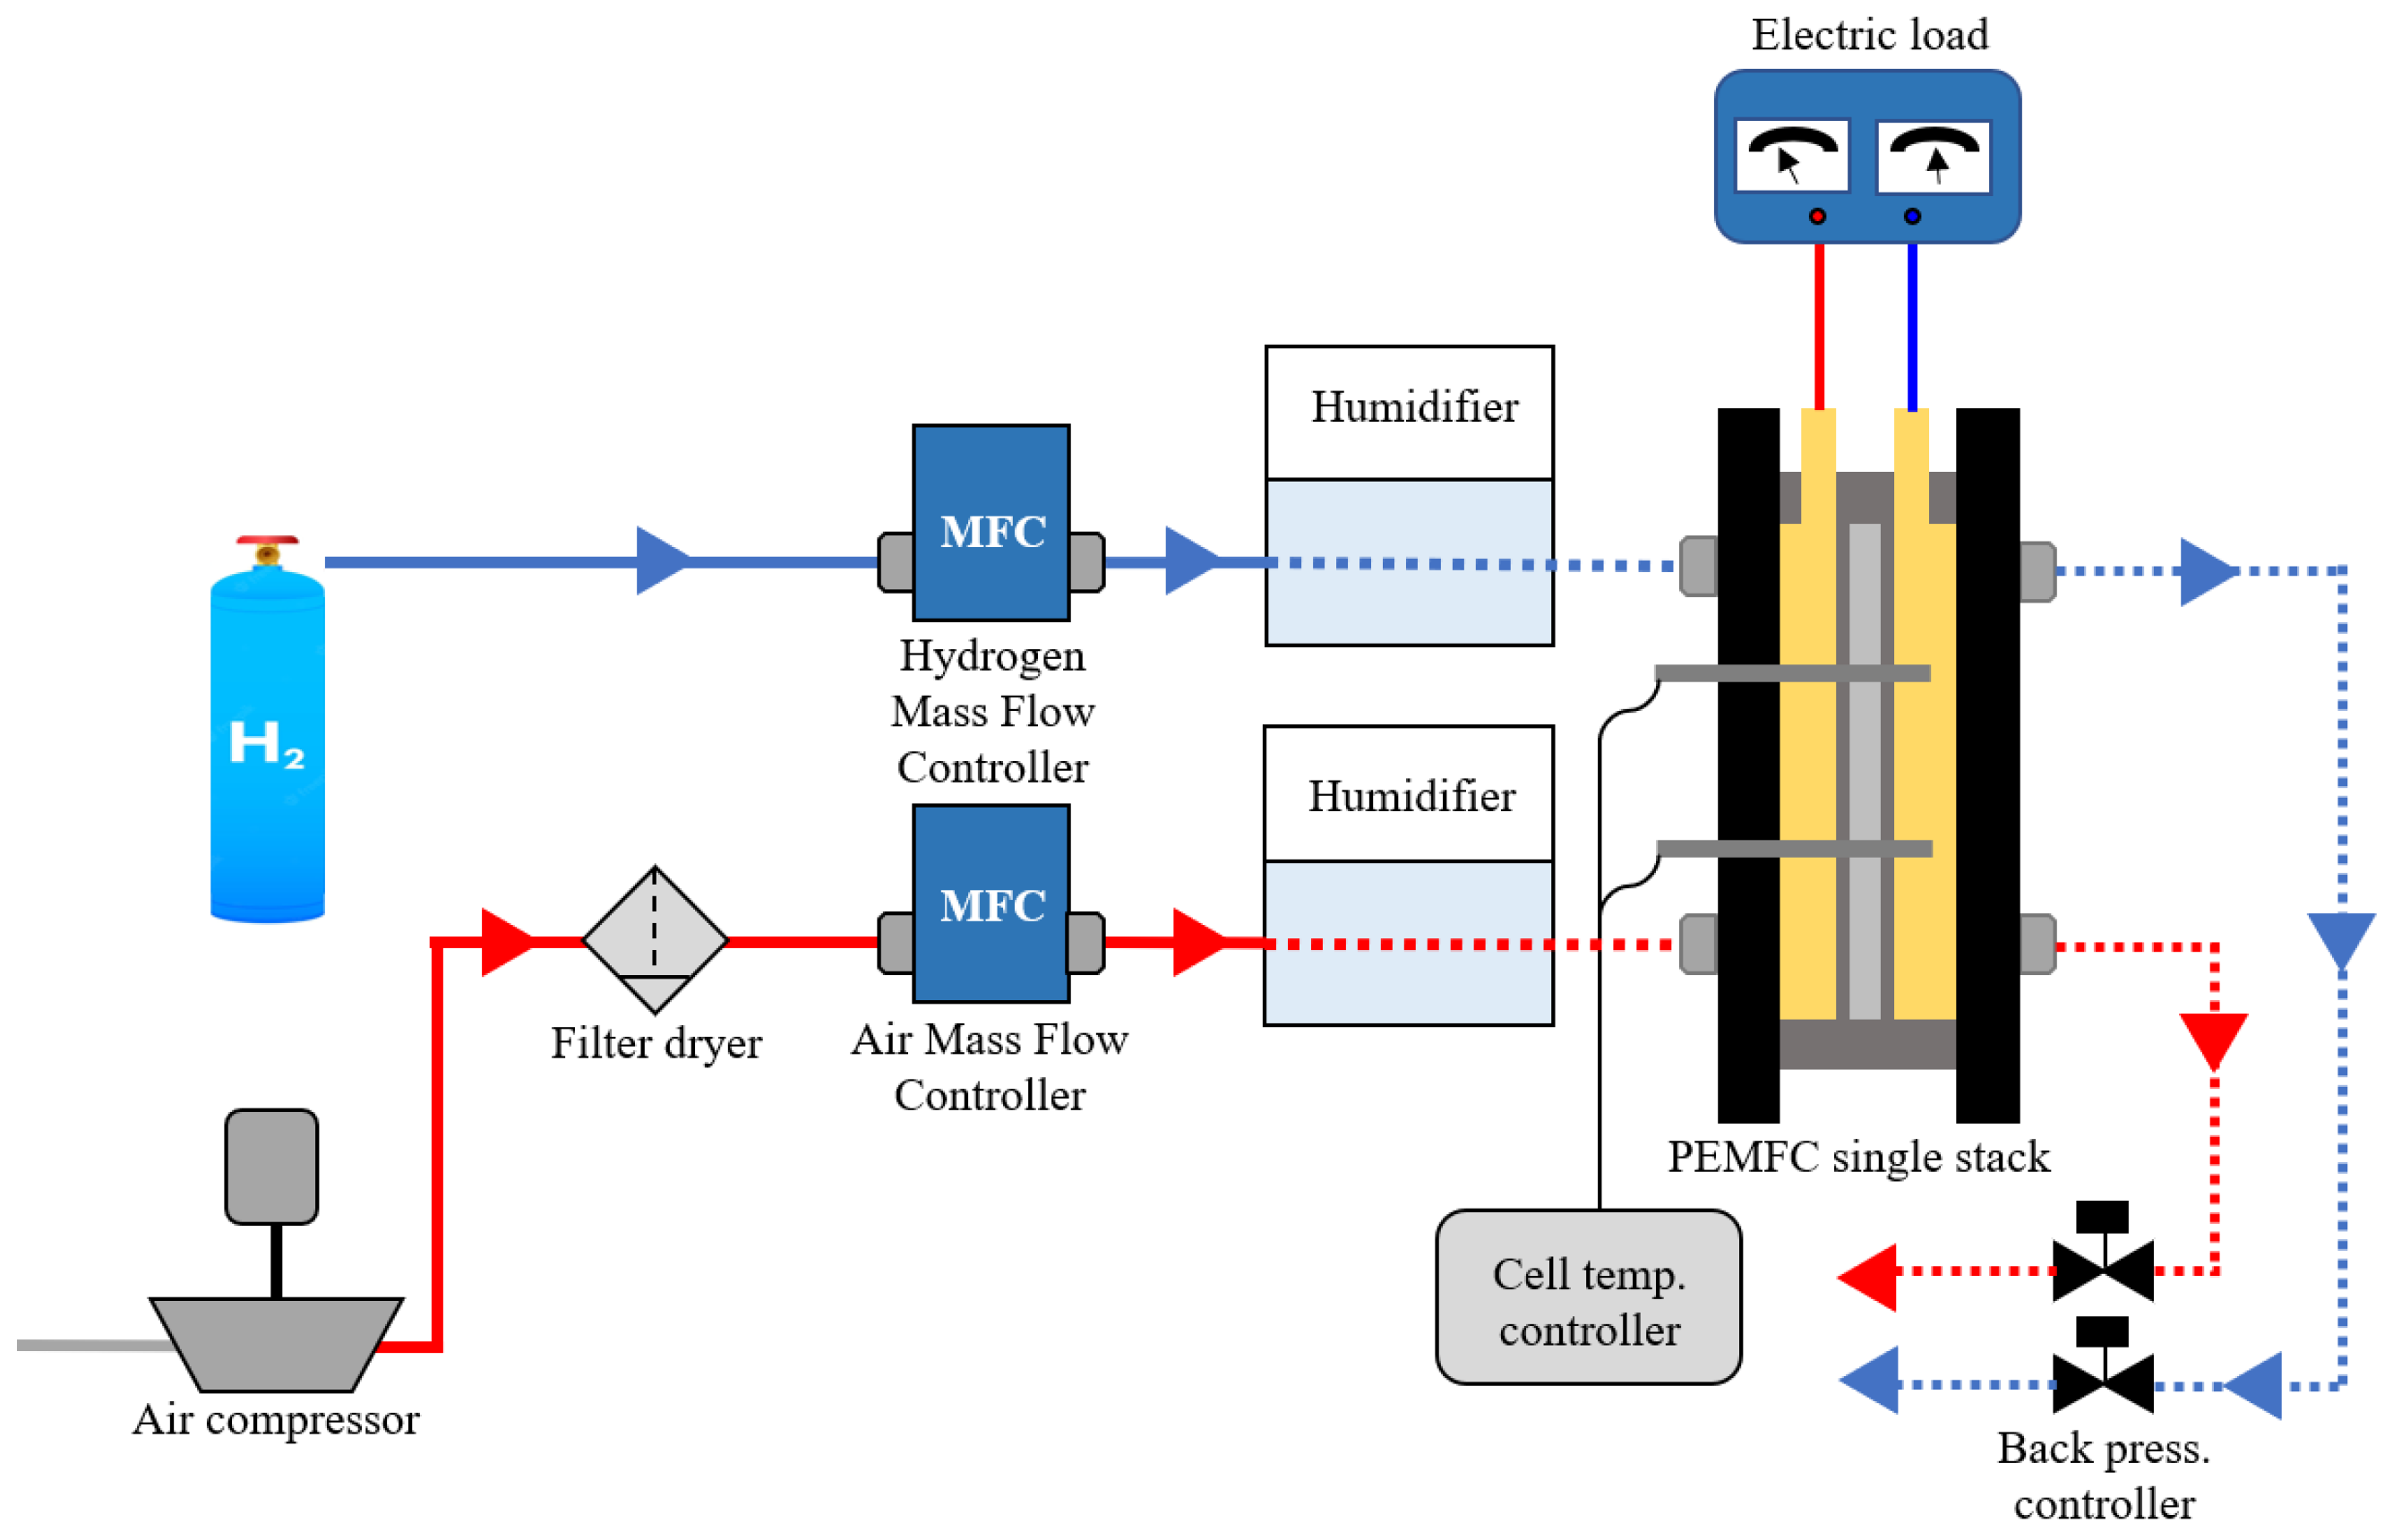
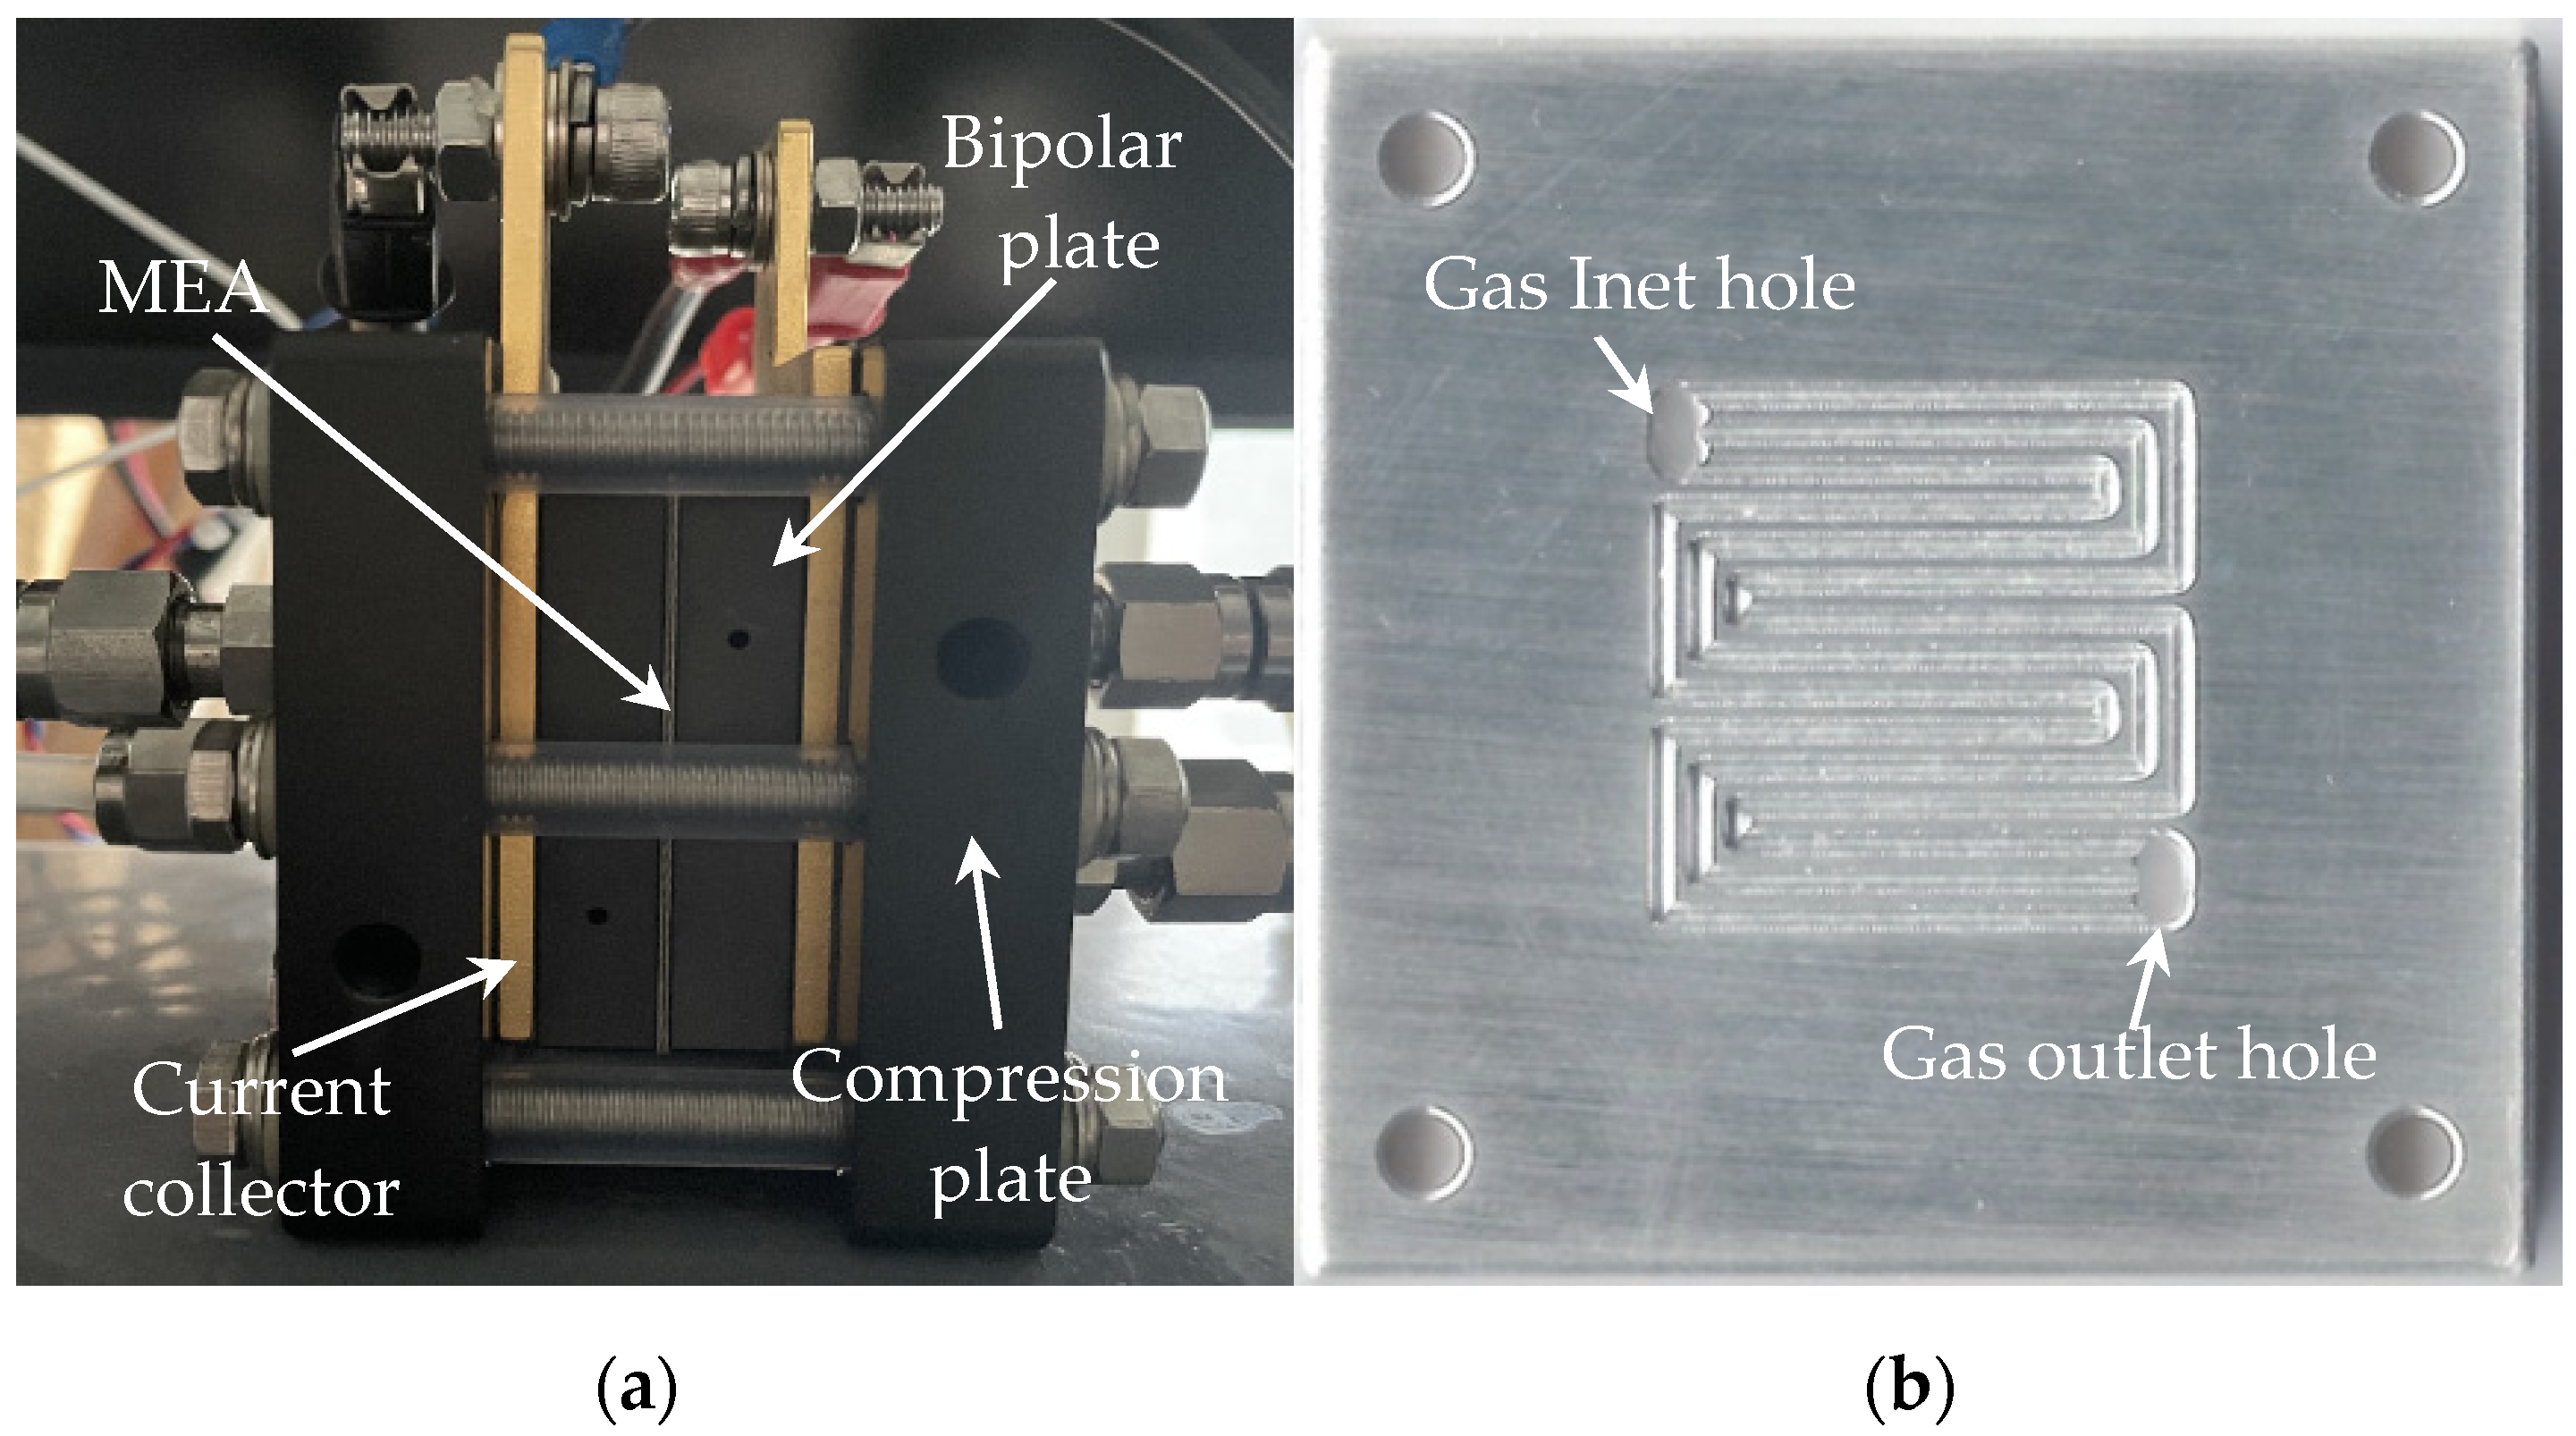
2.1. Configuration of Experiment

In this study, a single PEMFC with an active area of 4 cm2 was evaluated using a commercially available PEMFC Test System, as shown in Figure 1. The PEMFC consisted of MEA, compression plates, current collectors, and stainless 304 bipolar plates, as shown in Figure 2. The compression plate was fastened using 6 N∙m of torque and 12 bolts. The commercial MEA 5-layer (Nara Cell Tech, Seoul, Republic of Korea) consisted of a Nafion membrane and a gas diffusion electrode (GDE) made of carbon paper containing 0.4 mg/cm2 of platinum. The Nafion membrane exhibited a thickness of 50.8 µm, while the GDL possessed a corresponding thickness of 0.36 mm. The PEMFC was equipped with an air-cooling system, and the temperature was regulated through a fan on–off control method.
In all experiments, hydrogen (99.9%) was used as fuel and compressed air was used as the reduction agent, with the flow rates regulated by a mass flow controller. Compressed air, provided by a portable compressor, was filtered and dried to remove moisture and oil before being supplied to the experiment apparatus. The fuel and air were maintained at full humidity (RH = 100%) using a humidifier.

2.2. Taguchi Method and OA

The Taguchi method, a statistical technique used for experimental optimization, generally involves analyzing the sensitivity of each factor to the response and determining the optimal combination of factors. It typically aims to convert the response into a signal-to-noise ratio based on larger-the-better, smaller-the-better, and nominal-the-best characteristics. However, in this study, the responses were evaluated based on the mean value for intuitive interpretation. Four factors including the H2 and air stoichiometric ratio, the cell temperature, and the anode∙cathode back pressure were selected; each factor was set to have three levels. The details are presented in Table 1. The factors and levels were selected through prior research and the literature [4,5,17,18]. A full factorial design for the four factors with three levels would require a total of 81 experiments. However, by using an OA, this number drops to a minimum of nine experiments. The reduction to nine experiments using an OA depends on the specific type and structure of the array. The L9 array is designed for experiments with three-level factors and allows for the balanced testing of all factor combinations in just nine experiments. Subsequently, an L9 orthogonal array table was designed, as shown in Table 2.

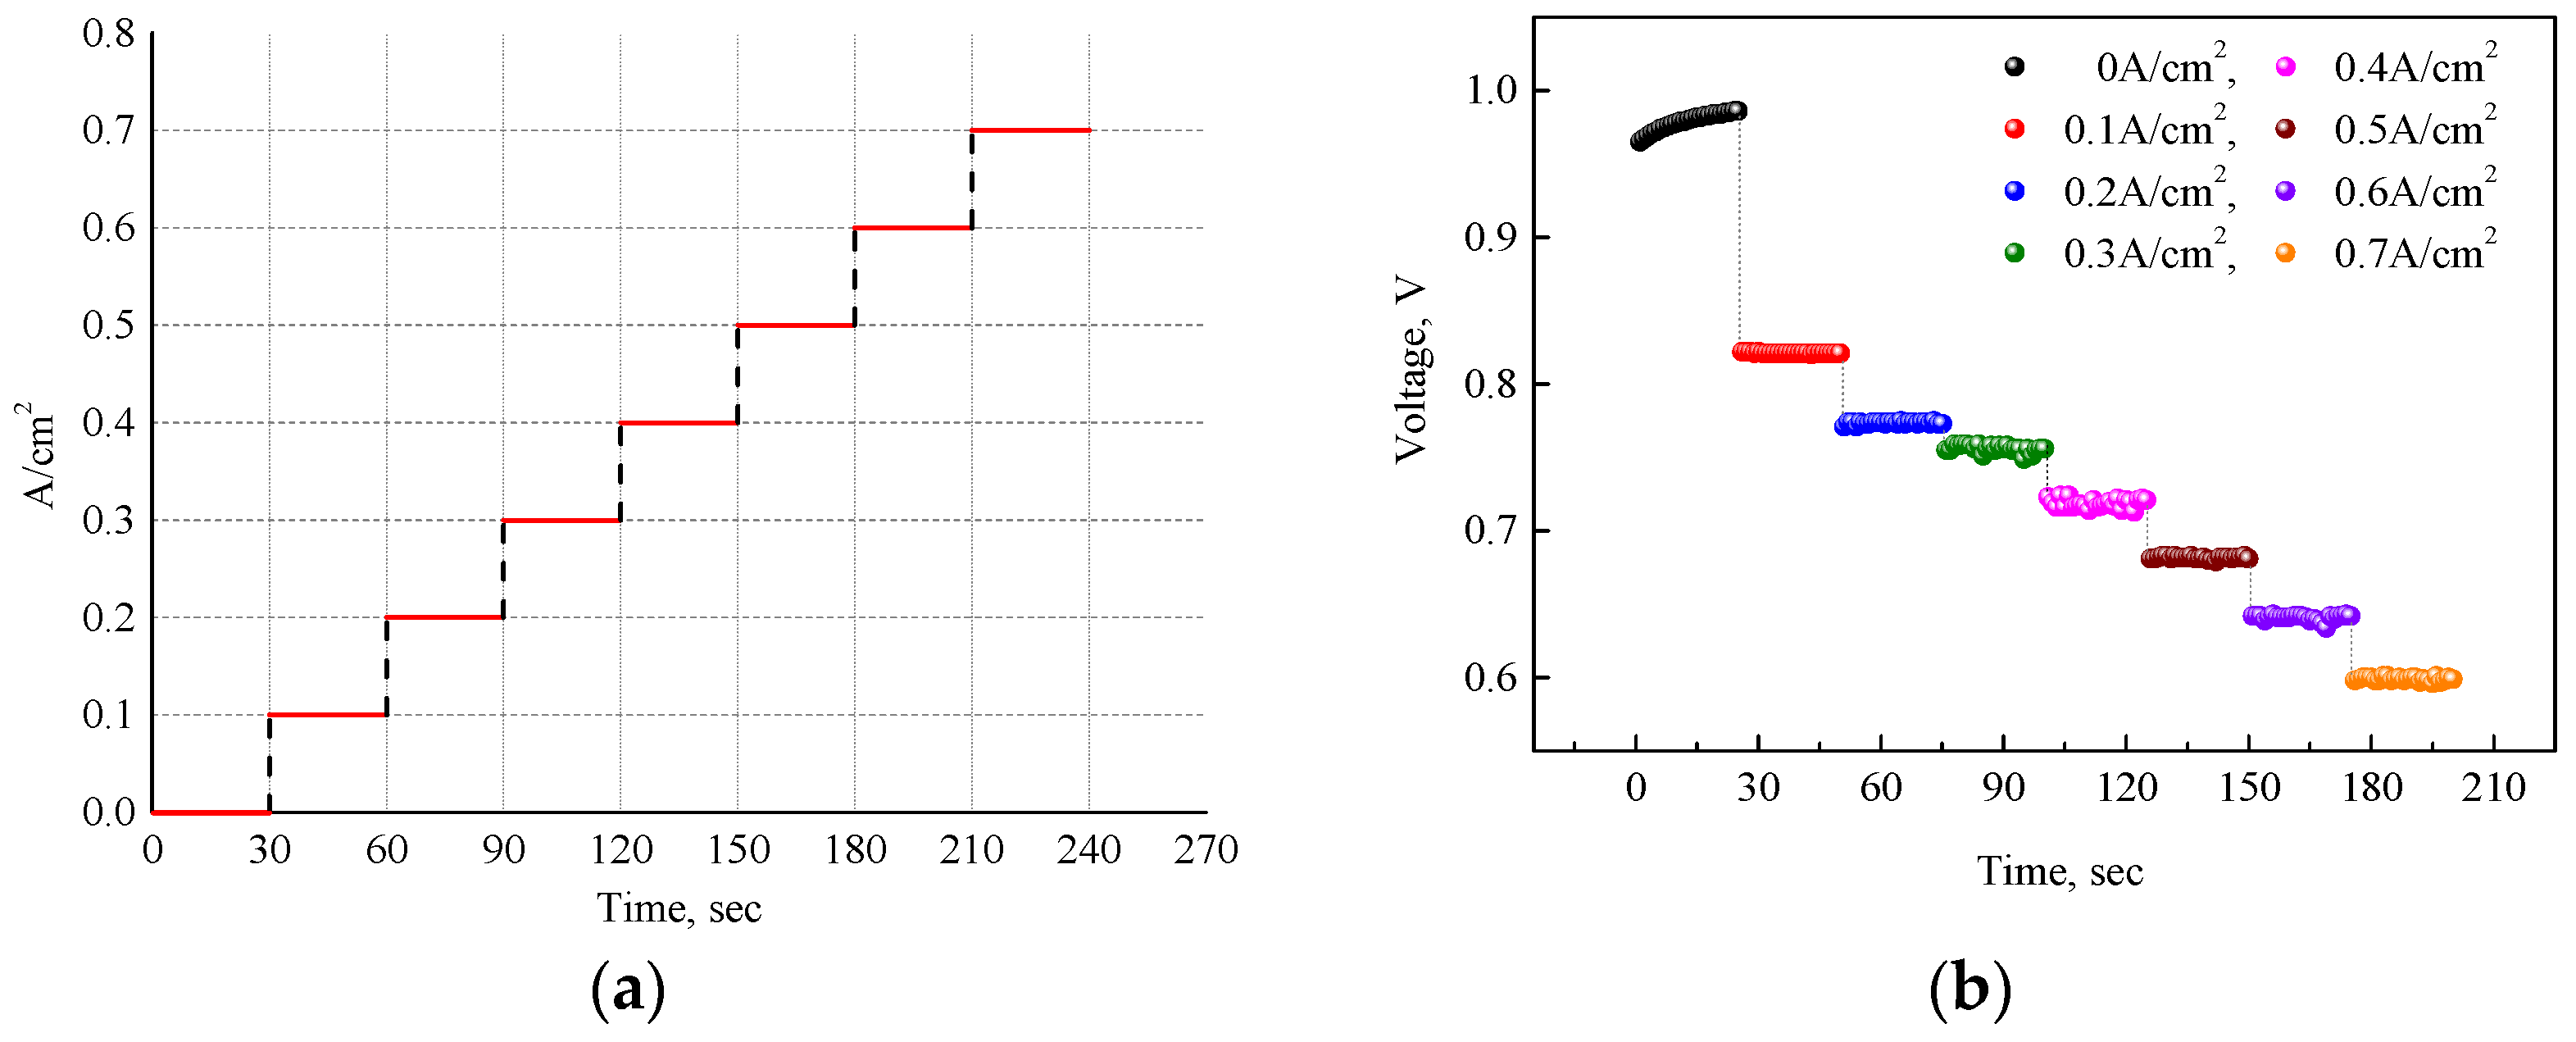
2.3. Polarization Curve

In this study, the PEMFC performance was evaluated using the step-up current (SC) load mode. We adopted the step-up current mode to obtain the I–V curve, given its capability for detailed data collection throughout the fuel cell’s entire operating range. This approach distinctly enables the identification and assessment of the various loss mechanisms inherent in the system. The SC load tests were performed on a PEMFC under the 9-parameter combination of the conditions listed in Table 2. In all tests, a single PEMFC was activated until the current density reached a stable condition for at least one hour at 0.6 V. During the activation procedure, the PEMFC operating conditions were maintained as follows: a cell temperature of 65 °C, H2 and airflow rates of 50 cc/min and 100 cc/min, respectively, a back pressure of 30 kPa, and an H2/air RH of 100%. Polarization was performed under SC loads that increased from 0 A/cm2 to 0.7 A/cm2 at a scan rate of 0.1 A/cm2. The time chart for SC is presented in Figure 3a; the delay time for each step was set to 30 s. Figure 3b shows an example of data performed under the SC, where 30 output voltages were measured at 1 s interval at each step. A total of nine polarization curves were obtained, and the mean output voltage at each step was used as a response characteristic for optimizing the parameter combination.

3. Results and Discussion

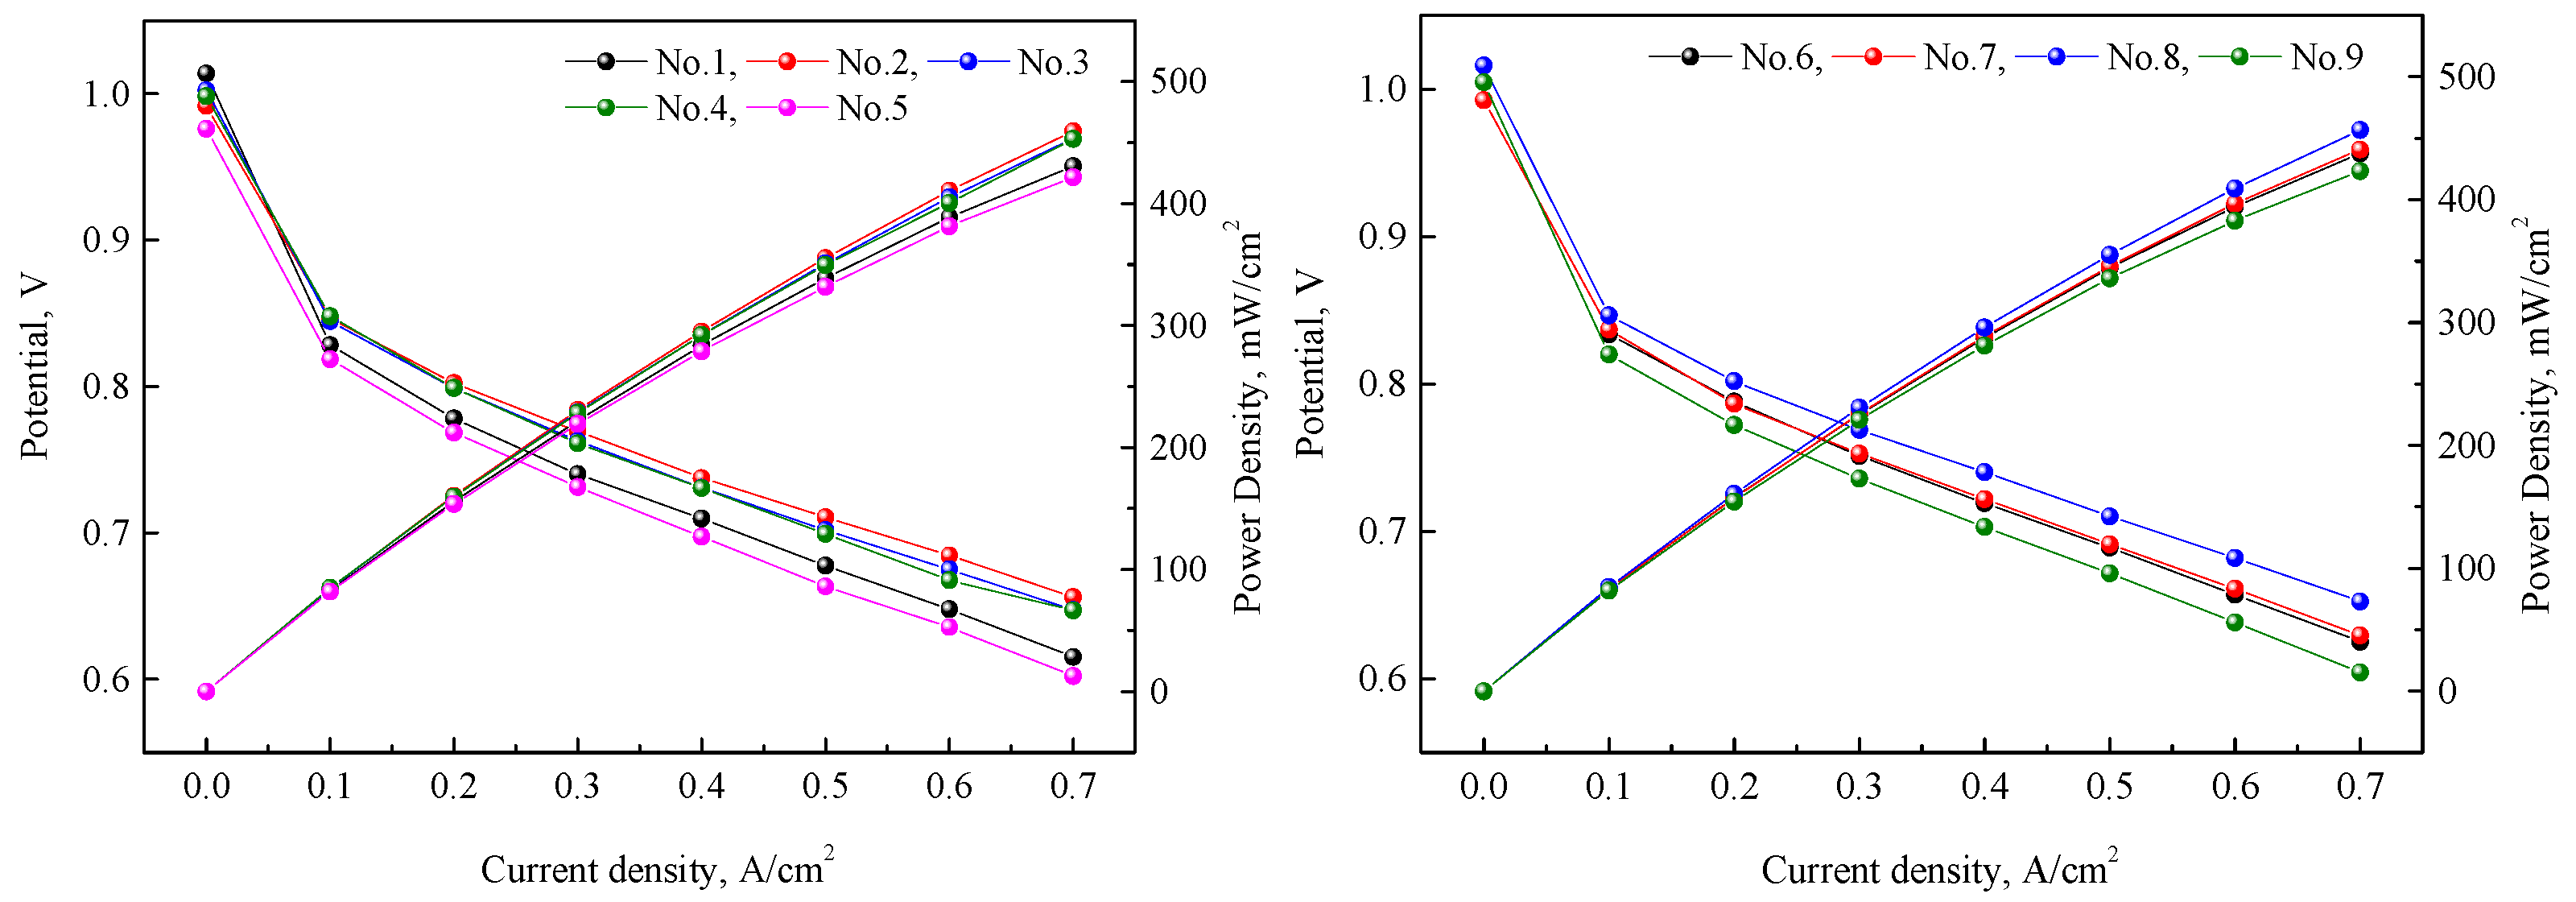
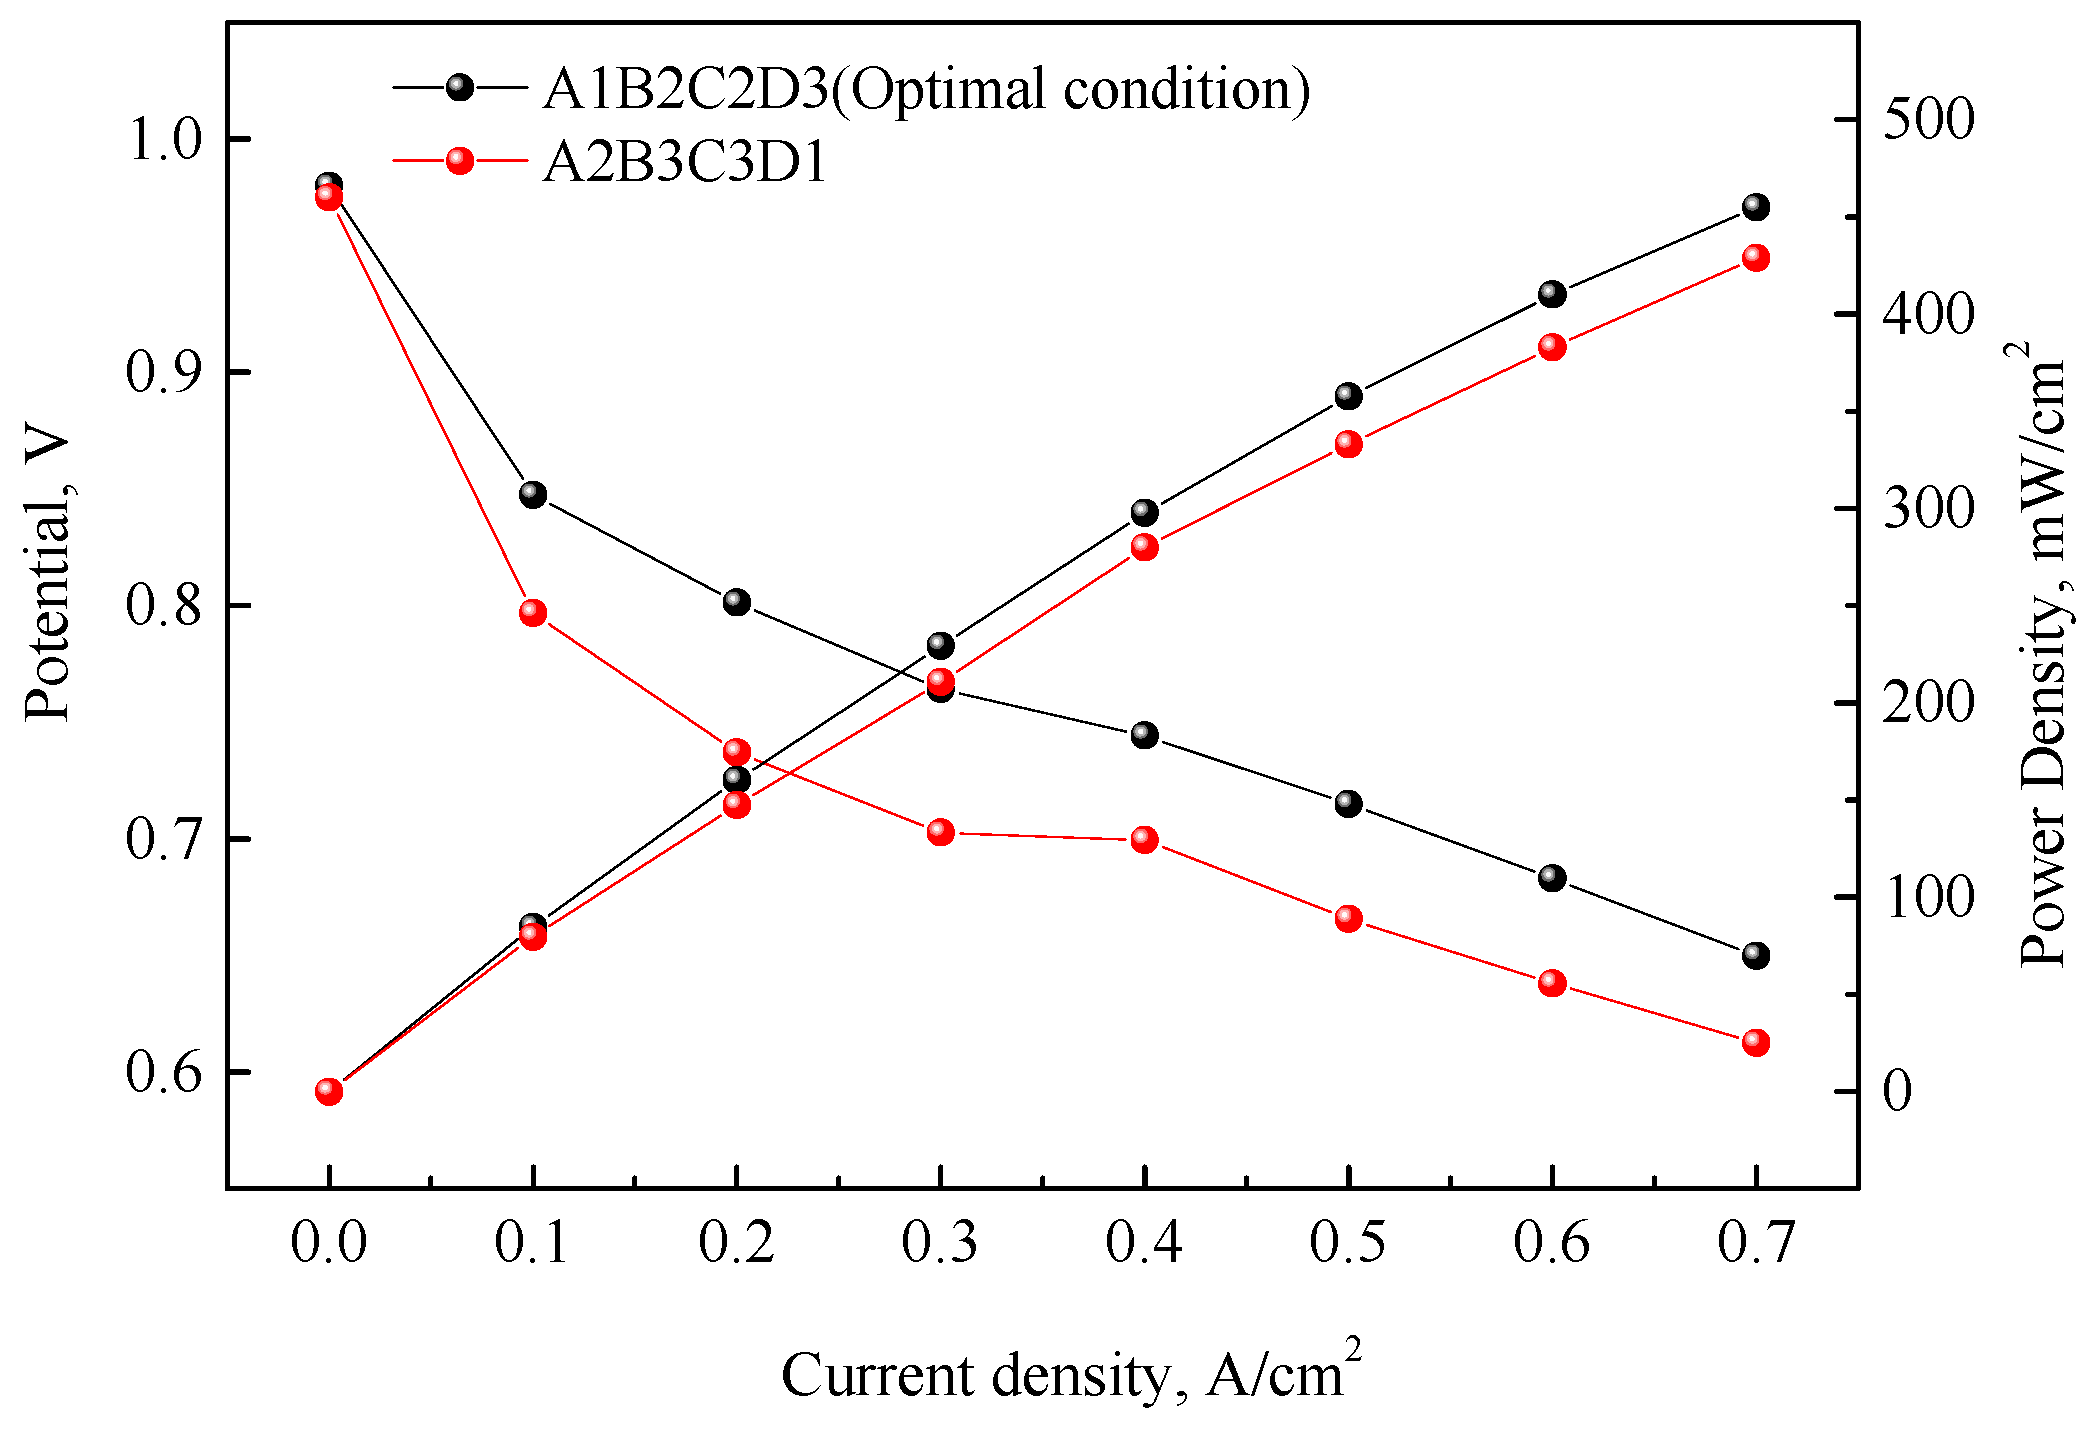
3.1. Polarization Curve

Figure 4 presents the I–V curves of a PEMFC operated under the conditions in the L9 OA table. The polarization curve is one of the primary methods for evaluating the performance of PEMFC, providing details including not only the activation losses, but also the resistance and concentration losses in the PEMFC. The output voltage was calculated as the mean value at each current density, and the detailed values are presented in Table 3. It is evident from the table that as the current density increased, there was a noticeable drop in the voltage output across all tests, which is characteristic of the inherent losses in the PEMFC. The curve illustrates various types of losses experienced in a PEMFC. Activation losses originate from the slow electrode reactions, resistance losses (or ohmic losses) arise due to the resistance of the electrolyte, electrodes, and interconnects, while concentration losses result from the depletion of reactants at high current densities [19,20]. The I–V curves exhibited significant differences; each condition corresponded to a difference in the output voltage at the current density, with this difference gradually increasing as the current density increased. For instance, at a current density of 0.7 A/cm2, Test 2 exhibited the highest voltage output of 0.656 V, while Test 5 showed the lowest at 0.602 V. Such variations emphasize the sensitivity of the PEMFC’s performance to different operational parameters. Tests like 1 and 5 showed a more pronounced drop in voltage as the current density increased. Understanding the specific conditions of these tests can provide insights into factors that might be causing such behavior. As observed in Tests 1, 5, and 9, a standout observation from the data was the performance variation when no back pressure was applied to the anode∙cathode (level 3 of factor D). This underlines the critical role of back pressure in PEMFC operation, influencing the reactant distribution, membrane hydration, and overall cell efficiency. The polarization curve data suggest the complex relationship between the operational parameters in PEMFCs. In this regard, the optimization of these parameters is revealed as essential for capitalizing on the full potential of PEMFCs, which will be elaborated on in the next section.

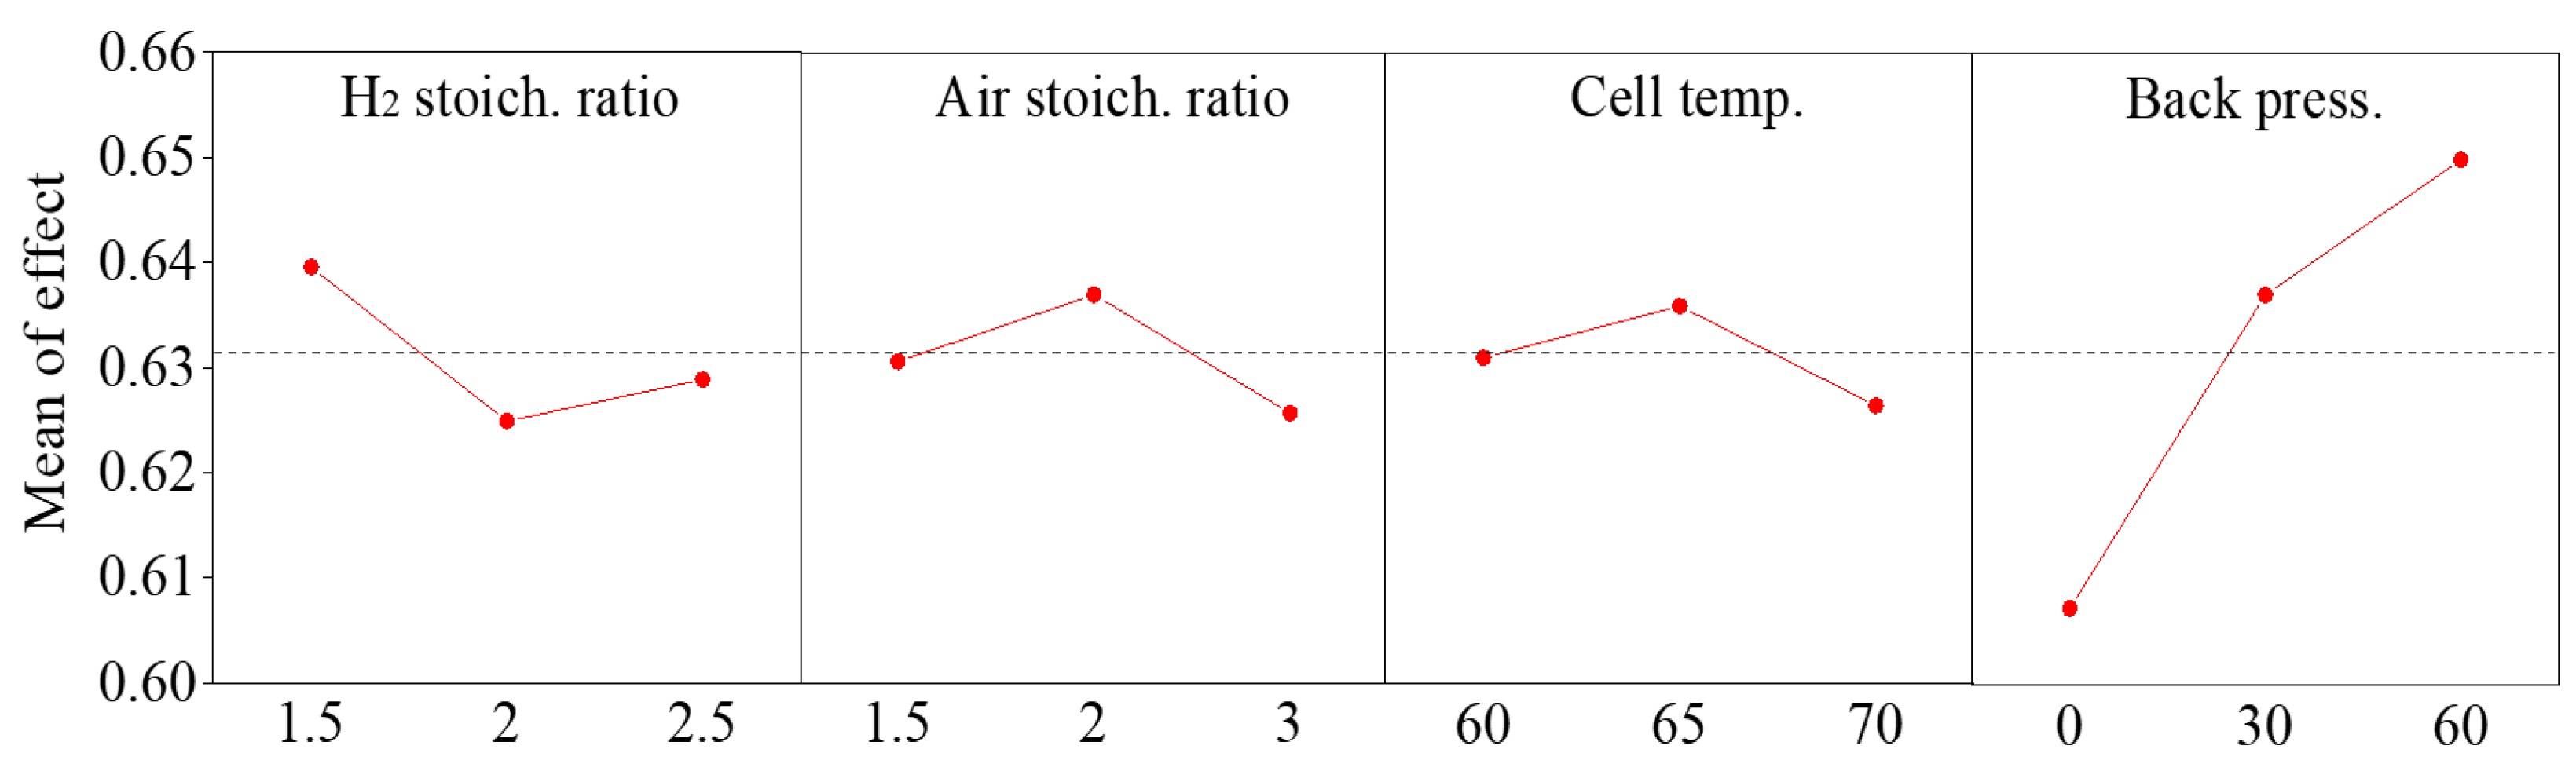
3.2. OA and Taguchi Analysis

Table 4 presents the mean values for each level of the factors, respectively. The delta values indicate the difference between the highest and lowest mean values at each level of the factor. A pronounced delta value indicates the substantial influence of that factor on the performance characteristics, a trend also substantiated by the I–V curves. Notably, factors D, A, B, and C exhibited the highest sensitivity to output voltage, in descending order. Among them, back pressure was the most influencing parameter in fuel cell performance. The other factors were confirmed to not have had a significant impact on the performance of the PEMFC according to the delta statistics. Figure 5 shows the main effect plot of each factor and its respective level on the output voltage. When the line representing a specific factor is close to the mean line (black dotted line), it indicates that the driving parameter has a low sensitivity to the output voltage. In contrast, steeper slopes correlate with heightened sensitivity. Based on this, significant influences on response characteristics were observed from level 1 (1.5) of the H2 stoichiometric ratio, level 2 (2.0) of the air stoichiometric ratio, level 2 (65 °C) of the cell temperature, and level 3 (60 kPa) of the cell pressure. Consequently, the optimal parameter set for achieving maximum output voltage was deduced as A1B2C2D3, a combination not present in the orthogonal array in Table 2.

3.3. Optimal Parameter Combination at Each Current Density

The performance of PEMFC inherently varies with changes in the output current density [21]. This variation can be attributed to the complex interaction of electrochemical reactions, material properties, and operational parameters within the cell. As the current density increases, so does the demand for reactants, increasing the risk of concentration losses. Moreover, factors such as heat generation and water management can influence the overall performance of the PEMFC. Given these operational complexities, it is crucial to understand the sensitivity of different operational parameters and their combined effects at varying current densities, which are important for optimal PEMFC operation.
Table 5 shows the optimal parameter combinations determined at each current density. It is imperative to note that the influence of factors provides insights into how changes in these parameters can influence the PEMFC’s performance. For all current densities, the sensitivity to the anode∙cathode back pressure (factor D) consistently remained the highest. This highlights the pivotal role of back pressure in ensuring an efficient reactant flow and mitigating concentration losses. The H2 stoichiometric ratio (factor A) followed in significance, emphasizing the balance required for optimal hydrogen flow and its subsequent reactions.
While the combination A1B2C2D3 consistently emerged as the optimal parameter set for most of the current densities, an exception was observed at 0.1 A/cm2, where A1B1C2D3 proved to be the best. The variations in the optimal combinations across different current densities highlight the necessity of adjusting operational parameters to achieve a full performance from the PEMFC. Further emphasizing the effectiveness of the A1B2C2D3 combination, it suggests the potential for a synergistic interaction among operational parameters, leading to reduced losses and heightened cell efficiency. By following this optimal set, PEMFC operations can be optimally configured to harness the full potential of the cell’s inherent capabilities.

3.4. Effect of Back Pressure on Optimal Parameter Combination

The effect of back pressure on PEMFC performance is represented in Figure 6, which contrasts the I–V curves of the most effective operating combination (A1B2C2D3) against the combination that yielded the lowest output voltage (A2B3C3D1) within the OA. Remarkably, the optimal parameter set demonstrated an enhanced performance, outperforming by approximately 6.8% in terms of power output. However, the optimal combination exhibited a performance improvement of 2.9% over the mean of the L9 combinations. This can be considered an insignificant improvement in performance because the levels of the variables applied in this study were within a range that guarantees a certain level of performance in PEMFC operation. Therefore, changes in certain variable levels led to subpar performance. On the other hand, this indicates that the Taguchi method is useful in finding the optimal combination, even among variables that have a subpar influence.
In Figure 5, while factors A, B, and C delineated the optimal levels that yielded the highest output voltage, factor D revealed a consistent trend: an increase in the output voltage as its level transitions from 1 to 3. It is well-established that the back pressure acts as a deterrent, preventing the loss of unreacted reducing agents at the cathode and simultaneously promoting transport [22]. Consequently, an increase in back pressure is directly correlated with an enhancement in cell voltage. However, this relationship has its limits. Excessive back pressure might usher in inconsistencies in current distribution [23], suggesting the potential for even more elevated output voltages beyond the back pressure levels employed to the anode∙cathode in this research.
To further investigate this, while retaining the optimal levels for A, B, and C, I–V curves were plotted with an increment in the level of factor D. Figure 7 reveals that an increased back pressure exceeding 60 kPa consistently led to a superior output voltage across all current density ranges. However, beyond 150 kPa, the output voltage appeared to stabilize, showing no further significant increase. Notably, at a back pressure of 240 kPa, there was a noticeable reduction in the output voltage when the current densities exceeded 0.5 A/cm2. It was deduced that when back pressures exceeded 60 kPa, there was an enhancement in humidification rates, a reduction in resistance losses, and an accelerated response, all contributing to improved PEMFC efficiency. However, these beneficial effects began to diminish and were potentially counteracted by intensified mass transport losses when the pressure went beyond 150 kPa [5]. In conclusion, back pressure elevates the cell’s output voltage until reaching a critical threshold at 150 kPa; beyond this pressure, it starts to impede the effective operation of the PEMFC.

3.5. Significance of Back Pressure in PEMFC Performance

Back pressure plays a crucial role in determining the performance of a PEMFC [24,25]. This research identified back pressure as a key parameter influencing the output voltage and overall efficiency of PEMFC. Its primary functions include facilitating reactant transport and maintaining conditions favorable for electrochemical reactions [5,22]. However, there is an optimal range for back pressure. While increased back pressure ensures uniform reactant distribution and optimal membrane hydration, excessive values can lead to challenges such as an uneven current distribution and increased mass transport losses. Furthermore, back pressure has implications beyond immediate performance metrics. Properly regulated back pressure can reduce degradation mechanisms, potentially extending the PEMFC’s life span [26,27]. As PEMFC technology evolves toward more efficient designs, understanding and managing the intricacies of back pressure is crucial. The findings from this study provide valuable insights for future PEMFC research and development.

4. Conclusions

This study applied the Taguchi method and orthogonal array to determine the optimal operating conditions for a single proton exchange membrane fuel cell (PEMFC). Through a systematic investigation, the parameters of interest were H2 stoichiometry, air stoichiometry, cell temperature, and the anode∙cathode back pressure. The results revealed that the optimal performance of the PEMFC was achieved with an H2 stoichiometric ratio of 1.5, air stoichiometric ratio of 2.0, cell temperature of 65 °C, and an anode∙cathode back pressure of 60 kPa.
Among the evaluated parameters, the anode∙cathode back pressure emerged as the most influential within the current density range of 0.1~0.7 A/cm2. This implies the crucial role of back pressure in managing reactant flow, ensuring adequate membrane hydration, and optimizing overall cell efficiency. However, the benefits of increasing back pressure were found to level off after 150 kPa, indicating a limit to its positive influence on cell performance.
This study reinforces the utility of the Taguchi method and orthogonal array in identifying the optimal operational conditions for PEMFCs. It also emphasizes the complex interactions among operational parameters and their combined effect on performance. The findings from this work hold significance for future investigations in enhancing PEMFC efficiency and provide guidance for commercial applications. Additional research could further explore the interrelationships between other relevant parameters within PEMFC operations.

Author Contributions

Conceptualization, K.-H.J. and J.-H.L.; Methodology, K.-H.J.; Software, K.-H.J.; Validation, K.-H.J.; Formal analysis, K.-H.J.; Investigation, K.-H.J. and J.-H.L.; Resources, K.-H.J. and J.-H.L.; Data curation, K.-H.J.; Writing—original draft preparation, K.-H.J.; Writing—review and editing, K.-H.J. and J.-H.L.; Visualization, K.-H.J.; Supervision, J.-H.L.; Project administration, J.-H.L.; Funding acquisition, J.-H.L. All authors have read and agreed to the published version of the manuscript.

Funding

This research was supported by the Basic Science Research Program through the National Research Foundation of Korea (NRF), funded by the Ministry of Education (2020R1/1A3073612).

Data Availability Statement

The data are not publicly available due to the project requirements.

Conflicts of Interest

The authors declare no conflicts of interest.

References

  1. Hu, D.; Wang, Y.; Li, J.; Yang, Q.; Wang, J. Investigation of optimal operating temperature for the PEMFC and its tracking control for energy saving in vehicle applications. Energy Convers. Manag. 2021, 249, 114842. [Google Scholar] [CrossRef]
  2. Wang, B.; Lin, R.; Liu, D.; Xu, J.; Feng, B. Investigation of the effect of humidity at both electrode on the performance of PEMFC using orthogonal test method. Int. J. Hydrogen Energy 2019, 44, 13737–13743. [Google Scholar] [CrossRef]
  3. Jang, J.H.; Chiu, H.C.; Yan, W.M.; Sun, W.L. Effects of operating conditions on the performances of individual cell and stack of PEM fuel cell. J. Power Sources 2008, 180, 476–483. [Google Scholar] [CrossRef]
  4. Kim, B.; Cha, D.; Kim, Y. The effects of air stoichiometry and air excess ratio on the transient response of a PEMFC under load change conditions. Appl. Energy 2015, 138, 143–149. [Google Scholar] [CrossRef]
  5. Zhang, Q.; Lin, R.; Técher, L.; Cui, X. Experimental study of variable operating parameters effects on overall PEMFC performance and spatial performance distribution. Energy 2016, 115, 550–560. [Google Scholar] [CrossRef]
  6. Kaytakoğlu, S.; Akyalçın, L. Optimization of parametric performance of a PEMFC. Int. J. Hydrogen Energy 2007, 32, 4418–4423. [Google Scholar] [CrossRef]
  7. Hasanzadeh, R.; Mojaver, P.; Chitsaz, A.; Mojaver, M.; Jalili, M.; Rosen, M.A. Biomass and low-density polyethylene waste composites gasification: Orthogonal array design of Taguchi technique for analysis and optimization. Int. J. Hydrogen Energy 2022, 47, 28819–28832. [Google Scholar] [CrossRef]
  8. Awolusi, T.; Taiwo, A.; Aladegboye, O.; Oguntayo, D.; Akinkurolere, O. Optimization of quinary blended supplementary cementitious material for eco-friendly paving unit using taguchi orthogonal array design. Mater. Today Proc. 2022, 65, 2221–2227. [Google Scholar] [CrossRef]
  9. Taiwo, A.E.; Madzimbamuto, T.N.; Ojumu, T.V. Optimization of process variables for acetoin production in a bioreactor using Taguchi orthogonal array design. Heliyon 2020, 6, e05103. [Google Scholar] [CrossRef]
  10. Deresse, N.C.; Deshpande, V.; Taifa, I.W. Experimental investigation of the effects of process parameters on material removal rate using Taguchi method in external cylindrical grinding operation. Eng. Sci. Technol. Int. J. 2020, 23, 405–420. [Google Scholar] [CrossRef]
  11. Chang, K.Y.; Lin, H.J.; Chen, P.C. The optimal performance estimation for an unknown PEMFC based on the Taguchi method and a generic numerical PEMFC model. Int. J. Hydrogen Energy 2009, 34, 1990–1998. [Google Scholar] [CrossRef]
  12. Chang, K.Y. The optimal design for PEMFC modeling based on Taguchi method and genetic algorithm neural networks. Int. J. Hydrogen Energy 2011, 36, 13683–13694. [Google Scholar] [CrossRef]
  13. Wu, H.W.; Ku, H.W. The optimal parameters estimation for rectangular cylinders installed transversely in the flow channel of PEMFC from a three-dimensional PEMFC model and the Taguchi method. Appl. Energy 2011, 88, 4879–4890. [Google Scholar] [CrossRef]
  14. Karthikeyan, P.; Muthukumar, M.; Shanmugam, S.V.; Kumar, P.P.; Murali, S.; Kumar, A.S. Optimization of operating and design parameters on proton exchange membrane fuel cell by using Taguchi method. Procedia Eng. 2013, 64, 409–418. [Google Scholar] [CrossRef]
  15. Lin, C.; Yan, X.; Wei, G.; Ke, C.; Shen, S.; Zhang, J. Optimization of configurations and cathode operating parameters on liquid-cooled proton exchange membrane fuel cell stacks by orthogonal method. Appl. Energy 2019, 253, 113496. [Google Scholar] [CrossRef]
  16. Xia, S.; Lin, R.; Cui, X.; Shan, J. The application of orthogonal test method in the parameters optimization of PEMFC under steady working condition. Int. J. Hydrogen Energy 2016, 41, 11380–11390. [Google Scholar] [CrossRef]
  17. Santarelli, M.G.; Torchio, M.F. Experimental analysis of the effects of the operating variables on the performance of a single PEMFC. Energy Convers. Manag. 2007, 48, 40–51. [Google Scholar] [CrossRef]
  18. Chugh, S.; Chaudhari, C.; Sonkar, K.; Sharma, A.; Kapur, G.S.; Ramakumar, S.S.V. Experimental and modelling studies of low temperature PEMFC performance. Int. J. Hydrogen Energy 2020, 45, 8866–8874. [Google Scholar] [CrossRef]
  19. Tang, X.; Zhang, Y.; Xu, S. Experimental study of PEM fuel cell temperature characteristic and corresponding automated optimal temperature calibration model. Energy 2023, 283, 128456. [Google Scholar] [CrossRef]
  20. Niya, S.M.R.; Hoorfar, M. Process modeling of the ohmic loss in proton exchange membrane fuel cells. Electrochim. Acta 2014, 120, 193–203. [Google Scholar] [CrossRef]
  21. Salva, J.A.; Iranzo, A.; Rosa, F.; Tapia, E.; Lopez, E.; Isorna, F. Optimization of a PEM fuel cell operating conditions: Obtaining the maximum performance polarization curve. Int. J. Hydrogen Energy 2016, 41, 19713–19723. [Google Scholar] [CrossRef]
  22. Reshetenko, T.V.; Bender, G.; Bethune, K.; Rocheleau, R. Systematic study of back pressure and anode stoichiometry effects on spatial PEMFC performance distribution. Electrochim. Acta 2011, 56, 8700–8710. [Google Scholar] [CrossRef]
  23. Zhang, J.; Li, H.; Zhang, J. Effect of operating backpressure on PEM fuel cell performance. ECS Trans. 2019, 19, 65. [Google Scholar] [CrossRef]
  24. Soomro, I.A.; Memon, F.H.; Mughal, W.; Khan, M.A.; Ali, W.; Liu, Y.; Choi, K.H.; Thebo, K.H. Influence of operating and electrochemical parameters on PEMFC performance. A simulation study. Membranes 2023, 13, 259. [Google Scholar] [CrossRef] [PubMed]
  25. Lu, J.B.; Wei, G.H.; Zhu, F.J.; Yan, X.H.; Zhang, J.L. Pressure effect on the PEMFC performance. Fuel Cells 2019, 19, 211–220. [Google Scholar] [CrossRef]
  26. Cai, C.; Rao, Y.; Zhang, Y.; Wu, F.; Li, S.; Pan, M. Failure mechanism of PEM fuel cell under high back pressures operation. Int. J. Hydrogen Energy 2019, 44, 13786–13793. [Google Scholar] [CrossRef]
  27. Rohendi, D.; Majlan, E.H.; Mohamad, A.B.; Daud, W.R.W.; Kadhum, A.A.H.; Shyuan, L.K. Effects of temperature and backpressure on the performance degradation of MEA in PEMFC. Int. J. Hydrogen Energy 2015, 40, 10960–10968. [Google Scholar] [CrossRef]
Figure 1. Configuration of the single PEMFC.
Energies 17 01690 g001
Figure 2. Image of the single PEMFC: (a) single PEMFC assembly, (b) flow channel of bipolar plate.
Energies 17 01690 g002
Figure 3. SC polarization method: (a) time chart of SC, (b) example of data performed under SC.
Energies 17 01690 g003
Figure 4. Polarization curves of the L9 orthogonal array.
Energies 17 01690 g004
Figure 5. Main effect plot for power voltage.
Energies 17 01690 g005
Figure 6. Comparison of polarization curves of the optimal and worst parameter.
Energies 17 01690 g006
Figure 7. Polarization curves with back pressure.
Energies 17 01690 g007
Table 1. Designed factors and their levels.
FactorsLevel
123
A: H2 stoichiometry1.52.02.5
B: Air stoichiometry1.52.02.5
C: Cell temperature (Tc), °C606570
D: Back pressure (Pb), kPa03060
Table 2. L9 orthogonal array with design factors and their levels.
TestFactors
ABCD
11 (1.5)1 (1.5)1 (60)1 (0)
21 (1.5)2 (2.0)2 (65)2 (30)
31 (1.5)3 (2.5)3 (70)3 (60)
42 (2.0)1 (1.5)2 (65)3 (60)
52 (2.0)2 (2.0)3 (70)1 (0)
62 (2.0)3 (2.5)2 (60)2 (30)
73 (2.5)1 (1.5)3 (70)2 (30)
83 (2.5)2 (2.0)2 (60)3 (60)
93 (2.5)3 (2.5)3 (65)1 (0)
Table 3. The voltage values of the L9 orthogonal array at each load (current density).
Test
Number
Current Density, A/cm2
00.10.20.30.40.50.60.7
11.0140.8280.7780.7400.7090.6770.6470.615
20.9910.8460.8020.7690.7370.710.6840.656
31.0020.8440.7980.7620.730.7010.6750.647
40.9980.8480.7990.7610.730.6990.6670.647
50.9760.8180.7680.7310.6970.6630.6350.602
61.0170.8330.7880.7510.7190.6880.6570.625
70.9920.8360.7860.7520.7220.6910.6610.629
81.0150.8460.8010.7680.740.710.6810.652
91.0040.820.7720.7350.7030.6710.6380.604
Table 4. Response table of mean effect.
LevelFactors
ABCD
10.63960.63060.6310.6073
20.62490.6370.63590.6371
30.62890.62570.62650.649
Delta0.01470.01120.00950.0417
Rank2341
Table 5. The influence ranks and optimal parameter at each current density.
Current Density, A/cm2Influence RankOptimal Parameter
0.1D > A > B > CA1B1C2D3
0.2D > A > C > BA1B2C2D3
0.3D > A > C > BA1B2C2D3
0.4D > A > B > CA1B2C2D3
0.5D > A > C > BA1B2C2D3
0.6D > A > B > CA1B2C2D3
0.7D > A > B > CA1B2C2D3
Disclaimer/Publisher’s Note: The statements, opinions and data contained in all publications are solely those of the individual author(s) and contributor(s) and not of MDPI and/or the editor(s). MDPI and/or the editor(s) disclaim responsibility for any injury to people or property resulting from any ideas, methods, instructions or products referred to in the content.

