Abstract
Pressure and flame surface oscillations are common in supersonic combustion instability. Understanding the characteristics, generation, maintenance, and interaction mechanisms of these oscillations is crucial. An experimental setup with an alcohol heater was used to study injection positions and fuel quantities in a dual-cavity scramjet combustion chamber. High-frequency pressure sensors and high-speed equipment were employed in this research. The most significant pressure oscillation occurred at a global equivalence ratio of 1.2 with a frequency of 300 Hz and an amplitude of 43%. Mean oscillation was not affected by changes in equivalence ratio. Increased amplitude was linked to stronger flow instability, indicating that flow instability induced by unstable heat release plays a significant role in supersonic combustion instability.
1. Introduction
Scramjets are a promising propulsion option for aircraft and cruise missiles due to factors like the absence of rotating parts, oxygen-free operation, and higher speed [1,2,3,4]. Scramjets are a variant of airbreathing engines like ramjets, with combustion occurring in a supersonic airflow [5,6]. Scramjets compress incoming air forcefully at high vehicle speeds before combustion, maintaining supersonic speeds throughout the engine. Advantages of scramjets include high specific impulse, simple structure, and light weight. Scramjets enable efficient operation at extremely high speeds [7,8]. Organizing efficient and stable combustion in supersonic airflow is a primary challenge for practical implementation. The problem involves complex processes like flow, mixing, and combustion as well as rapid structural changes such as shocks, boundary layers, and vortices. Supersonic combustion instability leads to continuous oscillations in pressure, flame surface, and heat release intensity. Understanding the mechanism of supersonic combustion instability is crucial for safe and stable operation and control regulation of scramjet engines. Our limited understanding of the physical mechanisms makes it challenging to analyze phenomena using numerical calculations and experimental methods [9]. Delving into phenomena at a deeper level is a viable research approach. Analyzing factors influencing the formation and sustenance of phenomena and exploring correlations between them can lead to a better understanding of supersonic combustion instability. This deeper understanding can facilitate the accumulation of valuable insights for investigating the underlying mechanisms.
Research has been conducted to address supersonic combustion instability. Various fuels have been studied including JP-7 kerosene [10], ethylene [11,12], methane [13], and hydrogen [14]. Different injection positions and combustion chamber configurations have been explored such as single [15], dual [16], and multiple cavity [17] arrangements.
Scholars are studying the relationship between pressure oscillation, flame morphology changes, and fluctuations in heat release intensity in combustion chambers. Allison et al. [18] conducted experiments at the University of Virginia to investigate flame motion and stability in a cavity flame-stabilizer combustion chamber fueled by ethylene, finding periodic oscillations at 340 Hz. Tian et al. [19] studied combustion oscillations in a similar combustion chamber using a direct-connected supersonic combustion facility and compared the results of wall static pressure FFT analysis at different conditions. Zhong et al. [20] investigated dominant frequencies related to flame oscillations in a combustion chamber using a direct supersonic combustion facility, and established the characteristic frequency range of ethylene and mixed fuels as 49–317 Hz. Wang et al. [21] conducted experiments in a direct-connected test facility to examine the combustion stability characteristics of a cavity flame-stabilizer combustion chamber fueled by ethylene under various fuel injection schemes. Notably, three fuel injection schemes resulted in the observation of distinct sharp peaks at frequencies of 150 Hz, 152 Hz, and 183 Hz. Gao et al. [22] examined the dynamic combustion characteristics of a dual-cavity combustion chamber fueled by ethylene using both numerical simulations and experimental methods. They observed peak oscillation frequencies of the flames at 156.750 Hz and 180.961 Hz for the upper and lower cavities, respectively. Quantitative analysis revealed that the average frequency of unstable combustion was approximately 200 Hz, with the dynamic process being attributed to the interaction between the shock-induced separation zone and heat release. Ouyang et al. [23,24,25] conducted a series of comparative experiments to address the combustion oscillation issue in a multi-concave combustion chamber fueled by ethylene. They observed combustion instability characterized by a dominant frequency of approximately 150 Hz. Based on their findings, they concluded that this low-frequency combustion oscillation with a large amplitude is a strongly coupled process involving injection, flow, and combustion. Many studies have examined the frequency of pressure and flame oscillations related to supersonic combustion instability. Frequency is a key aspect that has been emphasized in these investigations. Typically, researchers obtain time series data through experiments and employ appropriate processing techniques such as FFT analysis on the pressure data to extract frequency information and generate spectrum descriptions. However, limited research has been conducted on the amplitude characteristics of oscillation, especially in the context of hard oscillation where the amplitude increases significantly compared to existing oscillations. Thus, this study adopted a phenomenological approach and focused on two prevalent manifestations of supersonic combustion instability, namely pressure and flame.
The rest of the paper is organized as follows. Section 2 describes the experimental facilities and data processing methods. Pressure and flame data acquisition was achieved by pressure sensors and high-speed cameras. Section 3 discusses the results of previous experiments including injection schemes and system response characteristics at different equivalence ratios. Section 4 introduces experimental design concepts to observe strong oscillations of combustion instability to explore the system response under extreme conditions. This was defined as a global equivalence ratio of 1.2 for the fuel, and intentionally induces a broad range of changes in system inputs to investigate internal processes and correlation between hard oscillations and flame fluctuation, where a broad range of system input changes can be achieved by adjusting the global equivalence ratio to vary from 0.3 to 1.2. Section 5 rationalizes the maintenance mechanism of strong oscillations, speculates on the coupling relationship between pressure oscillations and flame surface oscillations, and analyzes reasons for the generation and maintenance of oscillations, focusing on pressure oscillations under different fuel supply strategies.
2. Facilities and Experiment
This section introduces the experimental setup used in the study, encompassing the experimental bench, measurement equipment, and data processing methods.
The experimental study in this paper was conducted on a direct-connected bench equipped with an alcohol heater. The experimental section was installed behind the nozzle of the alcohol heater. The heater simulates flight conditions at Mach 6 through oxygen/alcohol combustion, creating an airflow at the entrance of the test section with a Mach number of 2.52 and a mass flow rate of 1 kg/s. The operating time of the alcohol heater in the experiment was 9 s, the fuel injection time was 4–6 s, the fuel nozzle diameter was 0.5 mm, and aviation kerosene was used as the fuel. The wall surface of the experimental section was directly exposed to the atmosphere and had a width and height of 50 mm and 40 mm, respectively. The depth of the cavity was 8 mm, with a length to depth ratio of 7 and a rear angle of 45°. The specific configuration of the experimental section, as depicted in Figure 1, featured a dual-cavity chamber with gradual expansion on one side. The experimental section consisted of an equal straight isolator, injection section I, cavity I, injection section II, cavity II, and nozzle, all arranged along the incoming flow direction.

Figure 1.
Schematic diagram of the experimental section.
Three pairs of injectors were positioned in front of each cavity and arranged sequentially along the incoming flow direction; these were marked as Φ1, …, and Φ6, respectively. Similarly, to facilitate subsequent discussion, the fuel supply was represented by an equivalent ratio. For instance, Φ1 = 0.3 indicates that the first pair of nozzles supplies fuel at an equivalent ratio of 0.3, while in the actual experiment, the upper and lower injectors were simultaneously injected at an equivalent ratio of 0.15.
Six pressure measuring points were strategically positioned throughout the test section to obtain pressure information related to flow and combustion. The high-frequency pressure sensor used at each measuring point has a sampling rate of 128,000 Hz and an accuracy of ≤0.5% F.S. Sensor 1 was positioned at the upstream edge of the isolation section to assess the integrity of the experimental data.
Inlet unstart, whether occurring during an actual flight or experimentation, demands careful consideration and should be minimized. This is particularly crucial in the direct-connected test bench, where the presence of an alcohol heater upstream of the isolation section introduces complex challenges. The crossing of the shock front through the isolation section and the subsequent flow generated by the alcohol heater may deviate from the original experimental design conditions, thereby compromising the effectiveness of the combustion experiments.
An increase in pressure at sensor 1 was used to identify inlet unstart during the experiment. Experimental data related to inlet unstart were excluded from the analysis of the results. Measurement points 2–6 were strategically placed to gather pressure readings from specific locations within the experimental section as the pressure readings from these measurement points will be important for subsequent discussions.
Replaceable viewing windows were used to capture flame characteristics in the combustion chamber. A high-speed camera with a specialized filter records the CH* intensity at a sampling rate of 10,000 frames per second. Photographic results of injection II and cavity II are presented in Figure 2 after undergoing image processing. Grayscale images acquired with the filter were colorized frame by frame using a pseudo-color algorithm. The colorized images were rotated and arranged in chronological order to aid in further discussion.

Figure 2.
Camera image processing.
3. Influence of Injection Scheme on Combustion Oscillations
An injection scheme involves different combinations of injection locations and equivalence ratios. Our experiments aimed to study the impact of various injection schemes on combustion oscillations with the goal of understanding the engine combustion oscillation characteristics, analyzing the initial response patterns to injection scheme changes, and providing guidance in designing the operating conditions. We focused on two specific injection schemes: independent injection in cavity I and independent injection in cavity II.
3.1. Injection Scheme: Cavity I (Independent Injection)
The experiment involved independent injection in cavity I with Φ1 values of 0.3 and 0.37. The pressure results from sensors 3, 4, and 6 at Φ1 = 0.3 showed average pressure values of 1.4, 2.6, and 1.8, respectively, with an amplitude of around 8.5%, as shown in Figure 3. While the pressure results from sensors 3, 4, and 6 at Φ1 = 0.37 displayed average pressure values of 3.2, 2.7, and 1.8, respectively, with an amplitude of about 9%, as shown in Figure 4. Increasing the Φ1 value can lead to inlet unstart due to a low velocity of upstream inlet flow, causing thermal choking.
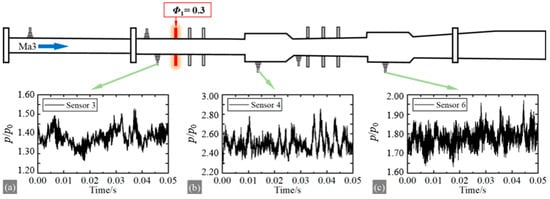
Figure 3.
Selected pressure results at Φ1 = 0.3. (a) Sensor 3; (b) Sensor 4; (c) Sensor 6.
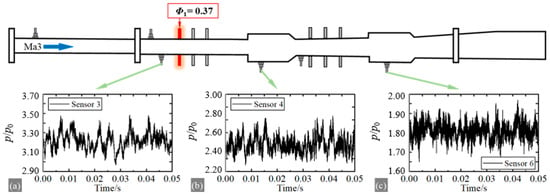
Figure 4.
Selected pressure results at Φ1 = 0.37. (a) Sensor 3; (b) Sensor 4; (c) Sensor 6.
The oscillation is generally weak with independent injection in cavity I. Oscillations below 10% are acceptable during engine operation, especially at low equivalent ratios. The pressure in cavity I rises slightly as the equivalent ratios increase, and the pressure in injection section I significantly increases with higher equivalent ratios. A slight pressure increase in cavity I can lead to significant changes in shock waves and boundary layers of the upstream flow.
3.2. Injection Scheme: Cavity II (Independent Injection)
For the independent injection in cavity II, the experiment employed Φ4 = 0.6 and Φ6 = 0.6. Figure 5 presents the pressure results from sensors 3, 4, and 6 at Φ4 = 0.6. Sensor 3 experienced intermittent shock interference characterized by the front rapidly crossing the position and quickly retreating. The average pressure values for sensors 4 and 6 were 2.5 and 3.1, respectively, with an amplitude of approximately 21%.
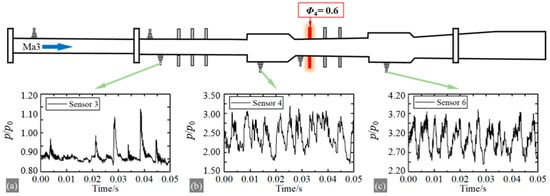
Figure 5.
Selected pressure results at Φ4 = 0.6. (a) Sensor 3; (b) Sensor 4; (c) Sensor 6.
The pressure results from sensors 3, 4, and 6 at Φ6 = 0.6 are displayed in Figure 6. Sensor 3 did not experience surge interference. The average pressure values for sensors 4 and 6 were 1.9 and 2.9, respectively, with an amplitude of approximately 22%. The backward injection position leads to the backward development of the shock front. Figure 5a and Figure 6a show weaker shock intensity with backward injection. Figure 5c and Figure 6c indicate lower cavity pressure with backward injection. These observations suggest the incomplete burning of fuel in cavity II with Φ6. A low cavity pressure implies reduced shock back pressure, weakening the shock and boundary layer separation. This condition may trigger a high-energy instability process without inlet unstart across various fuel flow variations.
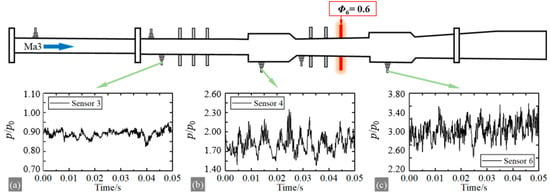
Figure 6.
Selected pressure results at Φ6 = 0.6. (a) Sensor 3; (b) Sensor 4; (c) Sensor 6.
4. Experimental Protocol and Discussion: Hard Oscillations
To induce strong oscillations in combustion instability, the design of the injection scheme must consider the following factors: (1) The ability to accommodate the highest feasible equivalent ratio; (2) Prevention of inlet unstart; (3) Ensuring sufficient combustion. Higher equivalence ratios make achieving adequate combustion more challenging and increase the risk of inlet unstart. Separate injection in cavity II using Φ4 and Φ5 simultaneously was chosen for the experiment. Φ4 was set to 0.6, and Φ5 was adjusted to create three sequential fuel supply steps: 0, 0.2, and 0.6. Each step lasted 2.0 s to allow for the complete development of flames within the combustion chamber. The most severe pressure oscillation in combustion instability was observed for sensors 3 and 6, as shown in Figure 7
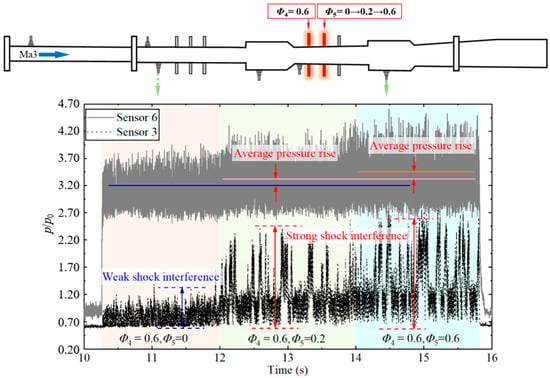
Figure 7.
Selected pressure results at [Φ4 = 0.6 & Φ5 = 0, 0.2, 0.6].
It is evident that both the mean and amplitude of pressure oscillation for sensor 6 increased with the rise in equivalence ratio. Furthermore, the front end of the shock wave intermittently disturbed sensor 3, with the disturbance intensity escalating.
The next section presents a separate discussion on the relationship between hard oscillations and the flame surface as well as the influence of equivalence ratio on oscillations.
4.1. Concomitance between Pressure Oscillation and Flame Surface Oscillation
Comparison with data from other pressure sensors revealed that the most significant oscillation took place at sensor 5, exhibiting an average pressure of approximately 350 kPa and an amplitude of around 43%, as depicted in Figure 8a. The most intense oscillation took place upstream of the combustion zone instead of in cavity II, suggesting that the oscillation was influenced not only by heat release instability, but also by additional mechanisms that supply the energy input. For a more detailed analysis, the time interval between 14.8 s and 14.9 s was chosen, as illustrated in Figure 8b. The intense oscillation displayed distinct peaks, occurring at a frequency of approximately 300 Hz. This frequency is relatively close to the reports of Allison [18], Tian [19], and Zhong et al. [20]. Moreover, the pressure curve within a timeframe of 0.012 s was selected and aligned with the starting point in time, as depicted in Figure 8c.
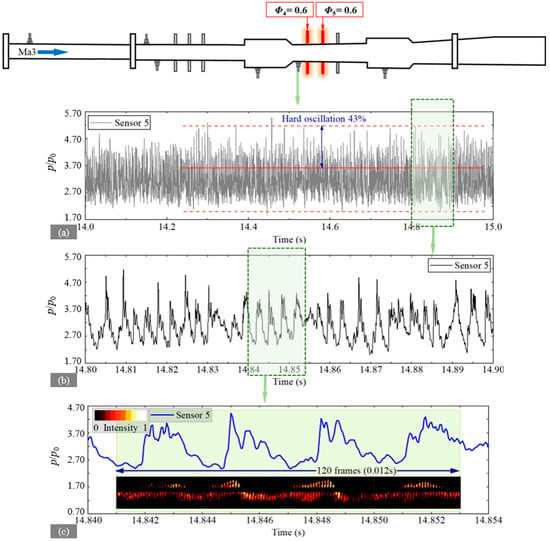
Figure 8.
Selected pictures and pressure results at [Φ4 = 0.6/Φ5 = 0.6], where (a) is 1s from sensor 5, (b) is 0.1 s from sensor 5, and (c) is a comparison of pressure and heat release in 0.012 s.
Firstly, it is evident that the flame surface exhibited continuous oscillation in the direction of flow. The distal end of the flame surface coincided with the pressure peak in the reverse flow direction, while the distal end of the flame surface in the downstream direction corresponded to the minimum value of pressure oscillation.
From a developmental perspective, the propagation of the flame surface in the direction of reverse flow corresponds to an increase in the pressure of the oscillatory process, whereas the propagation of the flame surface along the incoming flow corresponds to a decrease in the pressure of the oscillatory process. There is excellent concomitance between the flame surface and pressure.
The position of the flame surface is determined by the interplay of three processes: flow, mixing, and flame propagation. The elevated pressure measured by sensor 5 indicates, based on the compressible flow equation, a decrease in flow velocity within the main flow zone at this position. A lower flow velocity allows for greater fuel penetration depth during injection, resulting in shorter mixing times. Reduced flow velocity and shorter mixing times result in a narrower mixing zone.
At this stage, the downstream flame rapidly propagates within a fully premixed airflow. The reduced flow velocity hinders flame blowback during reverse propagation, leading to the continuous forward advancement of the flame surface within the narrower mixing zone.
However, if only the aforementioned process is taken into account, the system solution will eventually converge to a stable equilibrium after a developmental period, where the pressure measured by sensor 5 remains constant and the position of the flame surface remains unchanged. In reality, as the flame progresses forward, the pressure in cavity II continues to decrease, resulting in a reduction in shock back pressure, making it challenging to maintain the existing shock and boundary layer structure. The self-organizing nature of the flow diminishes the pressurization capability of the upstream shock wave to reestablish its front-to-back pressure differential. This, in turn, causes a decrease in pressure measured by sensor 5 and an increase in velocity within the mainstream region.
Subsequent progression is contrary to the earlier developmental process, ultimately resulting in the propagation of the flame surface in the direction of the incoming flow. The oscillations observed in the flame surface and pressure arise from the alternating interplay of the aforementioned processes. The fundamental reason for combustion oscillation is the strong coupling effect between the capture and pressurization process of working fluid in the intake duct and the mixing and heat release process in the combustion chamber. When the flame burns in the cavity, the pressure in the cavity gradually increases, leading to boundary layer separation and shock wave propagation. The forward development of the shock wave will lead to an increase in the penetration depth of the fuel jet and an improvement in mixing efficiency, which promotes the flame to propagate forward from the concave cavity to the injection section. However, when the flame burns in the injection section, it cannot provide the back pressure to maintain the current shock wave, which will cause the shock wave and boundary layer to disappear. At this time, the flame in the injection section is blown back or even extinguished, and the combustion returns to the cavity. Oscillation is the repetition of the above process. This is similar to the flame flashback mechanism reported by Zhao [26].
4.2. Sensitivity of Pressure Oscillations to Changes in Equivalence Ratio
Figure 9 illustrates that both the average value and amplitude of pressure oscillations at sensor 6 increased as the equivalence ratios increased, although the magnitude of the increase varied. Here p* is the reference pressure, determined by the local atmospheric pressure. To further elucidate this issue, four additional experiments were conducted to statistically analyze the relationship between the pressure oscillations and the global equivalence ratio. These experiments were performed under various operating conditions, namely Φ4 = 0.6/Φ5 = 0.1, Φ4 = 0.6/Φ5 = 0.3, Φ4 = 0.6/Φ5 = 0.4, and Φ4 = 0.6/Φ5 = 0.5, as depicted in Figure 9. The amplitude was 51 at an equivalence ratio of 0.6, but 101 at an equivalence ratio of 1.2. With a 100% increase in the equivalence ratio, the average pressure rose by 6.33%, and the amplitude also experienced an approximately 100% increase.

Figure 9.
Pressure response at different ΣΦ.
The slight increase of 6.33% in average pressure suggests the existence of an upper threshold for the fuel equivalence ratio that the fuel can be fully combusted within the flame-stabilized cavity. Any excess fuel will undergo combustion in the downstream structure along with the flow. Considering the complete combustion of fuel, when the fuel’s equivalence ratio increases from 0.6 to 1.0, the heat released during combustion should also increase by 66.7%. All of this heat is used to heat the combustion products, so the average pressure in the combustion chamber should also increase by 66.7%. However, in the experimental results, the average pressure only increased by about 3%.
When there was a slight increase in the overall heat release within cavity II, the amplitude of pressure oscillation experienced a significant increase. Referring to the discussion on the flame structure and combustion mode of diffusion combustion in a supersonic combustion chamber in the literature [27,28], this is possibly attributable to two factors:
- (1)
- Inhomogeneity in local mixing increased as the equivalence ratio rose, leading to greater heat release instability and stronger pressure oscillations. The most intense pressure oscillation was expected to occur at sensor 6 in the concave cavity, but the experimental findings showed that sensor 5 experienced the most substantial pressure oscillation with an amplitude of 150 kPa, surpassing sensor 6’s measurement of 100 kPa. The dominance of heat release instability as a factor in pressure oscillations is questioned based on the experimental results.
- (2)
- Although the intensity of heat release instability remained relatively constant or exhibited minimal growth, the higher equivalence ratio stimulated a new and more pronounced instability mechanism, subsequently resulting in heightened pressure oscillations, as depicted in Figure 10.
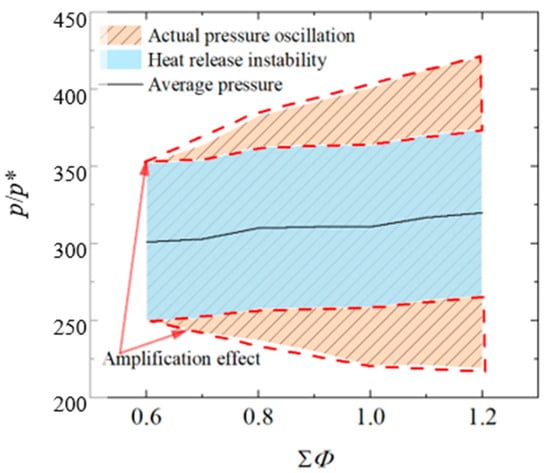 Figure 10. Amplification effect under the assumption of the approximate invariance of heat release instability.
5. Mechanisms for Amplifying Pressure Oscillations
This section examines the mechanisms responsible for amplifying pressure oscillations during changes in equivalence ratio. Specifically, it evaluates the strength of three mechanisms: acoustic resonance, heat release instability, and flow instability.
Combustion instability in conventional aircraft engines is commonly attributed to thermoacoustic instability in subsonic combustion, where amplification occurs through acoustic resonance within the combustion chamber. Thermoacoustic oscillation refers to the sound wave vibration generated through thermodynamic effects. When a gas is heated, the average kinetic energy of the molecules increases, and their average distance increases, which leads to a decrease in gas density and the formation of sound wave vibration. However, scramjet engines typically lack chambers that can generate substantial resonance. As an illustration, the dual-cavity combustion chamber examined in this study exhibits an acoustic resonance frequency above 1000 Hz. Nevertheless, research has revealed that oscillations in supersonic combustion lack the narrow spectrum characteristics associated with acoustic resonance in the frequency domain [29,30]. The speculation on the mechanism of oscillation amplification based on the test results in this paper is consistent with the analysis in the above literature. Instead, the high Mach number inlet flow in supersonic combustion, rendering the air more compressible, results in significantly stronger flow instability compared to subsonic combustion.
Building upon the preceding discussion regarding the intensity of heat release instability, it can be inferred that flow instability induced by heat release instability plays a dominant role in generating strong pressure oscillations. It is recommended that Figure 10 be presented in the format of Figure 11 to illustrate this distinction, which serves as a fundamental difference between supersonic and subsonic combustion instabilities. This distinction warrants special attention in conducting control-oriented research. Control methods for supersonic combustion instability should prioritize suppressing flow instability.
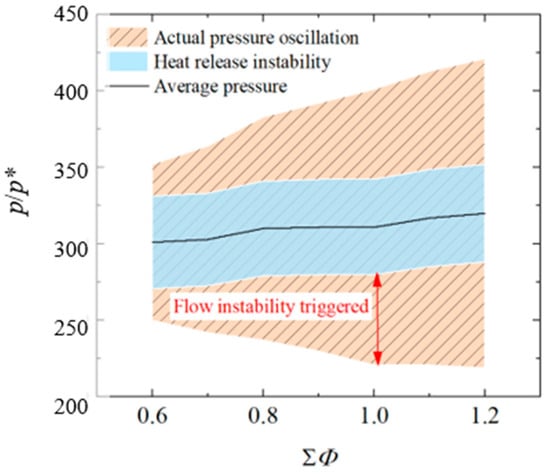
Figure 11.
Flow instability: the amplification effect of oscillations.
6. Conclusions
This study investigated the pressure response characteristics of supersonic combustion instability through the application of various injection schemes. By changing the fuel supply strategy, a large amplitude combustion oscillation was observed through a large number of experiments, which manifested as a large oscillation of the pressure and flame surface. By analyzing the coupling relationship between pressure oscillation and flame surface fluctuation, the concomitant relationship between pressure and flame surface was revealed, and the oscillation process described. The analysis suggests that flow instability, rather than heat release process, is expected to dominate the occurrence of strong pressure oscillation.
Author Contributions
W.L. and N.W.: Methodology; W.L. and Y.C.: Writing—original draft preparation. All authors have read and agreed to the published version of the manuscript.
Funding
This research received no external funding.
Data Availability Statement
The original contributions presented in the study are included in the article, further inquiries can be directed to the corresponding authors.
Conflicts of Interest
The authors declare no conflicts of interest.
References
- Oevermann, M. Numerical investigation of turbulent hydrogen combustion in a scramjet using flamelet modeling. Aerosp. Sci. Technol. 2000, 4, 463–480. [Google Scholar] [CrossRef]
- Dharavath, M.; Manna, P.; Chakraborty, D. Thermochemical exploration of hydrogen combustion in generic scramjet combustor. Aerosp. Sci. Technol. 2013, 24, 264–274. [Google Scholar] [CrossRef]
- Shin, J.; Sung, H.G. Combustion characteristics of hydrogen and cracked kerosene in a dlr scramjet combustor using hybrid rans/les method. Aerosp. Sci. Technol. 2018, 80, 433–444. [Google Scholar] [CrossRef]
- Kim, J.W.; Kwon, O.J. Modeling of incomplete combustion in a scramjet engine. Aerosp. Sci. Technol. 2018, 78, 397–402. [Google Scholar] [CrossRef]
- Cai, Z.; Zhu, J.; Sun, M.; Wang, Z. Effect of cavity fueling schemes on the laser-induced plasma ignition process in a scramjet combustor. Aerosp. Sci. Technol. 2018, 78, 197–204. [Google Scholar] [CrossRef]
- Cecere, D.; Ingenito, A.; Giacomazzi, E.; Romagnos, L.; Bruno, C. Hydrogen/air supersonic combustion for future hypersonic vehicles. Int. J. Hydrogen Energy 2011, 36, 11969–11984. [Google Scholar] [CrossRef]
- O’Brien, T.F.; Starkey, R.P.; Lewis, M.J. Quasi-one-dimensional high-speed engine model with finite-rate chemistry. J. Propuls. Power 2001, 17, 1366–1374. [Google Scholar] [CrossRef]
- Urzay, J. Supersonic combustion in air-breathing propulsion systems for hypersonic flight. Annu. Rev. Fluid Mech. 2018, 50, 593–627. [Google Scholar] [CrossRef]
- Qili, L.; Damiano, B.; Tonghun, L. Review of combustion stabilization for hypersonic air-breathing propulsion. Prog. Aerosp. Sci. 2022, 119, 100636. [Google Scholar]
- Ma, F.; Li, J.; Yang, V.; Lin, K.-C.; Jackson, T. Thermoacoustic flow instability in a scramjet combustor. In Proceedings of the 41st AIAA/ASME/SAE/ASEE Joint Propulsion Conference & Exhibit, Tucson, AZ, USA, 10–13 July 2005; AIAA: Reston, VA, USA, 2005; p. 3824. [Google Scholar]
- Peng, J.; Gao, L.; Yu, X.; Qin, F.; Liu, B.; Cao, Z.; Wu, G.; Han, M. Combustion oscillation characteristics of a supersonic ethylene jet flame using high-speed planar laser-induced fluorescence and dynamic mode decomposition. Energy 2022, 239, 122330. [Google Scholar] [CrossRef]
- Lin, K.-C.; Jackson, K.; Behdadnia, R.; Jackson, T.A.; Ma, F.; Yang, V. Acoustic characterization of an ethylene-fueled scramjet combustor with a Acoustic characterization of an ethylene-fueled scramjet combustor with a cavity flameholder. J. Propuls. Power 2010, 26, 1161–1170. [Google Scholar] [CrossRef]
- Peng, J.; Cao, Z.; Yu, X.; Yang, S.; Yu, Y.; Ren, H.; Ma, Y.; Zhang, S.; Chen, S.; Zhao, Y. Analysis of combustion instability of hydrogen fueled scramjet combustor on high-speed OH-PLIF measurements and dynamic mode decomposition. Int. J. Hydrogen Energy 2020, 45, 13108–13118. [Google Scholar] [CrossRef]
- Fotia, M.L.; Driscoll, J.F. Ram-scram transition and flame/shock-train interactions in a model scramjet experiment. J. Propuls. Power 2013, 29, 261–273. [Google Scholar] [CrossRef]
- Li, J.; Ma, F.; Yang, V.; Lin, K.-C.; Jackson, T. A comprehensive study of ignition transient in an ethylene-fueled scramjet combustor. In Proceedings of the 43rd AIAA/ASME/SAE/ASEE Joint Propulsion Conference & Exhibit, Cincinnati, OH, USA, 8–11 July 2007; AIAA: Reston, VA, USA, 2007; p. 5025. [Google Scholar]
- Yuan, Y.; Zhang, T.; Yao, W.; Fan, X. Study on flame stabilization in a dual-mode combustor using optical measurements. J. Propuls. Power 2015, 31, 1524–1531. [Google Scholar] [CrossRef]
- Zhao, G.-Y.; Sun, M.-B.; Song, X.-L.; Li, X.-P.; Wang, H.-B. Experimental investigations of cavity parameters leading to combustion oscillation in a supersonic crossflow. Acta Astronaut. 2019, 155, 255–263. [Google Scholar] [CrossRef]
- Allison, P.M.; Frederickson, K.; Kirik, J.W.; Rockwell, R.D.; Lempert, W.R.; Sutton, J.A. Investigation of supersonic combustion dynamics via 50 kHz CH* chemiluminescence imaging. Proc. Combust. Inst. 2017, 36, 2849–2856. [Google Scholar] [CrossRef]
- Tian, X.; Chen, L.; Gu, H.; Liu, C.; Cheng, L.; Chang, X. Experimental study of combustion oscillations in a dual-mode scramjet. In Proceedings of the 20th AIAA International Space Planes and Hypersonic Systems and Technologies Conference, Glasgow, Scotland, 6–9 July 2015; p. 3587. [Google Scholar]
- Zhong, F.; Cheng, L.; Gu, H.; Zhang, X. Experimental study of flame characteristics of ethylene and its mixture with methane and hydrogen in supersonic combustor. Aerosp. Sci. Technol. 2019, 86, 775–781. [Google Scholar] [CrossRef]
- Wang, Z.-G.; Sun, M.-B.; Wang, H.-B.; Yu, J.-F.; Liang, J.-H.; Zhuang, F.-C. Mixing-related low frequency oscillation of combustion in an ethylene-fueled supersonic combustor. Proc. Combust. Inst. 2015, 35, 2137–2144. [Google Scholar] [CrossRef]
- Gao, T.; Liang, J.; Sun, M.; Zhong, Z. Dynamic combustion characteristics in a rectangular supersonic combustor with single-side expansion. Proc. Inst. Mech. Eng. Part G J. Aerosp. Eng. 2017, 231, 1862–1872. [Google Scholar] [CrossRef]
- Ouyang, H.; Liu, W.; Sun, M. Parametric study of combustion oscillation in a single-side expansion scramjet combustor. Acta Astronaut. 2016, 127, 603–613. [Google Scholar] [CrossRef]
- Ouyang, H.; Liu, W.; Sun, M. The influence of cavity parameters on the combustion oscillation in a single-side expansion scramjet combustor. Acta Astronaut. 2017, 137, 52–59. [Google Scholar] [CrossRef]
- Ouyang, H.; Liu, W.; Sun, M. The large-amplitude combustion oscillation in a single-side expansion scramjet combustor. Acta Astronaut. 2015, 117, 90–98. [Google Scholar] [CrossRef]
- Zhao, G.; Sun, M.; Wu, J.; Cui, X.; Wang, H. Investigation of flame flashback phenomenon in a supersonic crossflow with ethylene injection upstream of cavity flameholder. Aerosp. Sci. Technol. 2019, 87, 190–206. [Google Scholar] [CrossRef]
- Ruan, J.L.; Domingo, P.; Ribert, G. Analysis of combustion modes in a cavity-based scramjet. Combust. Flame 2020, 215, 238–251. [Google Scholar] [CrossRef]
- Mitani, T.; Kouchi, T. Flame structures and combustion efficiency computed for a Mach 6 scramjet engine. Combust. Flame 2005, 142, 187–196. [Google Scholar] [CrossRef]
- Vinogradov, V.A.; Kobigskij, S.A.; Petrov, M.D. Experimental investigation of kerosene fuel combustion in supersonic flow. J. Propuls. Power 1995, 11, 130–134. [Google Scholar] [CrossRef]
- Gruber, M.R.; Baurle, R.A.; Mathur, T.; Hsu, K.Y. Fundamental studies of cavity-based flameholder concepts for supersonic combustors. J. Propuls. Power 2001, 17, 146–153. [Google Scholar] [CrossRef]
Disclaimer/Publisher’s Note: The statements, opinions and data contained in all publications are solely those of the individual author(s) and contributor(s) and not of MDPI and/or the editor(s). MDPI and/or the editor(s) disclaim responsibility for any injury to people or property resulting from any ideas, methods, instructions or products referred to in the content. |
© 2024 by the authors. Licensee MDPI, Basel, Switzerland. This article is an open access article distributed under the terms and conditions of the Creative Commons Attribution (CC BY) license (https://creativecommons.org/licenses/by/4.0/).