Article

Assessing the Paradox of Autonomous Vehicles: Promised Fuel Efficiency vs. Aggregate Fuel Consumption

by
Dilshad Mohammed
1,2,† and
Balázs Horváth
2,*,†
1
Department of Civil Engineering, University of Duhok, Duhok 42001, Iraq
2
Department of Transport, Széchenyi István University, Egyetem tér 1, 9026 Győr, Hungary
*
Author to whom correspondence should be addressed.
These authors contributed equally to this work.
Energies 2024, 17(7), 1589; https://doi.org/10.3390/en17071589
Submission received: 16 February 2024 / Revised: 21 March 2024 / Accepted: 23 March 2024 / Published: 26 March 2024
(This article belongs to the Section I1: Fuel)

Abstract

:
As autonomous vehicles (AVs) continue to evolve and approach widespread adoption in the near future, the touted benefits of improved fuel efficiency at an individual level come under scrutiny when considering the overall impact on fuel consumption. This research delves into the paradoxical relationship between the promising technology of AVs, their impact on traffic capacities, travel demand, and the subsequent influence on aggregate fuel consumption. While AVs have demonstrated enhanced fuel efficiency when considered as a singular mode of transportation, our study reveals a contrasting trend when scaled to a broader societal context. Through comprehensive analysis of the literature, we discovered that, at lower limits of energy savings achievable by a single AV, the overall fuel consumption increases by a staggering 42% compared to conventional human-driven vehicles. This counterintuitive outcome is a result of the aggregate effect of increased AV usage, leading to higher traffic volumes and travel demands. Conversely, at higher thresholds of energy savings by individual AVs, the percentage of fuel consumption increment diminishes, but remains notable. Even with advanced energy-saving features, the overall fuel quantity still experiences a substantial 30% increase compared to conventional vehicles when scaled up to widespread AV use. Our findings emphasize the importance of considering the holistic impact of AVs on transportation systems and energy consumption. As society transitions towards AV-dominated traffic, policymakers and stakeholders must address the challenges associated with increased travel demand, potential traffic congestion, and the resultant implications on fuel consumption.

1. Introduction

Autonomous vehicles (AVs) are revolutionizing the transportation landscape, promising safer and more efficient journeys [1,2,3]. The focus is specifically on AVs within the context of road transportation, primarily considering autonomous cars. While acknowledging the existence of other types of AVs, like drones and sea surface craft, the analysis centers on their impact within the road transportation sector. However, AVs impact on fuel consumption is a critical aspect that demands attention. This exploration delves into how AVs may influence fuel usage, considering technological advancements and systemic changes. Understanding this relationship is vital as we navigate a future where AVs play a prominent role in shaping the automotive industry and its environmental footprint. This aspect has evolved significantly over the last 25 years, in which advancements in technology, including the adoption of cleaner energy sources and more efficient manufacturing processes, have led to a notable reduction in emissions and resource consumption. However, the emergence of AVs introduces new dynamics that may necessitate a reassessment of our understanding of the environmental impact of the automotive industry.
It is believed that a comprehensive assessment of fuel consumption in the era of automated driving must consider the overall impact of increased travel demand, facilitated by AVs [4,5]. While AVs can improve fuel efficiency at the vehicle level through powertrain operation, as stated by Sigle and Hahn [6], and driving pattern planning, as suggested by Wang et al. [7]. The potential surge in travel due to increased convenience and accessibility may counteract these gains [8,9]. Additionally, the introduction of AVs may lead to transformative shifts in traffic dynamics, affecting capacities and congestion patterns [10,11,12,13]. AVs can streamline traffic flow through communication and coordination, potentially optimizing fuel use [14]. However, uncertainties arise regarding the coexistence of AVs with human-driven vehicles, which may impact overall traffic capacities [15]. Yet, it is worth considering that this surge in travel may not necessarily be entirely novel; some drivers may transition to becoming AV users, potentially mitigating some of the anticipated increase in traffic congestion. Furthermore, innovative strategies such as implementing shared AV schemes could offer a promising solution, allowing multiple commuters sharing the same route to benefit from a single AV. Additionally, acknowledging the shift towards electric propulsion in many AVs, such as Waymo’s utilization of the fully electric Jaguar I-PACE SUV, highlights the potential for reducing overall emissions and fuel consumption in the transportation sector. This transition from human-driven vehicles equipped with internal combustion engines to electric AVs presents a compelling prospect for sustainability. In essence, a holistic evaluation of fuel consumption in the era of automated driving necessitates an exploration of the macroscopic implications arising from changes in travel demand and the evolving landscape of traffic flow dynamics.
In the domain of projecting future expected fuel consumption, the advent of AVs has introduced a large number of methodologies, ranging from simulation models [16,17,18], to surveys gauging public perceptions [19] and development of analytical frameworks [20,21]. While these approaches have provided valuable insights, the landscape remains marked by a scarcity of real-world applications. However, conducting an in-depth investigation is crucial to estimate fuel consumption on a large scale, as it involves the intricate interplay between traffic flow, capacity, and travel demand on one side, and the corresponding anticipated total fuel consumption on the other side. The selection of these key factors is based on their significance. Traffic capacity provides insights for planners regarding the maximum load a transportation system can bear, while real-time traffic flow data measures the system’s efficiency. Additionally, considering travel demand ensures a holistic understanding of the population’s transportation needs. As we stand at the intersection of technological advancements and transportation dynamics, appreciating the intricate interplay between these variables is essential for crafting effective policies and strategies to navigate the dynamic landscape of fuel consumption in the age of AVs. This research endeavors to explore the uncharted territory of forthcoming fuel consumption patterns amid advancements in autonomous vehicular technology. It aims to estimate future fuel consumption in the presence of AVs, building upon the data and findings from prior research to enhance and complete the overall objectives of the study.
The remainder of this paper is organized as follows: Section 2 outlines the detailed methodology used in providing data and presenting the findings of the literature review used for the analysis in this study. In Section 3, we present the results of total fuel consumption attributed to the use of AVs, drawing connections to the findings from our previous studies. Section 4 discusses the reported results and presents the final percentages of increment and decrement in fuel consumption. Finally, in Section 5, we conclude with some final remarks and a discussion of the future directions of this paper.

2. Methodology

The methodology employed in this study to determine the overall fuel consumption by AVs in our societies relies on changes in traffic capacities and travel demand resulting from the introduction of these vehicles. For this purpose, the following main types of data have been used: On-Board Diagnostic (OBD) data to calculate fuel consumption for individual vehicles, the percentage increment or decrement of fuel consumption for an individual AV compared to a Human-Driven Vehicle (HDV), and the traffic capacity and travel demand for both HDVs and AVs. In the following subsections, the procedures used in this study are explained in detail.

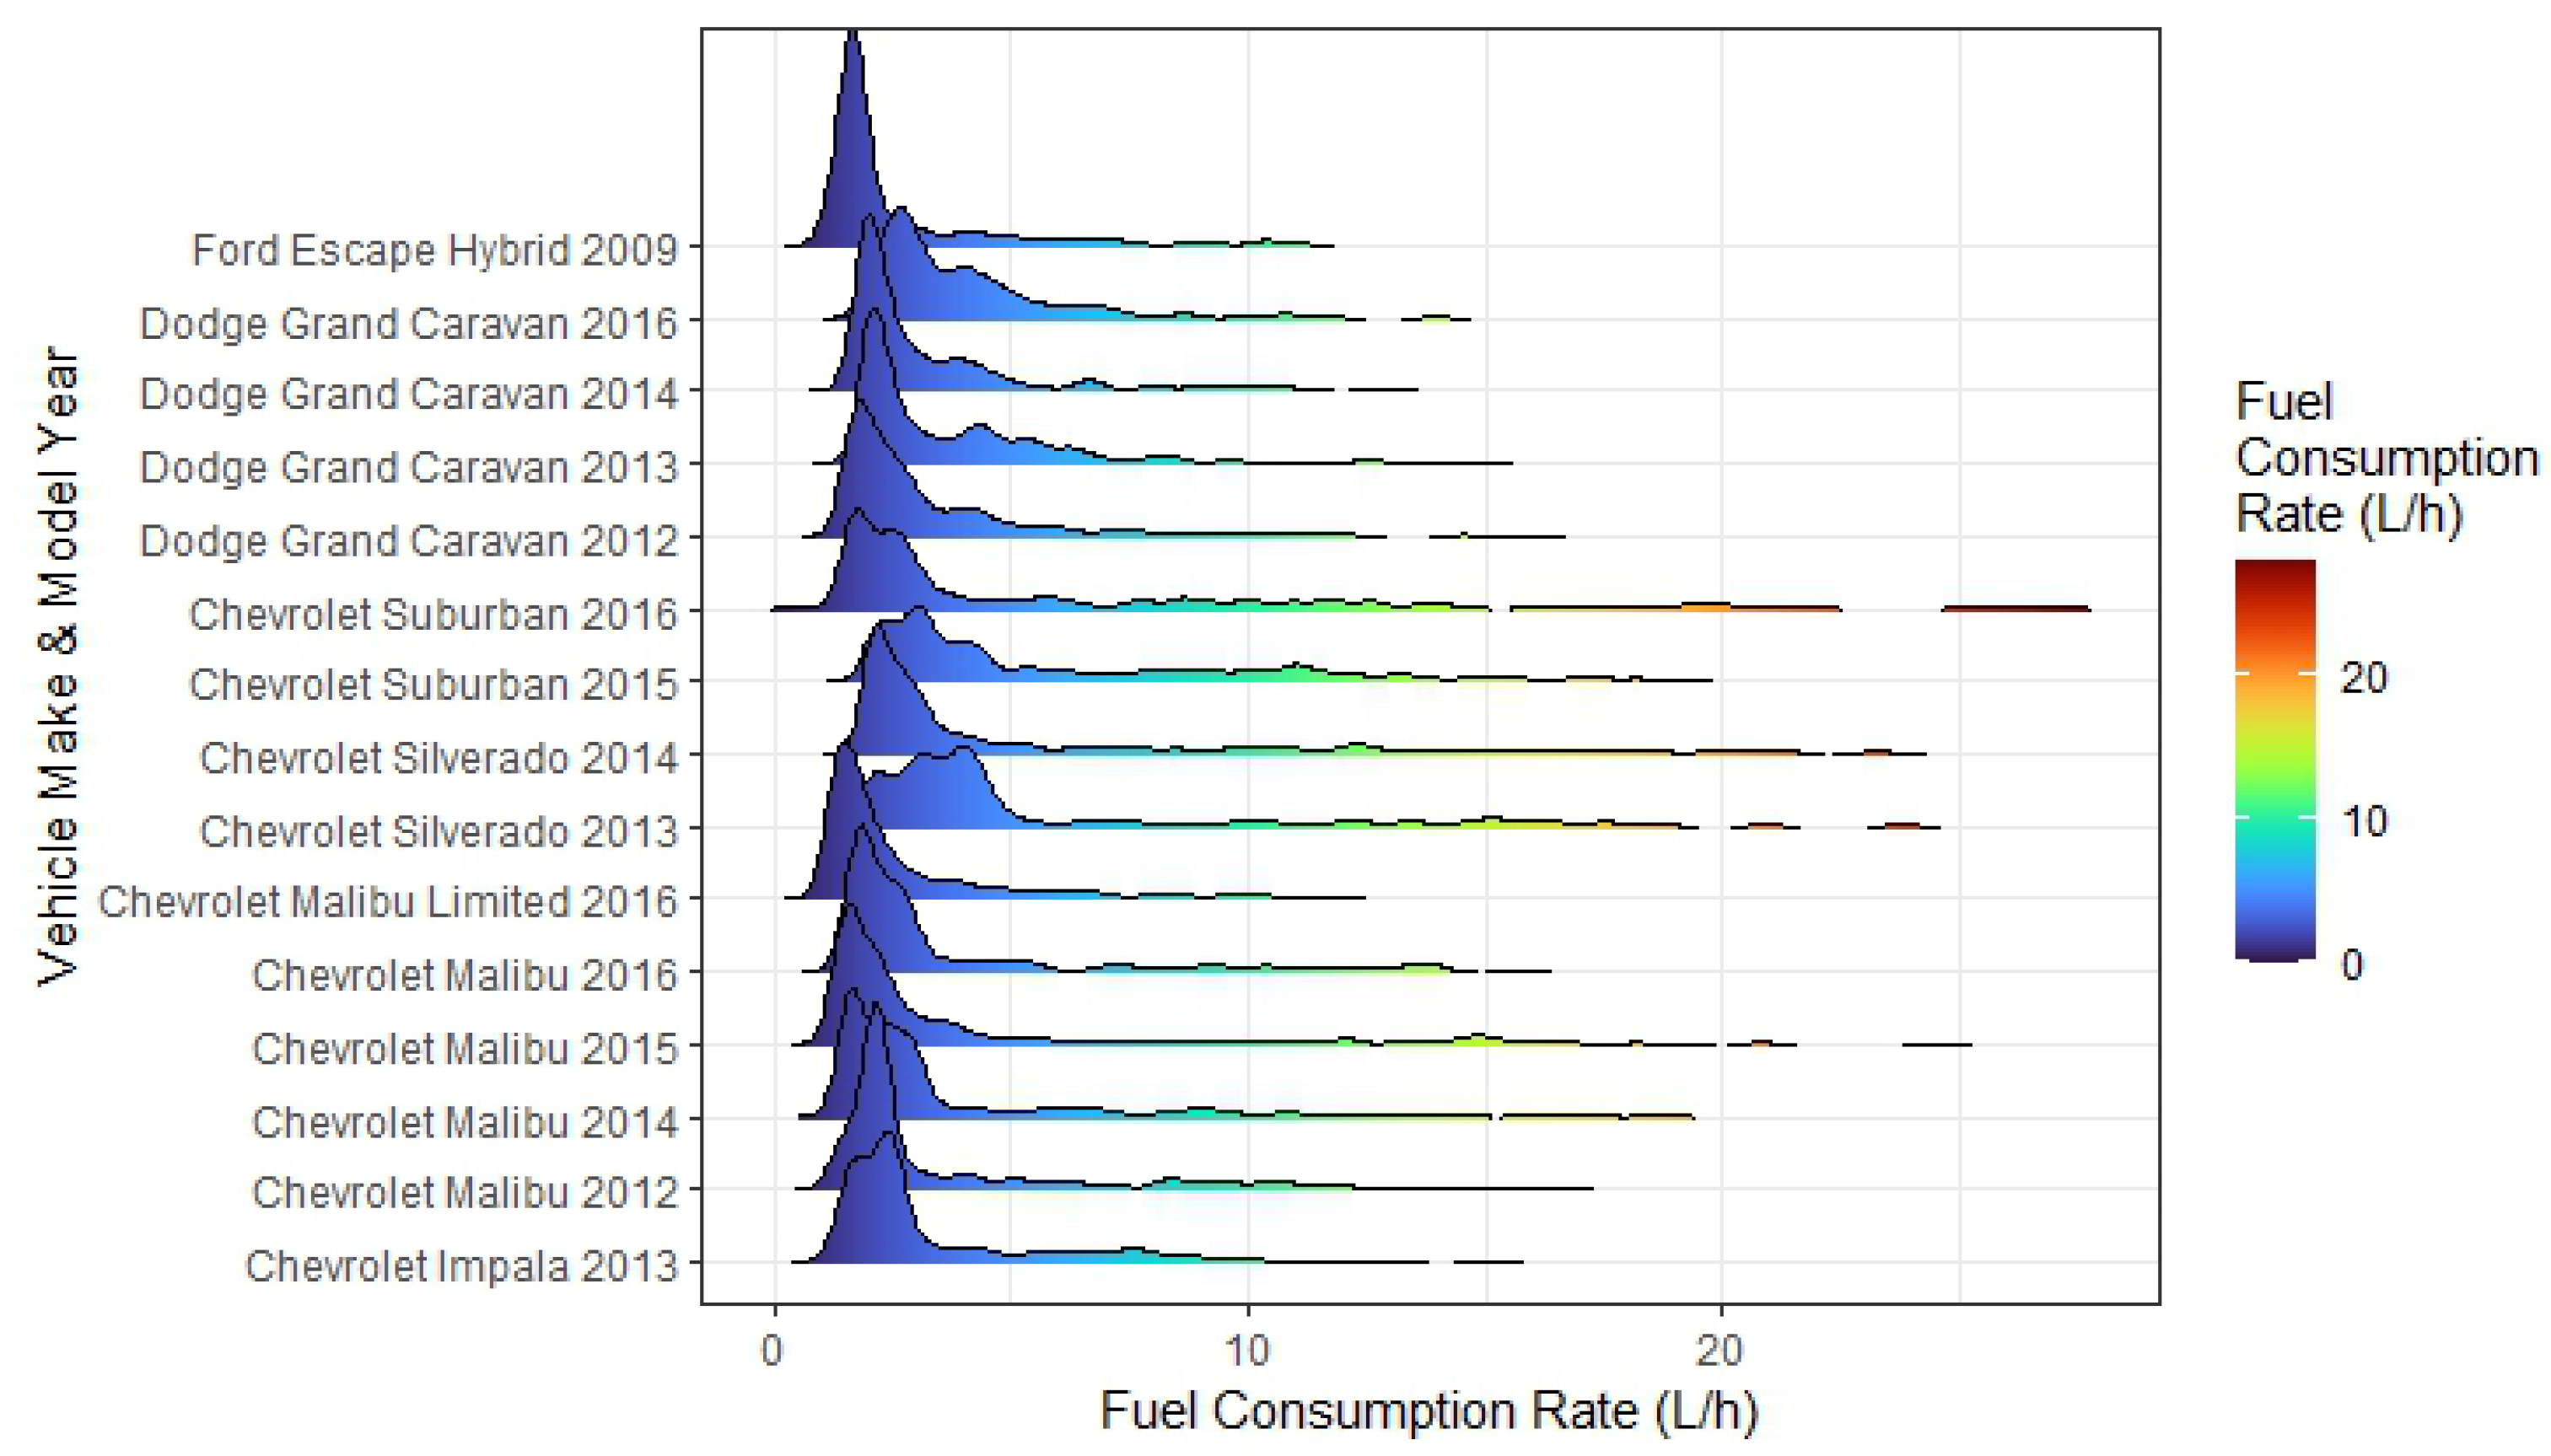
2.1. On-Board Diagnostics for Measuring Human-Driven Vehicle Fuel Consumption Rates

The study relies on the data obtained from the experiments presented in [22]. In the conducted experiment, a fleet of 15 passenger vehicles, each equipped with data acquisition hardware, was employed. The in-vehicle fuel data were collected using OBD-II standard interfaces available in most modern vehicles. While OBD-II primarily focuses on detecting and reporting faults and malfunctions, it can also provide valuable information related to fuel consumption rates. It is noteworthy that, to prevent redundancy, fuel data from only 15 vehicles was utilized in our study, as outlined below in Table 1. An important finding from the data of the experiment is that the maximum recorded driving speed was 50 km/h.
This level of speed is of particular significance, and will be further elaborated upon in subsequent sections of this paper, aligning with our proposed approach. Figure 1 illustrates the tested vehicles along with the corresponding fuel rate, obtained from an average of 10,000 OBD-II readings for each vehicle. The peak of each curve corresponds to the highest number of observations for the respective fuel consumption rate.

2.2. Fuel Consumption Saving Rates Using Single AVs

In this subsection, a diverse range of existing literature has been leveraged to assess the potential fuel consumption savings associated with the transition from human-driven vehicles to AVs for individual movements. Recognizing the inherent challenges posed by the continuously expanding body of literature on this emerging topic, the analysis in the study focused on four distinct areas of energy impact: car-following, platooning, powertrain, and intersection control. Motivated by Noroozi et al. [9], this categorization facilitated a systematic exploration of the impact of AV technology on fuel efficiency, enabling a comprehensive understanding of the associated fuel savings percentages. Organizing our investigation into these key domains allowed us to address the complexities of estimating fuel consumption savings in the context of AVs and contribute valuable insights to the existing literature.

2.2.1. Car-Following

Car-following behavior in an AVs involves dynamically adjusting its speed and maintaining a safe following distance from the vehicle ahead, based on real-time sensor inputs, optimizing traffic flow and ensuring safety. Additionally, car-following models, such as adaptive cruise control (ACC), cooperative ACC (CACC), and intelligent driver model (IDM), have been used to evaluate the impact of AVs on fuel consumption savings. Studies have shown that AVs equipped with ACC and CACC modes have lower fuel consumption compared to HDVs [23,24,25,26]. However, the fuel consumption of AVs may be influenced by factors such as headway settings, speed ranges, and traffic conditions [27,28]. Even though this may represent a small influence, knowing that HDVs are also affected by the factors mentioned, our study considered the same conditions when comparing fuel consumption between HDVs and AVs. Through presenting the literature results, Zhu et al. [29] found that, when traveling at similar conditions, the fuel consumption rates for vehicles using ACC mode was about 7% lower than those vehicles in non-ACC mode. Similarly, Mersky et al. [18] indicated that AV following algorithms developed without prioritizing efficiency may lead to a fuel economy reduction of up to 3%. In contrast, control strategies focused on efficiency could match or slightly surpass the current Environmental Protection Agency (EPA) fuel economy test results by as much as 10%. Khosravinia et al. [30] presented a bi-level model predictive control strategy in their study to optimize energy savings. The simulation results show a 6.18% reduction in the fuel economy. Some researchers have used the vehicle-specific power (VSP) model presented in [31] to calculate the fuel economy. Shi et al. [32] demonstrated that 7.16% of fuel could be saved using VSP model when driving at ACC headway setting 1. Along the same line, Zhang et al. [33] reported an approximate average saving of fuel 10% for driving speeds 20 km/h to 40 km/h, calculated using the VSP model. Overall, while there are a few studies suggesting a potential increase in fuel consumption when AVs are in operation [16,34], the majority of research papers confirm that there will likely be a reduction in fuel consumption for single AV driving.

2.2.2. Platooning

This strategy refers to coordinated and synchronized driving formation, where a group of vehicles travel closely together in a convoy, to enhance aerodynamic efficiency and reduce fuel consumption. Reduced drag resulting from platooning relies on factors like the shapes of the vehicles, their arrangement, and the following distances between them. Energy savings are more significant for vehicles positioned in the middle of the convoy; thus, the average savings rise as the number of vehicles in the platoon increases. It is worth mentioning that platooning is an applicable procedure that could be applied for both vehicles and trucks. In vehicles platooning, like cars, vans, or AVs, the following distances may exhibit greater variability due to differences in braking capabilities, acceleration rates, and overall vehicle sizes. Smaller vehicles often necessitate shorter following distances, owing to their superior braking capabilities and reduced stopping distances compared to larger ones. Conversely, in truck platooning, involving closely following commercial trucks, following distances tend to be more standardized and optimized, considering factors such as truck size, weight, and braking performance. These distances are carefully calibrated to strike a balance between safety and aerodynamic efficiency. Studies proved that vehicles facilitated by automated control systems achieved higher fuel savings than human driven vehicles. Song et al. [35] showed that an average fuel-saving of 3.8–8.9% could be achieved when two autonomous truck platoons are used. Hoef et al. [36] concluded that coordinated platoons led to 7.6% reduction in fuel consumption. Yang et al. [37] reported a 9.5% improvement in fuel consumption for the Connected Autonomous Vehicles (CAVs) compared to the HDVs. Tsugawa [38] conducted experiments on a convoy comprising three automated trucks traveling at 80 km/h. The decrease in energy usage amounted to 13% with a 10 m gap when the penetration rate reached 40% for heavy automated trucks. Lu and Shladovar [39] also investigated a platoon of three trucks with 6 m gaps. The findings indicate potential fuel savings of 4.3%, 10%, and 14% for the lead, second, and third trucks, respectively. In general, by consolidating findings from multiple studies in the literature, it becomes apparent that the primary factor contributing to energy savings is the inter-vehicles distances in the platoon.

2.2.3. Powertrain

In the powertrain-free approach, the energy indicator focuses solely on the tractive power demand exerted on the wheels [40,41]. Chen et al. [42] determined that in an optimistic AV Level 5 scenario, there could be energy economy improvements ranging from 4% to 8%, while a pessimistic AV Level 5 scenario might lead to an increase in energy economy ranging from 10% to 15%. Huang et al. [43] found from the simulation results that driving at different cycles with CAVs led to 5–15% improvement in the fuel economy. Zhang et al. [44] introduced was a flexible energy management strategy utilizing an equivalent consumption minimization strategy (ECMS) framework. This approach focuses on optimizing gearshift commands and torque distribution for an automated Hybrid Electric Vehicle (HEV), considering both drivability and fuel economy. The ECMS implementation resulted in an average 5% reduction in fuel consumption. Xu et al. [45] presented an engine-in-the-loop (EIL) hierarchical predictive controller model for a Level 1 automated truck. It is indicated that half-loaded trucks in urban/suburban settings can yield 14.63% fuel reduction. For fully-loaded trucks, the savings increases to 16.42%. Based on the aforementioned results, the influence of powertrain control on the fuel consumption of AVs can be clearly understood.

2.2.4. Intersection Control

The evolution of connectivity in both vehicle-to-vehicle (V2V) and vehicle-to- infrastructure (V2I) domains has ushered in a transformative era for CAVs. In this dynamic landscape, intersections become pivotal points where CAVs showcase their ability to navigate with heightened safety, improved efficiency, and a greater degree of mobility. The simulation results from Nei et al. [46] revealed that 3.13% of hydrogen consumption could be saved using proposed strategy for connected and automated fuel cell hybrid vehicles at signalized intersections. Shao and Sun [47] demonstrated that in real world traffic scenarios, empirical findings demonstrate that having two connected leading vehicles can result in a 6.9% improvement in fuel efficiency. Moreover, when there is accurate prediction involved, the fuel benefits increase to 11.2% by CAVs. Similarly, Zhang et al. [48] used the proposed eco-approach and departure (EAD) algorithm in passing intersections that led to an energy saving of 12.1% by autonomous driving. Du et al. [49] presented a hierarchical distributed coordination strategy for CAVs that are traveling through multiple unsignalized intersections. The simulation results revealed an average fuel consumption saving of 8.7% for CAVs. Finally, Jiang et al. [50] recorded the minimum fuel consumption benefit of 2.02% use under a partial CAV environment at an isolated signalized intersection.
By summarizing the fuel savings percentages documented in the literature for AVs, we can depict the variation in average fuel consumption between HDVs as derived from Figure 1, and various categories of AVs representing different areas of energy impact. The illustration of this comparison is presented in Table 2, which will be further employed in the results analysis section. Under each area of energy impact, the upper and lower limits of fuel savings due to the use of AVs are presented.

2.3. Traffic Capacities and Travel Demand for HDVs and AVs

The data from our earlier studies have been utilized to assess the overall fuel consumption associated with the capacity and demand of HDVs and AVs. Three key previous studies have been incorporated into the current work. The outcomes reported in these published papers complement each other, as they were completed within a short timeframe and specifically examine the impact of AVs on our road network transport. The studies with short descriptions are as follows:
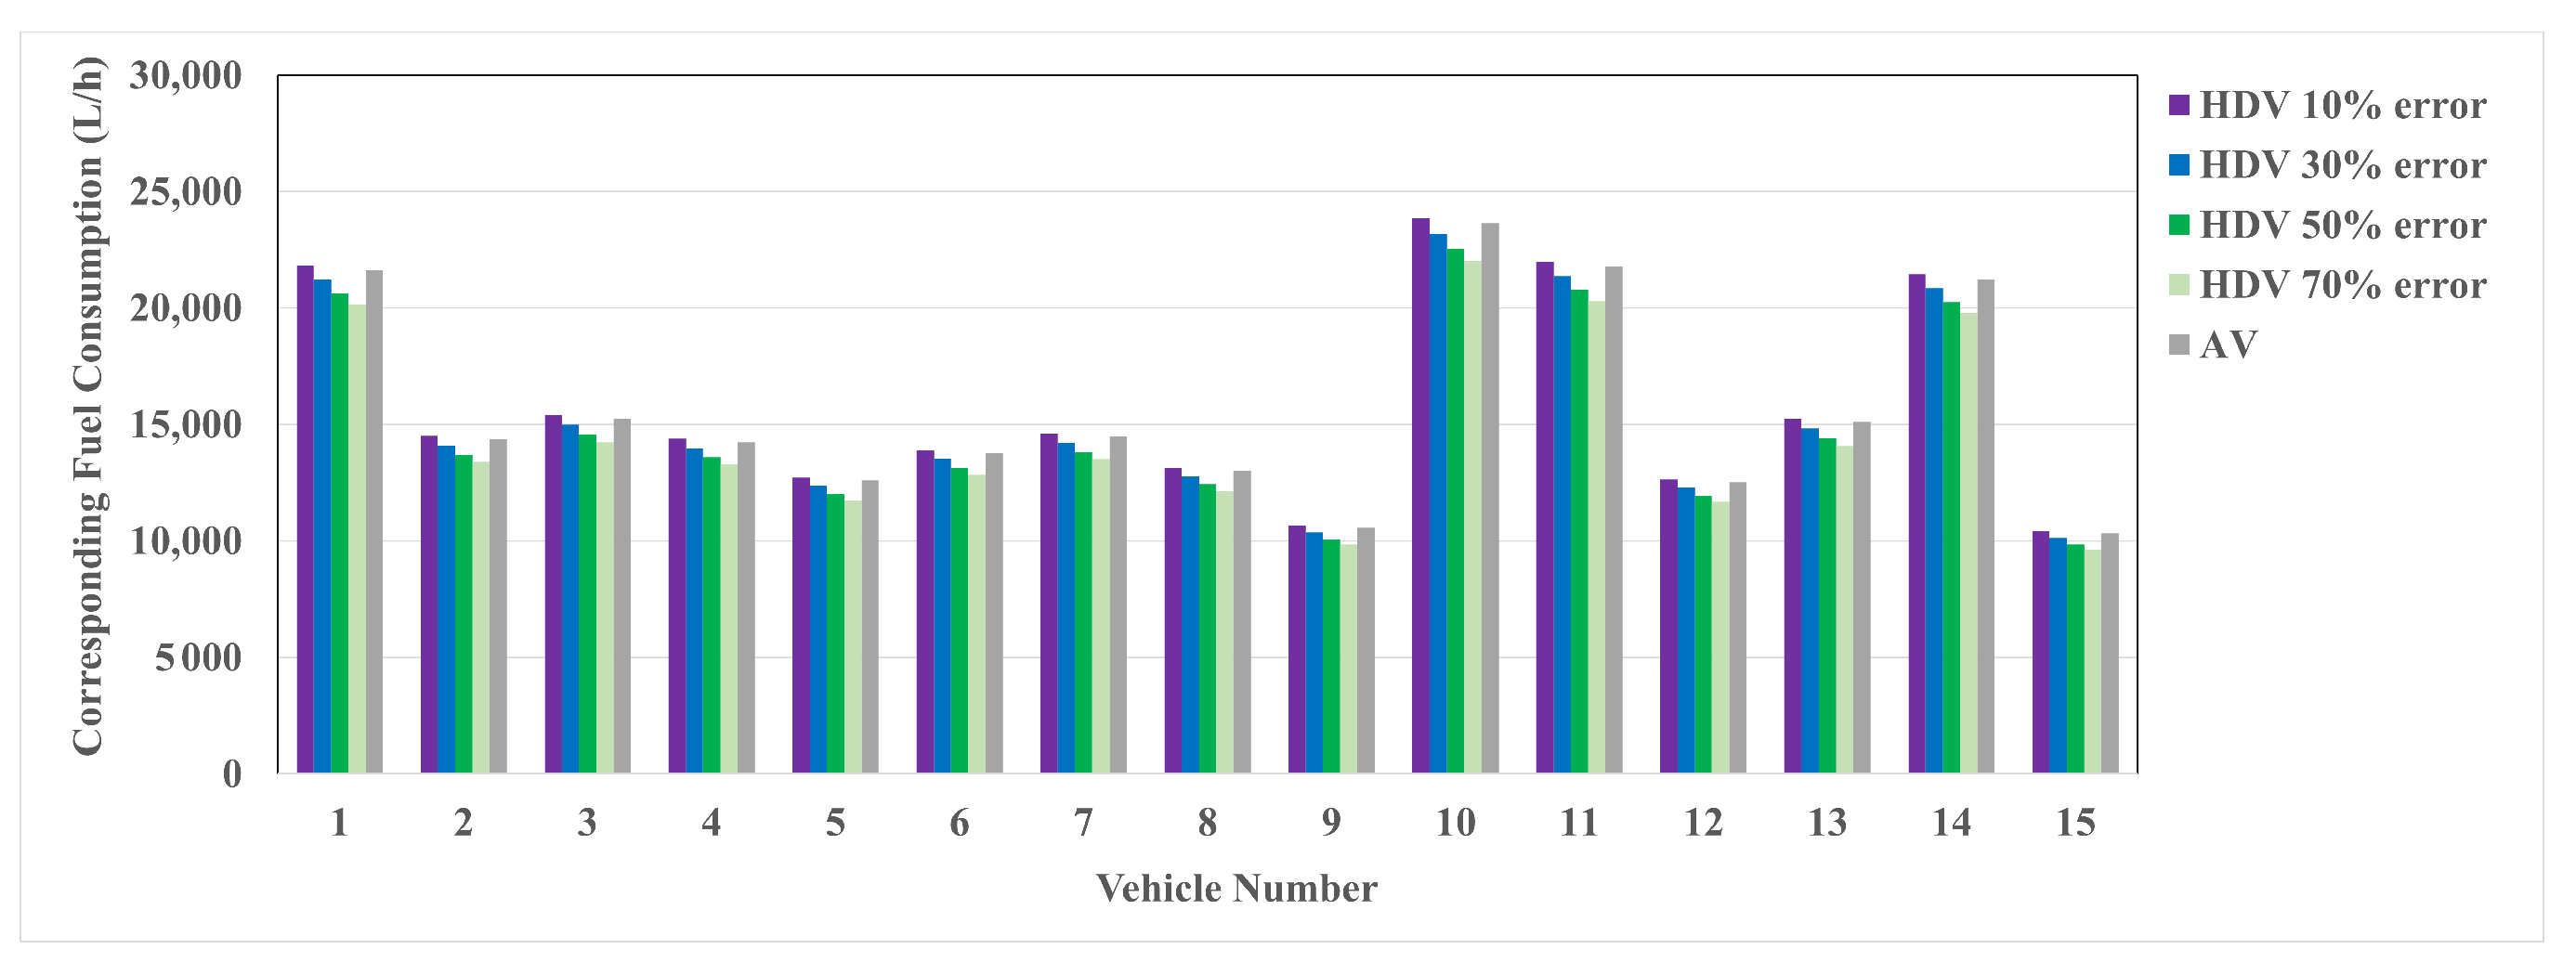
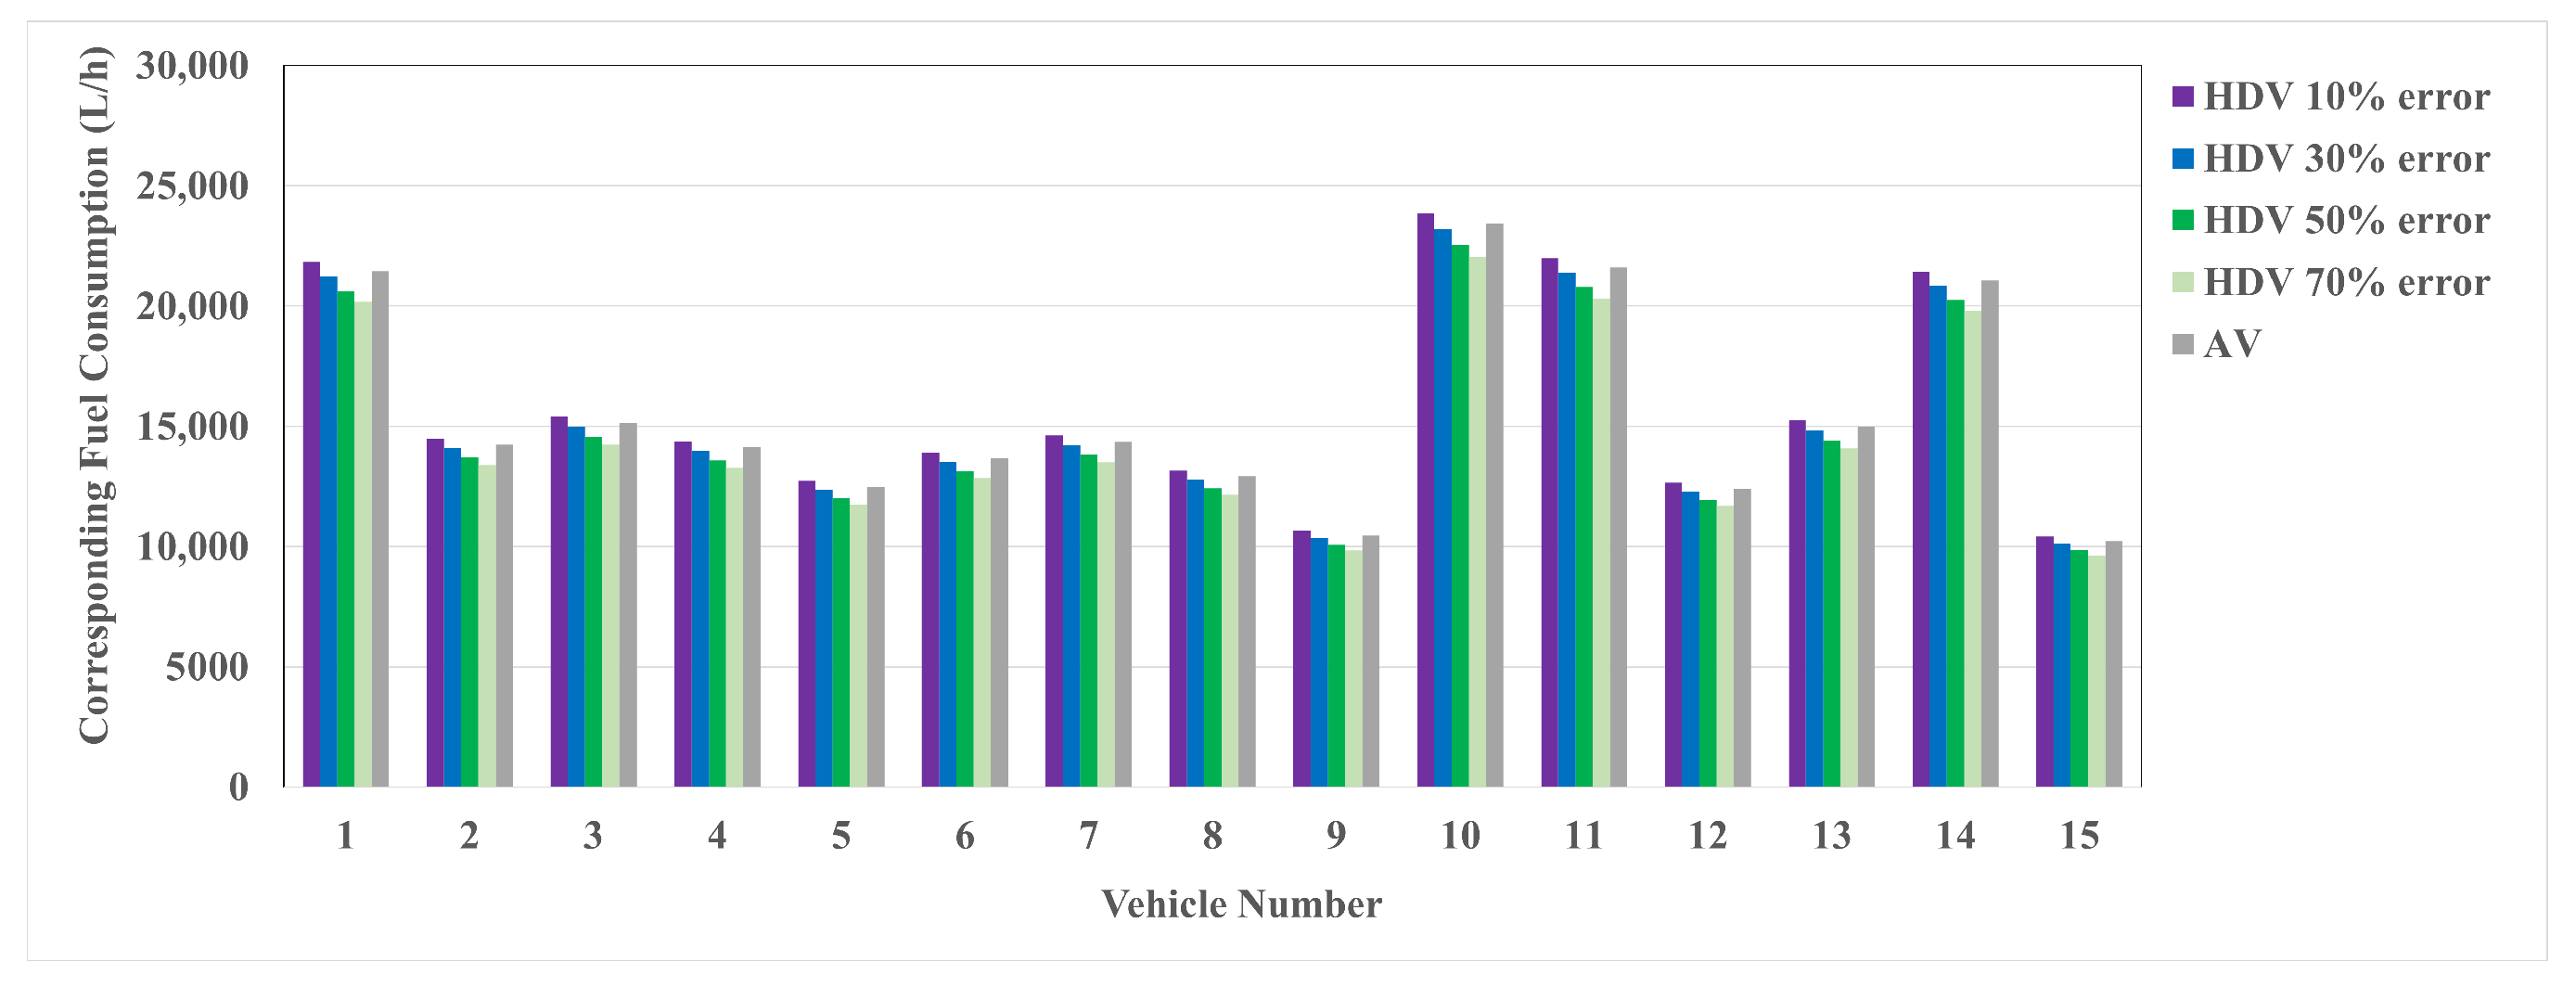
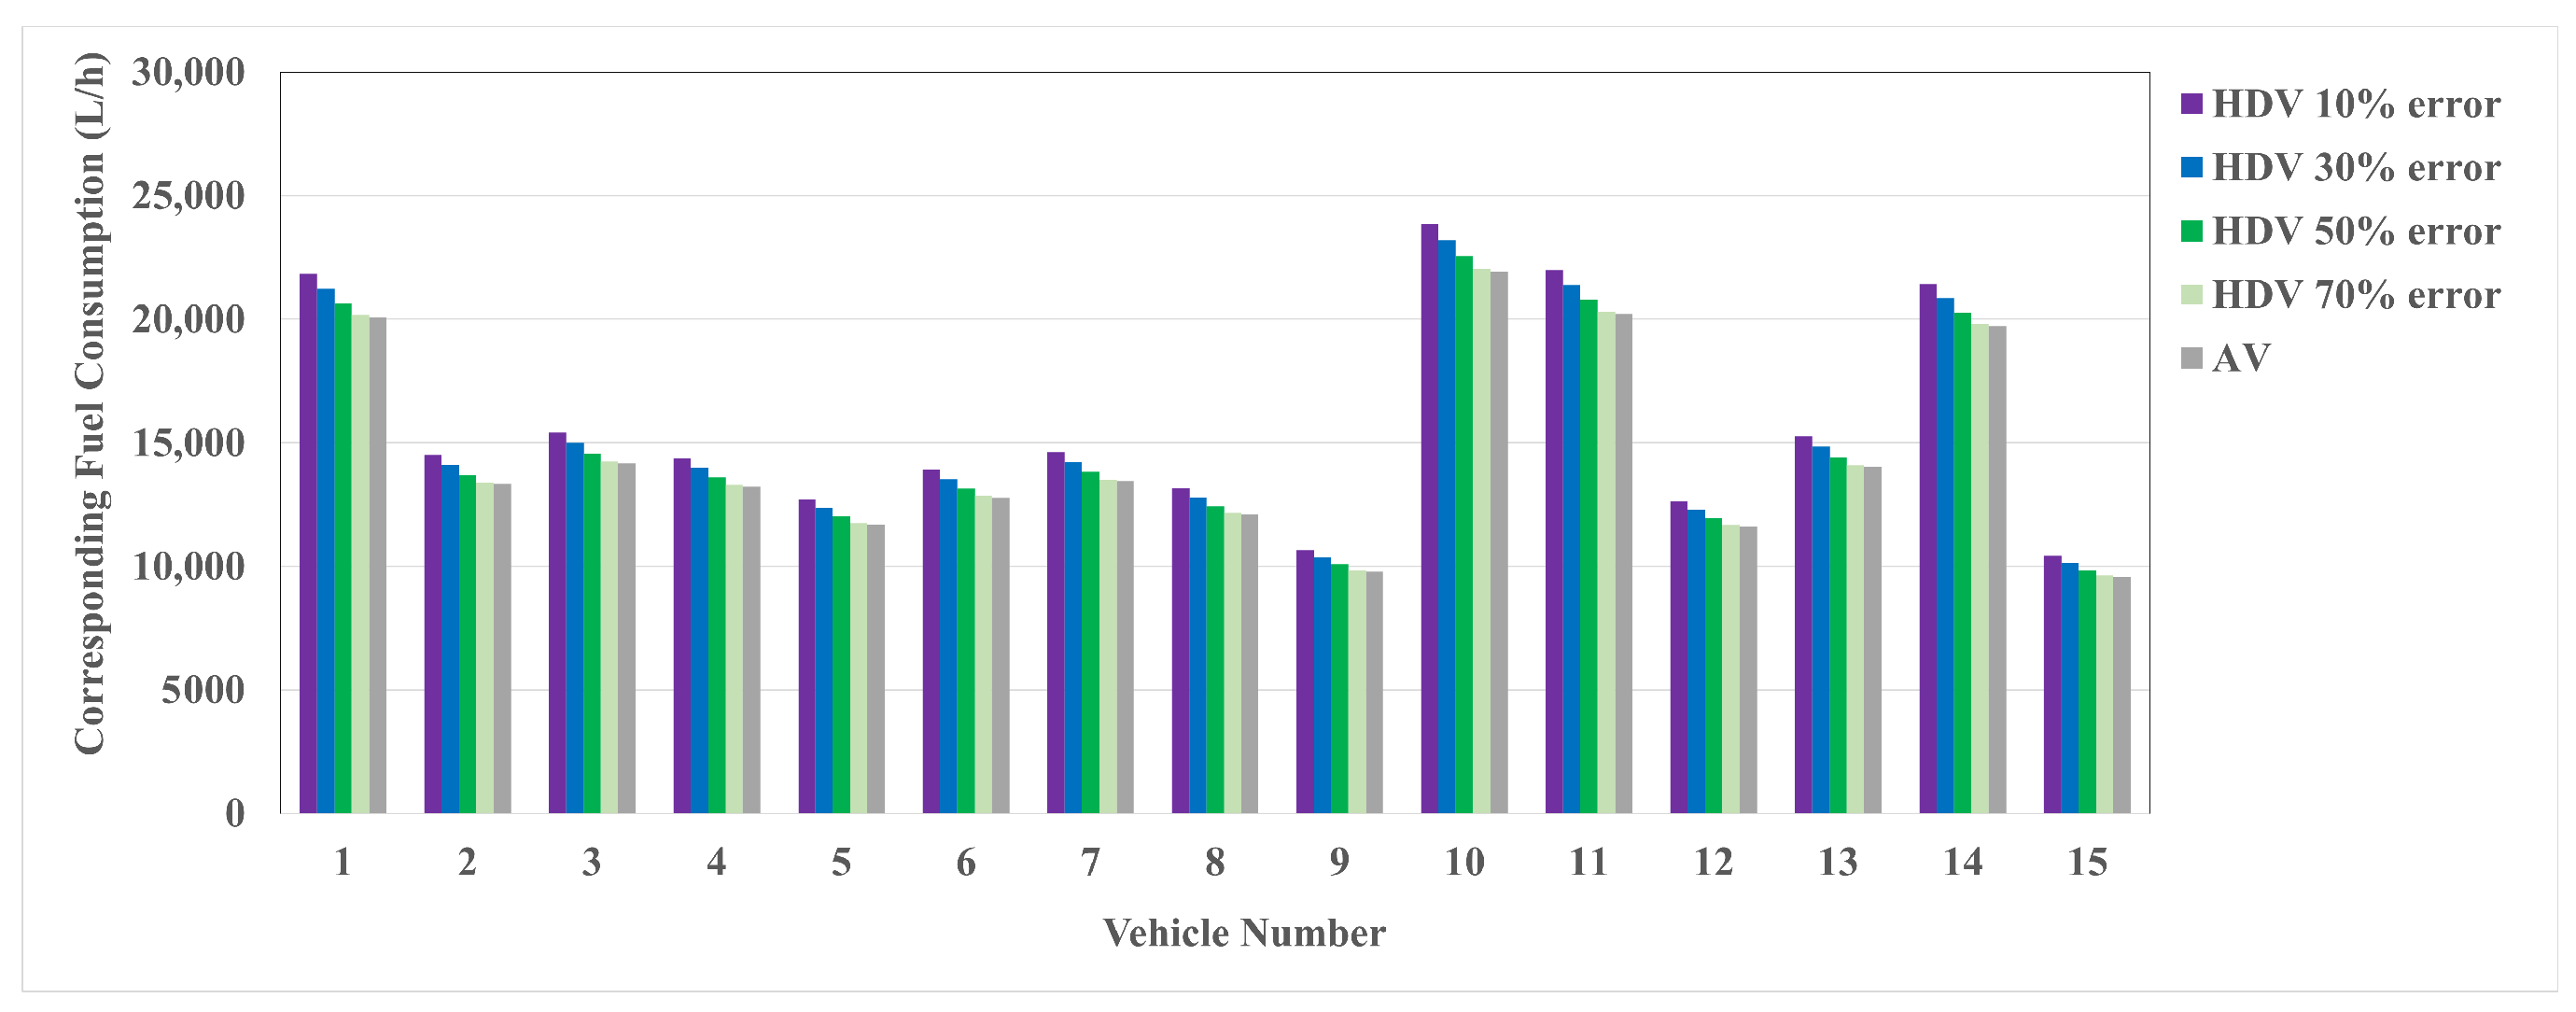
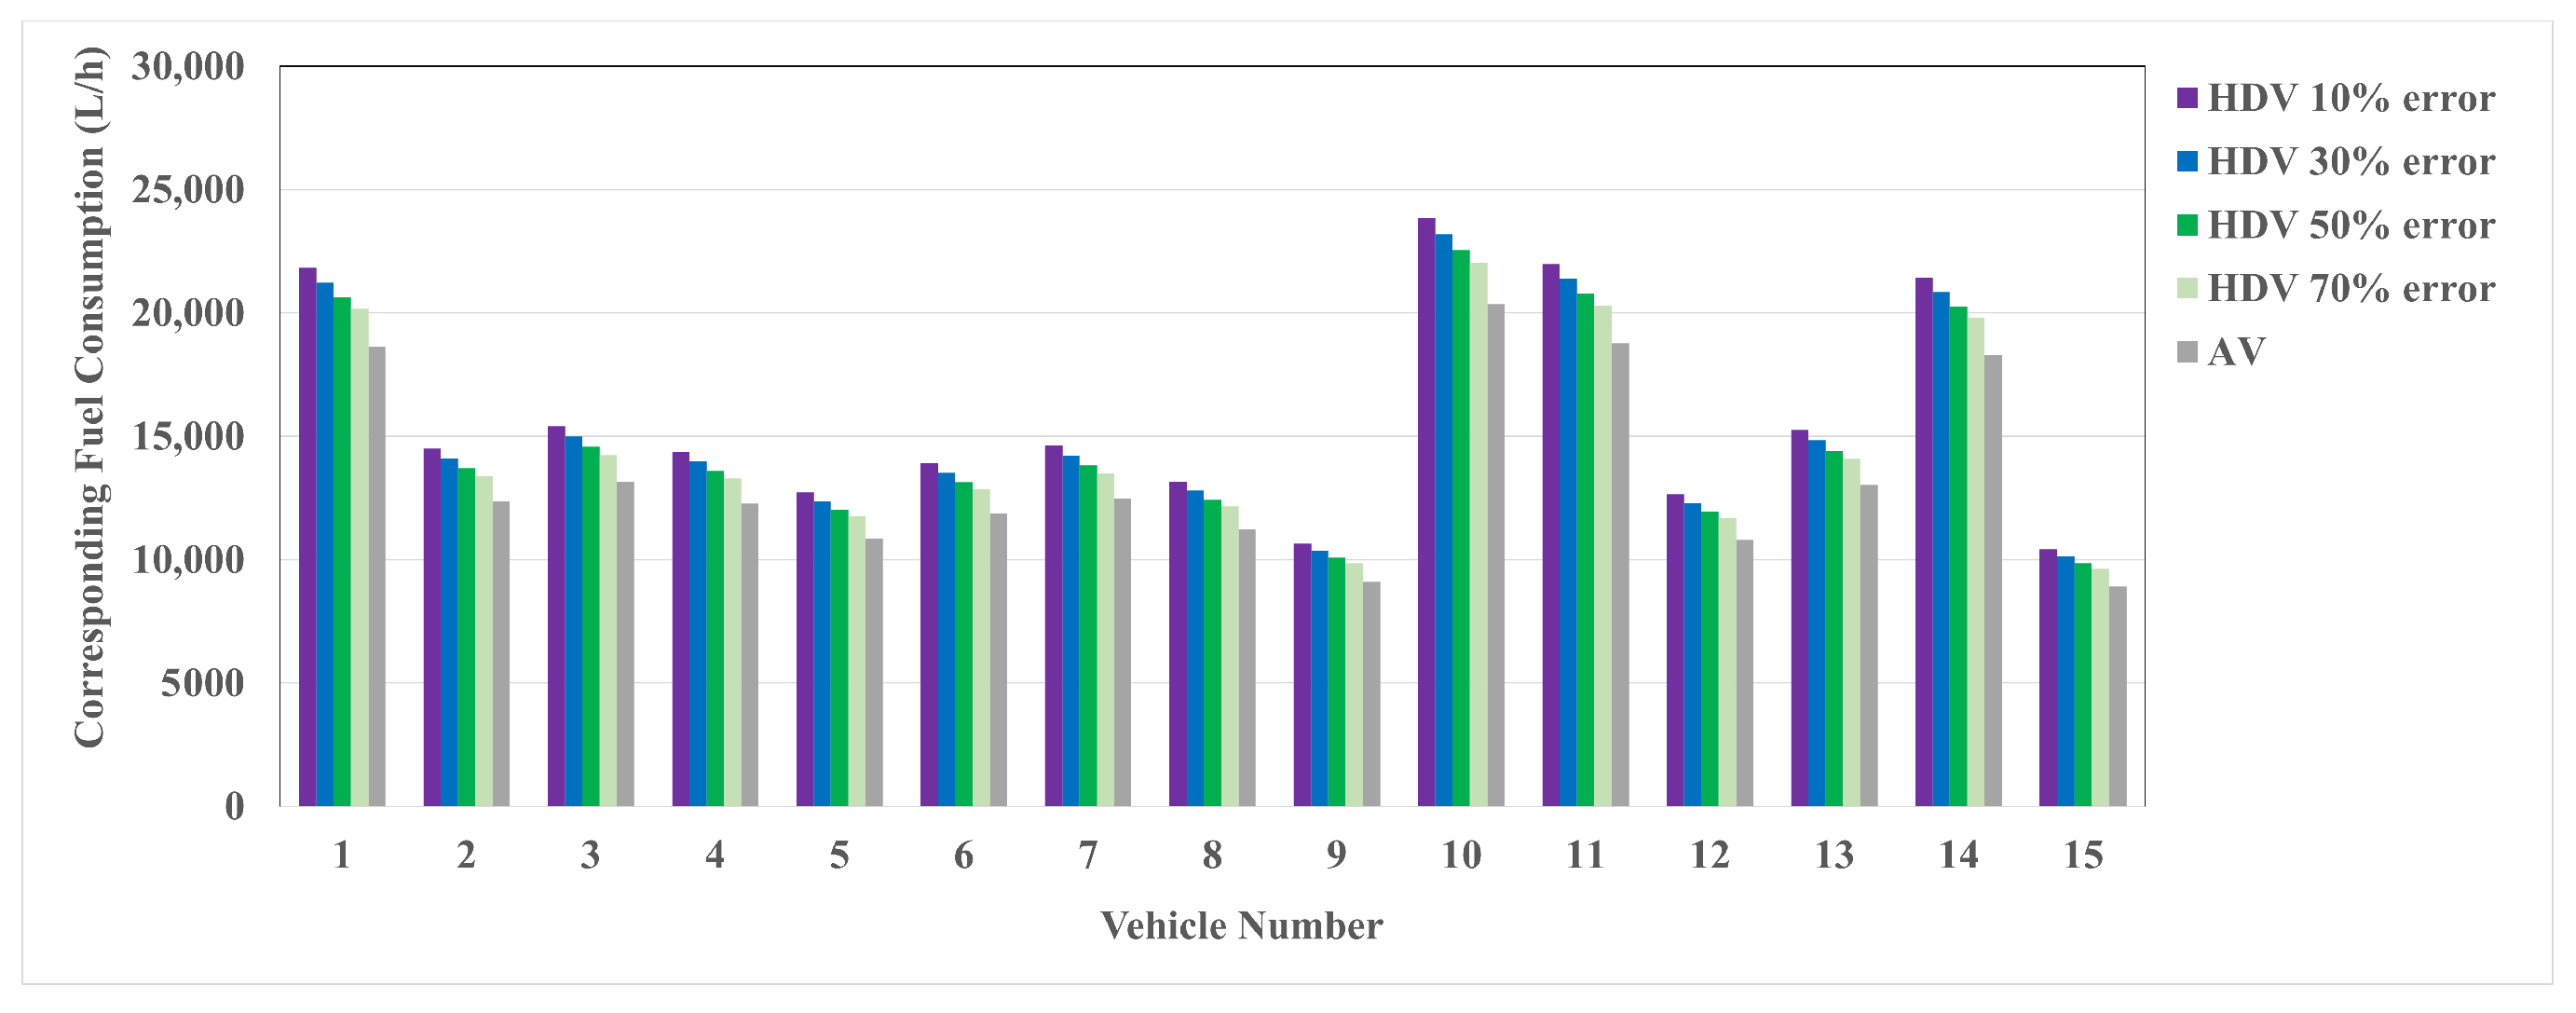
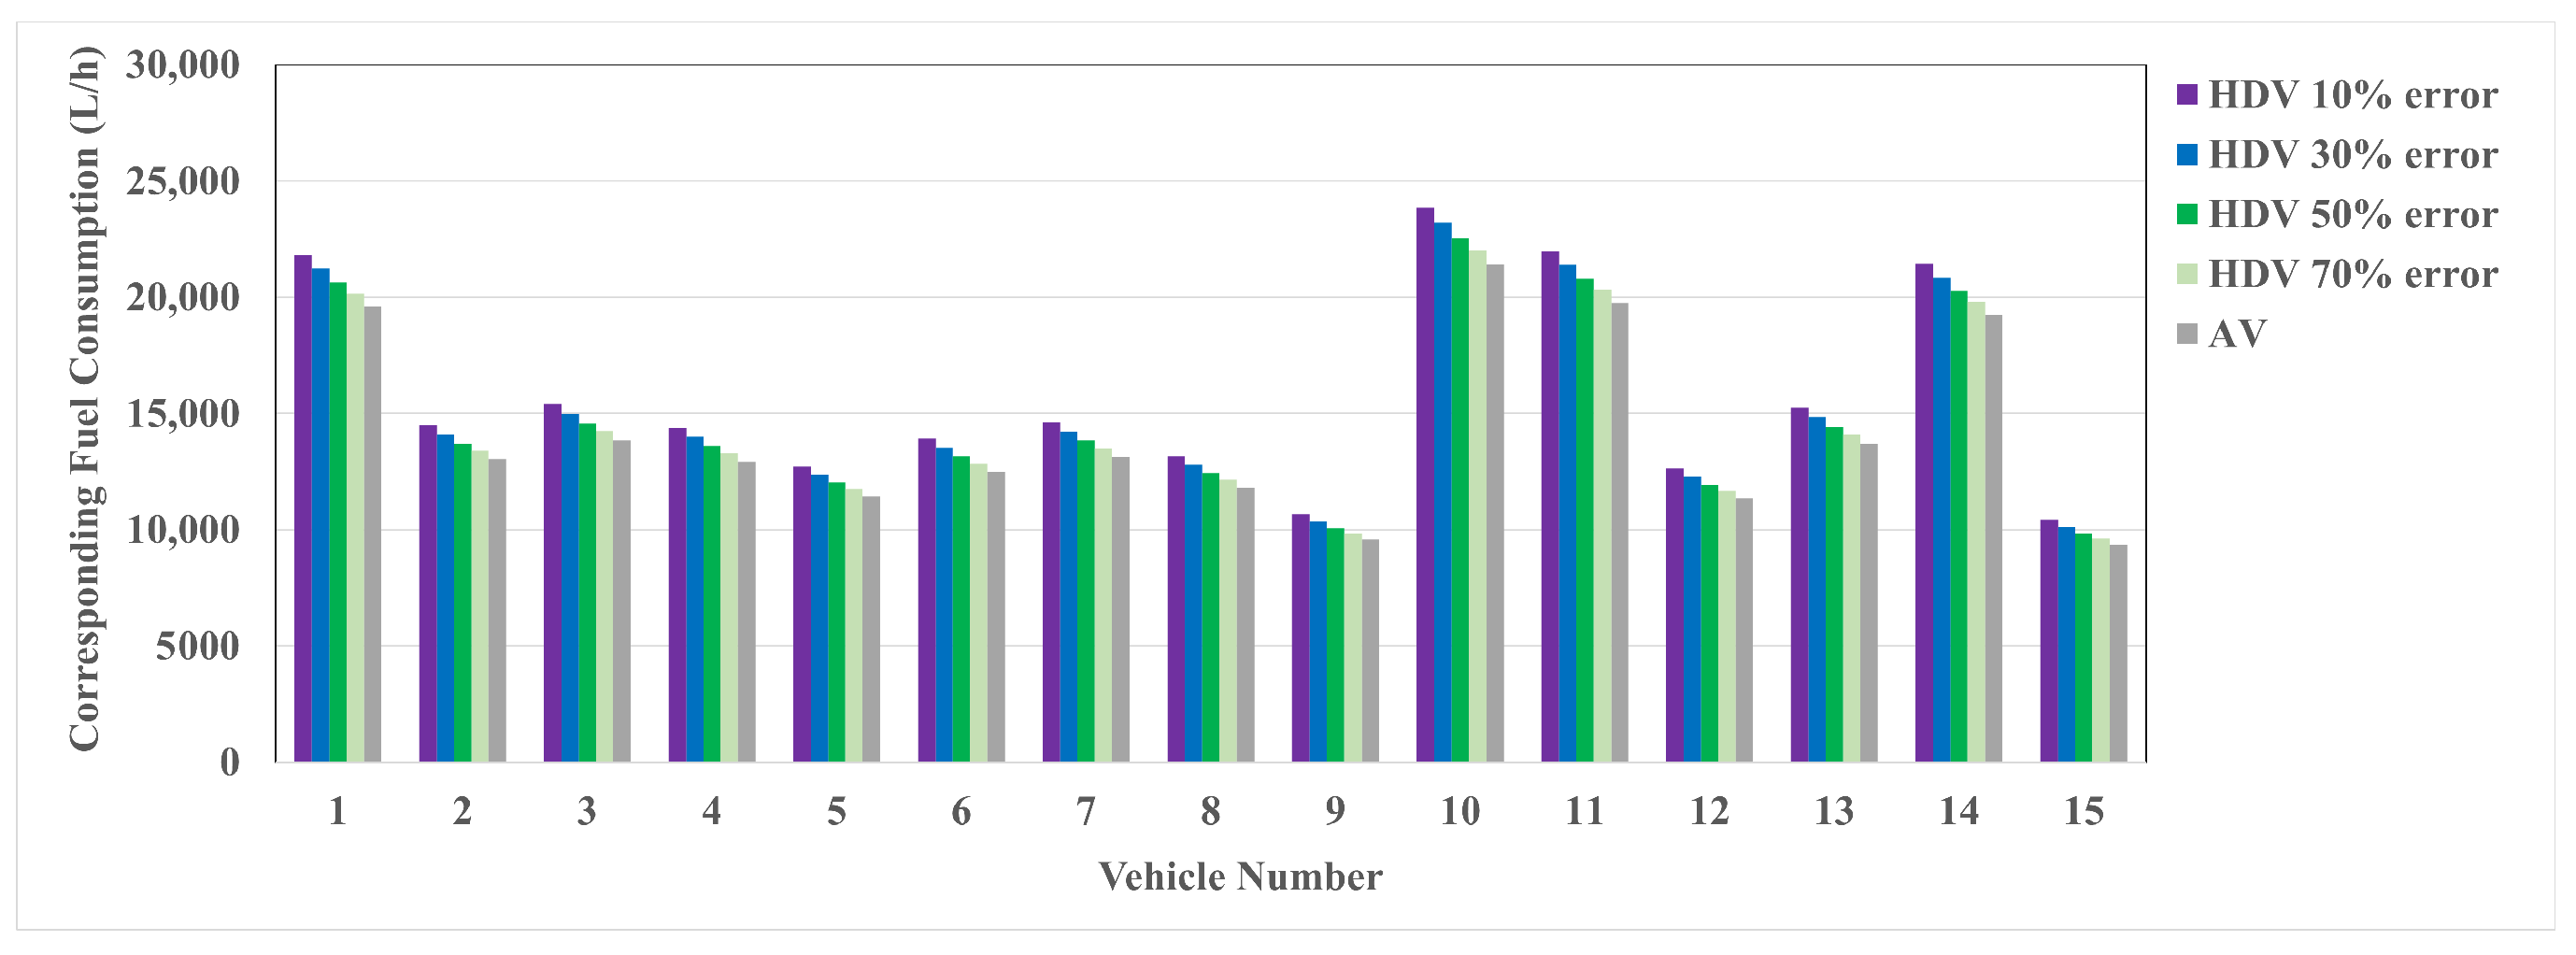
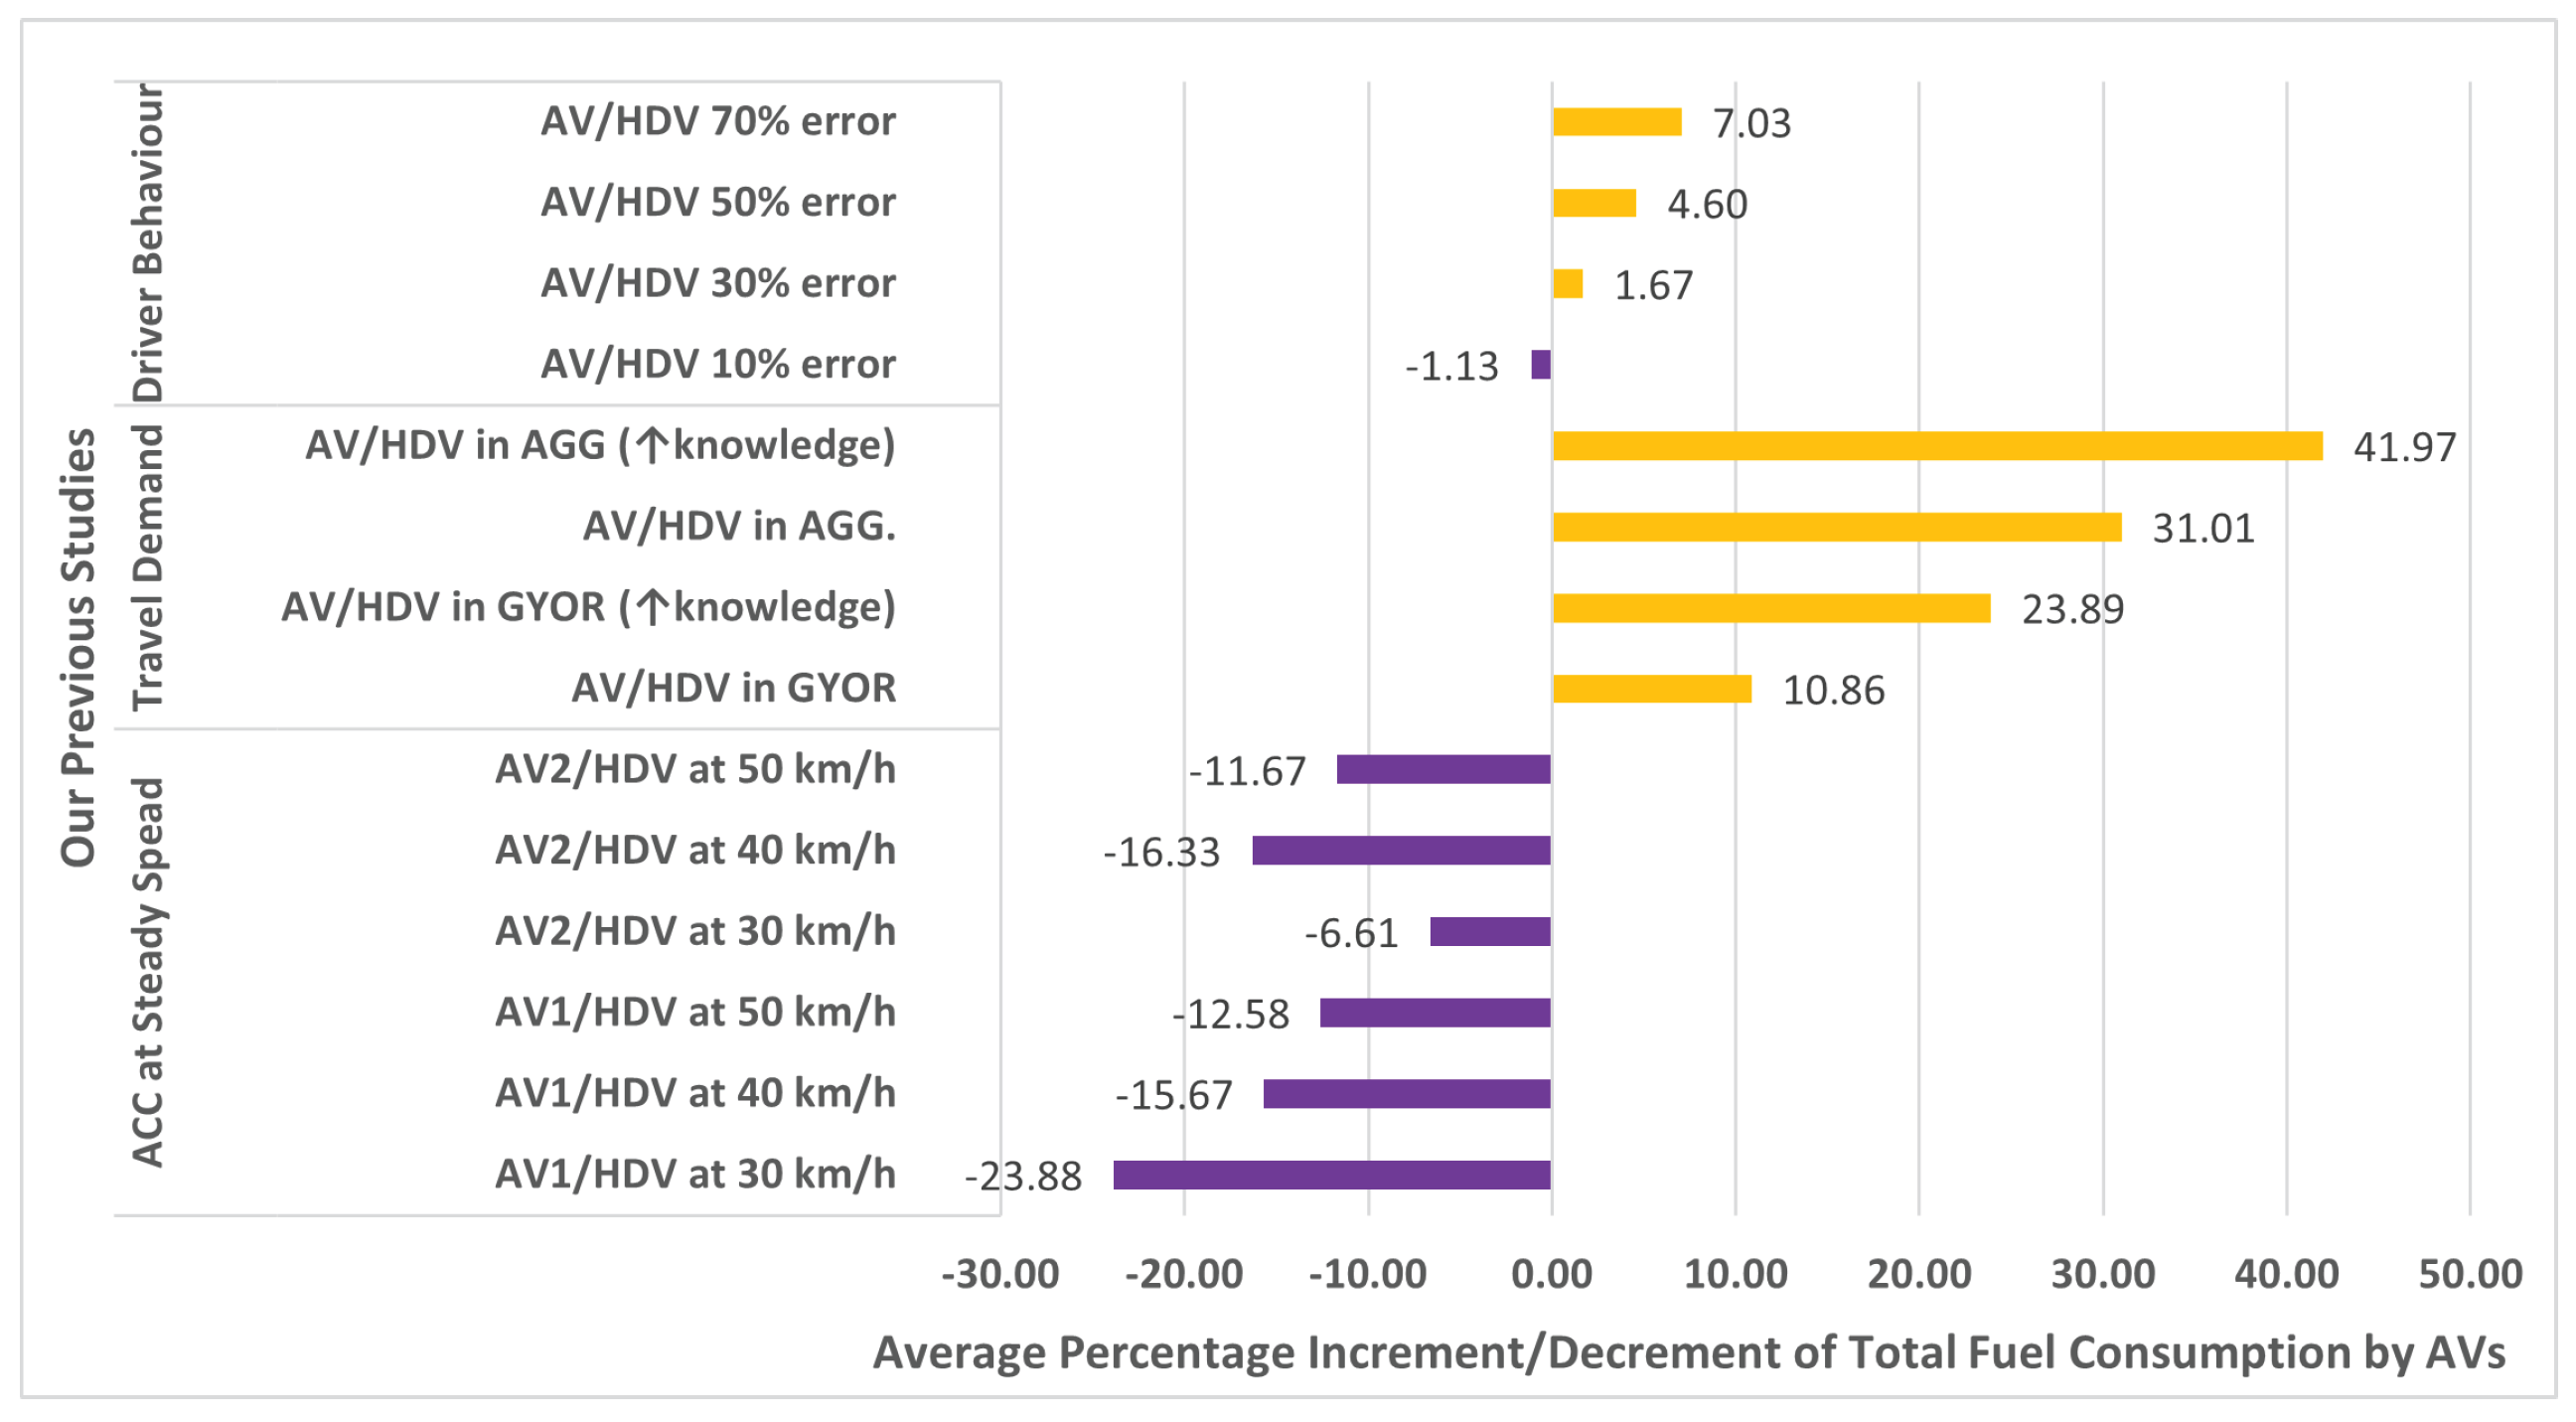
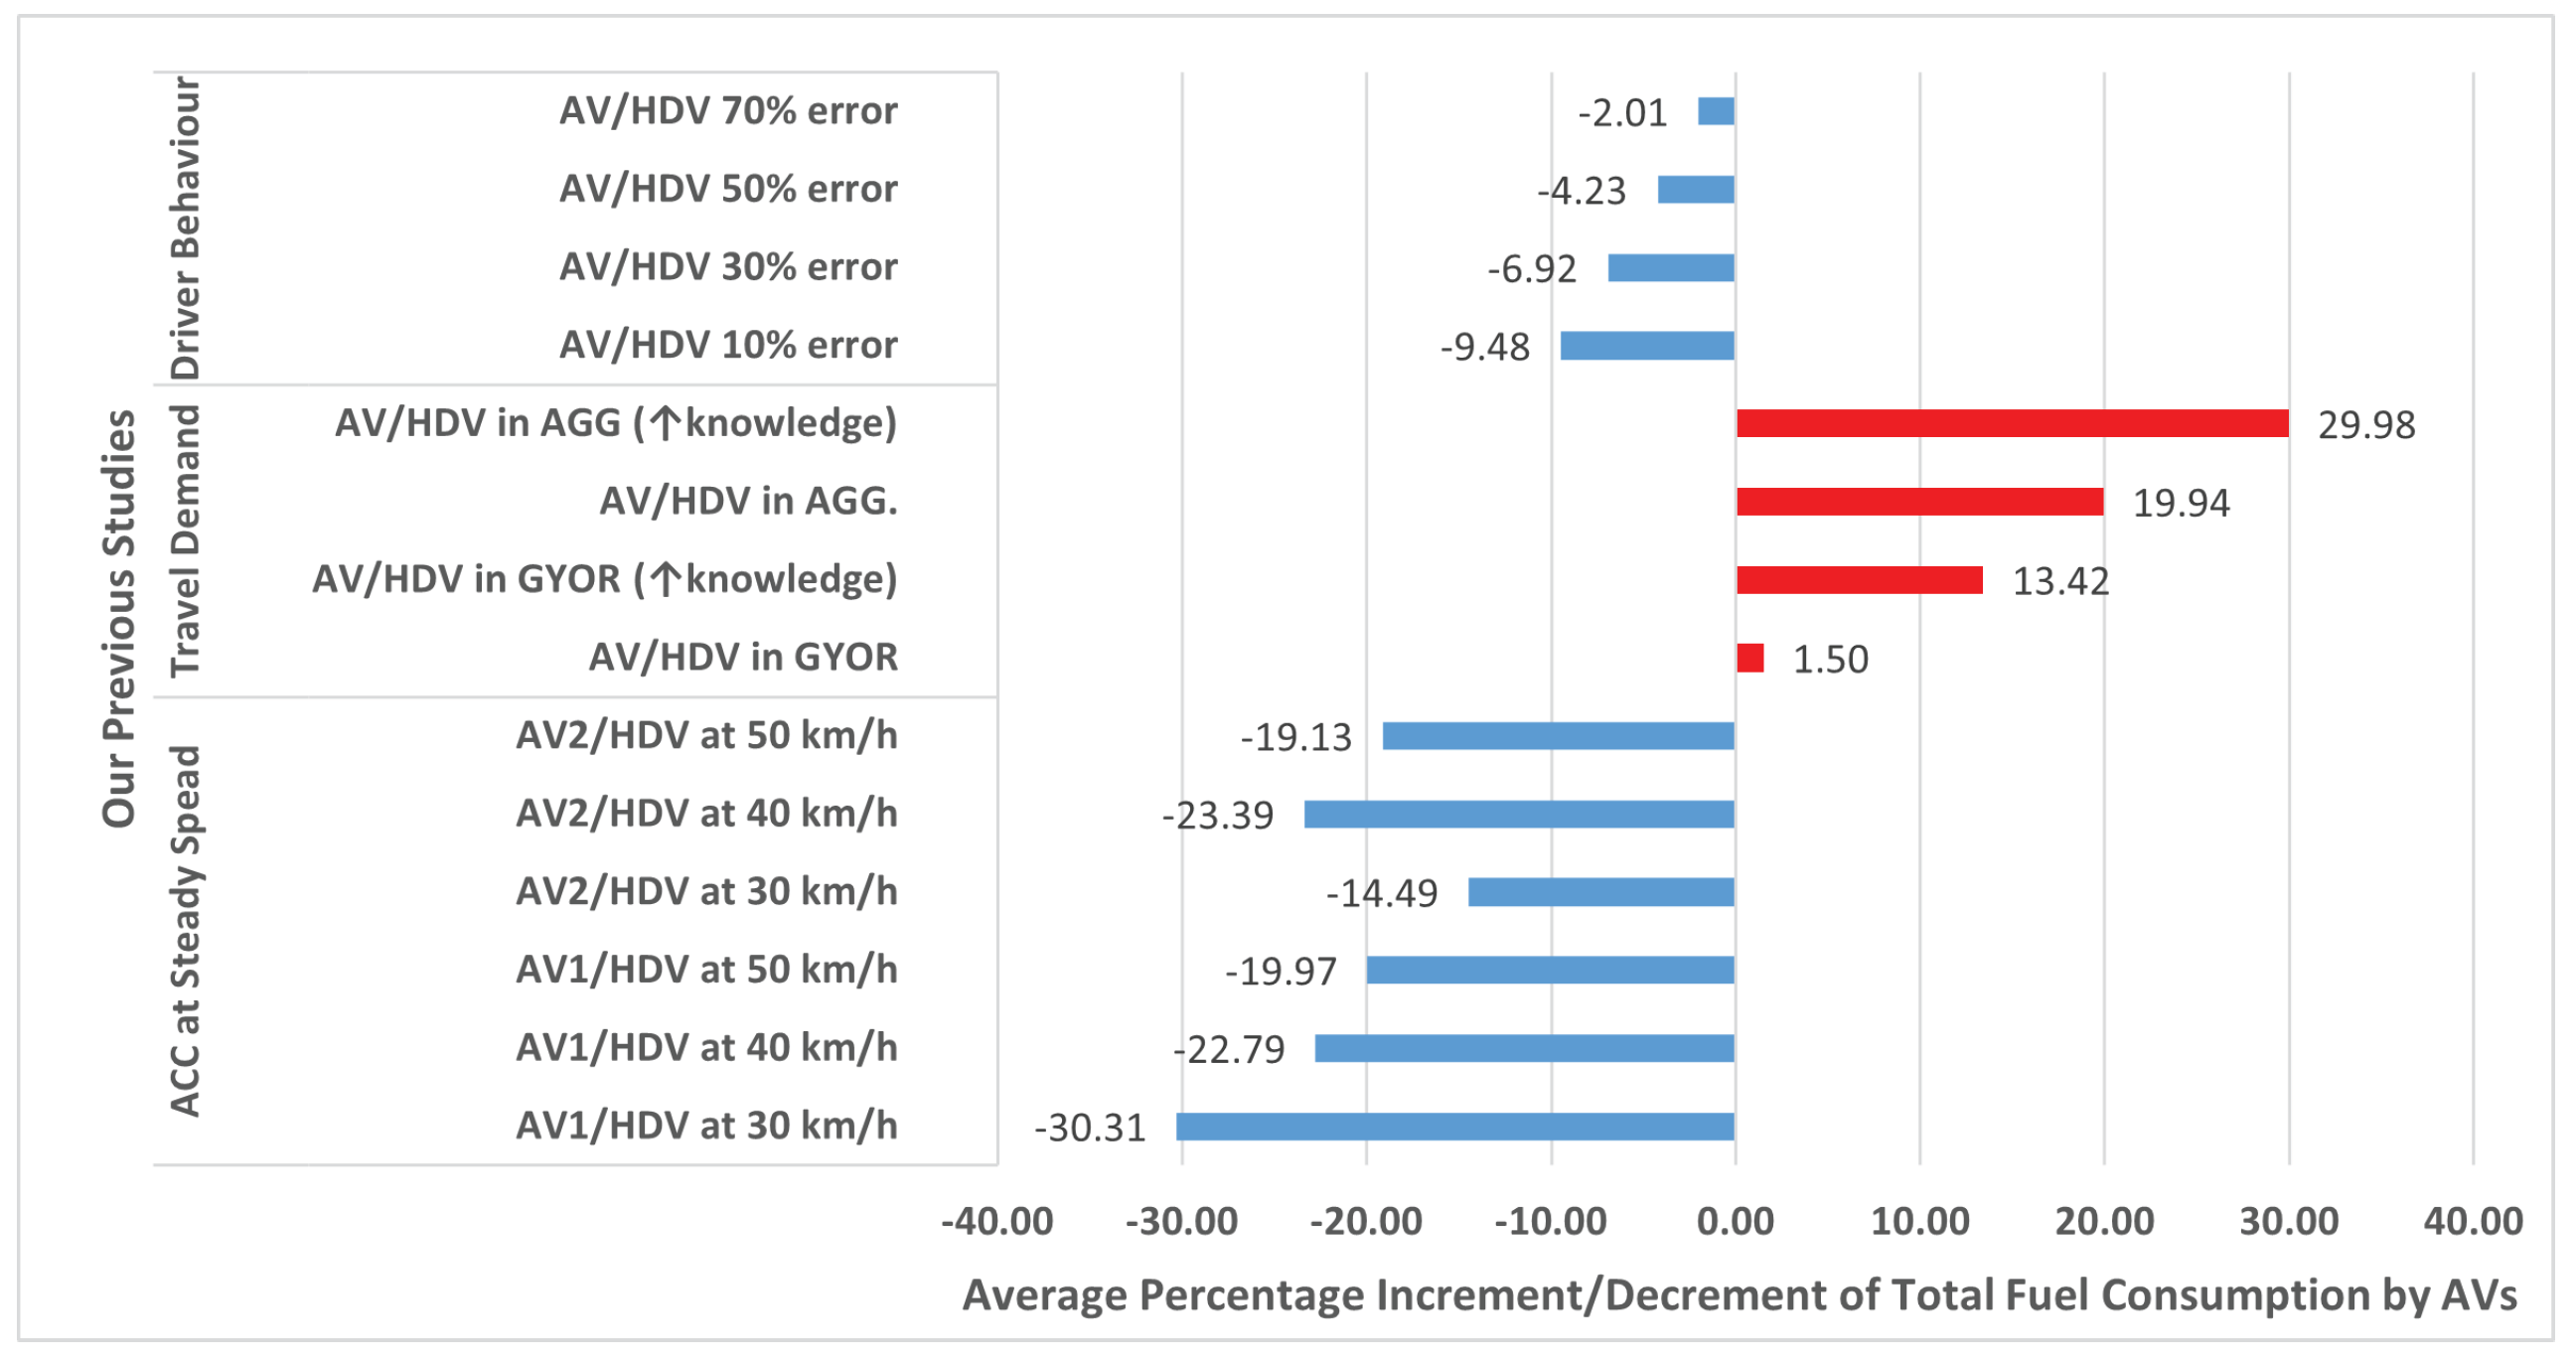
  • Driver behavior [51]: In this study, the Wiedemann microsimulation model was applied to investigate the impact of AVs on real traffic. Two driver behavior parameters were studied: driving errors due to distractions and possible interactions with vehicles ahead of the driver. Different AV penetration rates and various percentages of driving errors were also included in the study. As a result, an increase in capacity was achieved due to the use of AVs.
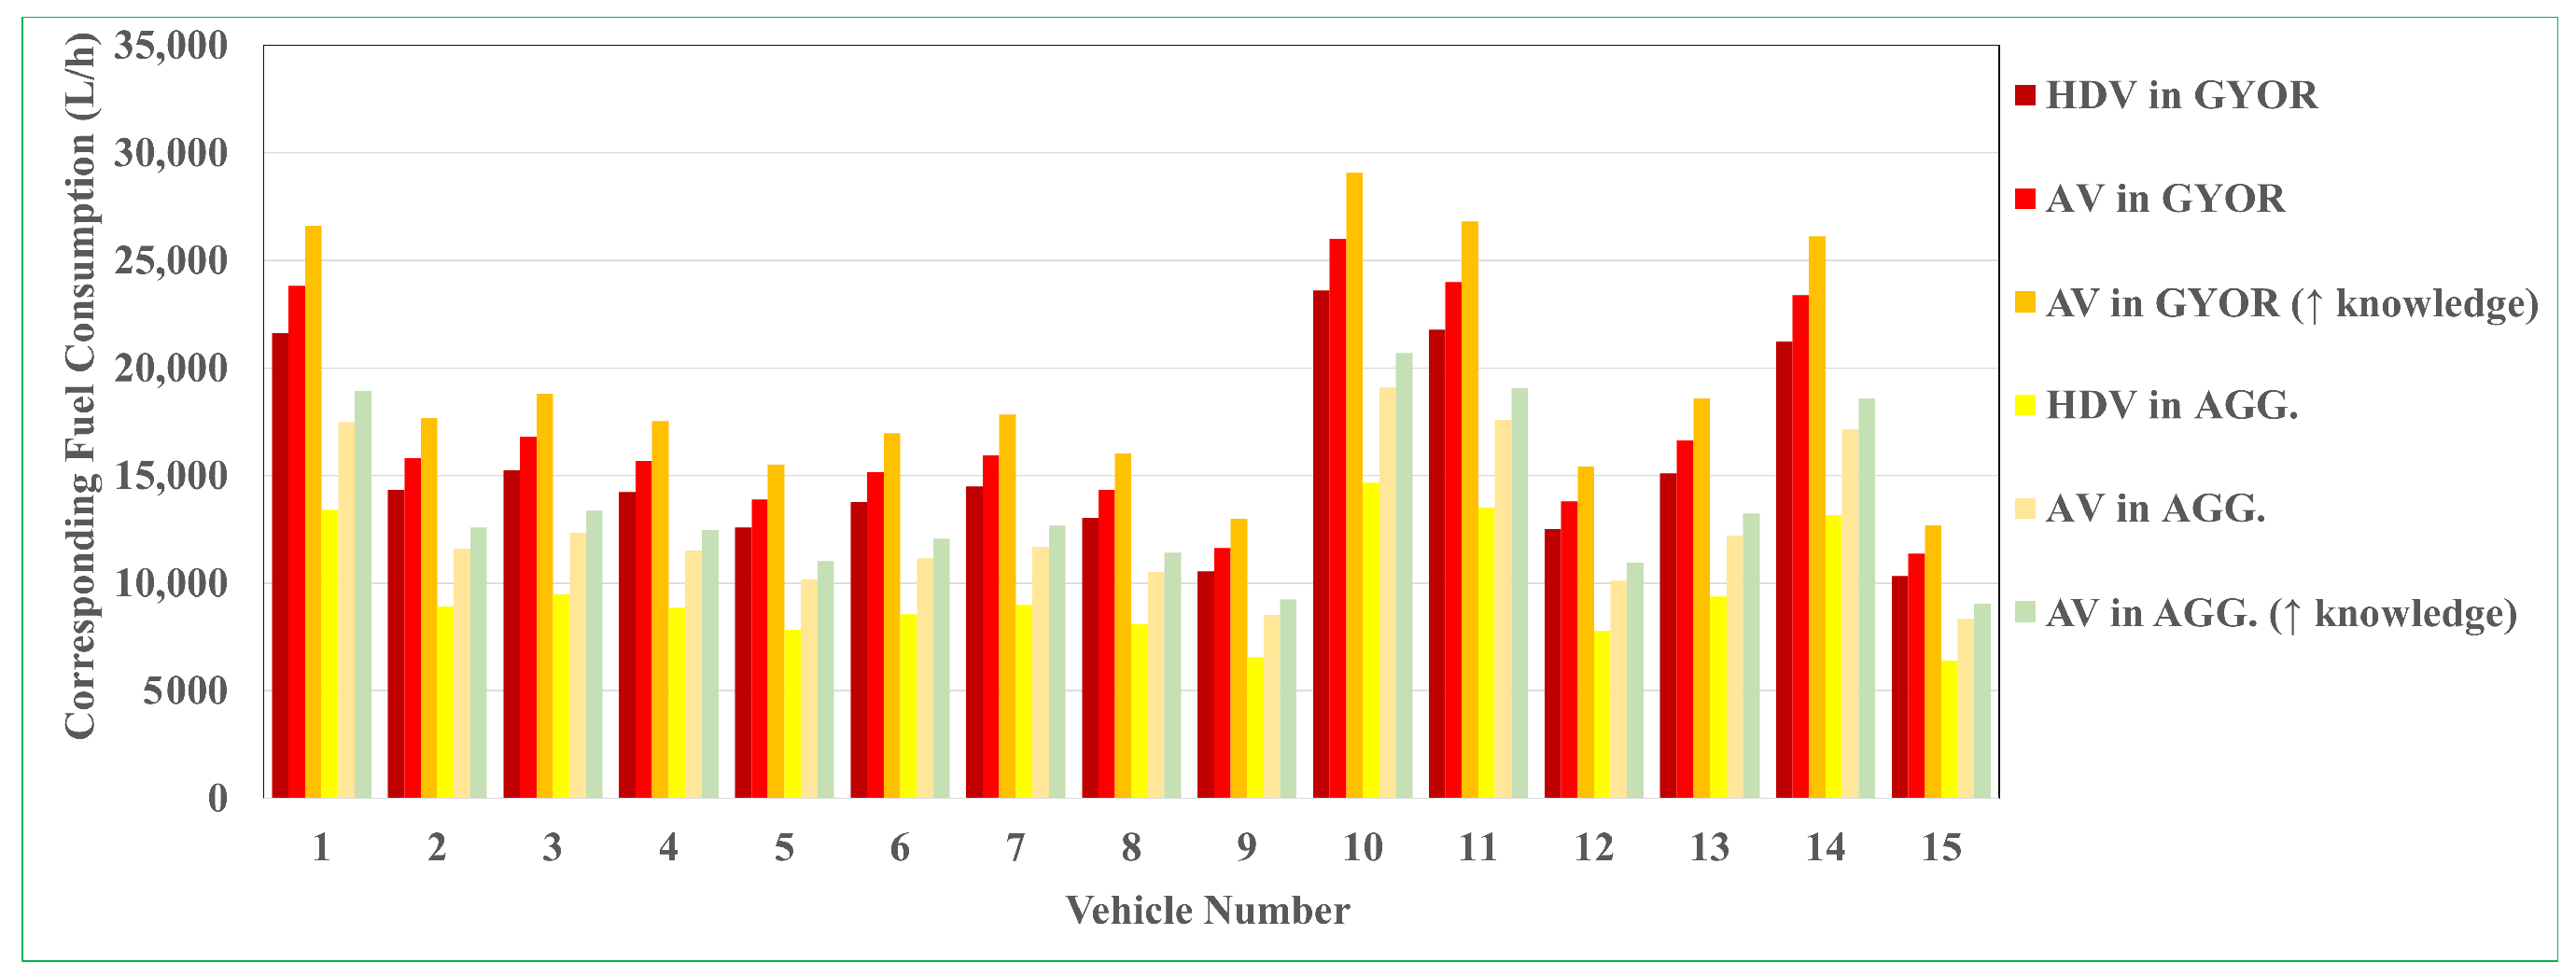
  • Travel demand [52]: This research discloses the outcomes of investigating the rise in travel demand attributed to the adoption of AVs. This was achieved through an extensive and densely populated survey conducted in Győr City and the Győr Agglomerations. The questionnaire, administered to a total of 5679 individuals, aimed to collect comprehensive and representative data, shedding light on potential challenges that could affect the sustainability of future transportation systems. The findings of the study indicate a noteworthy surge in the utilization of AVs for commuting in both examined regions.
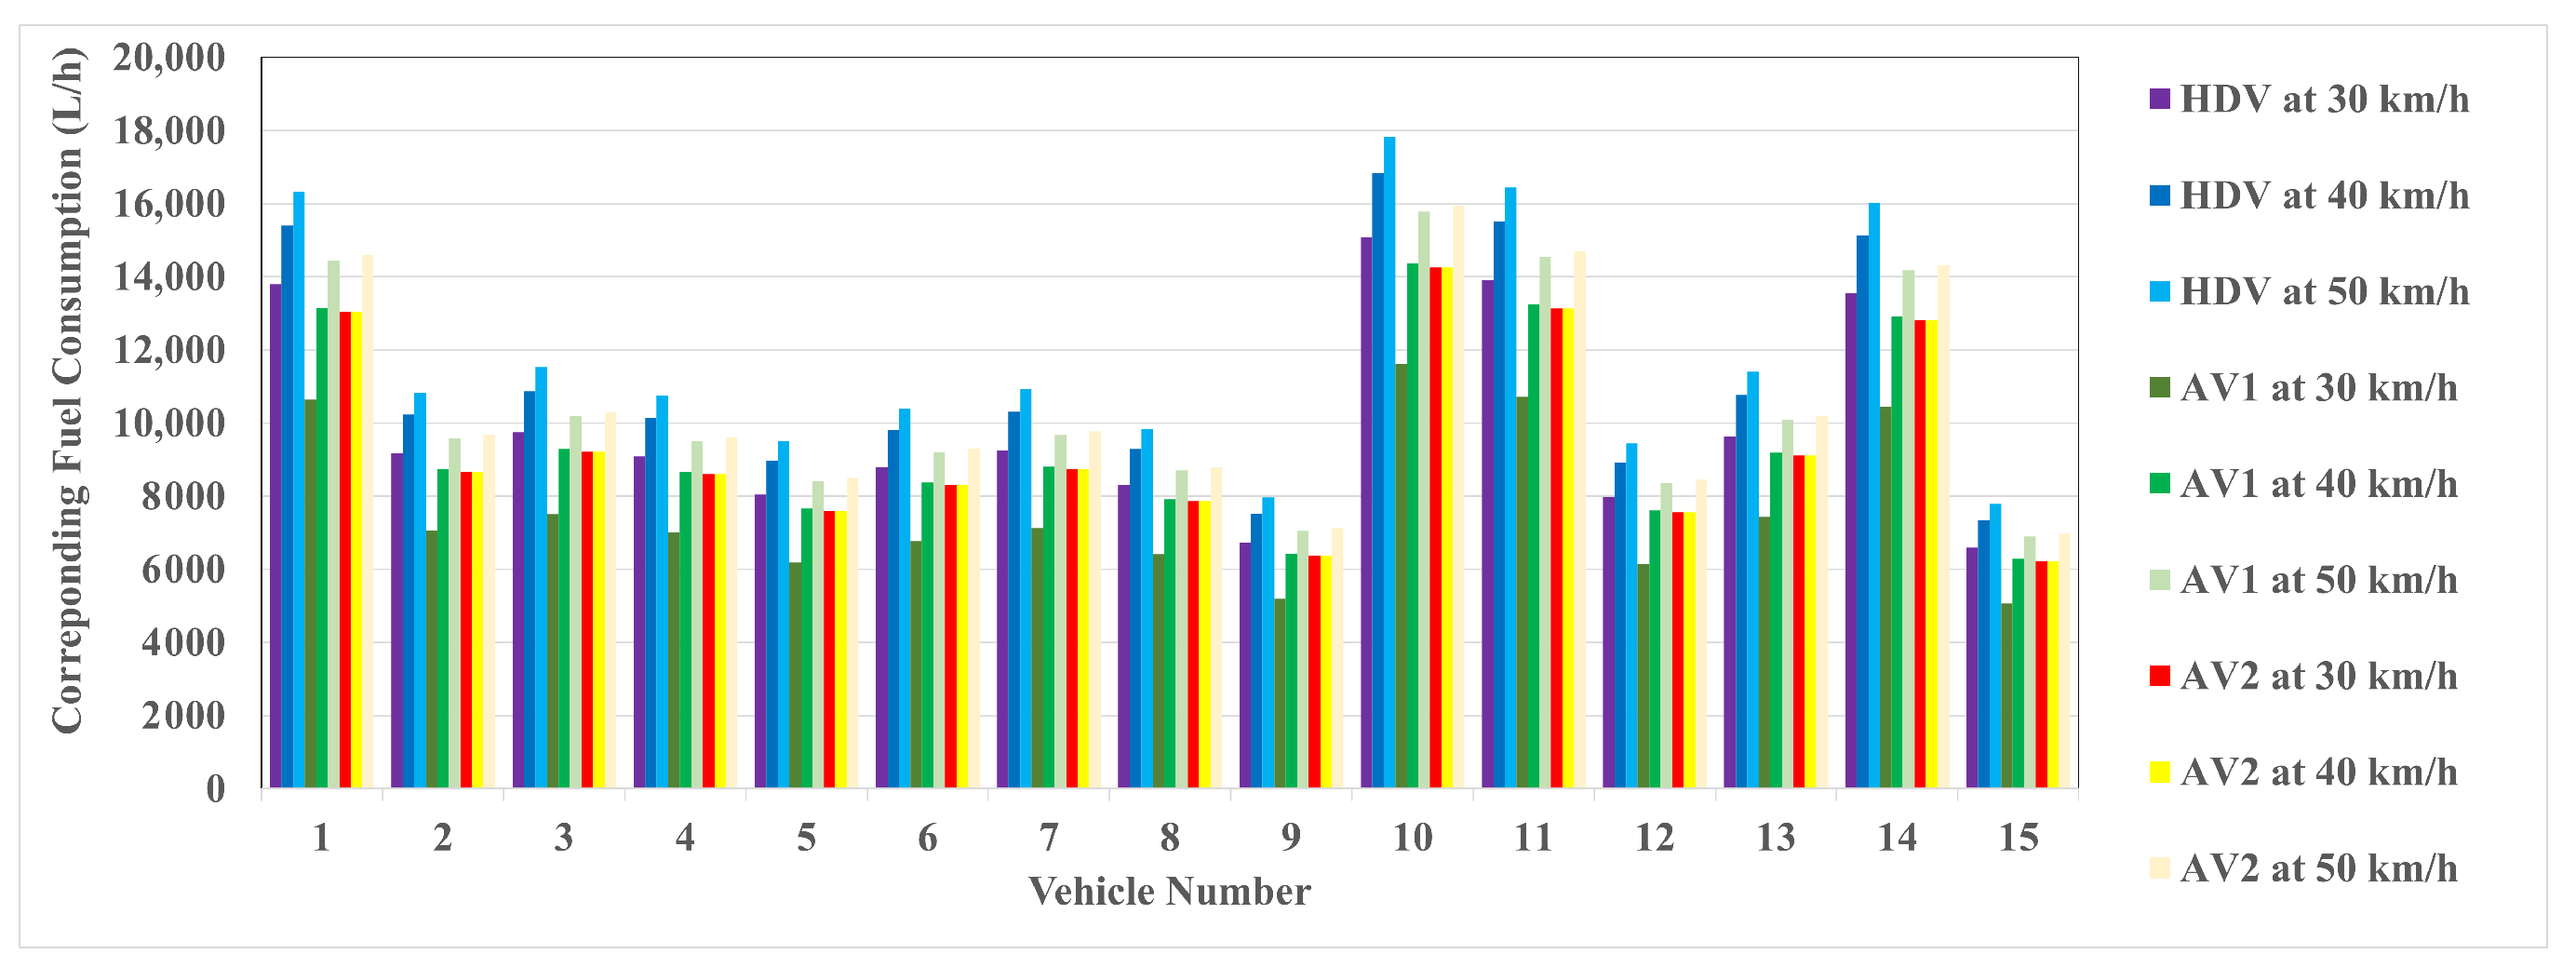
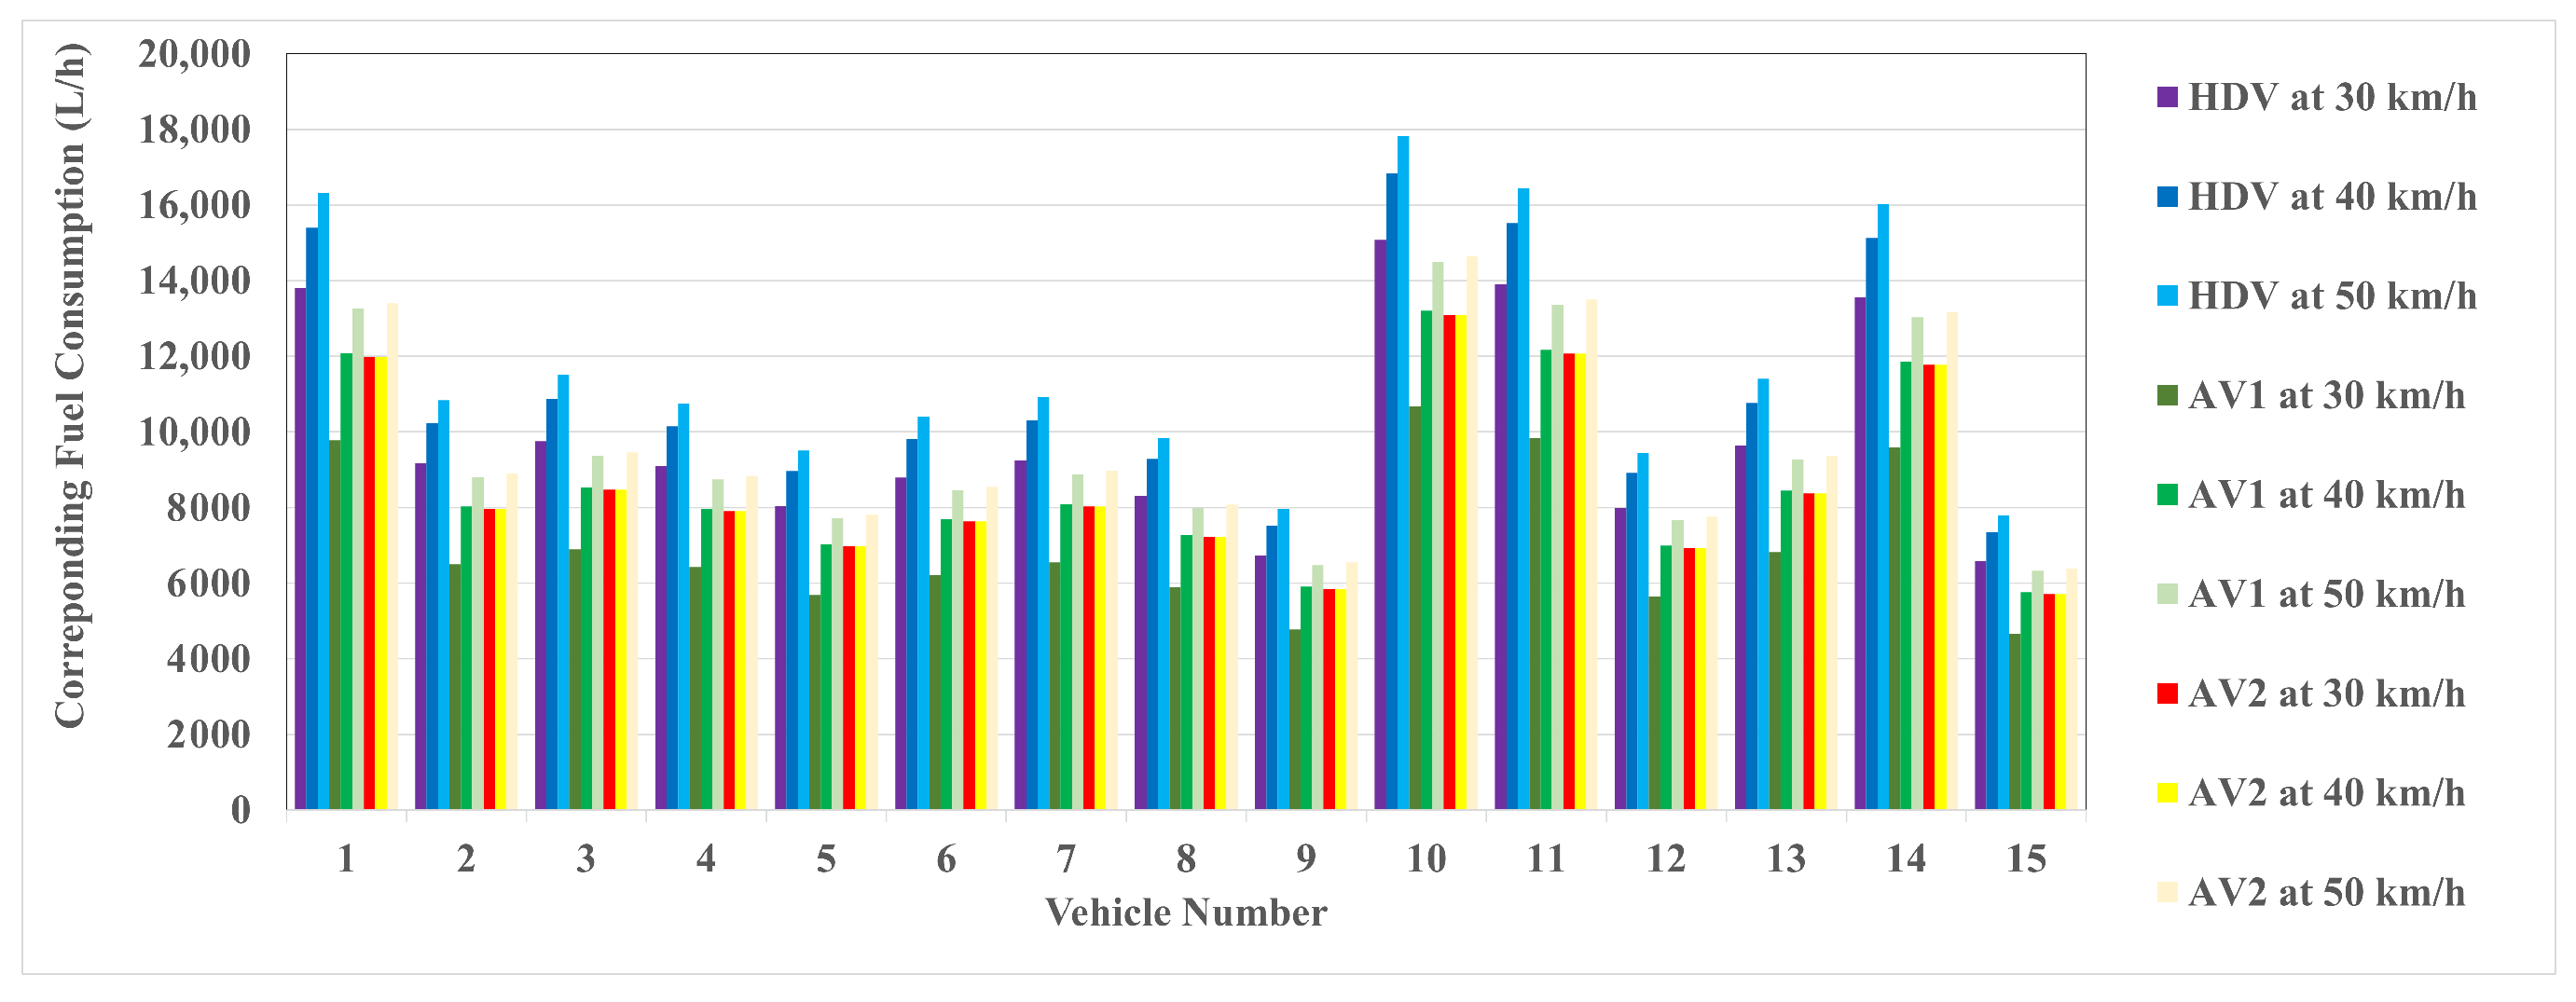
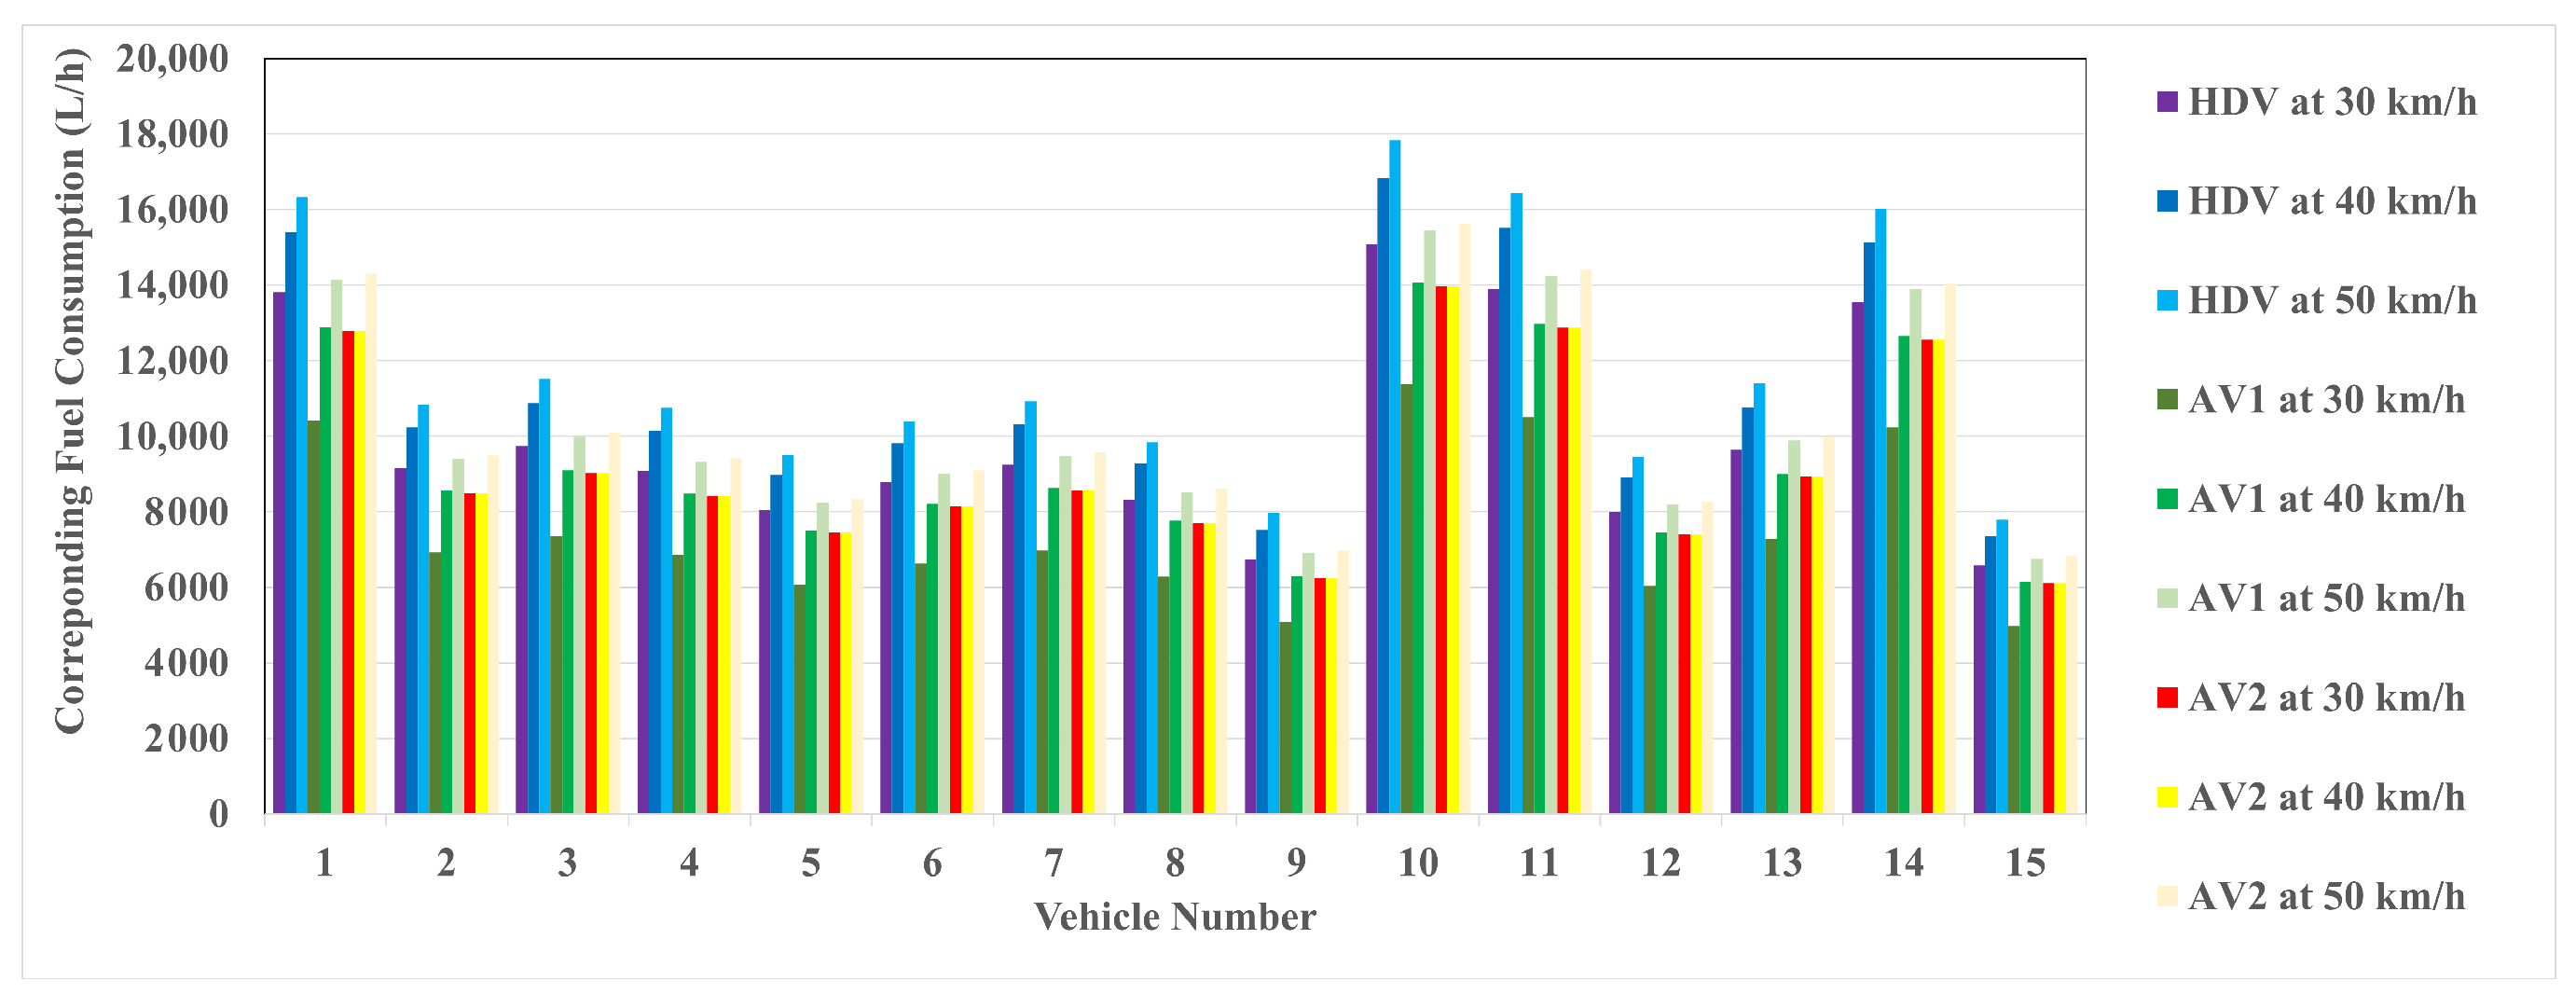
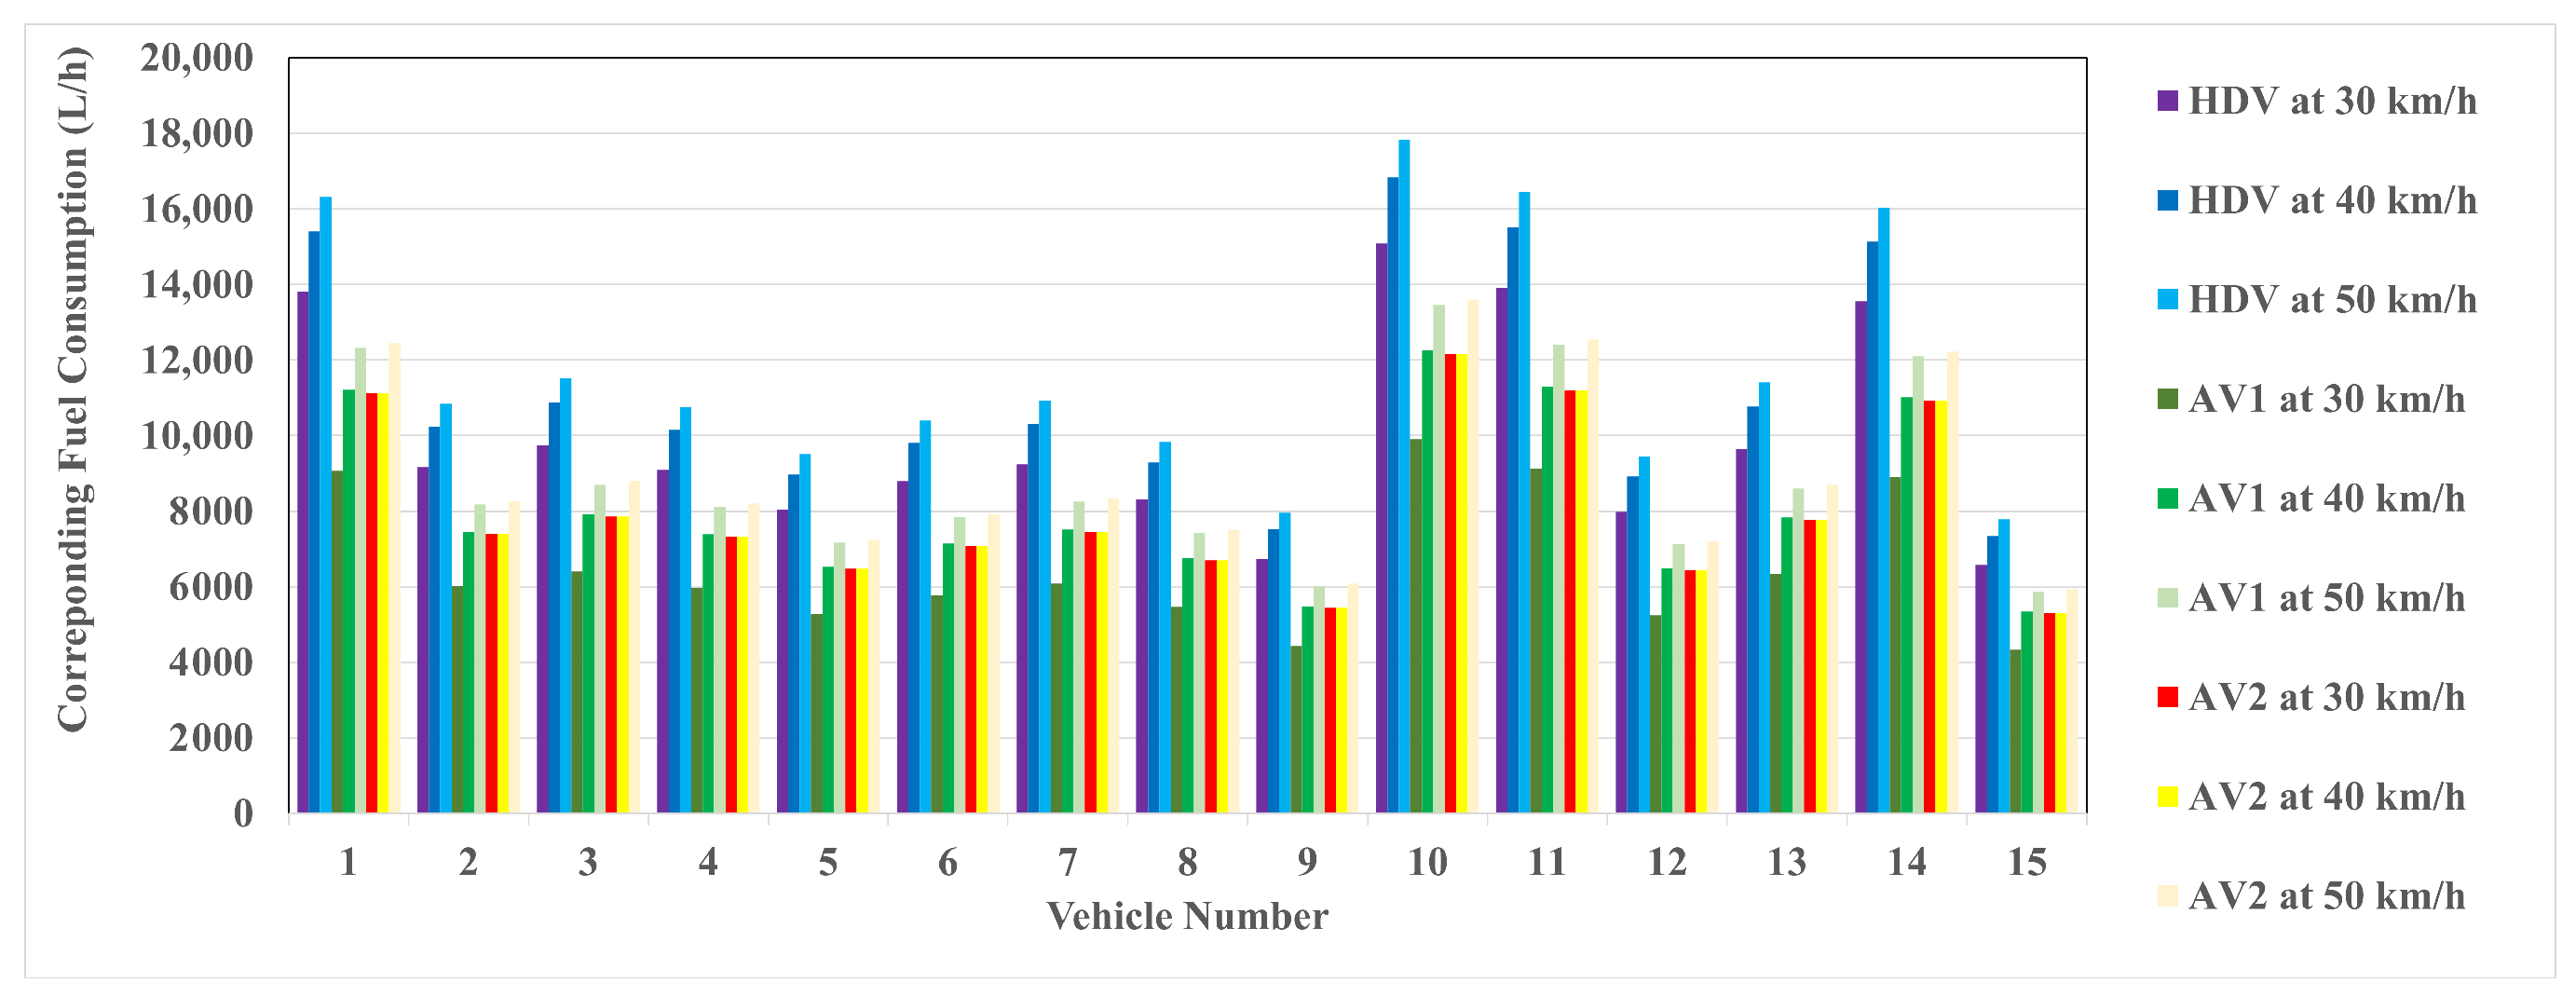
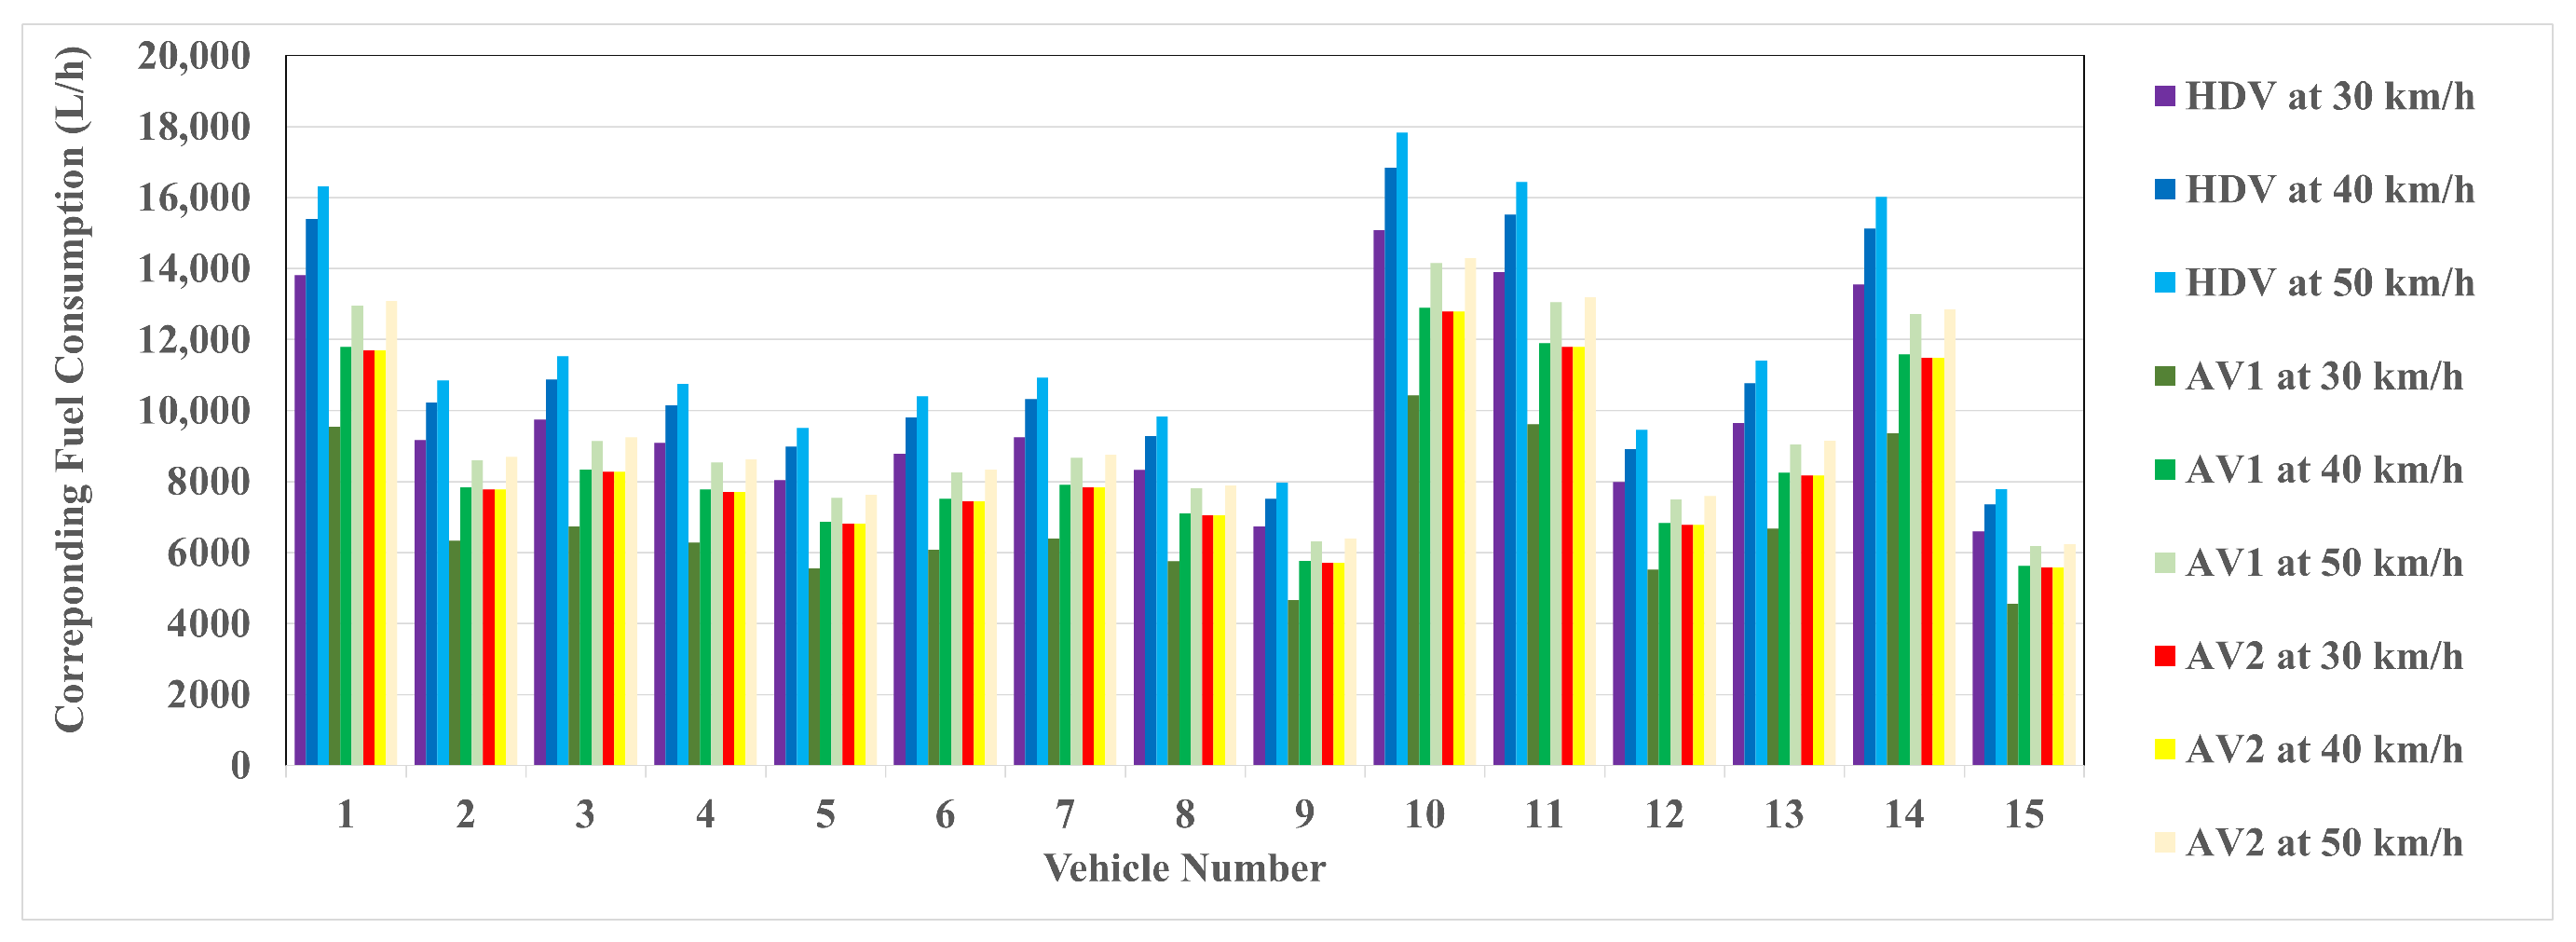
  • ACC at steady speeds [53]: This study included empirical tests conducted on the ZalaZONE Proving Ground. The tests included driving at various consistent speeds to assess how well ACC systems can maintain safe distances between vehicles. Our results suggest that ACC systems reliably achieve optimal following distances, showcasing their effectiveness in controlling vehicle spacing. Nevertheless, a significant drawback became apparent in terms of their negative influence on road capacities. The findings reveal a reduction in capacity percentages for the three categories of ACC-equipped vehicles when compared to human drivers.
Based on the three methodology subsections, the last step includes calculating the overall fuel consumption for both human-driven vehicles and AVs the following equations [51,52,53]:
HDV total fuel by driver error = HDV Average fuel rate × HDV Traffic capacity ,
AV maximum total fuel by driver error = AV Average fuel rate ( lower limit ) × AV Traffic capacity ,
AV minimum total fuel by driver error = AV Average fuel rate ( upper limit ) × AV Traffic capacity ,
HDV total fuel by travel demand = HDV Average fuel rate × HDV Travel demand ,
AV maximum total fuel by travel demand = AV Average fuel rate ( lower limit ) × AV Travel demand ,
AV minimum total fuel by travel demand = AV Average fuel rate ( upper limit ) × AV Travel demand ,
HDV total fuel at steady speeds = HDV Average fuel rate × HDV Traffic capacity ,
AV maximum total fuel by ACC at steady speeds = AV Average fuel rate ( lower limit ) × AV Traffic capacity ,
AV minimum total fuel by ACC at steady speeds = AV Average fuel rate ( upper limit ) × AV Traffic capacity ,

3. Results

This section presents an in-depth analysis of the fuel consumption findings, along with the corresponding results derived from our original research encompassing driver behavior, travel demand, and ACC performance at steady speeds. The findings are elucidated in detail, providing a comprehensive overview of the outcomes derived from these investigations.

3.1. Total Fuel Consumption with Respect to Diver Behavior

Table 3 displays the outcomes of traffic capacity at a signalized intersection derived from both human-driven vehicles and AVs, as obtained from [51]. The study encompasses four distinct levels of driver error (10%, 30%, 50%, 70%), each contributing to varying traffic capacities. Notably, the analysis addresses scenarios involving HDVs, as well as a scenario with 100% AV penetration.
By utilizing the above traffic capacities, Figure 2, Figure 3, Figure 4, Figure 5, Figure 6, Figure 7, Figure 8 and Figure 9 visually depict the aggregate fuel consumption data for the fifteen vehicles. This analysis considers scenarios where the vehicles are categorized as HDVs and, alternatively, as AVs. The evaluation extends to both lower and upper limits within the four defined energy impact areas, offering a comprehensive view of the variations in fuel consumption under different conditions.
In the context of lower-limit fuel savings, it is noteworthy that the total fuel consumption for HDVs marginally underperforms compared to AVs. However, it is imperative to acknowledge that these findings are specific to a single intersection, and the fuel consumption differentials may vary across multiple intersections. Conversely, when exploring the upper bounds of fuel economy savings, HDVs exhibit a higher aggregate fuel consumption than their AV counterparts. This observation aligns with expectations, considering that individual AV fuel consumption, as documented in the literature, has been reported to achieve a remarkable 16.42% reduction.

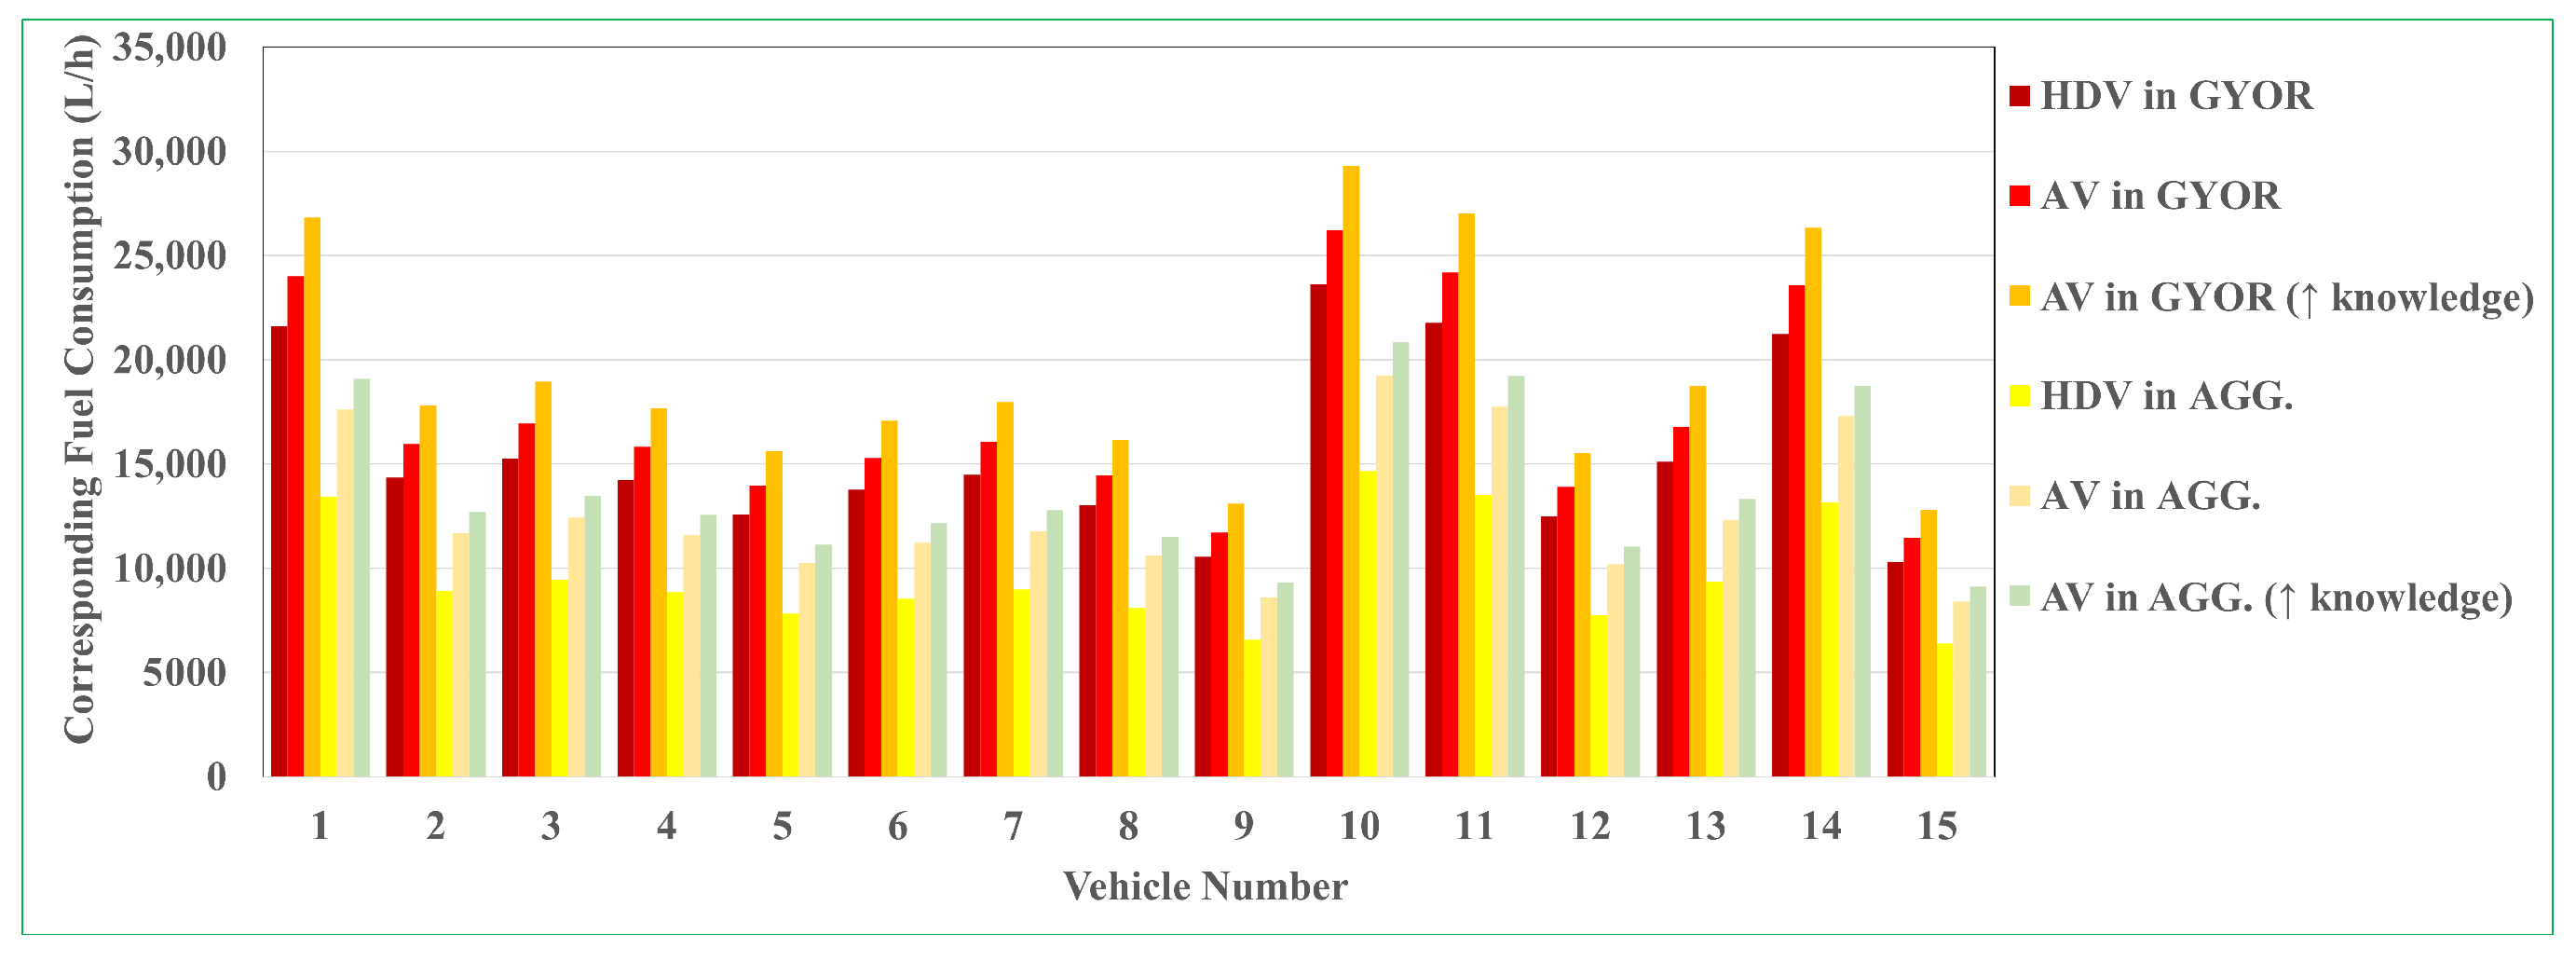
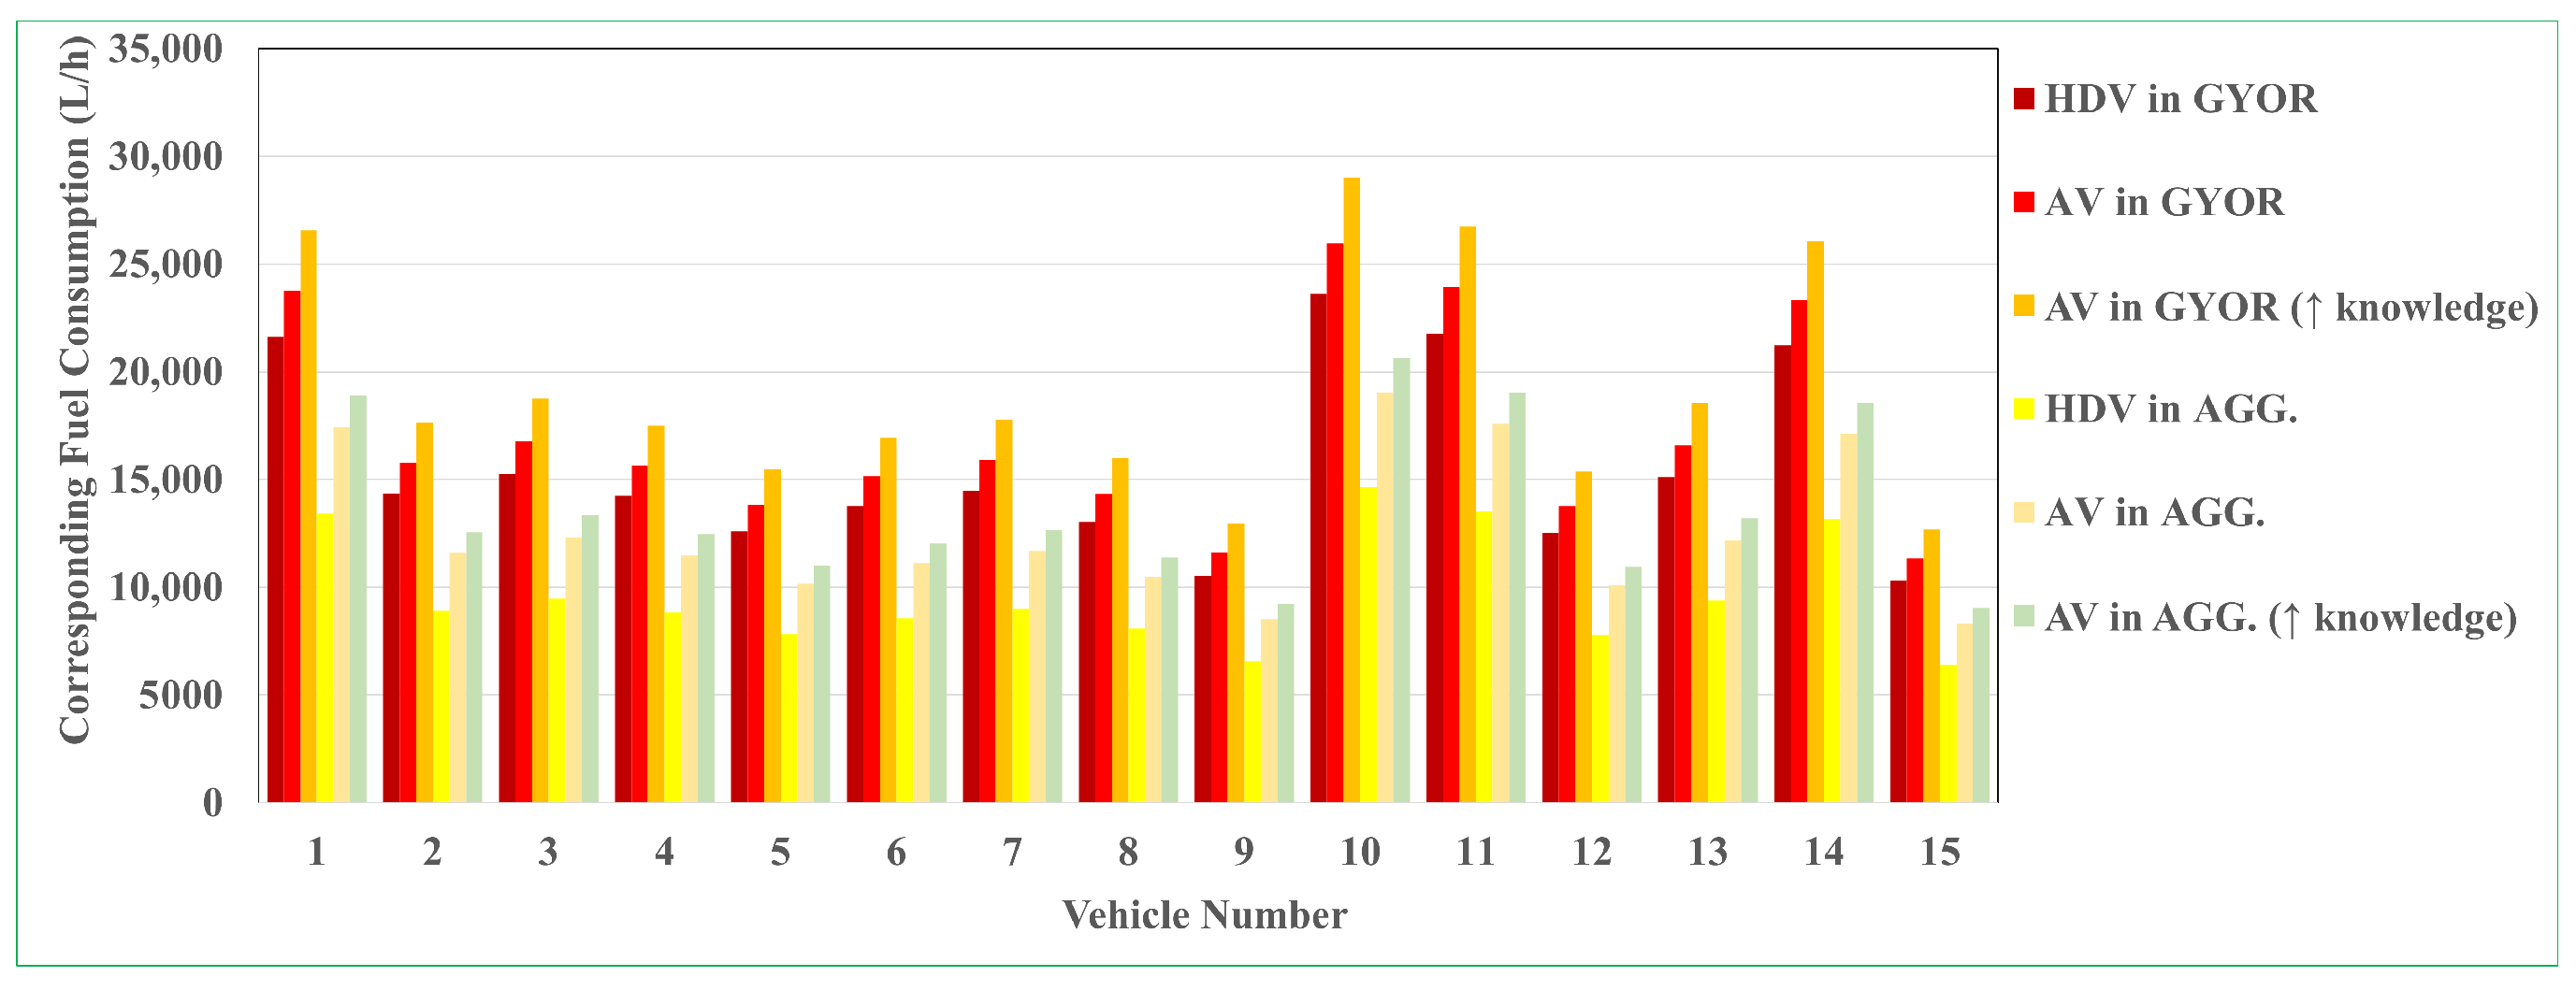
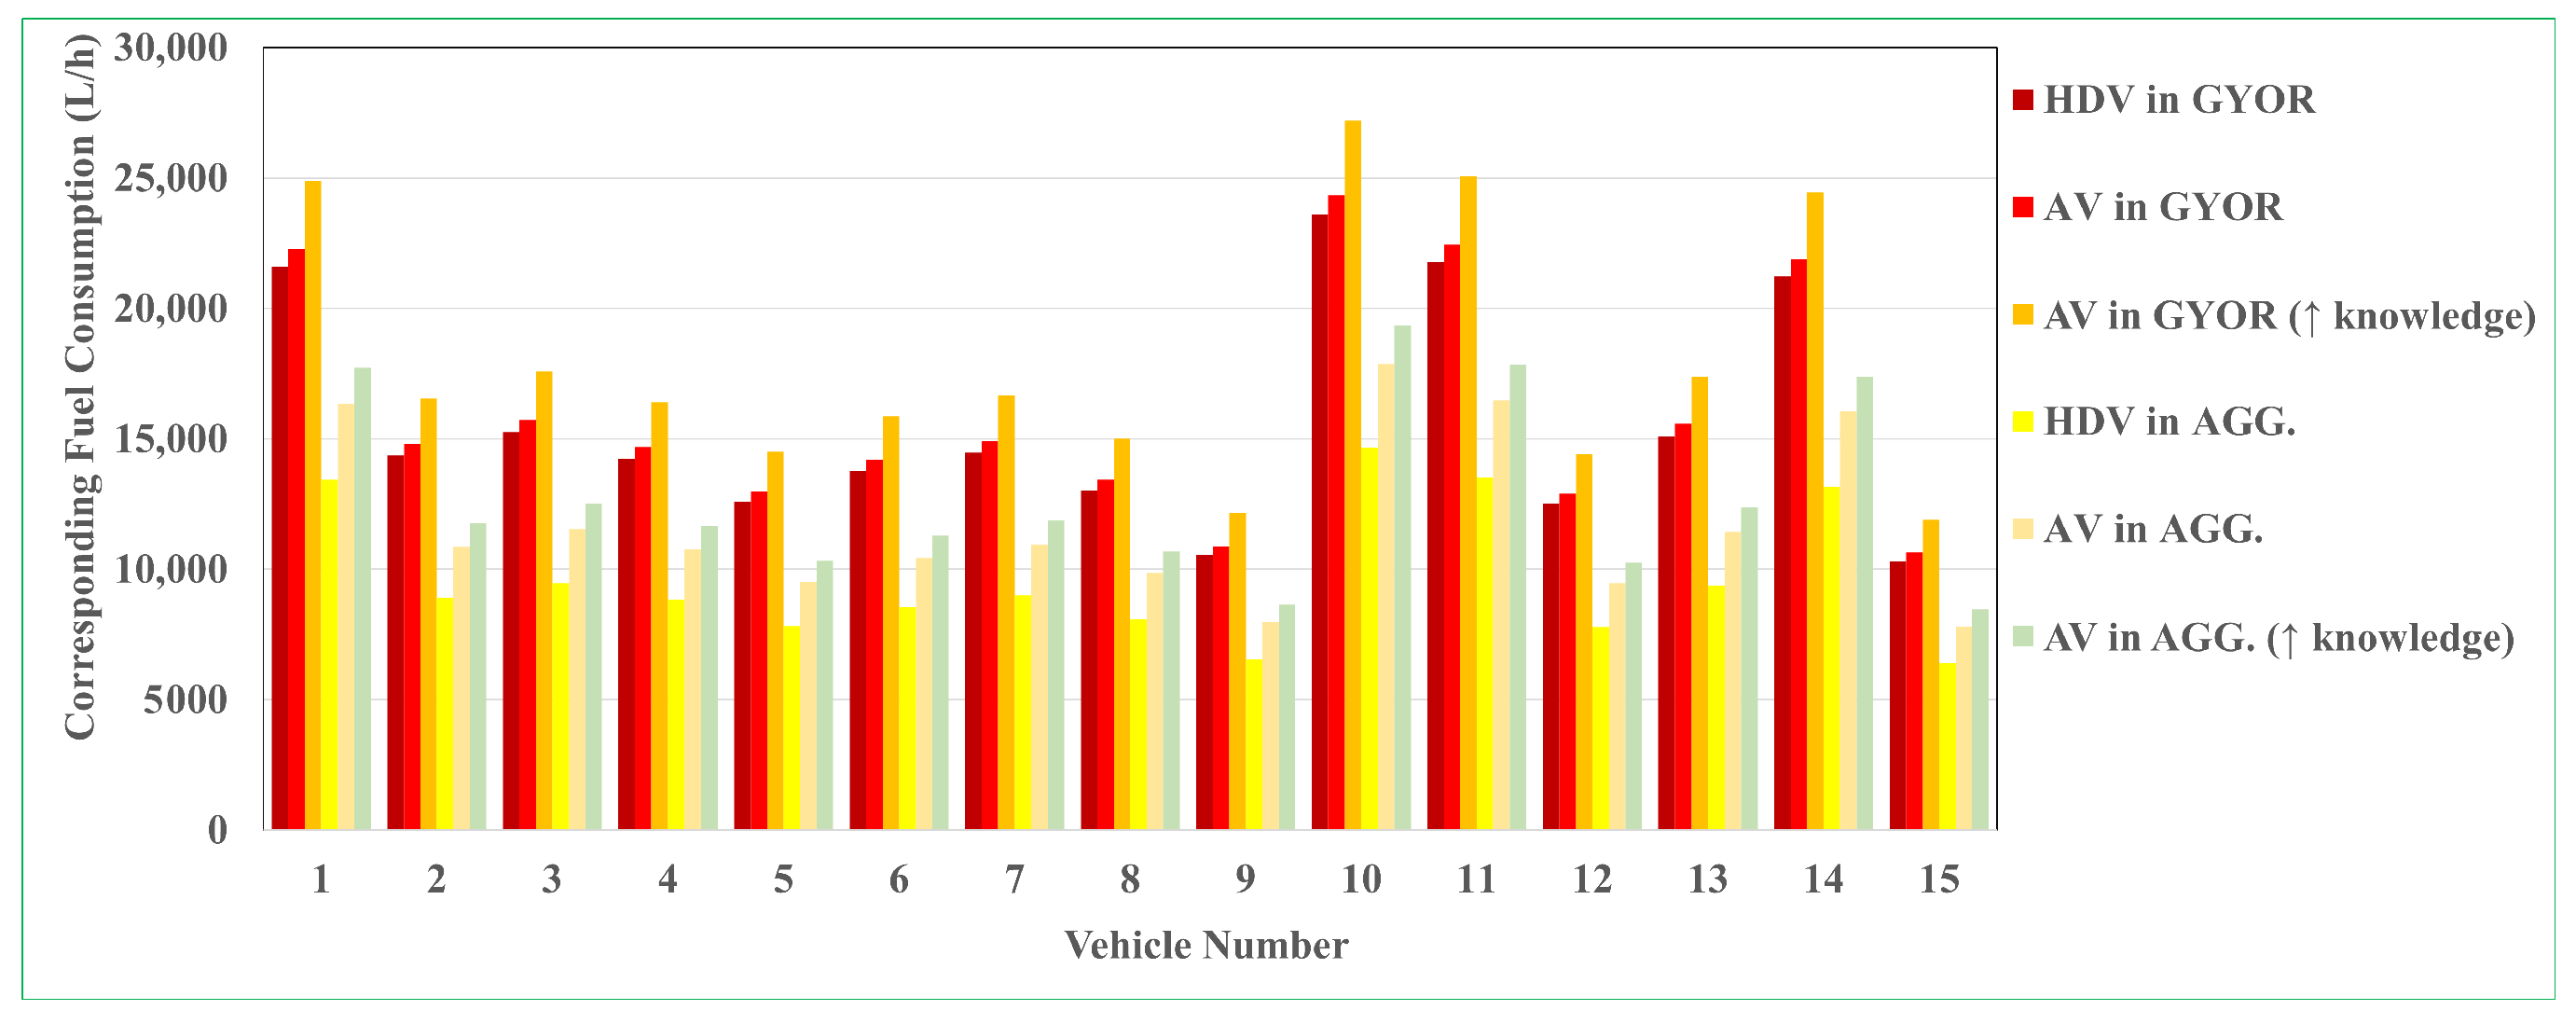
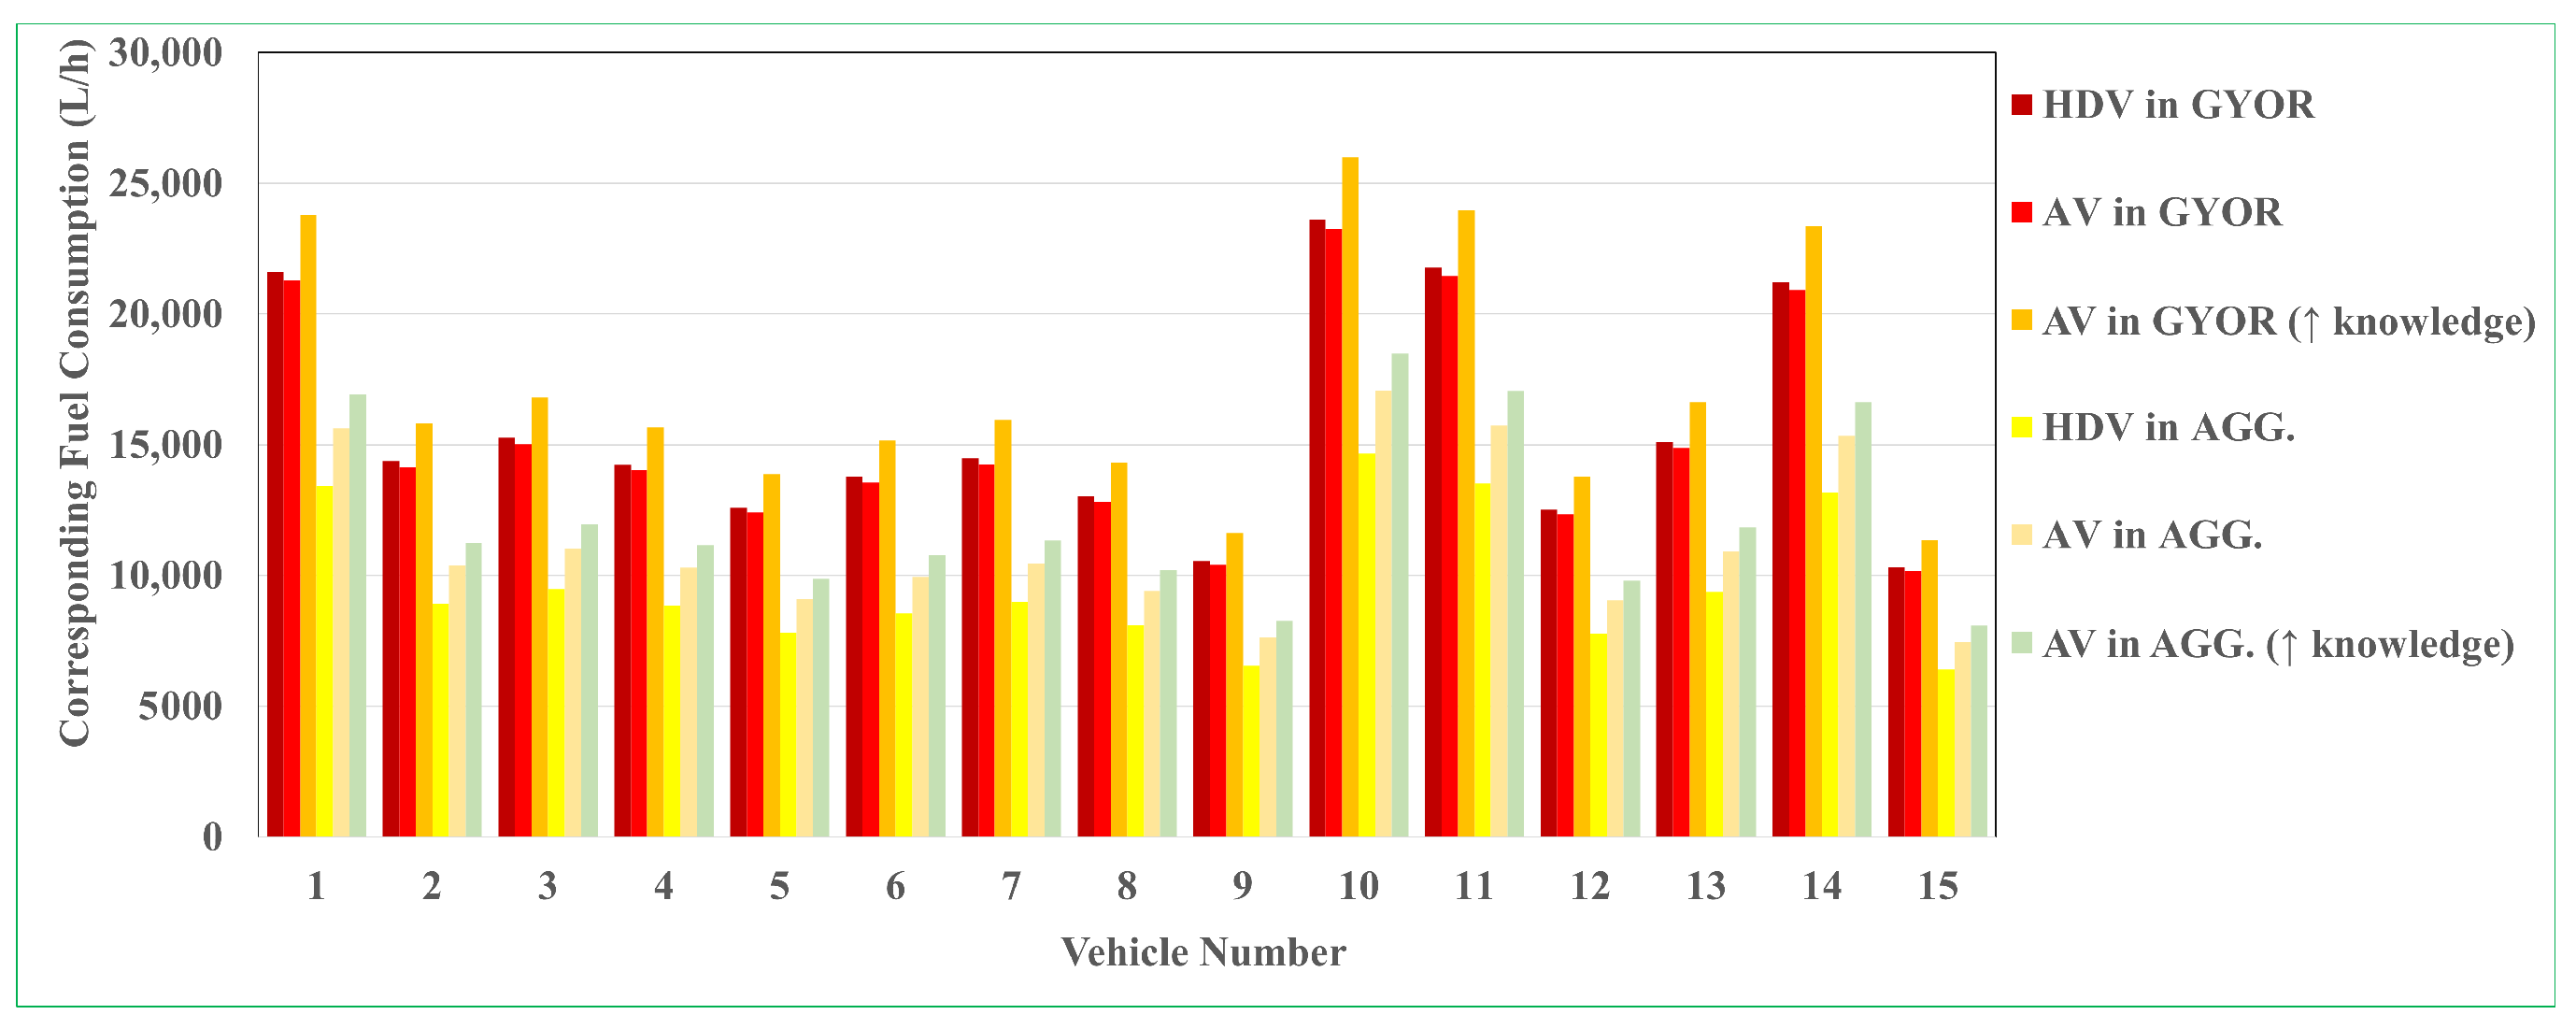
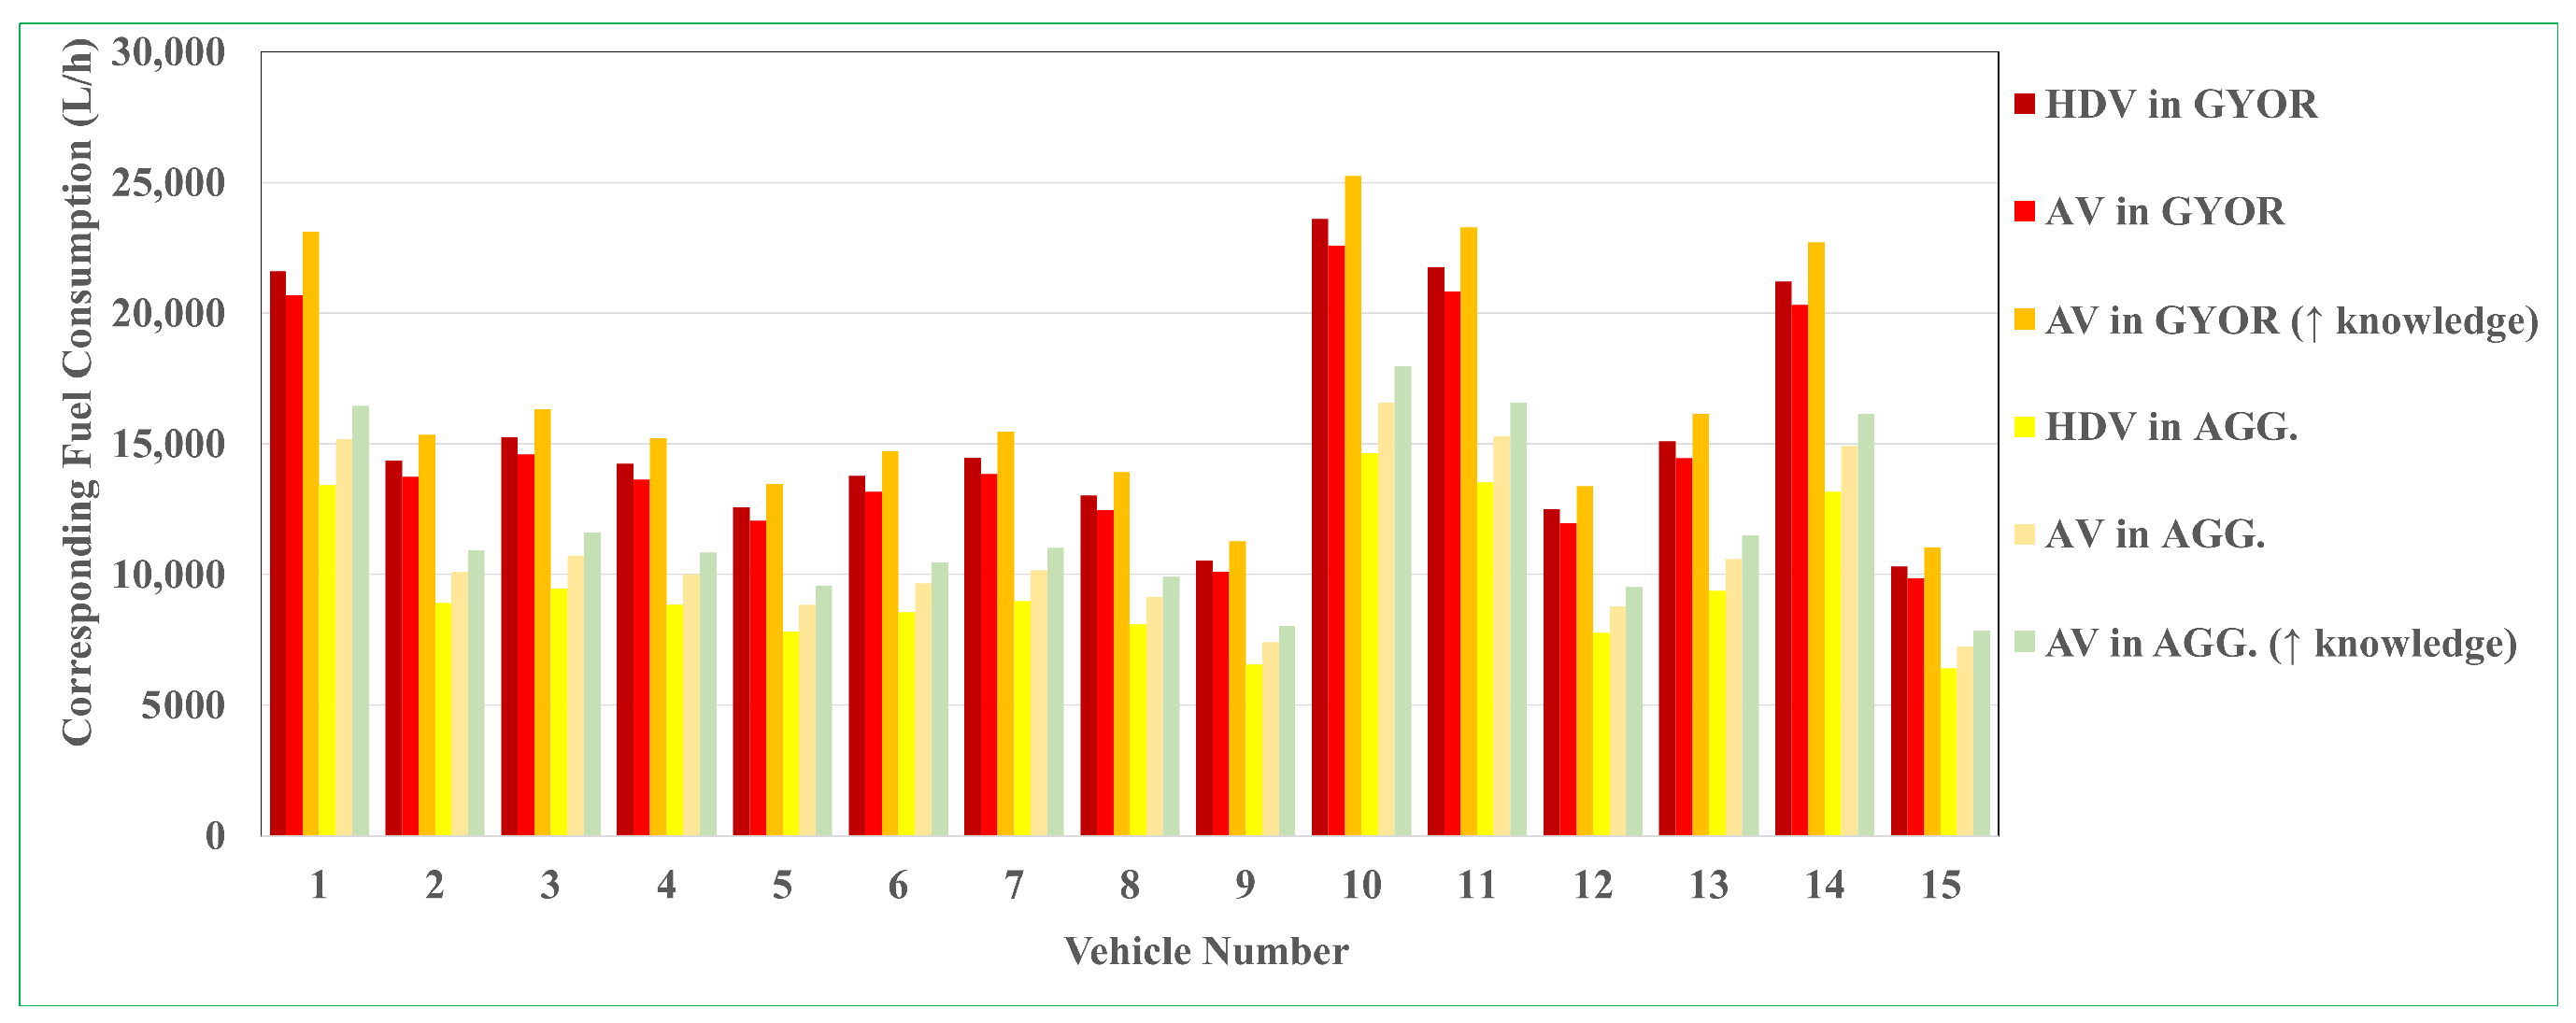
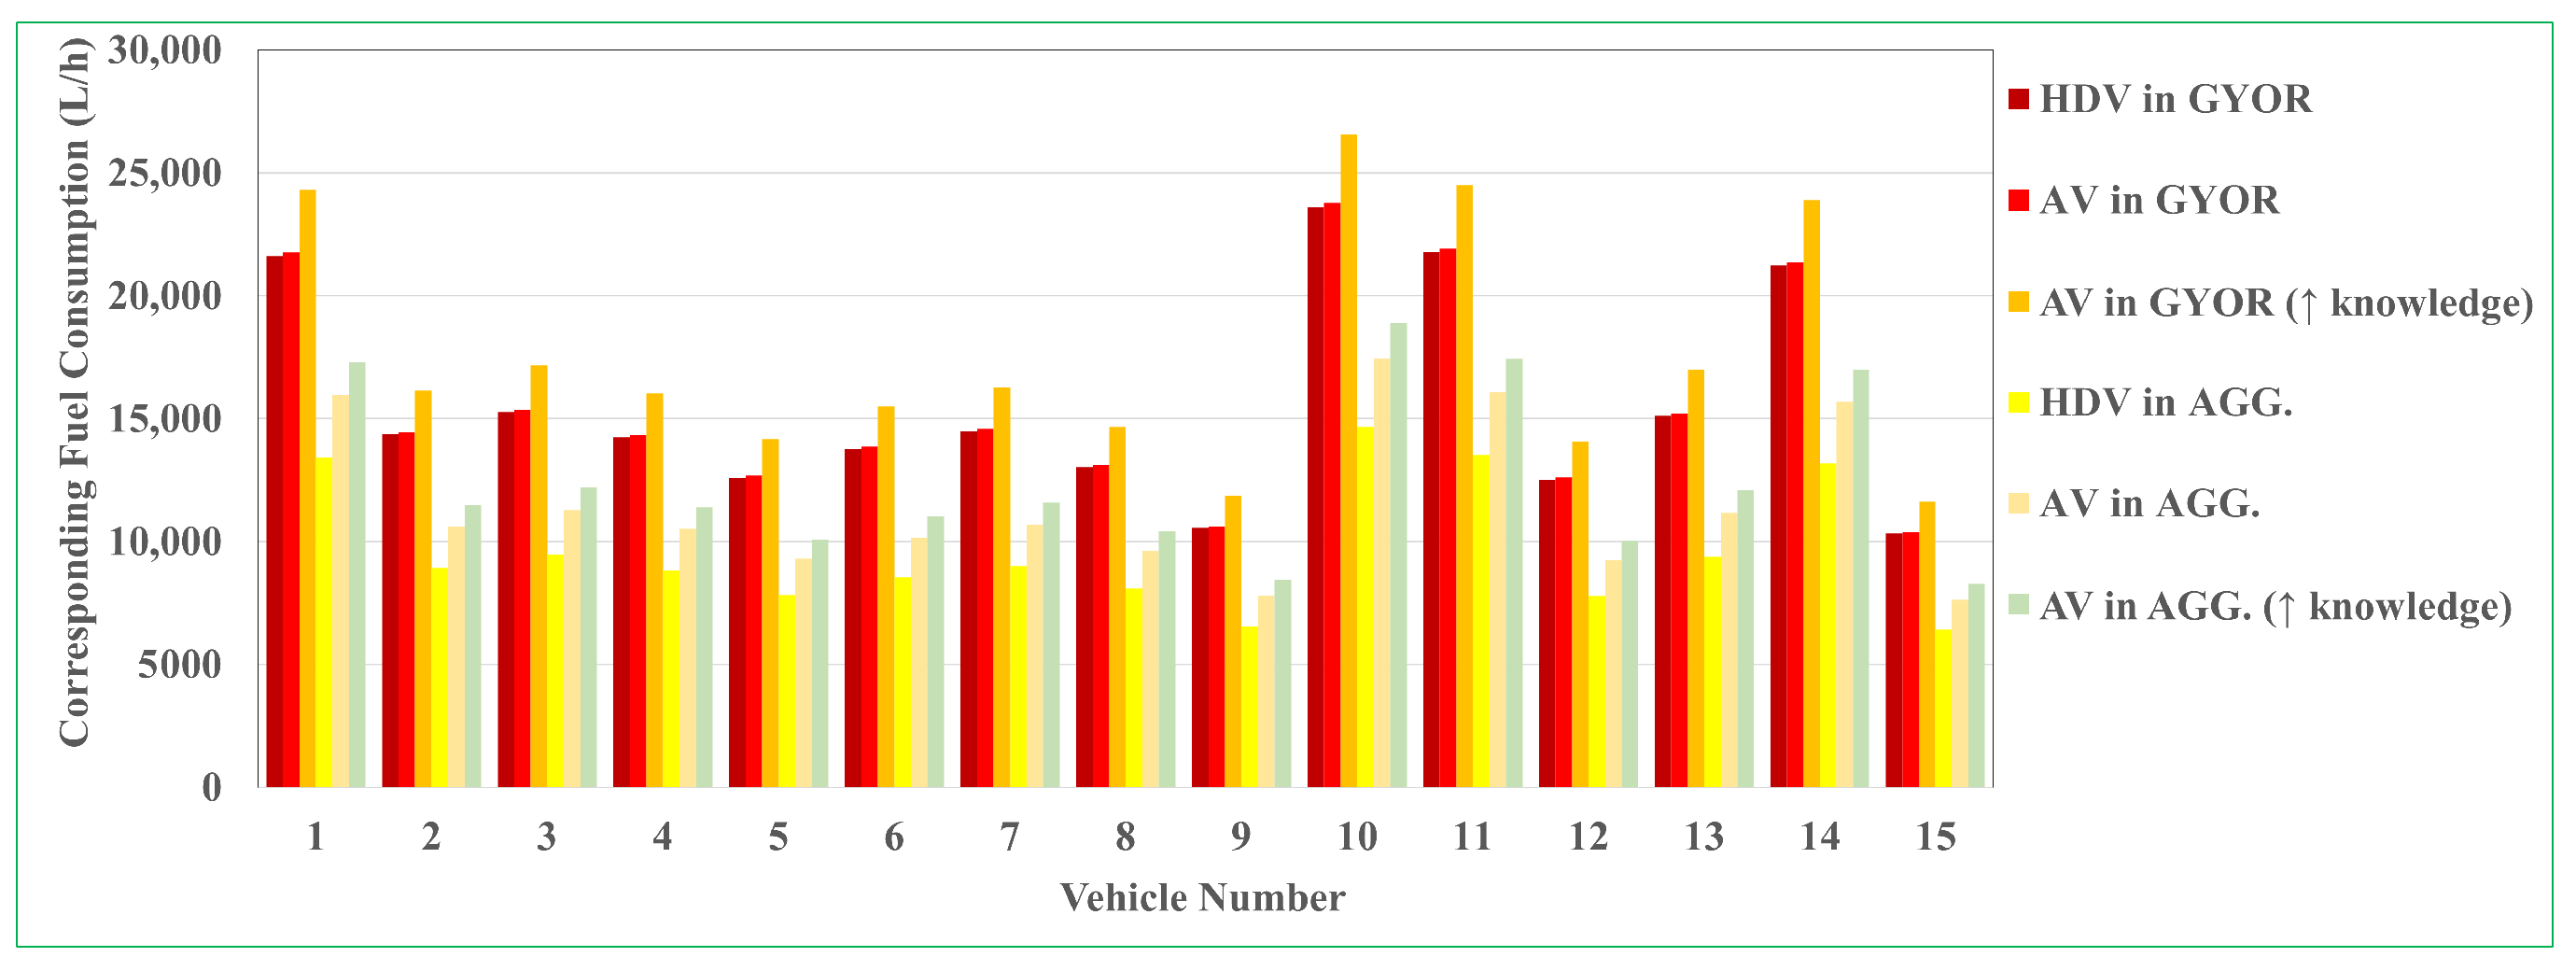
3.2. Total Fuel Consumption with Respect to Travel Demand

The travel demand for both HDVs and AVs in terms of the number of trips per hour, sourced from [52], is presented in Table 4. It is evident that the integration of AVs into our conventional vehicle landscape will lead to an increase in travel demand. Moreover, enhancing knowledge about AVs is expected to further escalate this demand.
Figure 10, Figure 11, Figure 12, Figure 13, Figure 14, Figure 15, Figure 16 and Figure 17 visually illustrate the impact of increased travel demand on total fuel consumption. While AVs present an opportunity to save fuel on an individual basis, the rise in AV travel demand, particularly among older and disabled individuals, results in an overall increase in fuel consumption compared to traditional human-driven vehicles [4].
Despite the potential for fuel savings at both lower and upper limits, the rising demand for travel, particularly among those with advanced knowledge of AV technologies, has not mitigated the high rate of fuel consumption associated with AV usage.
In assessing the lower limits of fuel efficiency, it is apparent that the differences among the four categories of fuel consumption areas are minimal, making it challenging to discern significant variations. This challenge arises due to the narrow range between these categories in terms of percentage of savings. Conversely, in upper limit categories, distinctions are more discernible owing to comparatively greater disparities in energy savings. Moreover, findings from the travel demand analysis reveal a higher volume of fuel consumption compared to that resulting from driver behavior, measured in liters consumed per hour, for both cases.

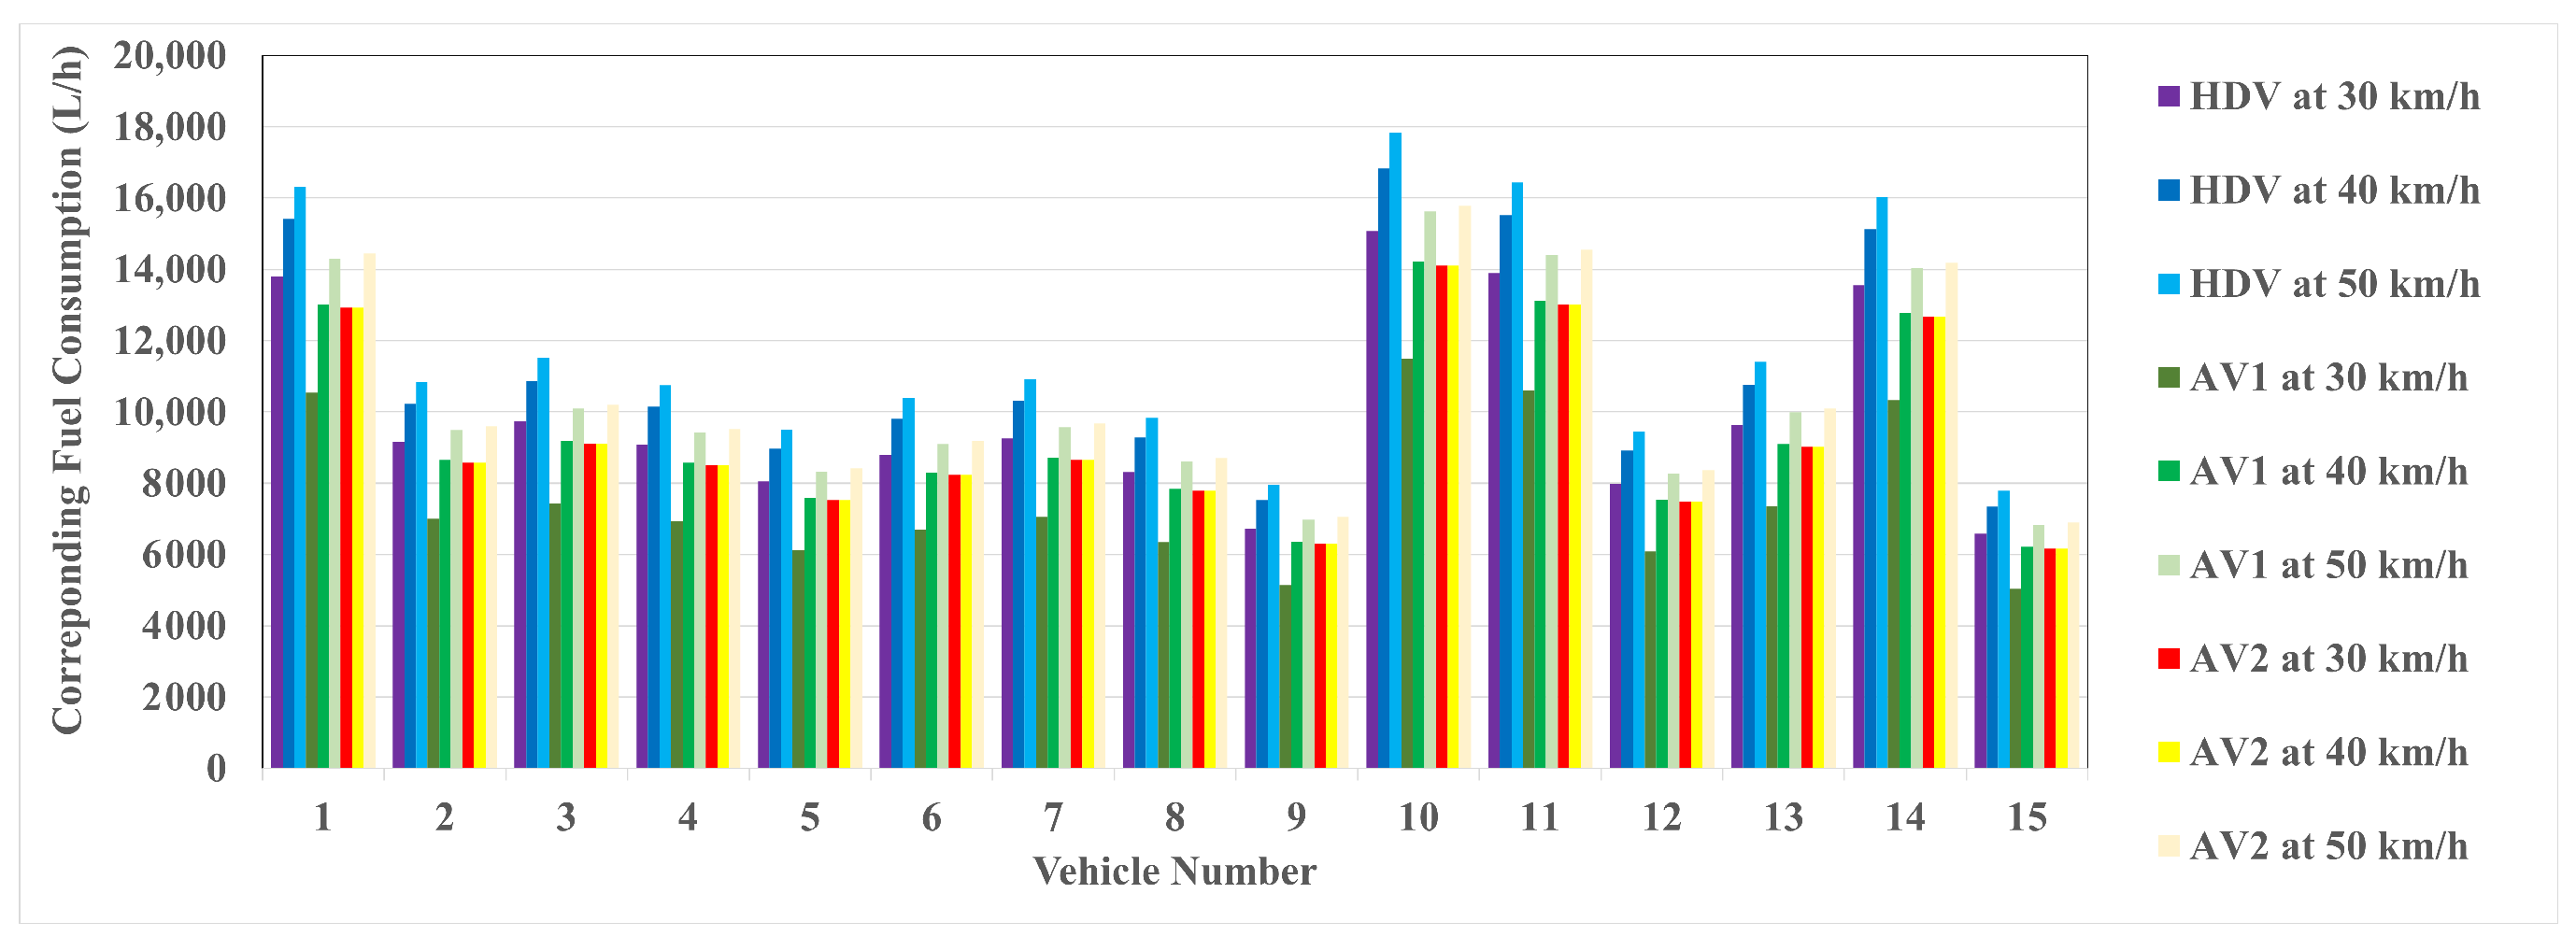
3.3. Total Fuel Consumption with Respect to ACC Performance at Steady Speeds

At this stage, we drew upon our earlier research, which aimed to offer perspectives on the prospective utilization of AVs by empirically investigating the following distances covered in different driving conditions. Controlled experiments were conducted using three vehicles equipped with diverse ACC sensors, and equivalent scenarios were duplicated with human drivers. However, one of the tested ACC equipped vehicles, which represented an electric vehicle, has not been considered in the current study. The reason behind that is that the study focused on comparing the fuel consumption between automated driving modes AV and HDV, specifically emphasizing vehicles with internal combustion engines (ICE) as the energy source. It was also aimed to provide a direct comparison between these two driving modes within the context of conventional fuel-powered vehicles, as they constitute the majority of vehicles on the road and are central to current transportation systems. Including an electric vehicle in the analysis would introduce a significant deviation from the primary focus of our study, potentially confounding the comparison between AV and HDV in terms of fuel consumption. The experiments encompassed driving at various constant speeds to assess the effectiveness of ACC in upholding secure following distances. The results for the traffic capacities are derived from [53] and presented in Table 5. Nevertheless, only the capacity data obtained at constant speeds of 30, 40, and 50 km/h is utilized for the purpose of fitting the current research data.
Figure 18, Figure 19, Figure 20, Figure 21, Figure 22, Figure 23, Figure 24 and Figure 25 present an overview of the total fuel consumption across the fifteen vehicles in three distinct scenarios: one involving HDV and two featuring AVs. To delve deeper into the ACC performance during the experiments in [53], AV1 relies on a vision-based camera sensor for the ACC in the car-following procedure. While AV2 utilizes a combined camera-radar sensor integrated into the ACC system.
The mentioned figures vividly depict the variations in total fuel consumption observed with HDVs, AV1, and AV2, considering both the lower and upper limits of energy savings. As a result, it is evident from the presented data that HDVs at a constant driving speed of 50 km/h exhibit the highest rates of fuel consumption. In contrast, AV1 at a speed of 30 km/h demonstrates the lowest rate of fuel consumption among all scenarios. This is due to the large capacities resulting from HDV when shorter following distances are maintained ahead of the leading vehicles, especially at higher speeds. In contrast, camera-based and combined camera-radar-based ACC systems provide longer and safer following distances, thus resulting in fewer vehicles per hour and, ultimately, lower fuel consumption per hour. Additionally, human drivers tend to drive more aggressively compared to ACC systems, which operate with smoother acceleration and deceleration rates, resulting in a more reasonable amount of fuel consumption.

4. Discussion

This study investigates the potential fuel consumption associated with the presence of AVs in the real world. The study’s results reveal two main branches of fuel savings, as outlined in the literature, that may impact the overall fuel consumption. The first part of the obtained results shown in Figures, an analysis of lower limits of energy savings, indicates nearly identical traffic capacities for HDVs and AVs at a low percentage of human driver error. Consequently, fuel consumption is considered to be at the same level. Contrastingly, a higher error percentage results in lower traffic capacity for HDVs, leading to the vehicle engine being more likely in the idling state. Consequently, lower fuel consumption rates are expected compared to the scenario of AVs navigating through interactions. On the other hand, at the upper limit of fuel consumption by AVs, the generated capacities surpass those of HDVs at all levels of human driver error, as illustrated in Figure 6, Figure 7, Figure 8 and Figure 9. It is worth mentioning that, while the study primarily focuses on the fuel consumption rates under different scenarios, incorporating a comparison of total consumption in predefined trips would provide a more comprehensive understanding of overall efficiency between AVs and HDVs.
The second part of the results raises concerns regarding the anticipated increase in fuel consumption corresponding to the rising demand for travel. Both the lower and upper bounds of energy savings, derived from the analysis of AVs single driving scenarios, contribute to a higher overall fuel consumption level as shown in Figures. Various factors contribute to this trend, including the integration of new user groups, such as the elderly, disabled individuals, and those under the age of 18 who lack a driving license. These demographics collectively amplify the demand for travel by AVs. However, it is important to consider the previous modes of transportation for these groups. For instance, if they primarily utilized taxis before, the shift to AVs could potentially have a positive impact on fuel consumption, as AVs may offer more efficient and direct routes. On the other hand, if they relied on public transportation, like buses or trains, the transition to AVs could result in a negative impact on fuel consumption. Therefore, it is crucial to recognize that not every AV user would be a new transportation user; some may simply switch from existing modes of transport. Moreover, an additional surge in trips is expected due to heightened public awareness of AVs and an increasing acceptance rate of this emerging technology. The mitigation of safety concerns within the public’s perception is likely to further boost the adoption of AVs in the near future.
The final segment of the results reveals a significantly lower total fuel consumption during the longitudinal behavior of AVs compared to HDVs. This can be attributed to the consistent speeds maintained throughout the experiment. During the track runs, the acceleration and deceleration for AVs were minimized, resulting in higher overall fuel consumption rates for HDVs in comparison to both AV1, simulated by a vision-based ACC system, and AV2, simulated by a radar-based ACC system, as illustrated in Figure 18, Figure 19, Figure 20, Figure 21, Figure 22, Figure 23, Figure 24 and Figure 25. While this analysis and its results may appear logical due to the disparities in traffic capacities resulting from the mentioned scenarios, it is important to note that the study’s primary focus was to investigate the quantity of fuel consumption and gain a comprehensive understanding of the potential future advantages and disadvantages associated with both driving modes in terms of energy efficiency.
Finally, to gain a more comprehensive understanding of the relative impact of AVs on overall fuel consumption within low and high energy savings limits, Figure 26 and Figure 27 present the percentage of total fuel consumption attributed to AVs in comparison to HDVs across all scenarios. These scenarios align with the outcomes of our earlier investigations into driver behavior, travel demand, and ACC performance at constant speeds.

5. Conclusions

This study explored the potential impact of AVs on fuel consumption, drawing upon a comprehensive review of existing literature that employed simulation models, road test models, and laboratory experimental models. The investigation encompassed four key areas of energy impact, analyzing factors such as car-following behavior, platooning, powertrain control, and intersection control, to provide a thorough coverage of the literature. The findings revealed an intricate relationship between AV technology and fuel consumption. Notably, the study underscored that various factors contribute to the total fuel consumption by AVs. These include the potential change in traffic capacity due to the elimination of human driver errors, as well as improvements in car-following behavior. Additionally, the study considered the impact of public preferences for AV travel. For this reason, our previous studies were selected to integrate their results, providing a cohesive understanding of the topic and yielding significant insights.
Despite the promising potential of vehicle automation technology to yield energy savings, in the analysis of individual AVs, the study demonstrated that the average percentages of total fuel consumption by AVs compared to HDVs exhibited a varied pattern. While some scenarios showcased records of fuel consumption mitigation, there was a notable increment in fuel consumption, especially at low limits of individual AV energy savings. Specifically, the study disclosed fuel consumption mitigation ranging from 1.13% to 23.88% in pessimistic scenarios and 2.01% to 30.31% in optimistic scenarios. In contrast, the range of fuel consumption increment varied between 1.67% and 41.97% at lower limits of energy savings and 1.5% to 29.98% at upper limits. These outcomes underscore the complexity of the relationship between AV behavior and fuel consumption. Importantly, these findings bear significance for the sustainability of transportation and offer valuable insights for planners venturing into the burgeoning industry of vehicle automation. By shedding light on the potential energy savings and challenges associated with AVs, this study contributes to a clearer vision for future transportation planning, guiding decision-makers in navigating the path towards a more sustainable and efficient transport system.

Author Contributions

Conceptualization, D.M. and B.H.; methodology, D.M.; formal analysis, D.M.; investigation, D.M.; writing—original draft preparation, D.M.; writing—review and editing, B.H.; visualization, D.M.; supervision, B.H. All authors have read and agreed to the published version of the manuscript.

Funding

This research received no external funding.

Data Availability Statement

The data presented in this study are available on request from the corresponding author. The data are not publicly available due to the interests of those providing the location and conditions of the measurement.

Conflicts of Interest

The authors declare no conflicts of interest.

Abbreviations

The following abbreviations are used in this manuscript:
AVAutonomous Vehicle
CAVConnected Autonomous Vehicle
OBDOn-Board Diagnostics
HDVHuman-Driven Vehicle
ACCAdaptive Cruise Control
CACCCooperative Adaptive Cruise Control
IDMIntelligent Driver Model
EPAEnvironmental Protection Agency
VSPVehicle-Specific Power
ECMSEquivalent Consumption Minimization Strategy
HEVHybrid Electric Vehicle
EILEngine In the Loop
V2VVehicle to Vehicle
V2IVehicle to Infrastructure
EADEco-Approach and Departure

References

  1. Wang, Z.; Shi, X.; Li, X. Review of Lane-Changing Maneuvers of Connected and Automated Vehicles: Models, Algorithms and Traffic Impact Analyses. J. Indian Inst. Sci. 2019, 99, 589–599. [Google Scholar] [CrossRef]
  2. Morando, M.M.; Tian, Q.; Truong, L.T.; Vu, H.L. Studying the Safety Impact of Autonomous Vehicles Using Simulation-Based Surrogate Safety Measures. J. Adv. Transp. 2018, 2018, 6135183. [Google Scholar] [CrossRef]
  3. Hoogendoorn, R.; van Arerm, B.; Hoogendoom, S. Automated Driving, Traffic Flow Efficiency, and Human Factors: Literature Review. Transp. Res. Rec. 2014, 2422, 113–120. [Google Scholar] [CrossRef]
  4. Wadud, Z.; MacKenzie, D.; Leiby, P. Help or hindrance? The travel, energy and carbon impacts of highly automated vehicles. Transp. Res. Part A Policy Pract. 2016, 86, 1–18. [Google Scholar] [CrossRef]
  5. Chen, B.; Chen, Y.; Wu, Y.; Xiu, Y.; Fu, X.; Zhang, K. The Effects of Autonomous Vehicles on Traffic Efficiency and Energy Consumption. Systems 2023, 11, 347. [Google Scholar] [CrossRef]
  6. Sigle, S.; Hahn, R. Energy Assessment of Different Powertrain Options for Heavy-Duty Vehicles and Energy Implications of Autonomous Driving. Energies 2023, 16, 6512. [Google Scholar] [CrossRef]
  7. Wang, C.; Dai, Y.; Xia, J. A CAV Platoon Control Method for Isolated Intersections: Guaranteed Feasible Multi-Objective Approach with Priority. Energies 2020, 13, 625. [Google Scholar] [CrossRef]
  8. Heiberg, S.; Emond, E.; Allen, C.; Raya, D.; Gadhamshetty, V.; Dhiman, S.S.; Ravilla, A.; Celik, I. Environmental Impact Assessment of Autonomous Transportation Systems. Energies 2023, 16, 5009. [Google Scholar] [CrossRef]
  9. Noroozi, M.; Moghaddam, H.R.; Shah, A.; Charkhgard, H.; Sarkar, S.; Das, T.K.; Pohland, T. An AI-Assisted Systematic Literature Review of the Impact of Vehicle Automation on Energy Consumption. IEEE Trans. Intell. Veh. 2023, 8, 3572–3592. [Google Scholar] [CrossRef]
  10. Carrone, A.P.; Rich, J.; Vandet, C.A.; An, K. Autonomous vehicles in mixed motorway traffic: Capacity utilisation, impact and policy implications. Transportation 2021, 48, 2907–2938. [Google Scholar] [CrossRef]
  11. Lu, Q.; Tettamanti, T.; Hörcher, D.; Varga, I. The impact of autonomous vehicles on urban traffic network capacity: An experimental analysis by microscopic traffic simulation. Transp. Lett. 2020, 12, 540–549. [Google Scholar] [CrossRef]
  12. Park, J.E.; Byun, W.; Kim, Y.; Ahn, H.; Shin, D.K. The Impact of Automated Vehicles on Traffic Flow and Road Capacity on Urban Road Networks. J. Adv. Transp. 2021, 2021, 8404951. [Google Scholar] [CrossRef]
  13. Ramezani, M.; Machado, J.A.; Skabardonis, A.; Geroliminis, N. Capacity and delay analysis of arterials with mixed autonomous and human-driven vehicles. In Proceedings of the 5th IEEE International Conference on Models and Technologies for Intelligent Transportation Systems (MT-ITS), Naples, Italy, 26–28 June 2017; pp. 280–284. [Google Scholar] [CrossRef]
  14. Huang, Y.; Ye, Y.; Sun, J.; Tian, Y. Characterizing the Impact of Autonomous Vehicles on Macroscopic Fundamental Diagrams. IEEE Trans. Intell. Transp. Syst. 2023, 24, 6530–6541. [Google Scholar] [CrossRef]
  15. Almlöf, E.; Nybacka, M.; Pernestål, A.; Jenelius, E. Will leisure trips be more affected than work trips by autonomous technology? Modelling self-driving public transport and cars in Stockholm, Sweden. Transp. Res. Part A Policy Pract. 2022, 165, 1–19. [Google Scholar] [CrossRef]
  16. Luo, Y.; Xiang, D.; Zhang, S.; Liang, W.; Sun, J.; Zhu, L. Evaluation on the Fuel Economy of Automated Vehicles with Data-Driven Simulation Method. Energy AI 2021, 3, 100051. [Google Scholar] [CrossRef]
  17. Qian, G.; Chung, E. Evaluating effects of eco-driving at traffic intersections based on traffic micro-simulation. In Proceedings of the 34th Australasian Transport Research Forum, Adelaide, Australia, 28–30 September 2011; pp. 1–11. [Google Scholar]
  18. Mersky, A.C.; Samaras, C. Fuel economy testing of autonomous vehicles. Transp. Res. Part C Emerg. Technol. 2016, 65, 31–48. [Google Scholar] [CrossRef]
  19. Wu, J.; Liao, H.; Wang, J.W.; Chen, T. The role of environmental concern in the public acceptance of autonomous electric vehicles: A survey from China. Transp. Res. Part F Traffic Psychol. Behav. 2019, 60, 37–46. [Google Scholar] [CrossRef]
  20. Wu, C.; Zhao, G.; Ou, B. A fuel economy optimization system with applications in vehicles with human drivers and autonomous vehicles. Transp. Res. Part D Transp. Environ. 2011, 16, 515–524. [Google Scholar] [CrossRef]
  21. Chen, Y.; Gonder, J.; Young, S.; Wood, E. Quantifying autonomous vehicles national fuel consumption impacts: A data-rich approach. Transp. Res. Part A Policy Pract. 2019, 122, 134–145. [Google Scholar] [CrossRef]
  22. Stern, R.E.; Cui, S.; Delle Monache, M.L.; Bhadani, R.; Bunting, M.; Churchill, M.; Hamilton, N.; Haulcy, R.; Pohlmann, H.; Wu, F.; et al. Dissipation of stop-and-go waves via control of autonomous vehicles: Field experiments. Transp. Res. Part C Emerg. Technol. 2018, 89, 205–221. [Google Scholar] [CrossRef]
  23. Sivakumar, R.; Mangalam, H. Ensemble hill climbing optimization in adaptive cruise control for safe automated vehicle transportation. J. Supercomput. 2020, 76, 5780–5800. [Google Scholar] [CrossRef]
  24. Charness, N.; Yoon, J.S.; Souders, D.; Stothart, C.; Yehnert, C. Predictors of Attitudes Toward Autonomous Vehicles: The Roles of Age, Gender, Prior Knowledge, and Personality. Front. Psychol. 2018, 9, 2589. [Google Scholar] [CrossRef] [PubMed]
  25. Pourabdollah, M.; Bjärkvik, E.; Fürer, F.; Lindenberg, B.; Burgdorf, K. Fuel economy assessment of semi-autonomous vehicles using measured data. In Proceedings of the 2017 IEEE Transportation Electrification Conference and Expo (ITEC), Chicago, IL, USA, 22–24 June 2017; pp. 761–766. [Google Scholar] [CrossRef]
  26. Ozkan, M.F.; Ma, Y. Eco-Driving of Connected and Automated Vehicle With Preceding Driver Behavior Prediction. J. Dyn. Syst. Meas. Control 2020, 143, 011002. [Google Scholar] [CrossRef]
  27. Ahmed, H.U.; Huang, Y.; Lu, P. A Review of Car-Following Models and Modeling Tools for Human and Autonomous-Ready Driving Behaviors in Micro-Simulation. Smart Cities 2021, 4, 19. [Google Scholar] [CrossRef]
  28. Huang, J.; Song, G.; He, F.; Tan, Z. Energetic Impacts of Autonomous Vehicles in Real-World Traffic Conditions From Nine Open-Source Datasets. IEEE Trans. Intell. Transp. Syst. 2023, 24, 9901–9914. [Google Scholar] [CrossRef]
  29. Zhu, L.; Gonder, J.; Bjarkvik, E.; Pourabdollah, M.; Lindenberg, B. An Automated Vehicle Fuel Economy Benefits Evaluation Framework Using Real-World Travel and Traffic Data. IEEE Intell. Transp. Syst. Mag. 2019, 11, 29–41. [Google Scholar] [CrossRef]
  30. Khosravinia, K.; Wang, S.; Lin, X. Eco-Driving Control of Connected and Automated Hybrid Electric Vehicles on Multi-lane Roads Using Model Predictive Control. SAE Int. J. Adv. Curr. Pract. Mobil. 2021, 3, 1748–1756. [Google Scholar] [CrossRef]
  31. Duarte, G.; Gonçalves, G.; Baptista, P.; Farias, T. Establishing bonds between vehicle certification data and real-world vehicle fuel consumption—A Vehicle Specific Power approach. Energy Convers. Manag. 2015, 92, 251–265. [Google Scholar] [CrossRef]
  32. Shi, X.; Yao, H.; Liang, Z.; Li, X. An empirical study on fuel consumption of commercial automated vehicles. Transp. Res. Part D Transp. Environ. 2022, 106, 103253. [Google Scholar] [CrossRef]
  33. Zhang, L.; Zhang, T.; Peng, K.; Zhao, X.; Xu, Z. Can Autonomous Vehicles Save Fuel? Findings from Field Experiments. J. Adv. Transp. 2022, 2022, 2631692. [Google Scholar] [CrossRef]
  34. He, Y.; Makridis, M.; Fontaras, G.; Mattas, K.; Xu, H.; Ciuffo, B. The energy impact of adaptive cruise control in real-world highway multiple-car-following scenarios. Eur. Transp. Res. Rev. 2020, 12, 17. [Google Scholar] [CrossRef]
  35. Song, M.; Chen, F.; Ma, X. Organization of autonomous truck platoon considering energy saving and pavement fatigue. Transp. Res. Part D Transp. Environ. 2021, 90, 102667. [Google Scholar] [CrossRef]
  36. van de Hoef, S.; Johansson, K.H.; Dimarogonas, D.V. Fuel-Efficient En Route Formation of Truck Platoons. IEEE Trans. Intell. Transp. Syst. 2018, 19, 102–112. [Google Scholar] [CrossRef]
  37. Yang, X.T.; Huang, K.; Zhang, Z.; Zhang, Z.A.; Lin, F. Eco-Driving System for Connected Automated Vehicles: Multi-Objective Trajectory Optimization. IEEE Trans. Intell. Transp. Syst. 2021, 22, 7837–7849. [Google Scholar] [CrossRef]
  38. Tsugawa, S. An Overview on an Automated Truck Platoon within the Energy ITS Project. IFAC Proc. Vol. 2013, 46, 41–46. [Google Scholar] [CrossRef]
  39. Lu, X.Y.; Shladover, S.E. Automated Truck Platoon Control and Field Test. In Road Vehicle Automation; Springer International Publishing: Cham, Switzerland, 2014; pp. 247–261. [Google Scholar] [CrossRef]
  40. Ko, Y.D.; Song, B.D.; Oh, Y. Mathematical Analysis of Environmental Effects of Forming a Platoon of Smart Vehicles. Sustainability 2019, 11, 571. [Google Scholar] [CrossRef]
  41. Ciuffo, B.; Makridis, M.; Toledo, T.; Fontaras, G. Capability of Current Car-Following Models to Reproduce Vehicle Free-Flow Acceleration Dynamics. IEEE Trans. Intell. Transp. Syst. 2018, 19, 3594–3603. [Google Scholar] [CrossRef]
  42. Chen, Y.; Sun, R.; Wu, X. Estimating Bounds of Aerodynamic, Mass, and Auxiliary Load Impacts on Autonomous Vehicles: A Powertrain Simulation Approach. Sustainability 2021, 13, 12405. [Google Scholar] [CrossRef]
  43. Huang, C.; Salehi, R.; Ersal, T.; Stefanopoulou, A.G. An energy and emission conscious adaptive cruise controller for a connected automated diesel truck. Veh. Syst. Dyn. 2020, 58, 805–825. [Google Scholar] [CrossRef]
  44. Zhang, F.; Hu, X.; Langari, R.; Wang, L.; Cui, Y.; Pang, H. Adaptive energy management in automated hybrid electric vehicles with flexible torque request. Energy 2021, 214, 118873. [Google Scholar] [CrossRef]
  45. Xu, C.; Groelke, B.; Alvarez Tiburcio, M.; Earnhardt, C.; Borek, J.; Pelletier, E.; Boyle, S.; Huynh, B.; Wahba, M.; Geyer, S.; et al. Engine-in-the-Loop Study of a Hierarchical Predictive Online Controller for Connected and Automated Heavy-Duty Vehicles. In Proceedings of the WCX SAE World Congress Experience, Virtually, 16–18 June 2020. [Google Scholar] [CrossRef]
  46. Nie, Z.; Jia, Y.; Wang, W.; Outbib, R. Eco-Co-Optimization strategy for connected and automated fuel cell hybrid vehicles in dynamic urban traffic settings. Energy Convers. Manag. 2022, 263, 115690. [Google Scholar] [CrossRef]
  47. Shao, Y.; Sun, Z. Eco-Approach With Traffic Prediction and Experimental Validation for Connected and Autonomous Vehicles. IEEE Trans. Intell. Transp. Syst. 2021, 22, 1562–1572. [Google Scholar] [CrossRef]
  48. Zhang, X.; Zhang, T.; Zou, Y.; Du, G.; Guo, N. Predictive Eco-Driving Application Considering Real-World Traffic Flow. IEEE Access 2020, 8, 82187–82200. [Google Scholar] [CrossRef]
  49. Du, Z.; HomChaudhuri, B.; Pisu, P. Hierarchical distributed coordination strategy of connected and automated vehicles at multiple intersections. J. Intell. Transp. Syst. 2018, 22, 144–158. [Google Scholar] [CrossRef]
  50. Jiang, H.; Hu, J.; An, S.; Wang, M.; Park, B.B. Eco approaching at an isolated signalized intersection under partially connected and automated vehicles environment. Transp. Res. Part C Emerg. Technol. 2017, 79, 290–307. [Google Scholar] [CrossRef]
  51. Mohammed, D.; Horváth, B. Effect of Different Driver Behaviour Parameters in Microsimulation Model. In Proceedings of the XX. European Transport Congress, Győr, Hungary, 9–10 June 2022; pp. 64–71. [Google Scholar]
  52. Mohammed, D.; Horváth, B. Travel Demand Increment Due to the Use of Autonomous Vehicles. Sustainability 2023, 15, 8937. [Google Scholar] [CrossRef]
  53. Mohammed, D.; Horváth, B. Steady-Speed Traffic Capacity Analysis for Autonomous and Human-Driven Vehicles. Appl. Sci. 2024, 14, 337. [Google Scholar] [CrossRef]
Figure 1. Tested vehicles and corresponding fuel consumption rates, based on [22].
Energies 17 01589 g001
Figure 2. Aggregate fuel consumption by driver behavior for lower limits of car-following.
Energies 17 01589 g002
Figure 3. Aggregate fuel consumption by driver behavior for lower limits of platooning.
Energies 17 01589 g003
Figure 4. Aggregate fuel consumption by driver behavior for lower limits of powertrain.
Energies 17 01589 g004
Figure 5. Aggregate fuel consumption by driver behavior for lower limits of intersection control.
Energies 17 01589 g005
Figure 6. Aggregate fuel consumption by driver behavior for upper limits of car-following.
Energies 17 01589 g006
Figure 7. Aggregate fuel consumption by driver behavior for upper limits of platooning.
Energies 17 01589 g007
Figure 8. Aggregate fuel consumption by driver behavior for upper limits of powertrain.
Energies 17 01589 g008
Figure 9. Aggregate fuel consumption by driver behavior for upper limits of intersection control.
Energies 17 01589 g009
Figure 10. Aggregate fuel consumption by travel demand for lower limits of car-following.
Energies 17 01589 g010
Figure 11. Aggregate fuel consumption by travel demand for lower limits of platooning.
Energies 17 01589 g011
Figure 12. Aggregate fuel consumption by travel demand for lower limits of powertrain.
Energies 17 01589 g012
Figure 13. Aggregate fuel consumption by travel demand for lower limits of intersection control.
Energies 17 01589 g013
Figure 14. Aggregate fuel consumption by travel demand for upper limits of car-following.
Energies 17 01589 g014
Figure 15. Aggregate fuel consumption by travel demand for upper limits of platooning.
Energies 17 01589 g015
Figure 16. Aggregate fuel consumption by travel demand for upper limits of powertrain.
Energies 17 01589 g016
Figure 17. Aggregate fuel consumption by travel demand for upper limits of intersection control.
Energies 17 01589 g017
Figure 18. Aggregate fuel consumption by ACC at steady speeds lower limits of car-following.
Energies 17 01589 g018
Figure 19. Aggregate fuel consumption by ACC at steady speeds lower limits of platooning.
Energies 17 01589 g019
Figure 20. Aggregate fuel consumption by ACC at steady speeds for lower limits of powertrain.
Energies 17 01589 g020
Figure 21. Aggregate fuel consumption by ACC at steady speeds for lower limits of intersection control.
Energies 17 01589 g021
Figure 22. Aggregate fuel consumption by ACC at steady speeds for upper limits of car-following.
Energies 17 01589 g022
Figure 23. Aggregate fuel consumption by ACC at steady speeds for upper limits of platooning.
Energies 17 01589 g023
Figure 24. Aggregate fuel consumption by ACC at steady speeds for upper limits of powertrain.
Energies 17 01589 g024
Figure 25. Aggregate fuel consumption by ACC at steady speeds for upper limits of intersection control.
Energies 17 01589 g025
Figure 26. Percentage of total fuel consumption of AVs to HDVs at lower energy savings limits.
Energies 17 01589 g026
Figure 27. Percentage of total fuel consumption of AVs to HDVs at upper energy savings limits.
Energies 17 01589 g027
Table 1. Make, model and year of the tested vehicles, based on [22].
Vehicle NumberYearMakeModel
12013ChevroletSilverado
22013DodgeGrand Caravan
32015ChevroletMalibu
42012ChevroletMalibu
52012DodgeGrand Caravan
62014ChevroletMalibu
72016ChevroletMalibu
82013ChevroletImpala
92016ChevroletMalibu Limited
102015ChevroletSuburban
112014ChevroletSilverado
122014DodgeGrand Caravan
132016DodgeGrand Caravan
142016ChevroletSuburban
152009FordEscape Hybrid
Table 2. Fuel consumption rates [L/h] of HDVs and different energy impact areas using AVs.
Nr.HDV(AV) Car-Following(AV) Platooning(AV) Powertrain(AV) Int. Control
3%10%3.8%14%4%16.42%2.02%12.1%
15.515.344.965.304.745.294.615.404.84
23.663.553.293.523.153.513.063.593.22
33.893.773.503.743.353.733.253.813.42
43.633.523.273.493.123.483.033.563.19
53.213.112.893.092.763.082.683.152.82
63.513.403.163.383.023.372.933.443.09
73.693.583.323.553.173.543.083.623.24
83.323.222.993.192.863.192.773.252.92
92.692.612.422.592.312.582.252.642.36
106.025.845.425.795.185.785.035.905.29
115.555.385.005.344.775.334.645.444.88
123.193.092.873.072.743.062.673.132.80
133.853.733.473.703.313.703.223.773.38
145.415.254.875.204.655.194.525.304.76
152.632.552.372.532.262.522.202.582.31
Table 3. Traffic capacities [Veh/h] at signalized intersection for HDVs and AVs [51].
Human Driver Error10%30%50%70%
HDV3962385337453660
AV4047404740474047
Table 4. Travel demand [trips/h] in Győr City and its agglomeration using HDVs and AVs [52].
Travel ModeGyőr CityAgglomeration
Current trips by HDVs39232436
Future trips by AVs44932397
Future trips by AVs with increased knowledge about AVs50213573
Table 5. Traffic capacities [Veh/h] at different driving speeds for HDVs and AVs [53].
Driving Speed30 km/h40 km/h50 km/h
HDV250527962962
AV1197024362675
AV2241724172703
Disclaimer/Publisher’s Note: The statements, opinions and data contained in all publications are solely those of the individual author(s) and contributor(s) and not of MDPI and/or the editor(s). MDPI and/or the editor(s) disclaim responsibility for any injury to people or property resulting from any ideas, methods, instructions or products referred to in the content.

