Article

Influence of Plastic Strain on Heat Capacity of L485ME Pipe Steel Grade

1
Laboratory for Research on Materials and Structures, Faculty of Mechanical Engineering, Bydgoszcz University of Science and Technology, Al. Prof. S. Kaliskiego 7, 85-796 Bydgoszcz, Poland
2
Department of Heating and Gas Systems, Warsaw University of Technology, Nowowiejska Str. 20, 00-653 Warszawa, Poland
3
Composite Structures and Innovative Materials Laboratory, University of Sciences and Technology USTOMB, BP 1505, Oran 31000, Algeria
*
Author to whom correspondence should be addressed.
Energies 2024, 17(7), 1554; https://doi.org/10.3390/en17071554
Submission received: 3 December 2023 / Revised: 13 March 2024 / Accepted: 18 March 2024 / Published: 24 March 2024
(This article belongs to the Special Issue Advances in Gas Transportation by Pipeline and LNG)

Abstract

:
The aim of this work is an experimental evaluation of a specific heat capacity as a function of plastic strain for thermo-mechanically rolled pipe material, with application of an infrared thermographic camera. The tensile load tests of samples prepared of L485ME (X70M) steel grade were performed with the use of a strength machine. Based on other known material thermophysical properties, the determination of heat source parameters was conducted with the use of an infrared thermography and with an optimization task solution. A linear regression equation describing the specific heat capacity as a function of plastic percentage elongation for L485ME steel grade was determined. The experimental results of the present study showed a linear increase in the specific heat capacity in the range of the analyzed tensile deformation up to 16%. The presented methodology is suitable for assessment of the material specific heat capacity as a function of strain up to the occurrence of the sample narrowing in a direction perpendicular to the tensile force.

1. Introduction

Two primary thermophysical properties of solid and fluid are distinguished: (i) thermal conductivity (λ) and (ii) specific heat capacity at constant pressure (cp). Thermal conductivity is related to the ability of a material to transmit thermal energy. Specific heat capacity characterizes the capability of storing the energy by material. Thermal properties are functions of material structure, its composition, and temperature. The magnitude of a steel heat capacity depends on the concentration of material imperfections, methods of heat-treatment and temperature changes, manufacturing processing and phase transformations. An influence of material deformation on the steel heat capacity obtained from tensile experiments is poorly reflected in the literature. There are only found scarce references to the impact of strain on the thermophysical properties of metals.
For evaluation of the heat capacity, L. R. Botvina [1] used preliminarily deformed cylindrical samples prepared of St20 09G2S steel grade cut out from the pipeline wall. After static tensile tests up to a certain degree of strain, nevertheless without a rupture, the central part of material was cut out from the samples. After experiments resulted in failure, the part of the sample adjoining the rupture surface was used. The specific heat (cp) of the samples was measured using an adiabatic scanning calorimeter in the temperature range of 20–300 °C, at a rate of heating of 2 K/min in an argon atmosphere. The results obtained from research [1] are as follows: (i) an increase in the strain causes a rise in the heat capacity of St20 steel grade, which is more significant in the case of tube 09G2S steel grade; (ii) at the initial stages of strain, the heat capacity remained almost independent of the temperature; however, after reaching elongation close to the ultimate strength of steel, the value of cp began to grow with increasing temperature.
According to M. Zhelnin [2], measurement of material thermal properties is a complex task requiring the use of special equipment and control of certain conditions during a test. In order to identify the thermal conductivity with a high accuracy, steady state methods are usually applied. Simultaneously, an accurate determination of the material specific heat capacity is performed with calorimetry techniques based on its definition. However, these methodologies require a strong limitation on the sample geometry and impose complex experimental setups, due to experiment sensitivity to heat losses and temperature sensor uncertainties. The influence of the plastic deformation on the thermal diffusivity, thermal conductivity and the specific heat capacity of the stainless AISI 304 steel grade was investigated in [2]. To study the thermal properties during mechanical tests, an experimental technique based on infrared thermography and on the data processing procedure has been applied. The presented procedure consists of Gaussian filtering of a sequence of thermographs, operation of averaging the temperature curves obtained from several tests as well as simultaneous determination of thermal diffusivity and thermal conductivity through minimizing the function of discrepancy between the analytical solution and the temperature measurements. As a result of study [2], it was shown that under an influence of the plastic strain, the thermal diffusivity of stainless steel increases linearly, whereas the specific heat capacity and the thermal conductivity decrease linearly for the considered AISI 304 stainless steel, in the studied strain range of ε ≤ 40%.
N. Tao [3] proposed a novel method for nondestructive evaluation of the thermal diffusivity of a bulk material of uniform properties. This method is based on pulsed thermal imaging called multilayer analysis (PTI-MLA), which is often used for coating materials. Since a test sample for PTI-MLA needs to be in a two-layer configuration, it was found that a commercial black electrical tape is suitable to construct a two-layer material with the tape as the first layer and the bulk material as the substrate. The tape is easily bonded with solids and liquids and has stable and uniform thermal diffusivity. This method was evaluated for testing six selected solids with thermal properties covering the range of most engineering materials, inter alia, carbon steel CS Q235, and stainless steel SS 304 manufactured only in China. To determine both thermal conductivity and heat capacity, the thermal diffusivity was measured with a well-established flash method using the same experimental instruments. The measured thermal property values were close to the literature values, with thermal-conductivity differences of λ < 4.6% and heat capacity differences of cp < 6.2%, which demonstrated that the combination of the PTI-MLA and flash methods is a convenient and effective approach to thermophysical property measurement. This also validates that PTI-MLA is an accurate method for thermal diffusivity measurement, since the thermographic technique can provide the specific heat capacity of the material and its thermal map in sense of temperature distribution.
The analysis of the heat capacity for micro-alloyed high-strength S960QL steel grade within temperature range of 50–1100 °C are reported by T. Ślęzak in [4]. The experiments were carried out using the Differential Scanning Calorimeter DSC 404F1 Pegasus. Measurements of thermal characteristic, i.e., heat capacity cp(T) and thermal expansion α*(T) were performed repeatedly in order to observe thermal processes occurring in micro-alloyed high strength steel. Two peaks in a specific heat capacity were observed during heating of the investigated S960QL steel grade.
A study by E. A. Moyseychik [5] emphasizes that thermal evaluation of steel parts is effective when heat is generated by mechanical stresses. The analysis reveals that thermal nondestructive testing is valuable for determining stress states during fracture initiation and evolution, indicating that quasi-static deformation in steel intended for machinery leads to elastic cluster formation and heat release, resulting in a temperature increase of 4.0–12.5 °C. In article [6], T. Haneef proposes an empirical equation linking a temperature increase rate and a strain rate, suggesting the potential of both the acoustic emission and infrared thermography for online monitoring of tensile deformation of AISI type 316 stainless steel. Further investigations on materials such as 2.25 Cr-1 Mo steel and low carbon steel are recommended to understand the effect of strain rate on an acoustic emission dominant frequency and a temperature rise rate during different deformation stages. In G. Risitano’s work [7], the energetic release during a tensile test of C45 steel grade was evaluated using the Static Thermographic Method. The infrared camera monitored the specimen surface temperature under adiabatic conditions, allowing the assessment of the material limit stress (222.2 ± 4.0 MPa). An elastic-plastic finite element analysis confirmed temperature trends, highlighting an influence of internal micro-defects on plastic deformation. The Static Thermographic Method is proposed for predicting the fatigue behavior with limited specimens and time. The paper by L. Huang [8] investigates the impact of deformation on the aging of a Cu-3.5 wt% Ti alloy. Following a 70% deformation after solid solution treatment, aging at 500 °C for 2 h results in transformation from the metastable β′-Cu4Ti phase to the equilibrium β-Cu4Ti phase. Deformation after aging dissolves the metastable phase with optimized heat treatment conditions at 500 °C for 2 h plus 70% deformation plus 450 °C for 2 h yielding improved conductivity (13.88% IACS) and hardness of 340.78 Hv. In investigation [9], S. Bhowmick systematically explore an impact of the strain equivalent to the uniform pressure on the thermal conductivity of the insulating solid. After conducting a theoretical analysis to find the relationship between thermal conductivity, temperature, and strain, classical molecular dynamics calculations are performed. The results from molecular dynamics closely align with the theoretical findings. The study conducted by N.I. Kourov [10] demonstrates significant changes in the heat capacity of ferromagnetic Ni2MnGa-based shape memory alloys after undergoing mega-plastic torsion deformation under high pressure. This alteration is observed across a broad temperature range, where both electron and lattice low-temperature contributions to a heat capacity increase. Additionally, a temperature-independent component of cp(T) appears within the range of 2 K < T < 30 K. Notably, there is no observed spin-wave magnetic contribution to cp(T) in these alloys. Beyond 150 K, a notable additional component to the heat capacity arises in the sub-microcrystalline alloy, attributed to thermoelastic martensitic transformations. Interestingly, this component is absent in the mega-plastically deformed amorphous–nanocrystalline alloy due to the suppression of martensitic transformations, influenced by the size effect and the stabilization of the austenite phase.
Infrared thermography is a test method used more and more to determine material properties, such as tensile strength [11], uniaxial [12], or multiaxial [13] fatigue properties of metals or entropy-related analyses in fatigue [14]. To the authors’ best knowledge, only a few publications analyze the specific heat capacity of the low-alloy steel based on thermography obtained from an infrared camera. In the present study, the infrared thermographic camera was used for the specific heat capacity determination as a function of percentage elongation, for a material commonly used for construction of gas transmission pipelines. The correlation of the specific heat capacity and a strain rate up to obtaining the sample narrowing in the direction perpendicular to the tensile force in the monotonic tensile tests of L485ME steel grade is the subject of the present research. The way of carrying out the experiments for thermo-mechanically rolled pipe steel and the obtained results are the novelty of the current research.

2. Materials and Methods

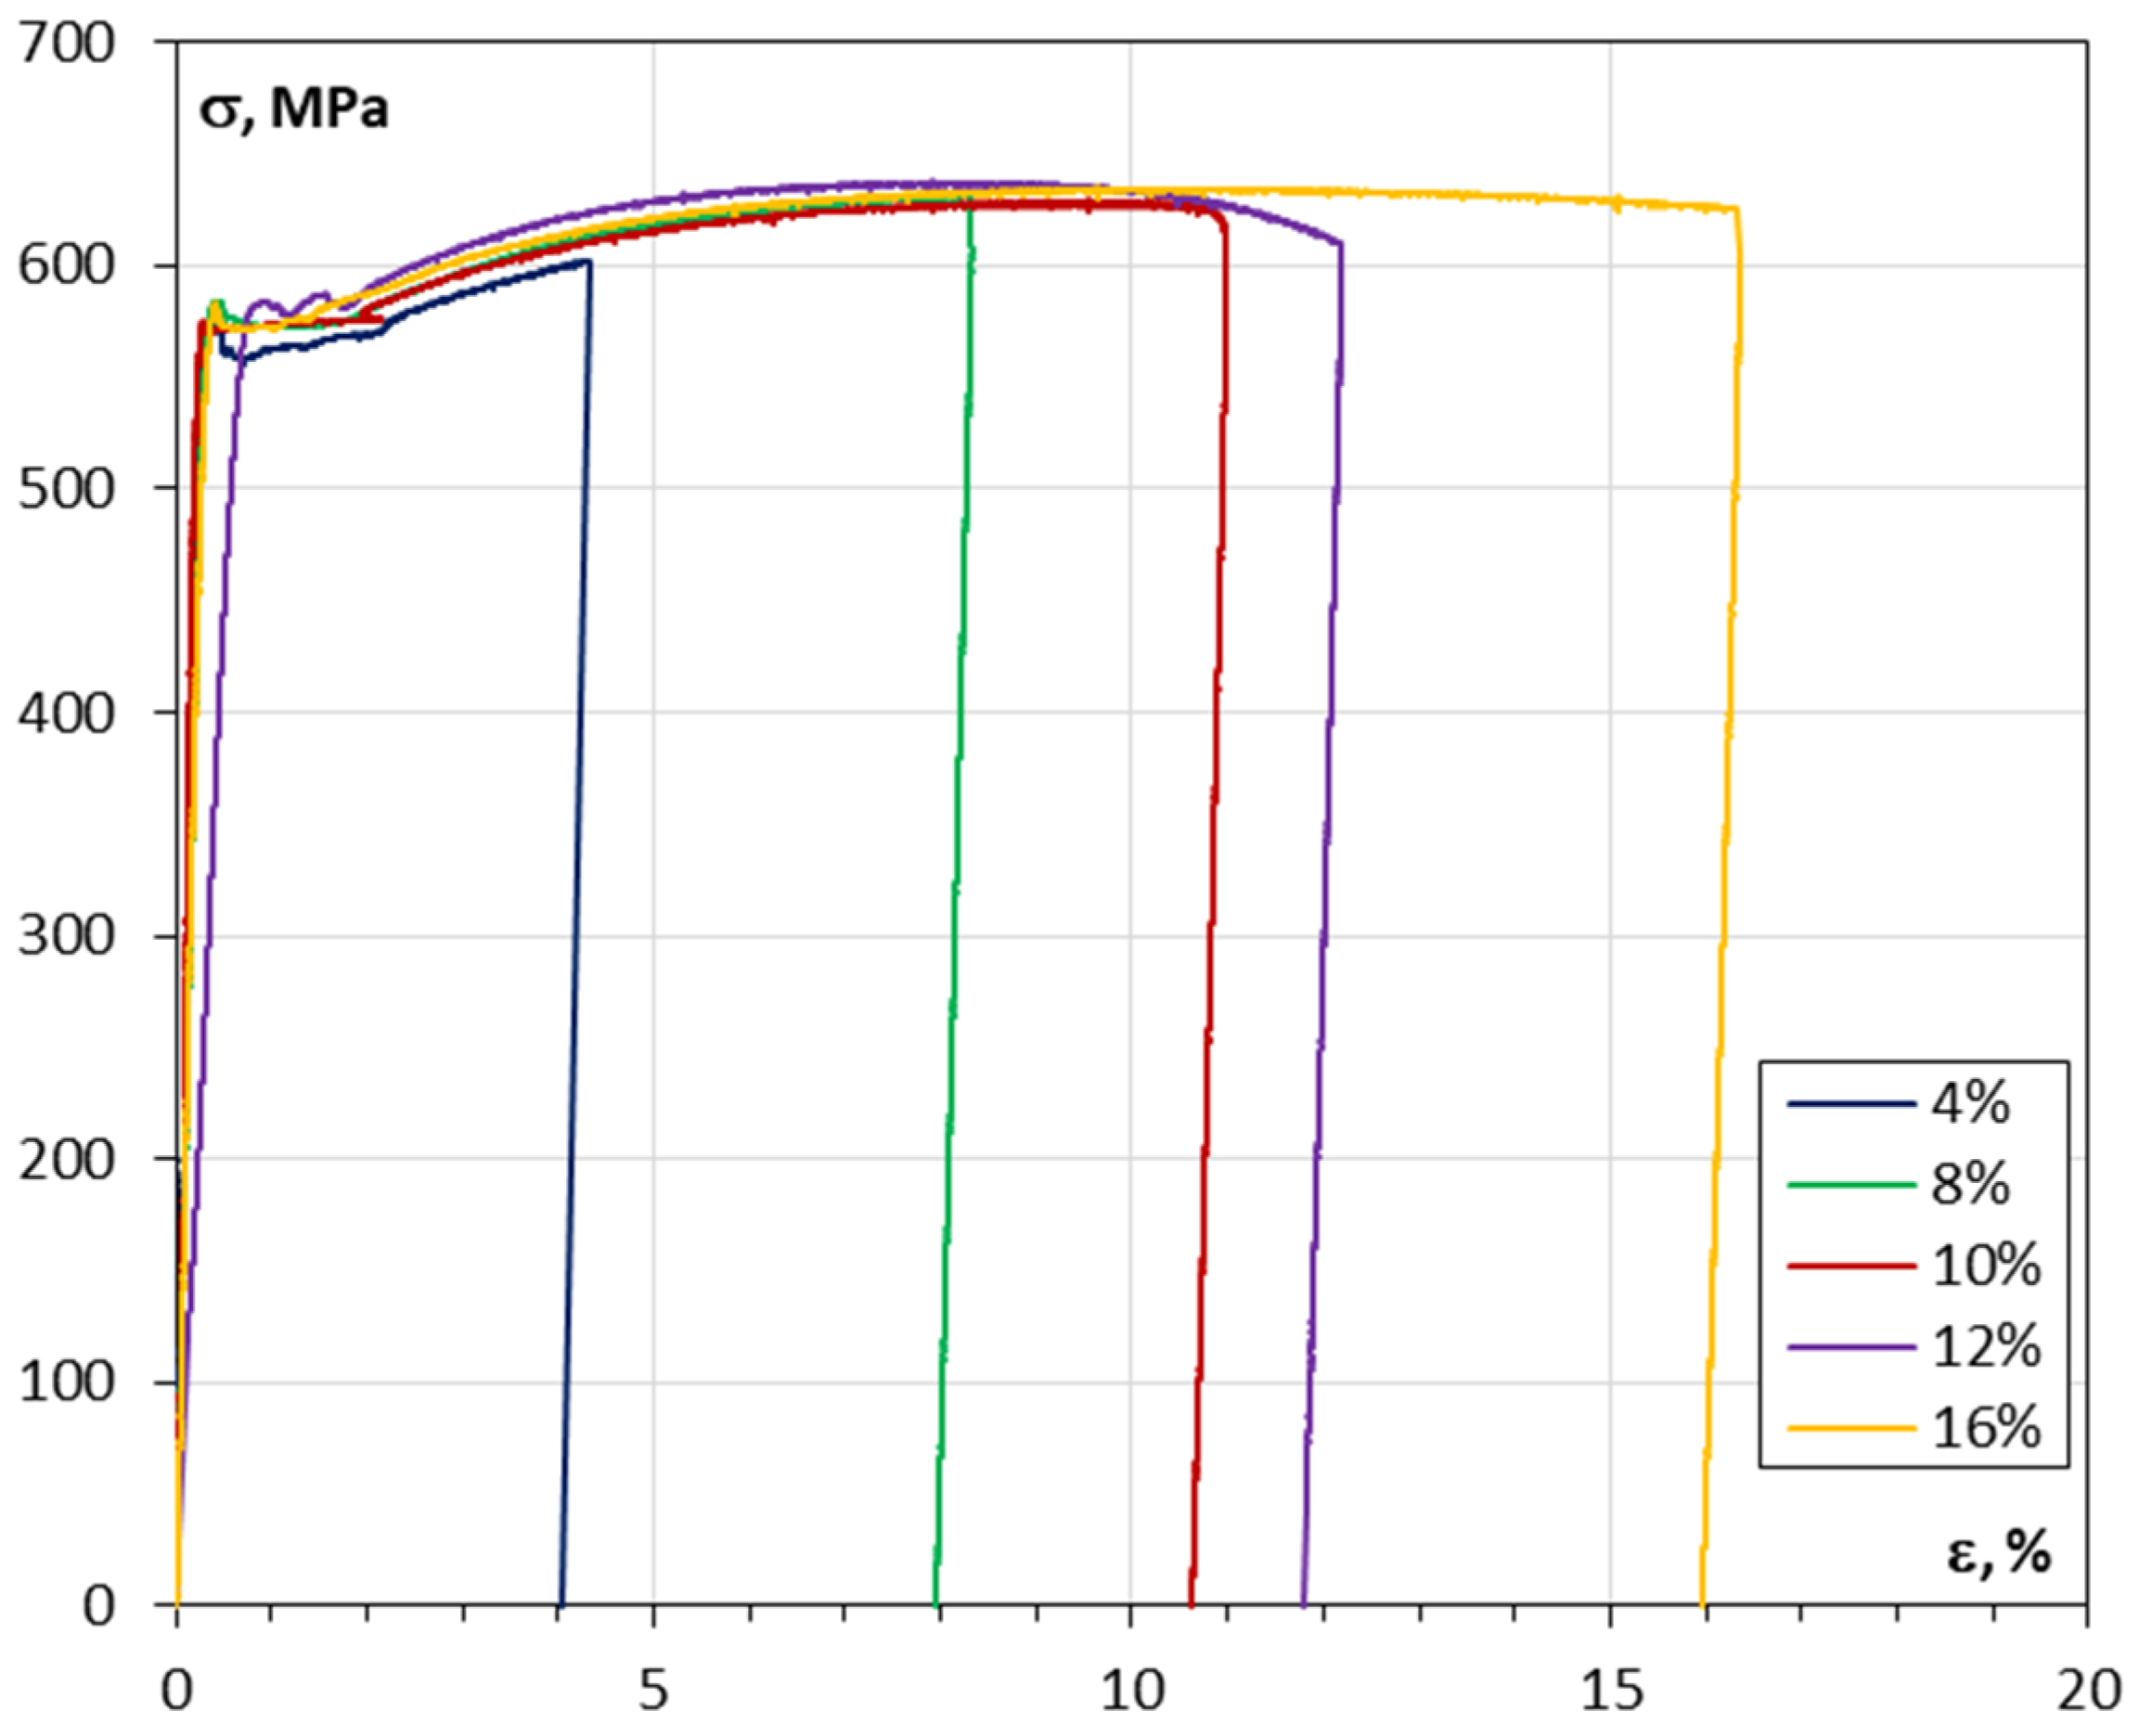
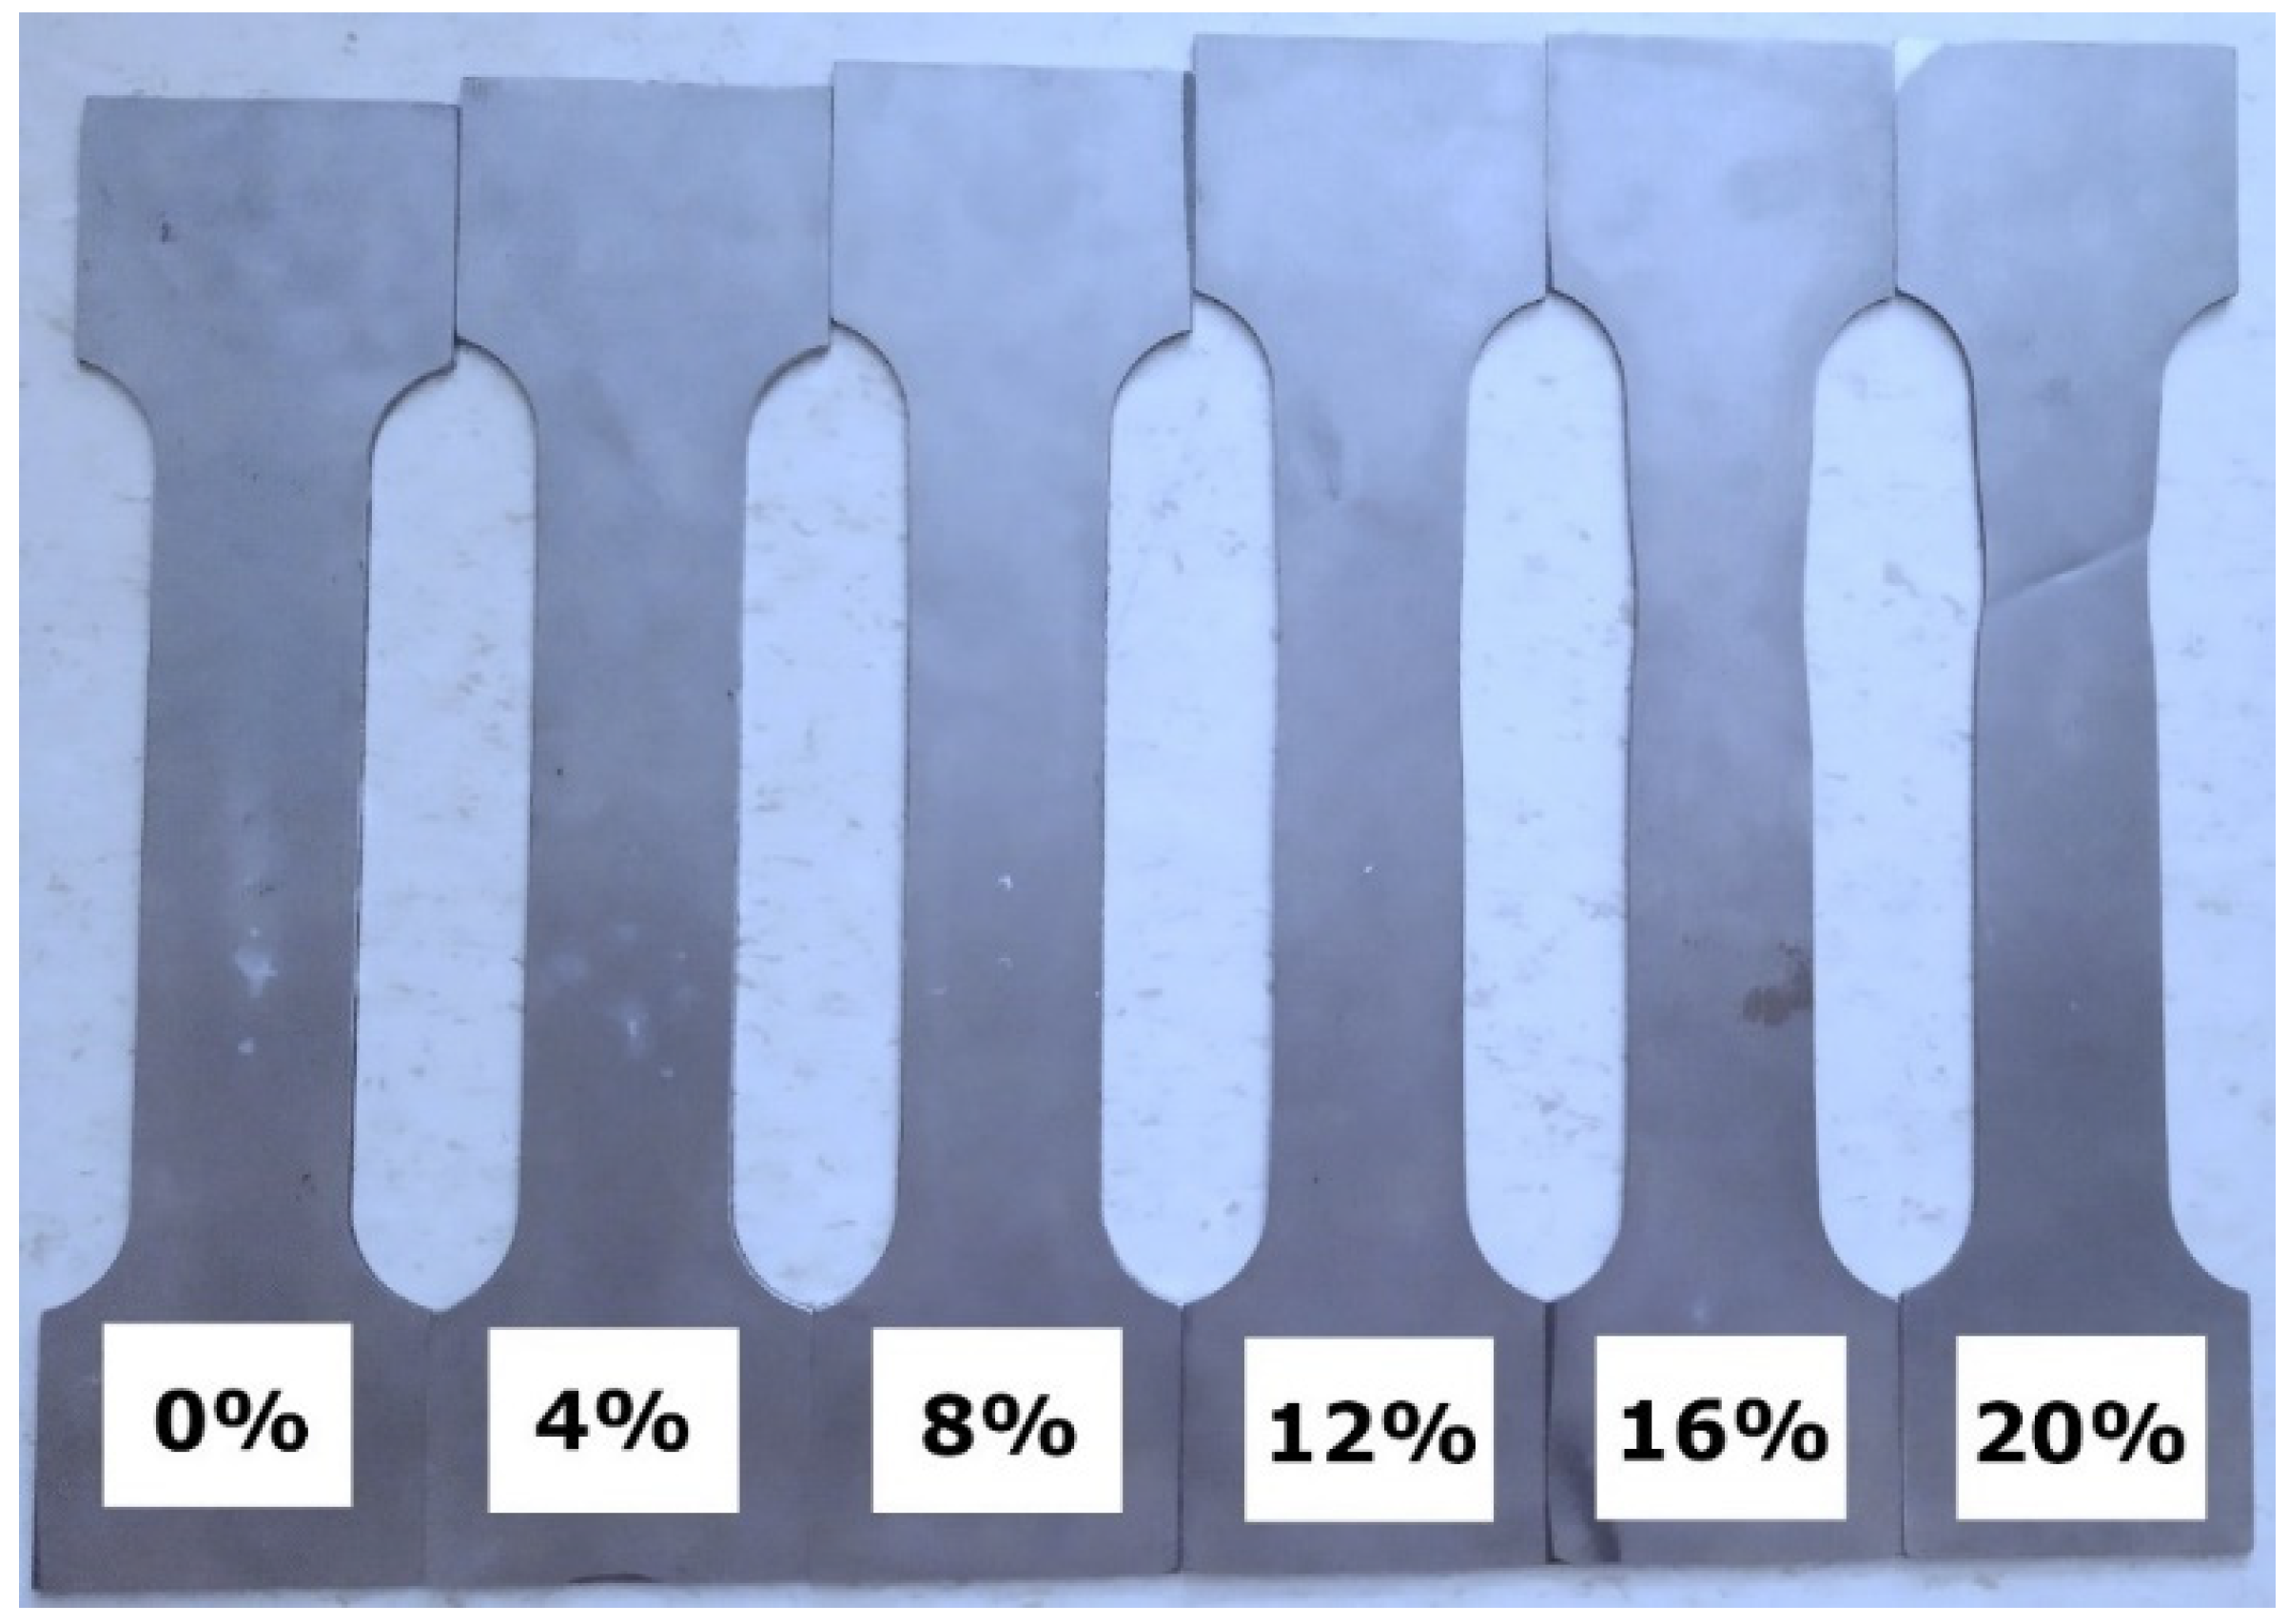
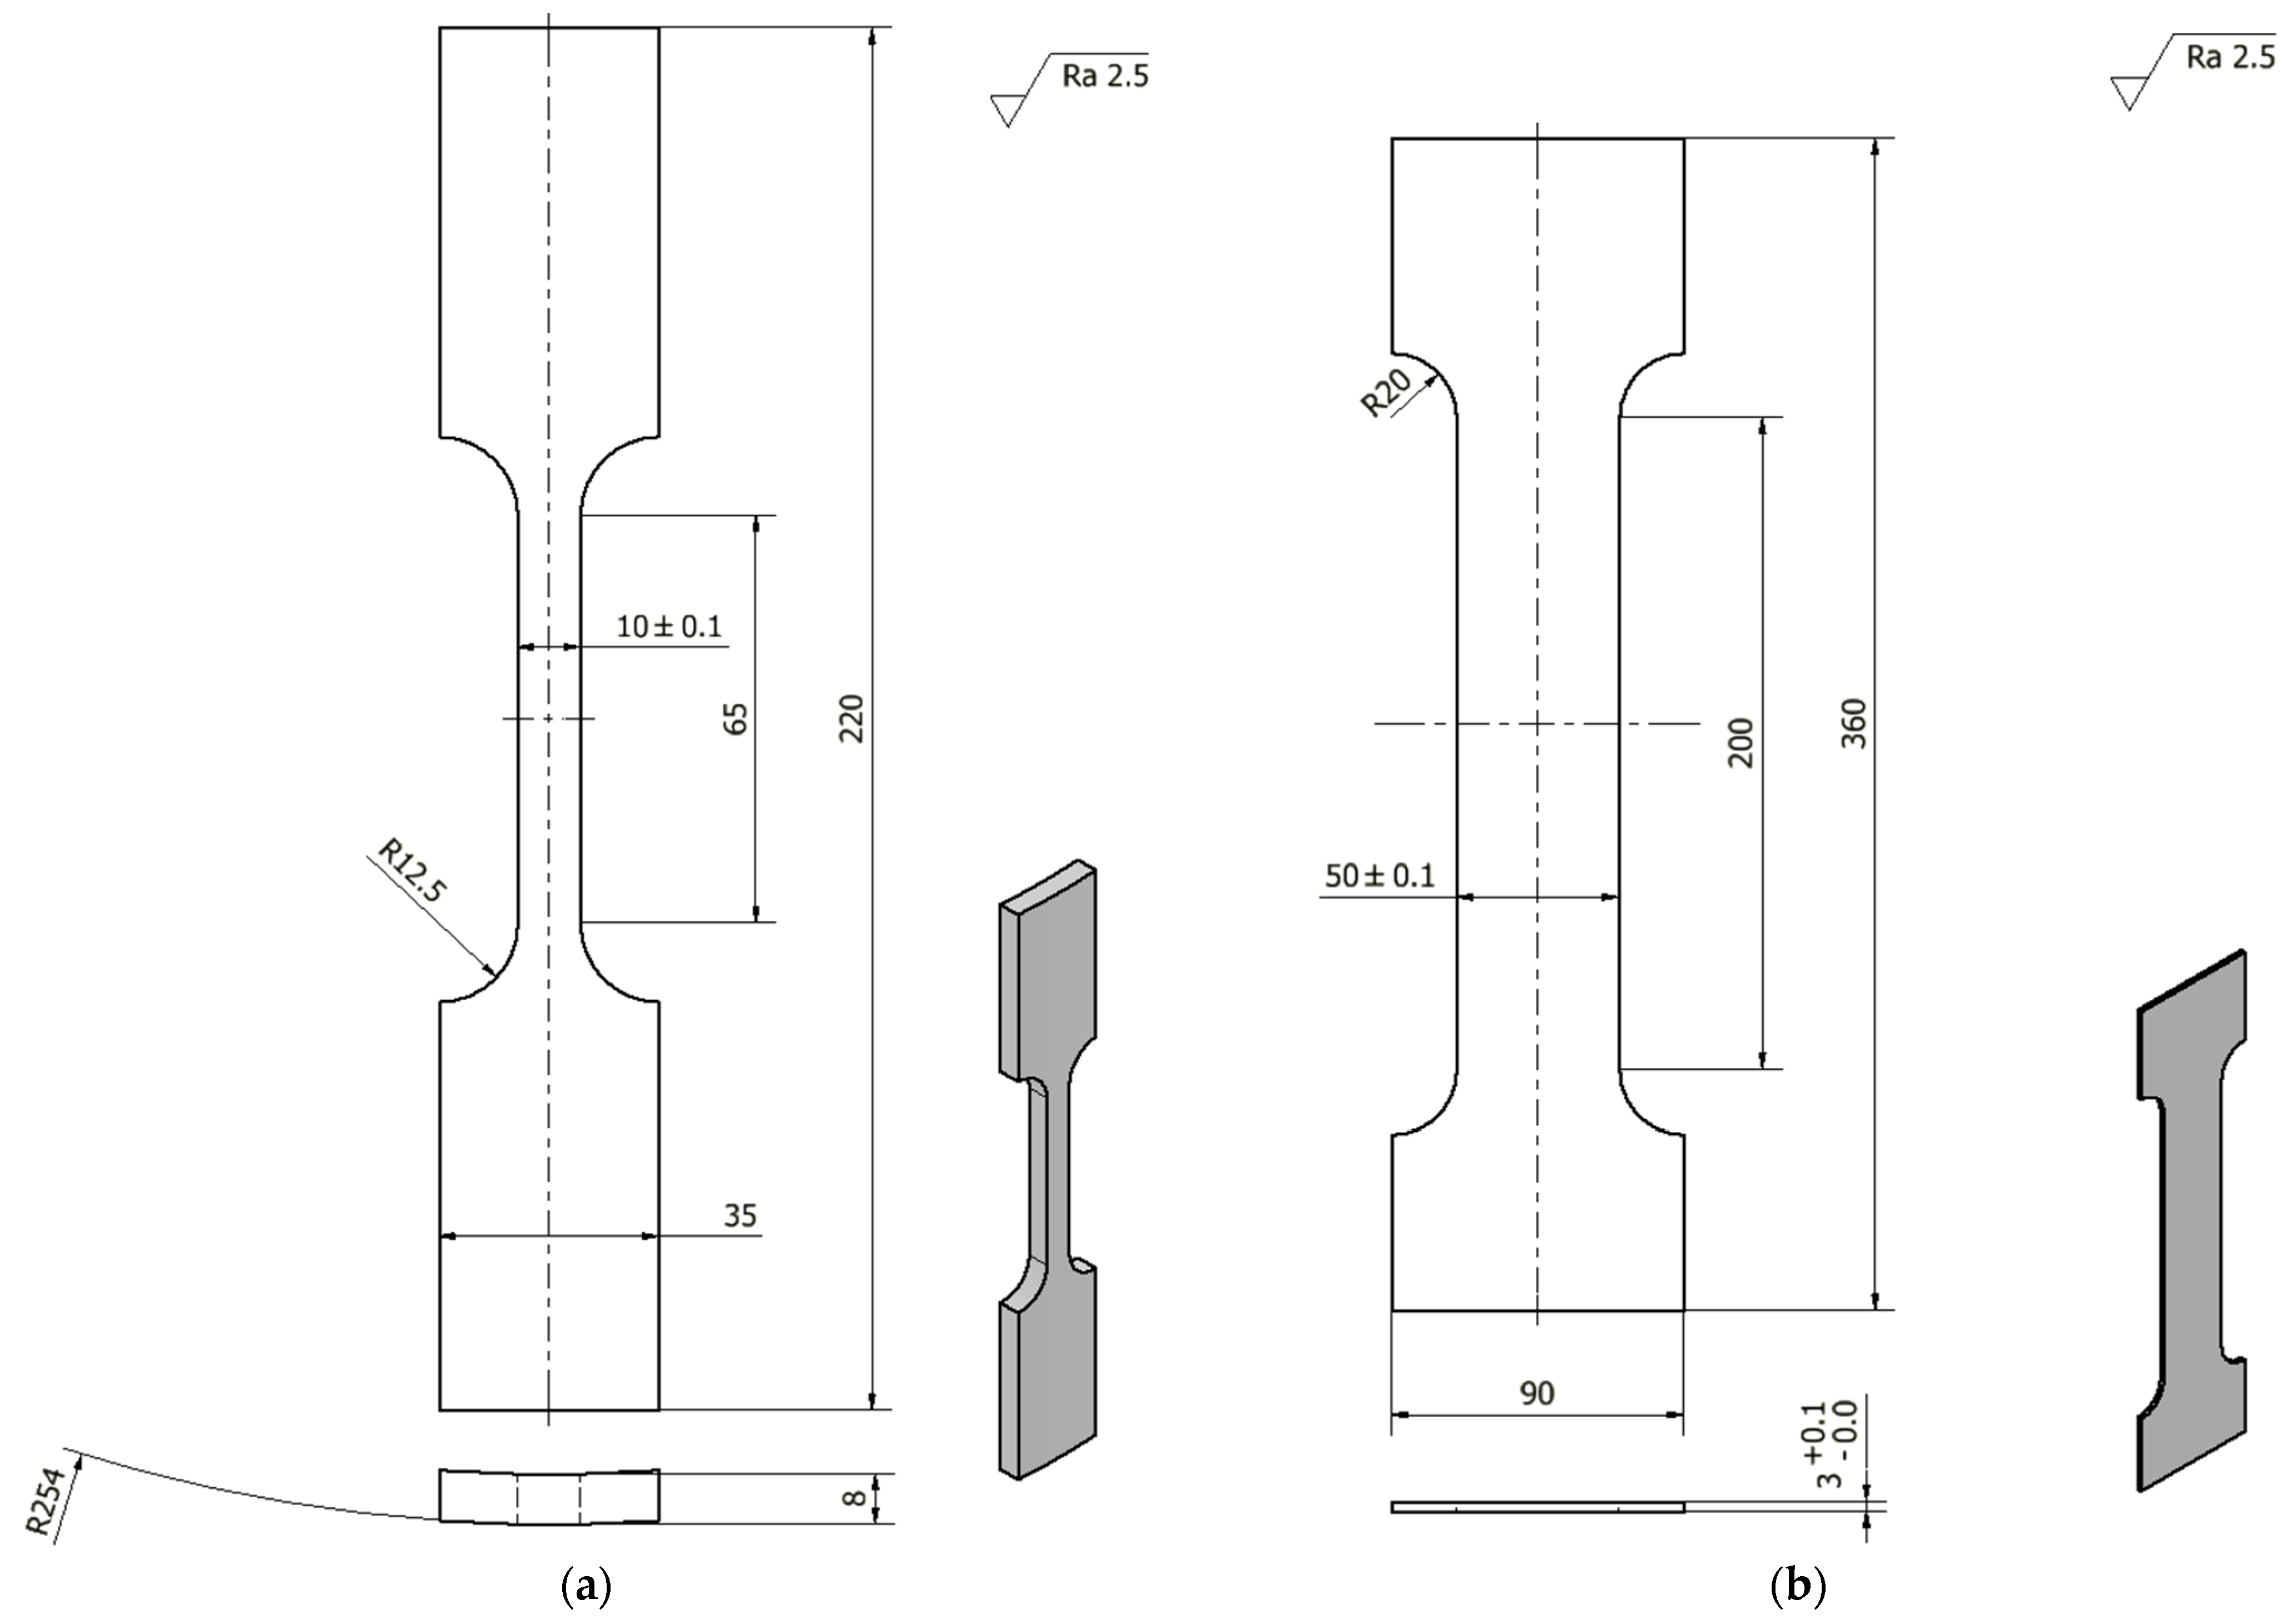
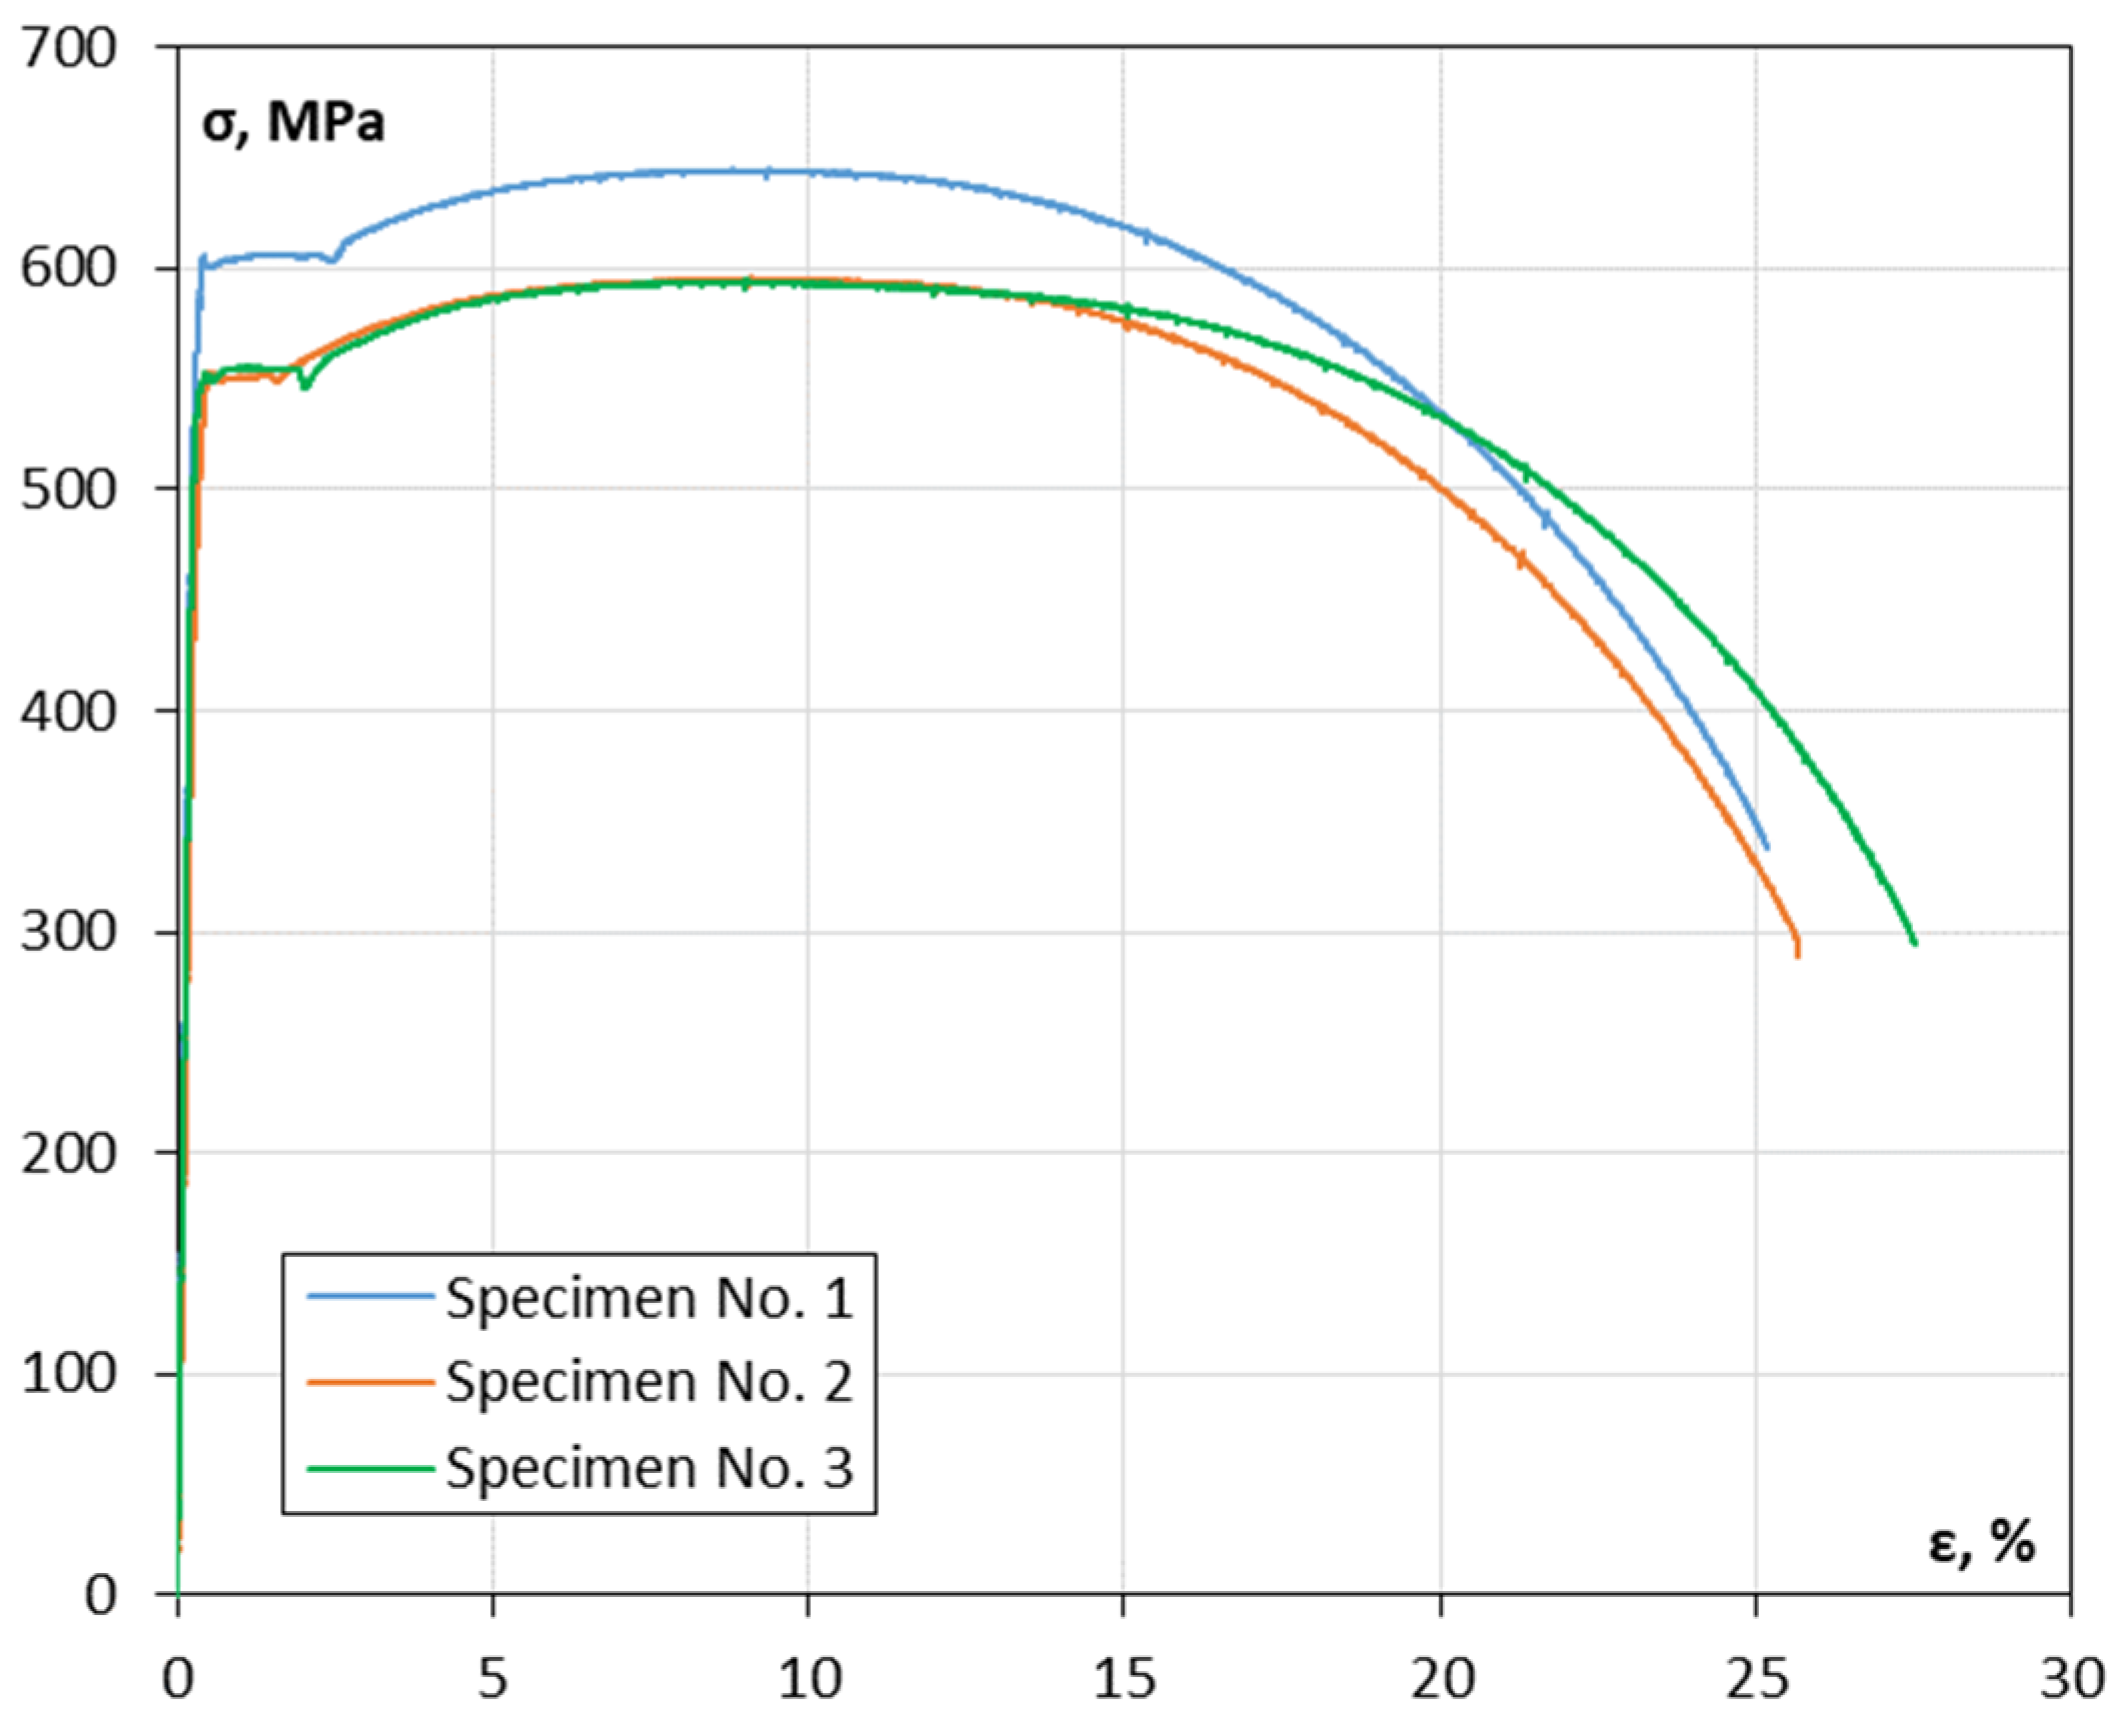
2.1. Mechanical Tests of Thermo-Mechanically Rolled Tubes

In the last few decades, L485ME steel grade, commonly used worldwide for construction of gas transmission pipelines, has been thermo-mechanically rolled according EN-ISO 3183 [15], and is equivalent to the X70M notation of API [16]. A controlled process of rolling and heat treatment of high strength plates and tapes with appropriate properties is applied as thermomechanical rolling, quenching, and tempering. The steels should be fully quenched and manufactured with a technology suitable for fine grain steel [17]. Sheets and strips used to produce line pipes for high pressure gas and oil pipelines are manufactured as longitudinally submerged arc-welded tubes (SAWL) or helically submerged arc-welded pipes (SAWH). Seamless pipes (SMLS) for oil and gas applications are produced worldwide only up to a nominal diameter of DN 600. According to [15,16], tubes are classified as normalized or normalizing rolling (N), thermomechanical-rolled (M), quenching, and tempering (Q) delivery conditions. The pipes signed (M) are manufactured as welded tubes only.
In the present study, L485ME steel grade specimens were cut out from new PSL2 pipes according to EN-ISO 3183 [15] with properties equivalent to X70M steel grade according to API Spec 5L [16]. The tensile tests were performed according to ASTM A370-23 standard [18] with the use of a servo-hydraulic testing machine INSTRON 8502 fitted with the control system 8500+. The main parameters of the testing machine are: maximum static force—300 kN, maximum dynamic force—250 kN, and piston stroke—±75 mm. One of three specimens presented in Figure 1a was fixed in the testing machine and subjected to a monotonically increasing tensile load until its complete rupture. During the test, the load on the specimen and the displacement of the testing machine actuator piston as well as the strain of the specimen, measured using the INSTRON 2630-113 extensometer with a measurement base of 50 mm and a measurement range of −5 mm to +50 mm, were recorded. The test was carried out with displacement control at a speed of 0.05 mm/s. The specimens before and after static tensile test at room temperature according to PN-EN-ISO 6892-1 [19] are shown in Figure 2a and Figure 2b, respectively.
The graphs obtained during the static tensile tests of three specimens in order to evaluate the material properties are shown in Figure 3, and the experimental results are presented in Table 1.
The geometry of six specimens cut out from L485ME steel grade for the thermophysical experiments are shown in Figure 1b. The specimens were successively clamped in the jaws of the INSTRON 8502 testing machine and subjected to a monotonically increasing tensile load until the deformation was reached with a value that allowed obtaining the assumed value of plastic deformation after unloading. The loading and unloading diagrams of individual specimens obtained as a result of the tests are shown in Figure 4. The plastic deformation, as well as dimensions of the cross-section of individual specimens, are shown in Table 2.
The specimens after the tensile experiments for different levels of plastic strain εpl are shown in Figure 5. The occurrence of specimen necking during the tensile tests limits the maximum values of plastic strain εpl ≤ 16% for a reliable, in terms of accuracy, specific heat capacity evaluation.

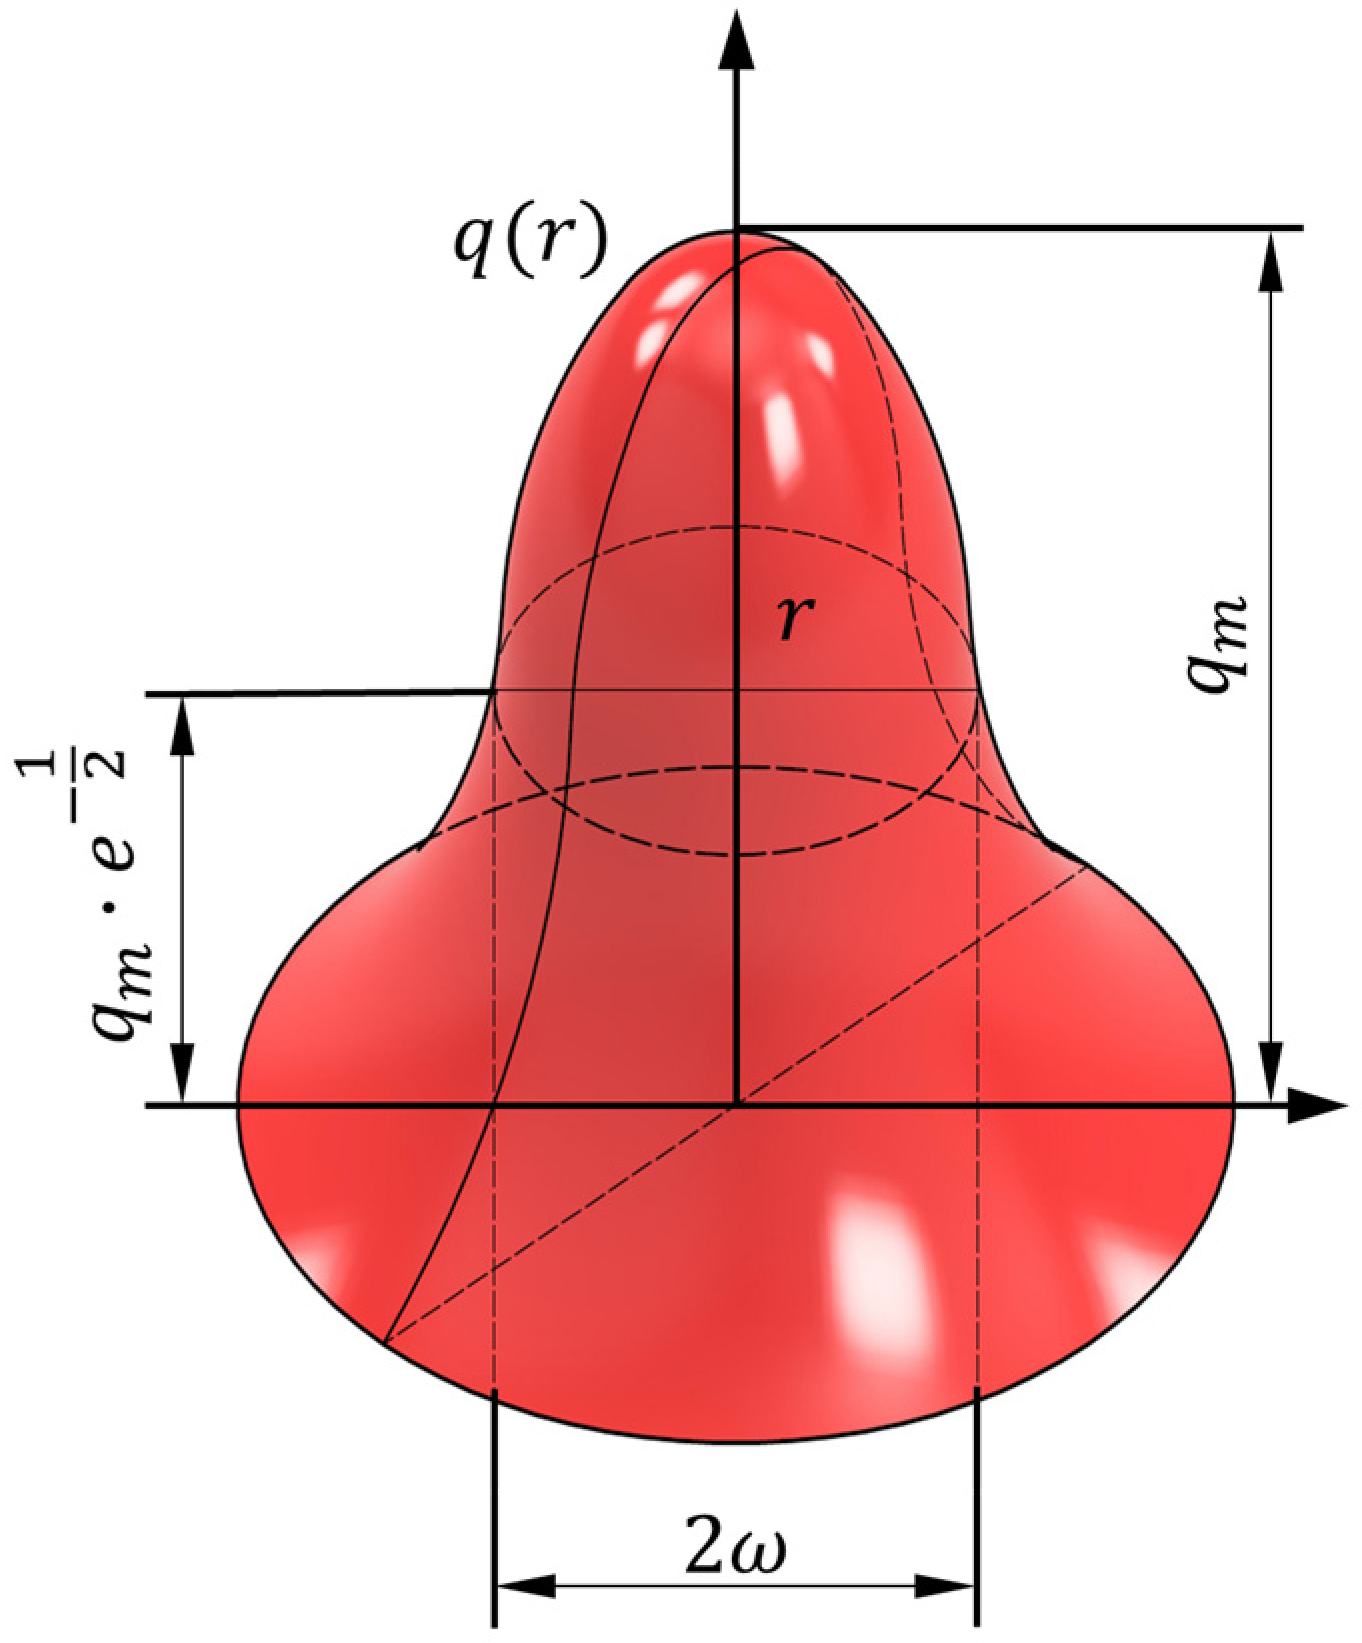
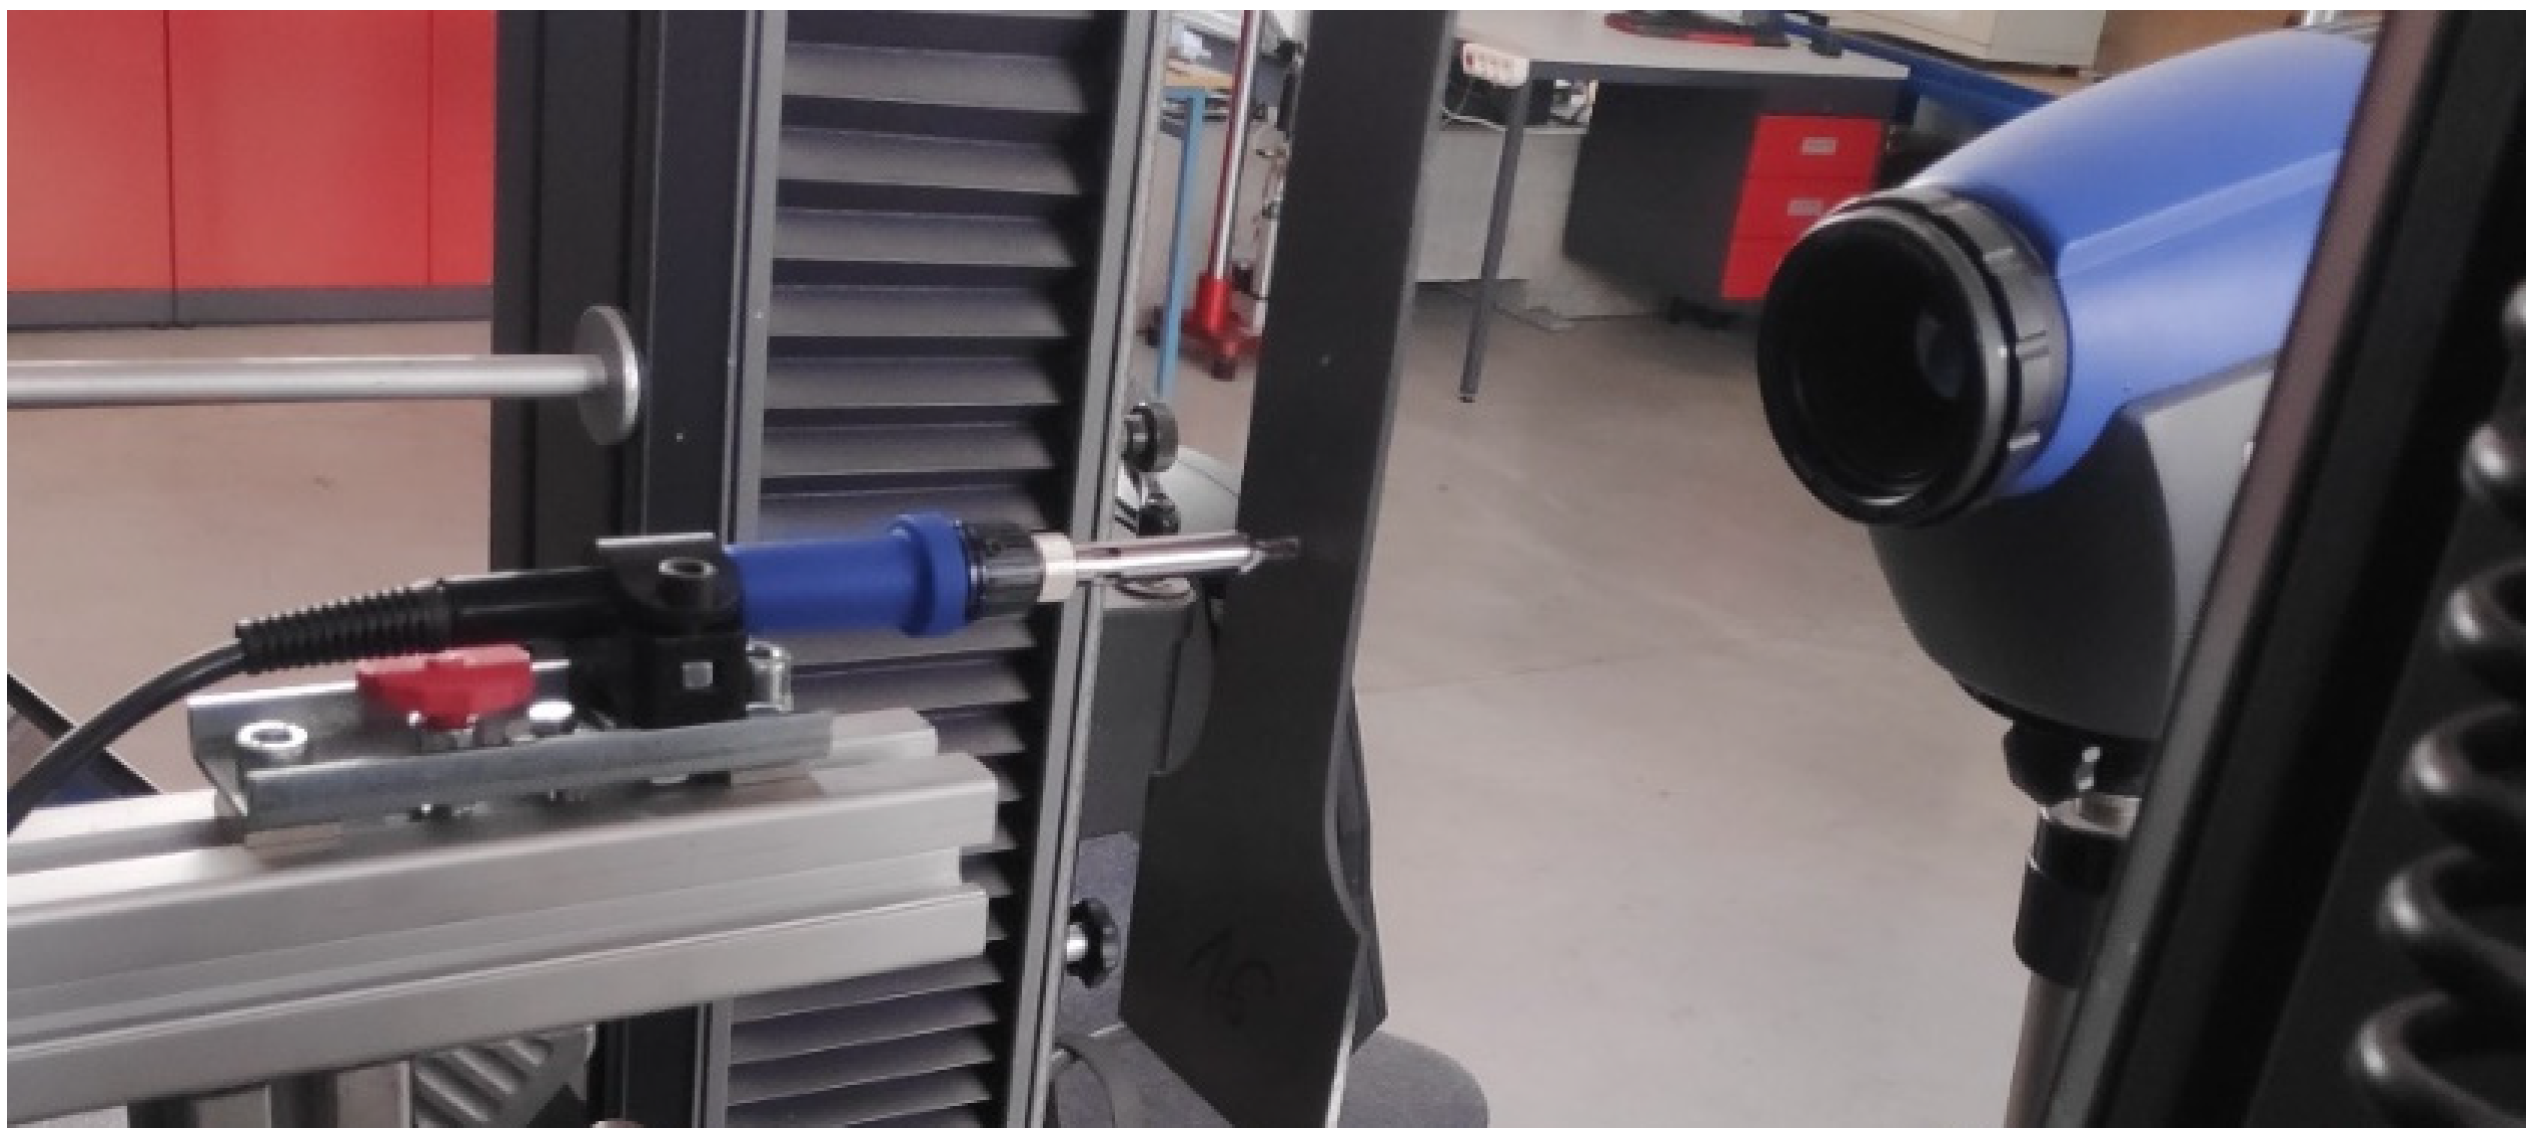
2.2. Heat Source Description

According to [20,21], the Gaussian distribution of the heat source shown in Figure 6 was adopted as the heat source model, described by the following equation:
q r = q m ω 2 · e x p r 2 ω 2 ,
where:
q(r)
is the heat flux capacity at radius r, W;
qm 
is the maximum value of heat flux capacity at the center of the heat source, W;
ω 
is the concentration coefficient, the distance at which the heat flux capacity decreases by factor e−1/2, m.
Figure 6. The Gaussian distribution heat source.
Energies 17 01554 g006
According to [2,20], the maximum value of the temperature field recorded on the side opposite to the heat source, on the surface of an isotropic and homogeneous rectangular specimen of constant thickness, is described by the following equation:
T t = q 4 λ l l n 4 α ω 2 t + 1 + 2 n = 1 + 1 n · e x p π 2 n 2 ω 2 4 l 2 · Γ 0 , π 2 n 2 ω 2 4 l 2 Γ 0 , π 2 n 2 4 α t + ω 2 4 l 2 ,
where:
t 
is the time, s;
α 
is the thermal diffusivity coefficient, m2/s:
α = λ c p ρ ,
λ 
is the thermal conductivity coefficient of the material, W/(m·K);
l 
is the specimen thickness, m;
cp 
is the specific heat capacity, J/(kg·K);
ρ 
is the density of steel, kg/m3.
In Equation (1), the upper incomplete gamma function in the following the form was used:
Γ 0 , x = x + t 1 e t d t .
The presented model was used for a comparison with the data obtained with a thermographic camera to determine the unknown parameters. First, the identification of the heat source parameters was carried out on the basis of material with known parameters. Then, the identified heat source parameters were used to determine the heat capacity of the plastically deformed samples.
In order to determine the unknown parameters of the heat source (q and ω), an optimization task was defined adopting, as the optimization criterion, the minimum of the sum of the square of the differences in the results describing the temperature change T(t)cal determined according to relation (2) and recorded with the use of a thermographic camera T(t)exp for n measurement points:
min i = 1 n T t c a l ,   i T t e x p , i 2 .
The Generalized Reduced Gradient Solver was used to find the minimum of function (5) in two-dimensional optimization problem.

3. Results

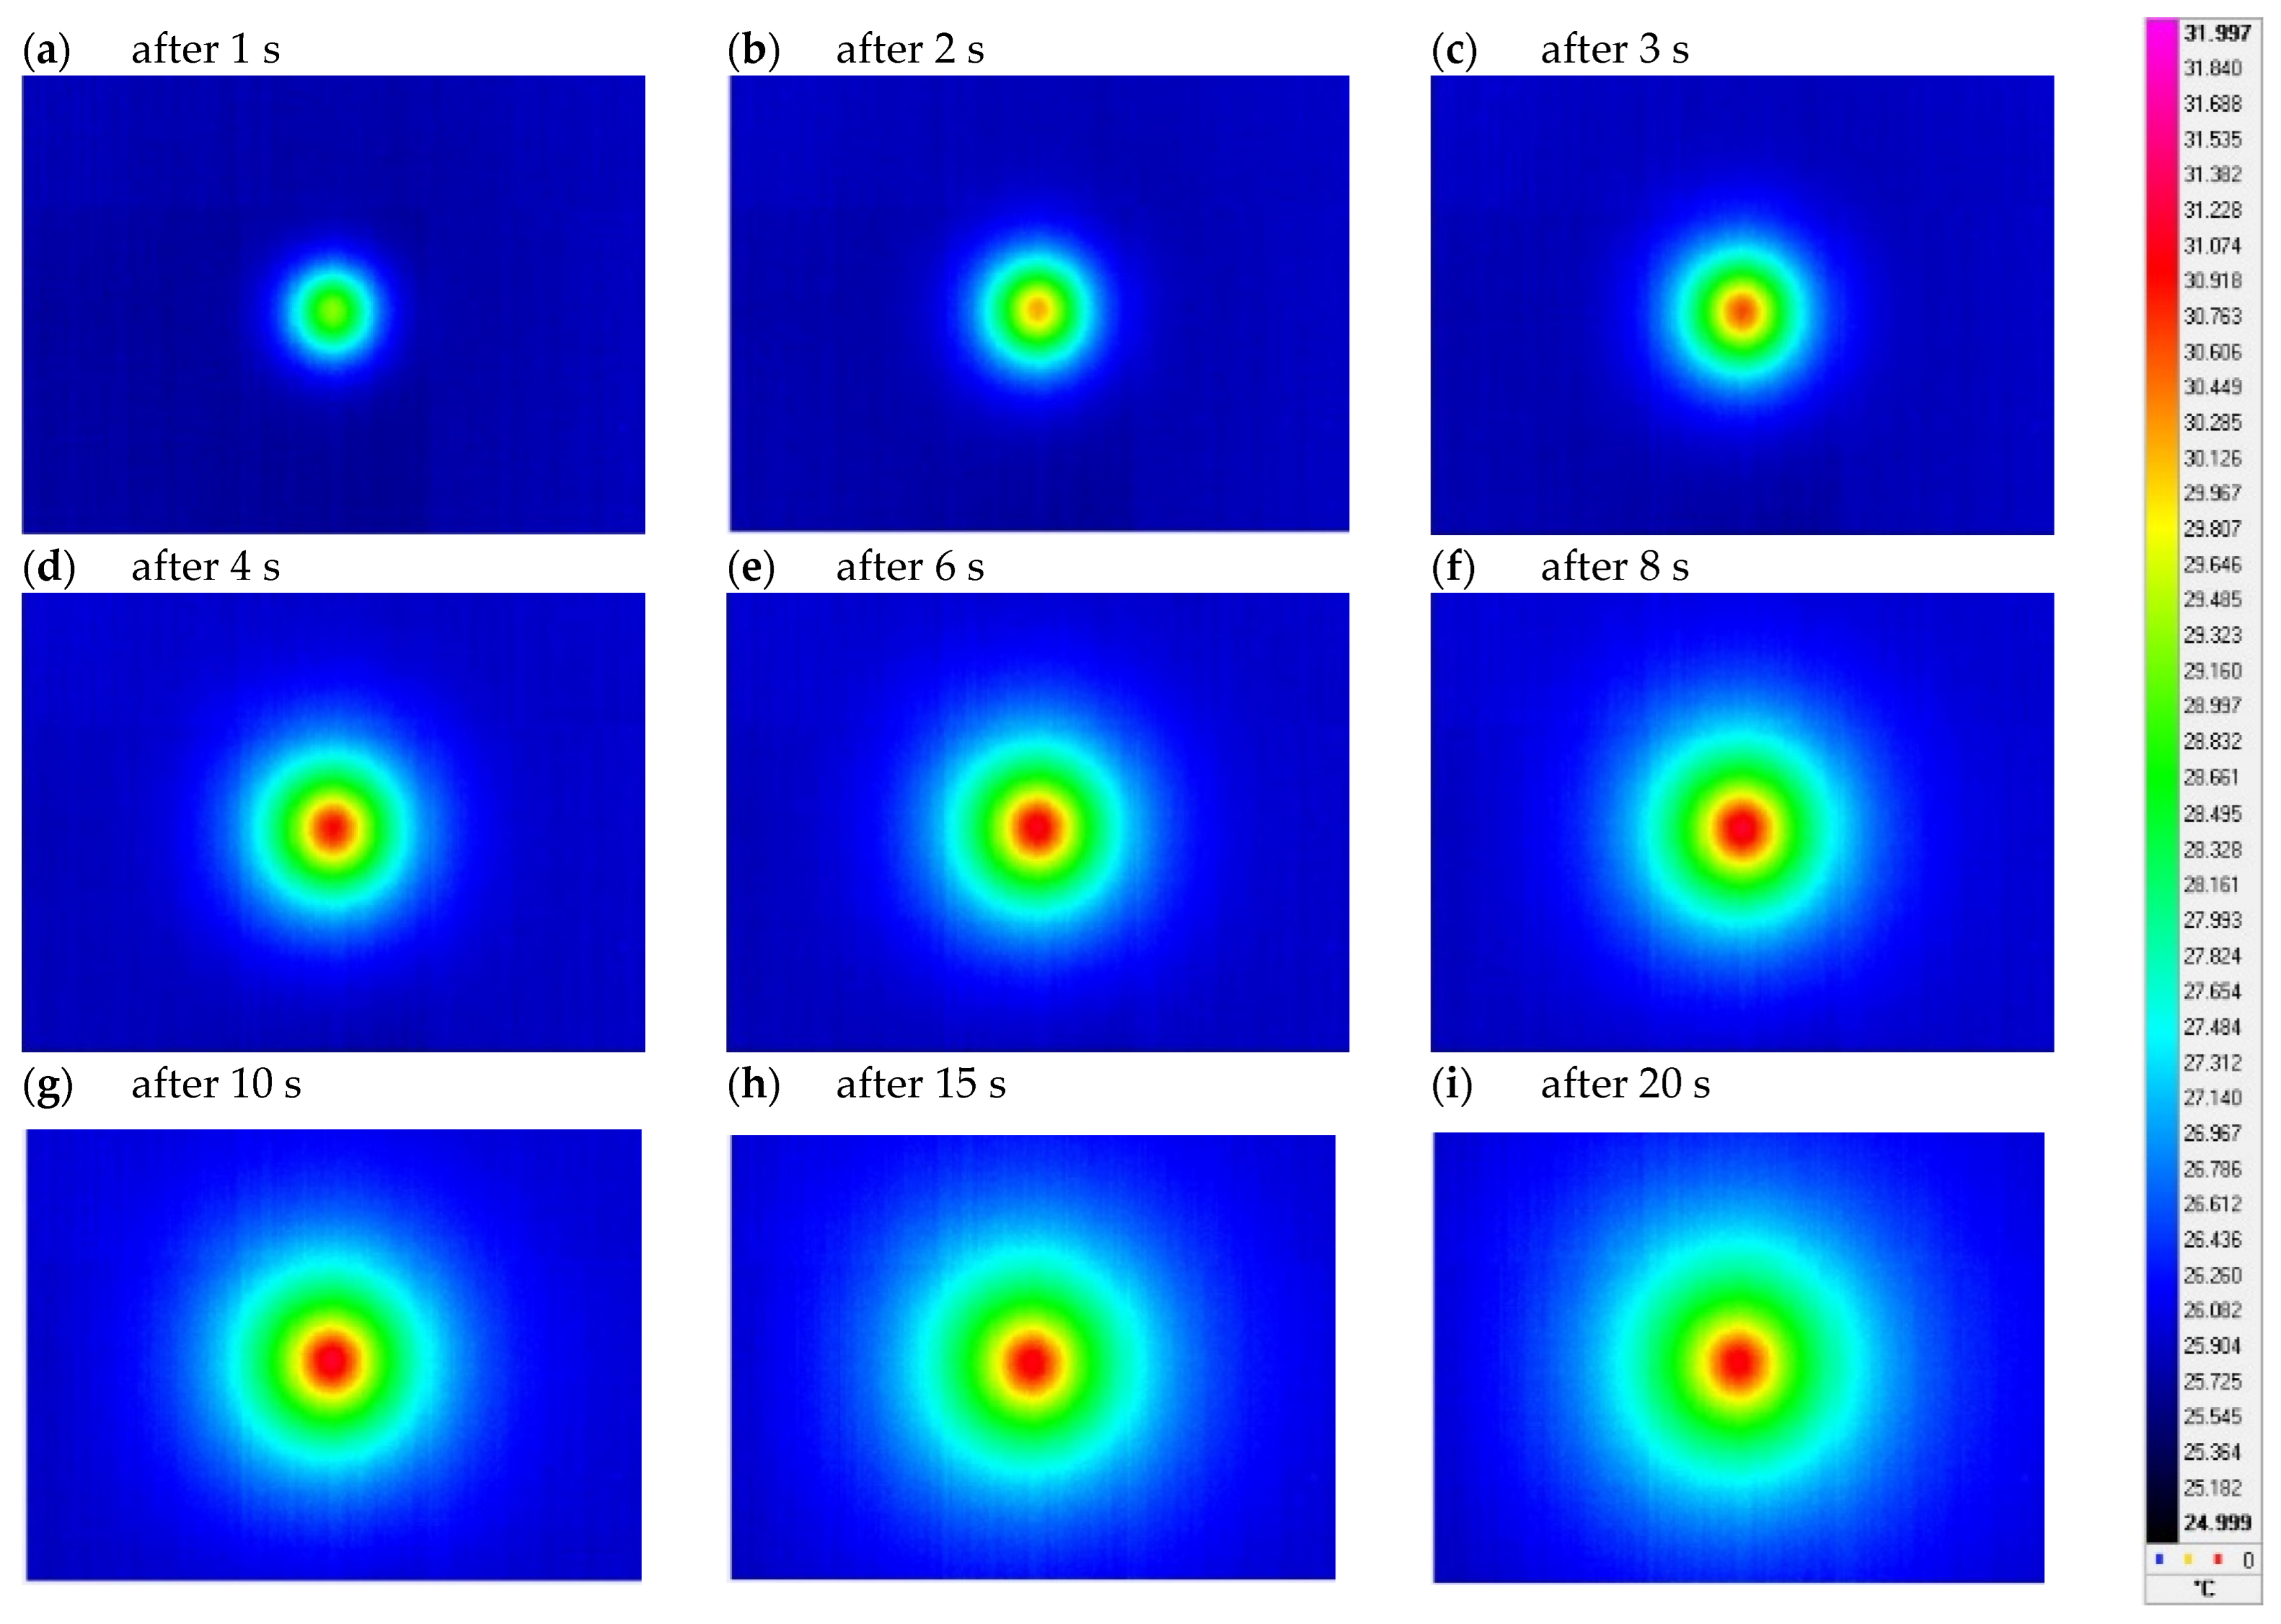
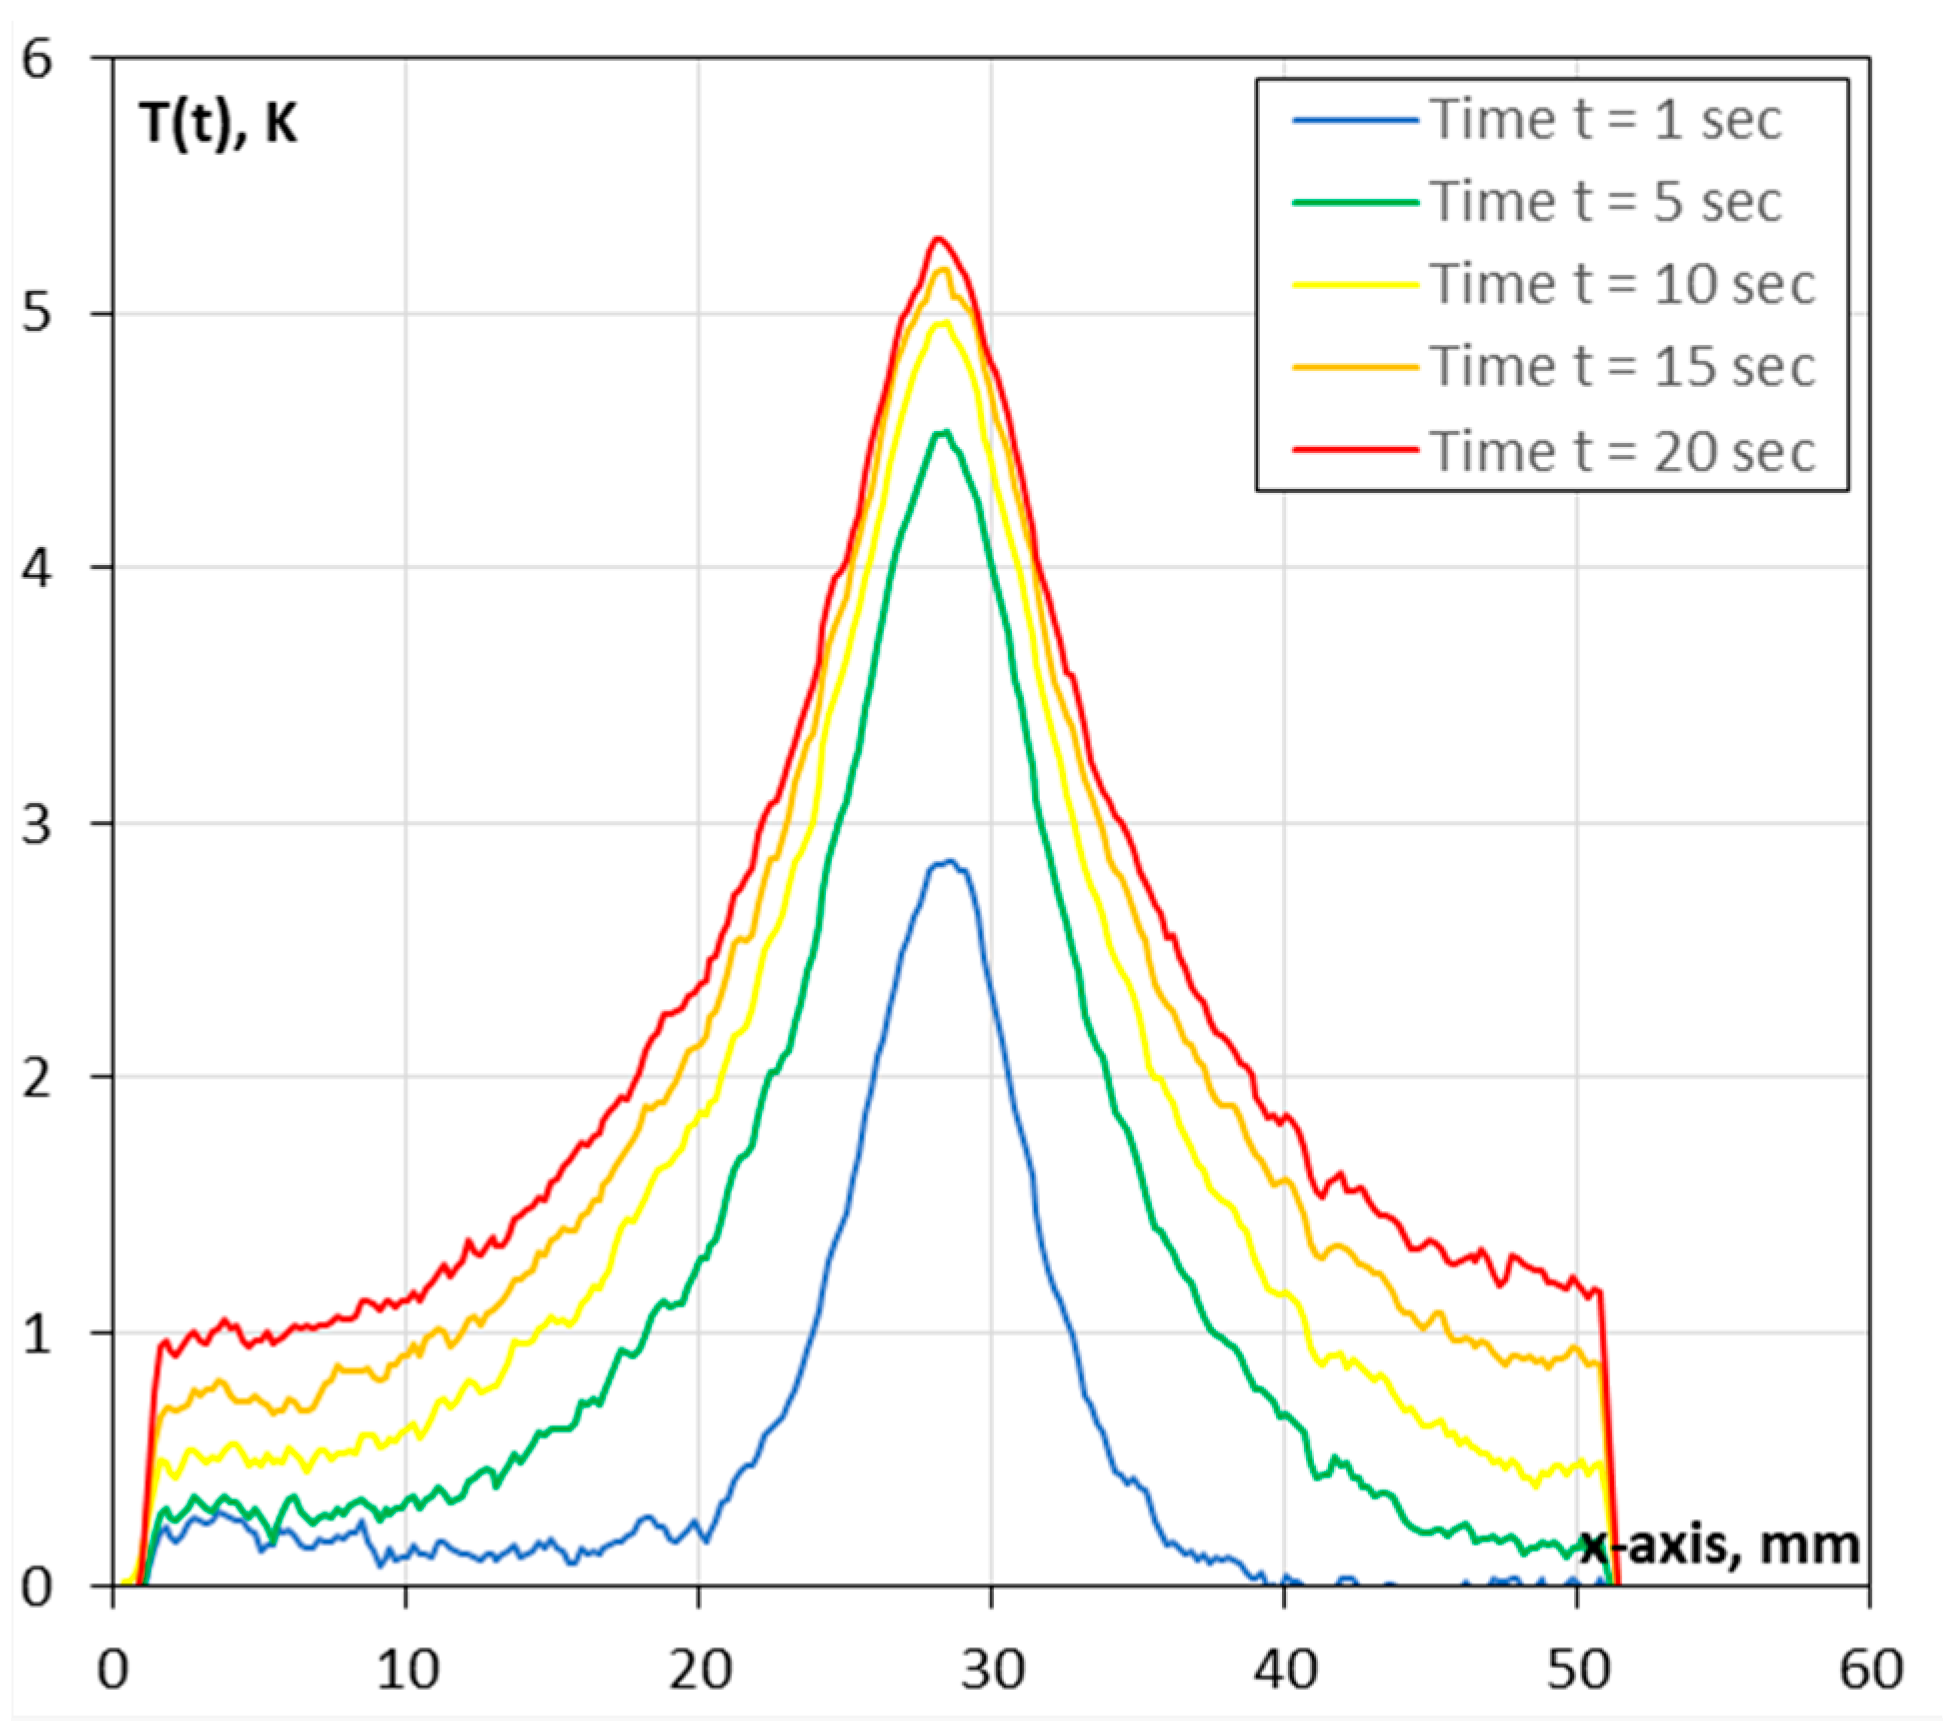
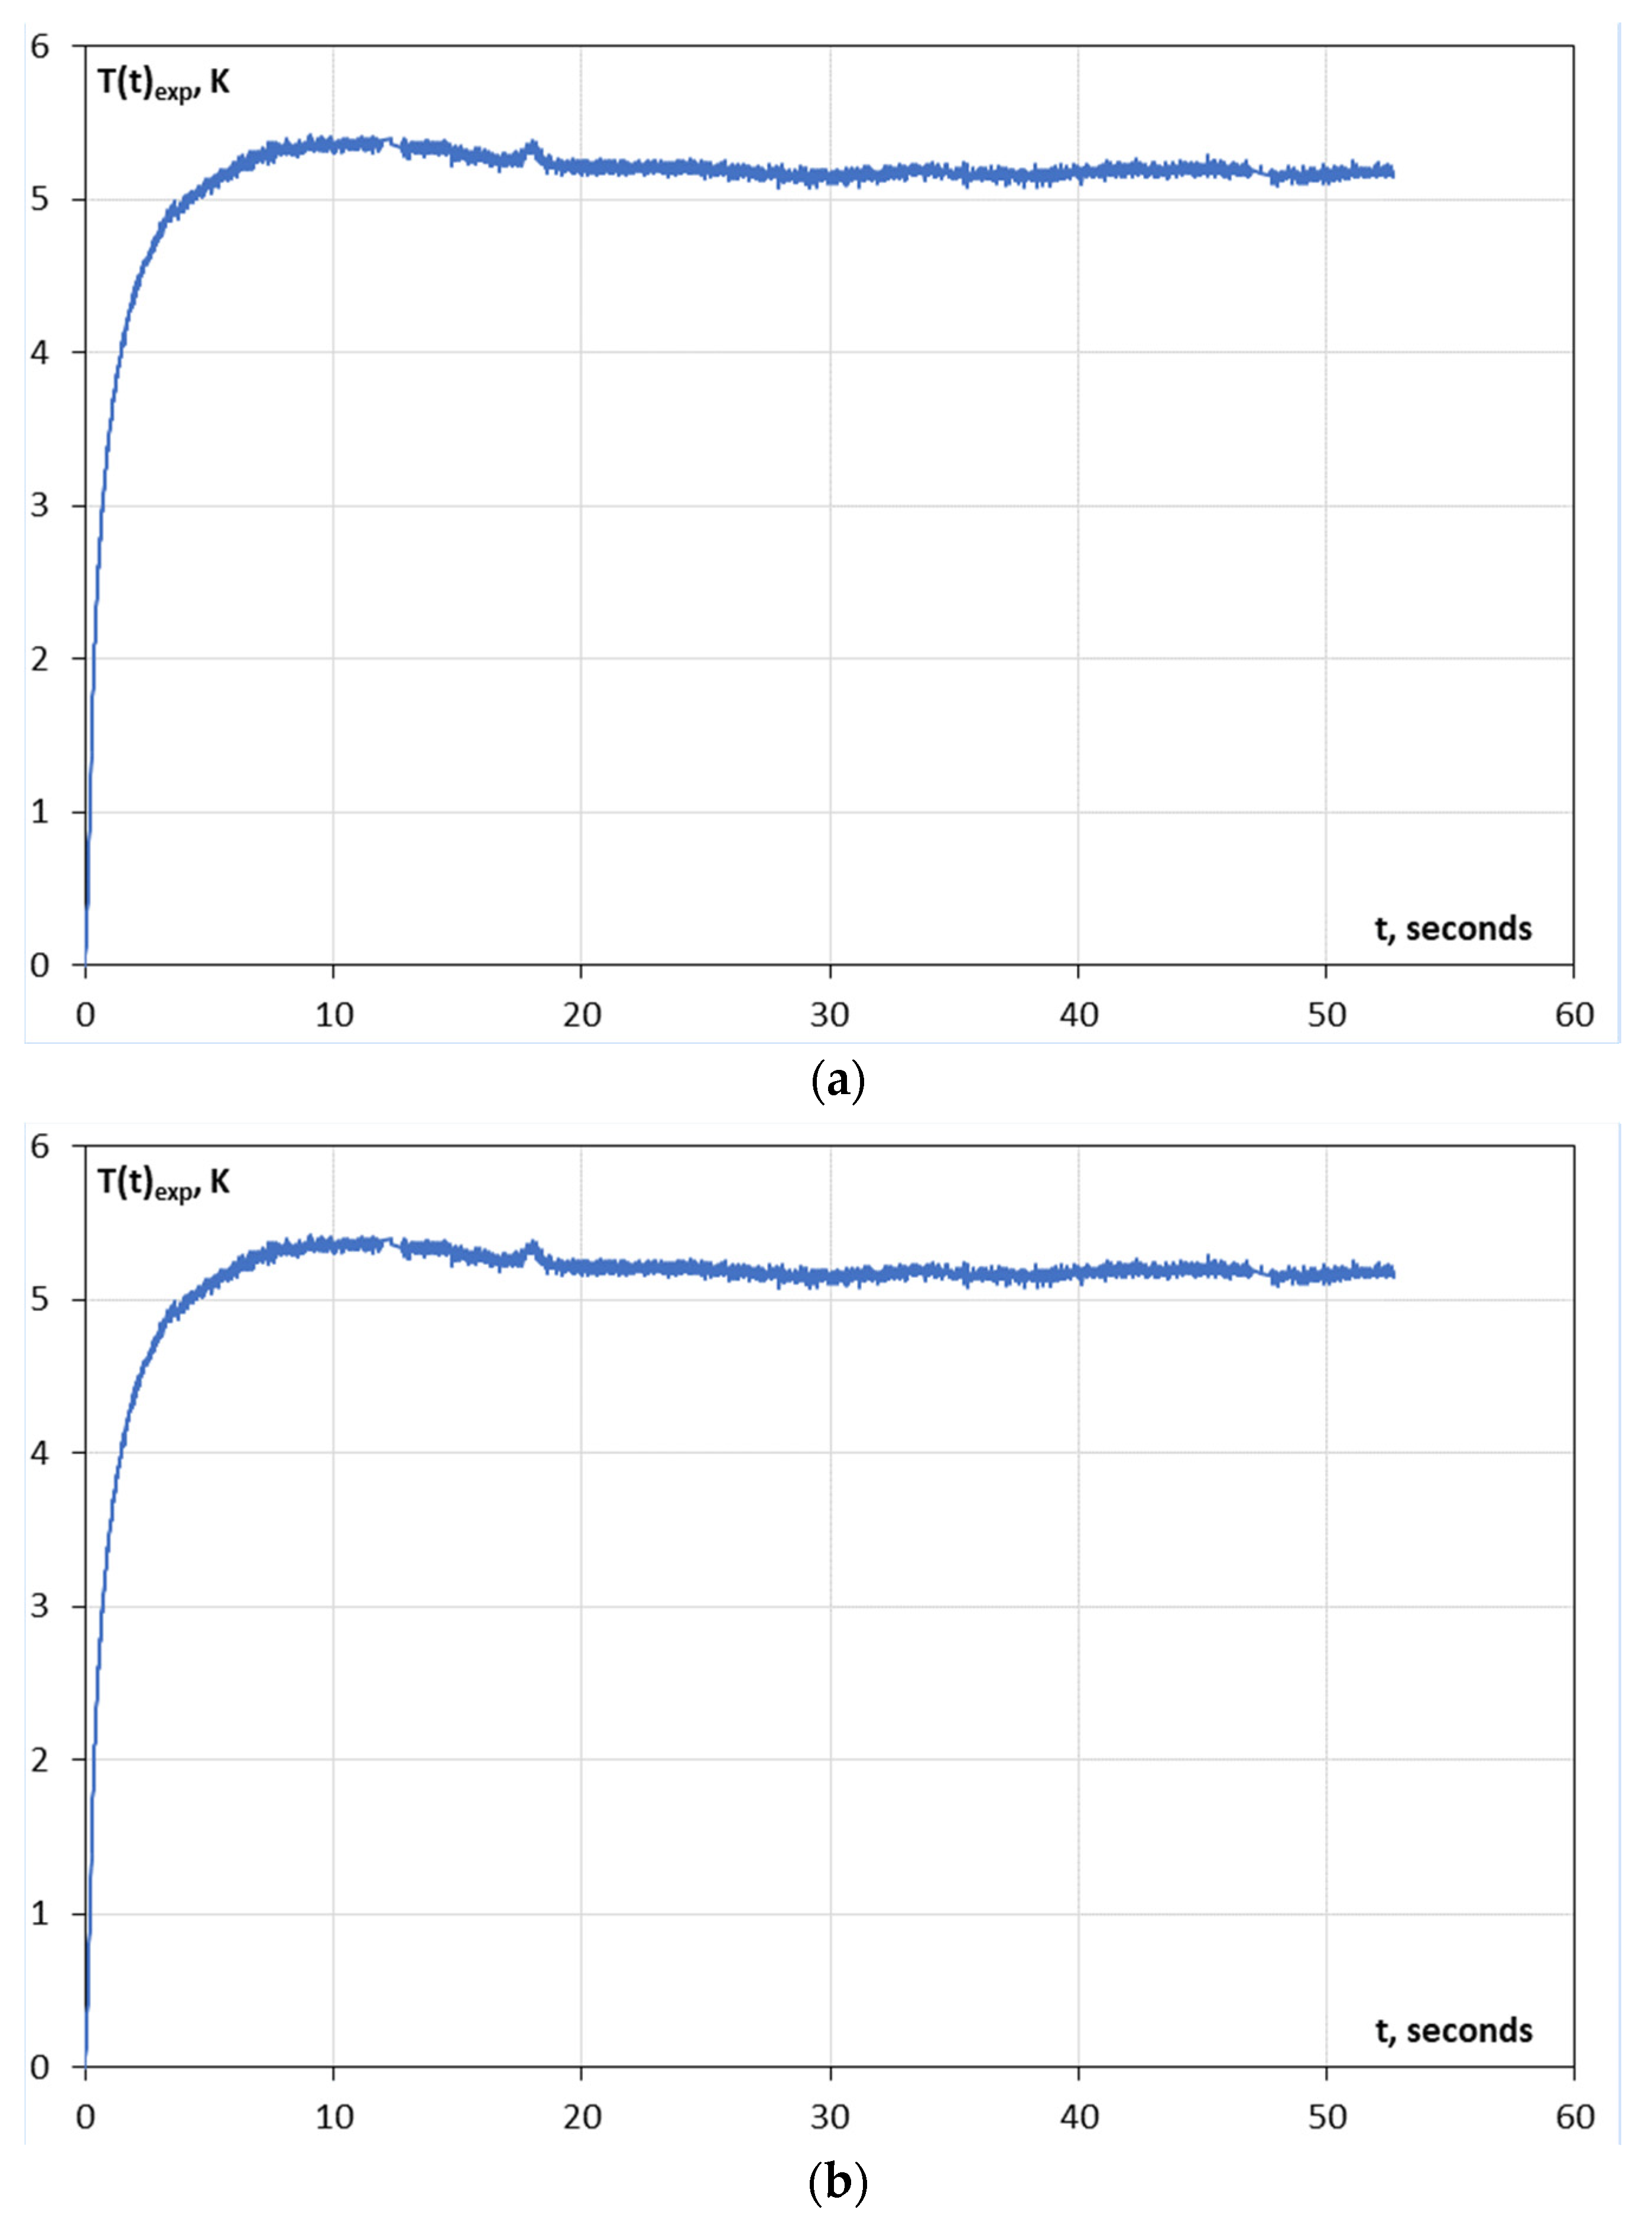
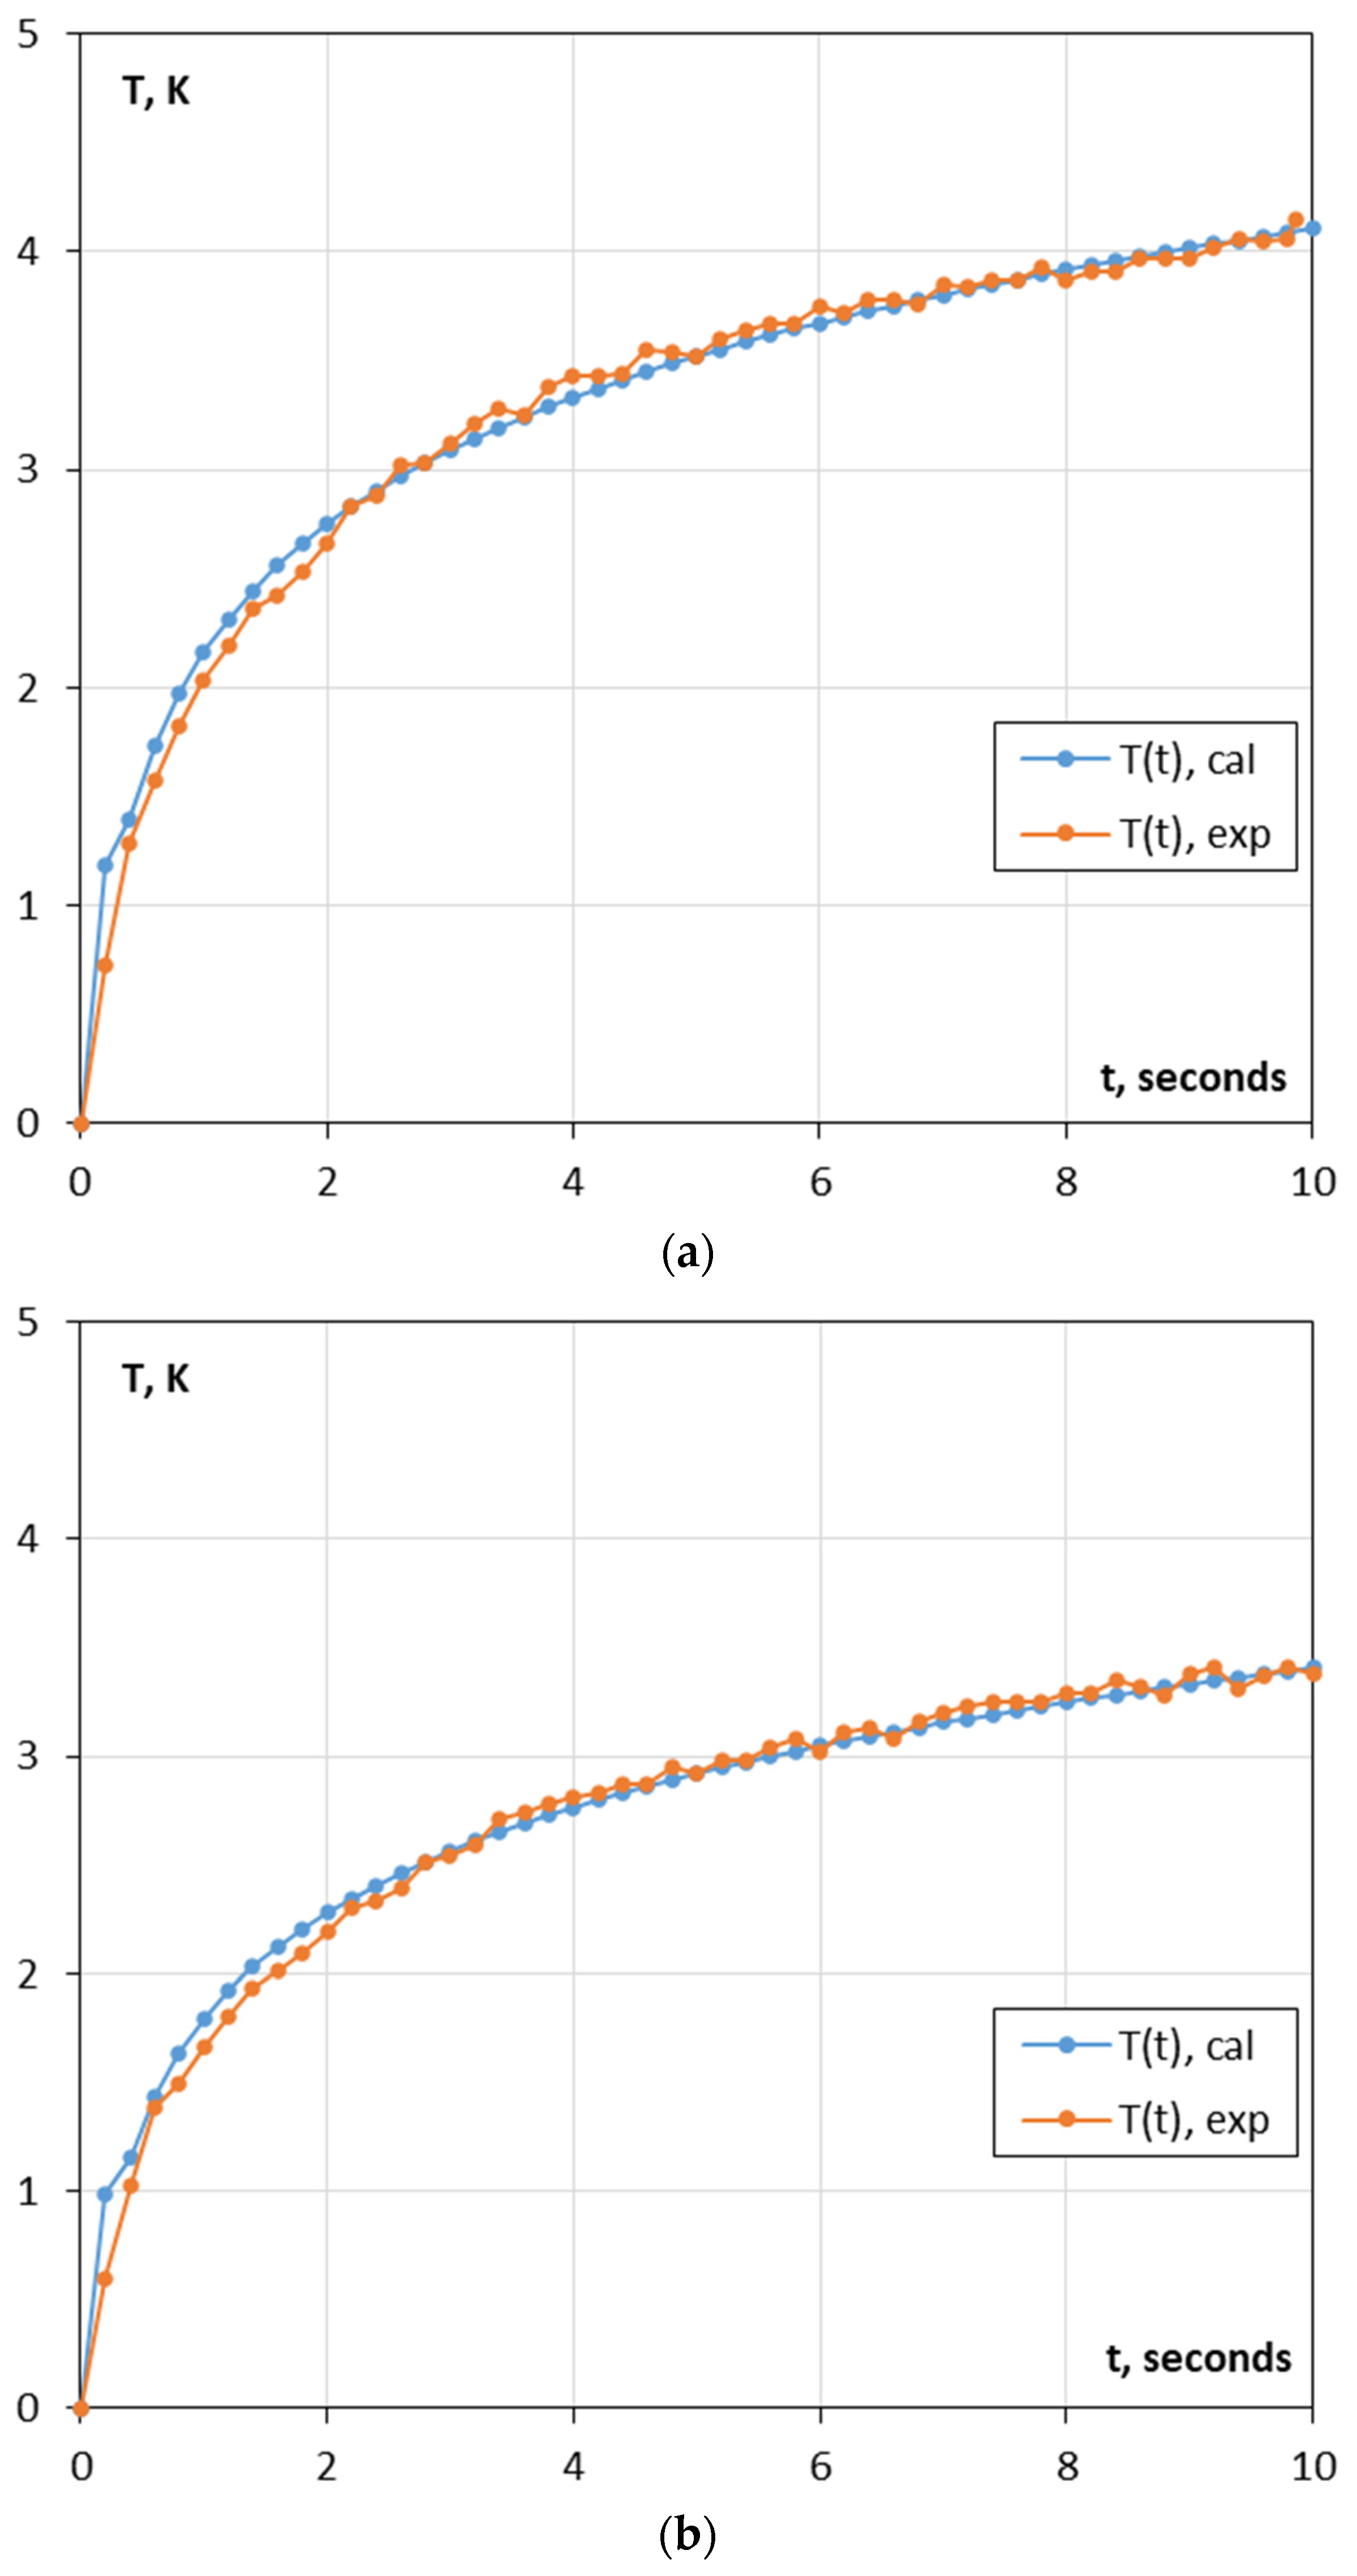
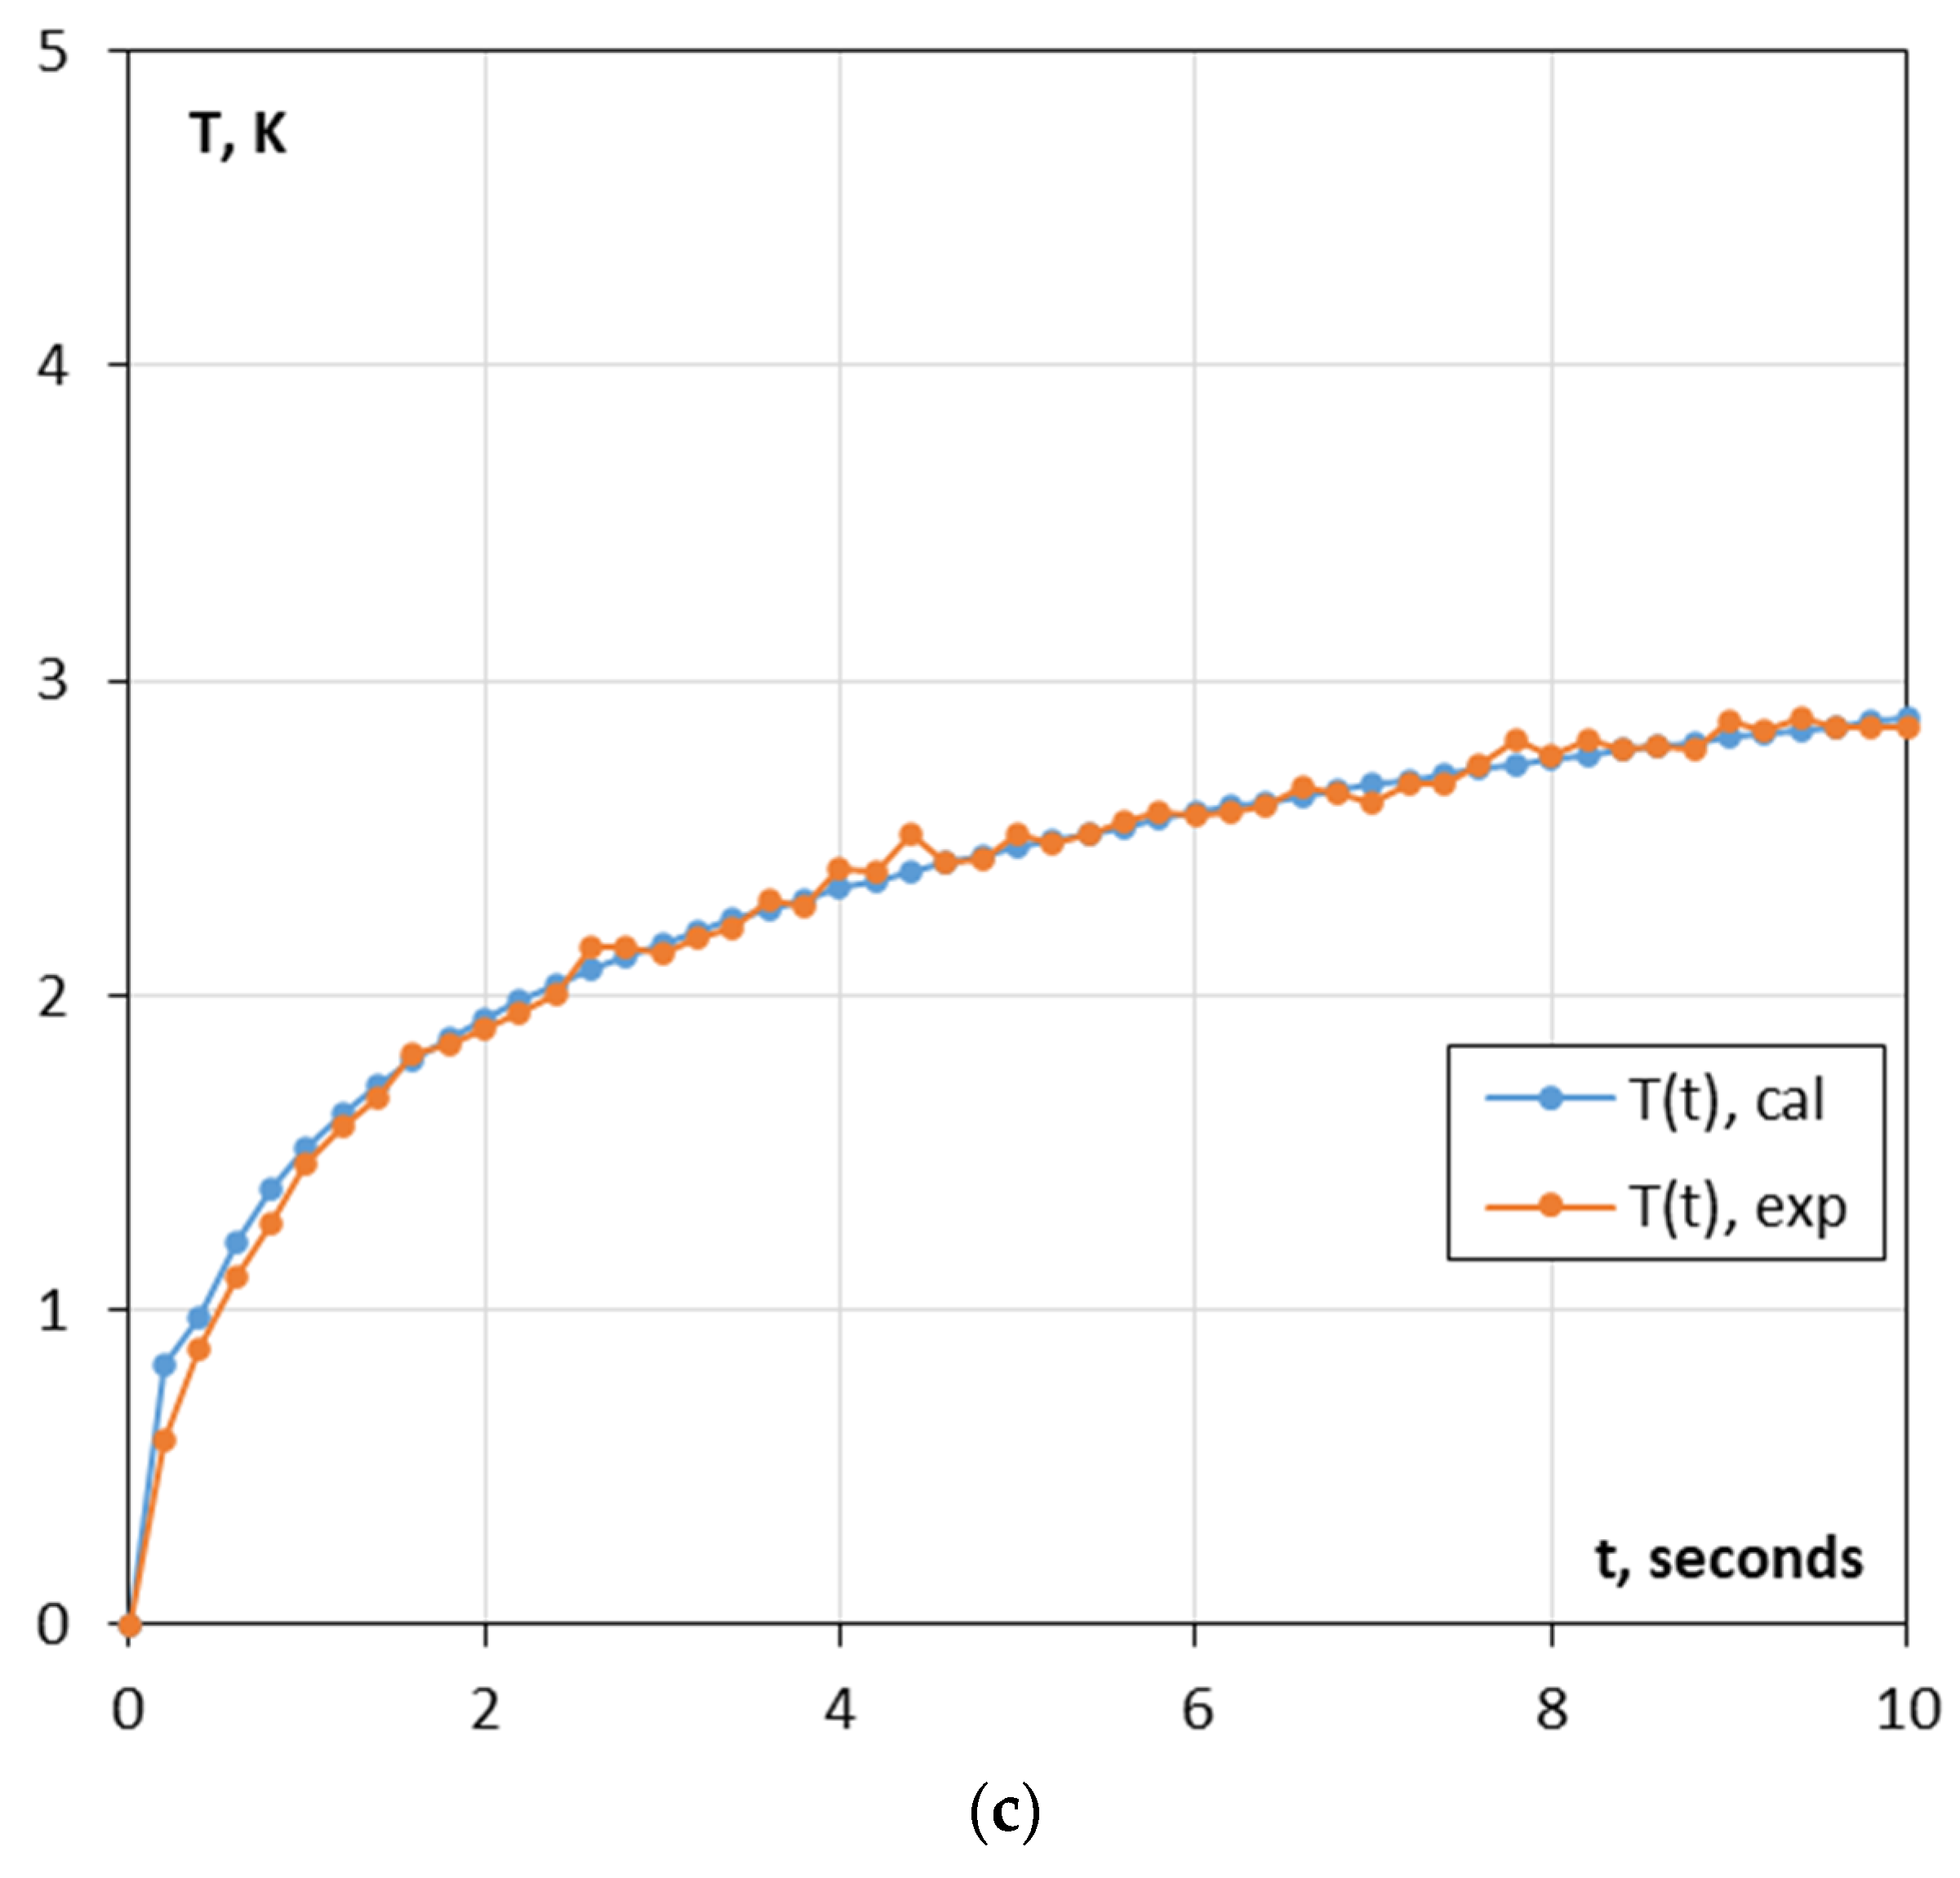
3.1. Thermo-Graphical Identification of Heat Flux Parameters

In order to identify the parameters of the heat source, i.e., (q) and (ω) from Equation (2), the experiments were performed based on the material with known properties, namely, a sheet made of S355 steel grade with the following parameters:
sheet thickness: l = 4.04 mm;
thermal conductivity coefficient of steel: λ = 42.2 W/(m·K);
specific heat capacity: cp = 461 J/(kg·K);
steel density: ρ = 7830 kg/m3.
The stand for identification of heat flux parameters with a heat source and a thermographic camera is shown in Figure 7. A heat source with a diameter of 3 mm was heated to temperature of 373.15 K ± 2 K and placed to the surface of the metal sheet through thermally conductive silicone paste. The ambient temperature during the experiments was constant and equal to 297.65 K, whereas the air humidity was 35%. The test was repeated twice at different points of the sheet, spaced approx. 50 mm apart. The temperature change on the side opposite of the sheet was recorded at a frequency of 100 Hz using a CEDIP Silver 420M (FLIR SC5200) thermographic camera with the main parameters:
resolution: 320 × 256 pixels;
pixel size: 25 μm;
spectral range: 3.6 ÷ 5.0 μm;
sensitivity: below 20 mK (8 mK achievable);
recording frequency for full resolution with digital image transfer up to 140 Hz (up to 25 kHz in 64 × 8 pixel resolution);
programmable integration time in the range from 10 μs to 10 ms.
Examples of thermograms recorded during the tests are shown in Figure 8a–i.
The change in temperature distribution during heating along the width of the specimen is shown in Figure 9.
Figure 10a,b shows the changes in the maximum temperature during heating for two different points on the plate. The measurement was carried out for at least 50 s of heating. Due to the temperature stabilization, shown in the graphs, occurring around the 10th second of the test, the results recorded for the first 10 s, from the moment of contact of the heat source with the sheet, were adopted for further analysis.
The calculation results for the unknown parameters of the heat source (q and ω) using Equation (5) are presented in Table 3. Based on the carried out measurements and calculations, the following assumptions were made:
heat flux capacity q = 0.87 W,
concentration coefficient ω = 7.74 × 10⁻⁴ m.
Table 3. Parameters of the heat source determined for the objective function (2).
Q, Wω, m
Point 10.867.74 × 10−4
Point 20.887.74 × 10−4

3.2. Thermophysical Parameters of L485ME Steel Grade

In order to determine the thermal properties of steel for pipes (cp and α), an optimization task was defined, assuming, as the optimization criterion, the minimum square of the difference in the results describing the change in temperature determined according to Equation (2), and recorded using a thermographic camera and described by relation (5). The summary of changes in temperature over time, e.g., T(t)cal, determined according to Equation (1) and T(t)exp, recorded with a thermographic camera for three measurements at εpl = 12%, are shown in Figure 11a–c.
The specific heat was determined based on transformed relationship (3):
c p = λ α ρ
The results of calculations of thermophysical parameters for a thermo-mechanically rolled pipe are presented in Table 4.

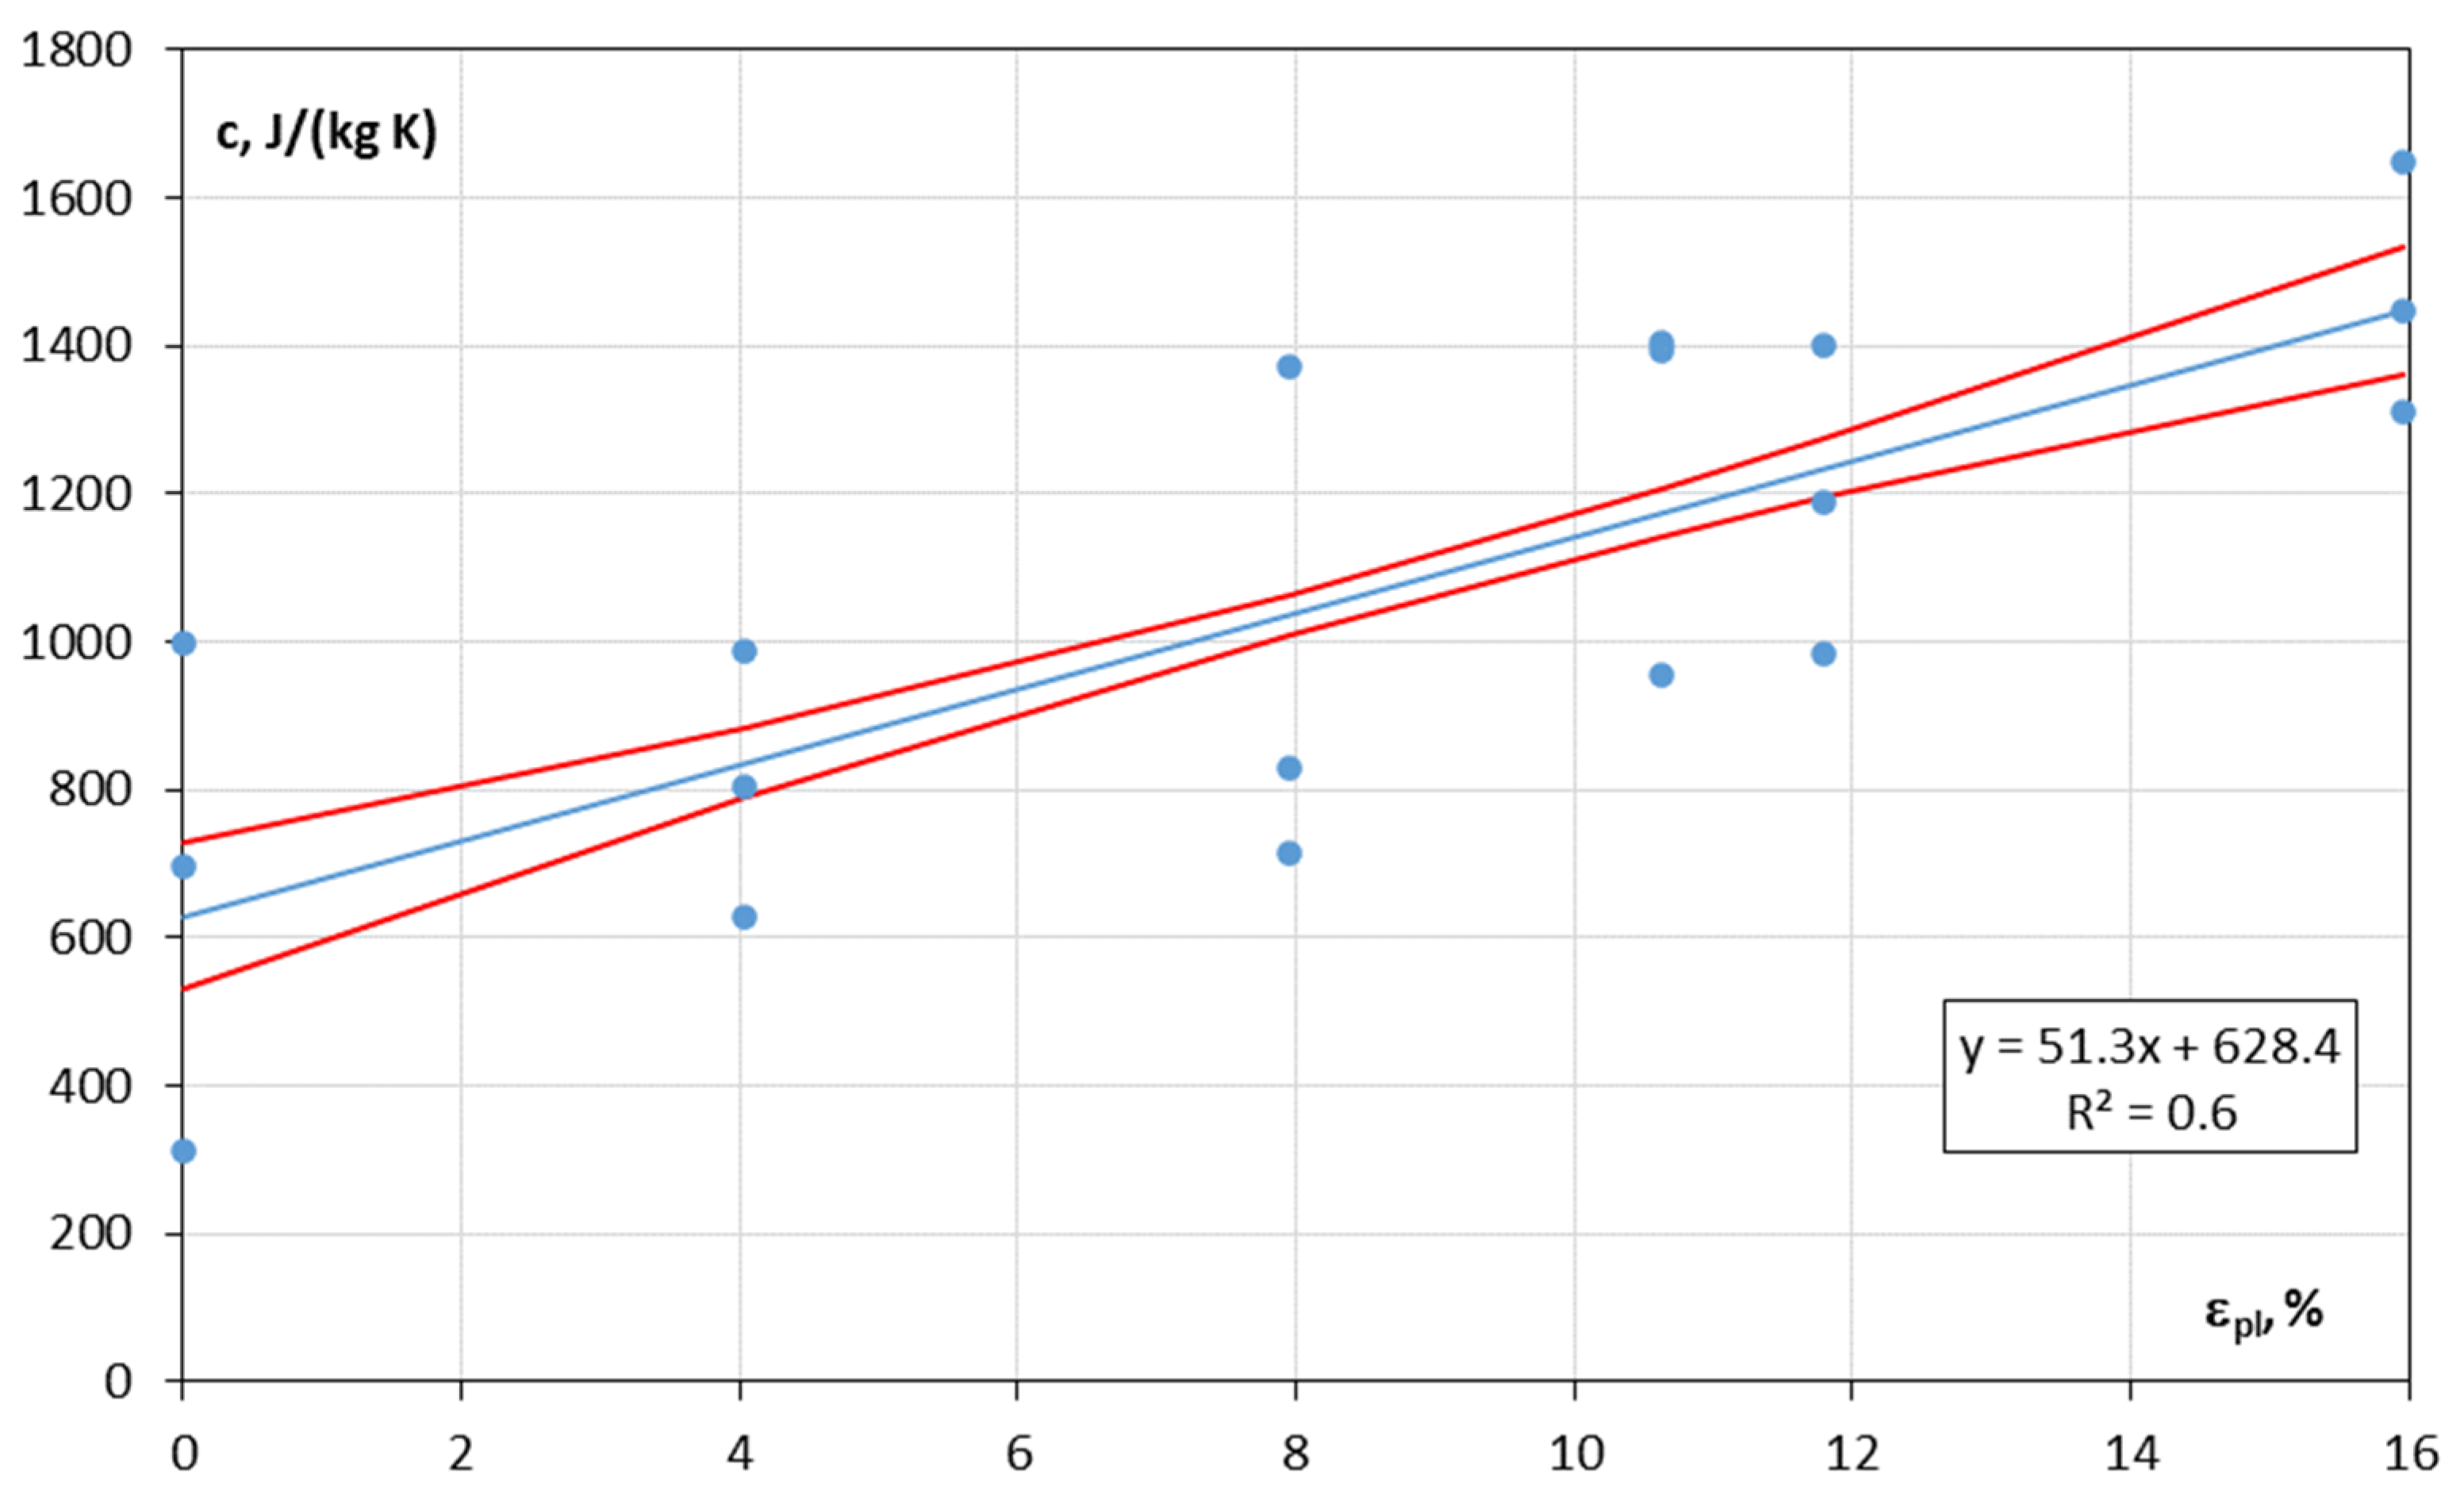
4. Heat Capacity as a Function of Strain for Thermo-Mechanically Rolled Steel

The linear regression equation was determined, obtaining the value of R2 = 0.6, which is shown in Figure 12. The F test [22] (significance level α = 0.05) to compare the variances in two samples was used to confirm that the line is a perfect fit for the data (p-value << α). The test of the significance of the slope of the regression line [22] showed (α = 0.05) that the slope is significantly different from 0 (p-value << α).
As a result of the statistical test, a linear equation was obtained describing the relation of plastic deformation of the L485ME pipe material, and the specific heat capacity of steel for pipes in the form of the following equation:
c p = 51.3 · ε pl + 628.4
valid for plastic strain εpl ≤ 16%.
For the AISI 304 stainless steel under consideration in [2], the specific heat capacity and thermal conductivity were determined as linearly decreasing within the range of the analyzed deformation of ε ≤ 0.4 (40%), where the percentage of total extension at fracture for the analyzed steel is approximately 45%. From the above values, it can be derived that the necking in the direction perpendicular to the sample axis occurred during the tensile experiment, which usually occurs approximately halfway of the total extension up to rupture. For an assessment of thermophysical properties in the present article, the occurrence of sample necking limits the maximum values of plastic strain εpl ≤ 16%, as shown in Figure 4. Until the occurrence of the sample narrowing in the direction perpendicular to the tensile force, deformation during the test is relatively homogenous. After reaching a local constriction of the sample, the heat capacity evaluation was disturbed due to unreliable determination of the local strain. The difficulty in relating heat capacity to plastic deformation after necking is primarily due to measurement disturbances. The strain in the test was measured using an extensometer. The appearance of necking locally causes the plastic strain to be greater than that indicated by the extensometer. In addition, the necking in the test specimens occurred non-perpendicular to the specimen axis (see Figure 5), further complicating the measurement. Perhaps the use of field methods for measuring specimen strain would make it possible to determine local values of plastic strain and consider their larger values for measurement.
The results of experiments conducted for thermo-mechanically rolled steel are opposite to the results of research [2], in which it was shown that under an influence of the plastic deformation of stainless steel, the specific heat capacity decreases linearly. There were examined the possible reasons of the increase in the heat capacity as a function of plastic elongation, occurring up to reaching the sample deformation, observed in the present study. In accordance with the classical theory of elasticity used for continuous media, the observed rise in the heat capacity of the deformed solid material at a constant pressure (cp) is probably connected with a change in a bulk modulus. It can be highlighted that an increase in strain was accompanied by an increase in microcracks, pores, and cavities, such as those analyzed in [1,23]. The structural defects formed during the tensile test of the steel can also contribute to a rise in the material heat capacity.

5. Conclusions

From the experiments conducted in the present research with the use of L485ME steel grade, the following conclusions can be drawn:
At the initial stages of sample plastic deformation, the heat capacity of thermo-mechanically rolled pipe steel remains almost independent of strain and later, with increasing elongation during tensile tests, the value of cp begins to rise. In the case of the studied pipe steel, the occurrence of sample narrowing in the perpendicular direction during the tensile test limits the plastic strain maximum values of εpl ≤ 16% for a reliable, in terms of accuracy, heat capacity determination.
Until the appearance of the sample necking during the tensile test, deformation of the steel sample is relatively homogenous. After reaching a local constriction of the sample, the heat capacity evaluation was disturbed due to unreliable determination of the local strain. The constrains in assessment of an influence of the heat capacity on the plastic deformation of steel after necking is primarily due to difficulties in measurement with the use of an extensometer. In the conducted tests, an extensometer indicates the average strain of the specimen over the gauge length. The appearance of necking locally causes the plastic strain to be greater than the one measured with an extensometer.
The presented methodology using infrared thermography is appropriate for determination of the specific heat capacity of metals. Regarding the fitting equations and rules obtained in the present paper, it can be mentioned that the obtained relationship is valid for the investigated steel grade. However, the general relations between plastic strain and specific heat capacity and trends can be valid at least for thermo-mechanically rolled steels such as L555ME or L450ME. The advantage of the proposed methodology is its applicability to the other metallic materials.
By implementing the proposed methodology, engineers can enhance their ability to detect and evaluate deformations in critical infrastructure components, thereby facilitating proactive maintenance strategies and ensuring the integrity and reliability of industrial structures. Moreover, a linear regression equation derived from our experimental results provides a practical tool for engineers to predict specific heat capacity changes corresponding to varying levels of plastic elongation in L485ME steel grade. Of course, this requires a much wider research program. At this stage, only the existence of a statistically significant correlation, which could become the basis for such a method, has been introduced.
Further investigations using other methods of the heat capacity evaluation of deformed steel are expected. Perhaps the use of field methods for measuring specimen strain would make it possible to determine local values of plastic strain and consider their larger values for the measurement.

Author Contributions

A.L.: conceptualization, methodology, software, formal analysis, investigation, validation, visualization; supervision; M.W.: conceptualization, methodology, formal analysis, investigation, resources, writing—original draft, writing—review and editing, supervision, project administration; M.A.: conceptualization, writing—original draft; P.S.: visualization, software, data curation, validation. All authors have read and agreed to the published version of the manuscript.

Funding

The authors declare that the research was funded by the Warsaw University of Technology within the IDUB-Open Science Program.

Data Availability Statement

All data generated or analyzed during this study are available on request. The data are not publicly available due to amount of results.

Acknowledgments

The authors wish to thank the reviewers for their valuable comments and suggestions.

Conflicts of Interest

The authors declare that there are no conflicts of interest directly or indirectly related to the research.

Code Availability

The published article includes all information about the software and algorithms used during this study.

Al Declaration

During the preparation of this work the authors did not used any AI tools.

References

  1. Botvina, L.R.; Levin, V.P.; Tyutin, M.R.; Zharkova, N.A. Heat Capacity of Deformed Steels. Dokl. Phys. 2010, 55, 494–497. [Google Scholar] [CrossRef]
  2. Zhelnin, M.; Iziumova, A.; Vshivkov, A.; Plekhov, O. Experimental study of an effect of plastic deformation on thermal properties of stainless steel. Quant. InfraRed Thermogr. J. 2018, 16, 74–86. [Google Scholar] [CrossRef]
  3. Tao, N.; Li, L.X.; Sun, J.G. Simultaneous measurement of thermal conductivity and heat capacity by flash thermal imaging methods. Rev. Sci. Instrum. 2017, 88, 064903. [Google Scholar] [CrossRef] [PubMed]
  4. Ślęzak, T.; Zmywaczyk, J.; Koniorczyk, P.; Śnieżek, L. DSC Investigations of the Phase Transition in the High Strength Steel S960QL. Adv. Mater. Res. 2015, 1126, 148–154. [Google Scholar] [CrossRef]
  5. Moyseychik, E.A.; Vavilov, V.P.; Kuimova, M.V. Infrared thermographic assessment of heat release phenomena in steel parts subjected to quasi-static deformation. Measurement 2021, 185, 110117. [Google Scholar] [CrossRef]
  6. Haneef, T.; Lahiri, B.B.; Bagavathiappan, S.; Mukhopadhyay, C.K.; Philip, J.; Rao, B.P.C.; Jayakumar, T. Study of the tensile behavior of AISI type 316 stainless steel using acoustic emission and infrared thermography techniques. J. Mater. Res. Technol. 2015, 4, 241–253. [Google Scholar] [CrossRef]
  7. Risitano, G.; Santonocito, D. Experimental and numerical assessment of the end of the thermoelastic effect during static traction test. Procedia Struct. Integr. 2020, 28, 1449–1457. [Google Scholar] [CrossRef]
  8. Huang, L.; Peng, L.; Mi, X.; Zhao, G.; Huang, G.; Xie, H.; Zhang, W. Effect of Cold Working on the Properties and Microstructure of Cu-3.5 wt% Ti Alloy. Materials 2022, 15, 8042. [Google Scholar] [CrossRef] [PubMed]
  9. Bhowmick, S.; Shenoy, V.B. Effect of deformation on the thermal conductivity of solids. J Chem Phys. 2006, 125, 164513. [Google Scholar] [CrossRef] [PubMed]
  10. Kourov, N.I.; Korolev, A.V.; Pushin, V.G. Effect of plastic deformation by torsion on the heat capacity of the Ni50.5Ti49.5 alloy. Phys. Solid State 2012, 54, 883–885. [Google Scholar] [CrossRef]
  11. Lipski, A. Change of Specimen Temperature during the Monotonic Tensile Test and Correlation between the Yield Strength and Thermoelasto-Plastic Limit Stress on the Example of Aluminum Alloys. Materials 2021, 14, 13. [Google Scholar] [CrossRef] [PubMed]
  12. Lipski, A. Accelerated Determination of Fatigue Limit and S-N Curve by Means of Thermographic Method for X5CrNi18-10 Steel. Acta Mech. Autom. 2016, 10, 22–27. [Google Scholar] [CrossRef]
  13. Skibicki, D.; Lipski, A.; Pejkowski, Ł. Evaluation of plastic strain work and multiaxial fatigue life in CuZn37 alloy by means of thermography method and energy-based approaches of Ellyin and Garud. Fatigue Fract. Eng. Mater. Struct. 2018, 41, 2541–2556. [Google Scholar] [CrossRef]
  14. Lee, H.W.; Basaran, C.; Egner, H.; Lipski, A.; Piotrowski, M.; Mroziński, S.; Noushad Bin Jamal, M.; Rao, C.L. Modeling ultrasonic vibration fatigue with unified mechanics theory. Int. J. Solids Struct. 2022, 236–237, 111313. [Google Scholar] [CrossRef]
  15. EN-ISO 3183:2019; Petroleum and Natural Gas Industries—Steel Pipe for Pipeline Transportation System. Technical Committee: ISO/TC 67/SC 2; BSI Standards Limited: London, UK, 2019.
  16. API Spec 5L, 46th ed.; American Petroleum Institute: Washington, DC, USA, 2018.
  17. Witek, M. Possibilities of using X80, X100, X120 high strength steels for onshore gas transmission pipelines. J. Nat. Gas Sci. Eng. 2015, 27, 374–384. [Google Scholar] [CrossRef]
  18. ASTM A370-23; Standard Test Methods and Definitions for Mechanical Testing of Steel Products. ASTM International: West Conshohocken, PA, USA, 2013.
  19. PN-EN-ISO 6892-1:2019E; Metallic Materials—Tensile Testing—Part 1: Method of Tests at Room Temperatures. Technical Committee: ISO/TC 164/SC 1. BSI Standards Limited: London, UK, 2019.
  20. Zhelnin, M.; Iziumova, A.; Plekhov, O. Determining the thermal constant of metals by infrared thermography. AIP Conf. Proc. 2016, 1785, 040095. [Google Scholar] [CrossRef]
  21. Eagar, T.W.; Tsai, N.S. Temperature fields produced by traveling distributed heat sources. Weld. Res. Suppl. 1983, 62, 346–355. [Google Scholar]
  22. Zaiontz, C. Real Statistics Using Excel. 2023. Available online: www.real-statistics.com (accessed on 1 February 2024).
  23. Abdelghani, M.; Tewfik, G.; Witek, M.; Djahida, D. Factors of Stress Concentration around Spherical Cavity Embedded in Cylinder Subjected to Internal Pressure. Materials 2021, 14, 3057. [Google Scholar] [CrossRef] [PubMed]
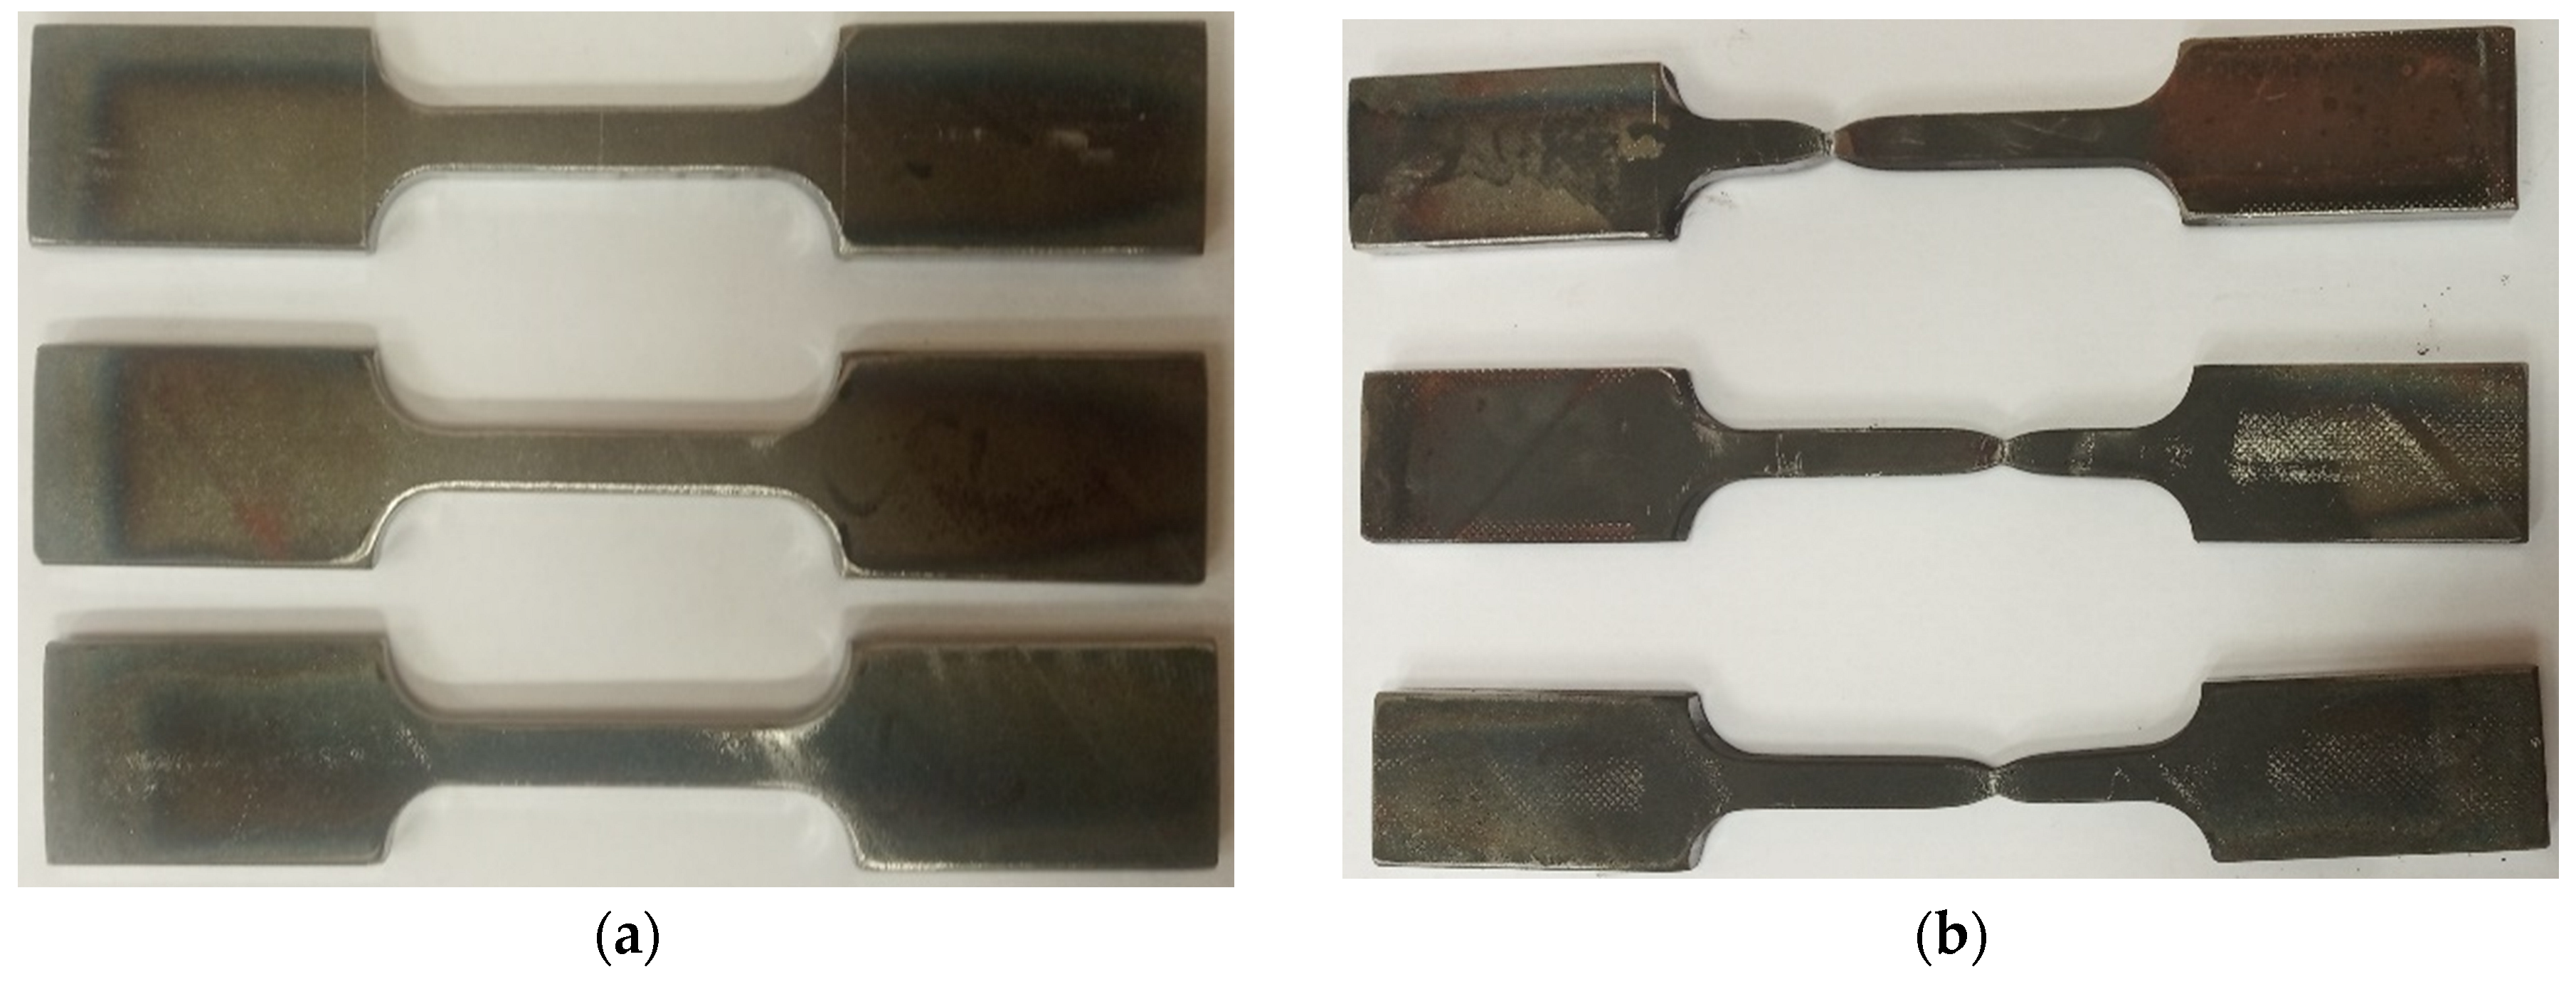
Figure 1. Geometry of the specimens (a) for the tensile test and (b) for thermophysical experiments (all dimensions in mm).
Energies 17 01554 g001
Figure 2. The specimens (a) before and (b) after static tensile tests.
Energies 17 01554 g002
Figure 3. The graphs obtained during the static tensile test for three specimens.
Energies 17 01554 g003
Figure 4. Loading and unloading diagrams of specimens for different levels of plastic deformation εpl.
Energies 17 01554 g004
Figure 5. The specimens after tensile tests for different levels of plastic strain εpl.
Energies 17 01554 g005
Figure 7. The stand for identification of heat flux parameters with a thermographic camera.
Energies 17 01554 g007
Figure 8. Examples of thermograms recorded during the experiments (time from the beginning of heating is given).
Energies 17 01554 g008
Figure 9. The change in temperature distribution during heating along the width of the specimen.
Energies 17 01554 g009
Figure 10. Curves of changes in the maximum temperature for two different points (a,b) on the sheet.
Energies 17 01554 g010
Figure 11. The temperature curves T(t)cal determined according to Equation (2) and T(t)exp recorded with a thermographic camera for three different points (ac) on the same sample for εpl = 12%.
Energies 17 01554 g011aEnergies 17 01554 g011b
Figure 12. Linear regression analysis results.
Energies 17 01554 g012
Table 1. The results of the tensile test for three specimens.
Specimen No. 1Specimen No. 2Specimen No. 3
Specimen section width, mm10.2010.2610.29
Specimen section thickness, mm8.608.608.60
Upper yield point ReH, MPa606.1552.6552.0
Lower yield point ReL, MPa603.2549.0545.3
Ultimate tensile strength Rm, MPa644.9595.7594.3
Table 2. Plastic percentage elongation and dimensions of the cross-sections of individual specimens.
Specimen DesignationObtained Plastic DeformationSpecimen Section Initial WidthSpecimen Section Initial Thickness
εpl, %mmmm
Strain 4%4.04%50.263.02
Strain 8%7.95%50.213.03
Strain 10%10.63%50.163.02
Strain 12%11.80%50.223.04
Strain 16%15.96%50.193.04
Table 4. Thermophysical parameters of L485ME steel grade.
Plastic StrainSample ThicknessDensityThermal Conductivity CoefficientThermal Diffusivity CoefficientSpecific Heat Capacity
εpll, mmρ, kg/m3λ, W/(m·K)α × 10−6, m2/scp, J/(kg·K)
0%3.048 06647.159.518.712.7312.6668.4
54.59.7695.1
77.09.6997.5
4.04%3.007 94360.772.99.511.9804.0806.3
83.616.8627.7
74.39.5987.3
7.95%2.997 823113.776.210.69.91370.5971.2
54.59.8713.7
60.69.3829.3
10.63%2.967 66868.589.19.39.3956.41251.2
99.19.31392.6
99.59.21404.5
11.80%2.927 63568.282.59.19.1983.31190.4
82.29.11188.7
97.29.11399.1
15.96%2.897 60762.683.75.07.71648.21467.5
89.79.01308.7
98.99.01445.6
Disclaimer/Publisher’s Note: The statements, opinions and data contained in all publications are solely those of the individual author(s) and contributor(s) and not of MDPI and/or the editor(s). MDPI and/or the editor(s) disclaim responsibility for any injury to people or property resulting from any ideas, methods, instructions or products referred to in the content.

