Abstract
This article concerns flow analysis through a multi-section proportional control valve. In valves of this type, the flow rate is adjusted through an electromagnet current. However, for a fixed control signal value, the flow rate changes as the pressure in the system increases, which is an unfavorable phenomenon. Compensation for pressure influence is usually achieved using additional valves. In this work, the valve characteristics were modified to achieve a possibly steady flow rate by compensating for the pressure using flow forces without the necessity of correction valves. For this purpose, the geometry of the spool throttling slots was designed by making precise cuts. Moreover, the parameters of the return springs were adjusted accordingly. The changes were introduced in such a way as to adjust the direction of the fluid stream and thus influence the balance of forces acting on the spool. Simulation tests were performed using the CFD method. In turn, laboratory experiments were carried out using the PONAR WREM10 valve with a prototype spool in two neutral position flow configurations: closed (E) and open (W). The results confirmed the valve’s ability to maintain a quasi-constant flow rate in a wide pressure range. The maximum obtained non-uniformity in the flow rate for the fixed control signal in the whole studied pressure range, p = 5–30 , was % except for the lowest current intensity, , when it raised to %. Moreover, high consistency between simulation results and laboratory experiments was achieved. The difference in the obtained flow rate did not exceed 8–10% in the case of low current intensity values –0.75 , and it fell below 5% at higher ones.
1. Introduction
Proportional control valves are widely used to control the flow rate and direction of fluid flow in the hydraulic systems of heavy-duty machines and devices due to their operational simplicity and reliability, as well as the possibility of use in automatic regulation systems. Proportional valves are particularly advantageous when smooth starting or braking of the load movement is required. The fluid flow rate is set by changing the cross-sectional area of the gap using a movable spool operated via an electromagnet force. The appropriate forming of the spool geometry allows a smooth change in the flow gap area, leading to the flow rate adjustment to the current requirements of the receivers. However, implementing this task requires adequate simulations and laboratory tests due to the complexity of flow-related phenomena. Hence, this subject matter is studied at numerous leading research centers worldwide.
One of the first researchers involved in estimating the flow forces acting on the hydraulic valve spool using the CFD method was R. Amirante. In his publications presenting results regarding an open-center directional control valve [1] and a direct (single-stage) proportional valve [2], he demonstrated that the implementation of additional cylindrical holes on the metering edge of the spool significantly affects the force balance, especially at medium and large valve openings. A significant contribution to the development of research on identifying and assessing the impact of flow forces in hydraulic control valves was made, among others, by J. Valdes and H. Chattopadhyay. Valdes, in [3], developed a reduced-order model for estimating fluid flow characteristics and flow forces. The model was based on incompressible flow theory and CFD simulations. Chattopadhyay [4] carried out an analysis of the flow structure inside spool valves, finding the k– model to be particularly useful for describing turbulence in this type of valve. Similarly, the k– turbulence model was used by Aung [5] in the analysis of a flapper-nozzle pilot valve. In turn, Gomez [6] and Ye [7] conducted transient state flow analyses of a poppet valve and a check valve, respectively.
Estimating the flow forces acting on the moving elements of the valve enables further research to minimize or modify them in order to determine the required flow characteristics. The issue of improving the characteristics by reducing the axial component of the flow force in a small hydraulic seat valve was undertaken by Simic and Herakovic [8]. By modifying the spool geometry, including inlet angle and metering edge overlap, the authors achieved an almost 80% reduction in flow force, which resulted in a 20% improvement in the response time and a 10% reduction in energy consumption. A study on the steady-state flow force compensation in a servo-proportional valve by modifying the spool shoulder inclination angle was provided by Chen [9]. In turn, Amirante [10] invented a new methodology for spool surface design in proportional directional valves. The redesign of the spool geometry resulted in an actuation force reduction of over 10% at the maximum valve opening. Moreover, Ding [11] demonstrated that a valve spool with a jet guiding groove can effectively compensate for the steady-state flow force and improve control accuracy. Tan [12] proposed a method for decreasing the steady-state flow force acting on a proportional cartridge valve spool. He applied and optimized a damping flange, achieving a 93% reduction in the axial that was verified through laboratory experiments. Similarly, Liu [13] designed a novel cartridge valve core structure to compensate for the negative effect of flow forces on valve characteristics by reducing the compensation coefficient by 40 to 64%, depending on the degree of valve opening, while Gui [14] proposed a methodology for the fluid-dynamic optimization of a piezoelectric servo valve spool geometry, achieving a dynamic bandwidth increase of approx. 26%.
The issue of making cuts on a valve spool to modify its characteristics is also the subject of numerous scientific studies. As early as 2005, Borghi [15] estimated the influence of geometry and the number of notches on spool valve metering characteristics, taking into account rectangular, semi-circle, and triangular shapes. Ye conducted similar research [16] to clarify the effects of the groove shape on the spool valve characteristics through (CFD) simulations and laboratory experiments. Ye considered spheroid, triangular, and divergent U-shaped grooves and concluded that the triangular grooves have the most significant influence on throttling stiffness. In turn, Zhang [17] provided a methodology for calculating the flow coefficients of spool valves with coupled O-shaped, U-shaped, and C-shaped throttling grooves. Moreover, Chen [18] proposed a throttling characteristics prediction methodology for a directional spool valve with combined U-shaped grooves. The authors reported a low cost and a high degree of compliance with the results obtained using the developed method with the results of laboratory experiments.
Pressure compensation becomes crucial in the case of multi-sectional control valves when several receivers can be powered with one pump. If the pump flow is sufficient, the valve can direct the working fluid to multiple receivers, provided that the pressure’s effect in individual supply lines is compensated. Known solutions usually use additional valves to counteract the influence of pressure on the flow. Wang [19] proposed a method for flow control valve active differential pressure regulation. He used a compensator spool and additional controllable force to achieve differential pressure regulation. Agh [20] applied an additional pressure compensator plunger-type valve to obtain a constant pressure difference across the flow control valve in a gas turbine engine fuel supply system. In turn, Huang [21] proposed a digital compensator for a two-stage proportional flow control valve. The compensator generated a signal to adjust the valve opening based on the measured actual pressure drop.
The solutions mentioned above require additional valves, measuring devices, and complex algorithms to achieve the effect of pressure compensation. They are accurate but relatively expensive, and they significantly complicate the construction of an entire system. Instead, the novelty of this work involves an attempt to obtain the effect of pressure compensation on the proportional control valve without using any external correcting elements. In a standard solution, the valve spool is affected by the spring, the electromagnet, and the flow forces. When a steady electromagnet force is obtained by setting a fixed current intensity, the spool is shifted by the distance balanced via the spring deflection. Flow forces disturb the balance of forces acting on the spool, which is usually adverse. However, by properly modeling the flow channels and the spool metering edge geometry, the flow force can compensate for the influence of pressure. In previous research, the authors were able to significantly compensate for the effect of pressure on the flow rate in some other valve types and sizes. The objects under study included, among others, a three-section, four-way WREM6 proportional directional control valve [22], and a USAB10 proportional control valve [23]. This article presents the analysis results of the WREM10 sectional control valve with a size of DN10 and a nominal flow of 80 using 3D modeling, CFD simulations, and verification on a laboratory test bench.
2. Case Study: Working Principle of the WREM10 Valve
The subject of the analysis is a proportional sectional control valve of the WREM10 type for a pressure of 35 and a nominal flow rate of per section.
2.1. Geometrical Model of the Valve
The external view of the valve is shown in Figure 1a. In the default configuration, the valve is composed of four sections, 2, connected in parallel. There are closing cover plates, , at both ends of the block. Additionally, a pressure safety valve is installed inside the plate, 1. The P and T ports are connected to the supply unit and the return line, respectively, while individual receivers can be attached to the A and B ports. The control valve body is designed to work with two types of spools, denoted as W and E. Functional diagrams of valve sections with individual spools are presented in Figure 2. The spools inside valve blocks are shown in the cross-sectional view in Figure 1b.

Figure 1.
WREM10 proportional sectional valve model: (a) general view and (b) cross section; 1—front cover plate with pressure valve, 2—regular sections, 3—rear cover plate, 4—W spool, and 5—E spool; P, A, B, T—connection ports.

Figure 2.
Schematic diagram of the control valve section: (a) type W spool and (b) type E spool.
Figure 2 presents potential flow directions through the control valve for both versions and all positions of the spool. In the E version, all flow channels are cut off in the neutral spool position, allowing other sections to be supplied simultaneously. In contrast, the control valve with the W spool version allows a small, throttled flow from the receiver to the return line in the neutral position. This is particularly important in designs containing a system of controllable check valves operating as a hydraulic lock. Pressure release with throttled flow allows the lock to cut off the flow quickly and tightly in both directions from and to the receiver. Because individual sections differ only in spool geometry, the further analysis was limited to two sections with the E and W spools, respectively. The internal structure of a single section is shown in Figure 3.
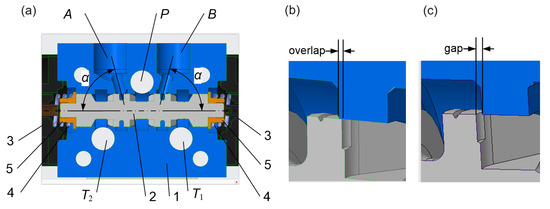
Figure 3.
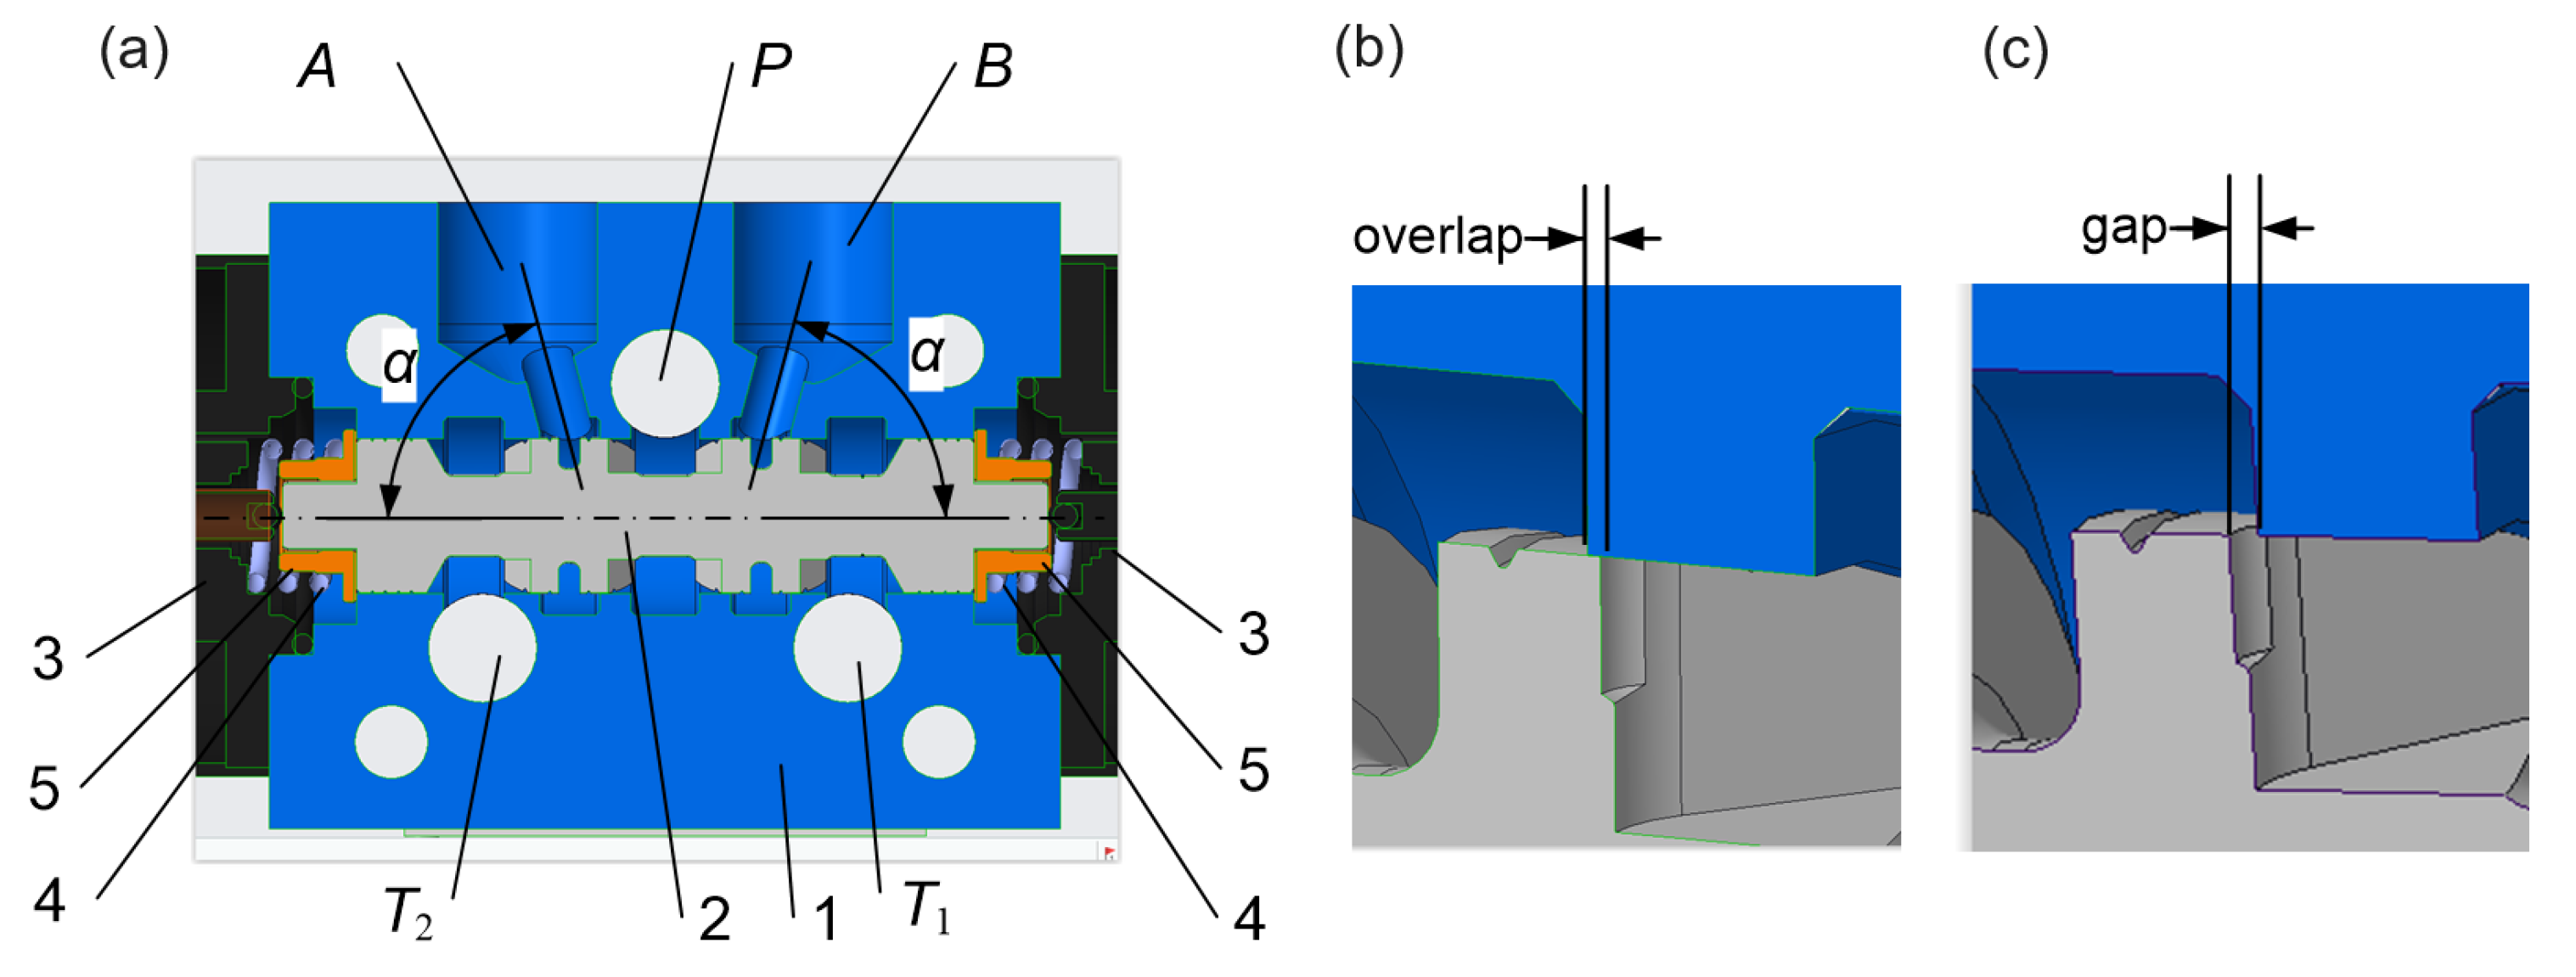
Single section of the valve: (a) longitudinal cross-sectional view, (b) spool in the flow cut-off position, and (c) spool in the flow opened position; 1—body, 2—spool, 3—electromagnet, 4—spring, and 5—sleeve.
2.2. Spool Design
It may be seen from the figure that the spool 2 in each section is controlled via two electromagnets, 3, and return springs, 4. The design solution of the spool is shown in Figure 4. Four symmetrical undercuts on each metering edge open the main flow. They are created by removing material in a direction perpendicular to the spool axis. The undercuts are deep enough to form flow conditions as close as possible to the radial direction, minimizing the axial component. The depth of each cut is , and the radius is . Additionally, two small, precise arc notches with a radius of are created symmetrically on both sides of each metering edge, creating an exact overlap of . The notches initiate the smooth opening of the main flow gaps.

Figure 4.
Valve spool design: (a) general view (b) default undercut R1, and (c) modified undercut R1 with a notch R0.5; , —pump side, , , , and — receiver side.
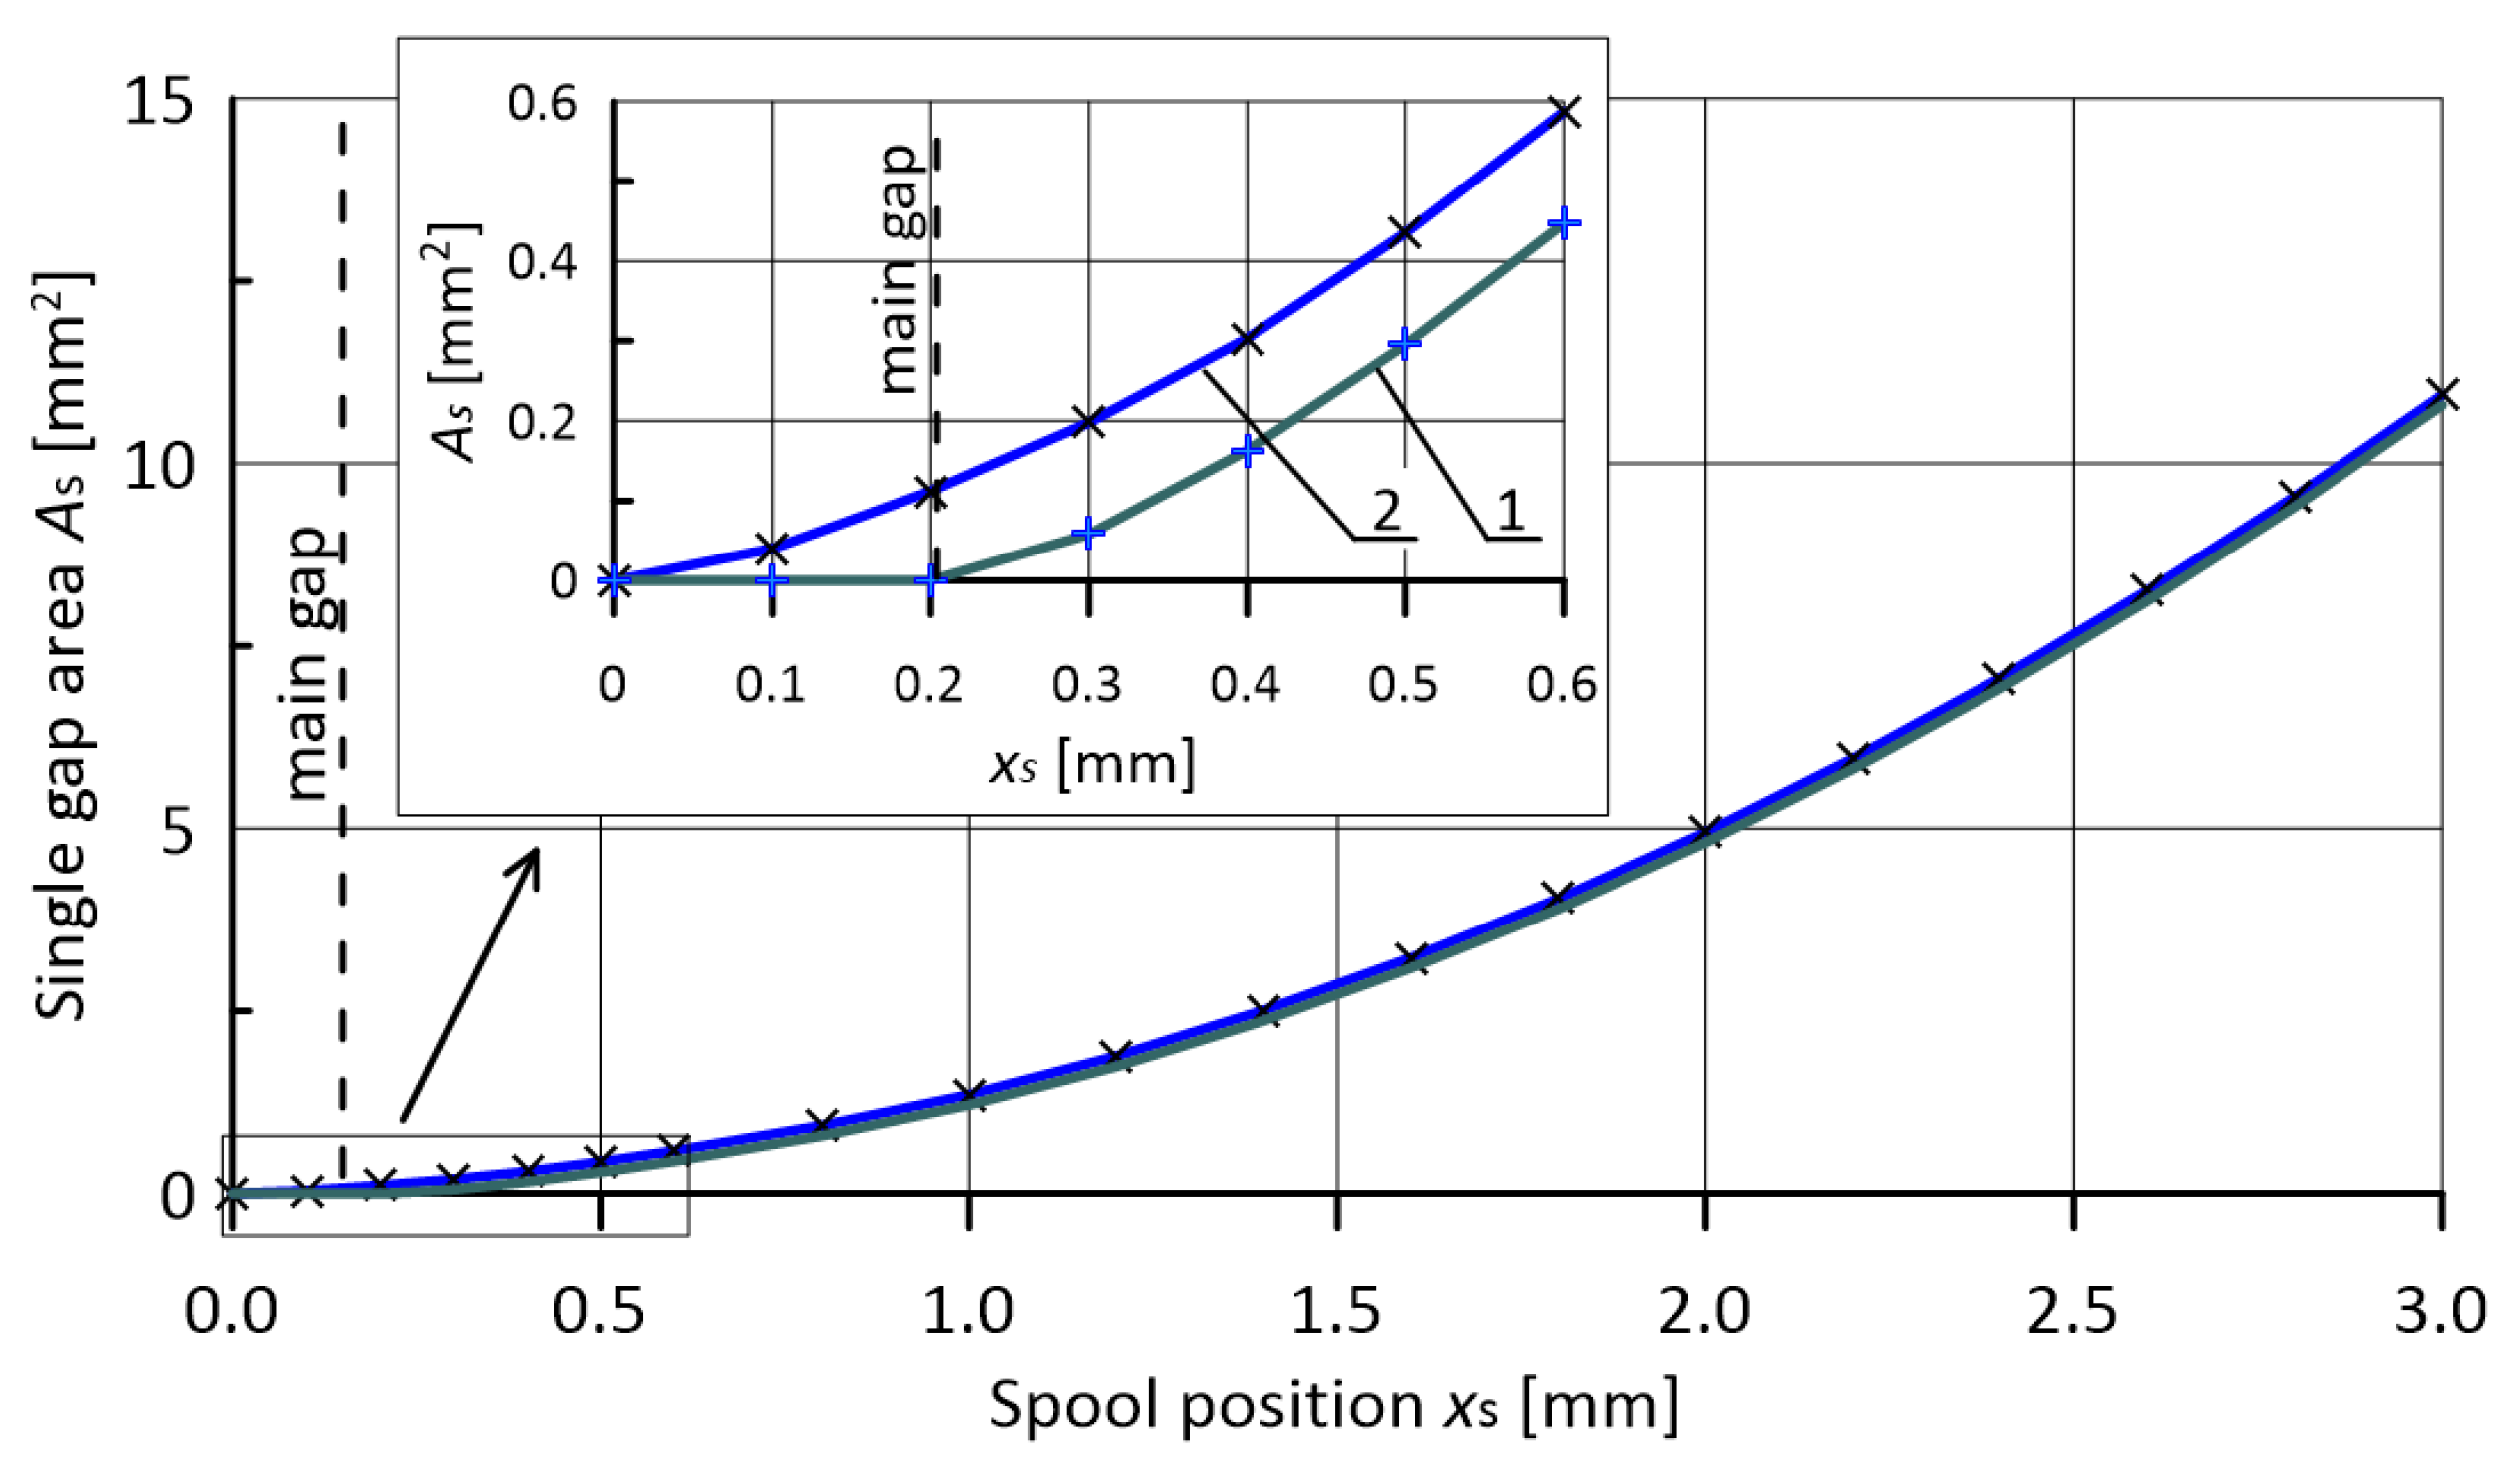
Figure 5 shows the cross-sectional areas of the individual and gaps determined separately against the spool position, . The total flow area, , is calculated by summing up the areas of four gaps at each metering edge. Since the E and W spool versions have the same geometry and differ only in the initial state (overlap value), the equations for calculating gap areas are the same. In the case of the E spool, the overlap is positive, , for all ports, while for the W spool, it is still positive for the P port and negative, , for A, B, and T ports, respectively. For further usage in the simulation model, the function was approximated with a second-degree polynomial, obtaining the residual sum of squares, , and the correlation coefficient, . The function, taking into account the overlap, has the form shown in Equation (1). The equation is valid for and in , and it returns the flow gap area in .
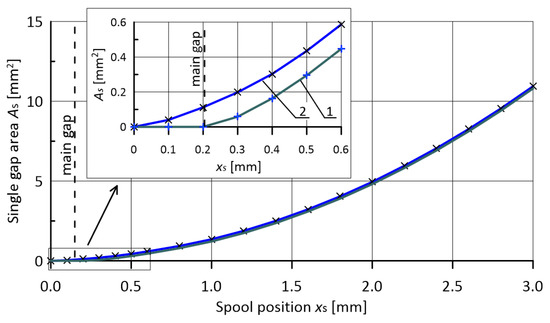
Figure 5.
Flow area of a single gap, , against spool position ; 1—default undercut () and 2—undercut with a notch ().
3. Methodology: Discrete Model and CFD Simulations
The methodology comprises creating the discrete model, including flow path modeling, defining boundary conditions, and turbulence configuration to carry out CFD simulations and formulate a mathematical model.
3.1. Discrete Flow Path Model and Boundary Conditions
The plan of CFD analysis assumed multiple simulations for fixed values of valve openings. The following assumptions and requirements were adopted to build the models:
- A series of geometric fluid models were built, corresponding to the individual positions of the spool and, thus, the areas of the flow gaps. The models were created in PTC CREO using geometric models of the valve body and spool;
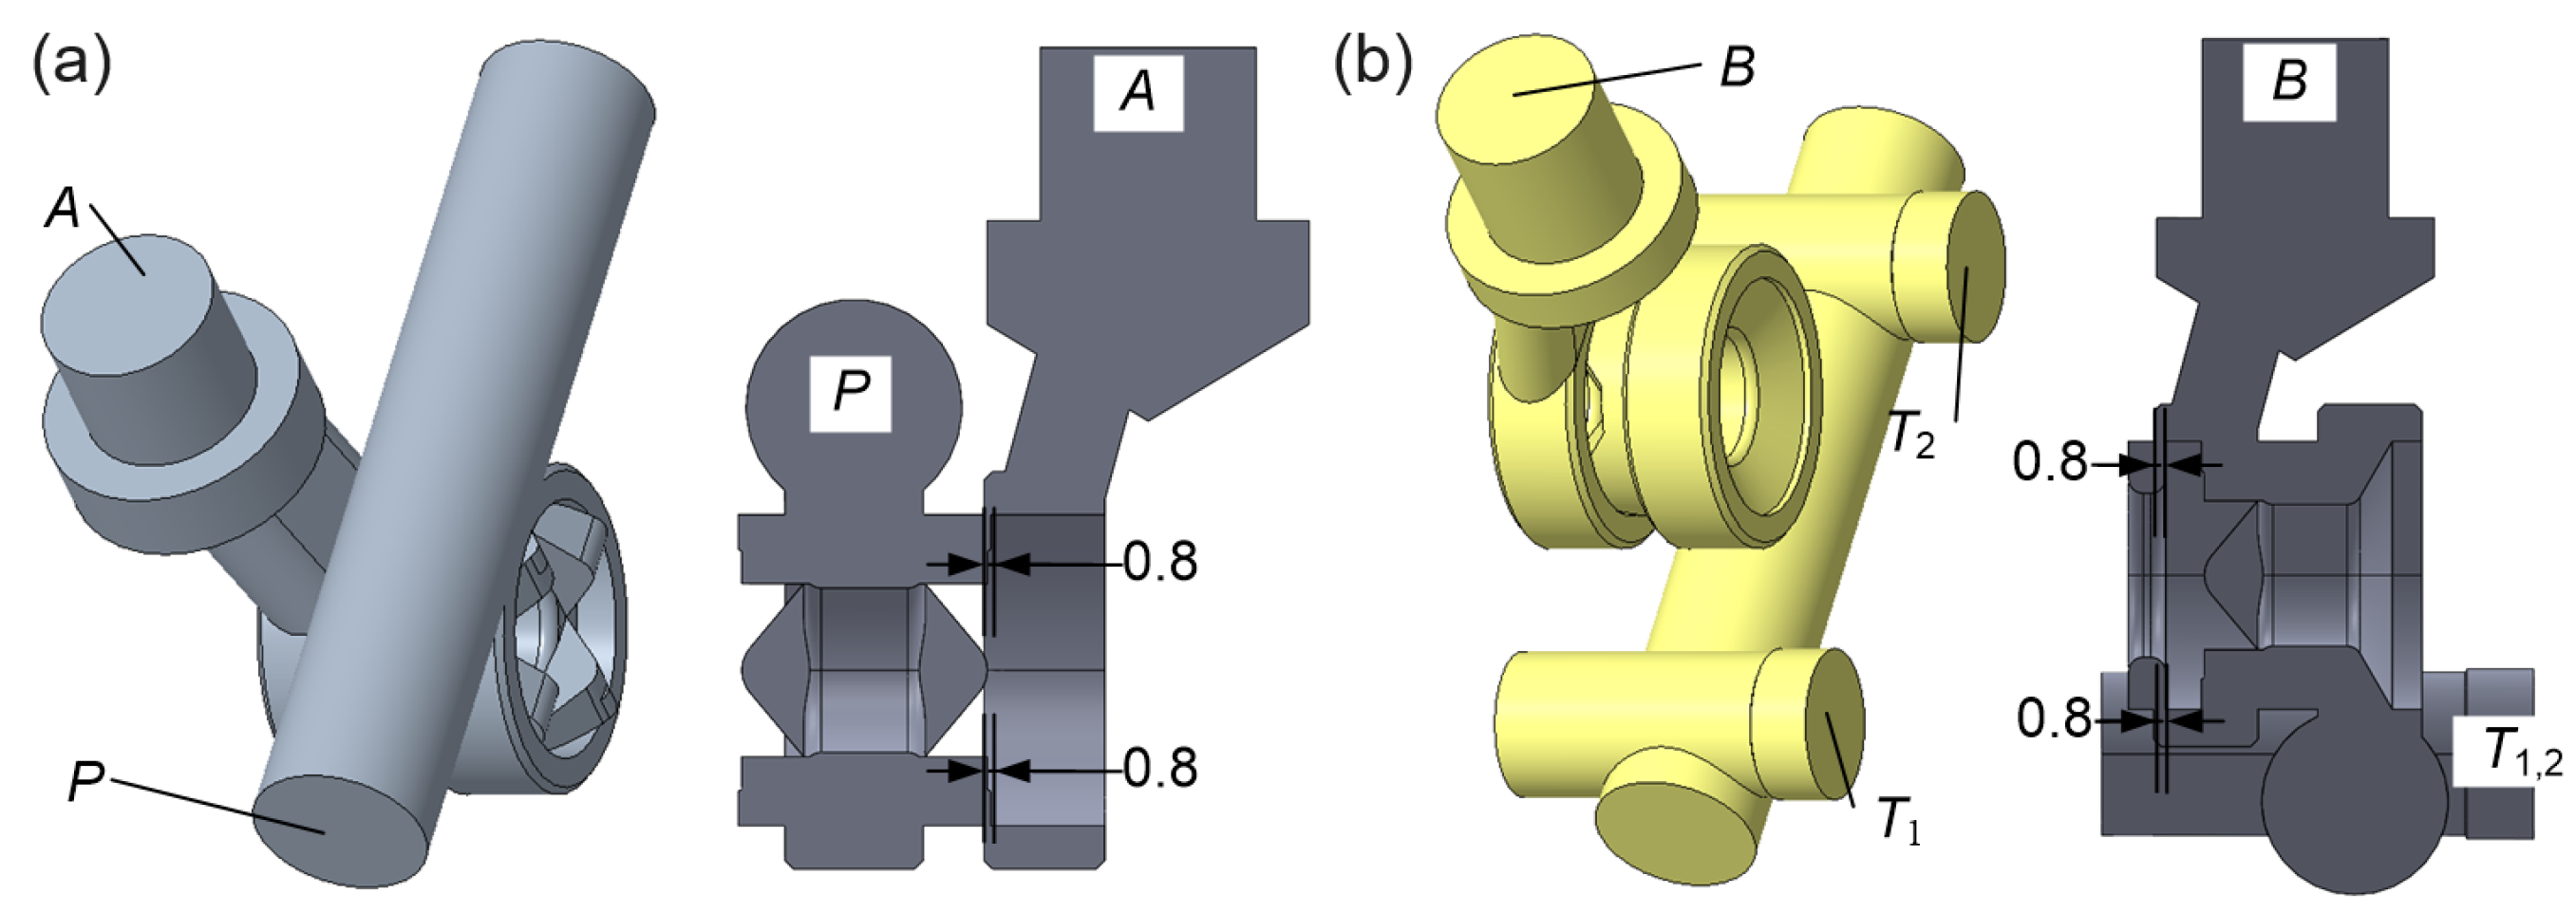
- Due to symmetry, the geometry of the flow channels on the supply side, P–A and P–B, is identical. Similarly, the return channels A–T and B–T have the same geometry. Hence, the analysis was performed for paths P–A and B–T. Examples of geometric models obtained for the E spool version at (gap width: ) are shown in Figure 6;
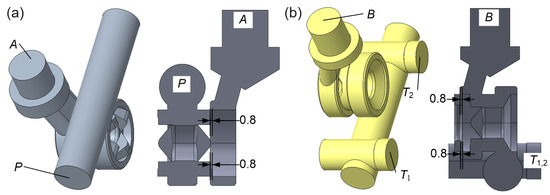 Figure 6. Fluid geometric model: (a) P–A flow path and (b) B–T flow path; P, A, B, , —connection ports.
 - The individual flow paths are geometrically separated. Hence, the analysis could be carried out independently for each of them.
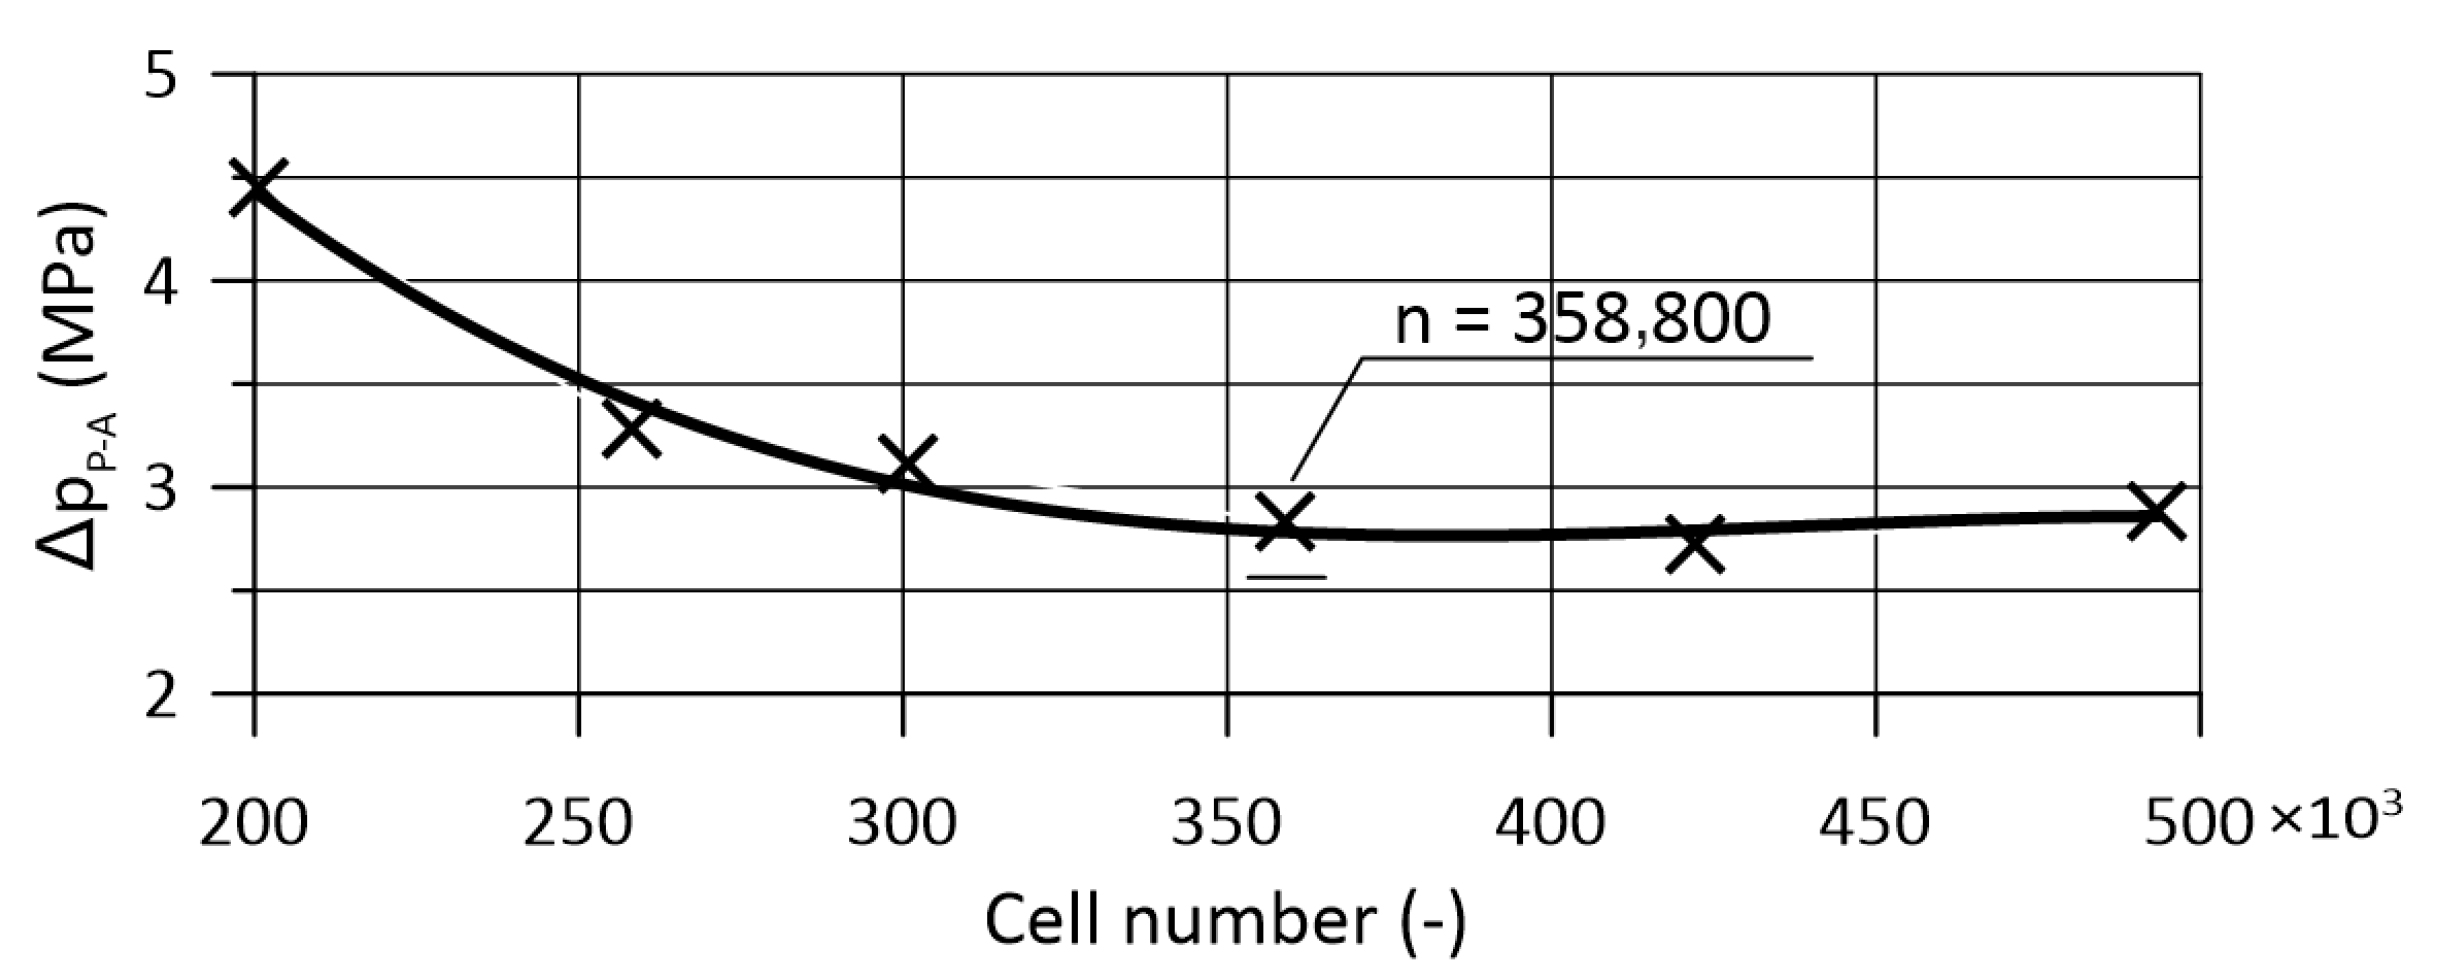
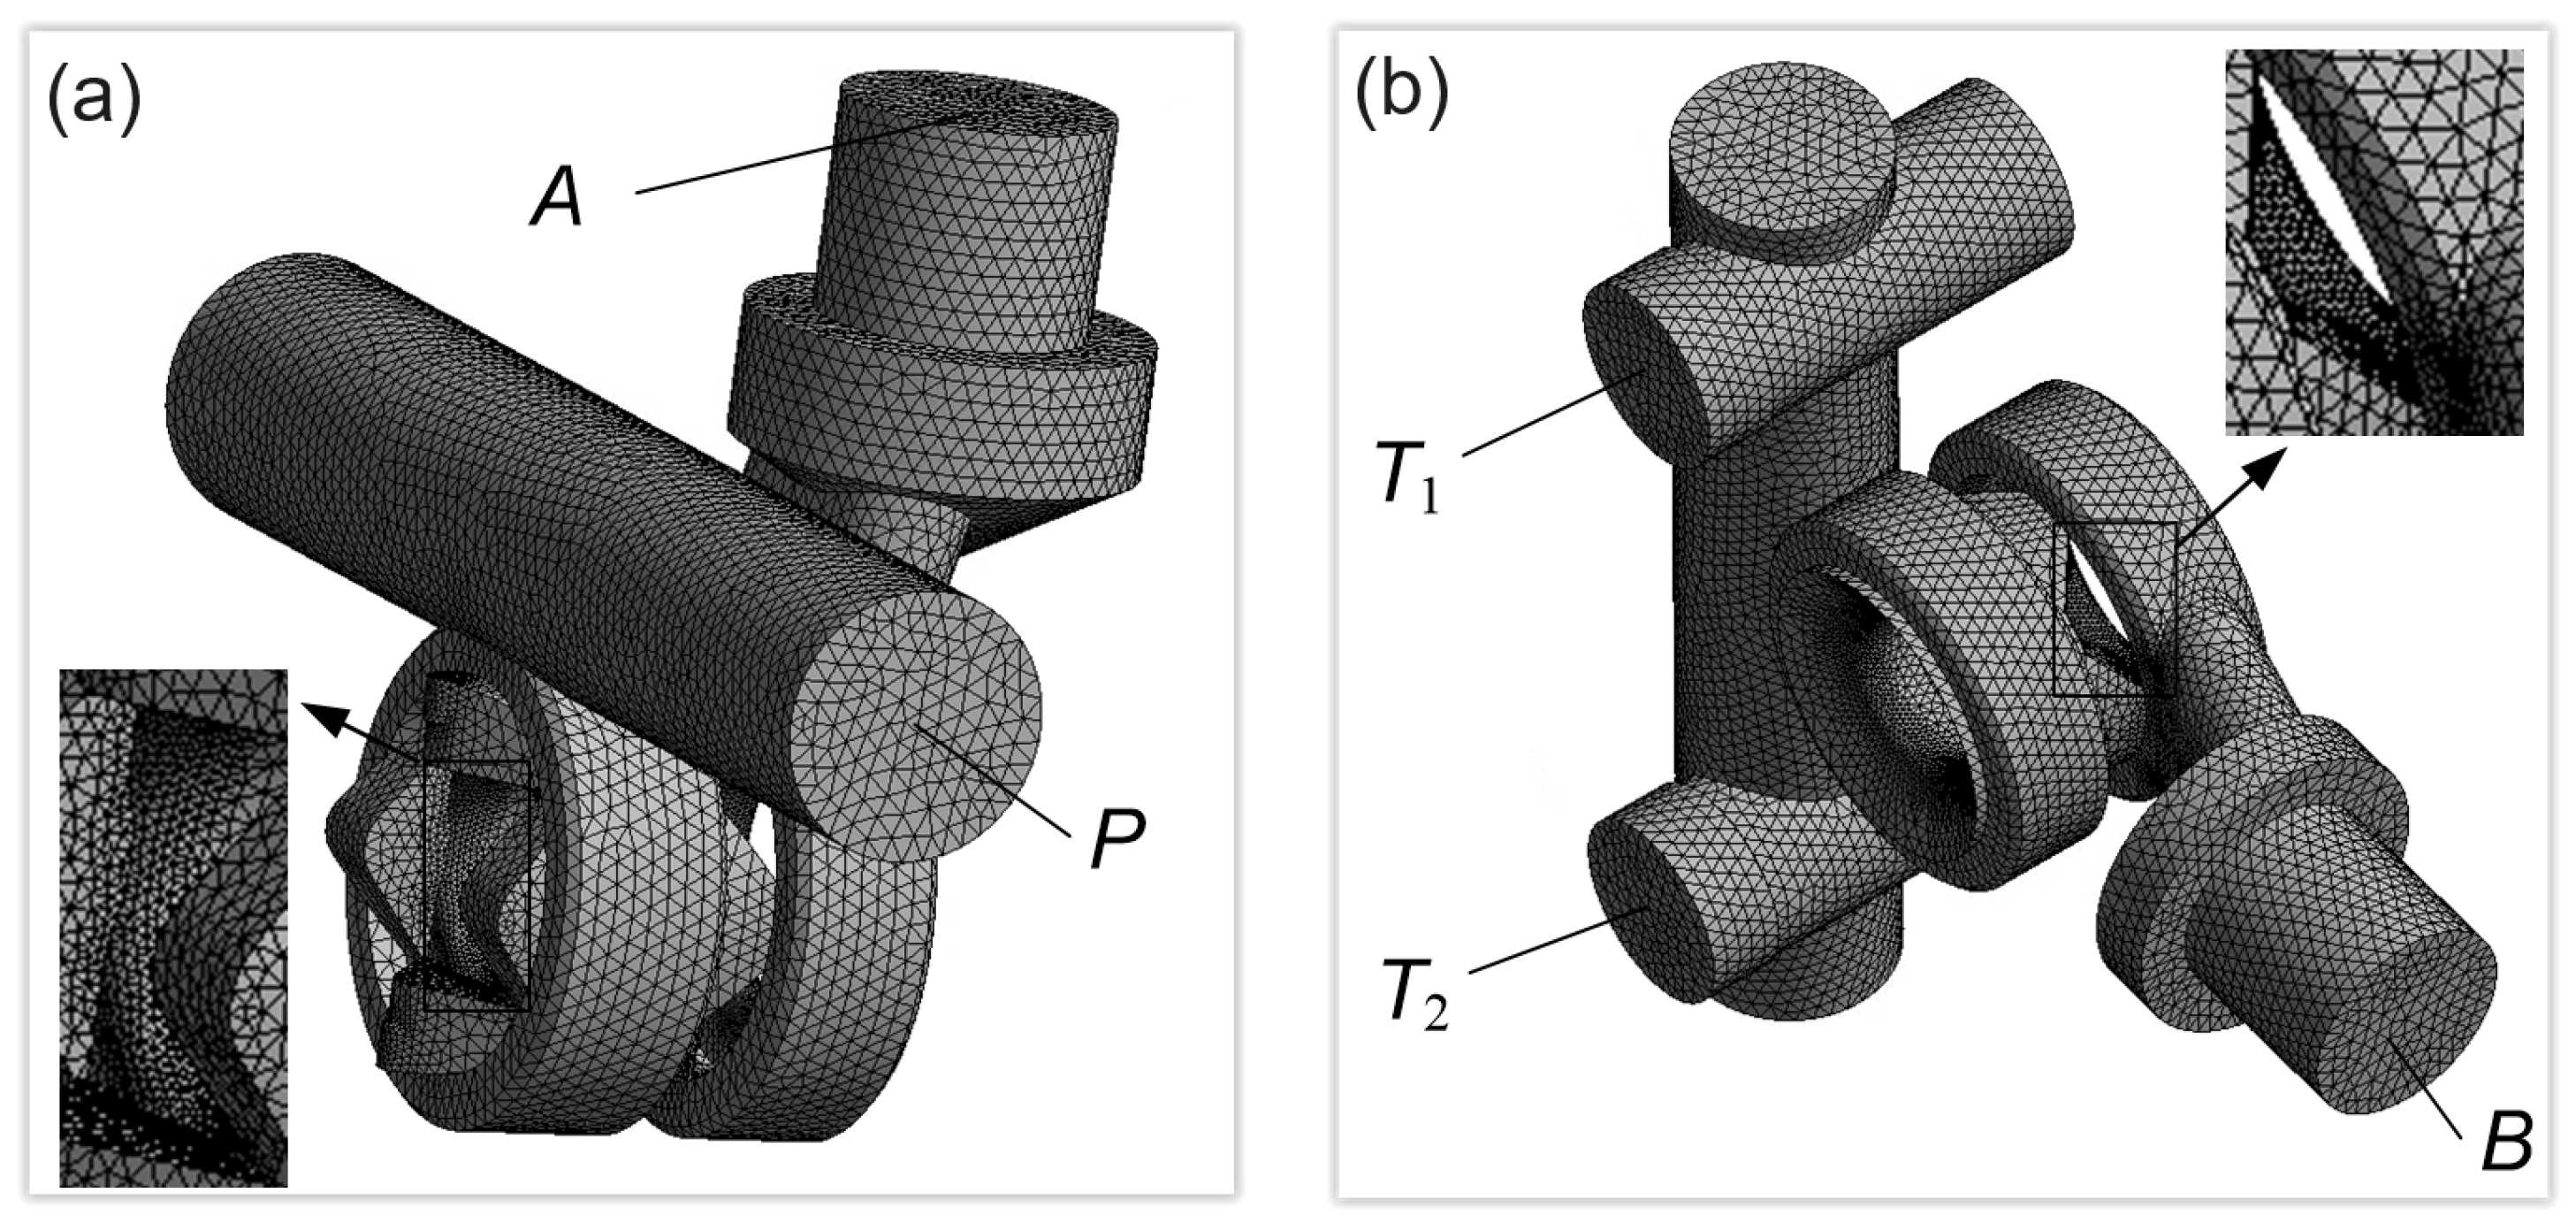
ANSYS/Fluent 2023 was used to create discrete models and conduct CFD analyses. Preliminary simulations aimed at mesh independence validation. The initial number of elements was based on general ANSYS recommendations for element sizes. Pressure–velocity coupling was achieved using the pressure-based solver and segregated algorithm. The maximum allowable absolute values of mass and momentum residuals were determined as . Then, more advanced features as local mesh refinement were used to adjust the mesh density, especially in the flow gap areas. The consecutive simulations for the P–A flow channel with assumed fluid viscosity of , a spool gap of , an input flow rate of , and output pressure of were conducted. Figure 7 shows the grid independence test results in the form of pressure drop calculations obtained with a gradually increased number of elements, resulting in a higher mesh density. Finally, a model containing thousand elements and 120 thousand nodes was selected for further simulations (Figure 8). The following mesh quality parameters were achieved: a minimum orthogonal quality of , a maximum aspect ratio not exceeding , and a maximum skewness of with a mean value of , respectively.
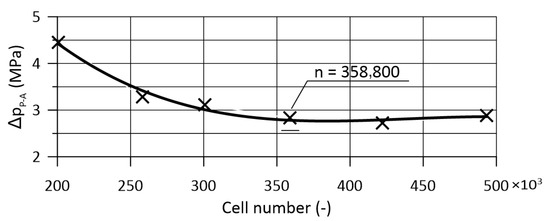
Figure 7.
Mesh quality assessment: function of pressure drop against node number.
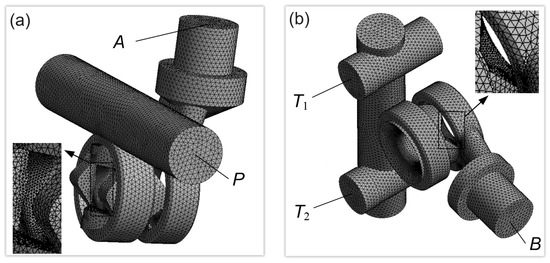
Figure 8.
Meshed fluid model with refined areas: (a) P–A flow path and (b) B–T flow path.
Similarly, discrete models were made for the subsequent widths of the spool flow gap. In total, they included , and .
The boundary conditions for the CFD simulation were defined as follows:
- Input: Fluid velocity with the specification method as normal to the boundary. The velocity was determined by setting the input flow rate;
- Output: Static pressure. A gauge pressure equal to was assigned.
3.2. Turbulence Model Configuration
To determine the character of the flow through the valve, the Reynolds number was first estimated for given ranges of the flow rate and the spool gap size. Values ranging from to 13,600 were obtained, so the k– turbulent flow model was adopted. Multiple variants of this model have been successfully used in numerous publications [2,3,4,5,13,16,18] when the main goal was to model the bulk flow, taking into account the boundary layers, but without analyzing them in detail. The used model is based on two transport equations related to the kinetic energy of turbulence, k, and the dissipation factor, , computed from the following transport equations [13,22]:
In the transport equations, models the increase in the turbulence kinetic energy due to the gradient of average velocities, is the energy generated via buoyancy, and is the energy associated with the fluid compressibility. The k and values are calculated based on the intensity, I, and the length scale, ℓ, parameters (Table 1). The required model constants were assigned values recommended by ANSYS: , , , , and . In turn, and are Pandtl numbers, respectively. The system of equations was closed using the formula determining the turbulent intensity, :

Table 1.
CFD model parameters.
3.3. Equations of Fluid Flow through the Valve
The flow rate through the valve gaps, in both directions, P–A and B–T, was determined with Equation (5). The cross-sectional area of the gap against the spool position was approximated using Equation (1). Then, static CFD analyses were used to compute pressure drops for the selected fixed spool positions and input flow rates, outlined in Table 2 and Table 3, for the P–A and B–T directions, respectively. The flow coefficient, , was estimated based on the obtained values. Due to the close results in both directions, the average value of was adopted for further analyses.

Table 2.
Pressure drop (MPa) in the P–A direction against flow rate Q and gap width .

Table 3.
Pressure drop (MPa) in the B–T direction against flow rate Q and gap width .
The valve spool movement is determined by a balance of forces, which includes electromagnet force , viscous friction , spring force , and flow force [3]:
The electromagnet force is proportional to the control signal u:
Viscous friction can be determined based on spool velocity:
Spring force includes initial tension and a component related to the spool position:
Flow force estimation is the most challenging assignment due to the complexity of flow-related phenomena. Usually, it is calculated based on the momentum conservation equation: . In the steady state, the velocity vectors may be considered constant. Hence, the equation can be written as follows:
where and are velocity vectors at the output and input of the valve gap, respectively. As mentioned earlier, the spool geometry was shaped so that the velocity vector at the entrance to the throttling gap was set in the radial direction as much as possible. Hence, the axial component that influences the movement of the valve spool depends mainly on the direction of the fluid stream at the outlet:
The average fluid velocity, , can be determined using Equation (5), dividing the flow rate, , by the gap area, .
3.4. Results of CFD Analysis
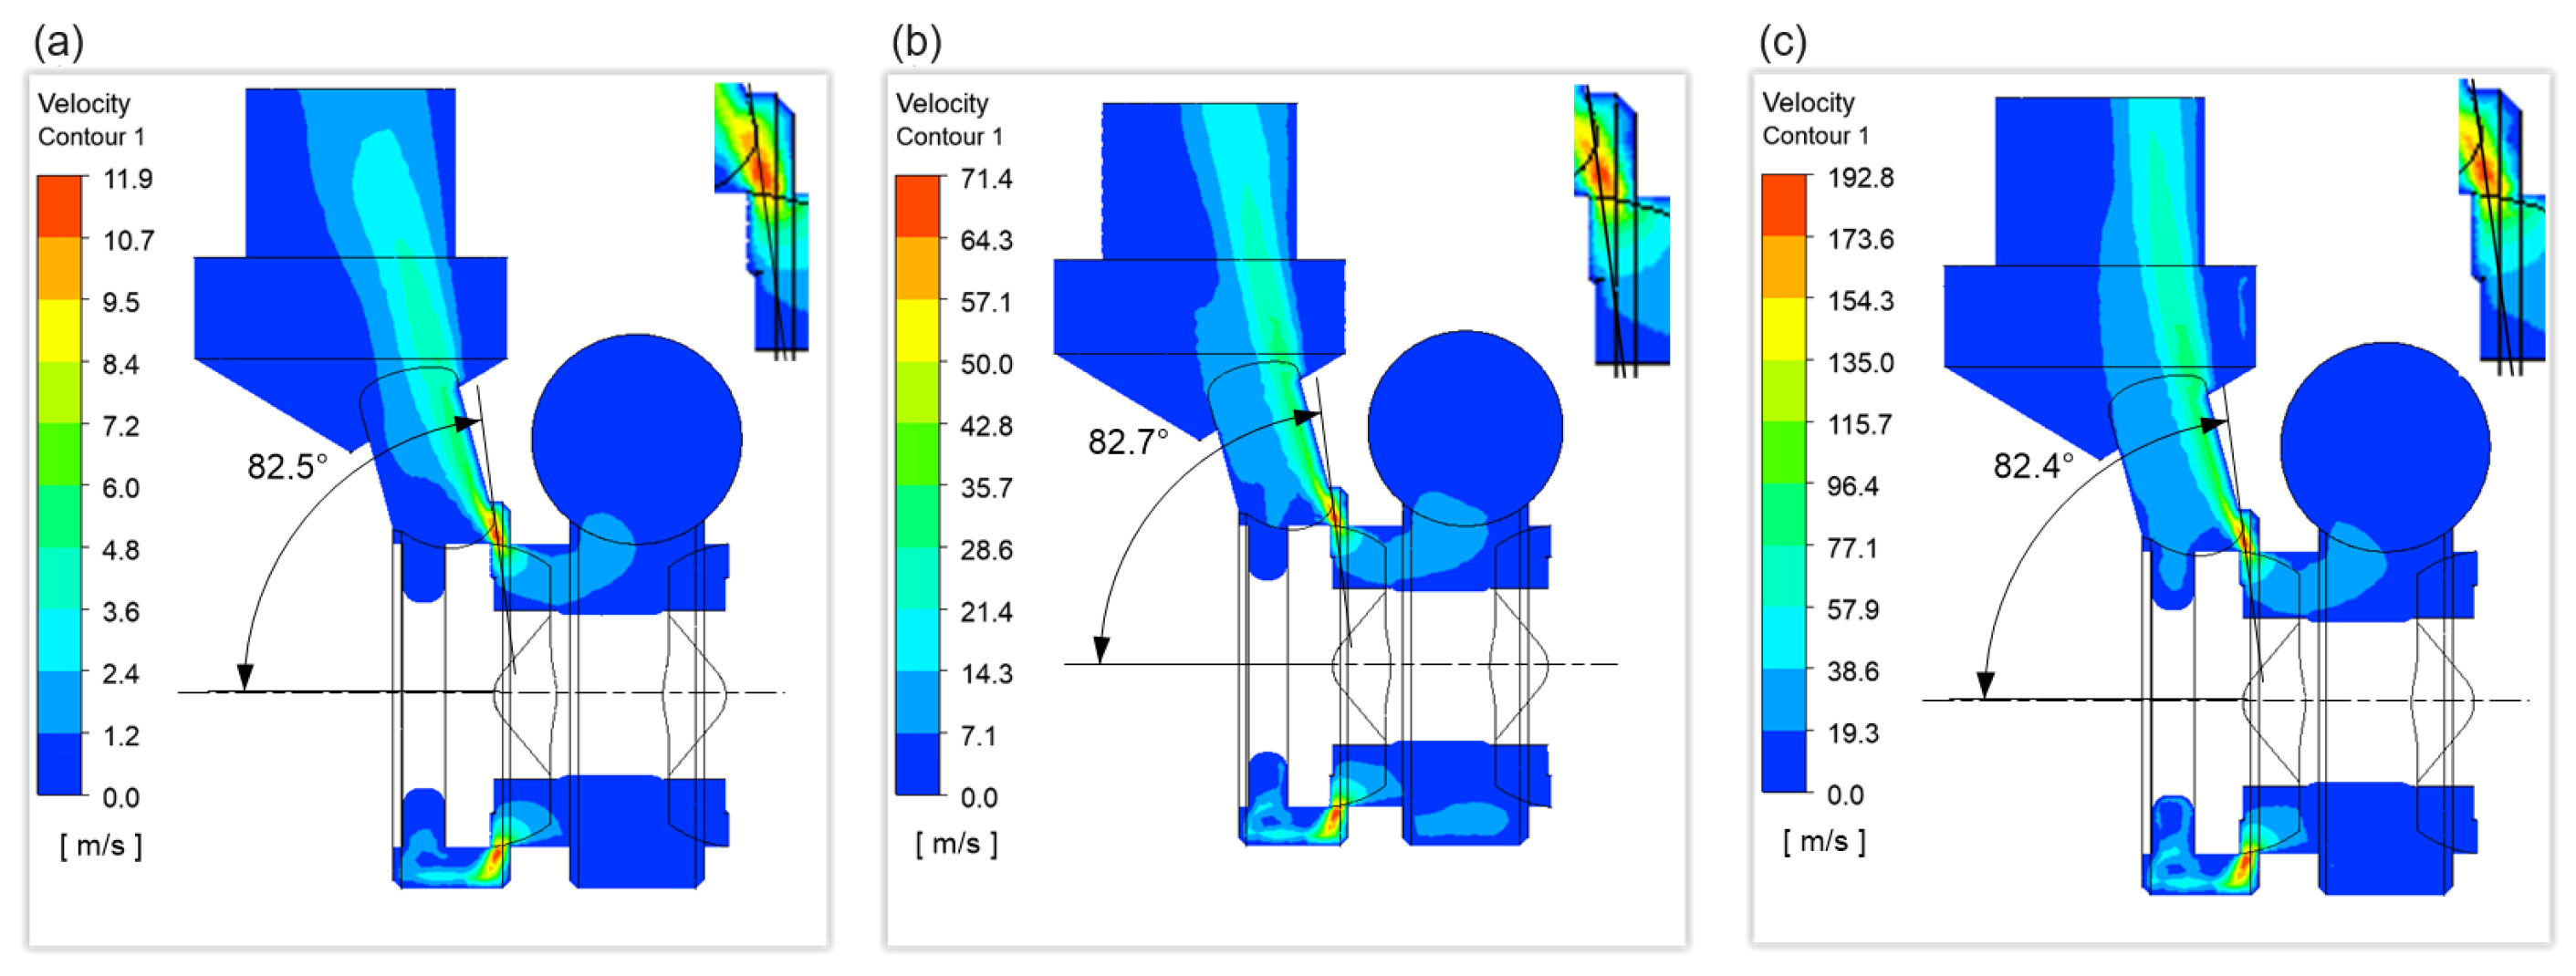
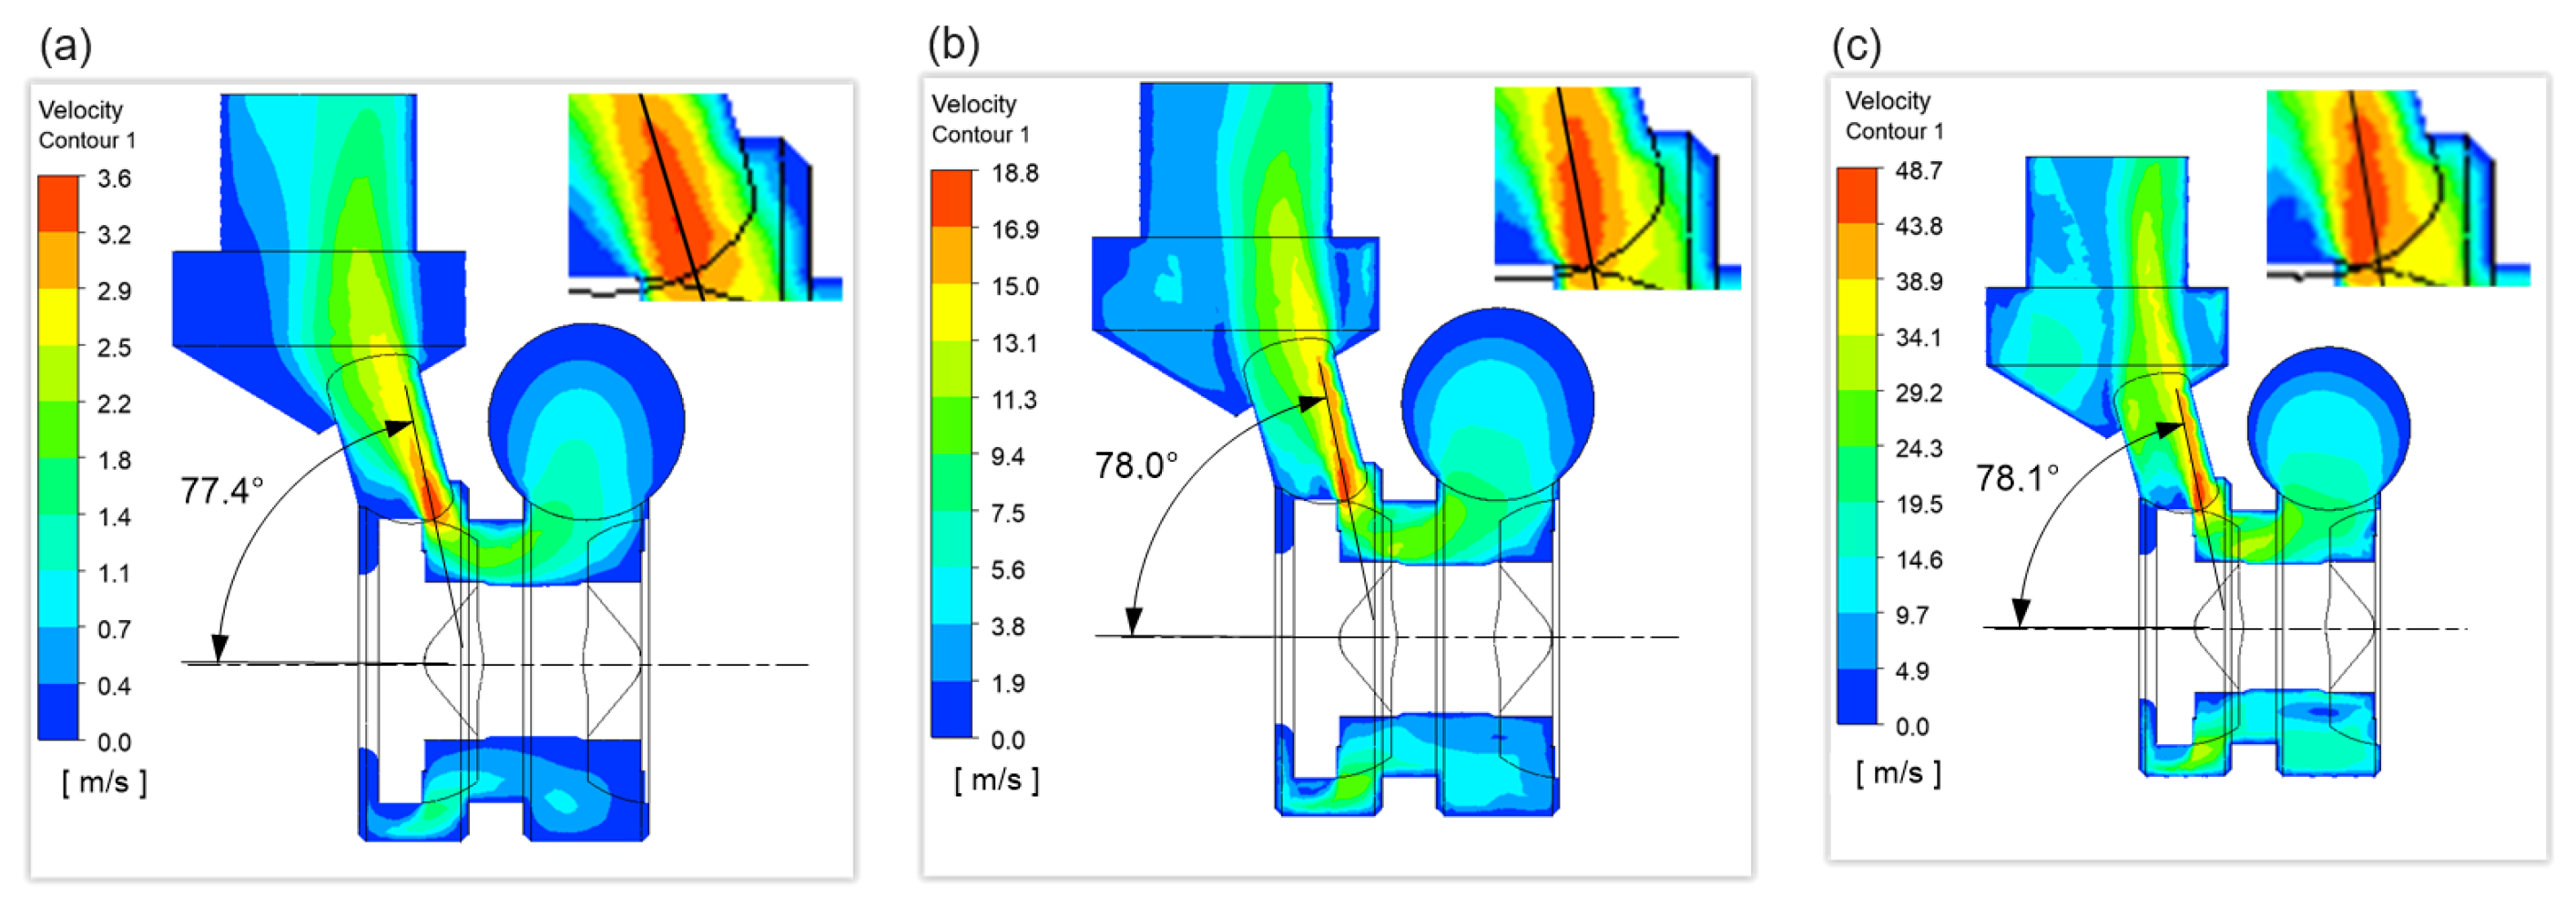
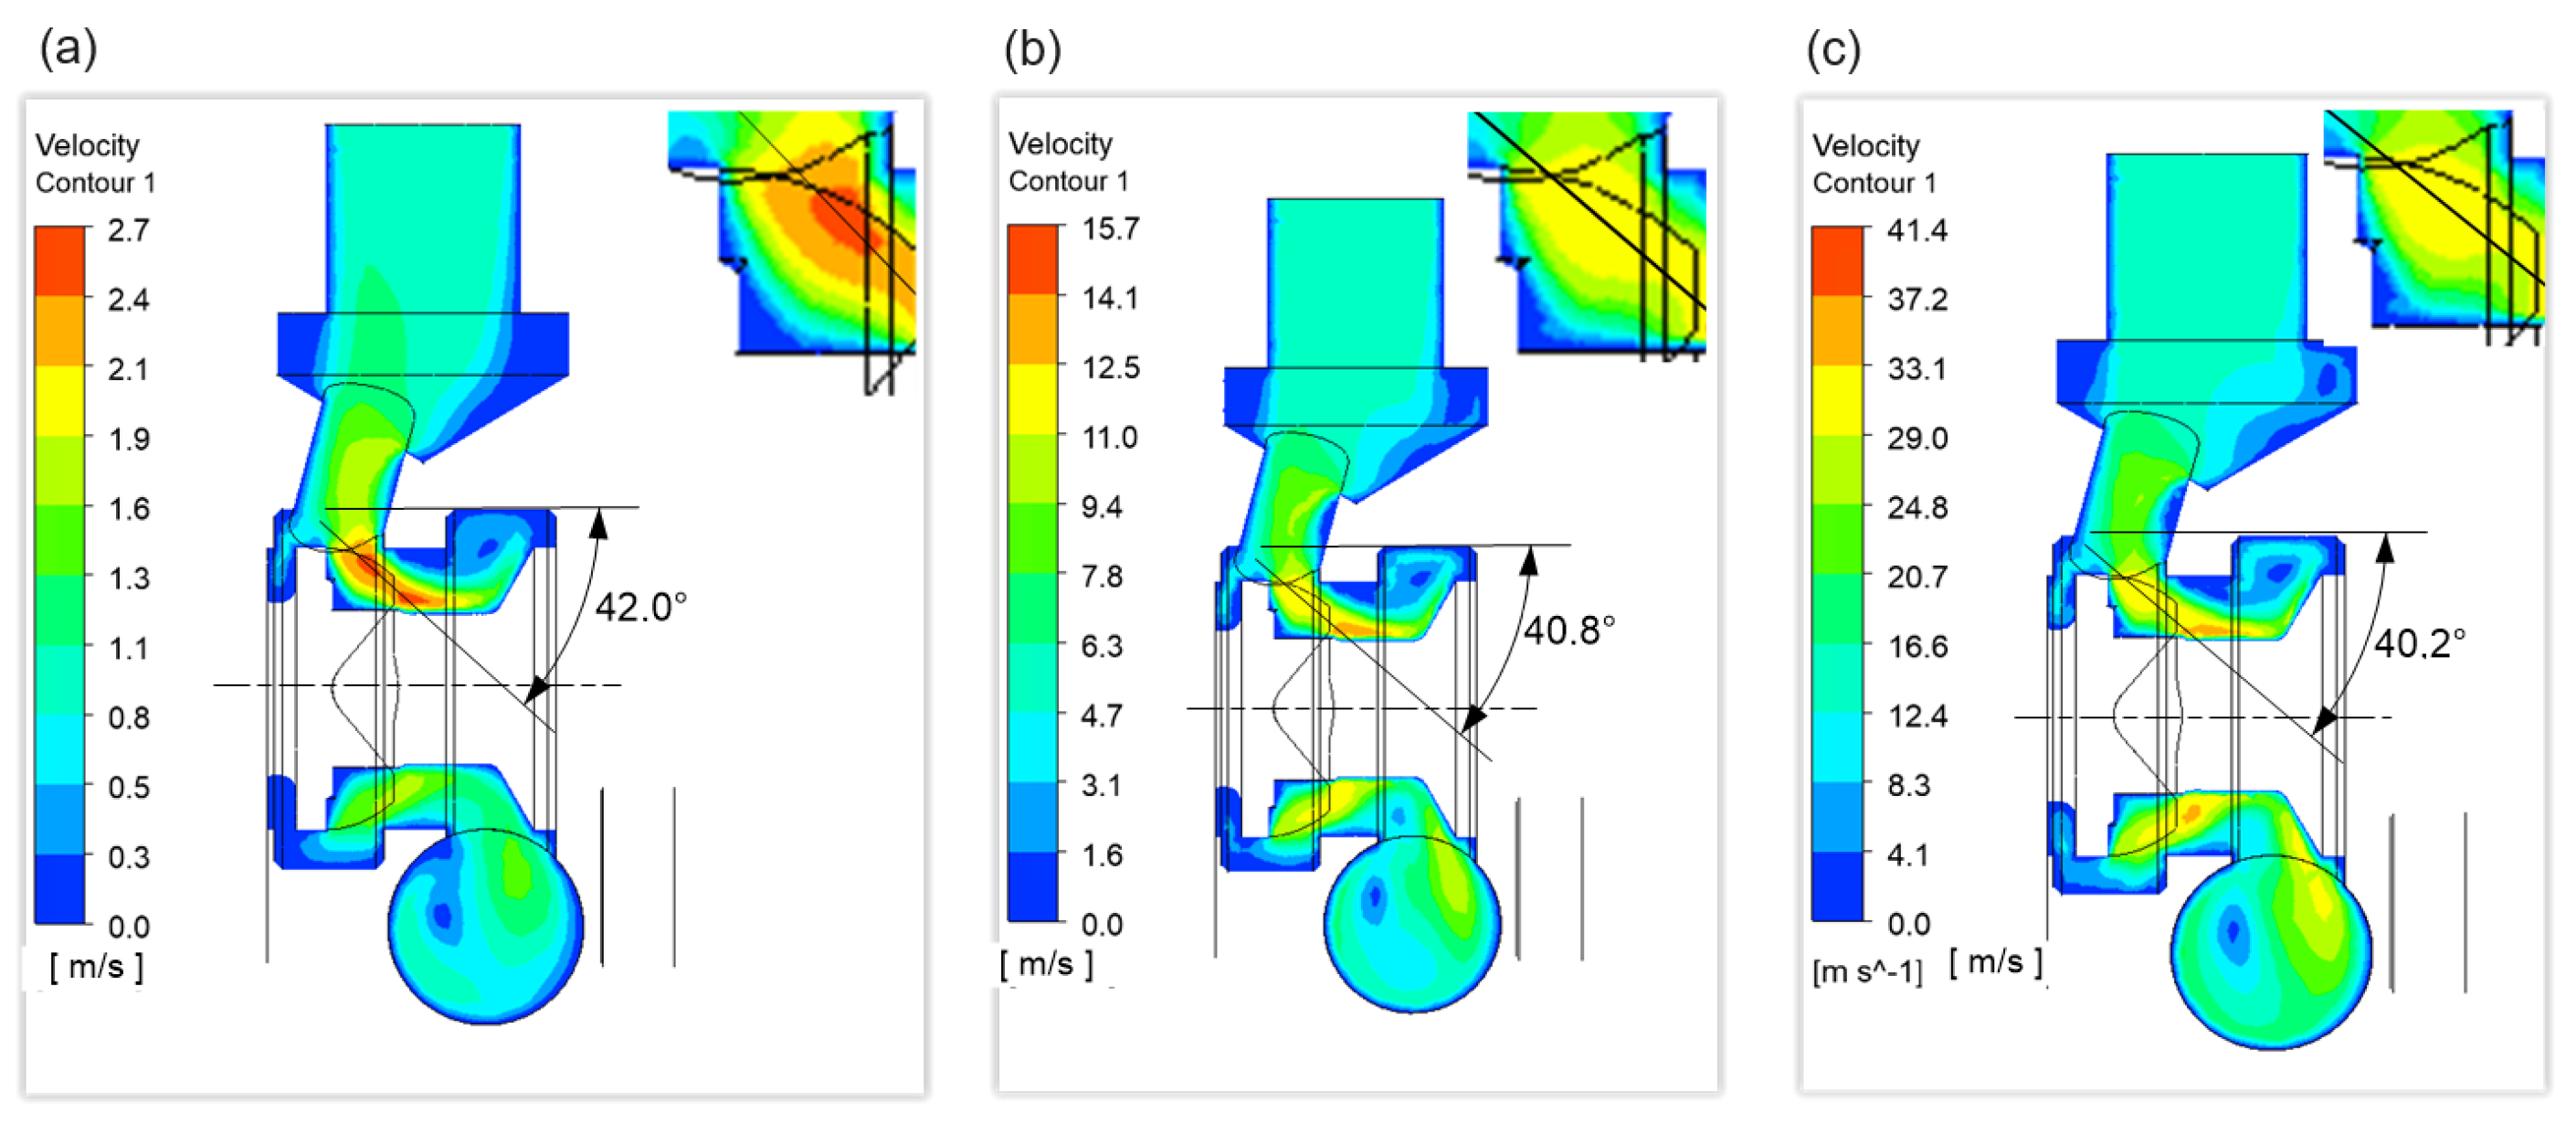
Closing the mathematical model required determining the value of . This work uses velocity distributions obtained from CFD analysis to determine average values against the spool position: . The figures show the sample results for P–A, including velocity distributions at flow rates of . Figure 9 refers to the slot width of , while Figure 10 concerns the value .
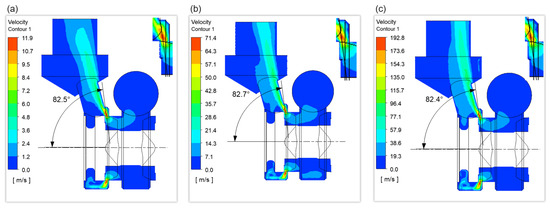
Figure 9.
Velocity distribution on the P–A flow path with a gap width of : (a) , (b) , and (c) .
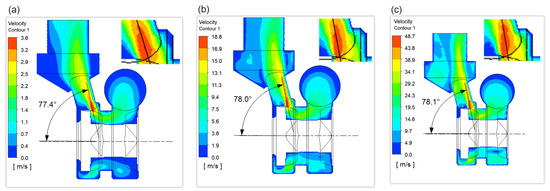
Figure 10.
Velocity distribution on the P–A flow path with a gap width of : (a) , (b) , and (c) .
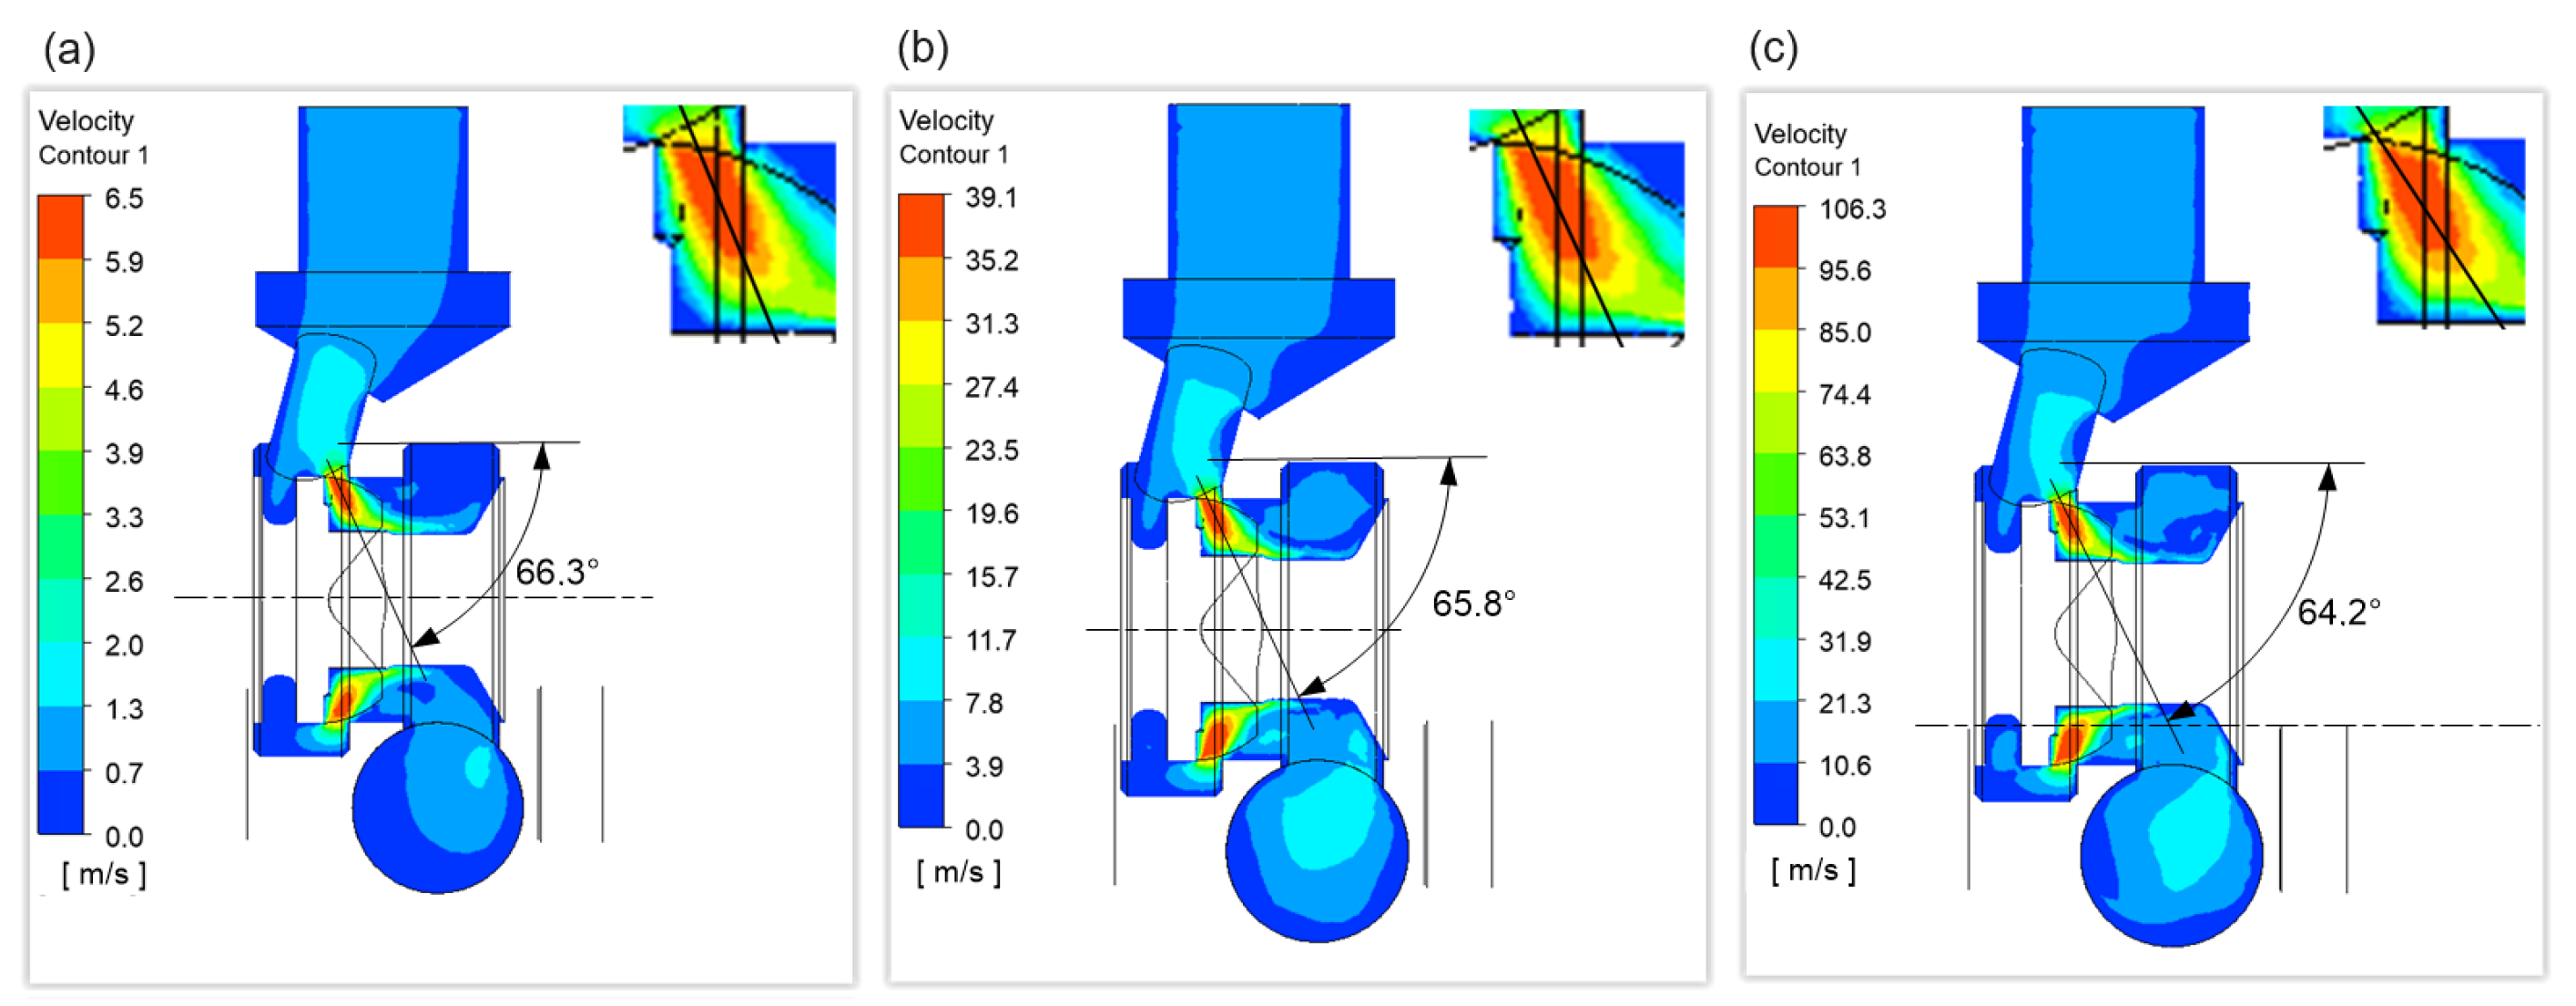
Analogous results obtained for B–T and the same spool positions are shown in Figure 11 and Figure 12.
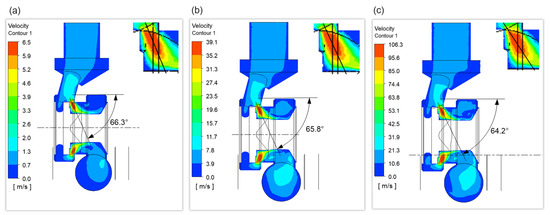
Figure 11.
Velocity distribution on the B–T flow path with a gap width of : (a) and (b) , (c) .
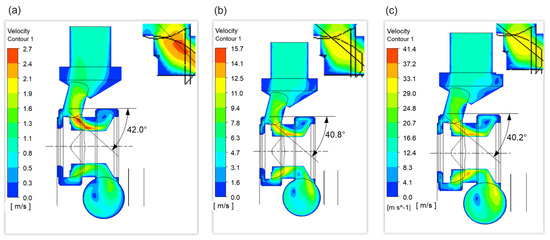
Figure 12.
Velocity distribution on the B–T flow path with a gap width of : (a) and (b) , (c) .
Based on the CFD results, the function of against the spool position () was approximated to the following linear relations:
4. Results: Valve Characteristics
The flow and control characteristics of the valve were determined in simulation tests using a previously defined mathematical model and then verified on a laboratory test bench.
4.1. Building a Simulation Model
By solving the system of equations consisting of the flow formulas and the spool movement, supplemented with the mass conservation equation formulated for the supply line (Equation (16)) and the parameter values collected in Table 4, it is possible to determine the flow characteristics.

Table 4.
Simulation model parameters.
In the above equation, to determine the supply pressure, p, the flow balance of pump delivery, , the relief valve flow, , and the control valve inflow, Q, is formulated. Furthermore, B stands for the bulk modulus, and V is the fluid volume.
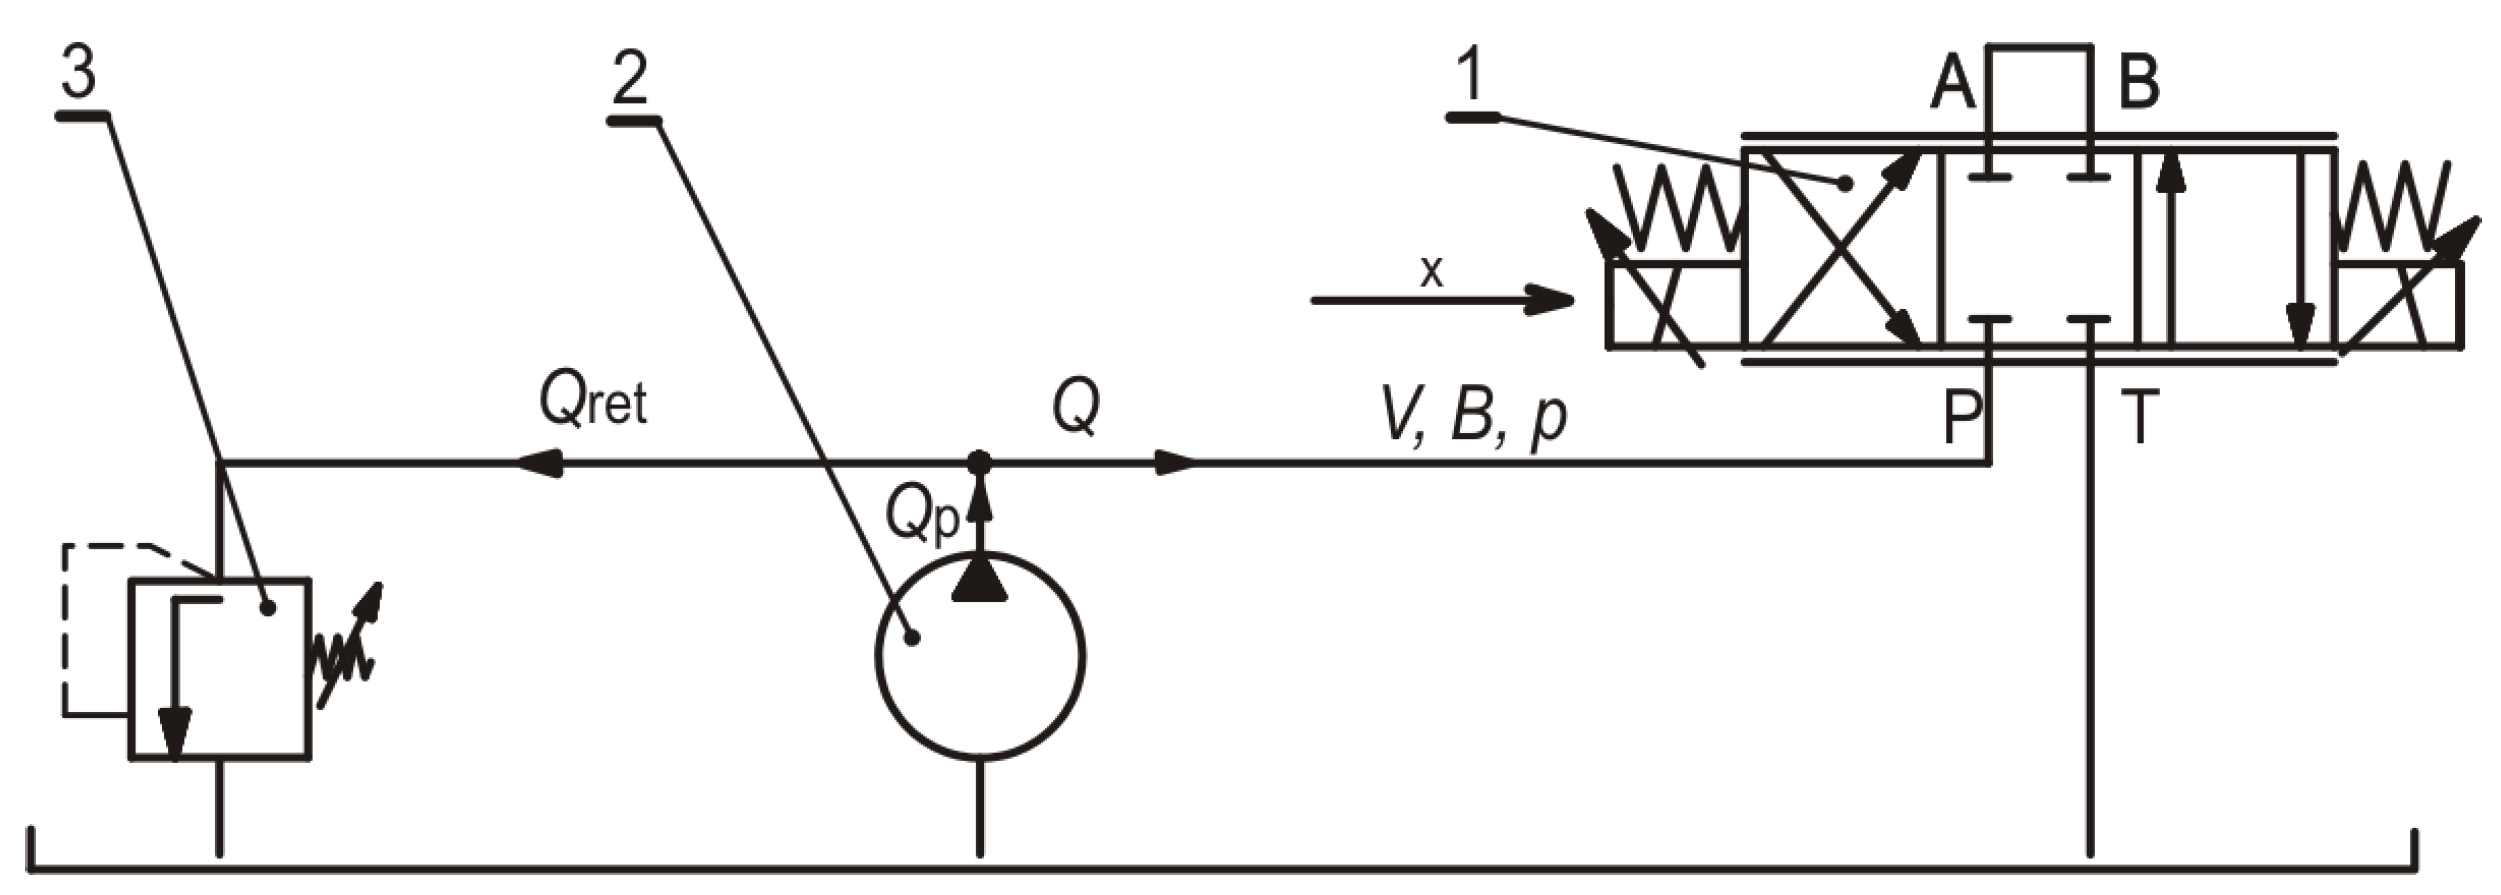
The flow characteristics of a single valve section were determined individually using numerical analysis for each of the considered flow paths. The simulation model was built in the Matlab-Simulink R2023b environment according to the scheme shown in Figure 13. The fixed speed pump, 2, supplies the tested valve, 3. The pressure in the supply line is set using the adjustable relief valve, 1, while the electromagnet force is set by applying the appropriate current intensity.
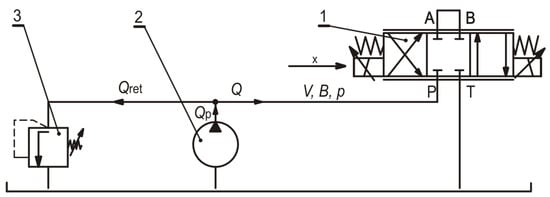
Figure 13.
Diagram of the system for studying the flow characteristics of a single valve section: 1—tested valve, 2—pump, and 3—relief valve.
4.2. Selection of Spring Stiffness
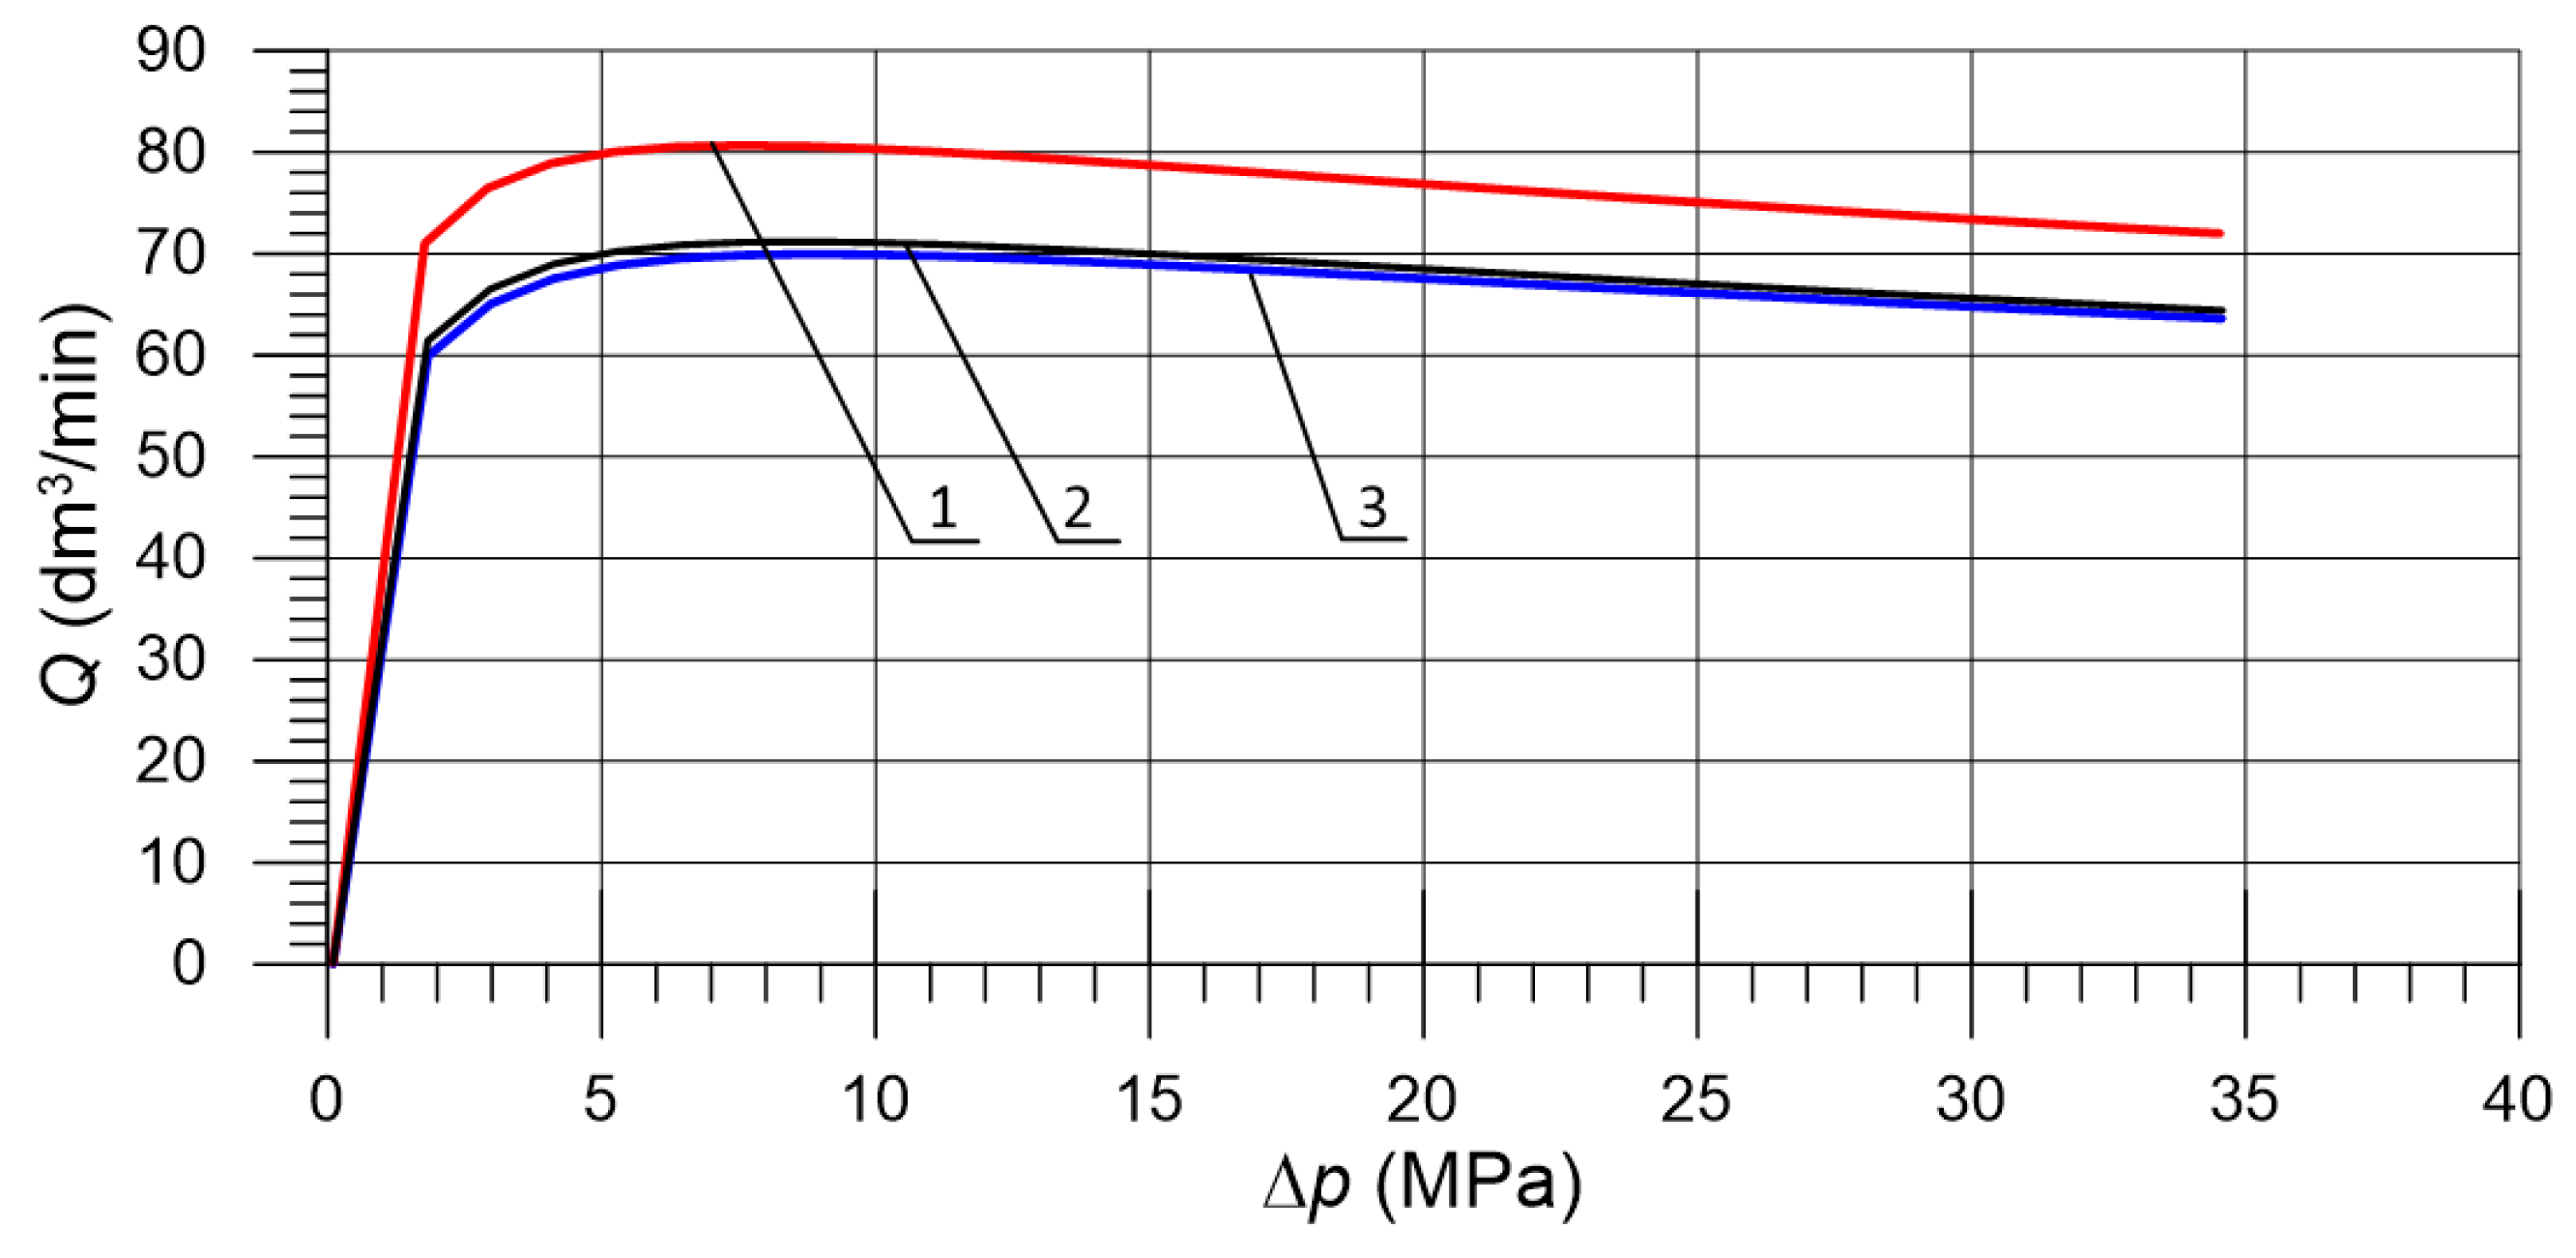
The valve with both spool versions, E and W, was tested with three types of springs at different values of initial tension. Figure 14 shows the flow characteristics for a fixed electromagnet current intensity value of and (1)—stiffness of and initial tension of , (2)— and , and (3)— and , respectively. As can be observed from the presented characteristics, after exceeding the threshold pressure value, the value of the volumetric flow rate changes only to a small extent for all springs. The use of the most flexible spring (1) results in the highest flow rate with a lower pressure drop and a subsequent gradual flow rate decrease as the pressure rises. In this case, the difference in the flow rate over the entire pressure range is approximately 25%. In the case of spring (2), an almost constant flow rate was obtained in the range of = 5–15 and then it slightly decreased, by approx. 9%. In turn, the stiffest spring (3) provided a constant flow rate at a larger , in the range of 10–30 .
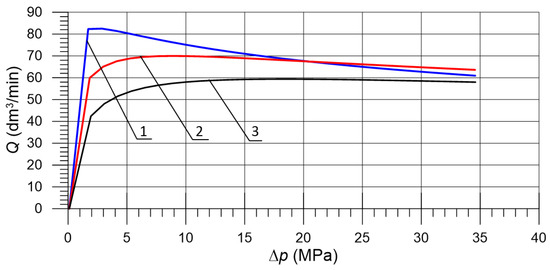
Figure 14.
Flow characteristics with different springs: 1—flexible, 2—regular, and 3—stiff.
4.3. Flow Characteristics at a Fixed Current Intensity
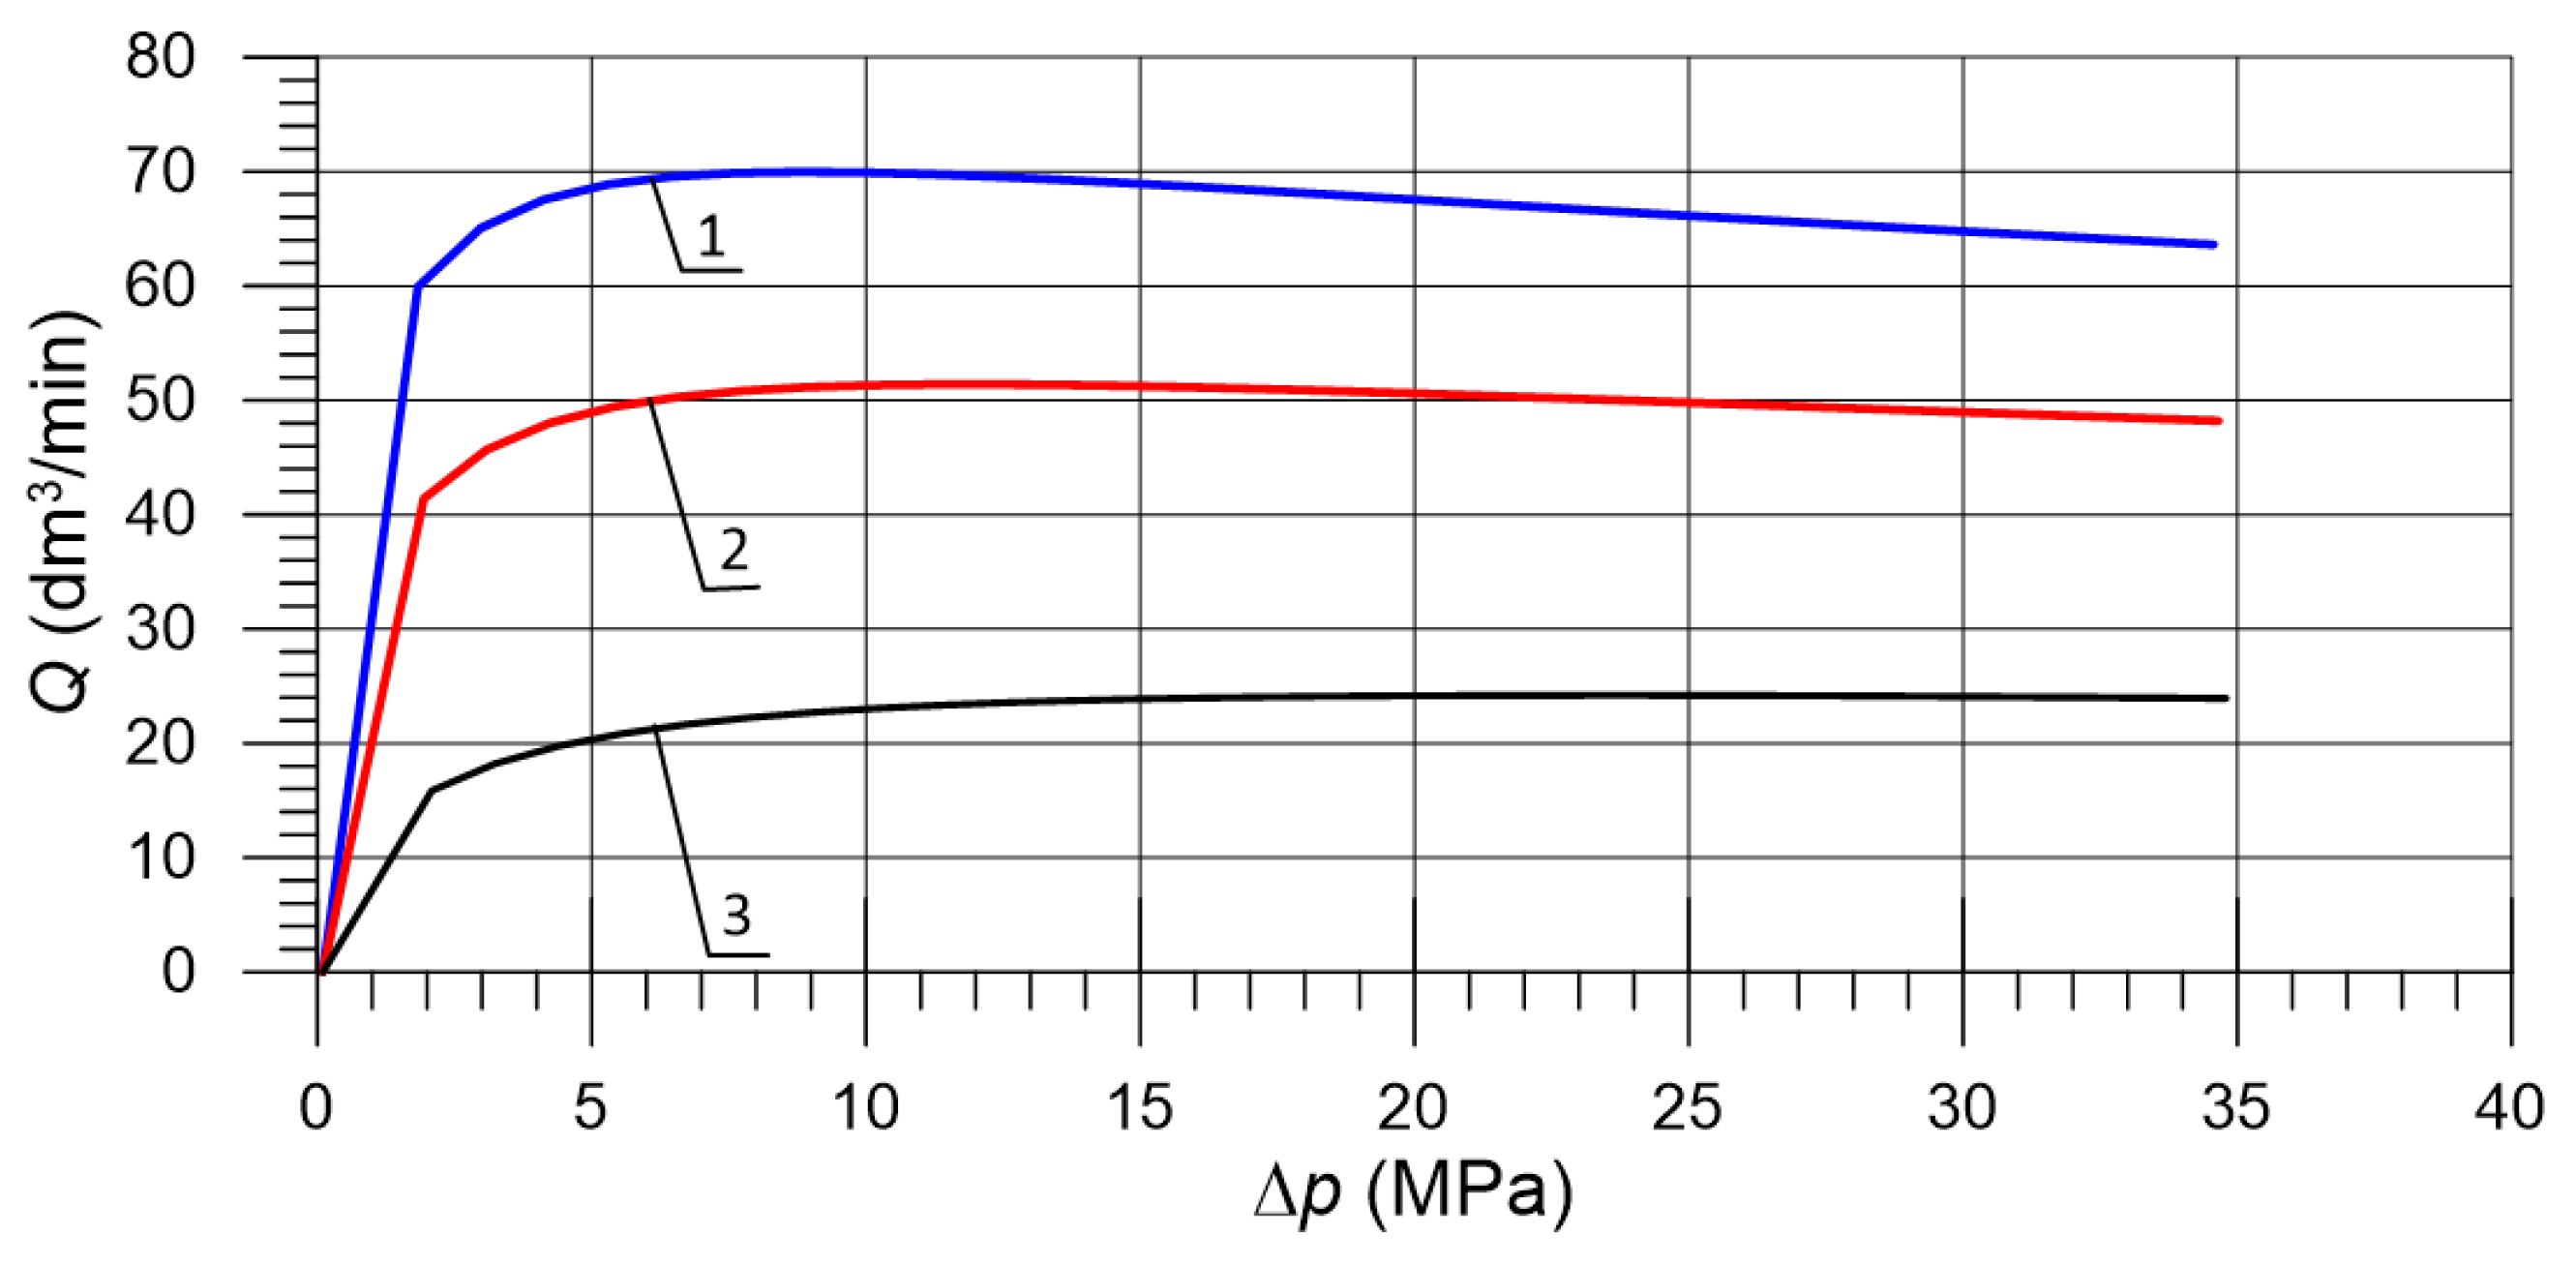
By changing the value of the electromagnet current, one can set the volumetric flow rate in a wide range. Figure 15 shows the flow control characteristics of the valve with the E spool against the pressure drop for different values of electromagnet current intensity. The characteristics were obtained for a spring stiffness of , an initial tension of , and , respectively. As the graph shows, setting a constant current in the system allows the operator to obtain a constant volumetric flow rate for the required value, regardless of the pressure drop.
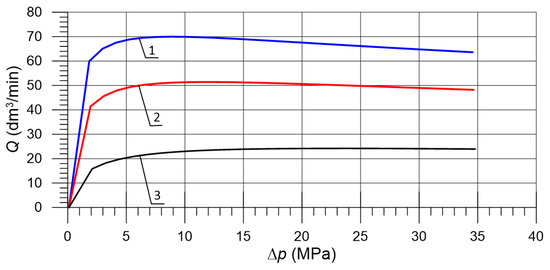
Figure 15.
Flow characteristics for fixed current intensity: 1— , 2— , and 3— .
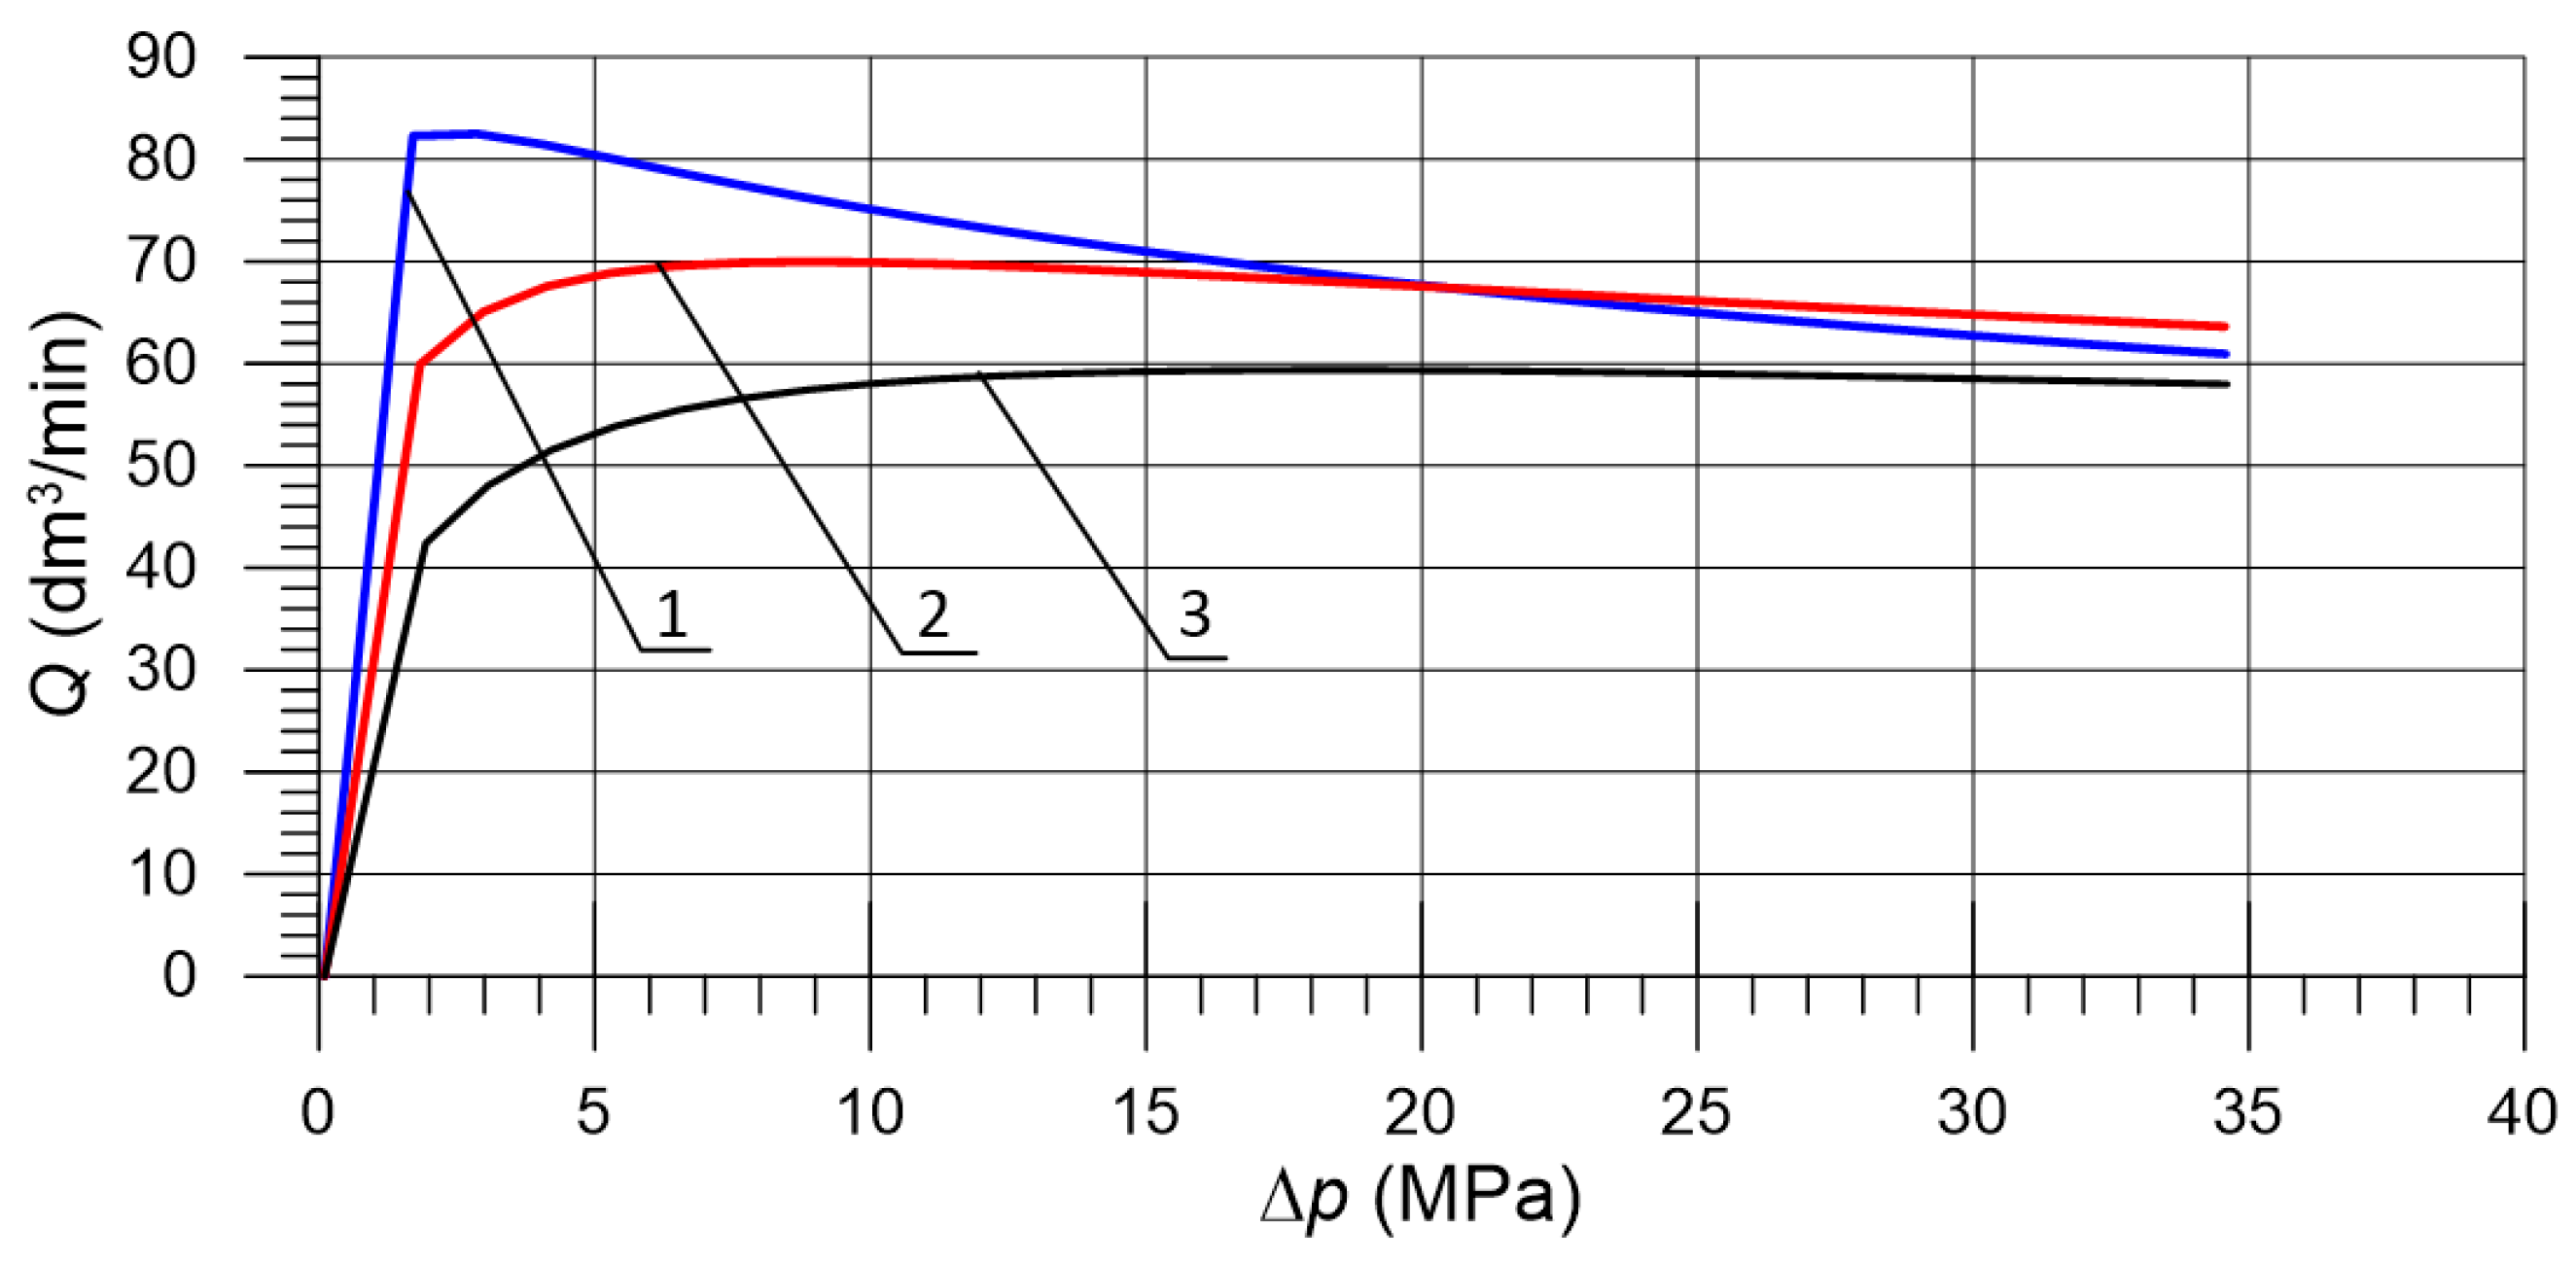
Similarly, the valve analysis with the W spool was carried out. In this case, there was only a difference in the gap size as a function of the spool displacement. Figure 16 compares the flow characteristics through the E and W spools for identical parameters, except that the W spool generates a higher flow at the same position due to the negative overlap. However, the nature of the flow rate course against pressure drop does not change, which means that very close flow characteristics can be obtained for both spool versions by correcting the control signal. It arises from Figure 16 that the characteristics of the valve with the W spool and current intensity reduced to results in an almost identical course, as in the case of the E spool at the maximum values, . The application of the W spool increases the maximum flow by approximately 10–12%.
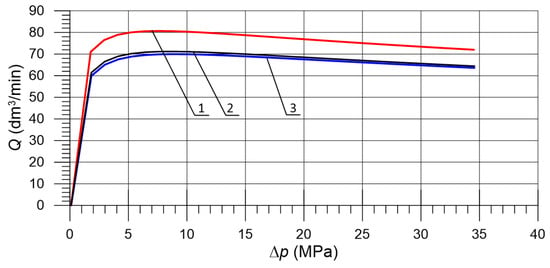
Figure 16.
Flow characteristics with different spools: 1—type W, , 2—type W, , and 3—type E, .
4.4. Control Characteristics
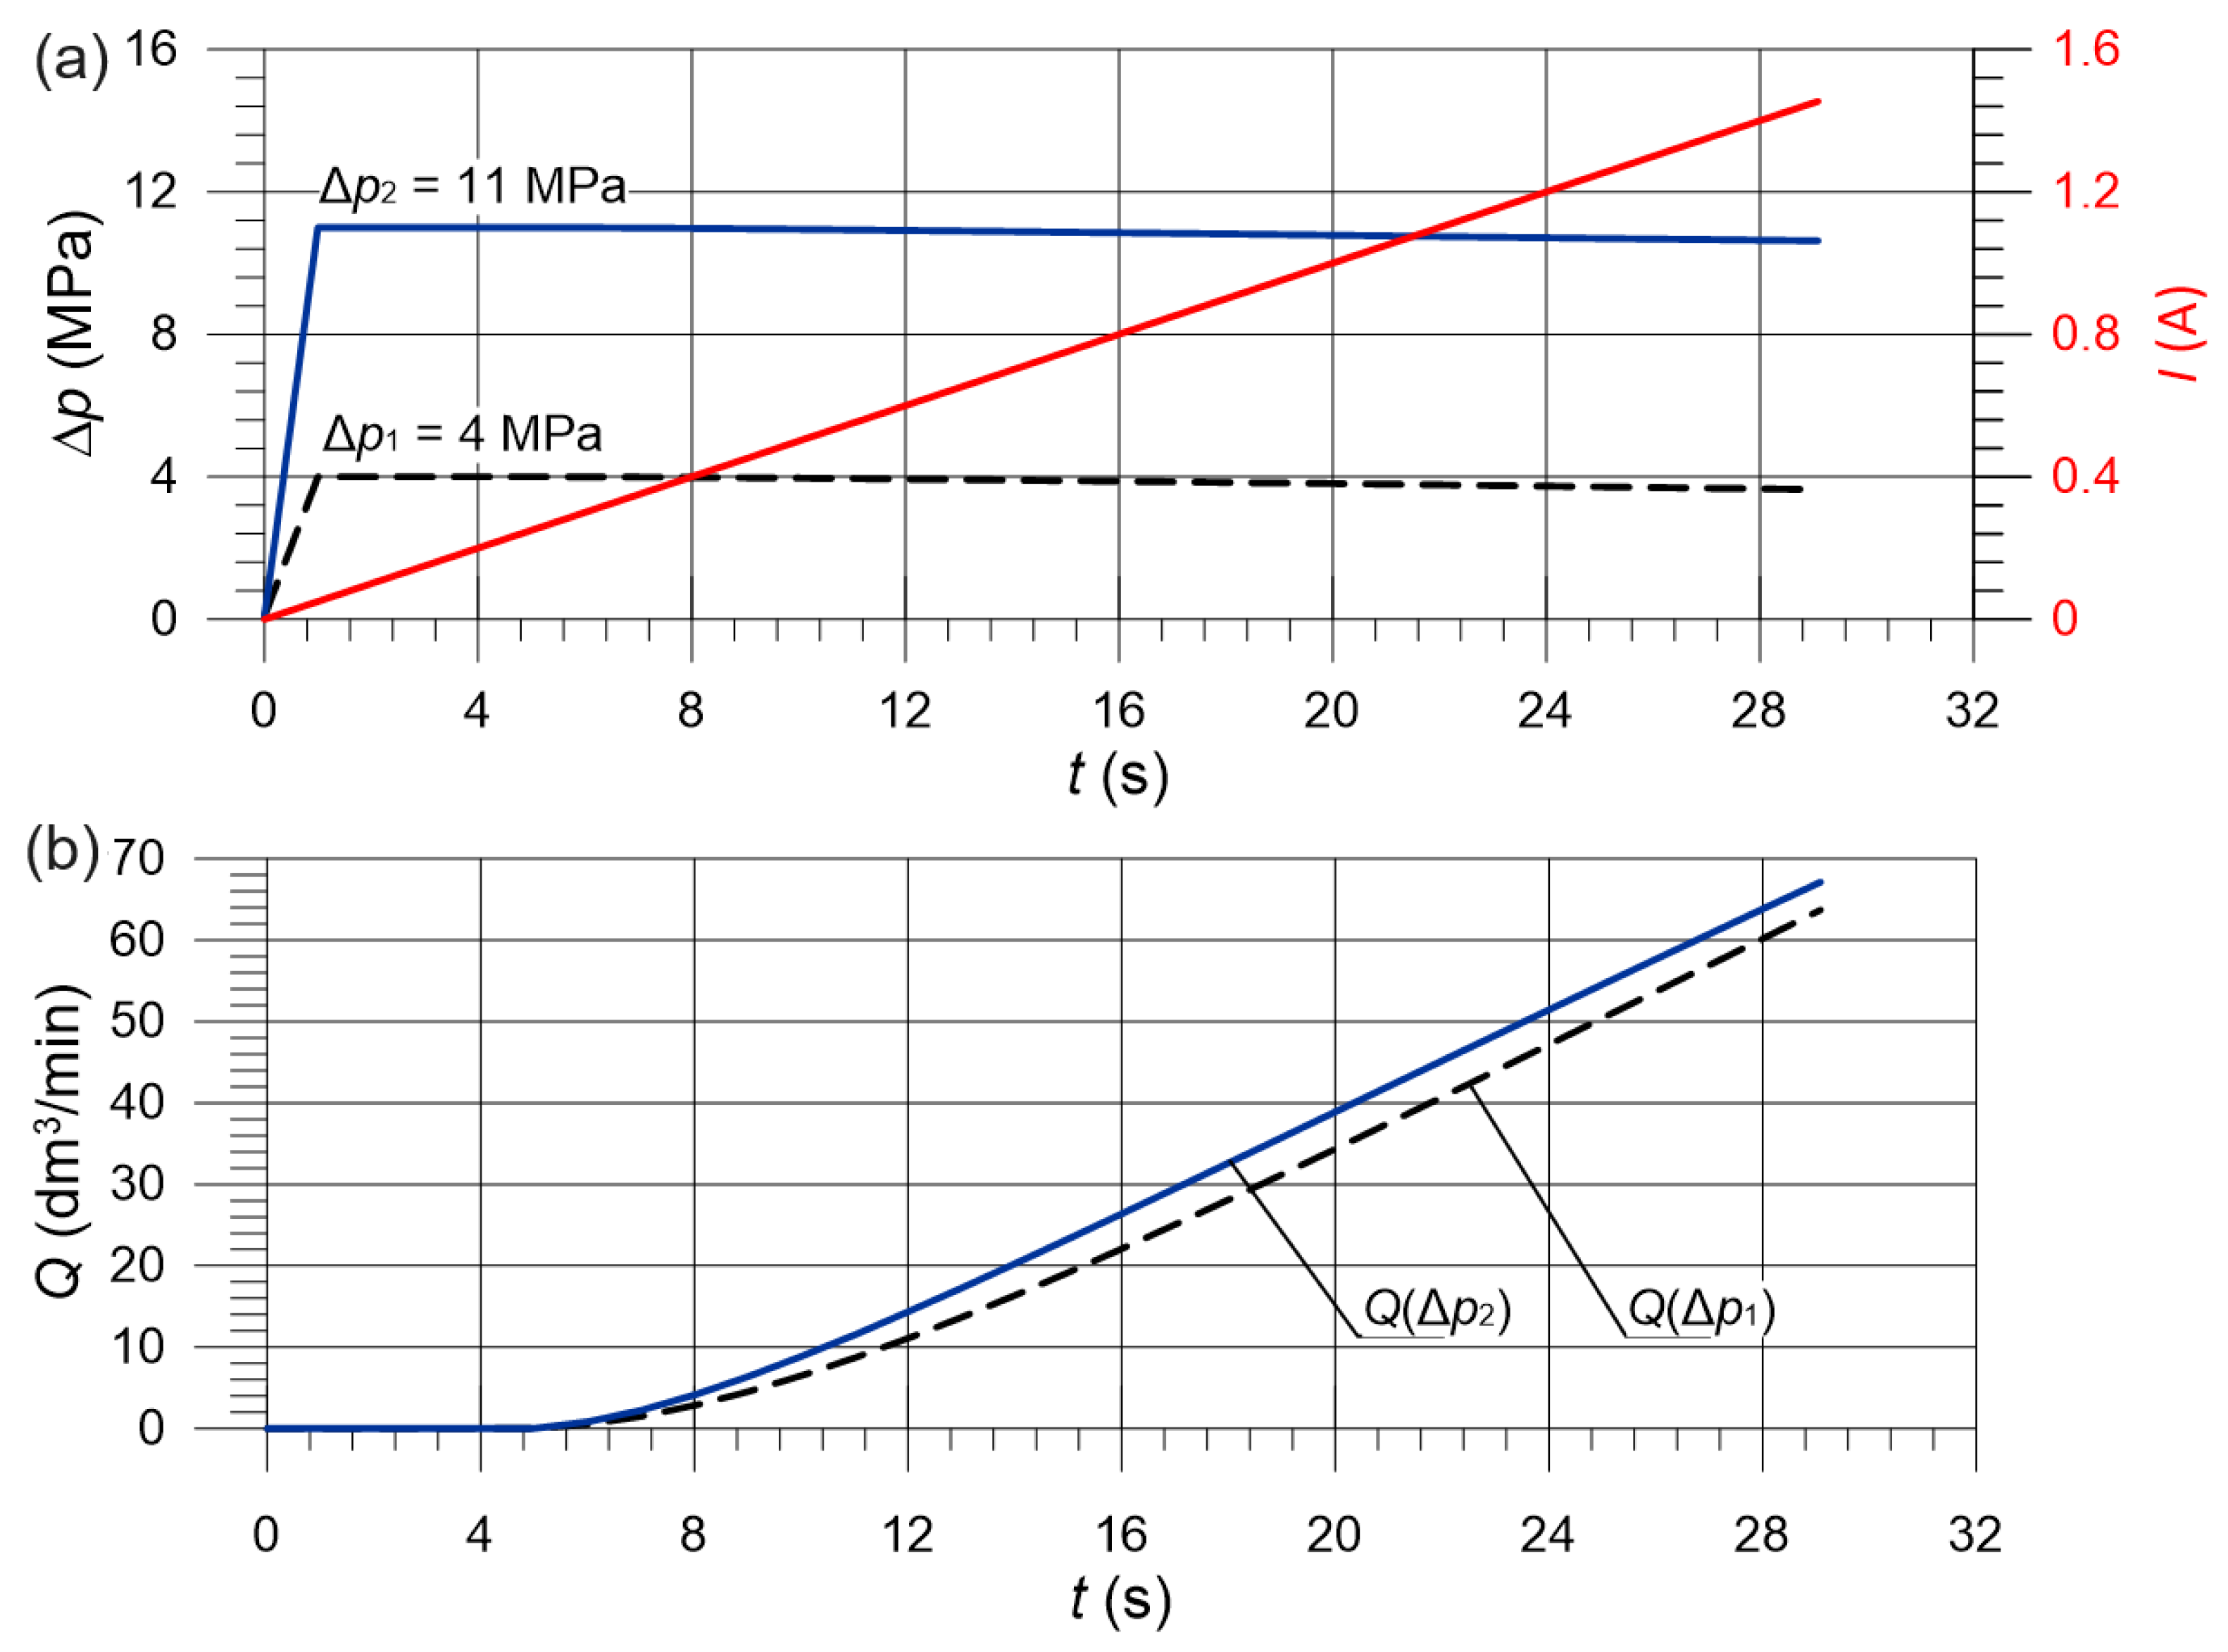
In practice, smooth flow rate regulation is achieved by setting the electromagnet current intensity in real time. Figure 17 shows the change in the flow rate as the supply current intensity changes quasi-linearly from zero to . Simulations were conducted for the pressures of and . As can be seen from the obtained charts, the valve opens after exceeding the threshold value of . Then, there is an increase in the flow rate, which depends only slightly on the pressure. The difference in flow rates for the considered pressures did not exceed 8%.
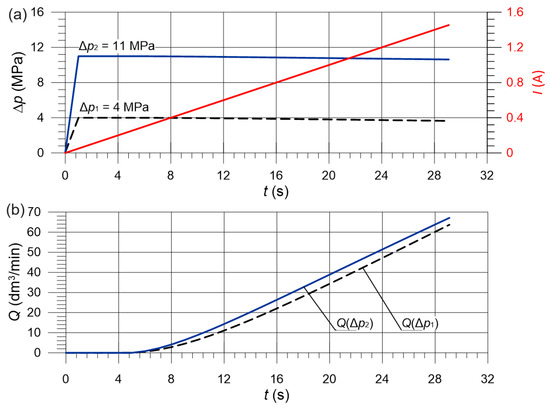
Figure 17.
Control characteristics with fixed pressure: (a) pressures and current intensity and (b) the obtained flow rates.
4.5. Test Bench Experiments
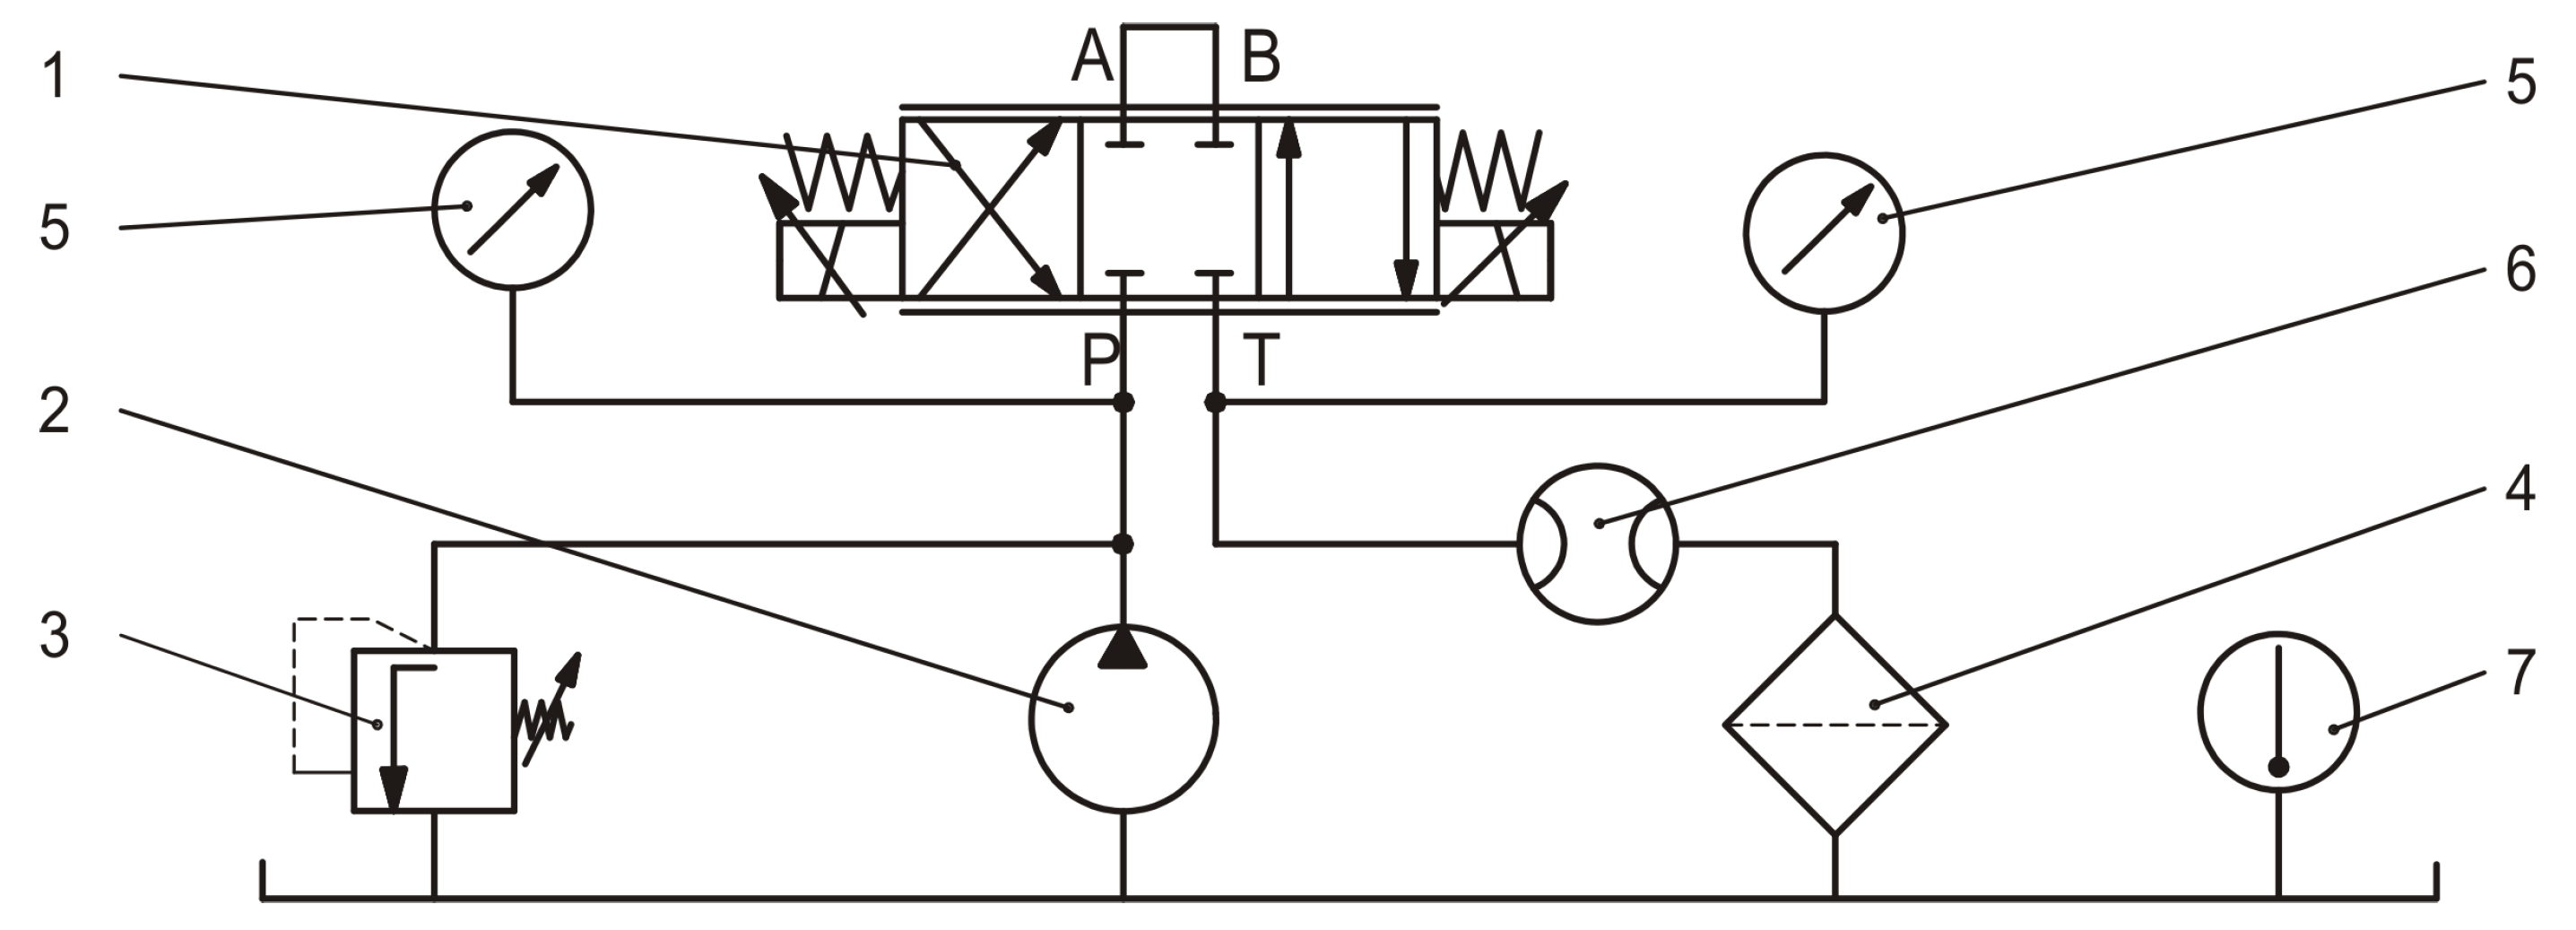
Laboratory experiments were carried out on a valve prototype shown in Figure 18a at the test bench presented in Figure 18b. The test bench was built according to the scheme shown in Figure 19, and it was equipped with the following devices:

Figure 18.
Experimental setup: (a) valve prototype and (b) valve at the test bench: 1—valve body, 2—cover plates, 3—electromagnets, 4—supply line, 5—return line, and 6—pressure transducers.
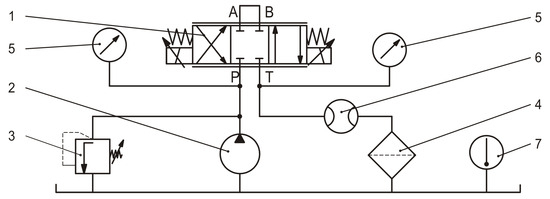
Figure 19.
Test bench scheme: 1—studied valve, 2—pump, 3—relief valve, 4—filter, 5—pressure transducers, 6—flowmeter, and 7—temperature transducer.
- Flowmeter: KRACHT, Germany, FM10-01-24-A, 8–80 , accuracy %;
- Pressure transducer: TRAFAG, Switzerland, NAT 100, 0 V, 0–10 , accuracy %;
- Pressure transducer: TRAFAG, Switzerland, NAT 400, 0 V, 0–40 , accuracy %;
- Temperature sensor: Introl, Poland, Fe-Konst 0–100 °C with a U90AN transducer;
- DAQ card: National Instruments, USA, NI USB-6009 (14 bit, 8 AI, 2 AO);
- DAQ system: National Instruments, USA, LabView.
A single test cycle was carried out by setting a specific, constant value of the electromagnet current intensity and then turning on the pump and continuously changing the relief valve settings, thus determining the pressure at the entrance to the valve.
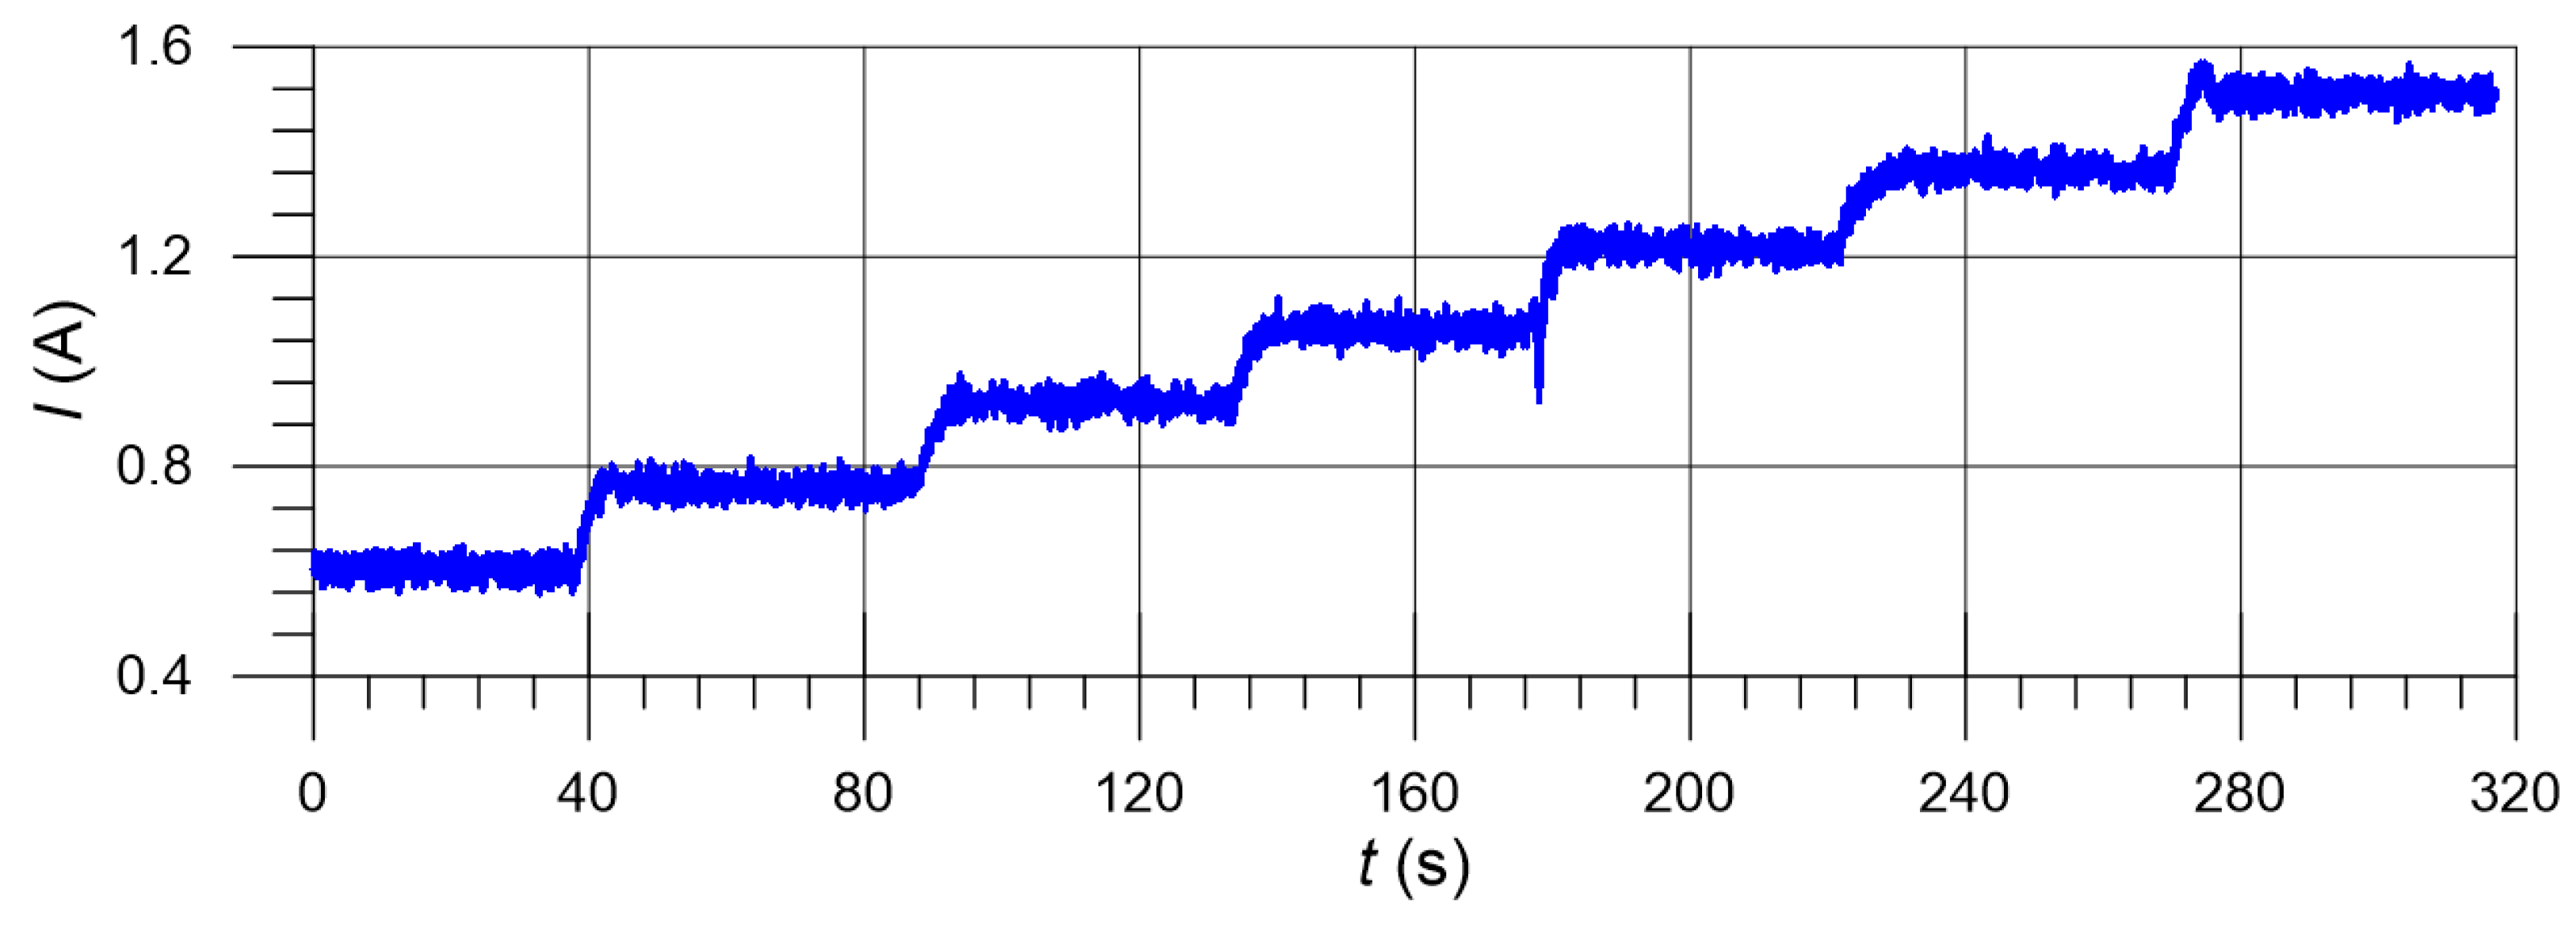
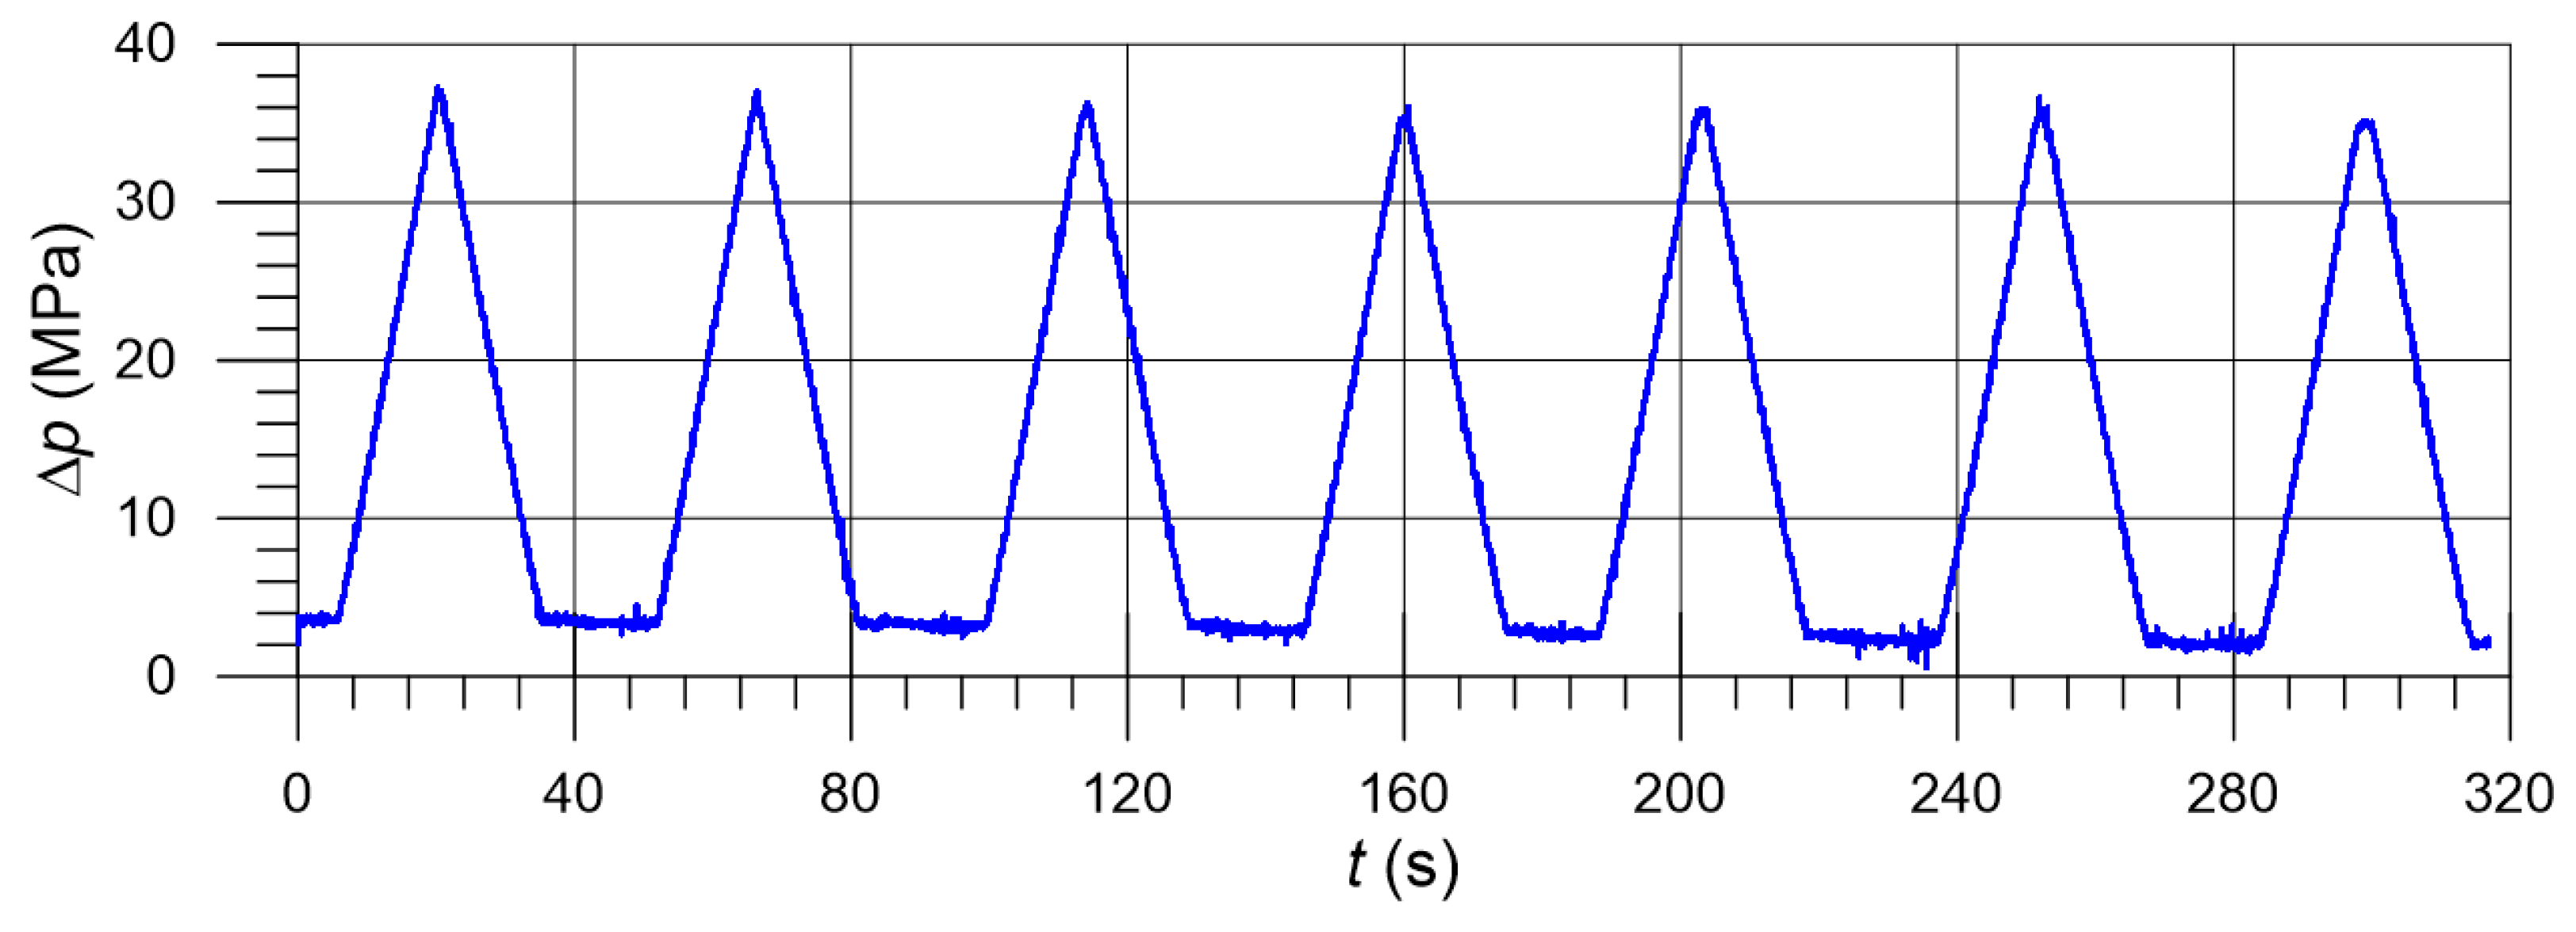
Figure 20 and Figure 21 show the electromagnet current intensity and obtained course of pressure against time. As is shown in Figure 20, the experiment was conducted with a gradually increased current intensity. Initially, the current was set to , and the subsequent increase resulted in the following values: , and . For each fixed I value, the pressure was quasi-linearly increased from approximately to and then decreased analogously (Figure 21). The values of the current intensity, I, pressure, , and the resultant flow rate, Q, were measured and recorded.
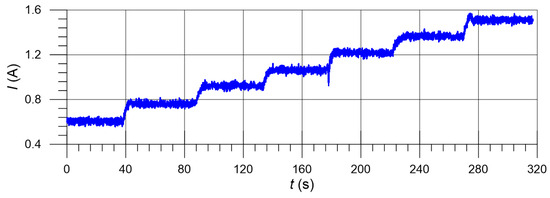
Figure 20.
Electromagnet current intensity against time .
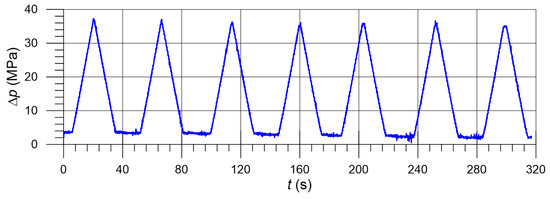
Figure 21.
Supply line pressure against time .
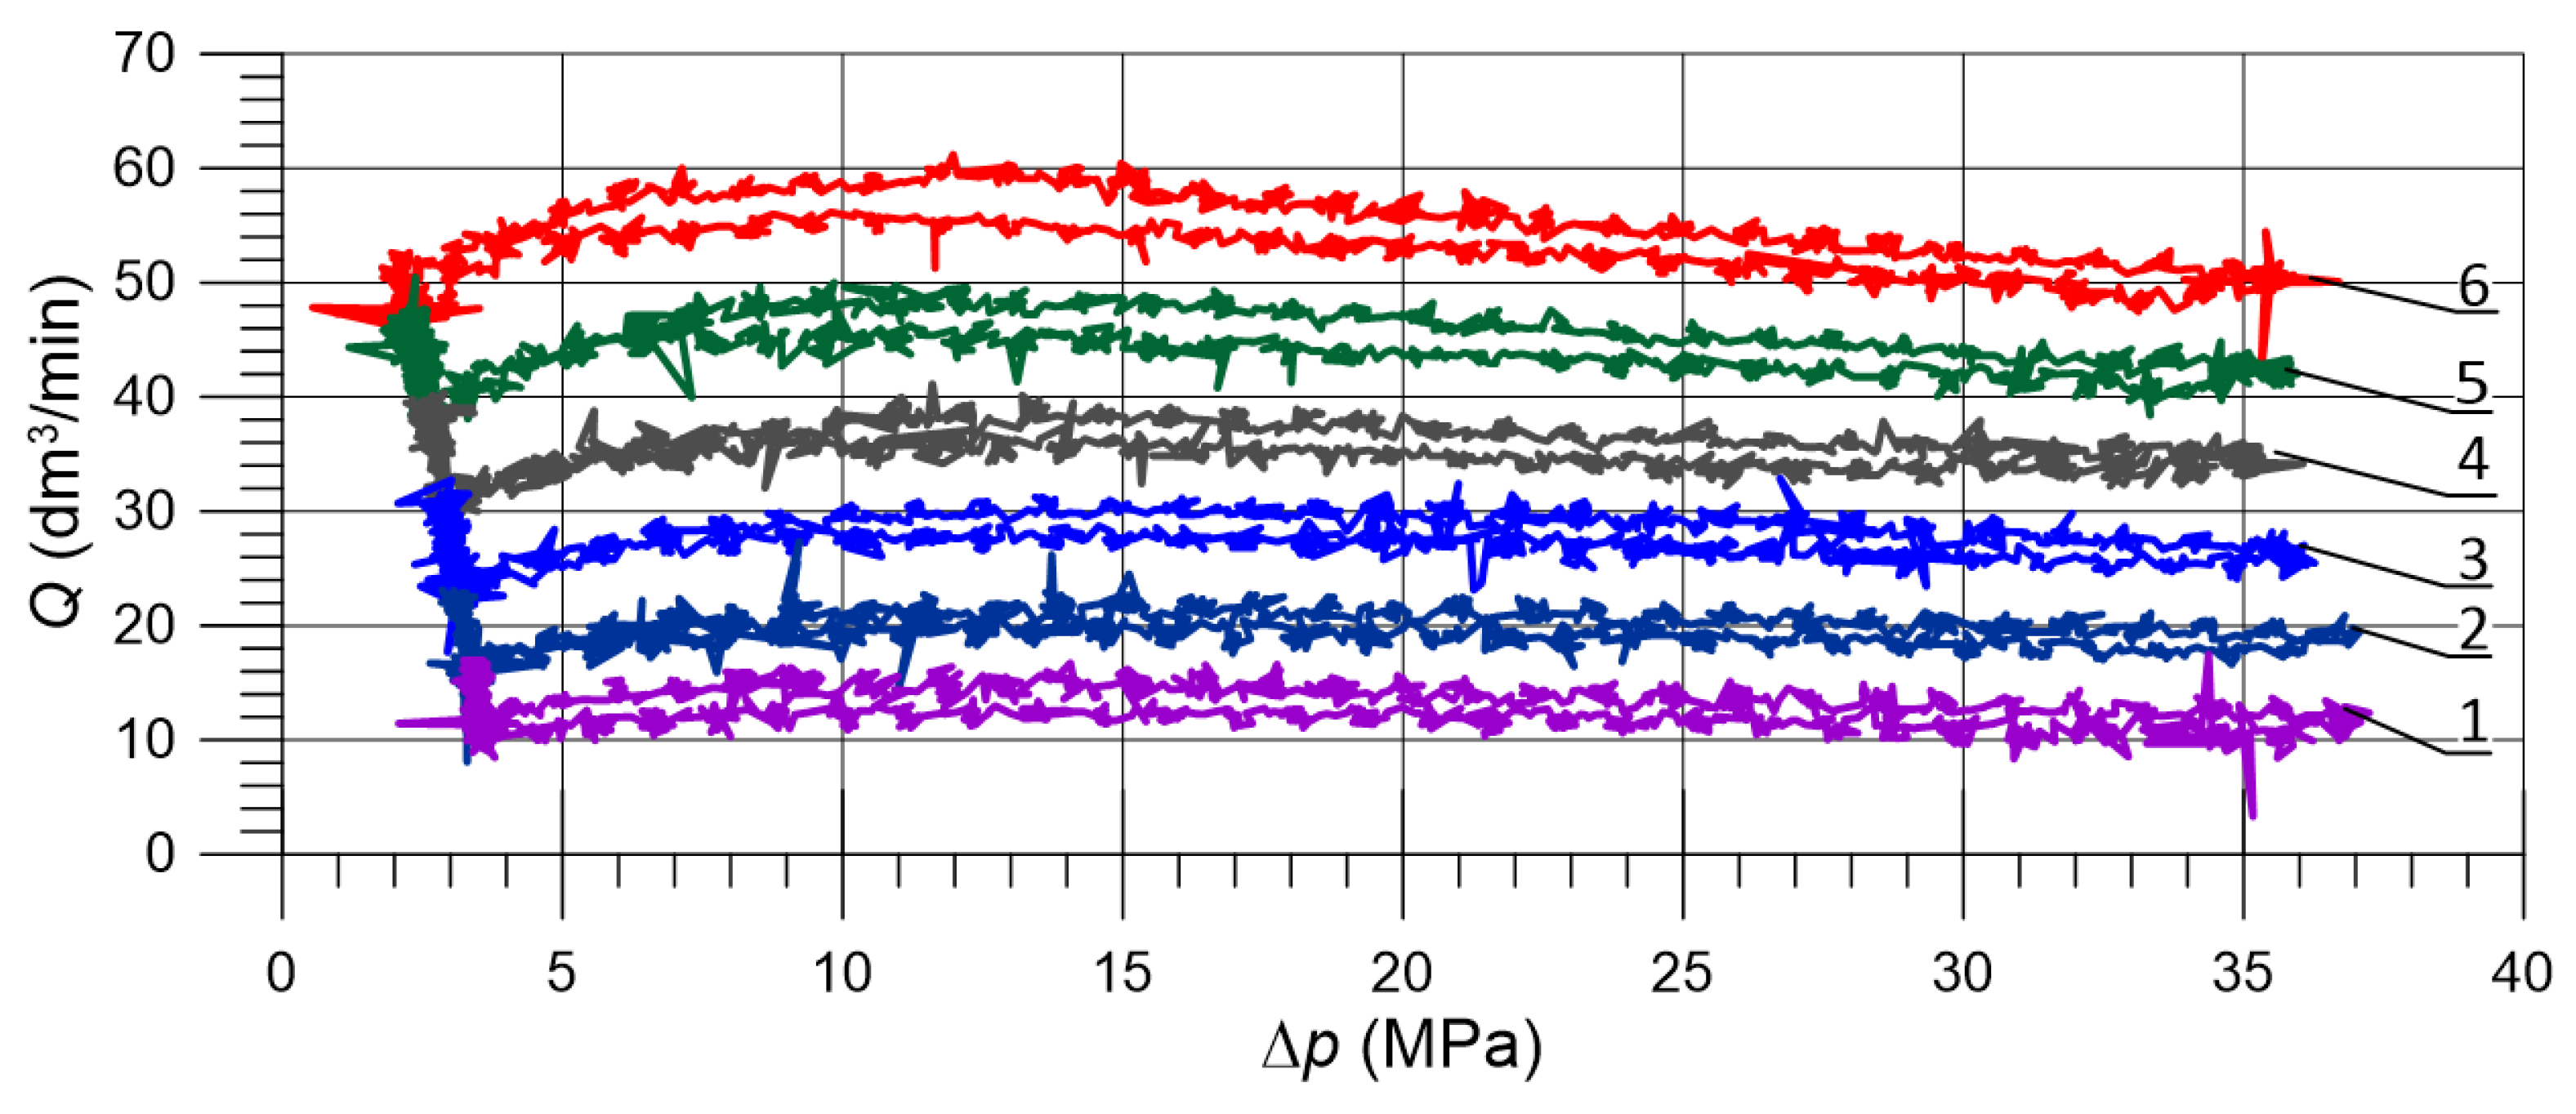
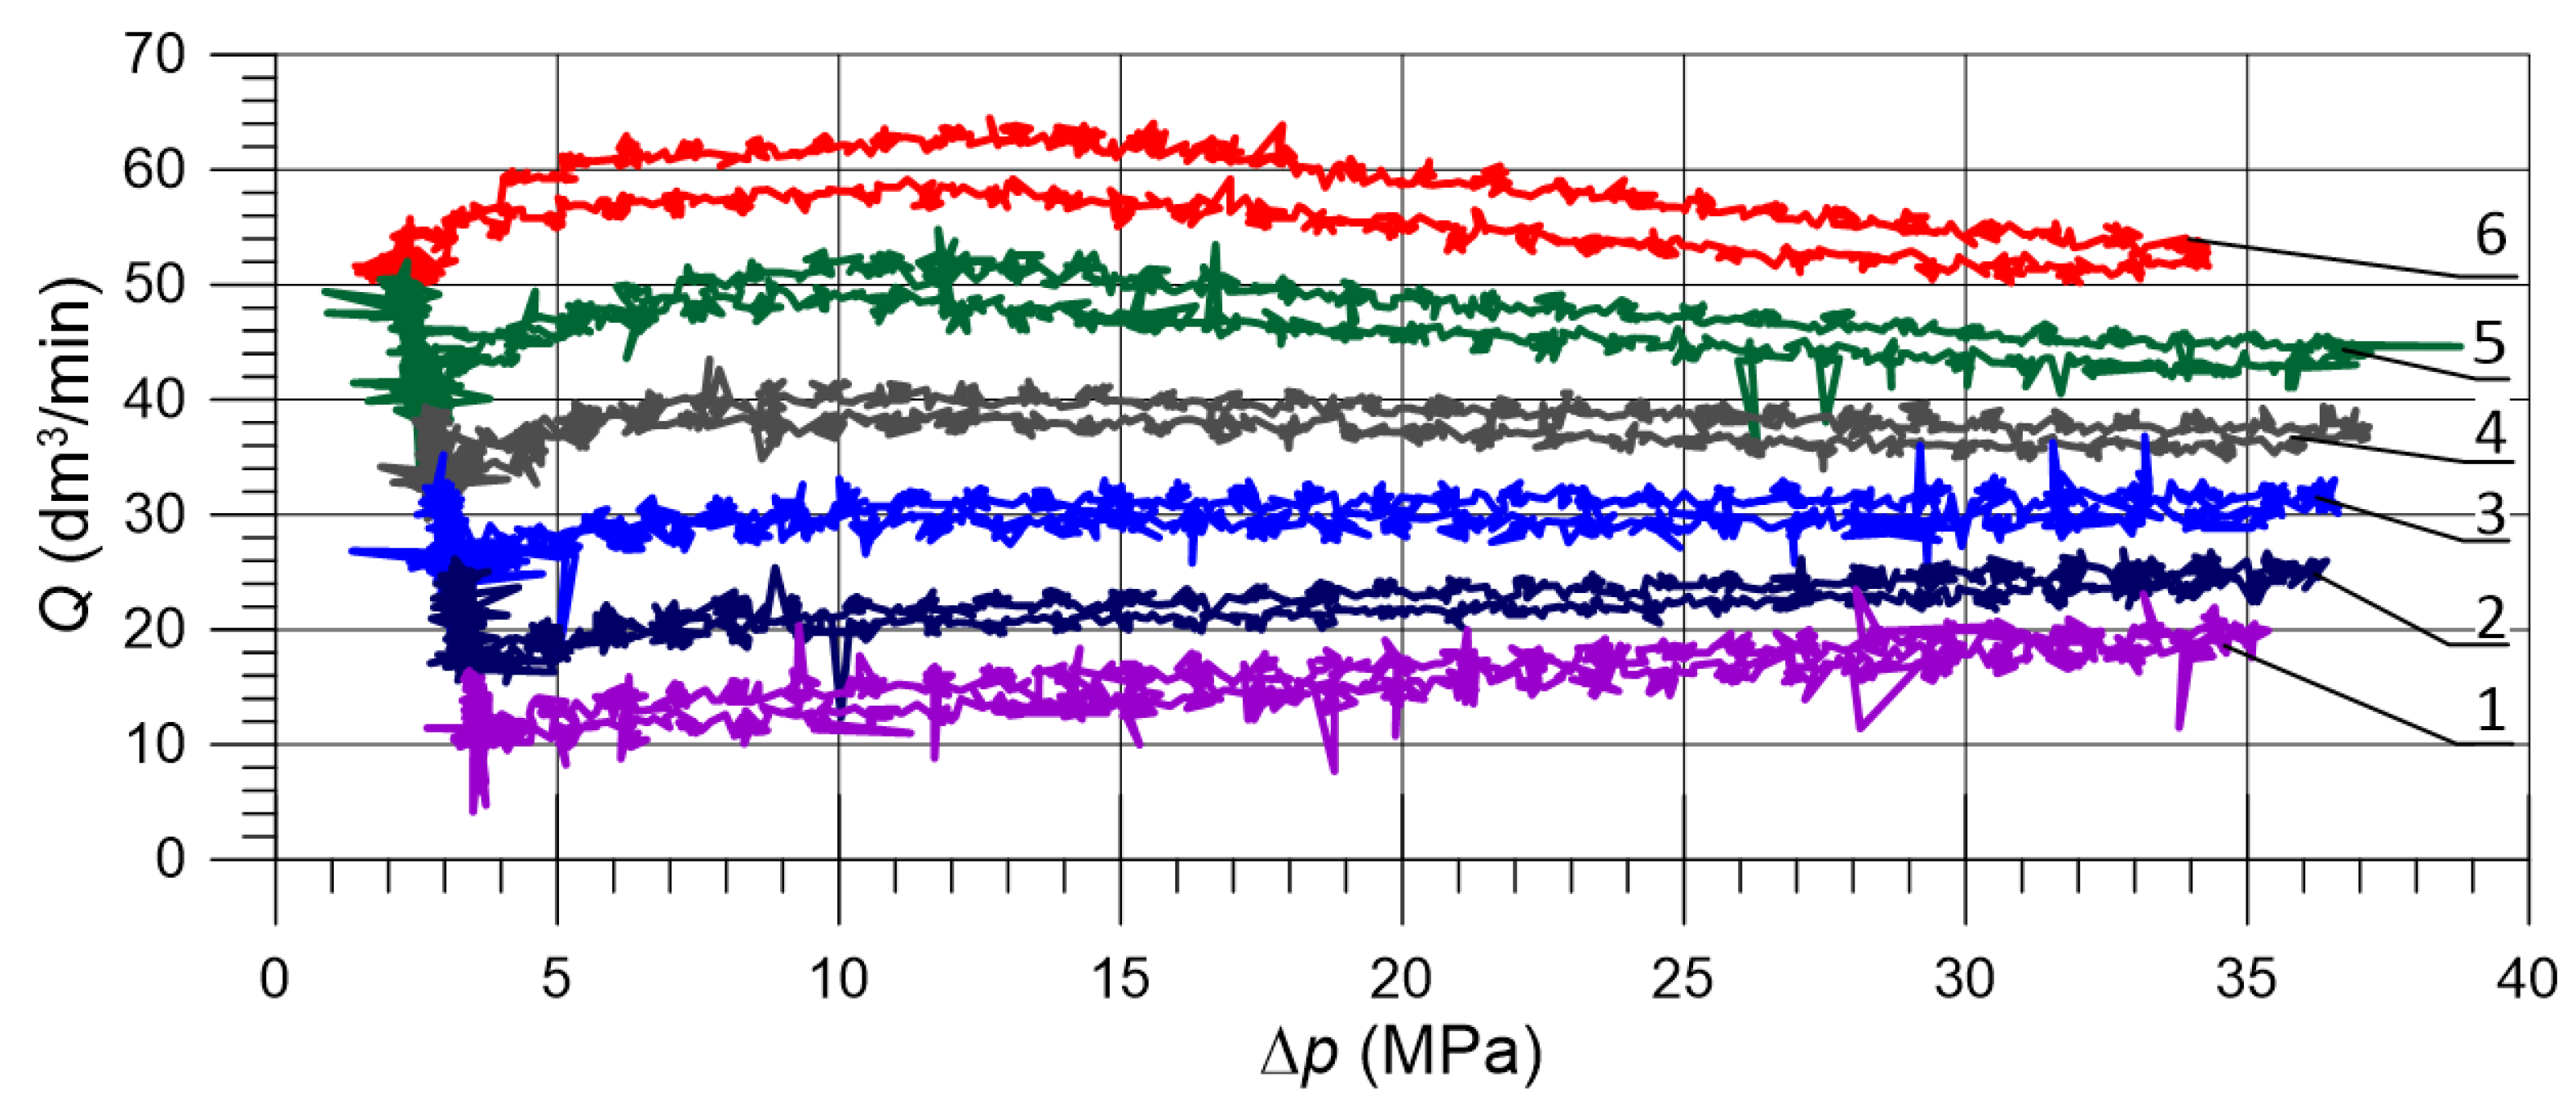
The resultant p–Q flow characteristics, drawn up based on the measurements, are presented in Figure 22 and Figure 23 for the E and W spools, respectively. As shown in the figures, applying the W-type spool results in a higher flow rate. The difference is brightly visible in the case of low current intensity values and high pressure. For and , the W spool achieved an almost doubled flow rate compared to the E one. However, higher control signal values resulted in a decrease in the difference. In the case of , the difference between the W and E spools was lower than 10%.
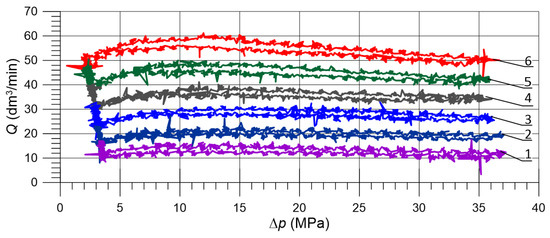
Figure 22.
The p–Q flow characteristics obtained with the E spool and fixed current intensity values: 1— , 2— , 3— , 4— , 5— , and 6— .
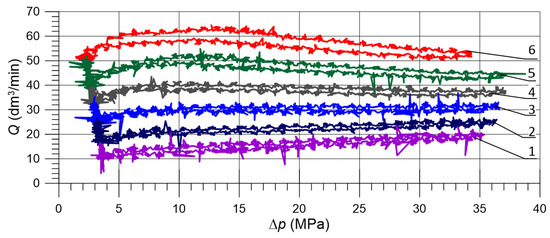
Figure 23.
The p–Q flow characteristics obtained with the W spool and fixed current intensity values: 1— , 2— , 3— , 4— , 5— , and 6— .
4.6. Comparison of Flow Characteristics with Simulation Results
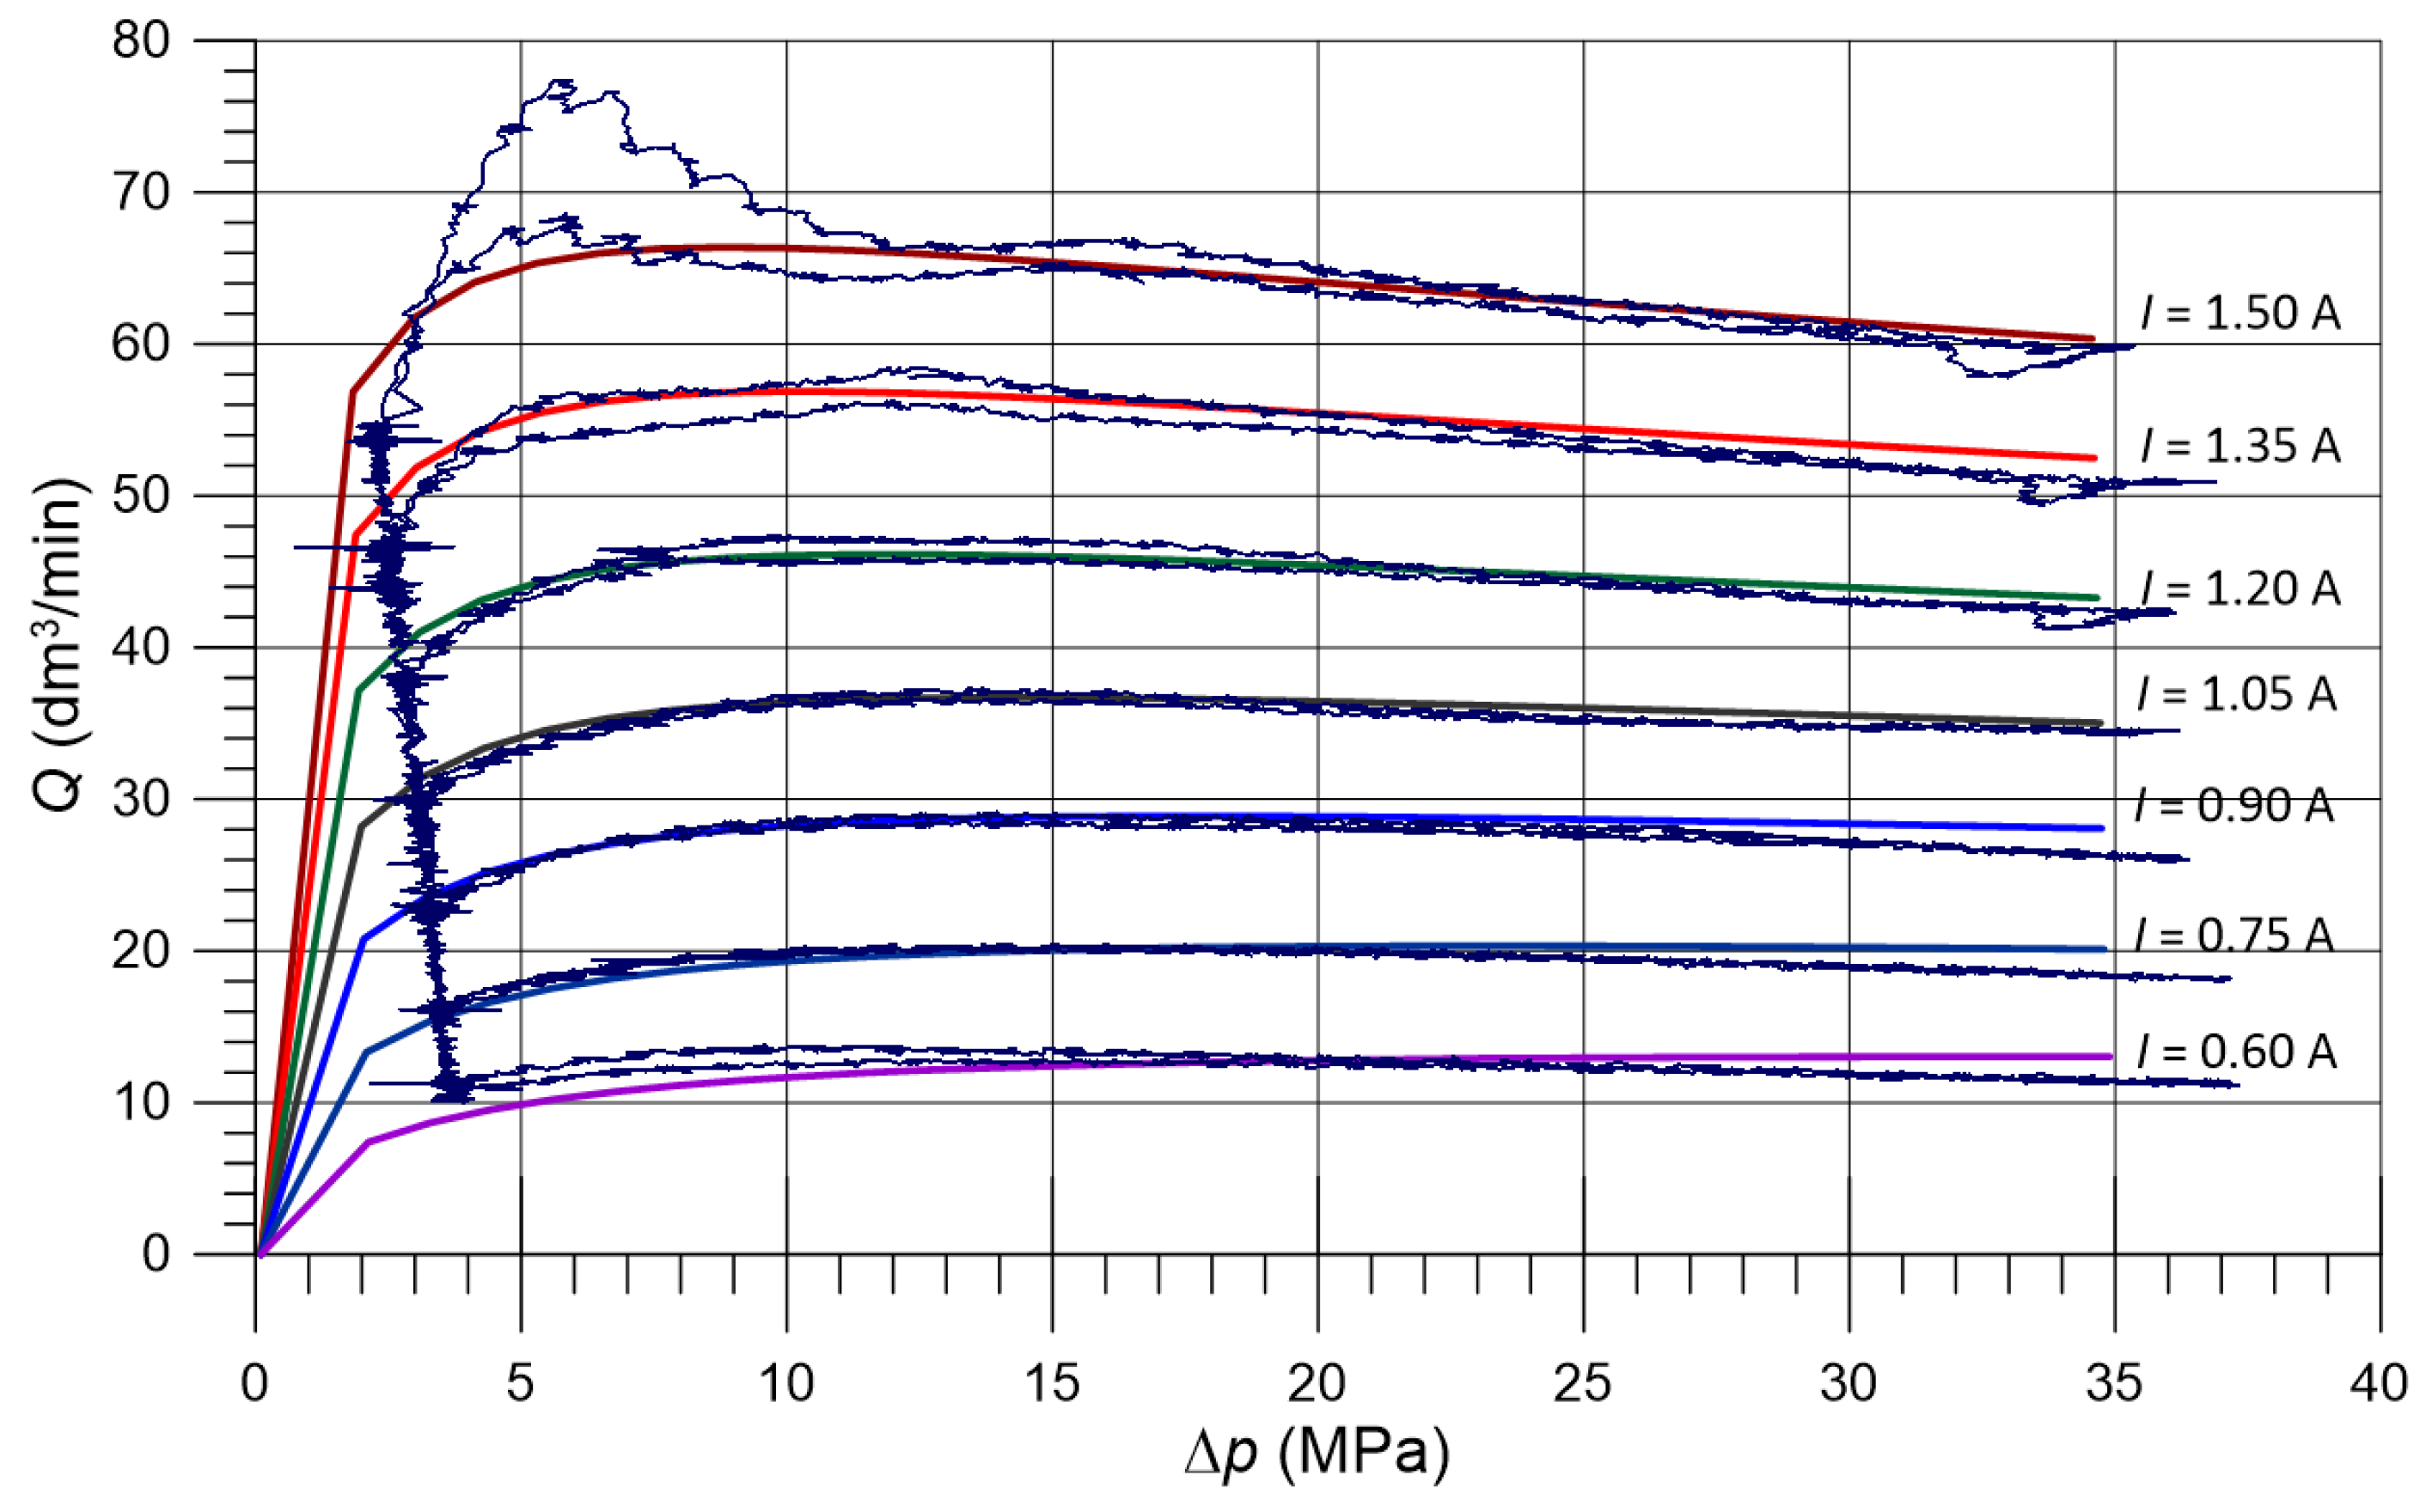
Figure 24 presents a comparison of the valve flow characteristics with the E spool obtained during the simulation and laboratory experiments.
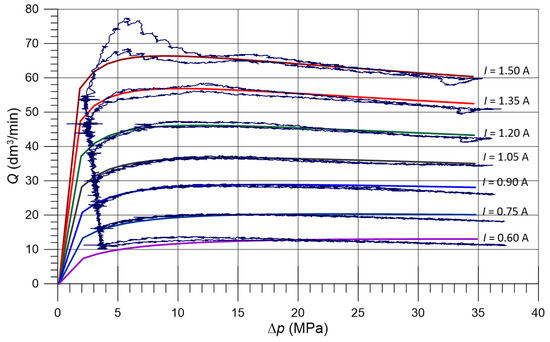
Figure 24.
Comparison of the p–Q flow characteristics from simulations and laboratory experiments obtained with the E spool and fixed current intensity values from to .
The flow rates obtained for fixed values of electromagnet current intensity and varying supply line pressure show a high level of convergence over the entire operating range of the actual valve. The differences do not exceed 8%, except for the smallest current value, , for which they amount to a maximum of 11%. The characteristics of the W spool are similar, except that the flow rates obtained for the particular current intensity values are higher. In turn, Figure 25 and Figure 26 show a comparison of valve control characteristics obtained with constant pressure and variable current intensity.
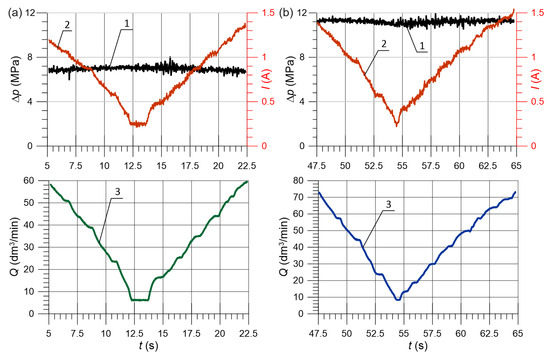
Figure 25.
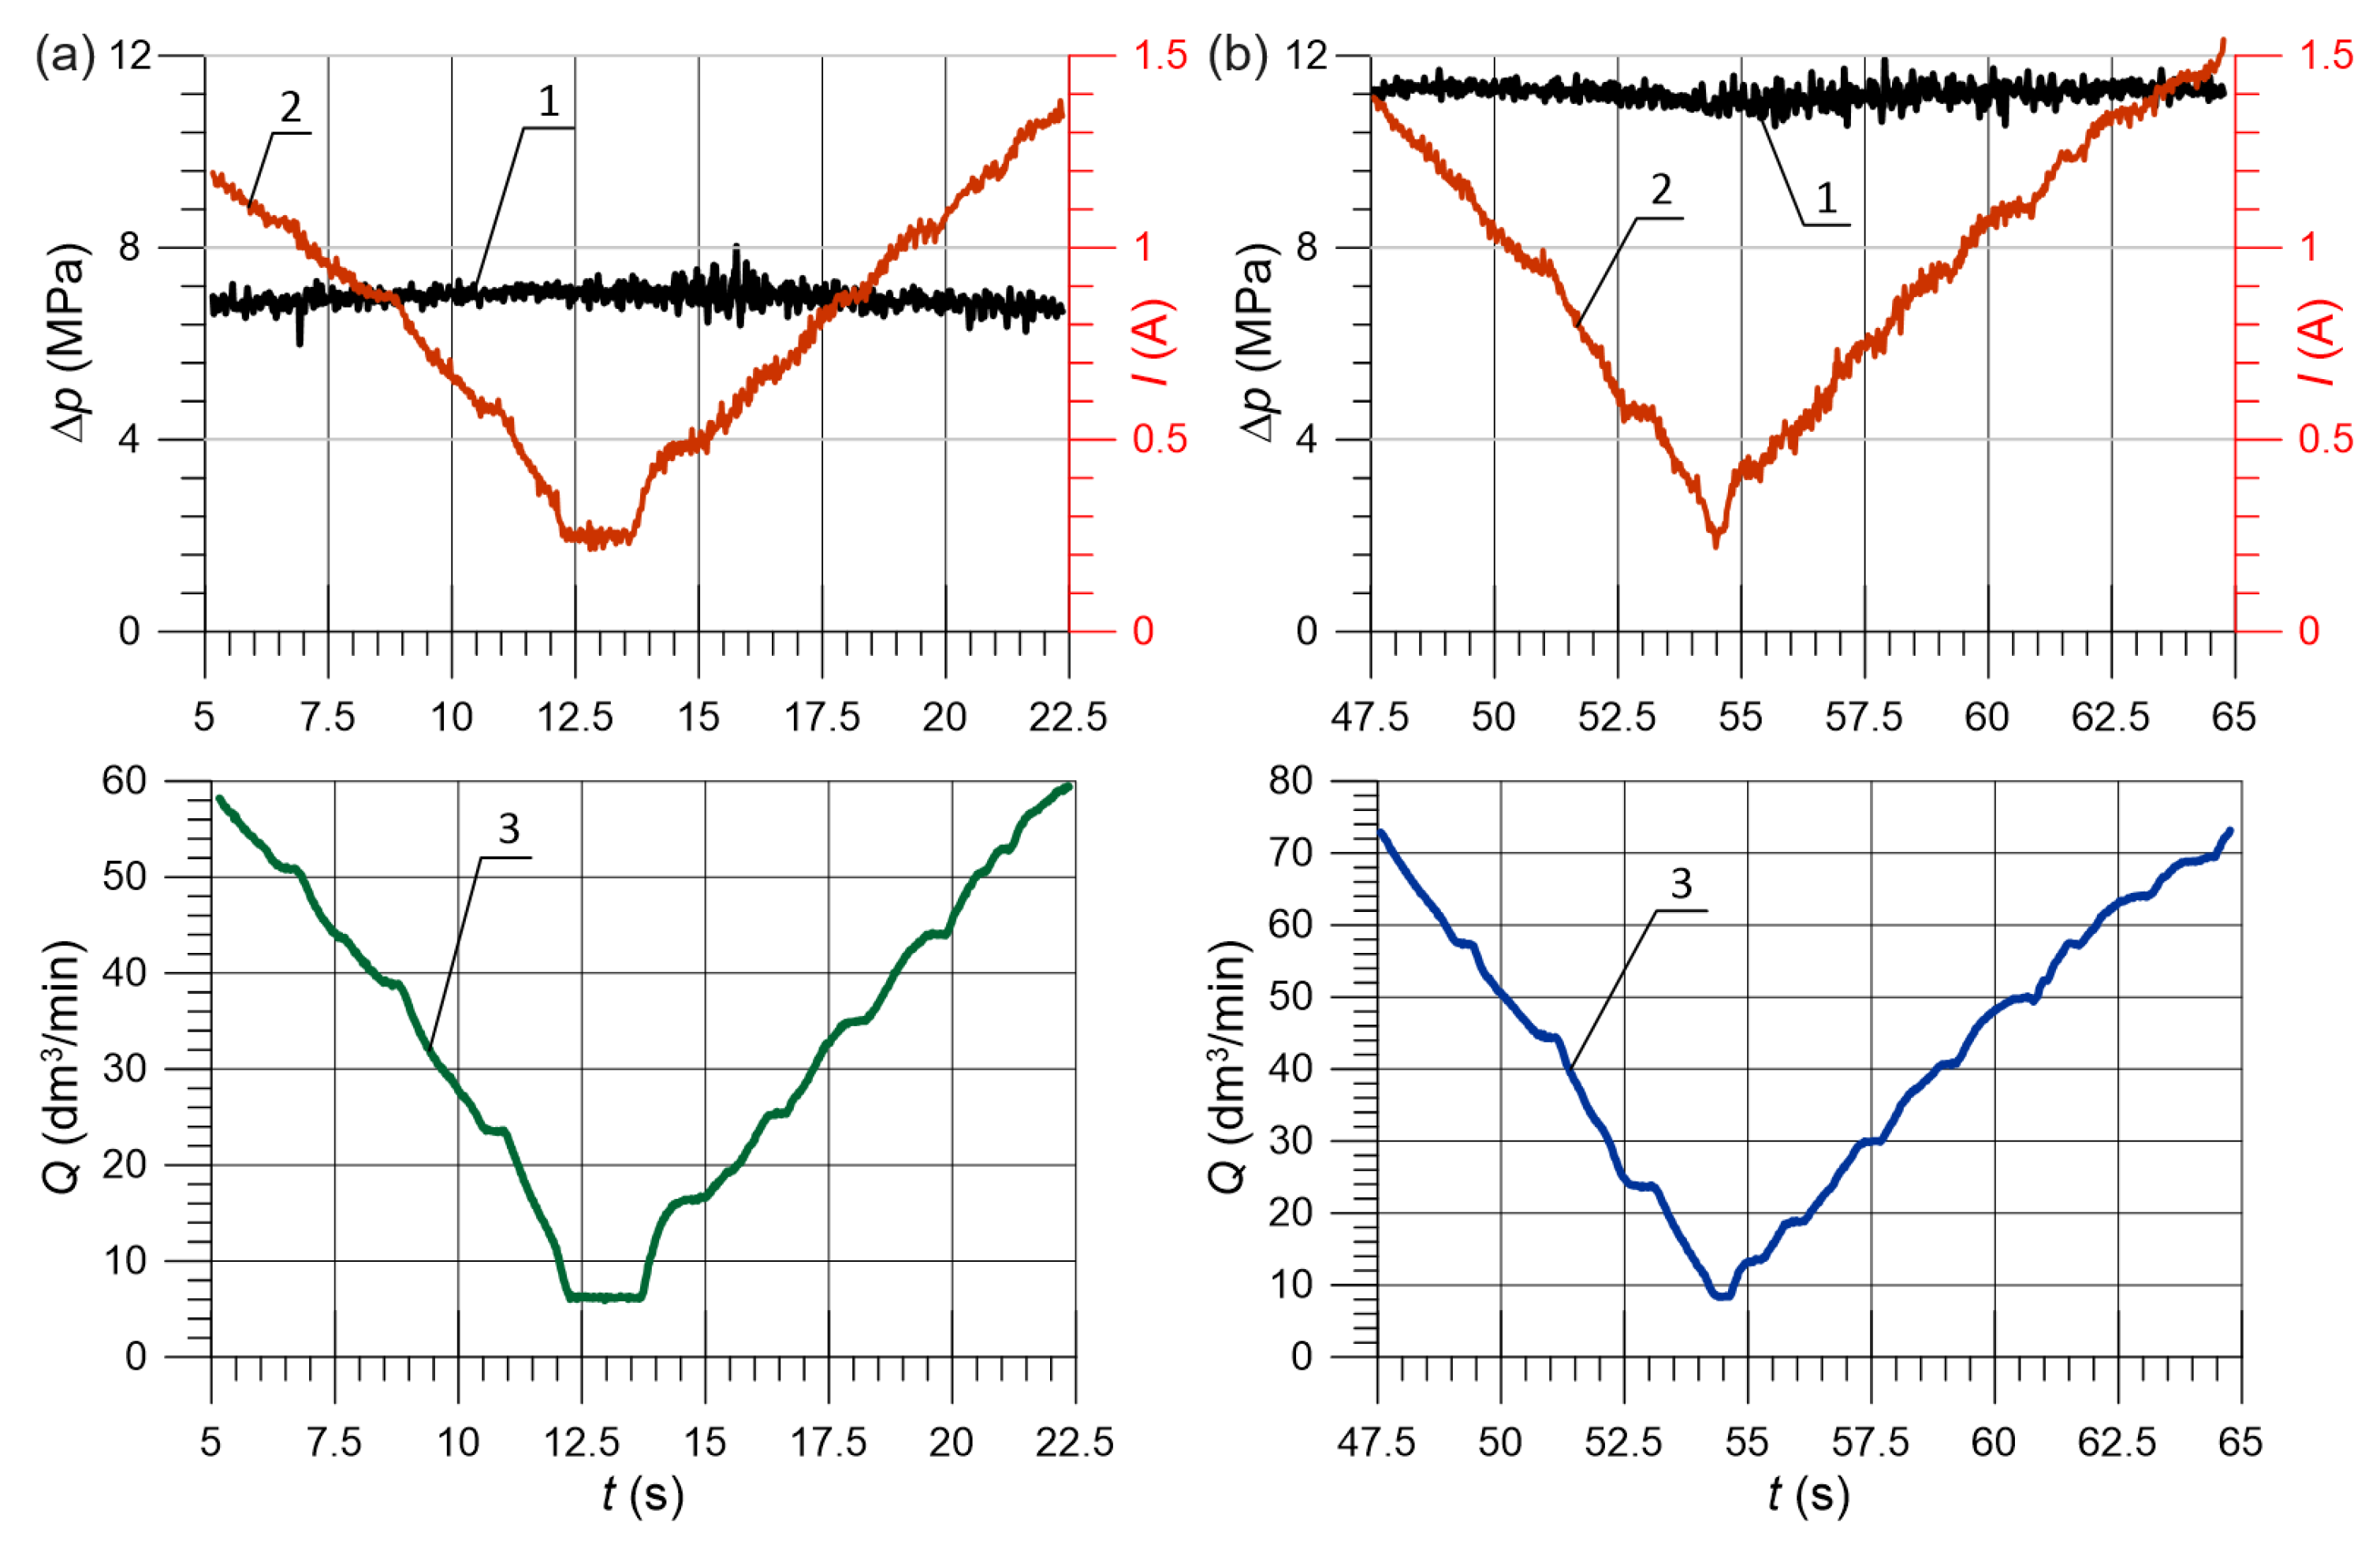
Parameters to prepare the control characteristics obtained during laboratory tests: (a) and (b) : 1—pressure, 2—current intensity, and 3—flow rate.
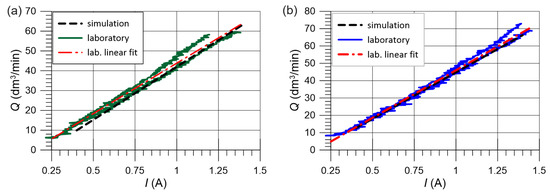
Figure 26.
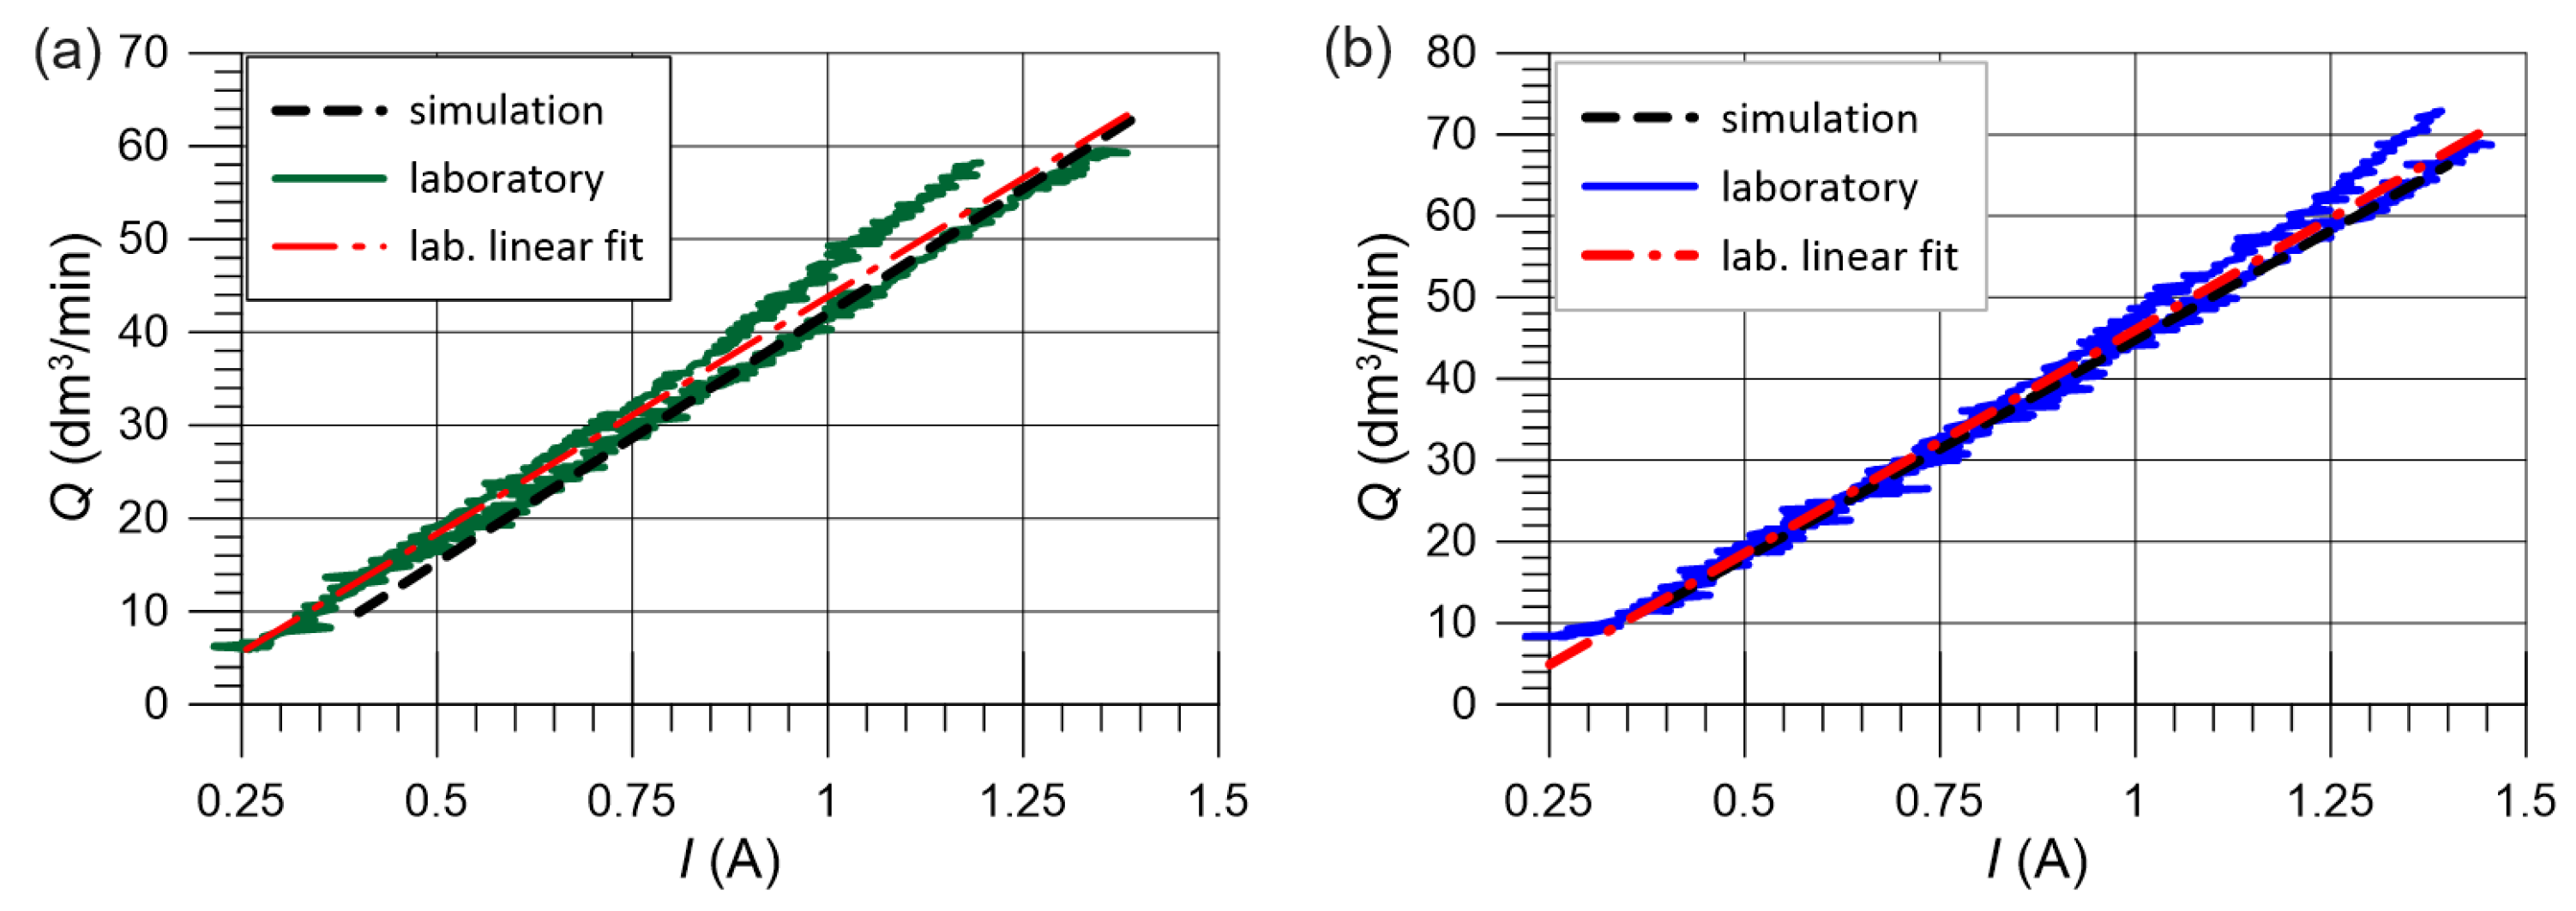
Comparison of control characteristics : (a) and (b) .
Figure 25a,b presents the pressure, current intensity, and flow rate against time for low and high pressure, and , respectively. Based on the acquired values, the characteristics were drawn, and they are shown in Figure 26. Despite a small hysteresis, the characteristics show a high level of linearity. A linear fit in both cases achieved a coefficient of determination above and a correlation coefficient above .
The obtained results were compared to previous results obtained for a similar valve of the DN6 size [22]. The comparison included the values of the percentage flow rate difference, , at a pressure of versus obtained for a control signal, I, in the range from 50% to 100% (Table 5).

Table 5.
Flow rate Q () at (MPa) and (MPa) for DN6 and DN10 valves.
A lower value of in Table 5 means better uniformity of the flow rate against pressure and, thus, better compensation for the influence of pressure on the flow characteristics. The results show that, for the formerly investigated DN6 valve, the obtained differences in the flow rate at low and high pressures ( and ) vary from % to %. In the case of the currently tested DN10 valve, significantly lower differences were achieved, ranging from % to %, respectively.
5. Conclusions
The article has provided a flow analysis of a proportional control valve. In particular, the possibility of compensating for the undesirable influence of variable pressure on the flow rate was investigated. The proposed solution is advantageous since it does not require any additional hydraulic equipment or advanced digital regulators, which simplifies the design, decreases costs, and may significantly increase reliability (MTTFD). The research involved using flow-related forces and appropriately assigning return spring parameters, such as stiffness and geometric dimensions. First, a CFD analysis was performed on a 3D model for selected spool versions and positions for various flow rates through the valve. The CFD analysis results determined the deflection angle of the fluid stream in the throttling gap. This consecutively allowed the estimation of the fluid force values acting on the spool. Then, the flow characteristics of the valve were determined by solving the flow equations and the spool motion equation with the mass conservation and momentum conservation principles. As a result, a quasi-linear dependence of the volumetric flow rate as a function of the electromagnet current intensity was identified, compensating for the influence of pressure. The following detailed conclusions may be formulated based on the carried-out research:
- Flow forces may significantly influence proportional spool valve characteristics; with properly designed spool geometry, they can be used to significantly reduce the impact of pressure on the flow rate through the valve;
- The design should also take into account the stiffness of the return spring because its too-low or too-high stiffness may significantly affect the flow rate against the system pressure;
- The investigated proportional valve of the DN10 size allowed a controlled, stable flow rate in the range of 10–60 to be obtained, which corresponds to electromagnet current intensity from (40%) to (100%);
- The results show that the obtained flow rate variability for a given solenoid setting does not exceed 5–6%; this determines the possibility of the practical use of the valve in systems where higher accuracy is not required.
The proposed design has great potential for practical applications, especially in single-pump, multi-receiver systems, which are advantageous for minimizing energy consumption. In particular, this solution may be applied using a multi-section proportional control valve, providing the functionality of an adjustable flow divider for multiple receivers. In this case, each section provides a constant, adjustable flow rate to the receiver, regardless of the pressure in its branch. All that is required is a pump with a sufficiently large output, and the operator may freely regulate the inflow rates to particular receivers, regardless of their load. Moreover, the individual sections of the valve may differ in internal flow characteristics, e.g., due to differences in the spool overlap, which may be used to fulfill various receiver demands.
Author Contributions
Conceptualization, E.L. and J.R.; methodology, G.F.; software, E.L.; validation, G.F. and E.L.; formal analysis, J.R.; investigation, E.L., G.F. and J.R.; resources, J.R.; writing—original draft preparation, G.F.; writing—review and editing, E.L.; visualization, G.F.; supervision, E.L.; project administration, G.F.; funding acquisition, E.L. and G.F. All authors have read and agreed to the published version of the manuscript.
Funding
This research received no external funding.
Data Availability Statement
The original contributions presented in the study are included in the article, further inquiries can be directed to the corresponding author.
Acknowledgments
This research was carried out as part of the statutory activities of the Faculty of Mechanical Engineering at Cracow University of Technology in cooperation with PONAR Wadowice.
Conflicts of Interest
Author Janusz Rajda was employed by the PONAR Wadowice. The remaining authors declare that the research was conducted in the absence of any commercial or financial relationships that could be construed as a potential conflict of interest.
References
- Amirante, R.; Vescovo, G.D.; Lippolis, A. Evaluation of the flow forces on an open centre directional control valve by means of a computational fluid dynamic analysis. Energy Convers. Manag. 2006, 47, 1748–1760. [Google Scholar] [CrossRef]
- Amirante, R.; Moscatelli, P.; Catalano, L. Evaluation of the flow forces on a direct (single stage) proportional valve by means of a computational fluid dynamic analysis. Energy Convers. Manag. 2007, 48, 942–953. [Google Scholar] [CrossRef]
- Valdés, J.R.; Miana, M.J.; Núñez, J.L.; Pütz, T. Reduced order model for estimation of fluid flow and flow forces in hydraulic proportional valves. Energy Convers. Manag. 2008, 49, 1517–1529. [Google Scholar] [CrossRef]
- Chattopadhyay, H.; Kundu, A.; Saha, B.K.; Gangopadhyay, T. Analysis of flow structure inside a spool type pressure regulating valve. Energy Convers. Manag. 2012, 53, 196–204. [Google Scholar] [CrossRef]
- Aung, N.Z.; Yang, Q.; Chen, M.; Li, S. CFD analysis of flow forces and energy loss characteristics in a flapper–nozzle pilot valve with different null clearances. Energy Convers. Manag. 2014, 83, 284–295. [Google Scholar] [CrossRef]
- Gomez, I.; Gonzalez-Mancera, A.; Newell, B.; Garcia-Bravo, J. Analysis of the Design of a Poppet Valve by Transitory Simulation. Energies 2019, 12, 889. [Google Scholar] [CrossRef]
- Ye, J.; Zhao, Z.; Zheng, J.; Salem, S.; Yu, J.; Cui, J.; Jiao, X. Transient Flow Characteristic of High-Pressure Hydrogen Gas in Check Valve during the Opening Process. Energies 2020, 13, 4222. [Google Scholar] [CrossRef]
- Simic, M.; Herakovic, N. Reduction of the flow forces in a small hydraulic seat valve as alternative approach to improve the valve characteristics. Energy Convers. Manag. 2015, 89, 708–718. [Google Scholar] [CrossRef]
- Chen, L.; Zhang, C.; Jin, B.; Yuan, T. Simulation and experimental research on steady flow force compensation for a servo proportional valve. Flow Meas. Instrum. 2023, 94, 102457. [Google Scholar] [CrossRef]
- Amirante, R.; Distaso, E.; Tamburrano, P. Sliding spool design for reducing the actuation forces in direct operated proportional directional valves: Experimental validation. Energy Convers. Manag. 2016, 119, 399–410. [Google Scholar] [CrossRef]
- Ding, X.; Li, R.; Xu, J.; Liu, Q.; Cheng, Y.; Liu, J. Study on flow force compensation characteristics and optimization design of jet guiding groove. Flow Meas. Instrum. 2022, 86, 102194. [Google Scholar] [CrossRef]
- Tan, L.; Xie, H.; Chen, H.; Yang, H. Structure optimization of conical spool and flow force compensation in a diverged flow cartridge proportional valve. Flow Meas. Instrum. 2019, 66, 170–181. [Google Scholar] [CrossRef]
- Liu, J.; Li, R.; Ding, X.; Liu, Q. Flow force research and structure improvement of cartridge valve core based on CFD method. Heliyon 2022, 8, e11700. [Google Scholar] [CrossRef]
- Gui, S.; Zhang, S.; Fu, B.; Ling, M. Fluid-dynamic analysis and multi-objective design optimization of piezoelectric servo valves. Flow Meas. Instrum. 2022, 85, 102157. [Google Scholar] [CrossRef]
- Borghi, M.; Milani, M.; Paoluzzi, R. Influence of notches shape and number of notches on the metering characteristics of hydraulic spool valves. Int. J. Fluid Power 2005, 6, 5–18. [Google Scholar] [CrossRef]
- Ye, Y.; Yin, C.; Li, X.; Zhou, W.; Yuan, F. Effects of groove shape of notch on the flow characteristics of spool valve. Energy Convers. Manag. 2014, 86, 1091–1101. [Google Scholar] [CrossRef]
- Zhang, X.; Wang, A.; Chen, W.; Kuang, L.; Jiang, T. Methodology for expressing the flow coefficients of coupled throttling grooves in a proportional–directional valve. Zhejiang Univ. Sci. A 2020, 21, 799–816. [Google Scholar] [CrossRef]
- Chen, Y.; Wang, A.; Li, X. Throttling characteristics prediction methodology for combined grooves in directional spool valves under variable flow rates. Heliyon 2023, 9, e21029. [Google Scholar] [CrossRef]
- Wang, B.; Zhao, X.; Quan, L.; Li, Y.; Hao, Y.; Ge, L. A method for improving flow control valve performance based on active differential pressure regulation. Measurement 2023, 219, 113271. [Google Scholar] [CrossRef]
- Agh, S.M.; Pirkandi, J.; Mahmoodi, M.; Jahromi, M. Development of a novel rotary flow control valve with an electronic actuator and a pressure compensator valve for a gas turbine engine fuel control system. Flow Meas. Instrum. 2020, 74, 101759. [Google Scholar] [CrossRef]
- Huang, J.; Wang, X.; Wang, H.; Hao, H. Development of a flow control valve with digital flow compensator. Flow Meas. Instrum. 2019, 66, 157–169. [Google Scholar] [CrossRef]
- Lisowski, E.; Filo, G.; Rajda, J. Pressure compensation using flow forces in a multi-section proportional directional control valve. Energy Convers. Manag. 2015, 103, 1052–1064. [Google Scholar] [CrossRef]
- Filo, G.; Lisowski, E. Research on Flow Forces in the USAB10 Control Valve Using a CFD Method. In Proceedings of the Advances in Hydraulic and Pneumatic Drives and Control 2020: NSHP 2020, Trzebieszowice, Poland, 21–23 October 2020; Stryczek, J., Warzyńska, U., Eds.; Lecture Notes in Mechanical Engineering. Springer: Cham, Switzerland, 2021. [Google Scholar] [CrossRef]
Disclaimer/Publisher’s Note: The statements, opinions and data contained in all publications are solely those of the individual author(s) and contributor(s) and not of MDPI and/or the editor(s). MDPI and/or the editor(s) disclaim responsibility for any injury to people or property resulting from any ideas, methods, instructions or products referred to in the content. |
© 2024 by the authors. Licensee MDPI, Basel, Switzerland. This article is an open access article distributed under the terms and conditions of the Creative Commons Attribution (CC BY) license (https://creativecommons.org/licenses/by/4.0/).


