Article

Improvement of Process Conditions for H2 Production by Chemical Looping Reforming

1
Department of Civil, Chemical, Environmental and Materials Engineering (DICAM), Alma Mater Studiorum, University of Bologna, Via Terracini 28, 40131 Bologna, Italy
2
Institute of Science, Technology and Sustainability for Ceramics (ISSMC), National Research Council of Italy (CNR), Via Granarolo, 64, 48018 Faenza, Italy
*
Author to whom correspondence should be addressed.
Energies 2024, 17(7), 1544; https://doi.org/10.3390/en17071544
Submission received: 26 February 2024 / Revised: 14 March 2024 / Accepted: 21 March 2024 / Published: 23 March 2024
(This article belongs to the Special Issue Hydrogen Production, Conversion and Use)

Abstract

:
A syngas production process was studied cyclically, exploiting the redox properties of Ce-based oxygen carriers. The two steps of the looping cycle were investigated through thermogravimetric analysis and fixed bed experiments. While TGA experiments were focused on the identification of the optimal temperatures ranges for methane partial oxidation (900–1000 °C) and carrier regeneration (400–900 °C), fixed bed testing was performed isothermally (at 900 or 950 °C), with a 10% CH4 feed stream in N2 to investigate material stability and cyclic performance reproducibility. The effect of the process times on carbon deposition, specific syngas yields, and selectivity was inspected, together with the investigation of best conditions to fully regenerate the carrier, adjust the syngas final ratio, and to ensure stable performances. The obtained results ensured the possibility to work in fully isothermal operations, with CH4 conversion of up to 38% and specific yields of syngas per mass of O2 carrier between 4.0–6.8 mmol∙g−1, preserved even across cycles, thus paving the path to the development of alternative and effective processes for syngas production. Under the operating conditions of the lab-scale experiment, an effective reforming time was 20 min, corresponding to 1.16 times of the characteristic time of reaction kinetics at 950 °C.

1. Introduction

Steam methane reforming (SMR), (R1), is the most employed process for hydrogen and syngas production, despite its notable contributions to global CO2 emissions [1,2,3] and the high production costs connected with heat supply at high temperature (650–1000 °C) and pressure (5–40 bar) [4,5,6].
C H 4 + H 2 O C O + 3 H 2                         Δ H 298 K 0 = + 205.8   k J m o l
The need to reduce greenhouse gas emissions in terms of the decarbonization of the chemical and energy industry requires the development of novel processes and technologies to enable more sustainable production. Carbon capture can be coupled with conventional SMR processes to reduce emissions [7,8,9]; however, steam reforming also produces syngas with a very high (3 or more) H2 to CO ratio, which is useful for hydrogen production but is often too high for chemical synthesis such as Fischer–Tropsch and methanol production, requiring costly post-treatment to correct the ratio [10,11]. Other technologies for syngas production therefore have been the subjects of increasing interest. For example, methane partial oxidation (PO) exploits an exothermic reaction, which is energetically more favorable than endothermic steam reforming and provides H2/CO at a ratio of 2 (R2) [12,13]. The main critical points of such processes are temperature control and selectivity towards partial oxidation (compared to complete combustion (R3)), as well as catalyst sintering or deactivation due to parasitic coke deposition side reactions.
C H 4 + 1 2 O 2 C O + 2 H 2                         Δ H 298 K 0 = 36.0   k J m o l
C H 4 + 2 O 2 C O 2 + 2 H 2 O                         Δ H 298 K 0 = 802.6   k J m o l
Carbon deposition may occur either through methane thermal decomposition (R4) or the Boudouard reaction (R5):
C H 4 C + 2 H 2                         Δ H 298 K 0 = + 74.5   k J m o l
2 C O C + C O 2                         Δ H 298 K 0 = 172.4   k J m o l
A tight control of methane to oxygen ratio in the feed is needed to ensure selectivity [14,15]. Non-catalytic, thermal partial oxidation processes for syngas production also need to operate at very high temperatures (above 1000 °C) [16] to achieve sufficient selectivity, necessitating the good control of reaction conditions to avoid temperature runaway as well as presenting limits in the construction of reactors capable of withstanding such high temperatures in oxidizing environments. While catalytic processes can potentially operate at lower temperature while maintaining high selectivity, they nonetheless can suffer from problems related to hotspot formation in the catalytic bed due to heat and mass transport limitations, which can lead to a loss of selectivity, thermal stresses in the bed, and catalyst sintering and degradation [17,18]. The coupling of thermo-catalytic process with photocatalysis has been proposed as a solution to increase selectivity and reduce operating temperature for PO processes [19], but optimal catalysts for this application are also yet to be found. Despite recent advancements in the development of novel catalysts, catalytic PO processes are generally still greatly hindered by carbon deposition, which causes very rapid catalyst deactivation and remains a major obstacle to the development of the process on a large scale [20]. The influence of the cracking reaction can also increase the product syngas H2/CO ratio significantly above the stoichiometric 2, which renders the product syngas unsuitable for direct implementation for processes such as methanol synthesis, requiring again costly post-treatment and the adjustment of the ratio to the desired value.
In addition, the direct mixing of methane with pure oxygen implies safety issues with risks of explosions [21] and requires the utilization of an expensive air separation unit (ASU) to provide pure oxygen instead of air in order to avoid the dilution of reaction products with N2 [22], limitations that cannot be solved by catalyst optimization.
These issues may be overcome by implementing PO in a chemical looping (CL) fashion.
The chemical looping approach was first proposed for the combustion of natural gas, hydrocarbons, and solid fuels but can also be applied to SMR and PO reactions [23]. The base concept of the approach is that the reaction can be divided into two separate steps by exploiting the redox properties of a solid carrier material, commonly a metal oxide [24]. Briefly, the metal oxide acts as an oxygen carrier (OC): first, methane is oxidized (either completely for combustion or to syngas in the case of PO or SMR) by the reduction in the OC, then the OC is regenerated (oxidized) through reaction with a source of oxygen (i.e., air, O2, CO2, H2O) to start another cycle. During the regeneration step, coke can also be removed by oxidation, thus limiting its accumulation across repeated cycles. By performing a PO reaction with a CL scheme, direct contact between methane and oxygen is avoided, and the product streams are inherently separated without the need of utilizing a pure oxygen feed. Furthermore, the proper selection of the carrier allows the replacement of a high-quality heat supply with isothermal redox operation improving the system efficiency. Therefore, in recent years, the benefits of a chemical looping approach to combustion and reforming processes have drawn increased interest from researchers [25,26,27]. The selection of a proper oxygen carrier is essential to ensure selectivity towards partial oxidation to syngas rather than complete combustion [28]. Furthermore, an ideal oxygen carrier should be economically competitive while at the same time ensuring stable productivity and structural stability across several repeated looping cycles, without loss in selectivity and yields due to the sintering or poisoning of the carrier, particularly due to coking [29].
Of various possible oxygen carriers, cerium dioxide (CeO2) possesses very promising properties for reforming reactions [30], both as support for Fe- [31,32], Ni- [33,34,35], or Co [36]-based OCs and catalysts or when directly employed. Despite cerium classification as a rare-earth element, its abundance in Earth’s crust is comparable to copper [37] and it can be extracted fairly easily from rare-earth-containing minerals [38,39]. Furthermore, cerium dioxide displays excellent redox properties, namely high oxygen storage capacity for the transition between Ce4+ and Ce3+; a stable cubic fluorite structure which is preserved even over a wide range of non-stoichiometric reductions [40,41]; fast and easily reversible reduction and oxidation reactions [42,43]; fast oxygen diffusion [44]; and high resistance to coke formation due to the re-oxidation of the deposited carbon thanks to the reaction with lattice oxygen [45,46]. The oxidation of methane on cerium dioxide is also selective towards syngas production.
Previous work based on its utilization has defined the reactions involved and highlighted the critical points that should be addressed to implement CeO2 on a large scale [47].
The reactions of a complete PO looping cycle are listed below:
1.
Partial oxidation step:
C H 4 + 2 C e O 2 C O + 2 H 2 + C e 2 O 3                         Δ H 298 K 0 = 332.3   k J m o l
C H 4 + 8 C e O 2 C O 2 + 2 H 2 O + 4 C e 2 O 3                         Δ H 298 K 0 = 670.7   k J m o l
2.
Carrier regeneration (REG) step:
C e 2 O 3 + O 2 2 C e O 2                         Δ H 298 K 0 = 368.3   k J m o l
C + 1 2 O 2 C O                         Δ H 298 K 0 = 110.5   k J m o l
C + O 2 C O 2                         Δ H 298 K 0 = 393.5   k J m o l
It should be mentioned that the (R6) and (R7) Equations represent simplified forms of the reactions schemes for the reduction step, as it is known that several non-stoichiometric cerium oxides species (CeOx, with 1.5 < x < 2) are formed during the process [48], and the same holds true for the corresponding scheme for the oxidation/regeneration process (R8). To avoid the complication of the description of various non-stoichiometric compounds participating in the process, the overall Ce/O ratio in the system will be referred to as the “bed-average” non-stoichiometric coefficient δ in the general oxide formula CeO2−δ [49], with 0 ≤ δ ≤ 0.5. Thus, the bed-average non-stoichiometry δ indicates the extent of the oxygen released by the cerium oxide lattice, from the value of zero indicating completely oxidized CeO2 to the maximum value of 0.5 corresponding to a complete reduction to Ce2O3 (which is to say, CeO1.5). During the carrier regeneration step, the deposited coke is also oxidized and removed (R9) and (R10), which is a considerable advantage of the chemical looping operation compared to conventional catalytic processes.
After the solid–gas reaction, the reduced carrier and potentially deposited carbon are normally regenerated by air or an O2/N2 mixture (R8, R9, R10). However, an interesting approach for this latter step relies on the utilization of CO2, according to the reaction (R11) [50]:
C e 2 O 3 + C O 2 2 C e O 2 + C O                         Δ H 298 K 0 = 85.4   k J m o l
This reaction is particularly interesting as it offers a pathway for CO2 valorization from the perspective of integrating carbon capture and utilization technologies to lower greenhouse gas emissions [51]. The produced CO stream can be valorized either on its own or mixed with the syngas of partial oxidation step in order to modulate the H2/CO ratio. Overall, when the regeneration step utilizes carbon dioxide for OC oxidation, the complete looping cycle amounts to an endothermic dry reforming (DR) reaction [52].
C H 4 + C O 2 2 H 2 + 2 C O                         Δ H 298 K 0 = + 247   k J m o l
Conventional catalytic dry reforming processes are limited by very high coke deposition, leading to rapid catalyst poisoning [53], but in a chemical looping operation, the deposited coke can be removed during each regeneration step. Therefore, chemical looping offers a promising pathway for carbon dioxide utilization in chemical synthesis.
The use of CeO2 for reforming processes has been studied from several perspectives to assess kinetic dependencies in relation to changes in flow rate and temperature. Warren et al. determined that an increase in operating temperature improves methane conversion and syngas yields, as expected from the endothermic nature of the reaction, and that decreasing methane residence time during the reduction enhances syngas yields while reducing CO2 and H2O formation due to further syngas oxidation [54]. Nevertheless, excessively high methane flow rates cause carbon deposition to prevail, as the rate of the release of oxygen from the cerium dioxide lattice becomes the limiting factor [49,55]. Therefore, while high temperature operations are thermodynamically and kinetically favorable for methane reforming, the methane flowrate must be properly regulated and the cycle duration selected in order to avoid the insurgence of carbon deposition as lattice oxygen is depleted. Conversely, carrier re-oxidation was found to be always complete between 900 and 1170 °C, even in the presence of different oxygen sources other than air, such as CO2, which means it is not kinetically limited by temperature changes [49].
The introduction of dopant, supports, and the use of mixed oxides can considerably increase oxygen carriers’ performance [56,57,58]. Alumina is a common, cheap support material, and its interaction with cerium dioxide has been studied in a number of applications. The ceria–alumina composite has demonstrated improved performance as a support for nickel-based catalysts in methane dry reforming reactions, displaying increased coke resistance and structural stability [59]. It has been observed that mixed alumina–cerium dioxide showed improved performance as a catalyst for the pyrolysis of waste oil, with decreased carbon deposition [60] and improved thermal stability for a water–gas shift catalyst [61]. The formation of a CeAlO3 spinel structure has also been found to enhance cerium dioxide reducibility [62,63]. Previous work on fluidized beds evidenced a beneficial effect on carrier performance when 30% weight of alumina was added to cerium oxide [47].
The present study aims to assess the effect of process time optimization, for both the reduction and oxidation steps of methane, in presence of a Ce-based oxygen carrier and mixed CeO2-Al2O3 (30% wt. in Al2O3) oxides, at the gram scale, by means of thermogravimetric analysis and cyclic reaction testing in a fixed bed apparatus, thus reporting the clear results of the effect of process time on overall syngas yields, selectivity, and carbon deposition.
In this research, the conditions needed to reach the highest syngas production rates as well as the ones needed to convert accumulated coke into additional CO, improving syngas yields and adjusting its final ratio, were identified. Furthermore, carrier regeneration by CO2 in cycles with optimized partial oxidation step duration was also verified.

2. Materials and Methods

2.1. Material Preparation

CeO2 commercial powder (PI-KEM, Tamworth, UK, purity 99.9%) was processed in a hydraulic press under an effective pressure of 250 MPa and then crushed and sieved into pellets sized between 0.595 mm and 0.841 mm. The sample was further calcined in air at 900 °C for 1 h, with a heating rate of 3 °C/min starting from room temperature, and the resulting pellets (tap density: 2.78 g cm−3, superficial area: 5.20 m2 g−1) were used for characterization and testing without further treatments.
The composite carrier was instead achieved by the mechanical mixing of CeO2 with a 30% mass fraction of Al2O3 powder (KMS96, Martinswerk GmbH, Bergheim, Germany) followed by pressing, sieving, and thermal treating at the same conditions of pure cerium samples.

2.2. Thermogravimetric Analysis (TGA)

CeO2 redox properties were preliminarily investigated on a STA 449 C Jupiter thermogravimetric balance (NETZSCH, Selb, Germany).
In a typical analysis, a flow rate of 180 mL/min at 4% CH4 in Ar and an air flow rate of 100 mL/min were used on a sample of ~ 80 mg to study the reduction and oxidation, respectively, employing pure argon for the pre-heating while keeping the previous gaseous atmosphere in the transition between stages (reduction and oxidation) for tests carried out under non-isothermal conditions.
Details of the operative conditions employed are listed below:
  • Heating in the Ar atmosphere at 30 °C/min;
  • Reduction for 40 min in 4 vol.% CH4/Ar at a flow rate of 180 mL/min;
  • Oxidation for 15 min with an air flow rate of 100 mL/min.
Two different types of tests were carried out: (i) at variable reduction temperatures, within the range of 900–1000 °C, while keeping the oxidation temperature constant at 900 °C; (ii) at variable oxidation temperatures, within a range of 400–900 °C, with the same reduction temperature of 900 °C.
TGA curves were elaborated by NETZSCH Proteus software (Version 6.1.0), and the results were reported as mass variations in the functions of time and temperature. The TGA results were then examined to be used in a pre-screening of the material performance in order to assess operating conditions in the chemical looping tests.

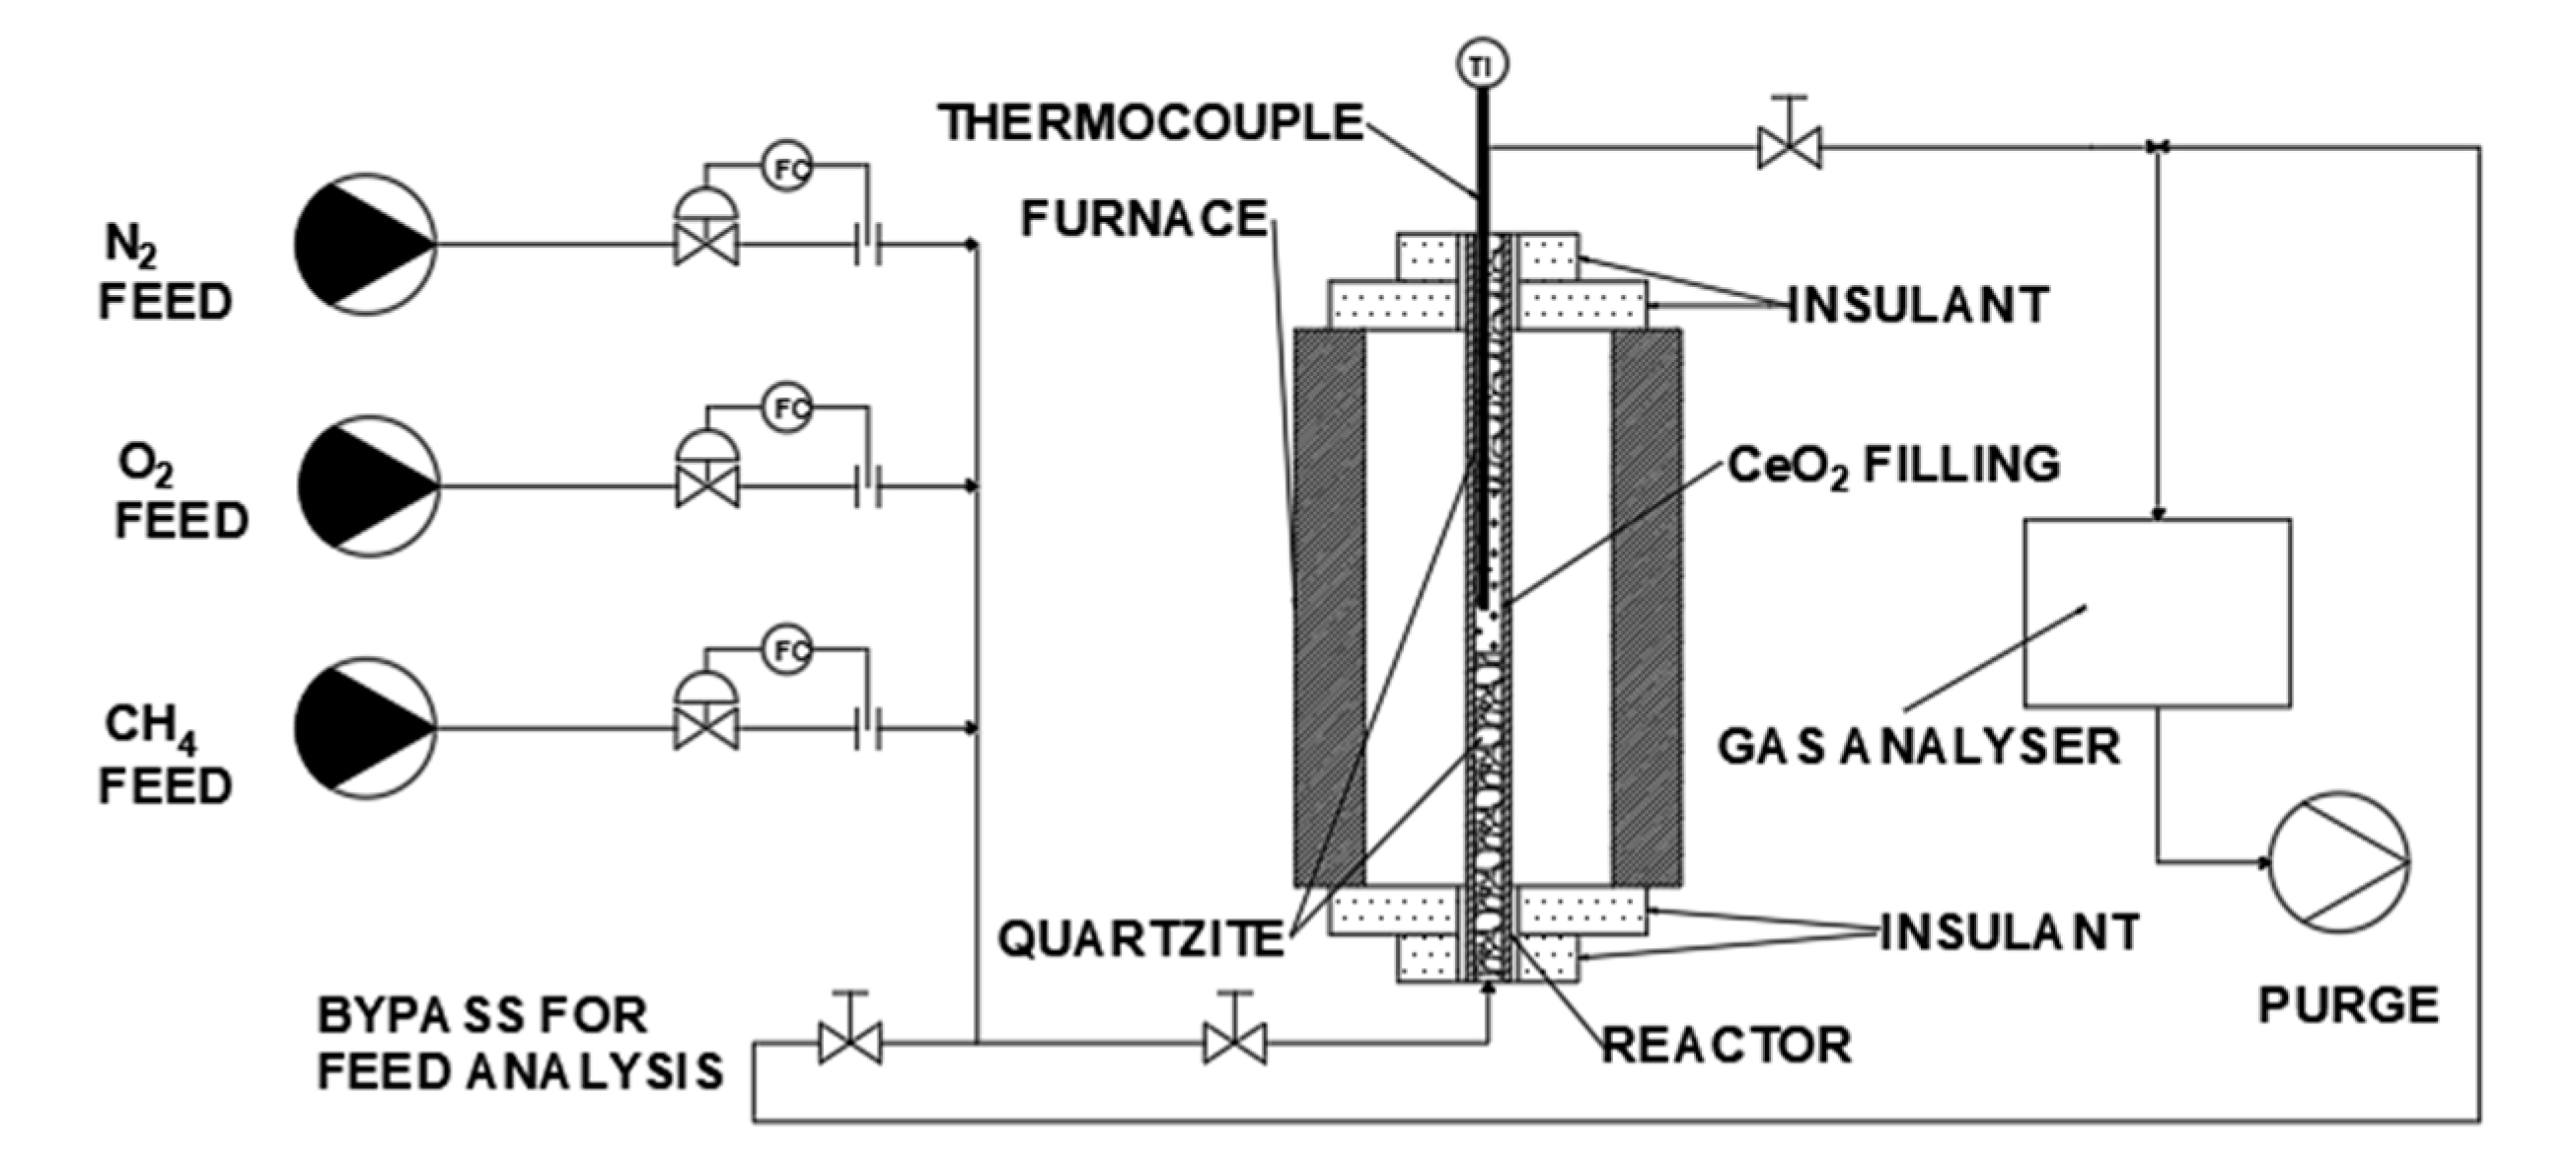
2.3. Chemical Looping Tests

The employed test rig, shown in Figure 1, consists of three main parts: the feeding system, the reaction area, and the gas detector.
O2, methane, and inert (N2) feed flow rates were set and controlled by Bronkhorst mass flowmeters, while the composition of the outgoing gases was monitored continuously through an online syngas analyzer (GEIT 3100 P+ Syngas) equipped with a thermal conductivity detector (TCD), an infrared detector (NDIR), and an electrochemical oxygen sensor.
An AISI-316 stainless steel reactor (ID 10 mm) in fixed bed configuration was enclosed within a tubular furnace, while layers of quartz wool were used to ensure thermal insulation and to guarantee isothermal operation. A K-type thermocouple, from the upper end of the reactor up to the height of the cerium dioxide, was inserted to measure the bed temperature at the middle point. Each reactor test was run isothermally, and the chemical looping operation was achieved by switching the feed composition and flowrate between the partial oxidation and carrier regeneration phases. The separation of the two reaction steps was achieved by the introduction of an intermediate step of purging with nitrogen to ensure the complete removal of the previous gas stream before the next reaction step. Coarse quartzite filler was loaded above and below the carrier layer to ensure its proper placement inside the reactor and to avoid the fluidization and entrainment of the bed. In a typical experiment, ~ 15 g of sample was loaded.
Before the start of the experiment, blank tests, in an inert atmosphere of N2 with the reactor filled with quartzite only, were performed to rule out eventual contributions of the filler or of reactor walls to reaction yields, collecting the output gas signal at all the flow rates and composition explored during the actual testing phase.
For the half cycle of reduction, 1 NL/min of CH4 10 vol.% in N2 was selected as a fixed condition, while several flow rates (1, 3, and 5 NL/min) with different O2 contents (3, 5, and 21 vol.% in N2) were evaluated for regeneration in an attempt to contain the overheating triggered by the exothermic reaction without loss of regeneration efficiency.
For the isothermal cycle, 900 and 950 °C were tried as trial temperatures, and the results were analyzed in terms of gas production rates, carbon build-up, carrier regeneration efficiency, syngas selectivity, yields, and final ratio.
SEM microscopy images (Field Emission GUN-FEG MIRA 3 XMU) were taken of samples both before and after reaction cycles to inspect structural changes linked to the reaction cycles.

2.4. Data Analysis

A method for data processing, where thermogravimetry data were processed based on the rate of oxygen release and the fixed bed tests in terms of outlet gas composition, was developed.
Specifically, in the thermogravimetric analysis, the average reaction rate of partial oxidation and carrier regeneration was determined from the time ( t F t 0 ) required to achieve the maximum carrier conversion calculated as follows:
PO   rate = ( ω 0 P O ω F P O ) / ( ω s t )   t F t 0 / y C H 4 ,
REG   rate = ( ω 0 R E G ω F R E G ) / ( ω s t )   t F R E G t 0 R E G / y O 2 ,
where ω 0 and ω F represent the initial and final weights of the sample as weight percentage and are normalized for the maximum stoichiometric weight loss, ω s t = 4.65 wt.%; calculated for the complete transition from CeO2 to Ce2O3; The rates are also normalized for the CH4 or O2 molar fraction in the feed during reaction step, y C H 4 and y O 2 .
For fixed bed experiments, the data were evaluated assuming the ideal behavior of the gas stream, with the consumed reagent (CH4, O2) and formed products (CO, CO2, H2) calculated from the numerical integration of mass balances based on the continuously known inlet and the outlet compositions.
All mass balances were solved assuming the conservation of N2, used as the basis for determination of the outlet mass flowrate, and the moles number of the generative term of all components, ni,g(t), was obtained as follows:
n i , G ( t ) = t 0 t n ˙ i n y i , i n y N 2 , i n y N 2 , o u t y i , o u t d t
where n ˙ i n   is the inlet flowrate; y N 2 , i n and y N 2 , o u t are the inlet and outlet molar fractions of nitrogen, respectively; y i , i n and y i , o u t are the inlet and outlet molar fraction of species i; and t0 is the starting time of the partial oxidation/carrier regeneration step. As H2O was not directly detected by the gas analyzer, its total produced amount was calculated as result of the total hydrogen balance.
n H 2 O P O = 4   n C H 4 ,   i n 4   n C H 4 ,   o u t 2   n H 2 ,   G 2 = 4   n C H 4 , G 2   n H 2 , G 2
The instantaneous rates of production/consumption were determined as the derivative over time of the amount produced:
d n i , g d t   t i n i , g t i + t n i , g t i t
The amount of carbon deposited during the partial oxidation step was obtained by a molar balance of carbon, calculated as follows:
n C P O = n C H 4 , g P O n C O 2 , g P O n C O , g P O
From this value, the amount of H2 produced by methane cracking was estimated and denoted as n H 2 C according to the stoichiometry of reaction (R4), and consequently, the net H2 obtained by the desired reaction (partial oxidation, PO).
n H 2 P O = n H 2 t o t n H 2 C = n H 2 t o t 2 n C P O
The bed-average oxygen non-stoichiometric coefficient δ of cerium dioxide achieved during partial oxidation was calculated based on the total oxygen species obtained in the same step, assuming that the regeneration step is complete, while cerium dioxide conversion was calculated with reference to the (R6) reaction scheme.
δ = n C O P O + 2 n C O 2 P O + n H 2 O P O n C e O 2
χ C e O 2 r e d = δ 0.5 × 100
On the other hand, the conversion for oxidation was calculated from the oxygen balance during the carrier regeneration step by subtracting the oxygen consumed by the carbon oxidation to the total moles of reacted oxygen:
χ C e O 2 o x = 2 n O 2 , i n r e g 2 · n O 2 , o u t r e g n C O , o u t r e g 2 · n C O 2 , o u t r e g n C O P O + 2 n C O 2 P O + n H 2 O P O × 100
Re-oxidable carbon was determined by the detection of CO and CO2, thus allowing the quantification of carbon build up for each looping cycle:
n C r e g = n C O r e g + n C O 2 r e g
n C a c c = n C P O n C r e g
Key indicators such as selectivity for partial oxidation ( ƞ P O ) , total oxidation ( ƞ T O ) , carbon formation ( ƞ C ) , specific syngas yield (ρ) and ratio, and methane and oxygen conversion were calculated according to the following equations:
ƞ P O = n C O P O / n C H 4 , G P O × 100
ƞ T O = n C O 2 P O / n C H 4 , G P O × 100
ƞ C = n C P O / n C H 4 , G P O × 100
ρ =   ( n H 2 P O + n C O P O ) / m C e O 2 , i n
Syngas   ratio = n H 2 t o t / n C O P O
χ C H 4 = n C H 4 , G P O / n C H 4 , i n P O
χ O 2 = n O 2 , G r e g / n O 2 , i n r e g
For the regeneration step with CO2, the same formulas were utilized, except for the calculation for oxidant conversion and for the carbon removed during regeneration, which were instead obtained as follows:
n C r e g ,   C O 2 = n C O 2 , o u t r e g , C O 2 + n C O , g r e g , C O 2 n C O 2 , i n r e g , C O 2
χ C O 2 = n C O 2 , g r e g , C O 2 / n C O 2 , i n r e g , C O 2

3. Results and Discussion

3.1. TGA

The effects of temperature on reforming and regeneration kinetics were first inspected by TGA, tracking the release of lattice oxygen through monitoring CeO2 weight loss. The purpose of TGA tests was to undertake a first screening of carrier behavior, particularly regarding the effect of reaction temperature on process kinetics and on more limited sample mass, in conditions where external transport limitations were expected to be less relevant compared to reactor tests and a wider temperature range with rapid temperature switches could be more easily investigated. The available apparatuses for TGA tests are unable to detect outgoing gas composition; therefore, information on whether oxygen release was linked to partial oxidation, total combustion, or a combination of both reactions, was not provided by this type of analysis.
Figure 2 displays profiles obtained, first, under constant methane reforming conditions (900 °C) but different regeneration temperatures (400 °C and 600 °C), and second, at a constant regeneration temperature (900 °C) but with varying methane oxidation temperatures (950 °C and 1000 °C).
Looking at the weight loss at different temperatures, i.e., 900 °C (Figure 2a,b), 950 °C (Figure 2c), and 1000 °C (Figure 2d), it is possible to make a comparison of the average rates of oxygen release after equal periods of 40 min.
The graphs show that a larger carrier reduction can be observed when increasing the operation temperature with a weight loss of 4.30% at 950 °C and 4.40% at 1000 °C, which are both very close to the stoichiometric value of 4.65% for the transition from CeO2 to Ce2O3, while highlighting only a weight loss of 2.65% at 900 °C after the same period of analysis. The apparent kinetics are calculated in Table 1, which confirms the positive effect of an increase in temperature on methane oxidation, as already reported in previous works [48,51,64]. Increasing reaction temperature from 900 to 950 °C nearly doubles the reaction rate, showing a clear preference to operations at higher temperatures. A further increase in the temperature to 1000 °C, on the other hand, does not appear to enhance the reaction rate significantly. Together with the limited increase in reduction extent between 950 °C and 1000 °C evidenced before, this lack of increase in kinetics indicates that the energy penalty required to operate the process at a temperature beyond 950 °C would not be justified by a significant increase in productivity. Therefore, a temperature of 950 °C appears to be the optimal condition for the PO step.
However, even if the trends and the calculations are representative, one should keep in mind that the measured oxygen releases could be underestimated due to the potential formation of carbon, which implies an increase in weight that could mask further oxygen release in these tests. The formation of carbon and the selectivity of oxidation are investigated more in depth in the looping tests in the reactor.
As per the average PO rates detected by the TGA test, the rates appear to be constant across the cycles in all examined cases, indicating that material performance is maintained during cyclic operation, independent of the regeneration temperature selected for the cycles. Therefore, it appears that the regeneration step with oxygen does not limit the overall process at any of the temperatures inspected (400, 600, 900 °C), which is in line with previous literature results [49].
For all regeneration temperatures, the sample weight at the end of oxidation reached the initial value and remained stable, suggesting that the complete re-oxidation of cerium dioxide is achieved under the present conditions and that any deposited carbon was completely removed in a maximum of 3 min to achieve full regeneration (Table 2). The rate of reaction slightly increased with temperature, but at all temperatures, the rate of regeneration was much greater than the rates observed for the partial oxidation step; therefore, the regeneration of the carrier with oxygen is demonstrated to not limit the overall looping process.
Previous works on redox behavior of cerium and cerium oxides also evidence fast oxidation kinetics even at room temperature [65,66]. Oxygen is adsorbed onto oxygen vacancies on the reduced ceria surface, forming peroxide and superoxide species which are then quickly dissociated into lattice oxygen atoms [67,68]. A low activation energy of 36 ± 4 kJ/kmol for the oxygen regeneration of ceria was previously reported by Bulfin et al. [69], which is compatible with the observed low effect of reaction temperature on kinetics. On the other hand, the mechanism of CeO2 regeneration through H2O or CO2 oxidation has been observed to involve the formation of hydride, hydroxyl, and carbonate species [70,71,72,73].
The easiness of regeneration, together with a carrier reduction close to the theoretical values, makes ceria a suitable OC to conduct repeated cycles, while 950 °C may be identified as the best operating temperature as it represents a reasonable trade-off between rapid reforming kinetics, carbon deposition, and energy penalties. In order to determine reaction yields and selectivity, chemical looping tests with higher carrier masses were performed in a bench scale reactor and are discussed in the next section.

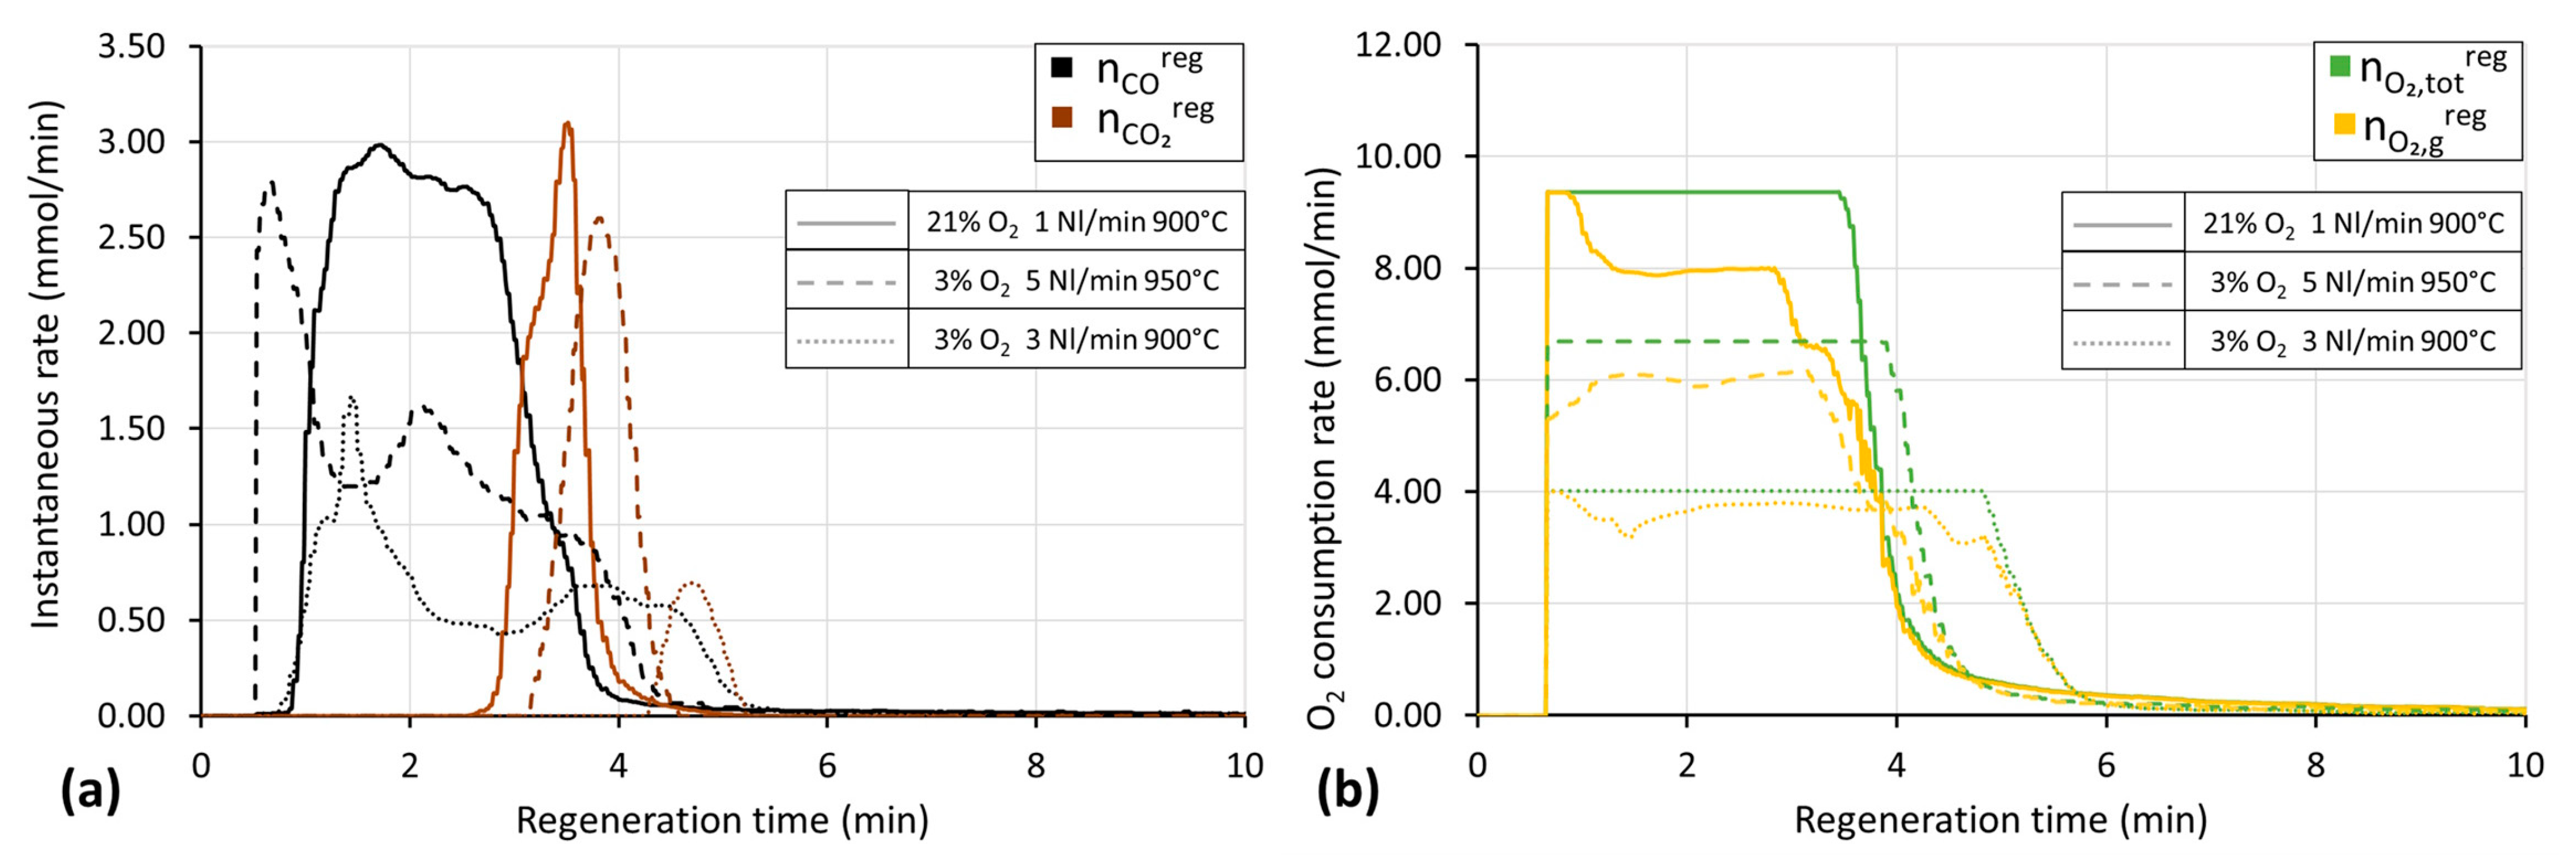
3.2. Chemical Looping Tests

Experiments were first performed for long partial oxidation (60 min) and carrier regeneration (40 min) time periods to determine maximum yields and the rates of production for CO, CO2, and H2 and to obtain the reaction scheme. The results of a complete looping cycle are displayed in Figure 3.
At the start of the partial oxidation step, a sharp peak of CO2 was detected. This is consistent with the previous literature [74], and it is caused by the high availability of superficial oxygen leading to the complete oxidation of methane. It is likely that water is also produced during this phase, even though it cannot be detected by the analytical instrument. This initial non-selective oxidation subsides rapidly within the first 5 min of the reaction at both investigated temperatures, replaced by a selective syngas formation.
Methane profile demonstrates an evident minimum, roughly at the same time when H2 and CO profiles display a maximum peak height, indicating the non-constant rate of the reaction during the PO step, with the conversion declining with the oxygen availability of the OC, as partial methane oxidation and methane thermolysis compete. The conversion of methane is thus never complete at the investigated temperatures.
The formation of solid carbon can be confirmed by two factors: (1) the presence of CO and CO2 peaks during carrier regeneration and (2) the differences in the profiles of the total hydrogen produced and the profile of hydrogen resulting from partial oxidation only (Figure 4a,b; Equation (7)).
In Figure 4a, the cumulative yields of the partial oxidation step are plotted over time, while in Figure 4b, the observed rates of production for CO, CO2, and H2 are plotted against the carrier conversion. It can be observed that production rate of CO rapidly drops to zero at 950 °C once 80% of carrier conversion is reached, indicating that oxygen release from cerium dioxide has ceased, leaving H2, produced by the cracking reaction (R4), as the only product. Therefore, it is not convenient to utilize such a high degree of the carrier conversion.
As expected, carbon deposition is indeed particularly evident at higher temperatures. Interestingly, methane decomposition becomes relevant only once cerium dioxide conversion reaches ~ 40% at both temperatures. Past this point, the methane cracking rate becomes much faster than partial oxidation (0.172 mmol/gCeO2/min of carbon deposition vs. CO production of 0.097 mmol/gCeO2/min at 40% CeO2 conversion at 950 °C).
Compared to the carbon monoxide yield, carbon dioxide production is very limited, both at 900 and 950 °C, and it always remains below 0.1 mmol/gCeO2. A higher temperature favorably affects syngas yield, with CO yield increased by 10%, while that of H2 increased by a factor of 50%, due to the contribution of methane cracking at higher temperatures.
The completion of the PO reaction is reached within 40 min at 900 °C and within 30 min at 950 °C, as indicated by the CO and H 2 P O plateau (Figure 4a); therefore, it is not interesting to conduct the oxidation beyond this time, and much of the carbon produced can be avoided even at higher temperatures by selecting a shorter partial oxidation time without significantly affecting the yield of the reaction.
The trends depicted in Figure 4 indicate that the optimal time for reforming stage lies between 20 and 30 min under the conditions of the present experiment. Indeed, in that time interval, the larger productivities at 950 °C are recorded, with low carbon contributions and a syngas ratio in the range 2.2–2.4, which is particularly suitable for the Fischer–Tropsch synthesis. Rates of partial oxidation rapidly decay after 20 min of reaction at 950 °C, with carbon deposition becoming increasingly relevant. While the maximum yield of carbon monoxide is reached only after 30 min of reaction, the prevalence of carbon deposition past 40% of carrier conversion suggests the adoption of a shorter partial oxidation step of 20 min as the better choice to minimize carbon deposition while still maintaining high syngas yields. It should be noted that at 20 min of reaction time, the yields at 950 °C reach the maximum level that can be obtained with a process time of 30–40 min at 900 °C, thus halving the time needed to reach the same level of cerium dioxide conversion. In the first 20 min of the reaction, the process performance indicators, such as yields, kinetics, and carbon deposition, were better at a higher temperature, confirming the observations obtained from TGA cycles and the previous literature. Indeed, Farooqui et al. also observed the sharp increase in reaction rates between 900 and 1100 °C, observing slow reaction rates at 900 °C while severe carbon deposition occurred at temperatures beyond 1050 °C [55]; these results were also confirmed by Haeussler et al. [75].
Carrier regeneration was also investigated to determine the optimal regeneration time for the looping cycle, specifically looking at the feasibility to obtain the full replenishment of the original oxygen content of the carrier and carbon removal at such high temperatures, which is unsuitable for reactions of an exothermic nature. Indeed, isothermal operation is easier to achieve in industrial application as it avoids heat losses connected to cooling and heating steps between cycles and reduces thermal stresses for fixed bed applications [50], making the selection of the same operation temperature for both stages a desirable operation condition.
During regeneration, cerium dioxide OC and deposited coke compete for the oxygen available in the feed (Figure 3; regeneration step profiles): carbon is initially preferentially oxidized to CO, while upon completion, oxygen availability increases and carbon re-oxidation switches toward complete combustion. The presence of carbon deposited during partial oxidation step did not appear to inhibit carrier regeneration. Figure 5 shows in more detail the results obtained in terms of coke removal and the O2 consumption for the carrier regeneration step conducted under different conditions. The concentration of oxygen and the total flowrate also do not appear to significantly affect the regeneration rate in the tested conditions. As can be seen in Figure 5a, it is evident that in all cases, coke removal is a fairly fast reaction, with the first phase of production of carbon monoxide followed by complete oxidation in the final minutes. Figure 5b displays the trends of the overall O2 consumption as n O 2 , t o t r e g and the amount that reacted with the carrier as n O 2 , g r e g with the difference between the two quantities corresponding to the oxygen needed for carbon removal; as one can see, the two processes take place simultaneously, proving that the presence of carbon does not significantly inhibit carrier regeneration.
As observed in TGA experiments, the operative temperature does not significantly affect carrier regeneration, and the complete regeneration of the carrier (χox = 100%) was observed for all cases within 10 min for all flowrates and oxygen concentrations investigated. The breakthrough of the oxygen profile during the regeneration step therefore appears to coincide both with the complete oxygen restoration of the carrier and complete carbon removal.
To confirm the goodness of partial oxidation and regeneration conditions, consecutive cycles were carried out at 950 °C for the entire looping cycle. Cyclic tests evaluated process performance by exploring the most promising process times for partial oxidation (20 and 30 min), with the regeneration step length being set at the point of oxidant breakthrough. For the regeneration stream in these tests, a diluted stream of 3% v/v O2 in N2 at 5 Nl/min was selected for safety reasons to contain the temperature increase during the carrier regeneration step. Even under these conditions, carrier regeneration could be completed within 5 min (Figure 5b). The average syngas yields, selectivity, and methane conversion for the different conditions tested are reported in Table 3.
The results of cycles at 30 min of partial oxidation are reported in more detail in Figure 6, as an average of two test runs conducted under the same conditions. The remarkable stability of carrier performance can be observed across the repeated reaction cycles, with averaged yields of CO, CO2, H 2 P O , and total hydrogen equal to 1.8 ± 0.1, 0.14 ± 0.01, 3.6 ± 0.2, and 5.0 ± 0.1 mmol/gCeO2, respectively. CeO2 demonstrates high selectivity towards PO and syngas production ( ~ 70% CO vs. ~ 5% of CO2); however, the obtained syngas H2/CO ratio, at an average of 2.8 ± 0.1, is consistently higher than 2, evidencing that methane decomposition is noticeable at this reaction time, with a selectivity for carbon deposition as high as 26% and an average of 0.26 ± 0.08 m m o l   C g C e O 2   being accumulated for each cycle due to incomplete regeneration. The presence of carbon deposited in the previous cycles may have hindered the kinetics of partial oxidation by covering the active sites of CeO2, consequently favoring further carbon deposition. The post-reaction inspection of samples indeed confirmed the presence of black coke particles in the CeO2 pellets. Despite carbon removal not being complete during regeneration, cerium dioxide conversion, methane conversion, and reduction extent remained stable across cycles, at average values of 82 ± 2%, 30.4 ± 0.9%, and 0.41 ± 0.01 mmol/ m m o l O 2 m m o l C e O 2 , respectively, with the given reduction extent corresponding to a weight loss of 3.81% compared to the theoretical maximum of 4.65%. It should be noted that for all cycles, the complete regeneration of the carrier was indeed obtained (χox) together with stable oxygen conversion (average 58 ± 3%). When considering the contribution of the regeneration step to CO production through the oxidation of carbon during the oxidation stage, the overall average H2/CO ratio of the complete cycle amounts to 2.4 ± 0.1. This can be attributed both to the permanence of non-reacted coke even after regeneration and to the fact that carbon was mainly converted to carbon dioxide during the regeneration step in oxygen.
Observed yields, the conversion of methane, and carrier reduction extent are comparable to those of the experiment by Chuayboon et al. at 1000 °C [49]; although it has to be noted that their observed carrier reduction extent (δ) was lower than that seen in Figure 6, as it averaged 0.34 across six cycles for a ceria foam sintered at 1000 °C. The higher operation temperature in their tests led to a higher methane conversion of 44.6% and a lower selectivity for partial oxidation, with the reduction extent also affected by the lower concentration of methane utilized (molar concentration of maximum 8%). This can also be observed when comparing their final cerium dioxide conversion, 64.9–68.6%, to the 79.5–81.6% conversion obtained in the present tests. Their observed average syngas ratio for the partial oxidation step across the six cycles was ~ 2.6, also demonstrating the presence of carbon deposition. Limiting cerium dioxide reduction extent can help to avoid carbon deposition; Fosheim et al. [76], for example, obtained repeatable performances across ten cycles of operations with a much higher methane concentration of 75%. They operated very short cycles of 240 s for partial oxidation and 120 s for carrier regeneration, greatly limiting the maximum reduction extent reached by the cerium dioxide (0.09 at 1228 K and 0.10 at 1274 K) and therefore also limiting carbon deposition and obtaining a syngas with an H2 to CO ratio close to 2. Such low reaction times and high methane concentrations, however, lead to low methane conversions (25% CH4 conversion at 1228 K and 36% at 1274 K) despite operating at higher temperatures compared to those in Figure 6. Nevertheless, the high temperatures favored a high syngas selectivity of 0.76 at 1228 K for both CO and H2, which increased at 0.90 for H2 and 0.82 for CO at higher temperatures. Tests presented in Figure 6 overall display lower selectivity than what is reported by Fosheim et al., with carbon deposition being the cause of a loss of selectivity. However, Fosheim et al. utilized a much higher mass of cerium dioxide (336 g) and a higher methane concentration (75%), thus obtaining the low reduction extent of the carrier, which implies a very poor utilization of the total oxygen exchange capacity available and sacrificing most of the theoretical yield of the reaction. Such a short reaction time is also challenging to achieve in industrial-scale applications. It is therefore suggested that a longer reaction time may in fact be preferable, even at the cost of allowing the occurrence of limited carbon deposition. While achieving complete reduction in cerium dioxide would lead to relevant and undesired carbon deposition, as in tests reported in Figure 6, the optimization of reaction step duration based on observed reaction rates could provide a better compromise between carrier utilization, the maximization of yield, and carbon deposition.
For conditions investigated in this work, the production rate of carbon monoxide is observed to reach a peak at around 40% carrier conversion (Figure 4). In particular, kinetics for PO reaction at 950 °C were observed to sharply decrease after 20 min of the reaction; at this point, 76% of the maximum syngas yield had been achieved, while carbon deposition was reduced to 50% of the amount observed at 30 min, which is to say, once the PO reaction maximum yield had been reached. The produced syngas after a 20 min PO step thus displays a good H2 to CO ratio of 2.2 (Figure 4a). If the excess deposited carbon can be completely oxidized, thus avoiding its accumulation, operation at 20 min of partial oxidation appears to be the optimal choice of reaction time. This would guarantee a good compromise between the utilization of the total carrier oxygen exchange capacity ( ~ 40%), high syngas yields, and carbon deposition.
It is also worth noting that a characteristic reactor time can be computed based on the PO rate observed by the TGA data (Table 1):
τreact = 1/(PO rate yCH4) = 17.24 min
Thus, tref = 20 min represents a value very close to τreact, also considering that the latter was estimated at maximum reaction rate, i.e., y C H 4 = y C H 4 , inlet . The dimensionless reforming time can be expressed as:
tref* = trefreact = 1.16
providing a more general approach for reaction time optimization.
As can be observed in Table 3, when a shorter 20 min partial oxidation step was implemented while not varying regeneration step length, carbon deposition could successfully be reduced: in this case, a much lower average selectivity of 10% towards cracking reaction and a much higher selectivity towards CO formation (82%) can be observed. Average yields of CO, CO2, and total H2 were found to be 1.2 ± 0.3, 0.11 ± 0.01, and 2.9 ± 0.5 mmol/gCeO2, respectively. An average cerium dioxide conversion of 55 ± 8% was reached, and was, as expected, lower than the 82% conversion obtained for the longer tests, while the obtained partial oxidation total yield (H2 + CO) was, on average, around 61% of the yield obtained for the 30 min PO step, which was lower than the expected 76% predicted from single cycle tests (Figure 4a). It should be noted that these shorter partial oxidation cycles displayed greater instability in the cyclic performance of the material compared to longer cycles. This is likely due to increased thermal instability in the operation of the cycles when switching from the shorter partial oxidation cycles to the regeneration step, which leads to a more unstable operation temperature. The longer cycles allow the temperature of the reactor to equilibrate at 950 °C after each step, but this is not achieved in these shorter tests. Despite this increased instability, carbon deposition is significantly inferior for cycles with a shorter partial oxidation time, and selectivity to partial oxidation is consistently increased. Moreover, despite the thermal instability, the rate of partial oxidation, indicated by CO formation, remains close to the one observed for the longer cycles (average of 0.014 ± 0.04 m m o l g C e O 2 s for 20 min PO compared to 0.017 ± 0.002 m m o l g C e O 2 s for 30 min PO).
The produced syngas H2/CO ratio is on average 2.3 ± 0.1, suitable both for the Fischer–Tropsch synthesis and methanol production. The significantly lower carbon deposition is also better compensated by coke oxidation during carrier oxidation: on average, carbon accumulation across cycles amounts to 0.02 ± 0.01 m m o l g C e O 2 , compared to the 0.26 m m o l   C g C e O 2 obtained for the 30 min oxidation step. Part of this residual carbon deposition can be presumably attributed at least partially to temperature changes during the reaction.
The temperature instability of the cycle can be mainly attributed to the highly exothermic regeneration step with oxygen, and it represents a severe issue in maintaining process optimal performance, particularly for the reactor with dimensions on the lab-scale. One option to mitigate this problem is the utilization of less strong oxidants for the carrier regeneration step, such as water and CO2.
Carrier regeneration with CO2 is particularly interesting, as it is considered a good alternative for CO2 utilization with a valuable further production of CO which can be utilized on its own or added to the produced syngas. Therefore, the chemical looping experiments at 20 min for the partial oxidation step were replicated in the same conditions but utilizing 15% CO2 in N2 (representative of flue gas) for carrier regeneration in place of oxygen stream. Indeed, the regeneration of carriers with CO2 is much less exothermic compared to regeneration in oxygen, allowing for milder temperature peaks during carrier regeneration. While energetically less favorable compared to the exothermic oxidation with O2, the utilization of carbon dioxide avoids the high temperature peaks that may negatively affect the use of oxygen for carrier regeneration while providing a pathway for the utilization of carbon dioxide in chemical synthesis, especially if the necessary heat of reaction can be provided through renewable energy sources. Cyclic looping tests performed with the CO2 regeneration of the carrier prove its effectiveness for cerium dioxide regeneration at 950 °C (Table 3), with stable average yields of the partial oxidation step close to the ones obtained when regenerating with O2. However, oxidation kinetics for carbon dioxide are significantly slower if compared to those achieved employing O2 in N2, requiring an increase in regeneration time to 15 min in order to reach CO2 breakthrough and ensure the complete oxygen replenishment of the carrier and maximum carbon removal.
As reported in Table 3, the average yields of CO, CO2, and total H2 were found to be equal to 1.52 ± 0.01, 0.16 ± 0.01, and 3.61 ± 0.11 mmol/gCeO2, respectively, which is higher than those obtained for regeneration in oxygen. The increased yield is probably due to the higher thermal stability of the reaction cycles, which avoids temperature excursion outside the optimal range of the temperature for PO selectivity. The achieved syngas yield corresponds to 76% of the maximum yield of the tests shown in Figure 4a, with a stable reactant conversion of 34.5 ± 1.2% for methane and of 76.8 ± 1.3% for cerium dioxide, which is also comparable to the conversion achieved at 1000 °C by Chuayboon et al. [49], while selectivity to partial oxidation remains high at an average value for CO formation of 0.76 ± 0.03. Cerium dioxide reduction extent (δ) reached an average of 0.38 ± 0.01, again higher than the one reached by Chuayboon et al. and higher than the average 0.28 observed for tests at 20 min with regeneration in oxygen. Carbon accumulation across cycles is average of 0.33 ± 0.07 m m o l g C e O 2 , noticeably higher compared to the 0.02 m m o l g C e O 2 observed for O2. CO2 can completely regenerate the carrier but displays more difficult carbon removal capabilities when compared to oxygen. Table 4 displays the different carbon deposition between cycles with regeneration in O2 and CO2. It is immediately evident that carbon dioxide regeneration does not permit the complete oxidization of carbon formed during the partial oxidation step, even for a longer oxidation time. Coke accumulation is generally undesirable, as over time it could lead to a loss in methane conversion, selectivity, and syngas yield by the obstructing sites of oxygen exchange in the carrier as well as by clogging the reactor column. Nonetheless, it is observed that despite the overall higher carbon accumulation, the conversion of methane, syngas yields, and selectivity are remarkably stable for cycles with carbon dioxide in the tested conditions. Thus, cerium dioxide proved again to be highly resistant to carbon formation.
Mixed ceria–alumina oxides displayed similar behavior compared to the pure ceria carrier with an average conversion of methane of 38.4 ± 3.8% for samples regenerated in an O2 atmosphere and 31.3 ± 1.0% for regeneration in CO2.
It should be noted that for cycles regenerating the sample in a carbon dioxide stream, the resulting selectivity for carbon monoxide production increased in the following partial oxidation step as compared to regeneration in oxygen. It is likely that carbon dioxide, being a milder oxidant compared to oxygen, does not completely restore the superficial oxygen atoms of lattice that are responsible for the formation of carbon dioxide during the partial oxidation, as was indeed previously observed in the literature [64,77]. Interestingly, syngas yields per mass of carrier were comparable between pure cerium dioxide and ceria–alumina samples, suggesting that despite the lower cerium dioxide load, the CeO2-Al2O3 sample did not noticeably lose oxygen exchange capacity. This can likely be attributed to the synergistic effect previously observed for interaction between alumina and cerium dioxide [47]. Ceria–alumina samples overall displayed much lower carbon deposition, suggesting that the presence of alumina may in fact inhibit the formation of carbon.
SEM analyses were performed on samples of cerium dioxide both before and after reaction cycles at partial oxidation for 20 min under either oxygen or CO2 regeneration conditions to inspect structural integrity after reaction cycles (Figure 7).
Figure 7a,b show the structure of the material after calcination. Particles appear to form tightly aggregated grains with small porosities. After cycles with oxygen regeneration (Figure 7c,d) and carbon dioxide regeneration (Figure 7e,f), the material shows an evident grain growth, especially in case of using O2 for the regeneration step (Figure 7d). The microstructure of the sample regenerated with CO2 appears less affected by sintering and the reduction in the degree of voids is more limited (Figure 7f). This is in accordance with the performance observed in chemical looping cycles being more stable after regeneration in carbon dioxide rather than in oxygen, probably due to fewer marked temperature peaks during operation in carbon dioxide. It is unlikely that coke formation plays a significant role in aggregation, as the sample regenerated in CO2 is less aggregated than the sample regenerated in oxygen despite the higher carbon deposition observed in the former. Thus, temperature can be assumed to be the main cause of aggregation. The ceria–alumina carrier before testing (Figure 7g,h) displayed different morphology, with smaller grain sizes and more uniform surfaces compared to the pure ceria samples. After reaction cycles in both O2 and CO2, the structure appears not to have been significantly altered, with no superficial aggregates formed and the much more limited accretion of grains compared to pure cerium dioxide (Figure 7i,j). The interconnected microporous network shown by the composite oxide may contribute to explaining its good yields and selectivity, as while the cerium load is lower compared to pure ceria, the higher surface area improves oxygen availability and the mass transfer of gaseous reactants.

4. Conclusions

A two-step chemical looping process of methane reforming and carrier regeneration was studied, aiming to identify suitable conditions for syngas production (target H2/CO ratio 2–2.5), employing commercial cerium oxide as carrier.
Temperature (in the range of 900–1000 °C) was found to govern the relative contributions of partial oxidation and methane cracking. Higher reaction temperatures significantly increased the maximum carrier conversion achievable and positively affected reaction kinetics but at the cost of increased carbon deposition. Both the TGA and fixed bed reaction test results highlight 950 °C as the optimal reaction temperature for the partial oxidation step of CH4 by ceria. Below 900 °C, process kinetics drop significantly, while temperatures higher than 1000 °C led to limited kinetic improvement (0.58 min−1 at 950 °C vs. 0.59 min−1 at 1000 °C) at the cost of increased cracking.
The regeneration of the carrier with oxygen was consistently proven to be fast across a wide temperature range (400–900 °C), with a short oxidation time even at a low O2 concentration (3%). Therefore, this step does not limit the overall looping process at 950 °C and isothermal operation is viable. Both stable syngas production and full carrier regeneration can be achieved, while coke deposition and accumulation can be effectively limited by the proper regulation of the cycle time.
The adoption of a dimensionless reforming time ratio of 1.16 during the chemical looping tests, in correlation with the apparent rate of reaction measured by TGA analysis, appears to provide a good compromise between reaction yields, syngas selectivity, and carbon deposition for a reactor feed of 10% CH4. The subsequent carrier regeneration step in oxygen is thus able to completely regenerate the carrier and remove traces of deposited carbon. Very high temperature peaks during carrier oxidation even in very diluted oxygen streams lead to the noticeable sintering of the carrier.
The use of carbon dioxide in place of oxygen for the ceria regeneration step, thus requiring a CL dry reforming process, greatly reduces sintering and demonstrates consistently lower carrier agglomeration. On the other hand, greater difficulty is found in achieving complete carbon removal. An average residual amount of 0.33 ± 0.07 m m o l g C e O 2 of carbon per cycle was observed to accumulate; however, when conducting the PO step at the dimensionless time ratio of 1.16, its presence did not appear to negatively affect carrier performance across repeated cycles in terms of syngas selectivity and yields.
The optimal point to interrupt partial oxidation was thus found at the point of carrier reduction (δ) of ~ 0.28 (χCeO2: 55%) when regenerating with O2, and at ~ 0.38 (χCeO2: 76.8%) when regenerating with CO2. Therefore, carbon deposition can be successfully limited while maintaining a high level of carrier utilization.
Mixed ceria–alumina oxide with a 30% wt. alumina content displayed a performance comparable to a pure cerium dioxide carrier when tested under the same conditions, despite the lower cerium load, offering the opportunity to obtain a cheaper oxygen carrier without sacrificing syngas selectivity and yields. As shown by SEM images, the presence of alumina helped prevent grain growth and sintering during high operation temperatures and helped improve the oxygen availability of cerium dioxide. Ceria–alumina therefore appears to be an effective mixture for oxygen carriers in the chemical looping reforming of methane.

Author Contributions

Conceptualization, F.M. and M.M.; methodology, A.S. and M.M.; validation, A.S. and M.B.; formal analysis, A.S. and M.B.; investigation, A.S., E.L. and M.B.; writing—original draft preparation, A.S. and M.B.; writing—review and editing, A.S., M.M. and F.M.; supervision, F.D. and M.M.; project administration, A.S. and F.M.; funding acquisition, F.D. All authors have read and agreed to the published version of the manuscript.

Funding

This work was funded to ISSMC/CNR by the Italian National Programme “Ricerca e Sviluppo di Tecnologie per la Filiera dell’Idrogeno—AdP Italian Ministry MiTE—ENEA, Mission 2, Comp. 2.3.5, PNRR, 2022–2025”. A doctoral grant was provided by the program “FSE REACT-EU, PON 2014 – 2020”.

Data Availability Statement

The data presented in this study are available on request from the corresponding author.

Conflicts of Interest

The authors declare no conflicts of interest.

Nomenclature

AbsAbsolute value, [-]
IDInternal diameter, mm
mMass, g
n ˙ Molar flowrate, mmol/min
toInitial time, min
t Time, min
TTemperature, C or K
τreactCharacteristic reactor time (min)
YMolar fraction
Subscript
0Initial value
AccAccumulation
CCarbon formed during partial oxidation
FFinal
GGenerative term
iSpecies i
inInlet value
MMass, g
RReactant
StStoichiometric
totTotal
Superscripts
AccAccumulation
CCracking contribution
CO2Regeneration step in CO2
POPartial oxidation
RegRegeneration
TotTotal
Greek symbols
δBed-average non-stoichiometric coefficient
ȠSelectivity of the partial oxidation, [-]
χ   Conversion of species i
ω Oxygen mass fraction
Acronyms
SMRSteam methane reforming
ASUAir separation unit
TPOTemperature-programmed oxidation
TGAThermogravimetric analysis
OC Oxygen carrier
DRDry reforming

References

  1. Lunsford, J.H. Catalytic Conversion of Methane to More Useful Chemicals and Fuels: A Challenge for the 21st Century. Catal. Today 2000, 63, 165–174. [Google Scholar] [CrossRef]
  2. Ozbilen, A.; Dincer, I.; Rosen, M.A. Comparative Environmental Impact and Efficiency Assessment of Selected Hydrogen Production Methods. Environ. Impact Assess. Rev. 2013, 42, 1–9. [Google Scholar] [CrossRef]
  3. Noh, Y.G.; Lee, Y.J.; Kim, J.; Kim, Y.K.; Ha, J.S.; Kalanur, S.S.; Seo, H. Enhanced Efficiency in CO2-Free Hydrogen Production from Methane in a Molten Liquid Alloy Bubble Column Reactor with Zirconia Beads. Chem. Eng. J. 2021, 428, 131095. [Google Scholar] [CrossRef]
  4. Abdin, Z.; Zafaranloo, A.; Rafiee, A.; Mérida, W.; Lipiński, W.; Khalilpour, K.R. Hydrogen as an Energy Vector. Renew. Sustain. Energy Rev. 2020, 120, 109620. [Google Scholar] [CrossRef]
  5. Boscherini, M.; Storione, A.; Minelli, M.; Miccio, F.; Doghieri, F. New Perspectives on Catalytic Hydrogen Production by the Reforming, Partial Oxidation and Decomposition of Methane and Biogas. Energies 2023, 16, 6375. [Google Scholar] [CrossRef]
  6. Iminabo, J.T.; Iminabo, M.; Yip, A.C.K.; Pang, S. Hydrogen-Rich Syngas Production via Dry and Steam Reforming of Methane in Simulated Producer Gas over ZSM-5-Supported Trimetallic Catalysts. Energies 2023, 16, 7518. [Google Scholar] [CrossRef]
  7. Luberti, M.; Brown, A.; Balsamo, M.; Capocelli, M. Numerical Analysis of VPSA Technology Retrofitted to Steam Reforming Hydrogen Plants to Capture CO2 and Produce Blue H2. Energies 2022, 15, 1091. [Google Scholar] [CrossRef]
  8. González Palencia, J.C.; Itoi, Y.; Araki, M. Design of a Hydrogen Production System Considering Energy Consumption, Water Consumption, CO2 Emissions and Cost. Energies 2022, 15, 7938. [Google Scholar] [CrossRef]
  9. Cherif, A.; Atwair, M.; Atsbha, T.A.; Zarei, M.; Duncan, I.J.; Nebbali, R.; Sen, F.; Lee, C.J. Enabling Low-Carbon Membrane Steam Methane Reforming: Comparative Analysis and Multi-Objective NSGA-II-Integrated Bayesian Optimization. Energy Convers. Manag. 2023, 297, 117718. [Google Scholar] [CrossRef]
  10. Lu, Y.; Lee, T. Influence of the Feed Gas Composition on the Fischer-Tropsch Synthesis in Commercial Operations. J. Nat. Gas. Chem. 2007, 16, 329–341. [Google Scholar] [CrossRef]
  11. Bozzano, G.; Manenti, F. Efficient Methanol Synthesis: Perspectives, Technologies and Optimization Strategies. Prog. Energy Combust. Sci. 2016, 56, 71–105. [Google Scholar] [CrossRef]
  12. Baltrusaitis, J.; Luyben, W.L. Methane Conversion to Syngas for Gas-to-Liquids (GTL): Is Sustainable CO2 Reuse via Dry Methane Reforming (DMR) Cost Competitive with SMR and ATR Processes? ACS Sustain. Chem. Eng. 2015, 3, 2100–2111. [Google Scholar] [CrossRef]
  13. Osman, A.I. Catalytic Hydrogen Production from Methane Partial Oxidation: Mechanism and Kinetic Study. Chem. Eng. Technol. 2020, 43, 641–648. [Google Scholar] [CrossRef]
  14. Honnery, D.; Moriarty, P.J.P. Syngas Production By Short Contact Time Catalytic Partial Oxidation of Methane. In Hydrogen Production: Prospects and Processes; Honnery, D.R., Moriarty, P., Eds.; Nova Science Publishers Inc.: Hauppauge, NY, USA, 2011; pp. 95–139. ISBN 9781621002468. [Google Scholar]
  15. Gao, M.; Xiao, Y.; Ding, L.; Gao, Y.; Dai, Z.; Yu, G.; Yang, W.; Wang, F. Understanding of the Effect of Oxygen on Soot Formation during Non-Catalytic Partial Oxidation Process. Chem. Eng. Sci. 2024, 284, 119499. [Google Scholar] [CrossRef]
  16. Makaryan, I.A.; Salgansky, E.A.; Arutyunov, V.S.; Sedov, I.V. Non-Catalytic Partial Oxidation of Hydrocarbon Gases to Syngas and Hydrogen: A Systematic Review. Energies 2023, 16, 2916. [Google Scholar] [CrossRef]
  17. Basini, L.; Guarinoni, A.; Aragno, A. Molecular and Temperature Aspects in Catalytic Partial Oxidation of Methane. J. Catal. 2000, 190, 284–295. [Google Scholar] [CrossRef]
  18. Wen, C.; Liu, Y.; Guo, Y.; Wang, Y.; Lu, G. Strategy to Eliminate Catalyst Hot-Spots in the Partial Oxidation of Methane: Enhancing Its Activity for Direct Hydrogen Production by Reducing the Reactivity of Lattice Oxygen. Chem. Commun. 2010, 46, 880–882. [Google Scholar] [CrossRef]
  19. Zhu, Z.; Guo, W.; Zhang, Y.; Pan, C.; Xu, J.; Zhu, Y.; Lou, Y. Research Progress on Methane Conversion Coupling Photocatalysis and Thermocatalysis. Carbon. Energy 2021, 3, 519–540. [Google Scholar] [CrossRef]
  20. Siang, T.J.; Jalil, A.A.; Liew, S.Y.; Owgi, A.H.K.; Rahman, A.F.A. A Review on State-of-the-Art Catalysts for Methane Partial Oxidation to Syngas Production. Catal. Rev. Sci. Eng. 2024, 66, 343–399. [Google Scholar] [CrossRef]
  21. Bharadwaj, S.S.; Schmidt, L.D. Catalytic Partial Oxidation of Natural Gas to Syngas. Fuel Process. Technol. 1995, 42, 109–127. [Google Scholar] [CrossRef]
  22. Kalamaras, C.M.; Efstathiou, A.M. Hydrogen Production Technologies: Current State and Future Developments. Conf. Pap. Energy 2013, 2013, 1–9. [Google Scholar] [CrossRef]
  23. Li, D.; Xu, R.; Gu, Z.; Zhu, X.; Qing, S.; Li, K. Chemical-Looping Conversion of Methane: A Review. Energy Technol. 2020, 8, 1900925. [Google Scholar] [CrossRef]
  24. Haeussler, A.; Abanades, S.; Julbe, A.; Jouannaux, J.; Cartoixa, B. Two-Step CO2 and H2O Splitting Using Perovskite-Coated Ceria Foam for Enhanced Green Fuel Production in a Porous Volumetric Solar Reactor. J. CO2 Util. 2020, 41, 101257. [Google Scholar] [CrossRef]
  25. Khan, M.N.; Cloete, S.; Amini, S. Efficient Production of Clean Power and Hydrogen through Synergistic Integration of Chemical Looping Combustion and Reforming. Energies 2020, 13, 3443. [Google Scholar] [CrossRef]
  26. Padula, S.; Tregambi, C.; Troiano, M.; Di Benedetto, A.; Salatino, P.; Landi, G.; Solimene, R. Chemical Looping Reforming with Perovskite-Based Catalysts for Thermochemical Energy Storage. Energies 2022, 15, 8556. [Google Scholar] [CrossRef]
  27. Czakiert, T.; Krzywanski, J.; Zylka, A.; Nowak, W. Chemical Looping Combustion: A Brief Overview. Energies 2022, 15, 1563. [Google Scholar] [CrossRef]
  28. Tian, M.; Wang, C.; Han, Y.; Wang, X. Recent Advances of Oxygen Carriers for Chemical Looping Reforming of Methane. ChemCatChem 2021, 13, 1615–1637. [Google Scholar] [CrossRef]
  29. Chang, W.; Hu, Y.; Xu, W.; Huang, C.; Chen, H.; He, J.; Han, Y.; Zhu, Y.; Ma, X.; Wang, X. Recent Advances of Oxygen Carriers for Hydrogen Production via Chemical Looping Water-Splitting. Catalysts 2023, 13, 279. [Google Scholar] [CrossRef]
  30. Storione, A.; Minelli, M.; Doghieri, F.; Landi, E.; Miccio, F. Thermodynamic Study on the Feasibility of a New Combined Chemical Looping Process for Syngas Production. Chem. Eng. Trans. 2021, 86, 1267–1272. [Google Scholar] [CrossRef]
  31. Kang, D.; Lee, M.; Lim, H.S.; Lee, J.W. Chemical Looping Partial Oxidation of Methane with CO2 Utilization on the Ceria-Enhanced Mesoporous Fe2O3 Oxygen Carrier. Fuel 2018, 215, 787–798. [Google Scholar] [CrossRef]
  32. García-García, F.R.; Metcalfe, I.S. Chemical Looping Dry Reforming of Methane Using Mixed Oxides of Iron and Cerium: Operation Window. Catal. Commun. 2021, 160, 106356. [Google Scholar] [CrossRef]
  33. Cao, Z.; Zhu, X.; Li, K.; Wei, Y.; He, F.; Wang, H. Moderate-Temperature Chemical Looping Splitting of CO2 and H2O for Syngas Generation. Chem. Eng. J. 2020, 397, 125393. [Google Scholar] [CrossRef]
  34. Pant, K.K.; Jain, R.; Jain, S. Renewable Hydrogen Production by Steam Reforming of Glycerol over Ni/CeO2 Catalyst Prepared by Precipitation Deposition Method. Korean J. Chem. Eng. 2011, 28, 1859–1866. [Google Scholar] [CrossRef]
  35. Löfberg, A.; Guerrero-Caballero, J.; Kane, T.; Rubbens, A.; Jalowiecki-Duhamel, L. Ni/CeO2 Based Catalysts as Oxygen Vectors for the Chemical Looping Dry Reforming of Methane for Syngas Production. Appl. Catal. B 2017, 212, 159–174. [Google Scholar] [CrossRef]
  36. Guerrero-Caballero, J.; Kane, T.; Haidar, N.; Jalowiecki-Duhamel, L.; Löfberg, A. Ni, Co, Fe Supported on Ceria and Zr Doped Ceria as Oxygen Carriers for Chemical Looping Dry Reforming of Methane. Catal. Today 2019, 333, 251–258. [Google Scholar] [CrossRef]
  37. Haxel, G.B.; Hedrick, J.B.; Orris, G.J. Rare Earth Elements—Critical Resources for High Technology. Available online: https://pubs.usgs.gov/fs/2002/fs087-02/ (accessed on 25 May 2022).
  38. Li, K.; Chen, J.; Zou, D. Extraction and Recovery of Cerium from Rare Earth Ore by Solvent Extraction. In Cerium Oxide—Applications and Attributes; IntechOpen: London, UK, 2019. [Google Scholar]
  39. Allahkarami, E.; Rezai, B. A Literature Review of Cerium Recovery from Different Aqueous Solutions. J. Environ. Chem. Eng. 2021, 9, 104956. [Google Scholar] [CrossRef]
  40. Li, P.; Chen, X.; Li, Y.; Schwank, J.W. A Review on Oxygen Storage Capacity of CeO2-Based Materials: Influence Factors, Measurement Techniques, and Applications in Reactions Related to Catalytic Automotive Emissions Control. Catal. Today 2019, 327, 90–115. [Google Scholar] [CrossRef]
  41. Schmitt, R.; Nenning, A.; Kraynis, O.; Korobko, R.; Frenkel, A.I.; Lubomirsky, I.; Haile, S.M.; Rupp, J.L.M. A Review of Defect Structure and Chemistry in Ceria and Its Solid Solutions. Chem. Soc. Rev. 2020, 49, 554–592. [Google Scholar] [CrossRef]
  42. Rotaru, C.G.; Postole, G.; Florea, M.; Matei-Rutkovska, F.; Pârvulescu, V.I.; Gelin, P. Dry Reforming of Methane on Ceria Prepared by Modified Precipitation Route. Appl. Catal. A Gen. 2015, 494, 29–40. [Google Scholar] [CrossRef]
  43. Montini, T.; Melchionna, M.; Monai, M.; Fornasiero, P. Fundamentals and Catalytic Applications of CeO2-Based Materials. Chem. Rev. 2016, 116, 5987–6041. [Google Scholar] [CrossRef]
  44. Ackermann, S.; Scheffe, J.R.; Steinfeld, A. Diffusion of Oxygen in Ceria at Elevated Temperatures and Its Application to H2O/CO2 Splitting Thermochemical Redox Cycles. J. Phys. Chem. C 2014, 118, 5216–5225. [Google Scholar] [CrossRef]
  45. Ramírez-Cabrera, E.; Atkinson, A.; Chadwick, D. Reactivity of Ceria, Gd- and Nb-Doped Ceria to Methane. Appl. Catal. B 2002, 36, 193–206. [Google Scholar] [CrossRef]
  46. Teh, L.P.; Setiabudi, H.D.; Timmiati, S.N.; Aziz, M.A.A.; Annuar, N.H.R.; Ruslan, N.N. Recent Progress in Ceria-Based Catalysts for the Dry Reforming of Methane: A Review. Chem. Eng. Sci. 2021, 242, 116606. [Google Scholar] [CrossRef]
  47. Miccio, F.; Landi, E.; Murri, A.N.; Minelli, M.; Doghieri, F.; Storione, A. Fluidized Bed Reforming of Methane by Chemical Looping with Cerium Oxide Oxygen Carriers. Chem. Eng. Res. Des. 2023, 191, 568–577. [Google Scholar] [CrossRef]
  48. Chuayboon, S.; Abanades, S.; Rodat, S. Stepwise Solar Methane Reforming and Water-Splitting via Lattice Oxygen Transfer in Iron and Cerium Oxides. Energy Technol. 2020, 8, 1–12. [Google Scholar] [CrossRef]
  49. Chuayboon, S.; Abanades, S.; Rodat, S. Solar Chemical Looping Reforming of Methane Combined with Isothermal H2O/CO2 Splitting Using Ceria Oxygen Carrier for Syngas Production. J. Energy Chem. 2020, 41, 60–72. [Google Scholar] [CrossRef]
  50. Gao, X.; Vidal, A.; Bayon, A.; Bader, R.; Hinkley, J.; Lipinski, W.; Tricoli, A. Efficient Ceria Nanostructures for Enhanced Solar Fuel Production via High-Temperature Thermochemical Redox Cycles. J. Mater. Chem. A Mater. 2016, 4, 9614–9624. [Google Scholar] [CrossRef]
  51. Nair, M.M.; Abanades, S. Tailoring Hybrid Nonstoichiometric Ceria Redox Cycle for Combined Solar Methane Reforming and Thermochemical Conversion of H2O/CO2. Energy Fuels 2016, 30, 6050–6058. [Google Scholar] [CrossRef]
  52. Mantripragada, H.C.; Veser, G. Hydrogen Production via Chemical Looping Dry Reforming of Methane: Process Modeling and Systems Analysis. AIChE J. 2022, 68, e17612. [Google Scholar] [CrossRef]
  53. Aramouni, N.A.K.; Touma, J.G.; Tarboush, B.A.; Zeaiter, J.; Ahmad, M.N. Catalyst Design for Dry Reforming of Methane: Analysis Review. Renew. Sustain. Energy Rev. 2018, 82, 2570–2585. [Google Scholar] [CrossRef]
  54. Warren, K.J.; Carrillo, R.J.; Greek, B.; Hill, C.M.; Scheffe, J.R. Solar Reactor Demonstration of Efficient and Selective Syngas Production via Chemical-Looping Dry Reforming of Methane over Ceria. Energy Technol. 2020, 8, 1–13. [Google Scholar] [CrossRef]
  55. Farooqui, A.; Bose, A.; Boaro, M.; Llorca, J.; Santarelli, M. Assessment of Integration of Methane-Reduced Ceria Chemical Looping CO2/H2O Splitting Cycle to an Oxy-Fired Power Plant. Int. J. Hydrogen Energy 2020, 45, 6184–6206. [Google Scholar] [CrossRef]
  56. Li, K.; Wang, H.; Wei, Y.; Yan, D. Syngas Production from Methane and Air via a Redox Process Using Ce-Fe Mixed Oxides as Oxygen Carriers. Appl. Catal. B 2010, 97, 361–372. [Google Scholar] [CrossRef]
  57. Zheng, Y.; Li, K.; Wang, H.; Zhu, X.; Wei, Y.; Zheng, M.; Wang, Y. Enhanced Activity of CeO2-ZrO2 Solid Solutions for Chemical-Looping Reforming of Methane via Tuning the Macroporous Structure. Energy Fuels 2016, 30, 638–647. [Google Scholar] [CrossRef]
  58. Laqdiem, M.; Carrillo, A.J.; Dimitrakopoulos, G.; Balaguer, M.; Garcia-Fayos, J.; Ghoniem, A.F.; Serra, J.M. Impact of Lattice Properties on the CO2 Splitting Kinetics of Lanthanide-Doped Cerium Oxides for Chemical Looping Syngas Production. Solid. State Ion. 2023, 394, 116192. [Google Scholar] [CrossRef]
  59. Li, S.; Wang, X.; Cao, M.; Lu, J.; Qiu, L.; Yan, X. Engineering the Interface and Interaction Structure on Highly Coke-Resistant Ni/CeO2-Al2O3 Catalyst for Dry Reforming of Methane. Jiegou Huaxue 2022, 41, 2212007–2212014. [Google Scholar] [CrossRef]
  60. Khalid, M.A.A.; Abdullah, N.; Ibrahim, M.N.M.; Taib, R.M.; Rosid, S.J.M.; Shukri, N.M.; Yahaya, N.F.; Abdullah, W.N.B.W. Catalytic Pyrolysis of Waste Oil into Hydrocarbon Fuel Utilizing Cerium Oxide Catalyst. Korean J. Chem. Eng. 2022, 39, 1487–1495. [Google Scholar] [CrossRef]
  61. Kim, J.-K.; Kim, Y.; Park, J.-W.; Bae, J.-S.; Yoon, D.-Y.; Lee, J.-G.; Kim, J.-H.; Han, C. Preparation of CuO-CeO2-Al2O3 Catalyst with Mesopore Structure for Water Gas Shift Reaction. Korean J. Chem. Eng. 2009, 26, 32–35. [Google Scholar] [CrossRef]
  62. Damyanova, S.; Perez, C.A.; Schmal, M.; Bueno, J.M.C. Characterization of Ceria-Coated Alumina Carrier. Appl. Catal. A Gen. 2002, 234, 271–282. [Google Scholar] [CrossRef]
  63. Prakash, A.S.; Shivakumara, C.; Hegde, M.S. Single Step Preparation of CeO2/CeAlO3/γ-Al2O3 by Solution Combustion Method: Phase Evolution, Thermal Stability and Surface Modification. Mater. Sci. Eng. B 2007, 139, 55–61. [Google Scholar] [CrossRef]
  64. Warren, K.J.; Scheffe, J.R. Kinetic Insights into the Reduction of Ceria Facilitated via the Partial Oxidation of Methane. Mater. Today Energy 2018, 9, 39–48. [Google Scholar] [CrossRef]
  65. Wheeler, D.W. Kinetics and Mechanism of the Oxidation of Cerium in Air at Ambient Temperature. Corros. Sci. 2016, 111, 52–60. [Google Scholar] [CrossRef]
  66. Bulfin, B.; Call, F.; Vieten, J.; Roeb, M.; Sattler, C.; Shvets, I.V. Oxidation and Reduction Reaction Kinetics of Mixed Cerium Zirconium Oxides. J. Phys. Chem. C 2016, 120, 2027–2035. [Google Scholar] [CrossRef]
  67. Mullins, D.R. The Surface Chemistry of Cerium Oxide. Surf. Sci. Rep. 2015, 70, 42–85. [Google Scholar] [CrossRef]
  68. Schweke, D.; Rafailov, G.; Zalkind, S.; Azulai, O.; Rabinovitch, L.; Hayun, S. Elucidating the Role of Hydrogen Species Originating from Water Vapor in the Oxidation Mechanism of Cerium. Corros. Sci. 2022, 196, 110030. [Google Scholar] [CrossRef]
  69. Bulfin, B.; Lowe, A.J.; Keogh, K.A.; Murphy, B.E.; Lübben, O.; Krasnikov, S.A.; Shvets, I.V. Analytical Model of CeO2 Oxidation and Reduction. J. Phys. Chem. C 2013, 117, 24129–24137. [Google Scholar] [CrossRef]
  70. Zhao, Z.; Uddi, M.; Tsvetkov, N.; Yildiz, B.; Ghoniem, A.F. Redox Kinetics Study of Fuel Reduced Ceria for Chemical-Looping Water Splitting. J. Phys. Chem. C 2016, 120, 16271–16289. [Google Scholar] [CrossRef]
  71. Zhao, Z.; Uddi, M.; Tsvetkov, N.; Yildiz, B.; Ghoniem, A.F. Enhanced Intermediate-Temperature CO2 Splitting Using Nonstoichiometric Ceria and Ceria-Zirconia. Phys. Chem. Chem. Phys. 2017, 19, 25774–25785. [Google Scholar] [CrossRef] [PubMed]
  72. Grünbacher, M.; Klötzer, B.; Penner, S. CO2 Reduction by Hydrogen Pre-Reduced Acceptor-Doped Ceria. ChemPhysChem 2019, 20, 1706–1718. [Google Scholar] [CrossRef]
  73. Zhou, Q.; Akber, H.; Zhao, A.; Yang, F.; Liu, Z. Interaction of Water with Ceria Thin Film. ChemCatChem 2023, 15, e202300318. [Google Scholar] [CrossRef]
  74. Otsuka, K.; Ushiyama, T.; Yamanaka, I. Partial Oxidation of Methane Using the Redox of Cerium Oxide. Chem. Lett. 1993, 22, 1517–1520. [Google Scholar] [CrossRef]
  75. Haeussler, A.; Chuayboon, S.; Abanades, S. Solar Redox Cycling of Ceria in a Monolithic Reactor for Two-Step H2O/CO2 Splitting: Isothermal Methane-Induced Reduction versus Temperature-Swing Cycle. AIP Conf. Proc. 2020, 2303, 170009. [Google Scholar] [CrossRef]
  76. Fosheim, J.R.; Hathaway, B.J.; Davidson, J.H. High Efficiency Solar Chemical-Looping Methane Reforming with Ceria in a Fixed-Bed Reactor. Energy 2019, 169, 597–612. [Google Scholar] [CrossRef]
  77. Warren, K.J.; Scheffe, J.R. Role of Surface Oxygen Vacancy Concentration on the Dissociation of Methane over Nonstoichiometric Ceria. J. Phys. Chem. C 2019, 123, 13208–13218. [Google Scholar] [CrossRef]
Figure 1. Schematic of experimental rig.
Energies 17 01544 g001
Figure 2. Oxygen weight variation as a function of time and temperature. Partial oxidation temperature of 9000 °C, regeneration at 400 °C (a), 600 °C (b); regeneration temperature 900 °C, partial oxidation temperature 950 °C (c), 100 °C (d). In all figures, continuous line indicates weight percentage, dotted line indicates temperature profiles. Arrows indicate y-axis for the two profiles.
Energies 17 01544 g002
Figure 3. Outlet gas composition profiles of a complete looping cycle on a fresh CeO2 sample at 950 °C (CH4 10 vol.% in N2 and O2 3 vol.% in N2).
Energies 17 01544 g003
Figure 4. (a) Cumulative yields over time at 900 °C and 950 °C for the partial oxidation step; (b) syngas production rates as a function of CeO2 conversion at 900 °C and 950 °C (CH4 10 vol.% in N2).
Energies 17 01544 g004
Figure 5. Instantaneous CO and CO2 rate of production, (a), and oxygen consumption profiles during carrier regeneration under different conditions, (b).
Energies 17 01544 g005
Figure 6. Yields and methane conversion of the partial oxidation step of CeO2 for consecutive cycles at 950 °C with the reforming process maintained for 30 min and the regeneration process for ~ 5 min.
Energies 17 01544 g006
Figure 7. SEM microscopy of sample: CeO2 before redox cycles (a,b); CeO2 after reaction with O2 regeneration (c,d); CeO2 after reaction cycles with CO2 regeneration (e,f); CeO2-Al2O3 before (g,h) and after cycles in both O2 and CO2 (i,j).
Energies 17 01544 g007
Table 1. Average reactions rates for the partial oxidation averaged across four looping cycles.
ParameterCase iCase iiCase iiiCase iiii
TPO (°C)9009009501000
TREG (°C)400600900900
PO rate (min−1) 0.35   ± 0.010.36 ± 0.01 0.58   ± 0.01 0.59   ± 0.08
Table 2. Time required to achieve complete carrier regeneration averaged across three cycles.
ParameterCase iCase iiCase iii
TREG (°C)400600900
TPO (°C)900900950–1000
tREG (min)2.5 ± 0.12.3 ± 0.13.0 ± 0.1
REG rate (min−1)1.0 ± 0.11.2 ± 0.21.44 ± 0.05
Table 3. Average yields, selectivity, and methane conversions during oxygen or carbon dioxide regeneration.
SampleGastPO (min)ηCO2 ηCO ηC CO Yield (mmol/gcarrier)H2 Yield (mmol/gcarrier)χCH4
[%]
CeO2O2300.05 ± 0.010.68 ± 0.040.26 ± 0.041.80 ± 0.075.01 ± 0.1130.4 ± 0.9
CeO2O2200.08 ± 0.020.82 ± 0.050.10 ± 0.041.24 ± 0.252.88 ± 0.5025.4 ± 4.1
CeO2CO2200.08 ± 0.010.76 ± 0.030.16 ± 0.031.52 ± 0.013.61 ± 0.1134.5 ± 1.2
CeO2-Al2O3O2200.27 ± 0.020.63 ± 0.010.10 ± 0.011.38 ± 0.172.71 ± 0.3538.4 ± 3.8
CeO2-Al2O3CO2200.18 ± 0.020.75 ± 0.010.07 ± 0.021.33 ± 0.052.76 ± 0.1231.3 ± 1.0
Table 4. Specific amount of accumulated carbon during consecutive looping cycles for regeneration in O2 and CO2.
CycleAccumulated C (mmol/gCeO2)
O2 RegenCO2 Regen
100.275
20.0200.241
300.252
40.0250.278
50.0300.312
60.0260.340
70.0300.373
8(-)0.405
9(-)0.440
Disclaimer/Publisher’s Note: The statements, opinions and data contained in all publications are solely those of the individual author(s) and contributor(s) and not of MDPI and/or the editor(s). MDPI and/or the editor(s) disclaim responsibility for any injury to people or property resulting from any ideas, methods, instructions or products referred to in the content.

