1. Introduction
Occasional incidents of lithium-ion batteries, including overheating, fires, and even explosions, have prompted safety concerns. Battery hazards are classified into physical and chemical types according to the damage they cause [
1]. Physical hazards encompass battery case rupture, while chemical hazards arise from the leakage or venting of corrosive or toxic materials within the battery. Both types of hazards can cause damage to the equipment and environment due to the reactive and flammable nature of active lithium present and/or the toxic nature of materials leaked from batteries [
2]. Cylindrical lithium-ion batteries are equipped with multiple safety mechanisms designed to safeguard against potential hazards [
3,
4].
A current interrupt device (CID) serves as a protective mechanism integrated into batteries to mitigate the risks associated with elevated internal pressure or temperature. It interrupts the electrical connection within a battery if the cell pressure or battery temperature surpasses a predefined threshold [
3]. The positive temperature coefficient (PTC) thermistor provides protection against overcurrent or excessive temperature conditions and is generally made of a thin annulus consisting of a conductive polymer layer between two metal annular disks [
3]. Safety vents, also known as pressure relief vents or safety pressure vents, are designed to release excess pressure that may build up within the battery and prevent it from rupturing or exploding [
5,
6,
7].
One concern in cylindrical lithium-ion batteries is electrolyte leakage [
8,
9,
10]. Loss of electrolyte can lead to batteries drying out, which can result in capacity reduction, performance degradation, and safety hazards [
11]. The electrolyte in a lithium-ion battery enables the movement of lithium ions between the positive and negative electrodes during charging and discharging. The electrolyte usually consists of lithium salts, organic solvents, and additives [
12]. When the electrolyte leaks, in addition to deteriorating the battery’s capacity and performance, the leaked electrolyte can react with the moisture in the air and generate hydrofluoric acid (HF), which can corrode the electrode’s active materials [
11].
Lithium-ion batteries are sealed through a method called dual sealing to prevent the escape of electrolytes and gases. Cylindrical batteries use gaskets and seal rings to insulate and seal the cathode terminal and the can [
13]. This is the first sealing. These gaskets and seal rings, which serve as terminal-can insulators and come into direct contact with the organic electrolyte in the can, must be chemically stable and resist pressing creep simultaneously [
14]. They can be made from Ultem
® (polyetherimide), Ryton
® (polyphenylene sulfide), and fluoropolymers (PFA plastic) because of their high heat resistance, chemical resistance, and ability to mold thin walls [
15]. The second seal is created during the crimping process as part of the manufacturing process, which creates a hermetic seal by deforming the metal casing to securely enclose the internal components.
Commercial lithium-ion batteries typically have an upper operational temperature limit ranging from 50 °C to 60 °C [
16]. However, in practical scenarios such as electric vehicles, instances can occur where these batteries are exposed to temperatures exceeding 75 °C [
17]. According to the International Air Transport Association (IATA), heat damage may occur during cargo transloading, a stage of shipping. During transloading, temperatures may exceed 75 °C [
18].
Many lithium-ion battery safety and performance standards were developed, including UN 38.3 [
19], UL 1642 [
20], UL 2054 [
21], IEC 62133 [
22], and ISO 12405 [
23]. These standards require steady-state temperature tests as well as temperature cycling tests [
24,
25]. The UN Manual of Tests and Criteria, Section 38.3, outlines specific test procedures and requirements for lithium-ion batteries [
19]. These tests help identify potential issues and ensure the safe transportation of lithium-ion batteries. UN 38.3 serves as the foundation for regulatory requirements concerning the shipment of lithium-ion batteries in many countries. Manufacturers and shippers are often legally required to comply with UN 38.3.
The thermal test in the UN 38.3 standard aims to assess battery seal integrity and internal electrical connections by cycling the samples between two temperatures [
19]. Based on UN 38.3 Revision 7, the battery is stored at 72 ± 2 °C for at least 6 h, followed by storage for at least 6 h at −40 ± 2 °C [
19]. Standard IEC62133 instructs the battery to be stored at 72 ± 2 °C and −40 ± 2 °C for 4 h at each temperature [
22]. Both standards defined the maximum time to reach from one test temperature to the other as 30 min. This procedure is to be repeated for 10 cycles, after which all the test batteries are stored for 24 h at ambient temperature (20 ± 5 °C).
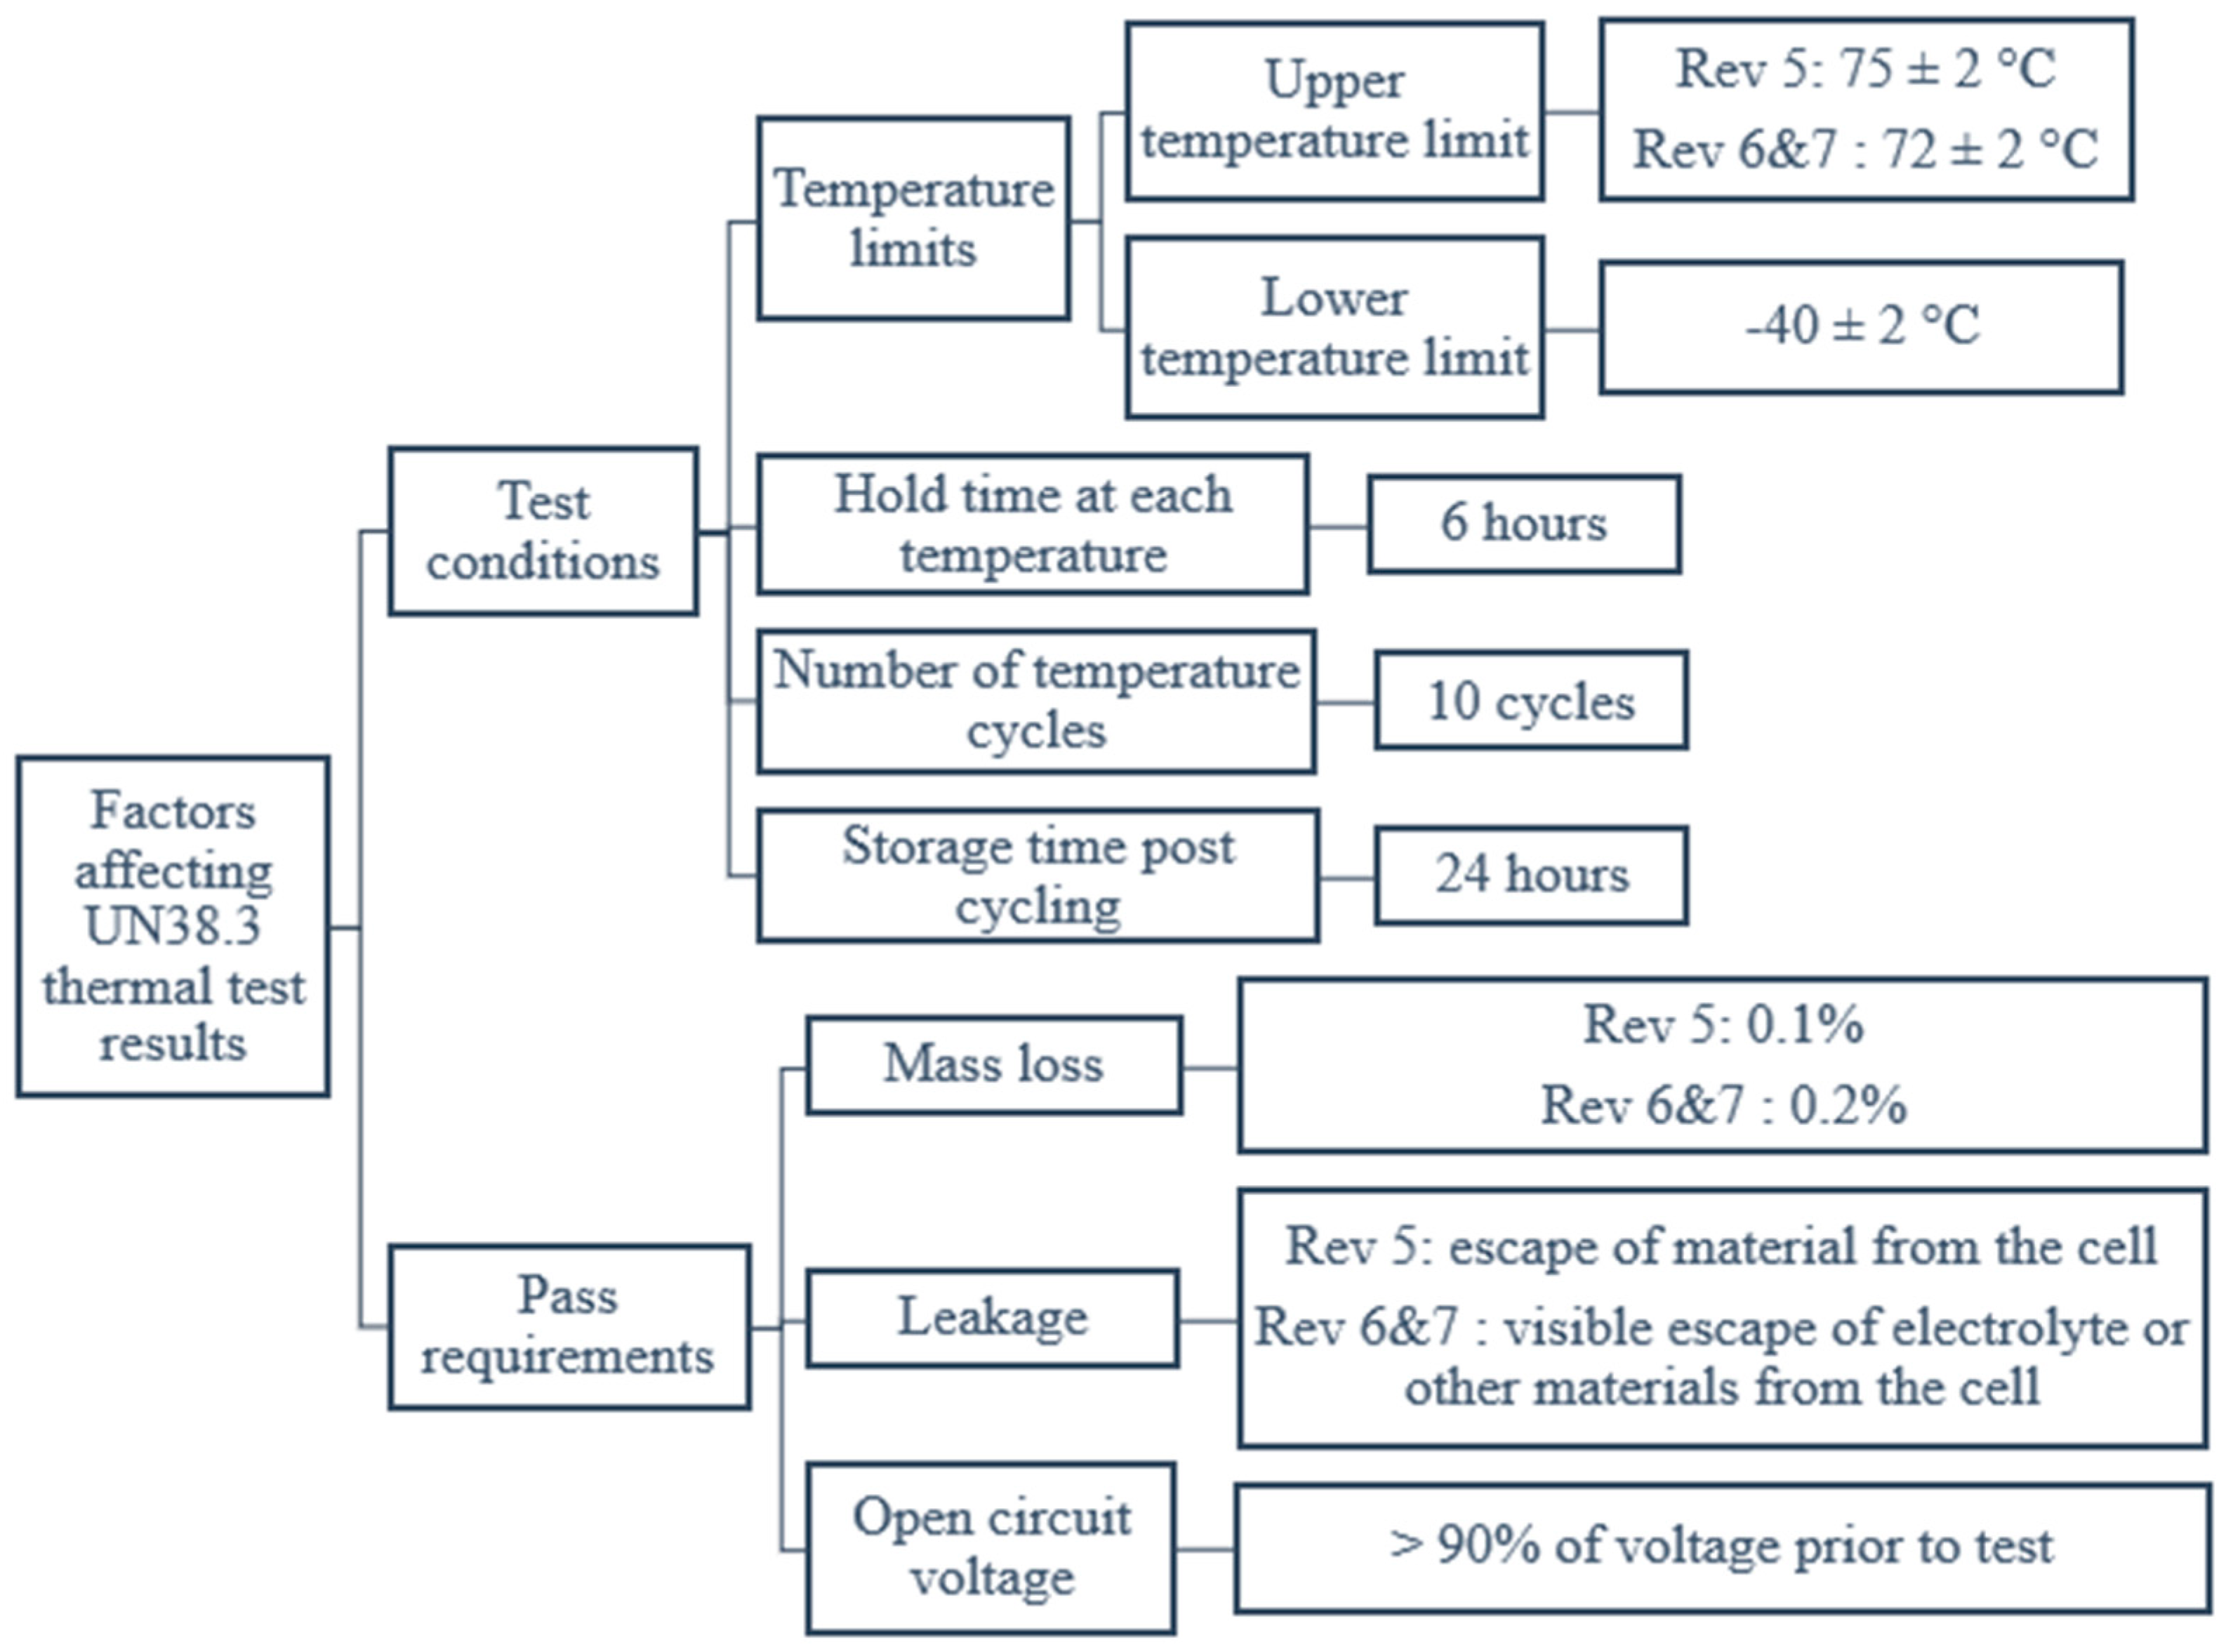
The UN 38.3 standard is continuously updated to meet evolving industry requirements.
Figure 1 shows the factors affecting the thermal test results from revisions 5 to 7. Revision 5 of the standard was released in 2009 and has an upper-temperature limit of 75 ± 2 °C. The passing criteria in revision 5 is “no mass loss, no leakage, no venting, no disassembly, no rupture, and no fire, and the open circuit voltage of each test cell or battery after testing is not less than 90% of its voltage immediately prior to this procedure [
26]”. Leakage is defined as the escape of material from a cell or battery, and mass loss is defined as the loss of mass that exceeds the values shown in
Table 1.
In 2015, revision 6 was released, in which “no mass loss” was removed from the requirement section. Instead, it was integrated into the definition of leakage, which is “the visible escape of electrolyte or other materials from a cell or battery, or the loss of material (excluding battery casings, handling devices, or labels) from a cell or battery in a manner that exceeds the values provided in
Table 2 [
27]”. This new definition introduced the additional criterion of requiring visible evidence to identify leakage in addition to mass loss. Additionally, the upper-temperature limit was reduced from 75 ± 2 °C to 72 ± 2 °C in revision 7 in 2019 [
19].
In this study, to determine the robustness of batteries’ seal integrity under high-temperature impact, the upper-temperature limit is increased from 72 °C to 80 °C. The experimental setup and test procedure for temperature cycling (TC) are presented in
Section 2. Inspection results from optical inspection, weight, capacity, impedance measurements, and computed tomography (CT) scans are discussed in
Section 3.
Section 4 delves into the mechanism of electrolyte leakage path formation.
Section 5 assesses the temperature limits and requirements for the thermal test stated in UN 38.3. The conclusions highlight the need for the standard to ensure batteries have margins to withstand real-world temperature impacts.
2. Experimental Setup
This paper presents an experimental study on the thermal performance and structural integrity of 10 commercial 14500 cylindrical lithium-ion batteries. The batteries have a diameter of 14 mm and a height of 50 mm, an average weight of 19.5 g, and a rated capacity of 750 mAh. Capacity measurements, electrochemical impedance spectroscopy (EIS) studies, CT scans, and thermal analysis of the battery components were conducted to identify the electrolyte leakage path.
Capacity measurements were conducted through constant current–constant voltage (CC-CV) charging and constant current (CC) discharging using a battery tester from Arbin Instruments, Texas, USA. A 0.2 C charge–discharge rate was applied in the voltage range of 3 V to 4.2 V with a constant voltage cut-off current of 0.02 C. EIS measurements were performed using a Verastat 4 potentiostat from AMETEK Scientific Instruments, Tennessee, USA, over a frequency range of 10 mHz to 10 kHz. To compare the internal structure of the batteries before and after temperature cycling, a CT scan was conducted on battery No.1 before TC.
Batteries for the TC tests were discharged to a 50% state of charge (SOC), aiming to maintain uniform testing conditions. The IEC 62133 standard mandates a 50% SOC for testing [
22], while the UN 38.3 standard requires 10 batteries to undergo testing at 0% SOC and 10 at 100% SOC. As our selected test condition is less severe than those specified, we utilize the passing criteria of UN 38.3 to determine battery failure. The TC profile for each cycle involved cycling between 25 °C and 80 °C with a ramp rate of 0.25 °C/minute, and there are 2-h dwell periods at minimum/maximum temperatures. Each complete TC set consisted of 10 individual cycles. We conducted a total of 2 sets of TC. Henceforth, “TC1” denotes the first set of temperature cycling, while “TC2” denotes the second set.
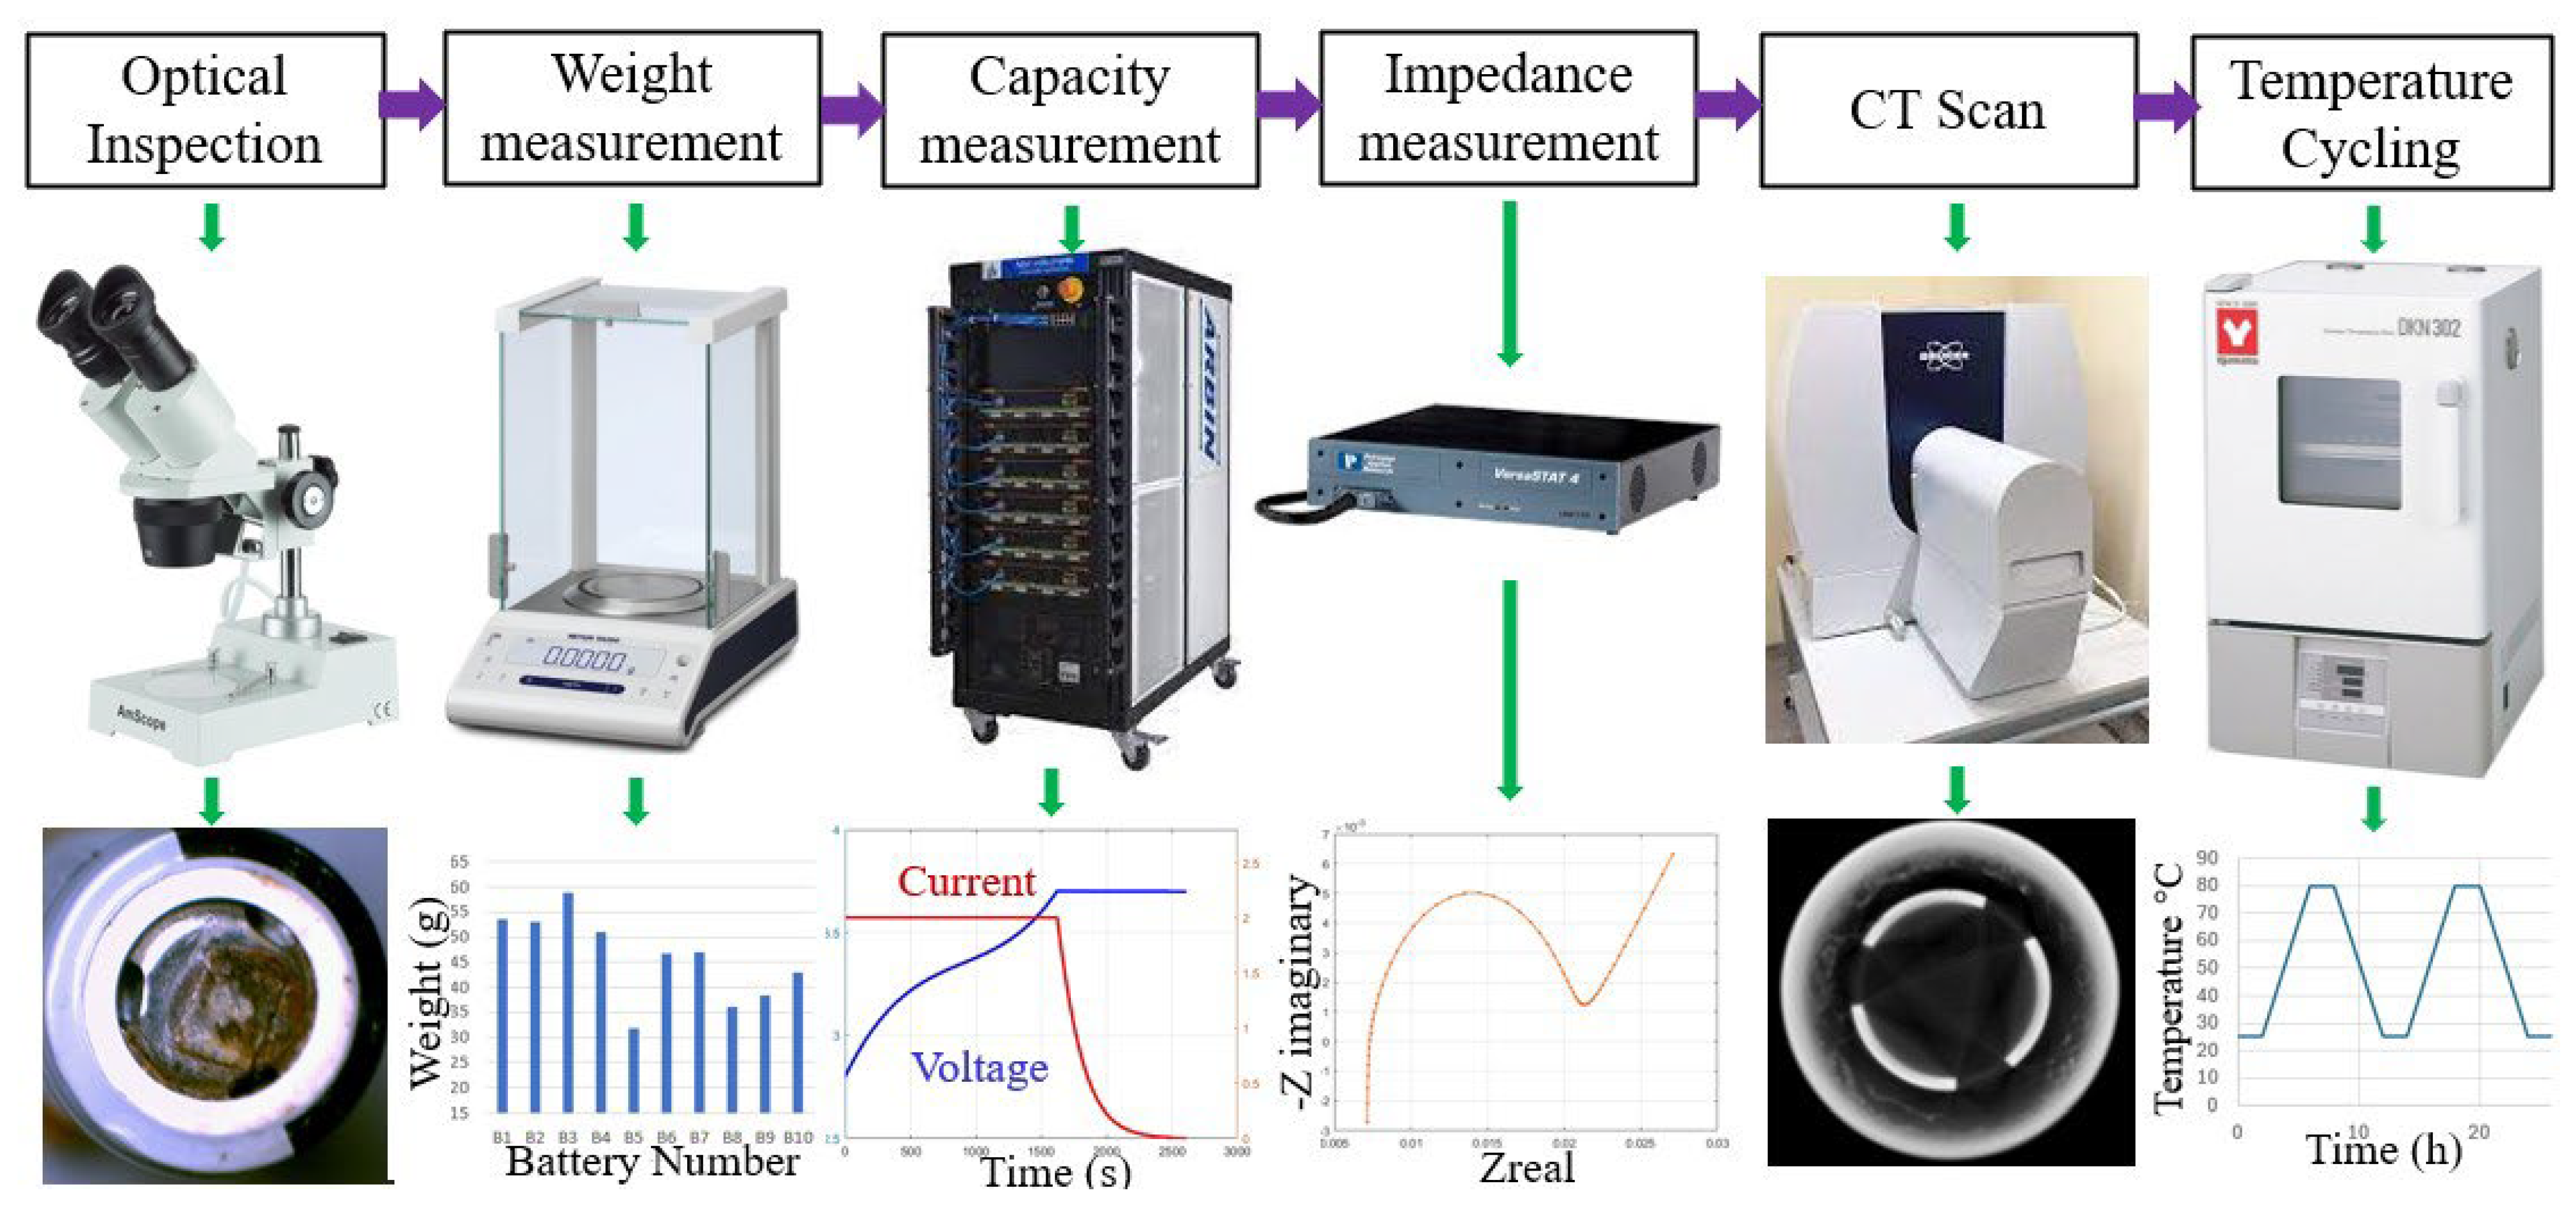
Following the first set of TC, optical inspection using an optical microscope was performed. Subsequently, weight, capacity, and EIS measurements were taken. A CT scan using the Bruker SkyScan 1276 Micro-CT, from Kontich, Belgium, was conducted on failed battery No.6 for internal structural inspection. The CT scan provided insights into the internal structure of the batteries, aiding in investigating the corrosion-related issues. Following this, all batteries, except for battery No.5, underwent a second set of TC. After the second set of TC, another round of optical inspection, weight, capacity, EIS measurements, and a CT scan of failed battery No.10 was conducted. The schematic illustration of the experimental procedure is shown in
Figure 2.
To understand the pathway of electrolyte leakage, a cylindrical battery that had not undergone prior TC was disassembled. Energy dispersive X-ray (EDX) analysis and Fourier transform infrared (FTIR) spectroscopy were employed to elucidate the elemental composition of the battery cap. Additionally, thermomechanical analysis (TMA) was executed to obtain the coefficient of thermal expansion (CTE) of the battery cap elements.
3. Experimental Results
Following the first set of TC, all batteries exhibited no signs of electrolyte leakage, and voltage measurements indicated that the current interrupt devices (CID) were not activated. Subsequently, voltage and weight measurements were taken, followed by a battery capacity test and EIS measurements. Battery No.5 and No.6 exhibited corrosion at their positive terminals and a weight loss of 5% and 3%, respectively. Subsequently, their voltage readings decreased from their initial voltage of 3.6 V to 143 mV and 160 mV, respectively, representing a reduction of more than 10%, thereby concluding these batteries failed to meet the UN 38.3 requirements. To investigate the root cause of the voltage drop, a CT scan was performed on battery No.6.
A second set of TC was carried out on 9 of the 10 batteries, excluding battery No.5. During this second set of tests, battery No.10 failed to meet the pass requirements of UN38.3, and a CT scan was conducted to identify the specific cause of failure. After the capacity and EIS measurements, the voltage of battery No.4 dropped to 72 mV. After two sets of TC, four batteries (4, 5, 6, 10) failed to meet the thermal test requirements stated in Revision 7 because they experienced weight loss greater than 0.2% and voltage drops greater than 90%. However, as the corrosion on these batteries was not observed until after 72 h, there is no visible indication of electrolyte leakage. The detailed results from the two sets of TC are discussed below.
3.1. Optical Inspection
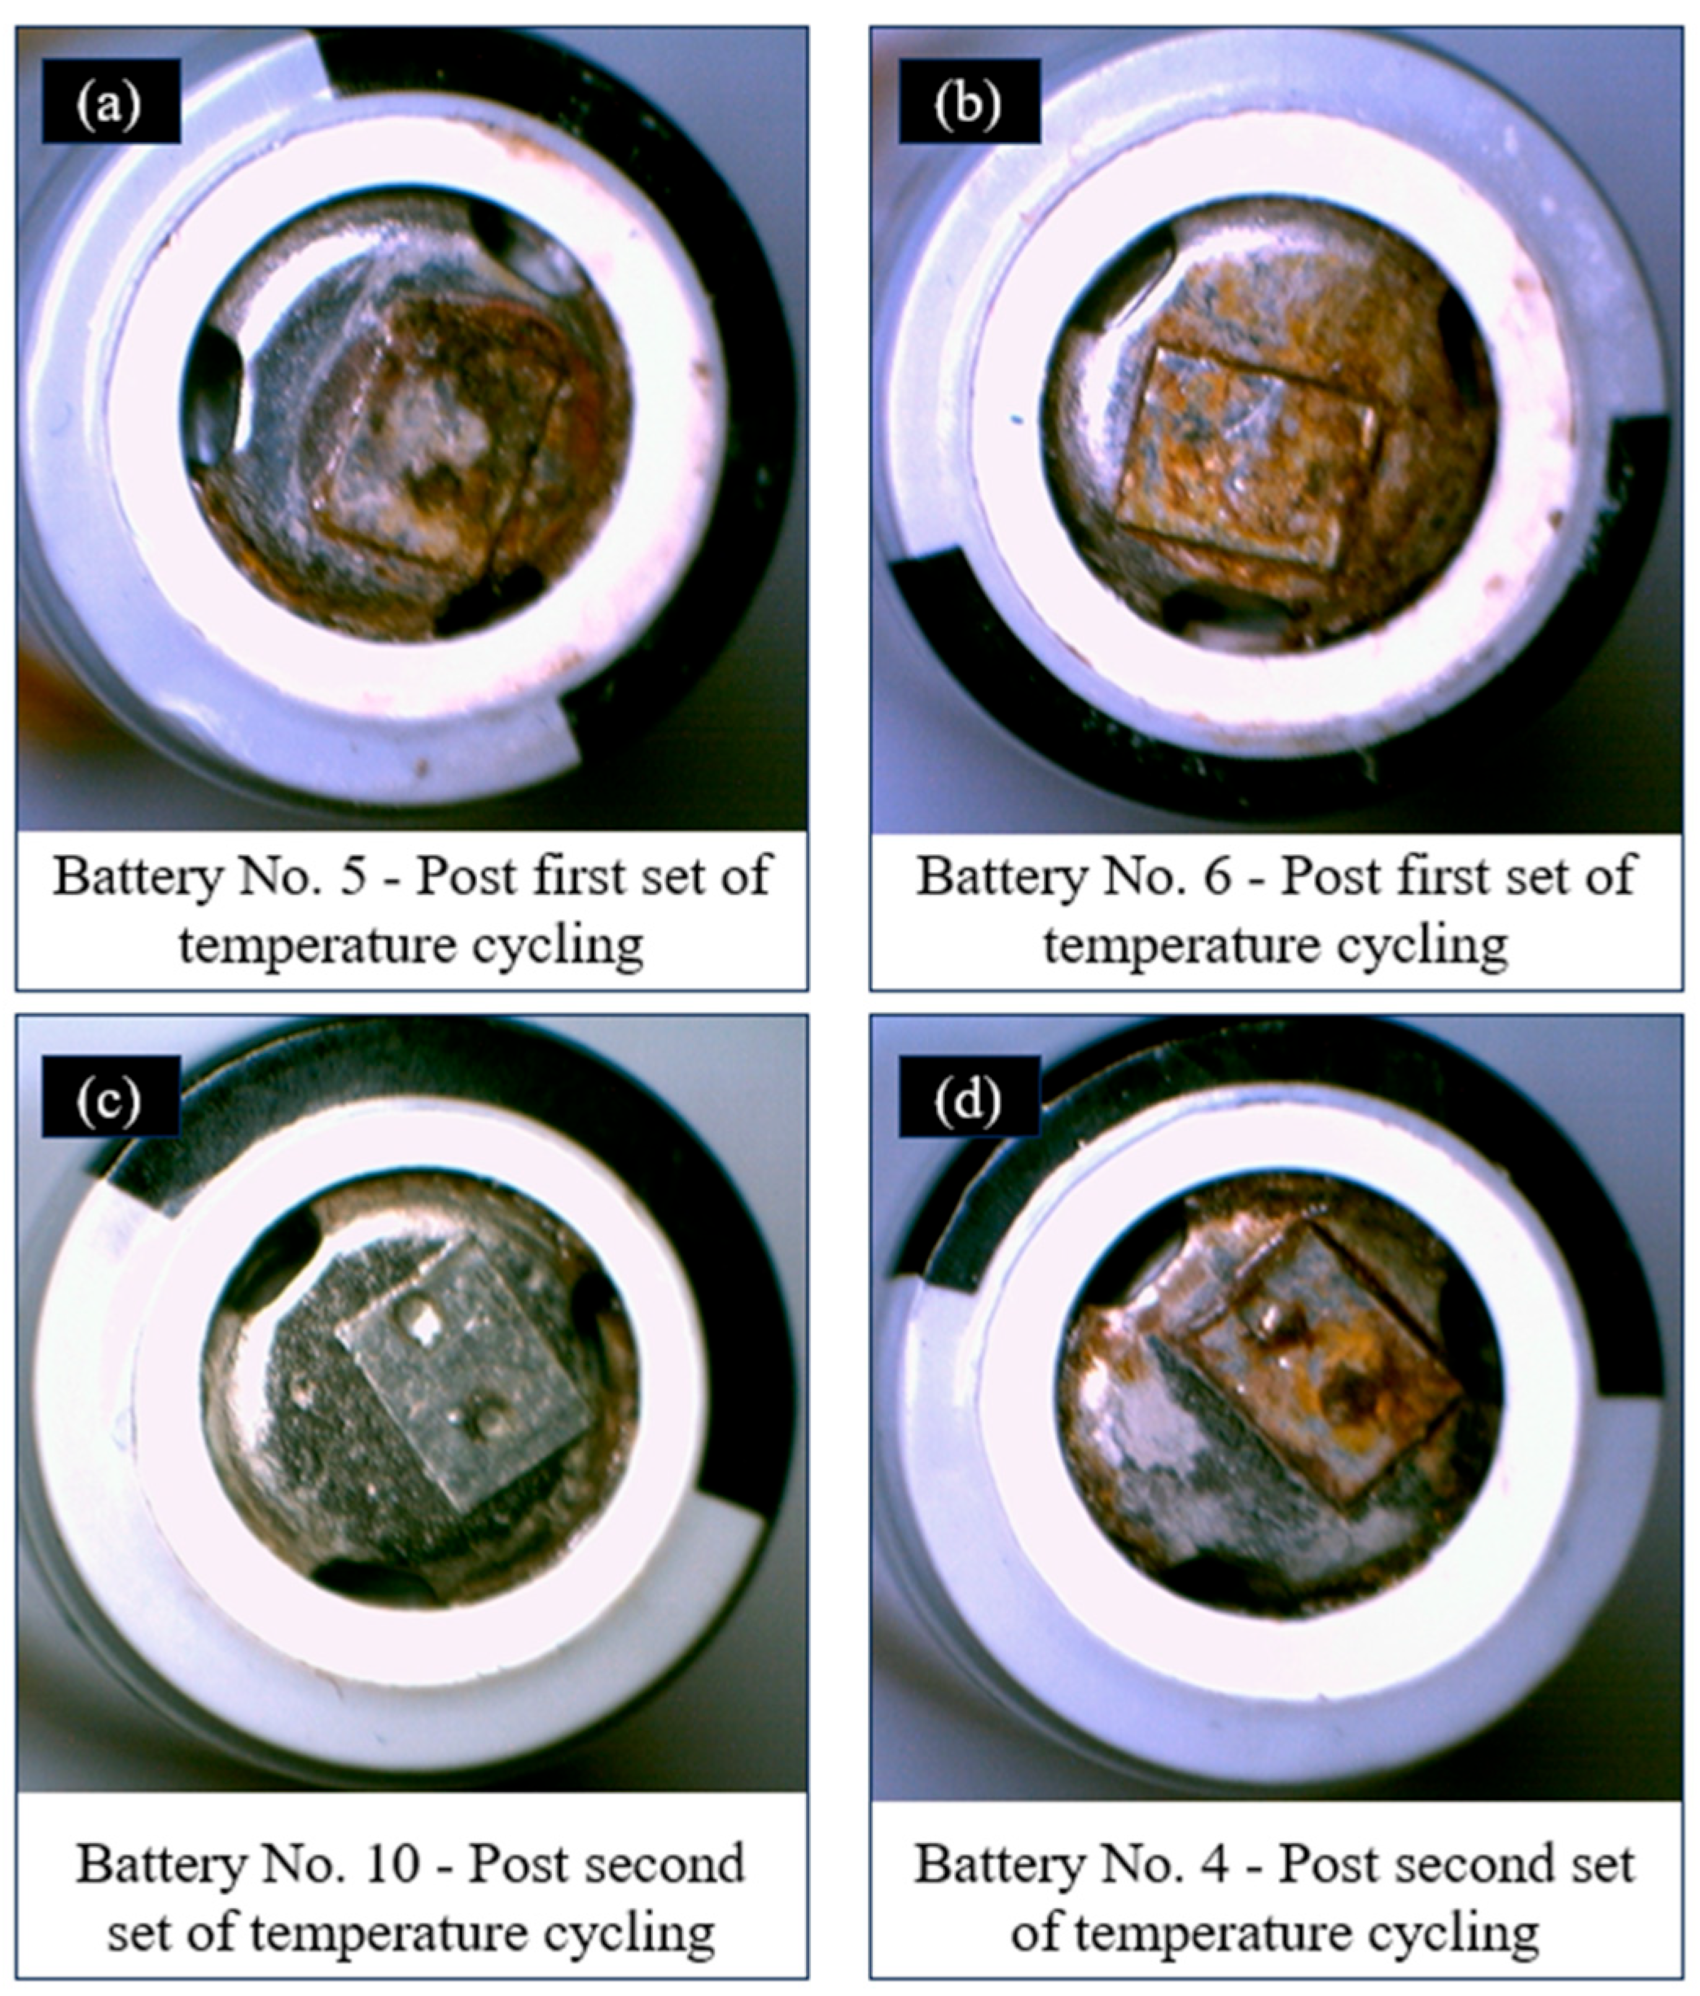
The corrosion observed on the positive terminal emerged as a characteristic that distinguished the failed batteries from the rest. The optical images of the four batteries that show corrosion, along with their test conditions, are shown in
Figure 3. After the first set of TC, none of the batteries showed any corrosion. However, subsequent to the capacity test, batteries No.5 and No.6 exhibited corrosion on their positive terminals. After the second round of TC, battery No.10 also showed corrosion on its positive terminal, and battery No.4 showed corrosion after the capacity and EIS measurements.
The battery-positive terminal is made of nickel-plated steel. The observed corrosion on the terminal can be attributed to the oxidation caused by HF acid, which is produced when the leaked electrolyte reacts with moisture from the environment [
11]. Consequently, the formation of HF acid could lead to the corrosion of the battery’s positive terminal, deteriorating the electrical connection between the cathode and the positive terminal.
3.2. Weight Measurements
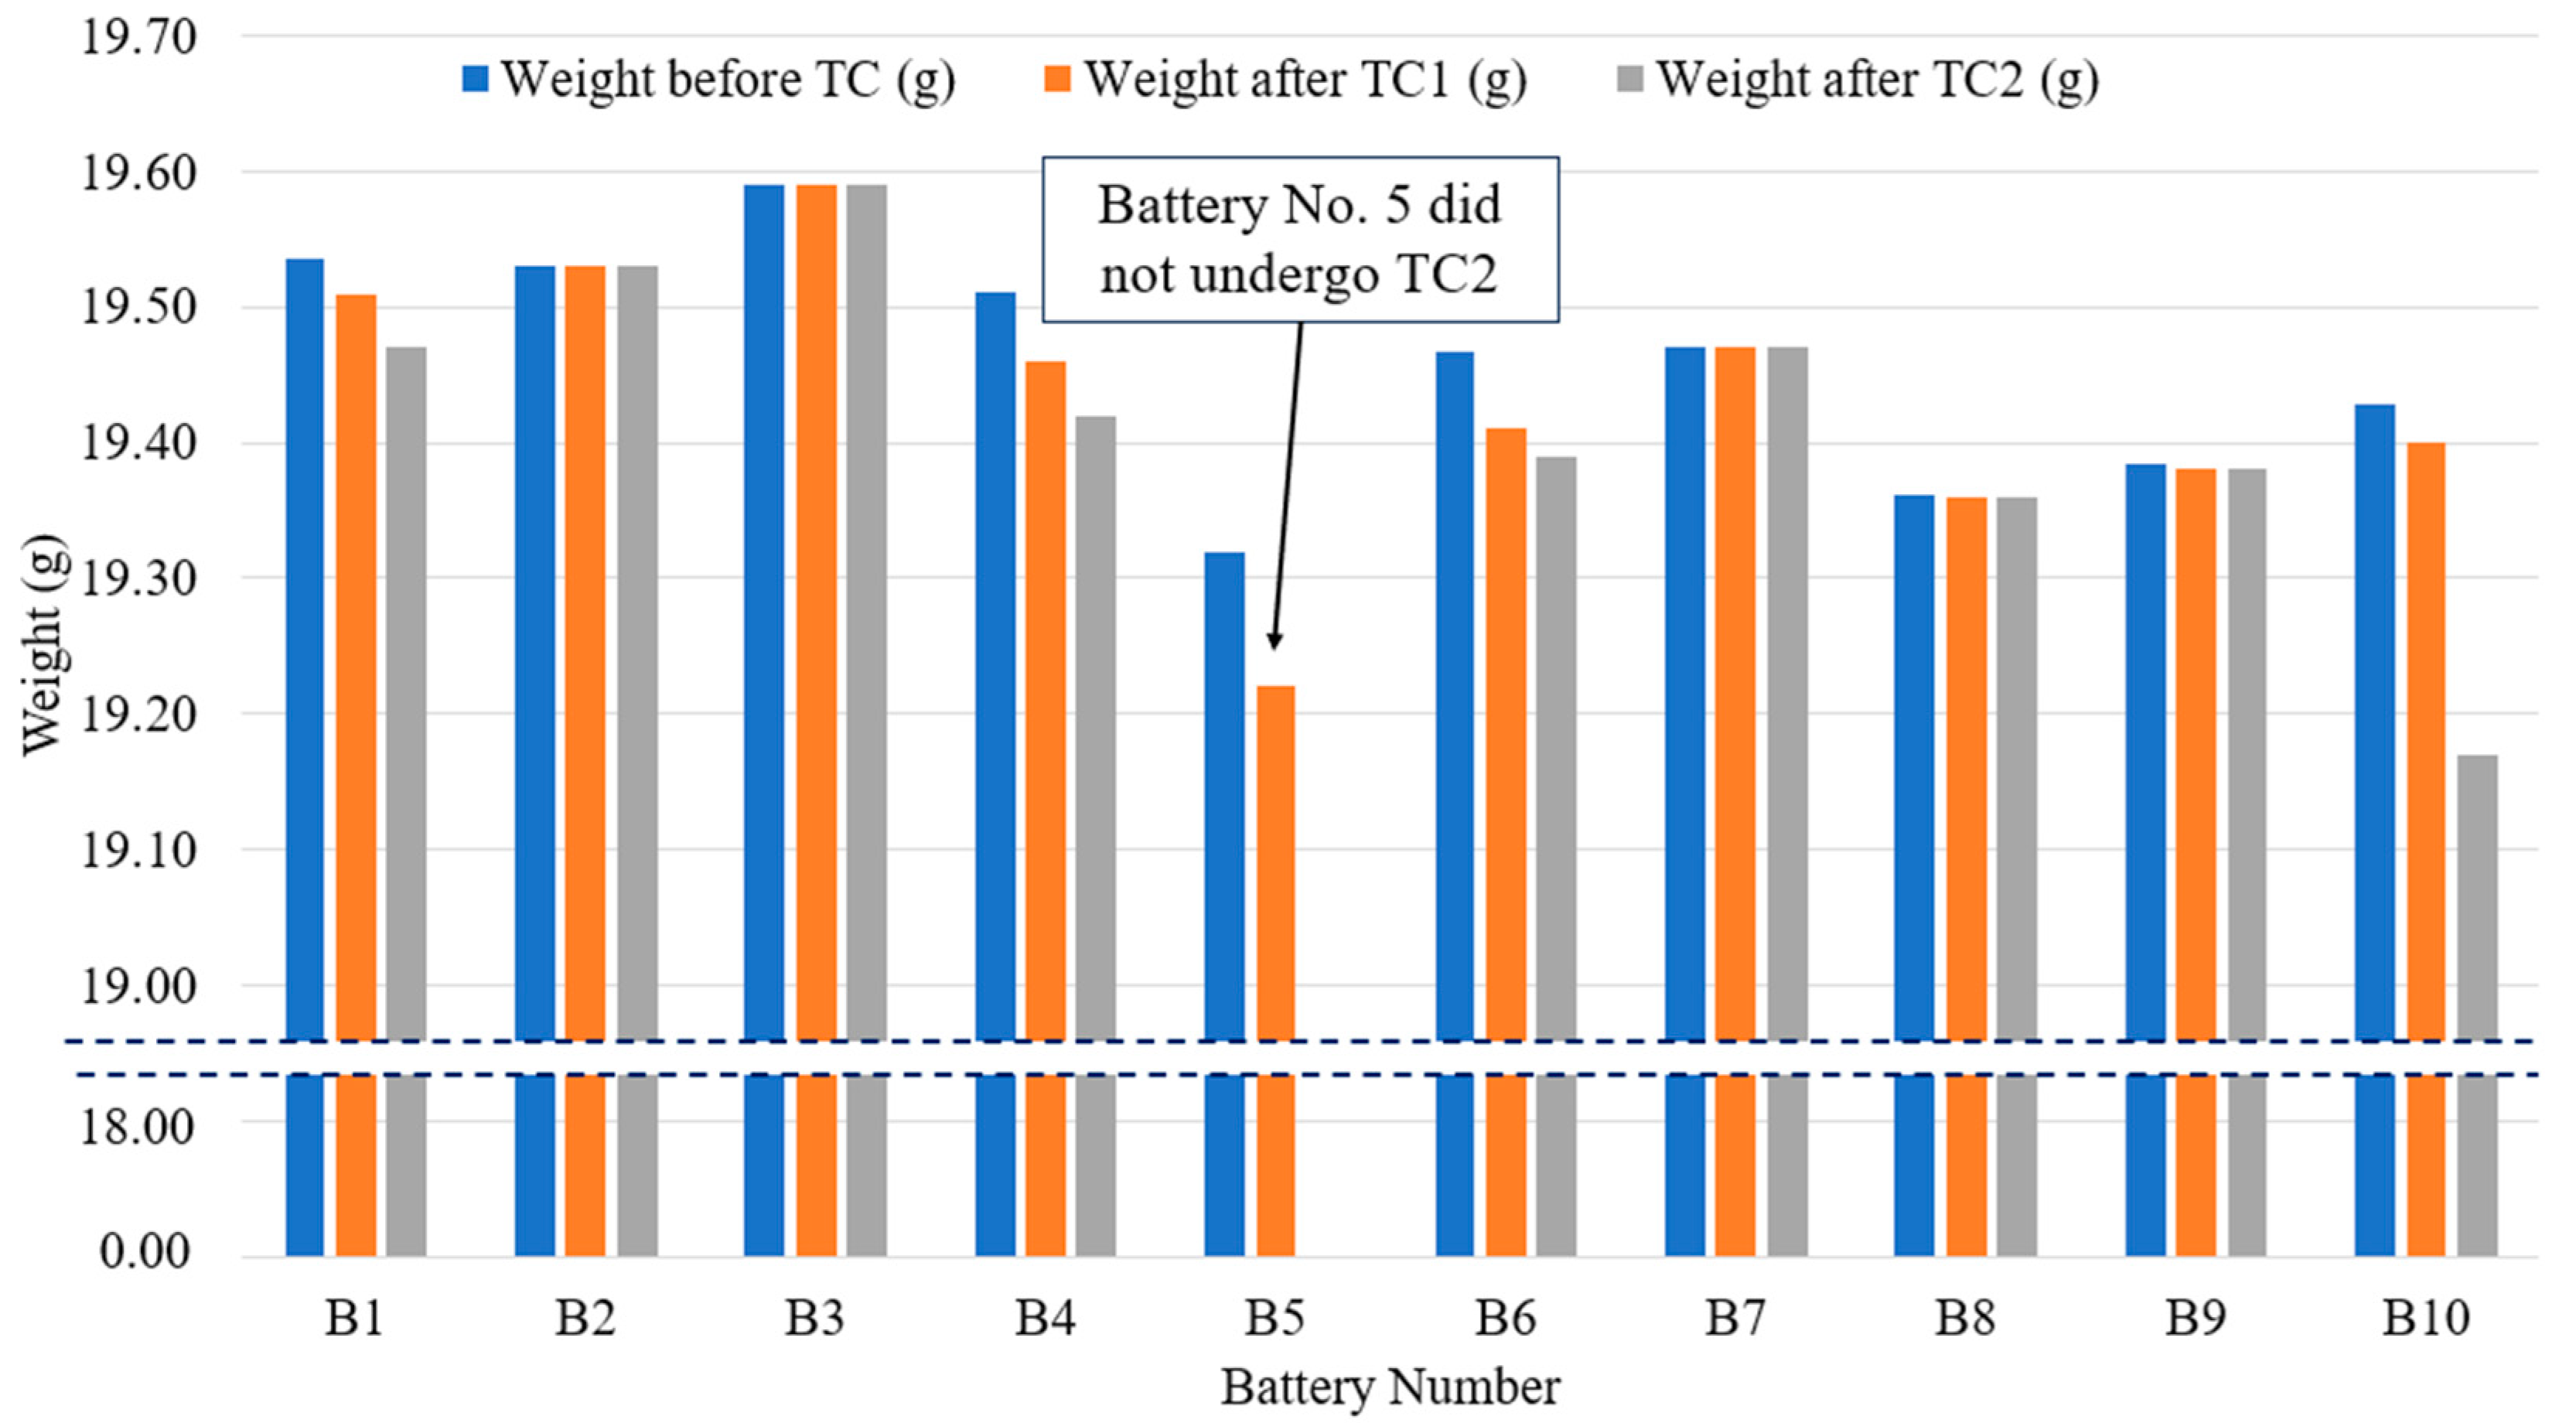
The weight of each battery before and after TC was measured, as depicted in
Figure 4. Following the first set of temperature cycling, five batteries, namely batteries No.1, No.4, No.5, No.6, and No.10, exhibited weight reductions of 1.34%, 2.63%, 5.05%, 2.96%, and 1.46%, respectively. Similarly, after the second set of TC, batteries No.1, No.4, No.6, and No.10 showed further weight reductions of 2.05%, 2.08%, 1.02%, and 11.7%, respectively.
The observed weight loss indicates the seal has been compromised, leading to electrolyte leakage and/or gas venting from the cells. The weight measurements thus provide evidence for the occurrence of electrolyte leakage. To pinpoint the exact root cause of the weight loss, CT scans were conducted on the batteries that experienced weight loss and showed signs of electrolyte leakage. The CT scans aimed to determine whether the CID was activated and to analyze the structural changes in the battery that could provide a leakage path for the electrolyte. These results are further discussed in
Section 3.5.
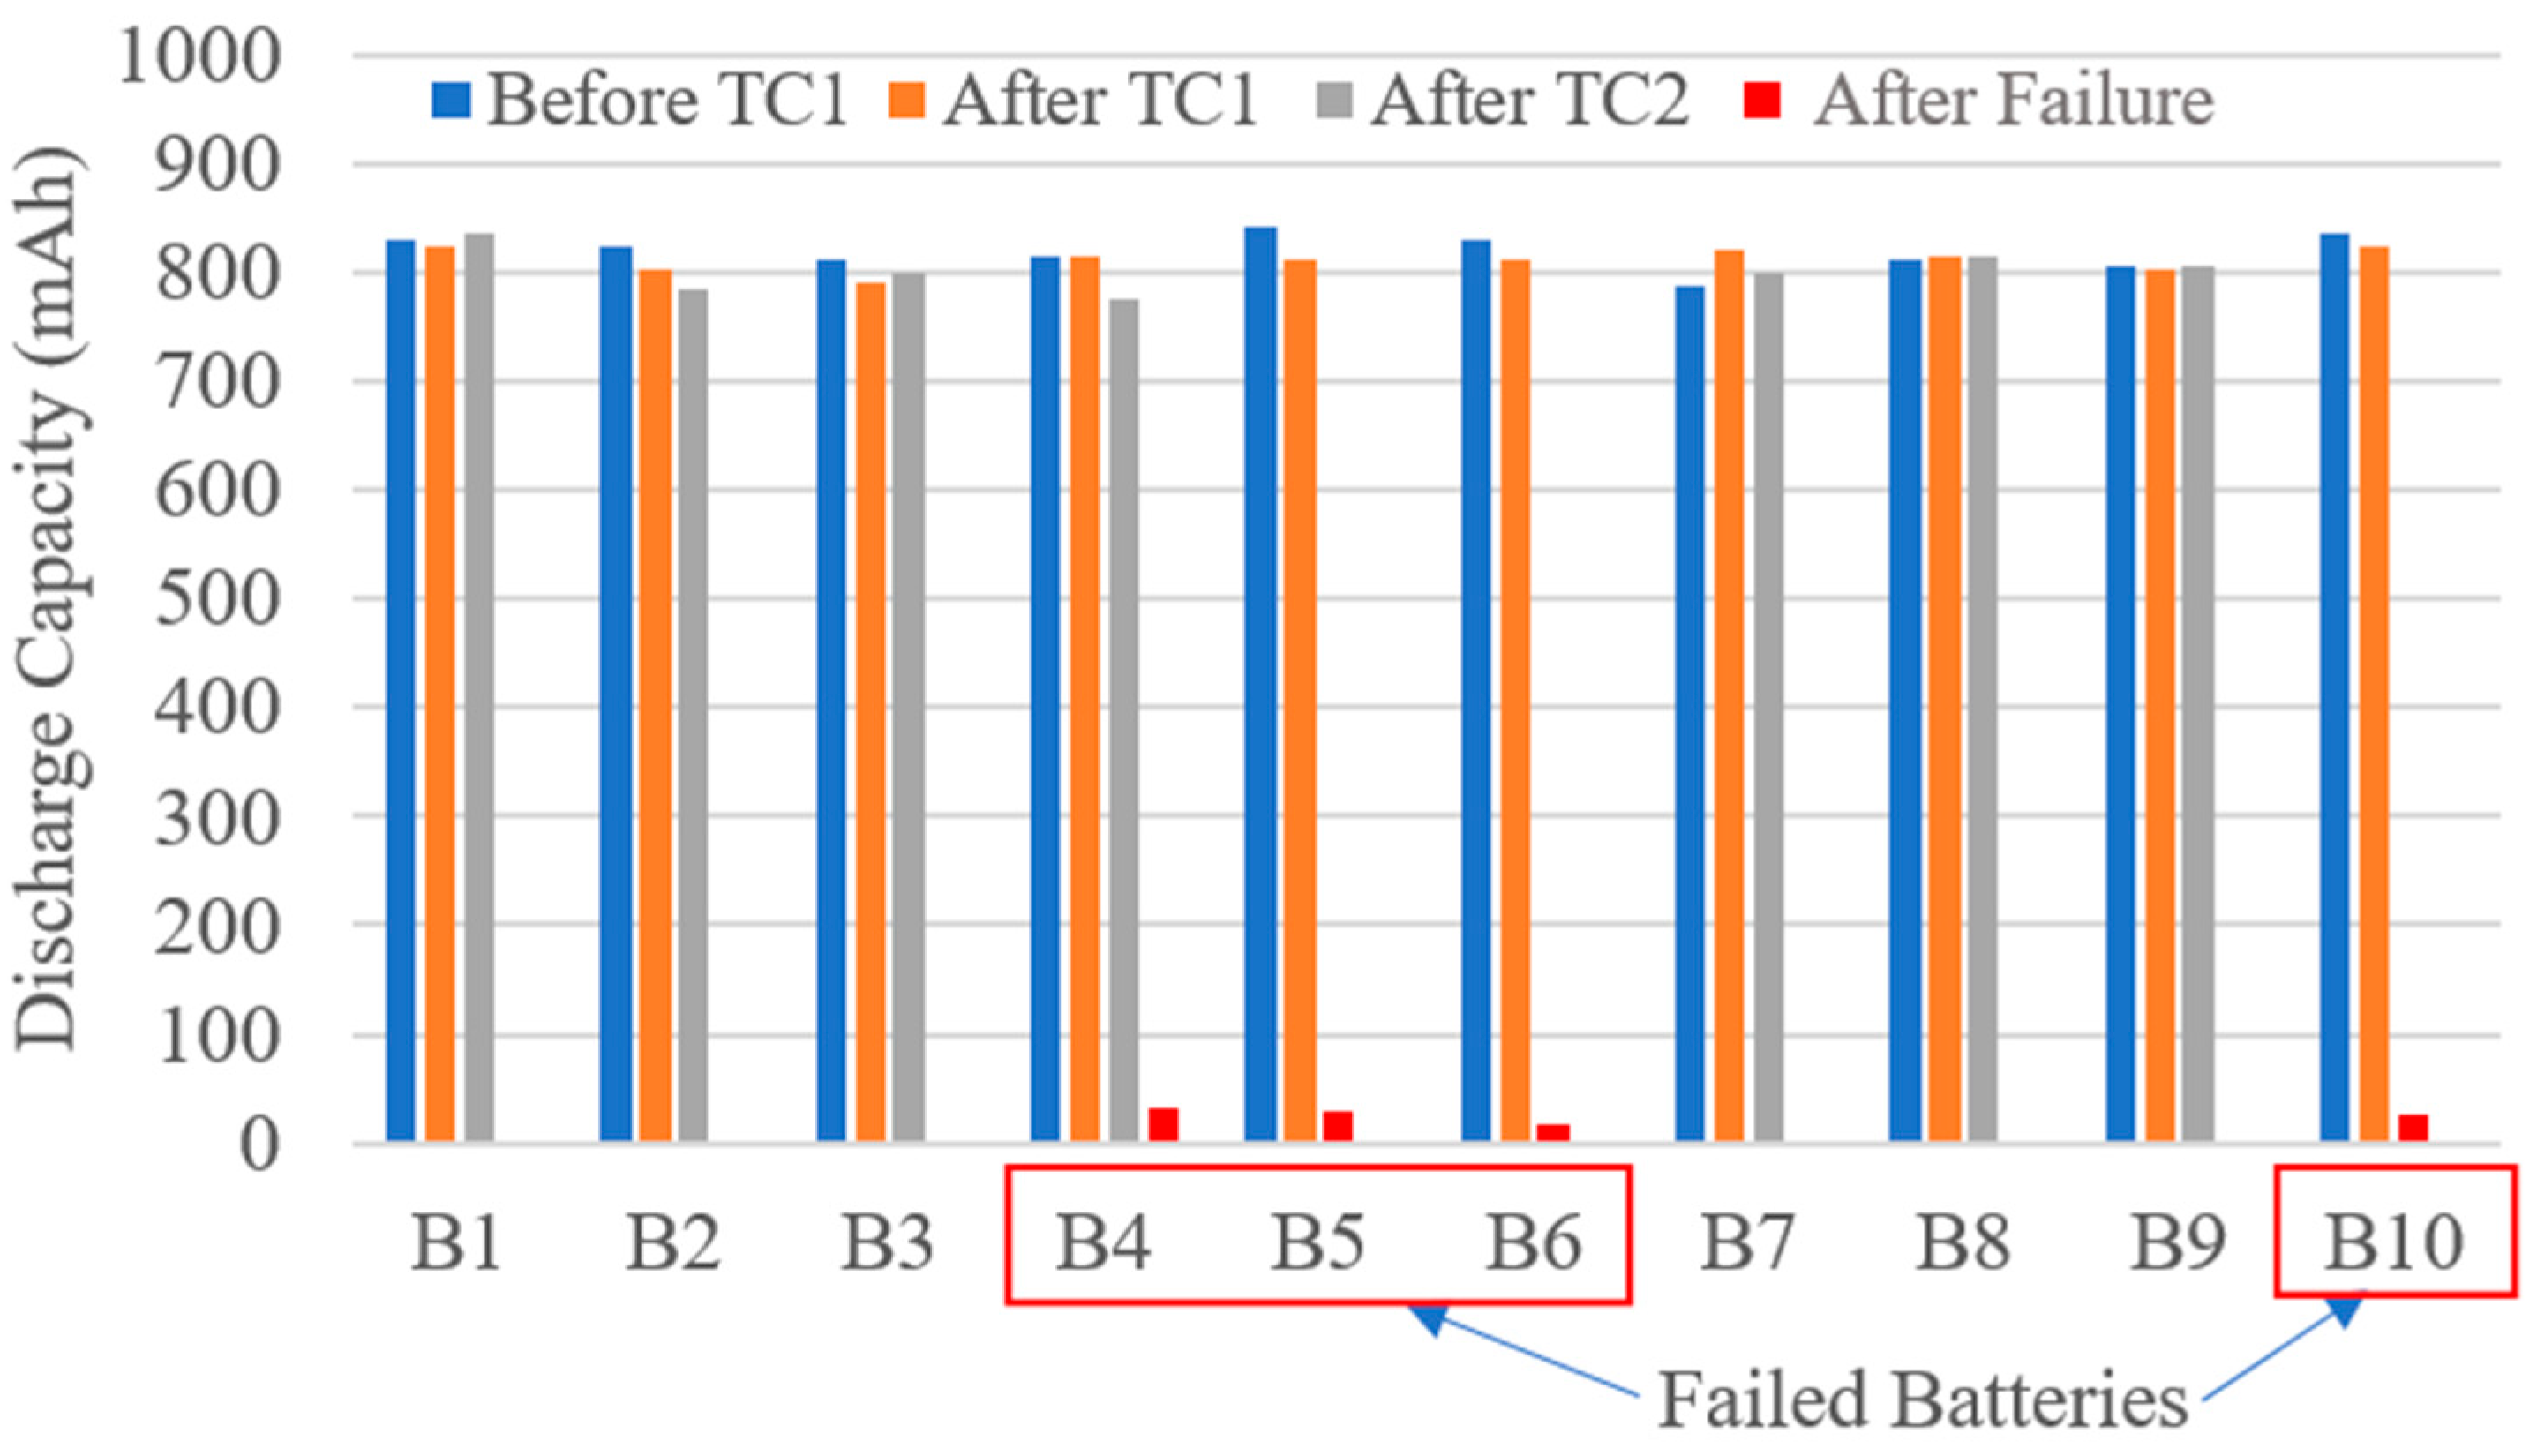
3.3. Capacity Measurements
Previous research indicates that a leaking battery tends to exhibit more severe self-discharge, capacity decay, and resistance growth. The extent of leakage directly correlates with the severity of initial self-discharge [
11,
28]. In this study, capacity measurements were conducted on all batteries before and after TC. The results revealed that the capacity of batteries No.4, No.5, No.6, and No.10 decreased to 32 mAh, 29 mAh, 18 mAh, and 13 mAh, respectively. These capacity losses are shown along with all the other batteries in
Figure 5.
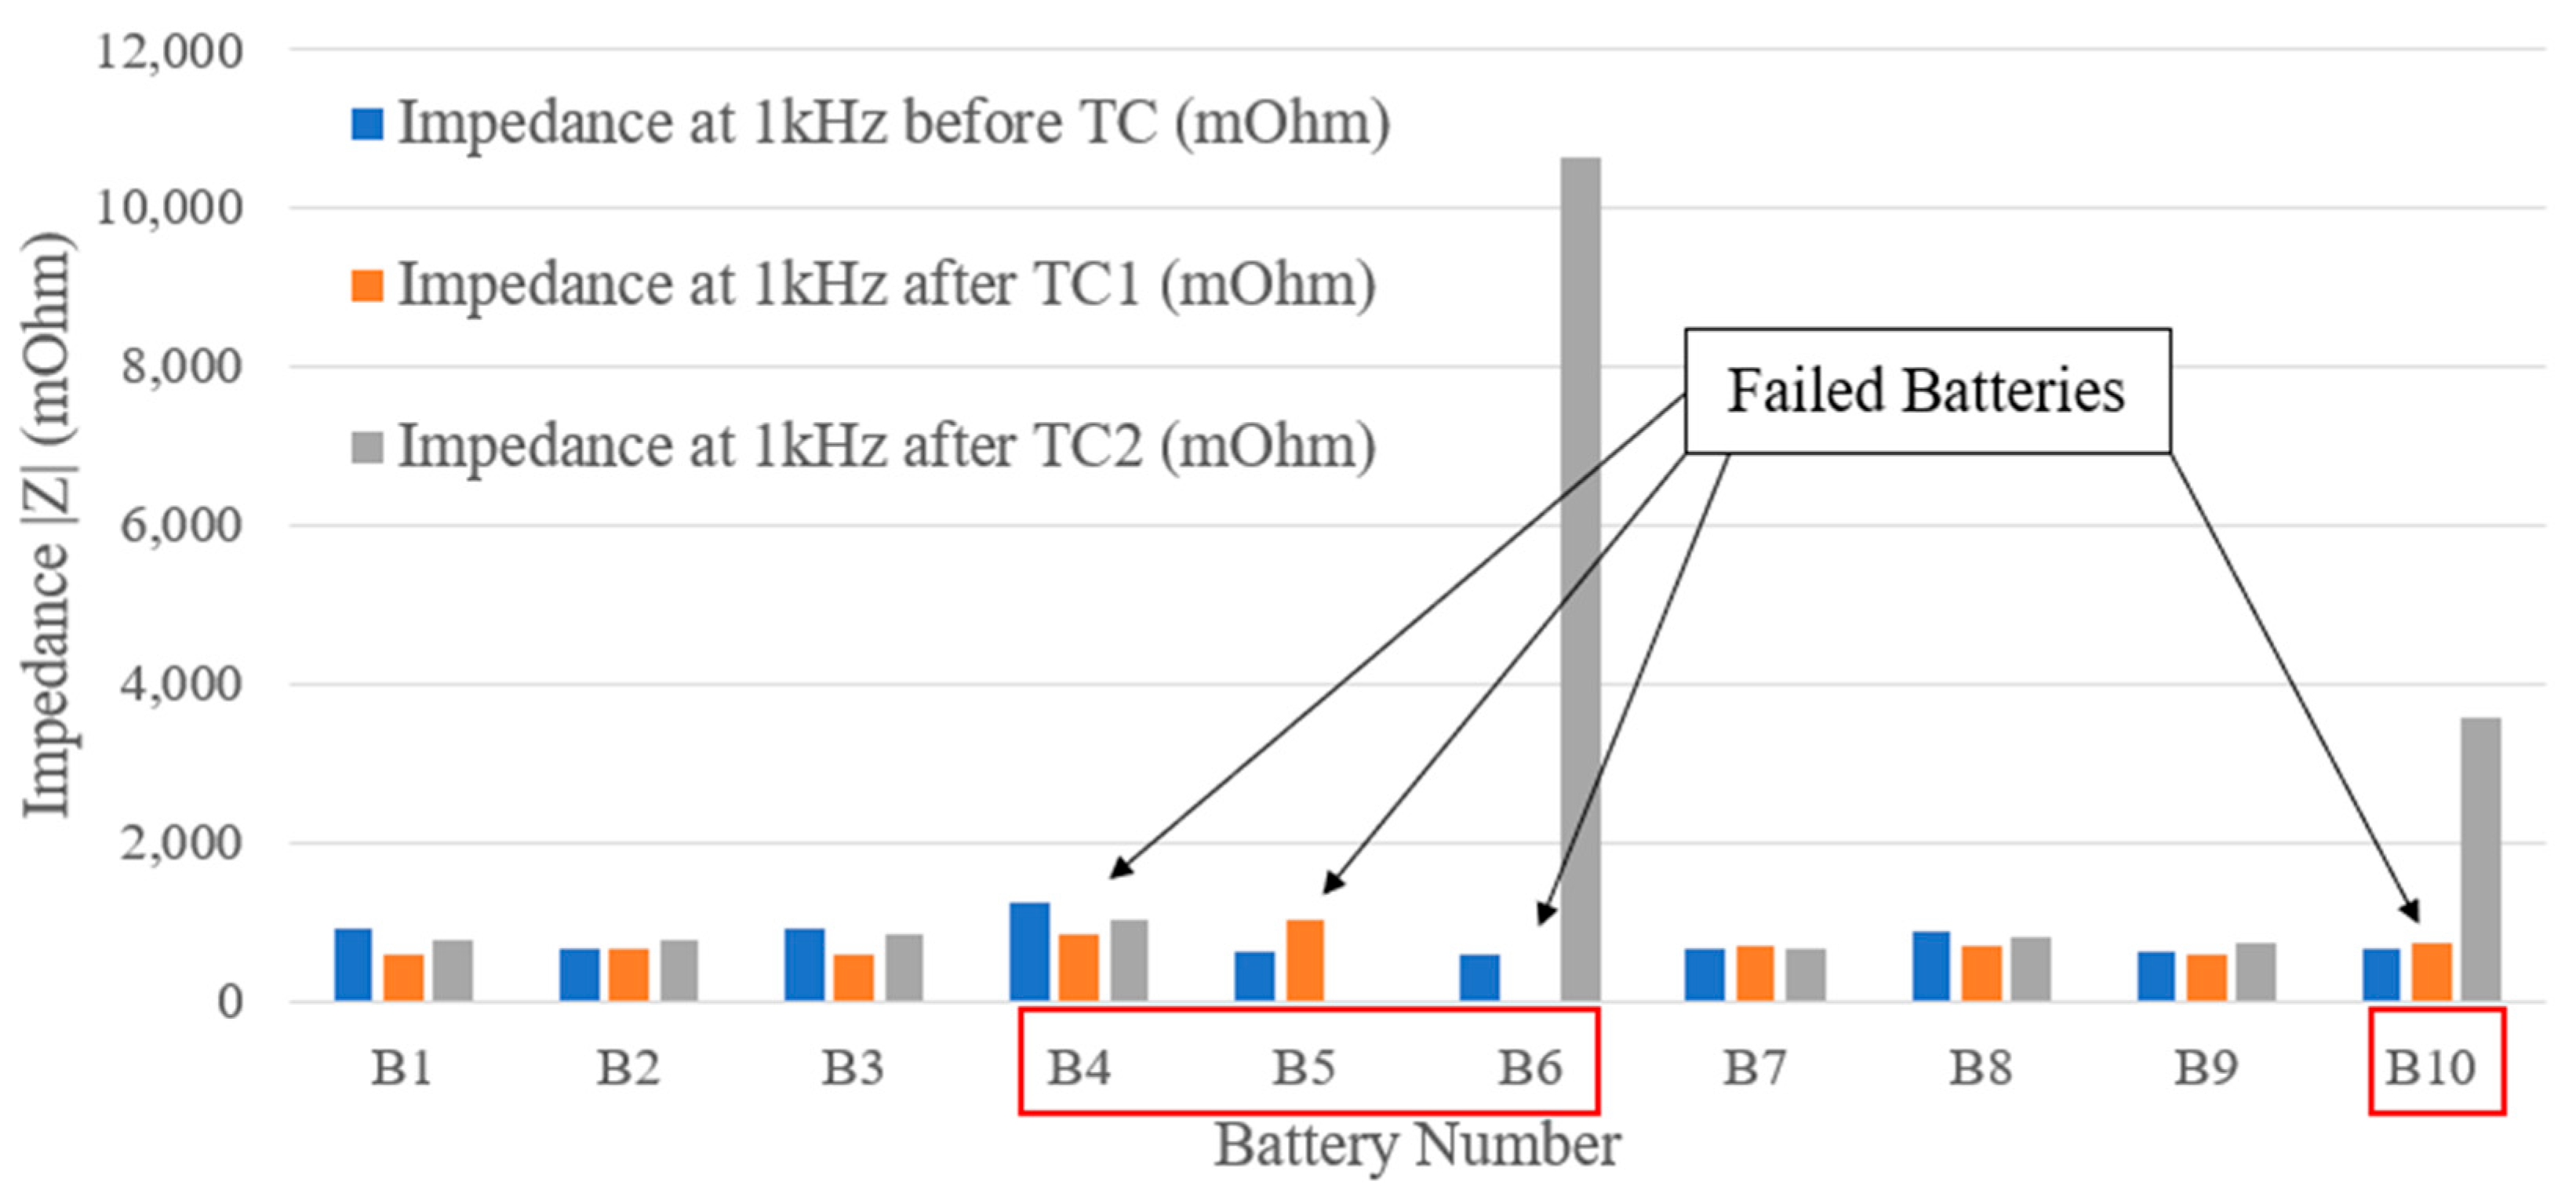
3.4. EIS Measurements
EIS measurements were performed before and after every set of TC in a frequency range of 10 mHz to 10 kHz.
Figure 6 shows the magnitude of impedance at 1 kHz. The failed batteries showed an increase in the impedance, with battery No.6 and battery No.10 showing an increase of about 12 times (1213%) and 3 times (335%), respectively. The increase in resistance can be attributed to the increase in contact resistance due to corrosion observed on the positive terminal, as shown in
Figure 2.
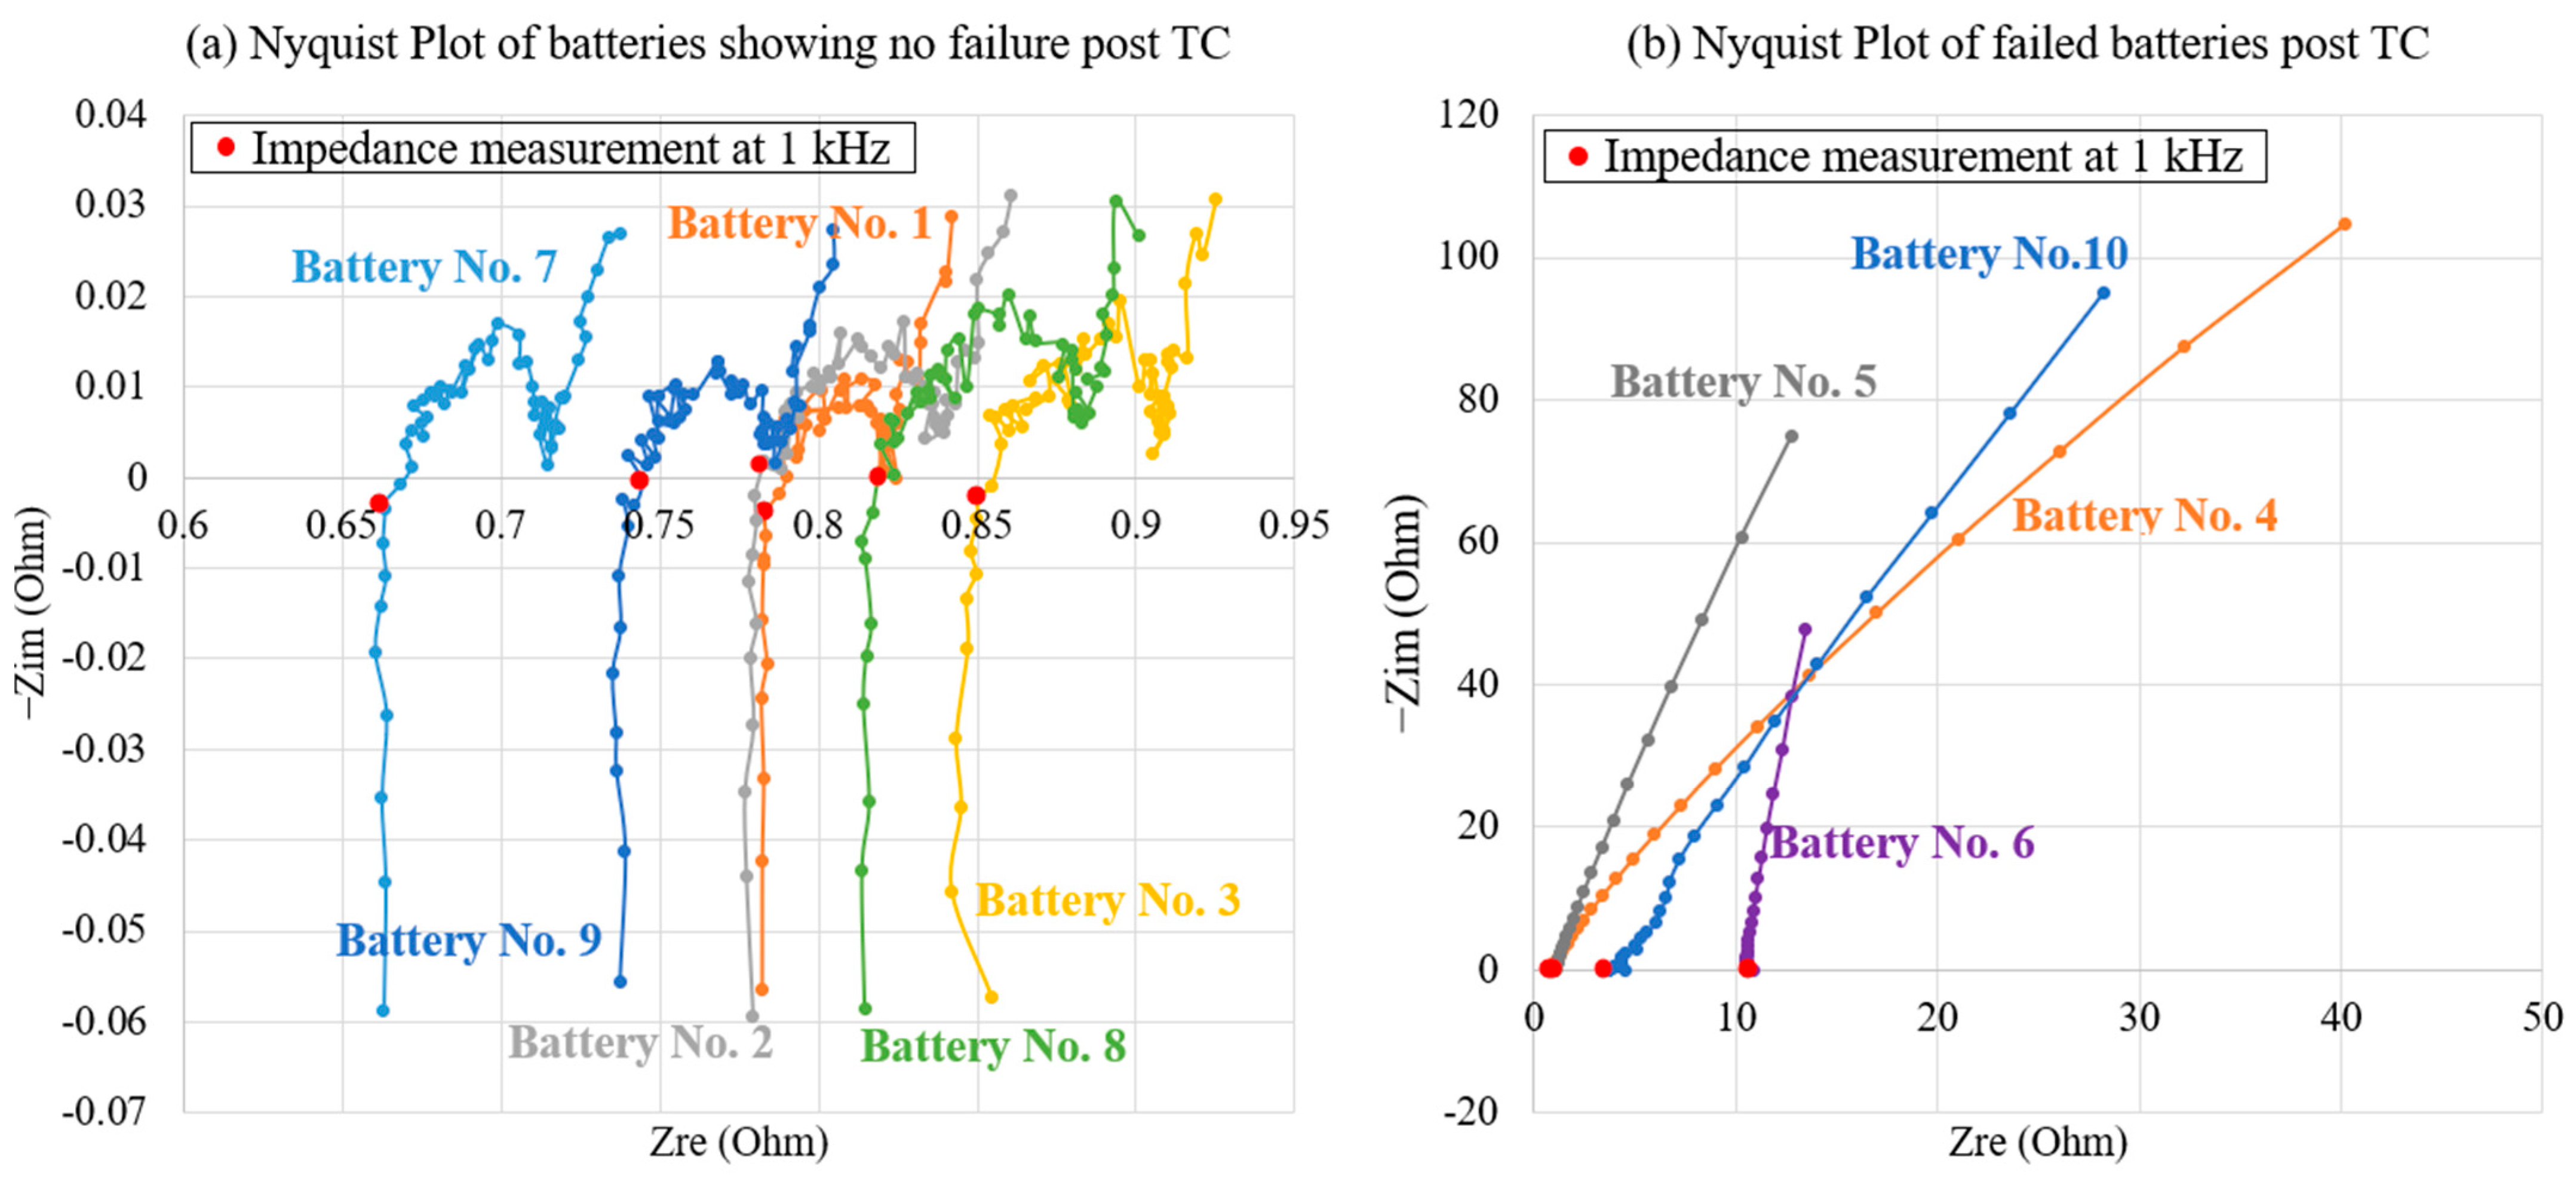
Figure 7a shows the Nyquist plots for batteries that do not show any failure, and
Figure 7b presents the Nyquist plots for batteries No.4, No.5, No.6, and No.10 following their failure. These Nyquist plots depicted a distinctive behavior resembling that of capacitors, characterized by a rise in the negative imaginary impedance values as the frequency decreased [
29]. The resemblance to capacitors suggests that these batteries exhibit capacitive-like behavior post-failure.
3.5. CT Scan Results
A CT scan is a non-destructive technique that can reveal the battery’s internal structure without changing its original status [
30,
31]. One aspect investigated through the CT scans was to check whether the CID was activated or not. CT scans were performed on three batteries (battery No.1, No.6, and No.10). Battery No.1 was chosen before undergoing any TC to serve as a base to compare with failed batteries. Batteries No.6 and No.10 were chosen to analyze the cause of failure after the first and second sets of TC, respectively.
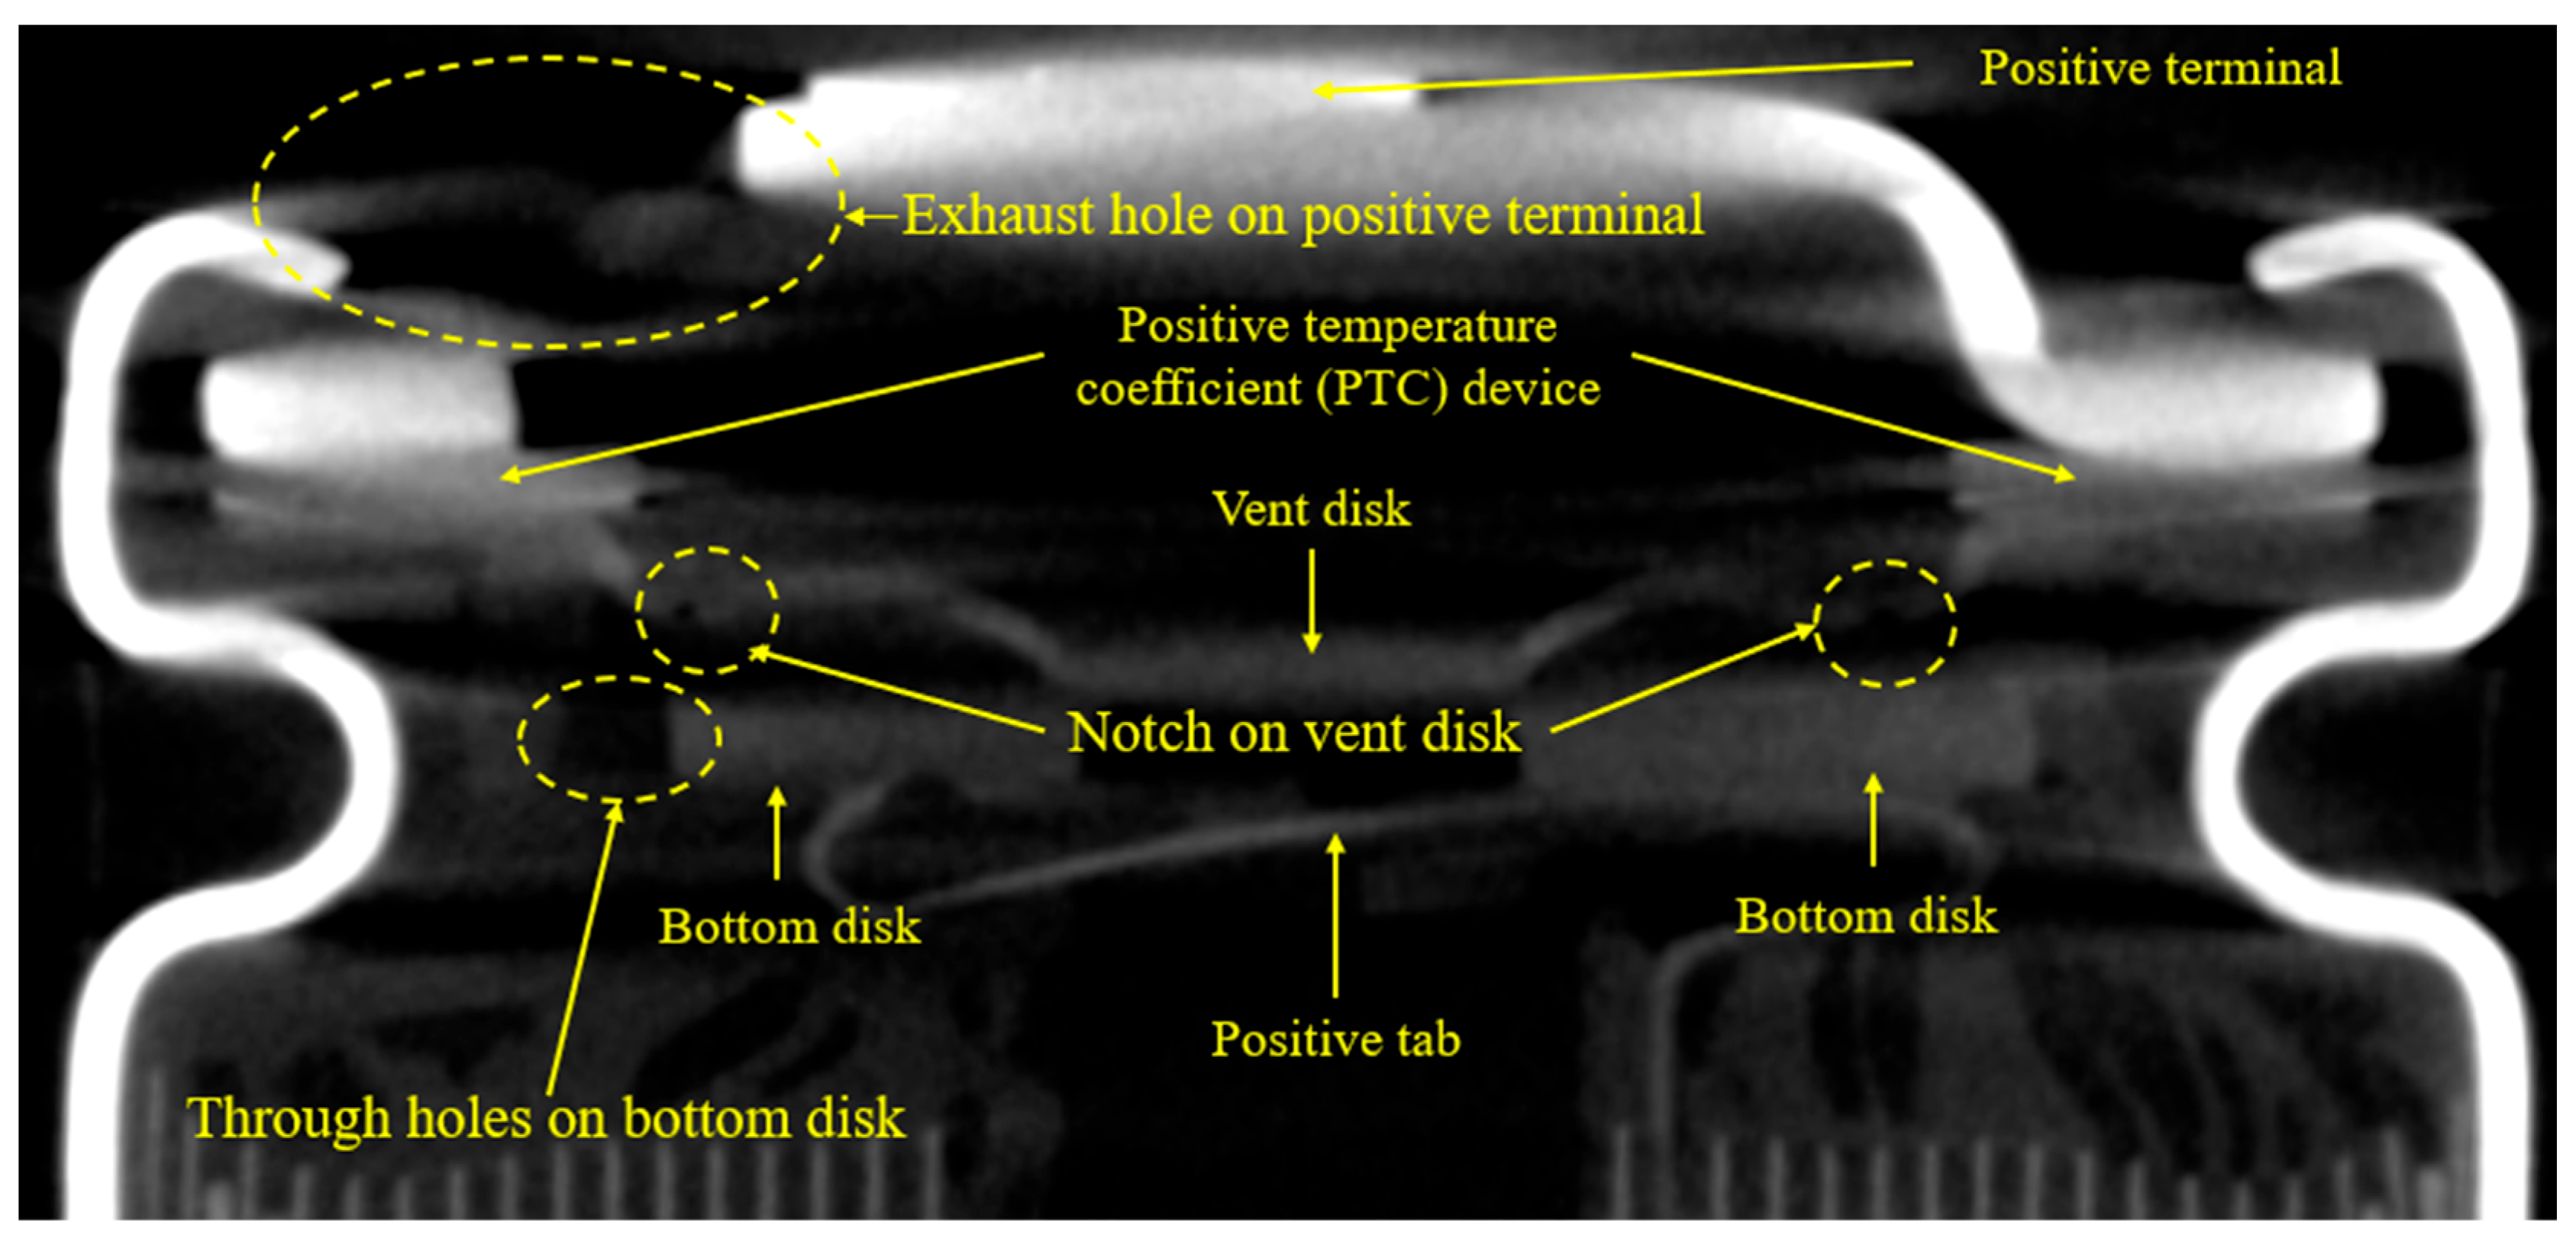
Figure 8 presents the longitudinal view of the cap portion of battery No.1.
The axial view of the CT scan across the components of the cap was used to compare the structural change that occurred due to the TC.
Figure 9 illustrates the CT scan images of the positive terminal for batteries No.1, No.6, and No.10. The results corroborated the findings of the corrosion observed on the positive terminal, as reported in
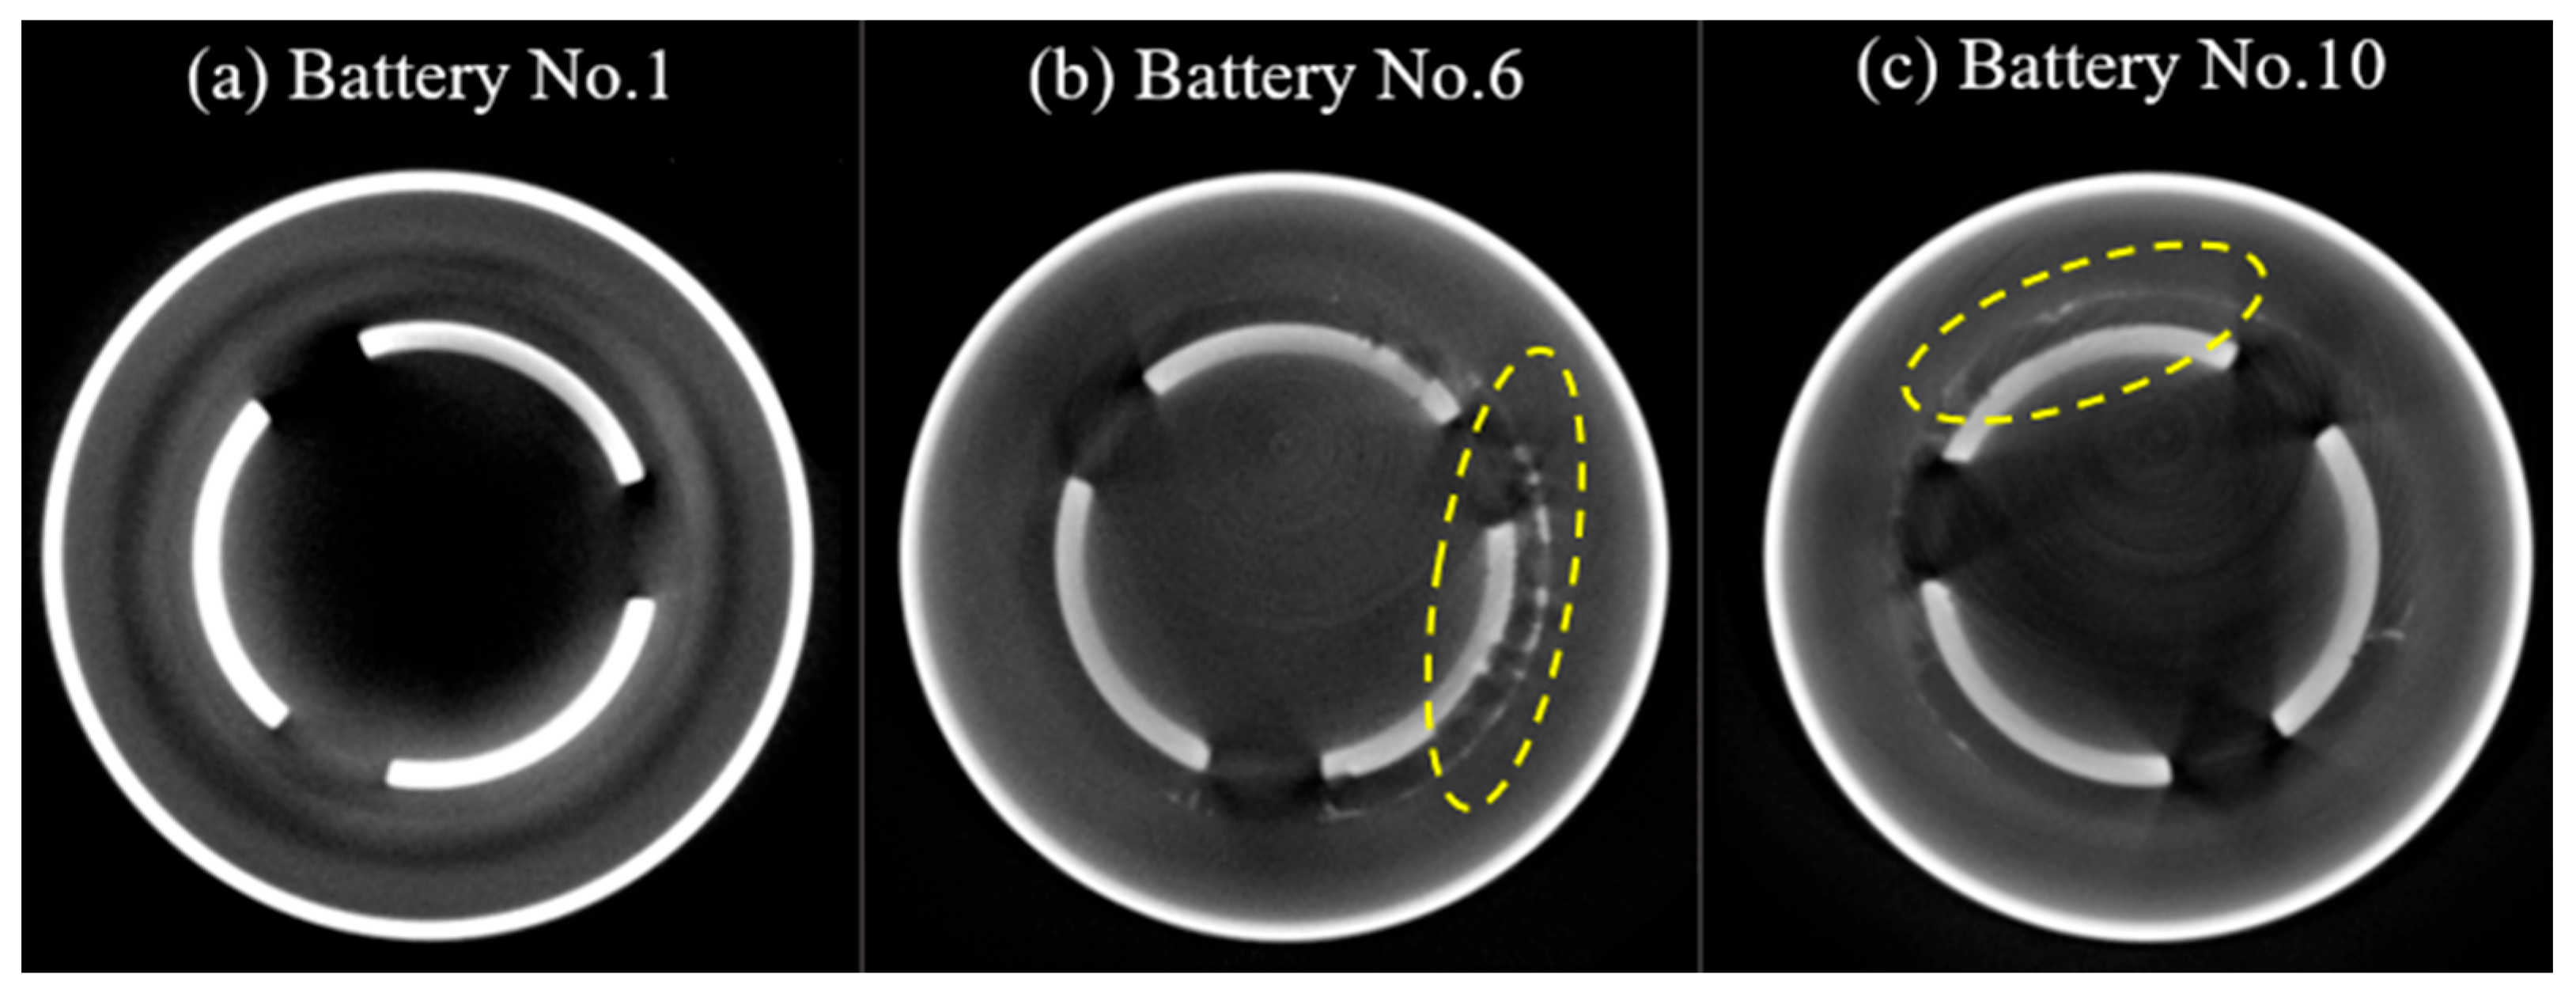
Section 3.1. This indicated that corrosion played a significant role in the failure mechanisms of these batteries during temperature cycling. The axial view of the gasket of the three batteries is depicted in
Figure 10. Notably,
Figure 10b,c revealed a potential occurrence of gasket corrosion in the vicinity of the vent holes in the failed batteries as emphasized by the highlighted areas.
Figure 11 shows the CT scan results of PTC in batteries No.1, No.6, and No.10. The inner section of the PTC shows discoloration (highlighted within the area between the two circles), suggesting a change in its chemical composition, possibly attributed to corrosion.
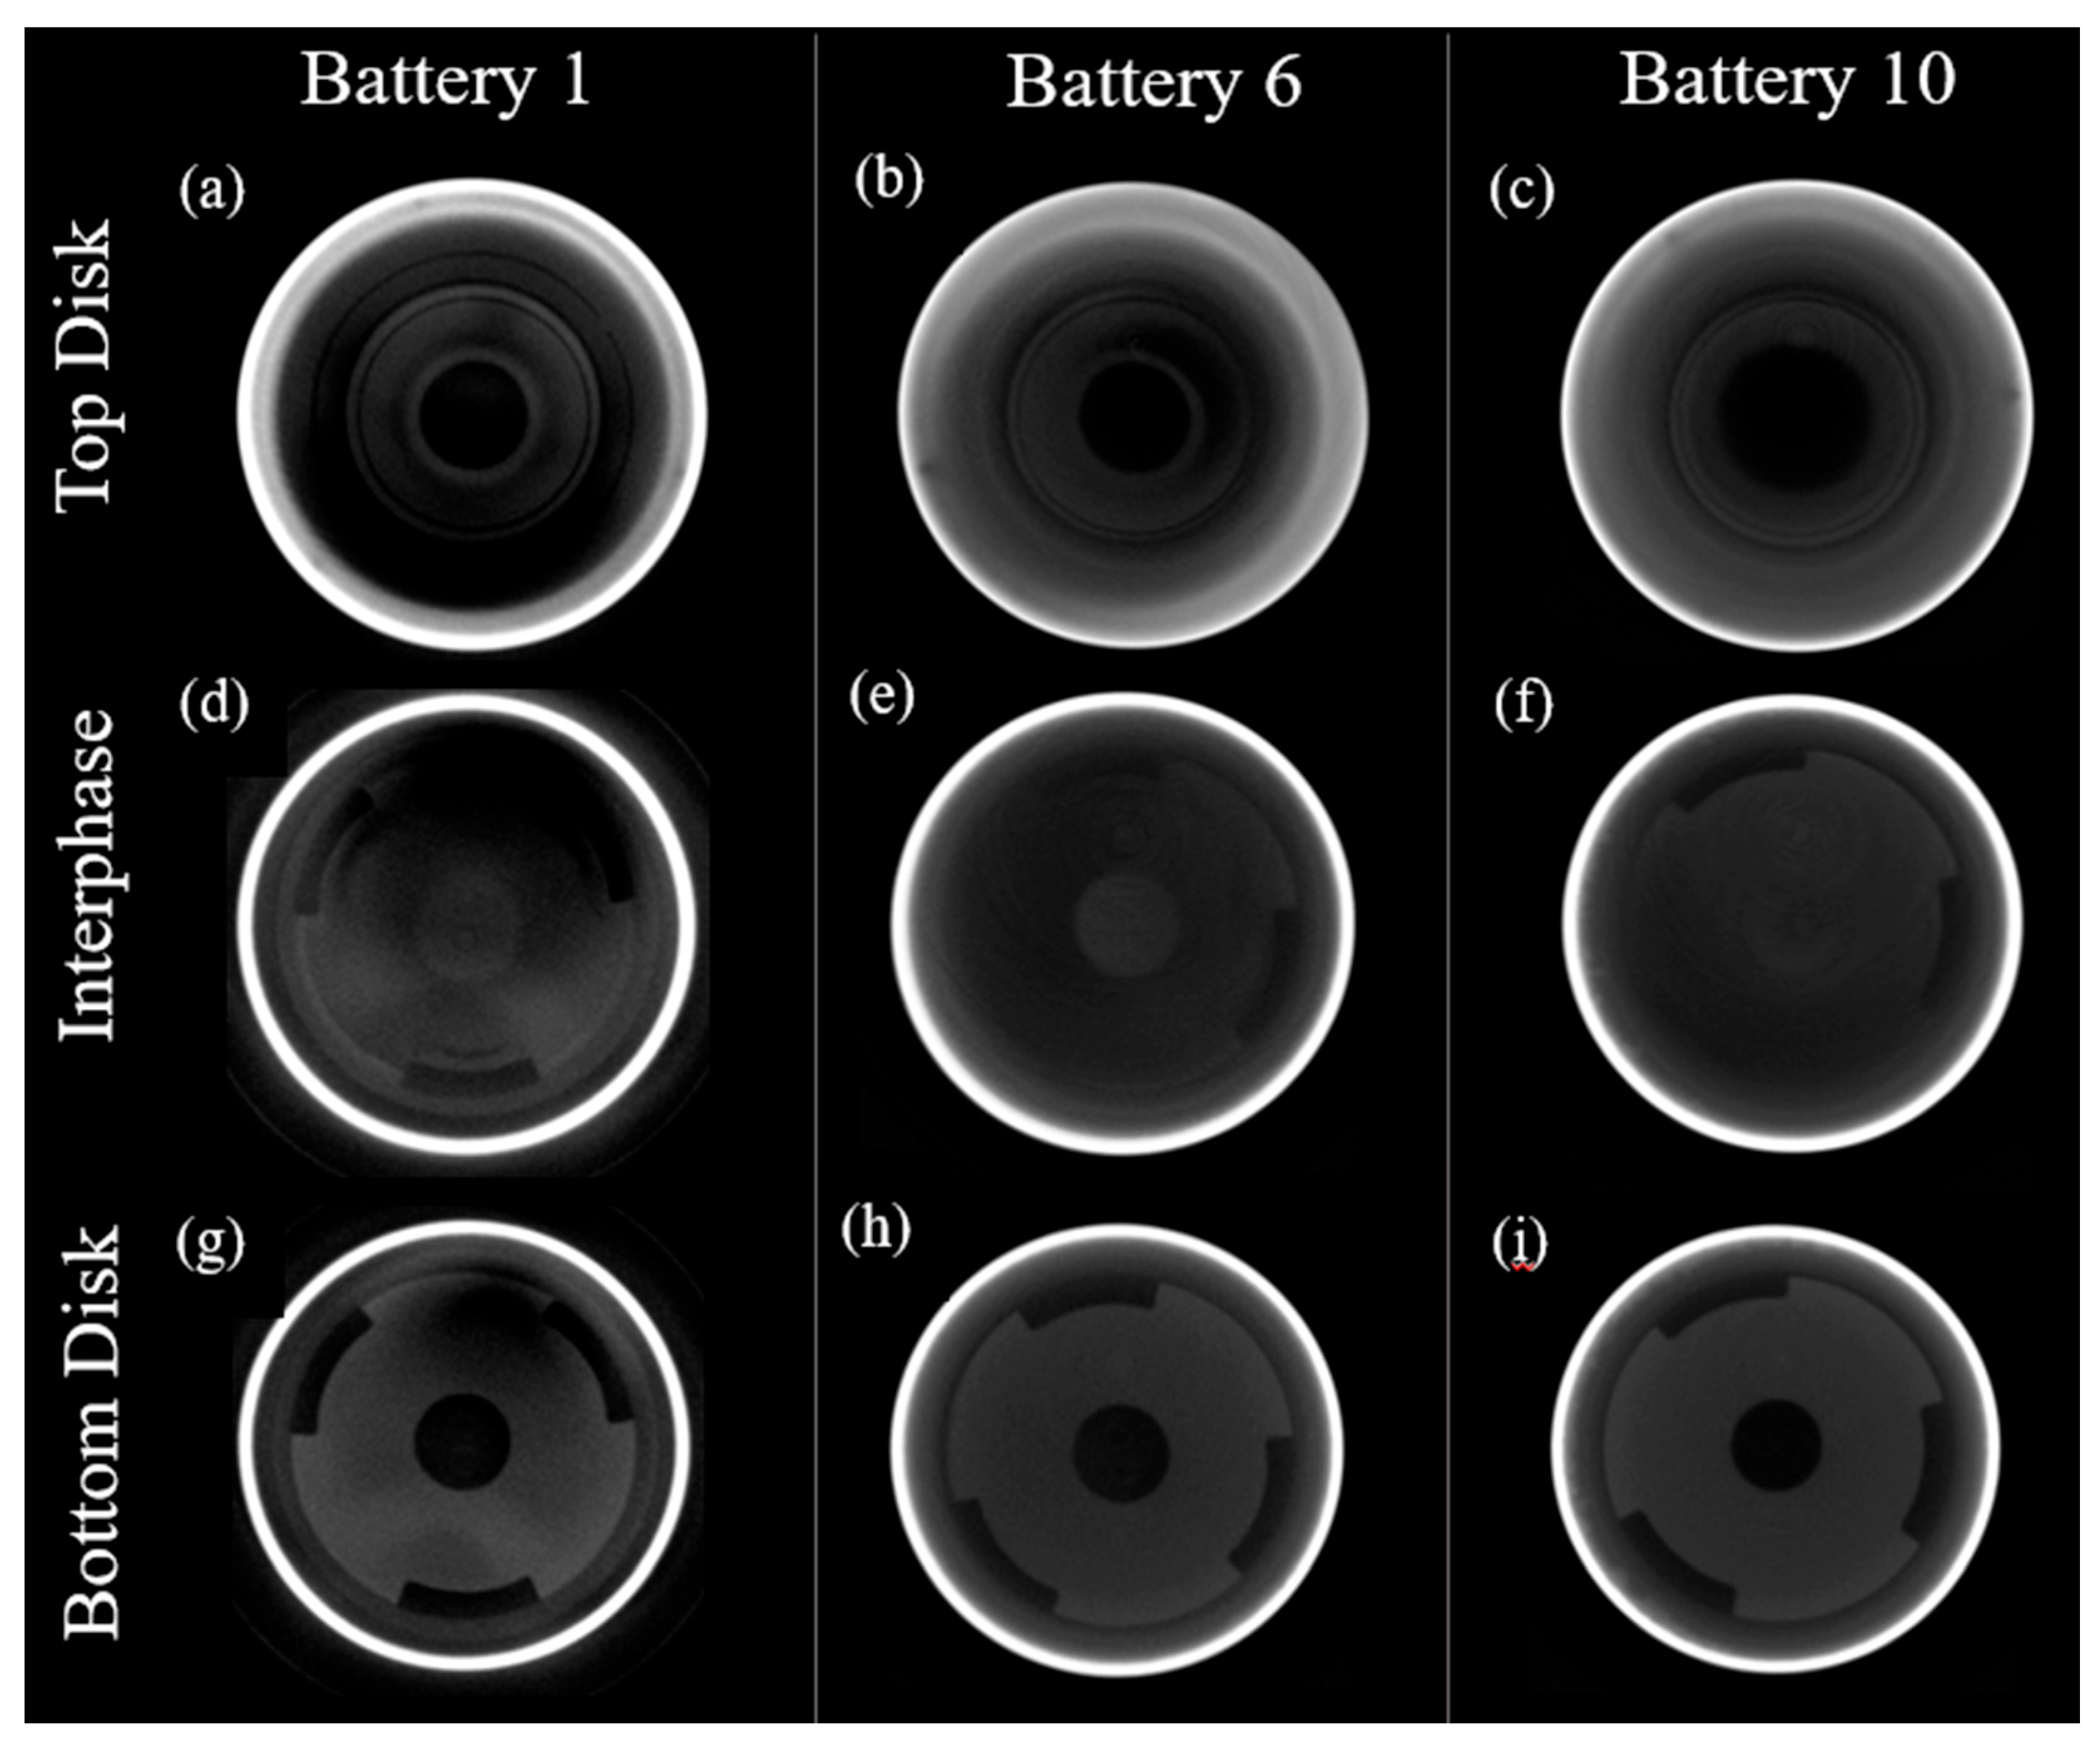
In commercial cylindrical cells, the CID consists of the top disk, plastic insert, and bottom disk. The top disk is a conductive flexible member that can move upwards under excessive pressure. The center point of the top disk is welded to the bottom disk. The seal ring electrically insulates the remaining areas between the top disk and the bottom [
32].
Figure 12a–c provides CT scan images of the upper disk of the CID, revealing an absence of corrosion in this region. In
Figure 12d–f, the CT scans focused on the interface between the upper and lower disks of the CID, demonstrating that the electrical contact remains undisturbed at this junction. This observation serves as confirmation that the CID has not been activated.
Figure 12g–i shows the CT scans of the lower disk of the CID, indicating no corrosion in this specific area.
4. Assessment of the Leakage Path
To gain insight into the pathway through which electrolyte leakage occurs, a cylindrical battery that had not been subjected to any prior temperature cycling was disassembled.
Figure 13 shows the battery cap components from the disassembly and the constituents evaluated.
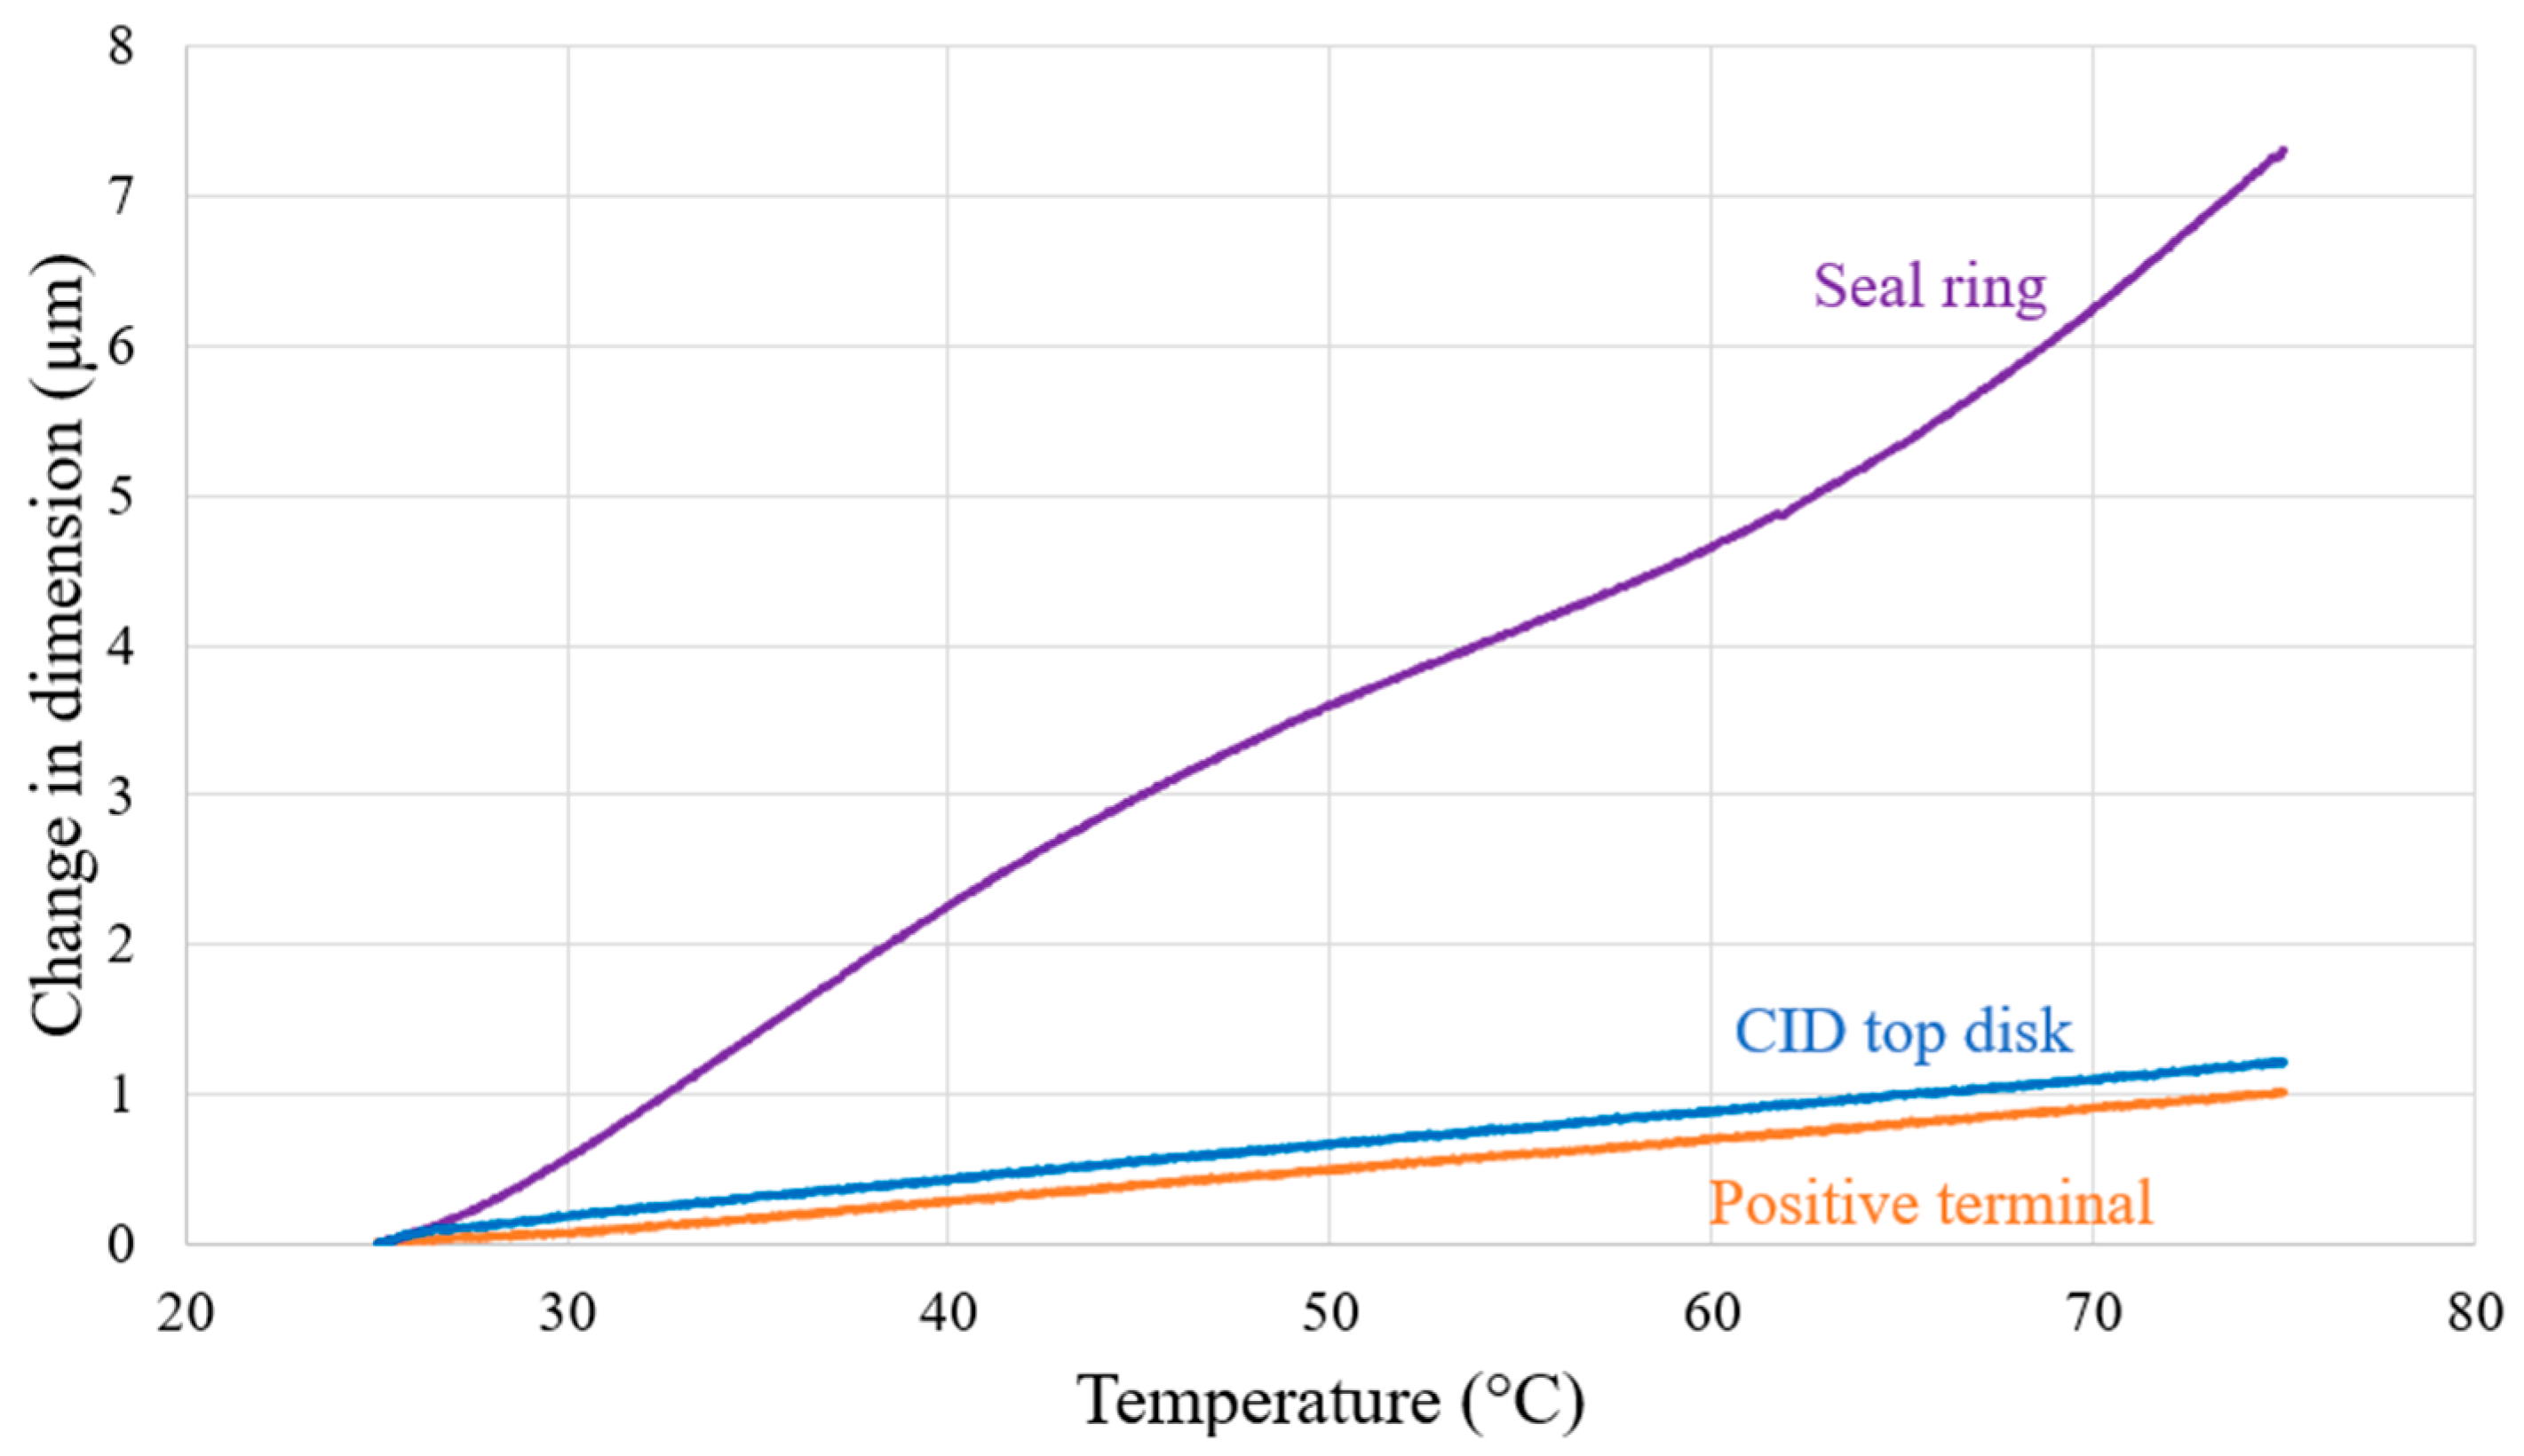
TMA was conducted on three components of a lithium-ion battery: the positive terminal, the CID top disk, and the seal ring, to investigate the response of these components to temperature variation. The experiment involved subjecting the samples to a controlled temperature increase from 25 °C to 75 °C with a heating rate of 5 °C/minute. During this temperature ramp, the dimensional changes of the samples were measured, as shown in
Figure 14.
The initial dimensions of the positive terminal, CID top disk, and seal ring were recorded as 2.16 mm, 1.06 mm, and 1.39 mm, respectively. The dimensional changes were measured using the TA Q400 thermo-mechanical analyzer, TA Instruments, Delaware, USA, with a sensitivity of 15 nm and a precision of 0.1%. The observed changes in dimensions were found to be 1.01 μm, 1.20 μm, and 7.31 μm, respectively. The linear CTE was determined by dividing the observed dimensional change in each component by its initial dimension and the temperature change [
33]. EDX analysis and FTIR spectroscopy were employed to elucidate the elemental composition of the constituent materials comprising the battery cap. The material and thermal properties of the battery elements are shown in
Table 3.
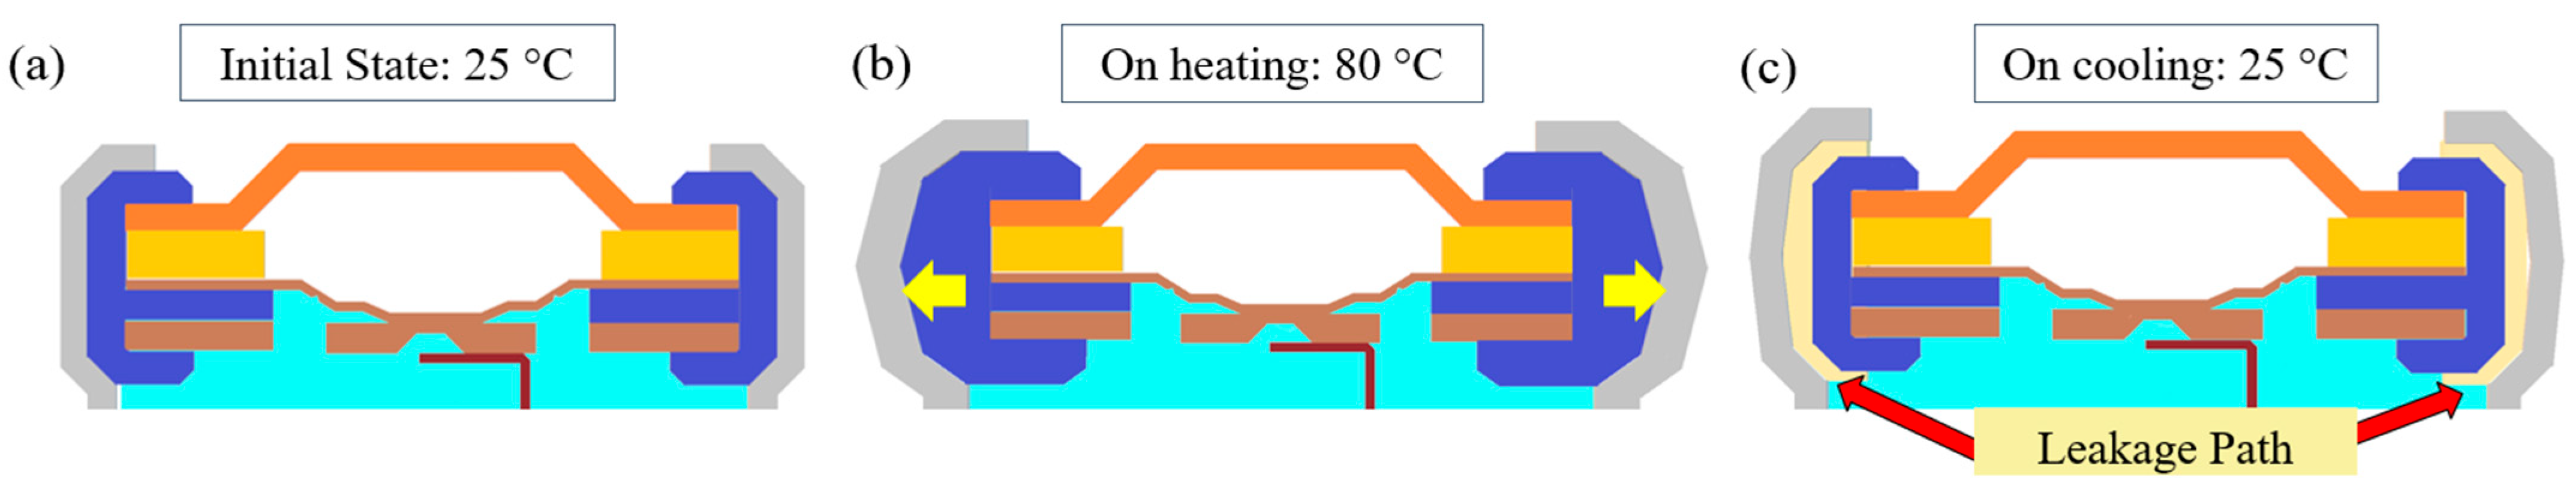
One hypothesis regarding the source of the electrolyte leakage pathway pertains to the differential coefficients of thermal expansion exhibited by various components of the battery cap. As indicated in
Table 3, the insulating materials, specifically the gasket and seal ring, exhibited higher coefficients of thermal expansion (CTE) in comparison to the conductive elements. Consequently, as temperature increases, the gasket and seal ring expand to a greater extent than the positive terminal, PTC device, and CID. Due to the ten times higher coefficient of thermal expansion of the gasket than the battery can, the gasket will exert force on the can when the temperature increases to 80 °C. When the battery is cooled, the gasket contracts to its initial dimensions, whereas the battery can undergo plastic deformation, causing a leakage path, as shown in
Figure 15.
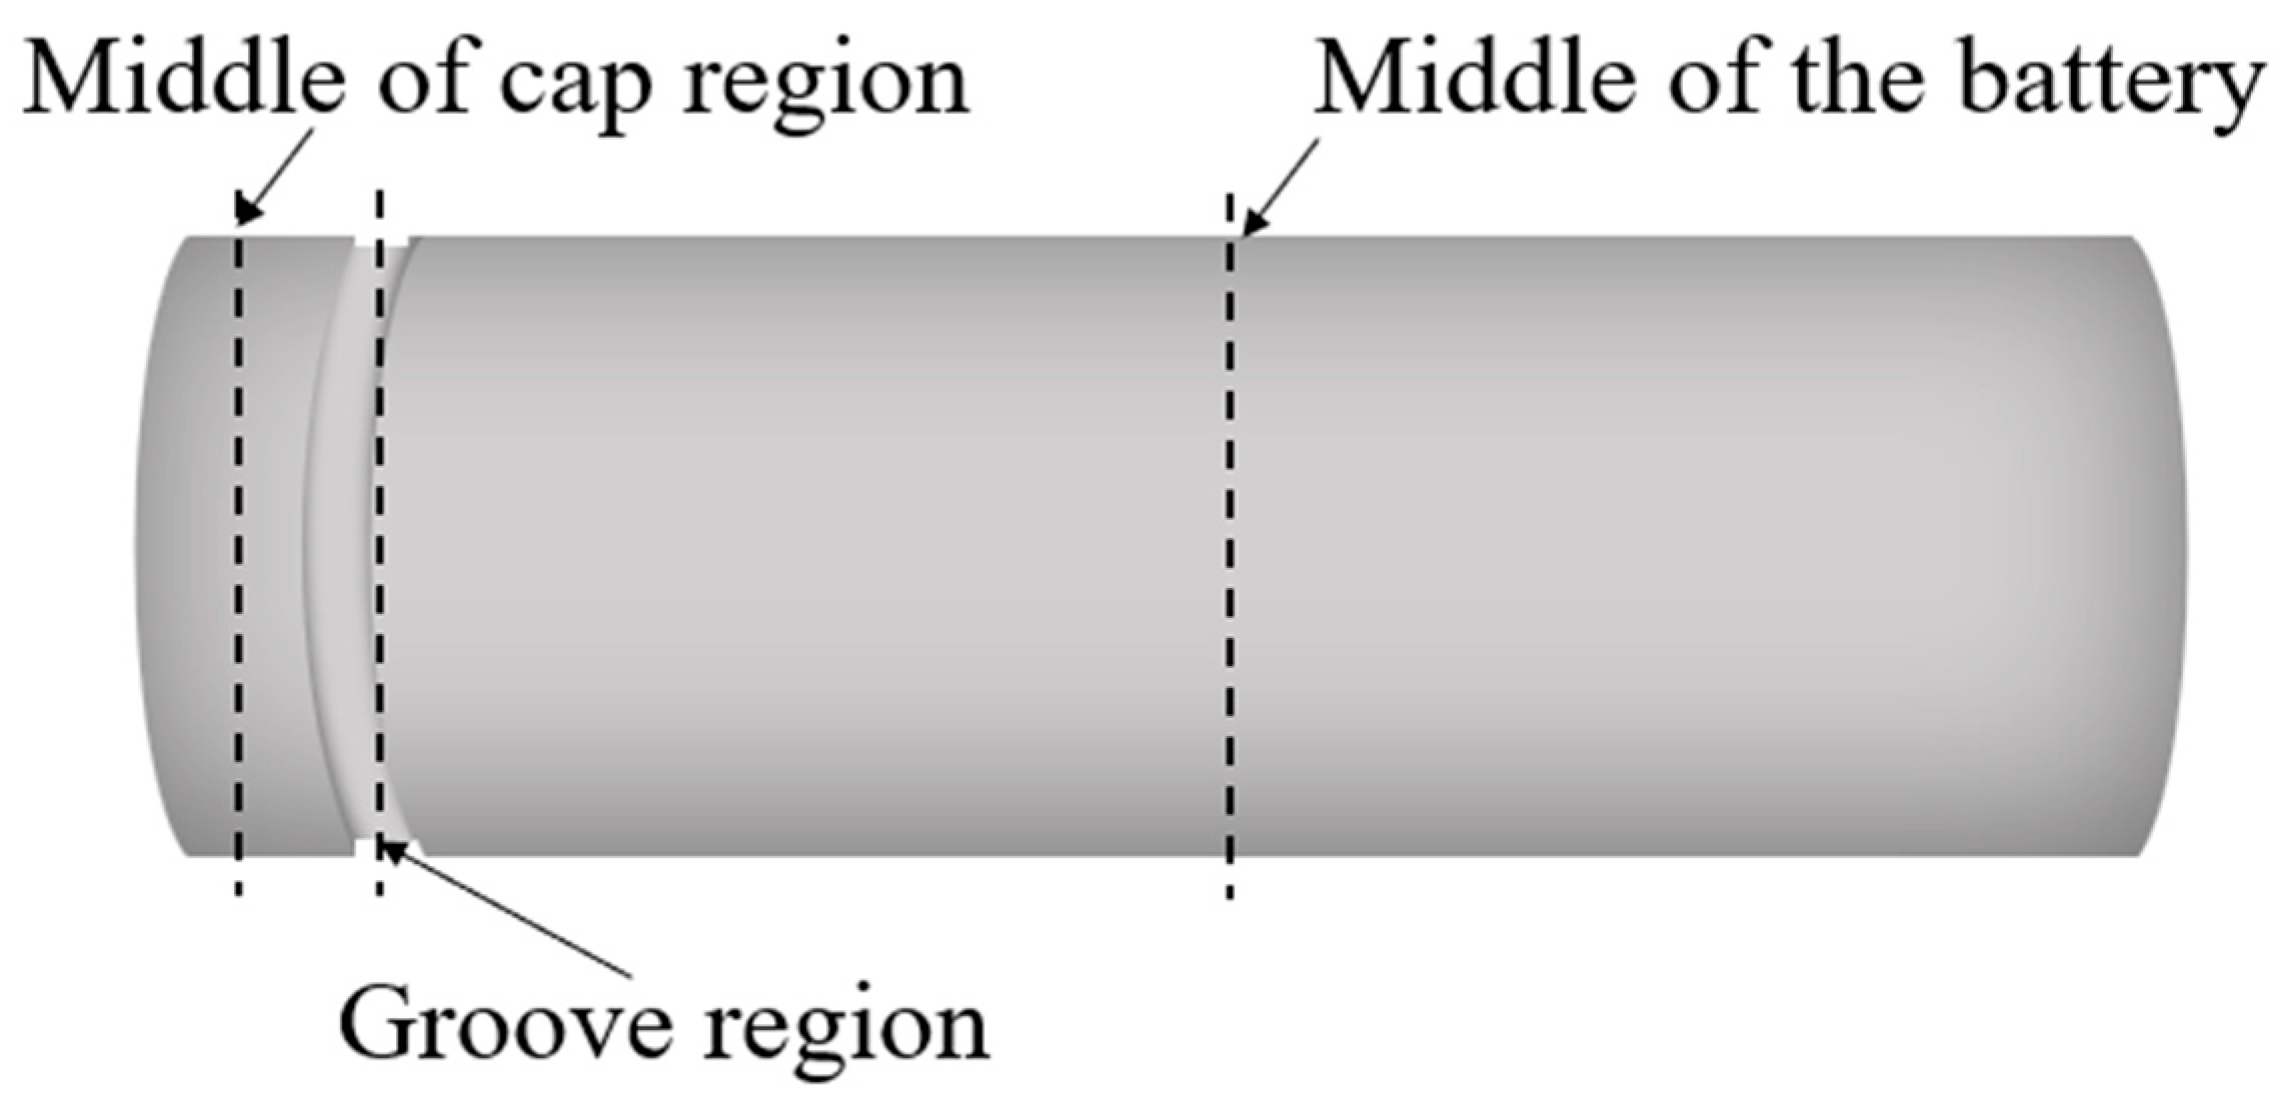
To confirm the above hypothesis, the diameter of both the fresh batteries and the failed batteries was measured, as shown in
Figure 16. The failed batteries displayed an increase in thickness of approximately 50 μm within the cap region when compared to their fresh counterparts. An expansion of roughly 190 μm was observed within the groove region of these failed batteries in contrast to the measurements from new batteries. However, there was negligible expansion detected within the middle portion of these batteries. The longitudinal CT scans of the batteries revealed similar diameter discrepancies, as shown in
Figure 17. Battery No.6 and No.10 exhibited an approximate increase of 300 μm at the middle of the cap post-TC, compared to battery No.1 pre-cycling. Similarly, at the groove region, the diameter of the can was increased by approximately 600 μm. The observed localized expansions in the cap and groove regions correlate with the differential thermal expansion rates. This empirical evidence served to support that plastic deformation occurred in the cap region of the batteries, leading to the formation of a leakage path.
5. Conclusions
Lithium-ion batteries have the potential to pose safety risks, including the risk of thermal runaway resulting in fires and explosions. UN 38.3 helps ensure that lithium-ion batteries meet safety standards to minimize risks during transportation. In this study, ten commercial 14500 cylindrical batteries were subjected to temperature cycling, alternating between 25 °C and 80 °C at a 50% state of charge. The upper-temperature threshold employed in the temperature cycling test was elevated from 72 °C, as stipulated in revision 7 of the UN 38.3 standard, to 80 °C to align the testing conditions with more robust environmental conditions that these batteries could face during transportation, according to the International Air Transport Association (IATA). Four of the ten batteries tested showed a weight decrease of 0.2%, a reduction in voltage from 3.6 V to less than 200 mV, and corrosion at the positive terminals after 72 h post-testing. CT scans revealed that the CID was not activated in the failed batteries, ruling out its role in the voltage drop.
Per the UN 38.3 standard, batteries are required to meet the weight, voltage, and visual criteria following 24 h of storage. Interestingly, in the ten tested batteries, there was no decrease in open circuit voltage or indications of electrolyte leakage within the initial 24 h. However, after 72 h of storage, the open circuit voltage of the failed batteries declined to less than 90% of their initial levels, and the positive terminals exhibited signs of corrosion. This suggests that the UN standard needs to be revised since the goal is to prevent failures from occurring over time and not just within 24 h.
To identify the causes of leakage, a thermo-mechanical analysis of the components comprising the battery cap was conducted. It was found that the gasket and seal ring have a coefficient of thermal expansion of approximately 134 μm/m°C, which is 10 times higher than the conductive components to which they are attached. The differential CTE within the cap region results in stresses that deform the outer can, causing an average 50 μm increase in diameter and creating a pathway for electrolyte leakage. The inhomogeneous expansion of the battery cap elements emphasizes the need to design the cap elements of the lithium-ion battery to be compatible with the environmental and usage conditions during their lifecycle.
Finally, the UN 38.3 test conditions and requirements are continuously revised to align with the demands of the evolving market. However, for some reason, in the latest UN 38.3 revision, the upper temperature threshold was reduced from 75 °C to 72 °C. It is the opinion of the authors that this adjustment lacks an adequate safety margin for real-world scenarios, and the UN should reconsider more accurately aligning with potential life cycle conditions.
In the future, it is imperative to study the effects of ramp rates, dwell periods, and state of charge during temperature cycling on battery performance. These factors influence the thermal and mechanical stresses within battery components, particularly in the cap region. Despite their importance, current standards lack specific guidelines for examining these parameters. Understanding these relationships is beneficial for improving batteries’ qualification test profiles. The test results also point out the importance of material selection for reducing the CTE mismatch-caused deformation in the dual-sealing design at the cell cap area.


