Article

Study on the Influence of the Application of Phase Change Material on Residential Energy Consumption in Cold Regions of China

1
School of Architecture and Design, Harbin Institute of Technology, Harbin 150006, China
2
Key Laboratory of Cold Region Urban and Rural Human Settlement Environment Science and Technology, Ministry of Industry and Information Technology, Harbin 150006, China
*
Authors to whom correspondence should be addressed.
Energies 2024, 17(7), 1527; https://doi.org/10.3390/en17071527
Submission received: 1 February 2024 / Revised: 3 March 2024 / Accepted: 21 March 2024 / Published: 22 March 2024
(This article belongs to the Section G2: Phase Change Materials for Energy Storage)

Abstract

:
As the impact of climate change intensifies, meeting the energy demand of buildings in China’s cold regions is becoming increasingly challenging, particularly in terms of cooling energy consumption. The effectiveness of integrating phase change material (PCM) into building envelopes for energy saving in China’s cold regions is unclear. The aim of this study is to assess the effectiveness of PCM integration in building enclosures for energy efficiency in these regions. The research monitored and recorded indoor temperature data from typical residential cases from May to September. This measured data was then used to validate the accuracy of EnergyPlus22-1 software simulation models. Subsequently, the calibrated model was utilized to conduct a comparative analysis on the effects of PCM on indoor temperatures and cooling energy consumption across these regions. The results of these comparative analyses indicated that PCM can alleviate indoor overheating to varying degrees in severe cold regions of China. Focusing on north-facing bedrooms, applying PCMs reduced the duration of overheating in non-air-conditioned buildings in severe cold regions of China by 136 h (Yichun), 340 h (Harbin), 356 h (Shenyang), and 153 h (Dalian). In terms of cooling energy consumption, the energy saved by applying PCMs ranged from 1.48 to 13.83 kWh/m2. These results emphasize that the performance of PCM varies with climate change, with the most significant energy-saving effects observed in severe cold regions. In north-facing bedrooms in Harbin, the energy-saving rate was as high as 60.30%. Based on these results, the study offers guidance and recommendations for feasible passive energy-saving strategies for buildings in severe cold and cold regions of China in the face of climate change. Additionally, it provides practical guidance for applying PCMs in different climatic zones in China.

1. Introduction

Climate change has become one of the most urgent global issues, impacting not only the natural ecological environment [1] but also posing potential consequences for the construction industry [2]. Countries around the world have reached a consensus on the need to limit global warming to 1.5 °C by the end of the 21st century [3]. Climate change has increased the demand for cooling energy in the summer, even in cold regions such as those of China. Research has suggested that integrating PCMs into building envelopes is an effective method of tackling high energy demand and carbon dioxide emissions, contributing to the sustainable development of the construction industry [4].

1.1. Impact of Climate Change on Building Energy Consumption Demands

The construction industry is a primary consumer of global energy, accounting for 40% of total global energy consumption [5]. A substantial proportion of this energy is dedicated to heating and cooling [6]. The increasing frequency of extreme weather events, including heatwaves and intense precipitation, is affecting outdoor environmental conditions, making it ever more difficult to meet the construction industry’s demand for energy, especially cooling energy [7].
The changes in environmental temperature directly impact the cooling energy consumption demand of buildings [8]; when the ambient temperature tends to increase, the cooling energy consumption of buildings will also increase [9]. Deng et al. assessed the impact of climate change on the energy consumption of two existing communities. The research results indicate that by 2025, the heating energy consumption of the two neighborhoods will decrease by 22–31% and 21–29%, respectively, while the cooling energy consumption will increase by 113–173% and 95–144% [10]. Xiong et al. observed changes in building heating and cooling loads using future meteorological data. Based on their results, heating demand is expected to significantly decrease in cities like Harbin and Beijing in the future, while cooling demand will significantly increase in cities like Guangzhou and Chongqing [11]. In recent years, research has explicitly indicated that climate change poses a potential risk of overheating in residential buildings in severe cold and cold regions of China [12], which could result in an increase in buildings’ consumption of and thus demand for cooling energy in these regions. To reduce winter heating energy consumption in severe cold regions of China, insulation is often increased to minimize indoor heat loss. Research shows high-performance buildings overheat 40.6% more than conventional buildings [13]. Bo et al.’s study has confirmed that, influenced by global warming, the addition of insulated walls in bedrooms in severe cold regions of China increases the duration of overheating by 6.9% to 22.5% compared to bedrooms without insulation [14]. In addition, due to the impact of climate change, severe cold and cold regions of China can no longer rely solely on natural ventilation to lower indoor temperatures. Nowadays, it is also necessary to use air conditioning to maintain indoor thermal comfort in these areas. The building envelope structure, as the interface between the outdoor environment and indoor user requirements, plays a crucial role in regulating architectural energy consumption [15]. Research has investigated the use of passive measures to alleviate the adverse effects of climate change on building energy consumption [16,17]. Integrating PCMs into building envelopes is an effective low-carbon passive energy-saving measure [4,18].

1.2. Applications of PCM in Construction

PCMs have been widely integrated into building envelope structures, and a considerable amount of research has discussed the feasibility of such integration [19,20]. PCMs can absorb or release significant latent heat during phase transitions, and their use in building envelopes is widely recognized [21], which has been reported to be integrated into walls [22], bricks [23], floors [20], concrete [24], and mortar [25] to enhance the thermal storage capacity of building envelopes. Yang et al. found that PCM gypsum boards demonstrated satisfactory performance in heat storage and temperature delayed heat release compared with normal gypsum boards [22]. Silva et al. reported that PCMs integrated into brick walls had the potential to store solar thermal energy, reducing the thermal amplitude from 10 °C to 5 °C, which helped to attenuate indoor temperature fluctuations [23]. Another study showed that PCM roofing with thermochromic coating saved 17% energy, performing best in mild climates [26].
Kishore et al. argued that the working performance of PCMs is optimal when the phase change temperature range closely matches the indoor temperature range [27]. The use of PCM is an effective passive measure that can help improve indoor thermal comfort [28,29]. Godoy-Vaca et al. demonstrated that the incorporation of PCM in Ecuadorian social housing can increase the duration of thermal comfort by 46% and reduce the time experiencing a shift from “very hot” to “hot” by 937 h [30]. PCMs undergo phase transition during the processes of absorbing and releasing heat, which helps reduce indoor temperature fluctuations, thereby improving thermal comfort [31]. Beemkumar et al. suggested that integrating PCMs into building roofs can reduce temperature fluctuations in buildings, resulting in an average peak temperature reduction of 1–2 °C [32]. Another study indicates that PCM can help improve indoor thermal comfort by 215 h during the summer [33]. Furthermore, in terms of energy savings, research has shown that the energy-saving rate of phase change walls in the cooling season is 24.45%, and in the heating season, it is 14.76% [34]. Hammid et al. indicated that PCM with a melting temperature of 25 °C can help save energy consumption by 22% [35]. Another study indicates that compared to single-layer PCM, the energy-saving efficiency of double-layer and triple-layer PCM is higher, reaching 15.21% [36].

1.3. Other Applications of PCM

In addition to being used in building envelopes, PCM can also be employed in other fields. Integrating PCMs into vehicle rooftops can mitigate internal temperature fluctuations, thereby enhancing passenger comfort and reducing reliance on energy-intensive heating and cooling systems [37]. PCMs can also be utilized in energy storage and production devices to enhance the performance of such systems. PCMs have demonstrated a significant role in Thermal Energy Storage (TES) by efficiently utilizing and storing waste heat for later use, thereby enhancing energy efficiency and sustainability [38]. Latent Heat Thermal Energy Storage (LHTES) systems utilizing PCMs can generate electrohydrodynamic (EHD) effects, which can enhance the performance of LHTES while simultaneously reducing electricity consumption, thus improving energy efficiency and sustainability [39]. TES with PCM integration will serve as a more efficient and cost-effective energy storage system in the production of renewable solar energy [40].

1.4. Applicability of PCM under Different Climate Conditions

As the performance of PCMs is strongly correlated with climatic conditions, recent research has investigated the climatic adaptability of such materials. In a study conducted in a mild climate, PCMs reduced indoor temperature fluctuations by 1.4 °C [41]. In a hot climate, the integration of PCMs resulted in a peak indoor temperature lag of 2.6 h [42]. Another study selected four representative cities in severe cold and cold regions of China to verify the effectiveness of PCMs in alleviating overheating. The results showed that PCMs reduced the duration of overheating by 19.66%, 17.95%, 15.88%, and 10.87%, respectively [43]. Liu et al. validated the effectiveness of PCMs coupled with nighttime ventilation during the transitional and hot seasons in 10 cities in western China. The results indicated that the optimal PCMs for the 10 cities were effective in the temperature range of 23–29 °C [44].
PCMs have been shown to be particularly suitable for Mediterranean climates, increasing energy efficiency by up to 62% in the Csb-Coimbra climate [45]. In the Central Plains of China, Li et al. found that PCMs lowered indoor temperatures by 1–2 °C [46]. Another study indicated that PCM concrete effectively reduced summer indoor temperature fluctuations in Paris compared to three cities with higher summer temperatures [47]. Kishore et al. conducted a comparative study on the differences in the use of PCM in five U.S. cities located in different International Energy Conservation Code climate zones. They found that PCM is not always universally beneficial under all climate conditions. Specifically, for cities with extreme and longer winters, integrating PCM is effective for heating season [27]. Dehkordi et al. found that the energy-saving effects of applying PCMs were more pronounced in cold climates than in hot climates. Using PCMs inappropriately may even increase the energy demand of buildings [48]. It is clear from the results of past studies that the performance of PCMs is considerably affected by climatic conditions. However, the effectiveness of PCM application in different climatic zones in China is still unclear.

1.5. Literature Gap and Research Object

Based on the literature review above, the following research gaps are identified:
  • Currently, the majority of quantitative research focuses on the application of PCMs in tropical regions for construction purposes. According to ASHRAE Standard 169-2013, regions classified within the numerical range of 6 to 8 can be categorized as cold regions [49]. Table 1 illustrates that some studies have examined the use of PCMs in cold regions, such as Moscow in Russia, Billing in the USA, Kiruna in Sweden and Ottawa and Yellowknife in Canada. However, the effectiveness of PCM in severe cold and cold regions of China still has research potential and significance.
  • In the past, cold regions of China were considered not to consume a significant amount of cooling energy. However, due to the impact of climate change, buildings in this region now face new challenges in terms of cooling energy demand. Limited research has addressed the application of PCMs in this climatic zone and its efficacy in reducing cooling energy consumption.
  • In China, there are significant differences in outdoor weather conditions among different climatic zones. However, limited comparative research has been conducted on the efficacy of PCMs in reducing cooling energy consumption in residential buildings during summer across various climatic zones. It is necessary to further explore the applicability of PCMs under different climatic conditions in China from the perspective of energy-saving effects.
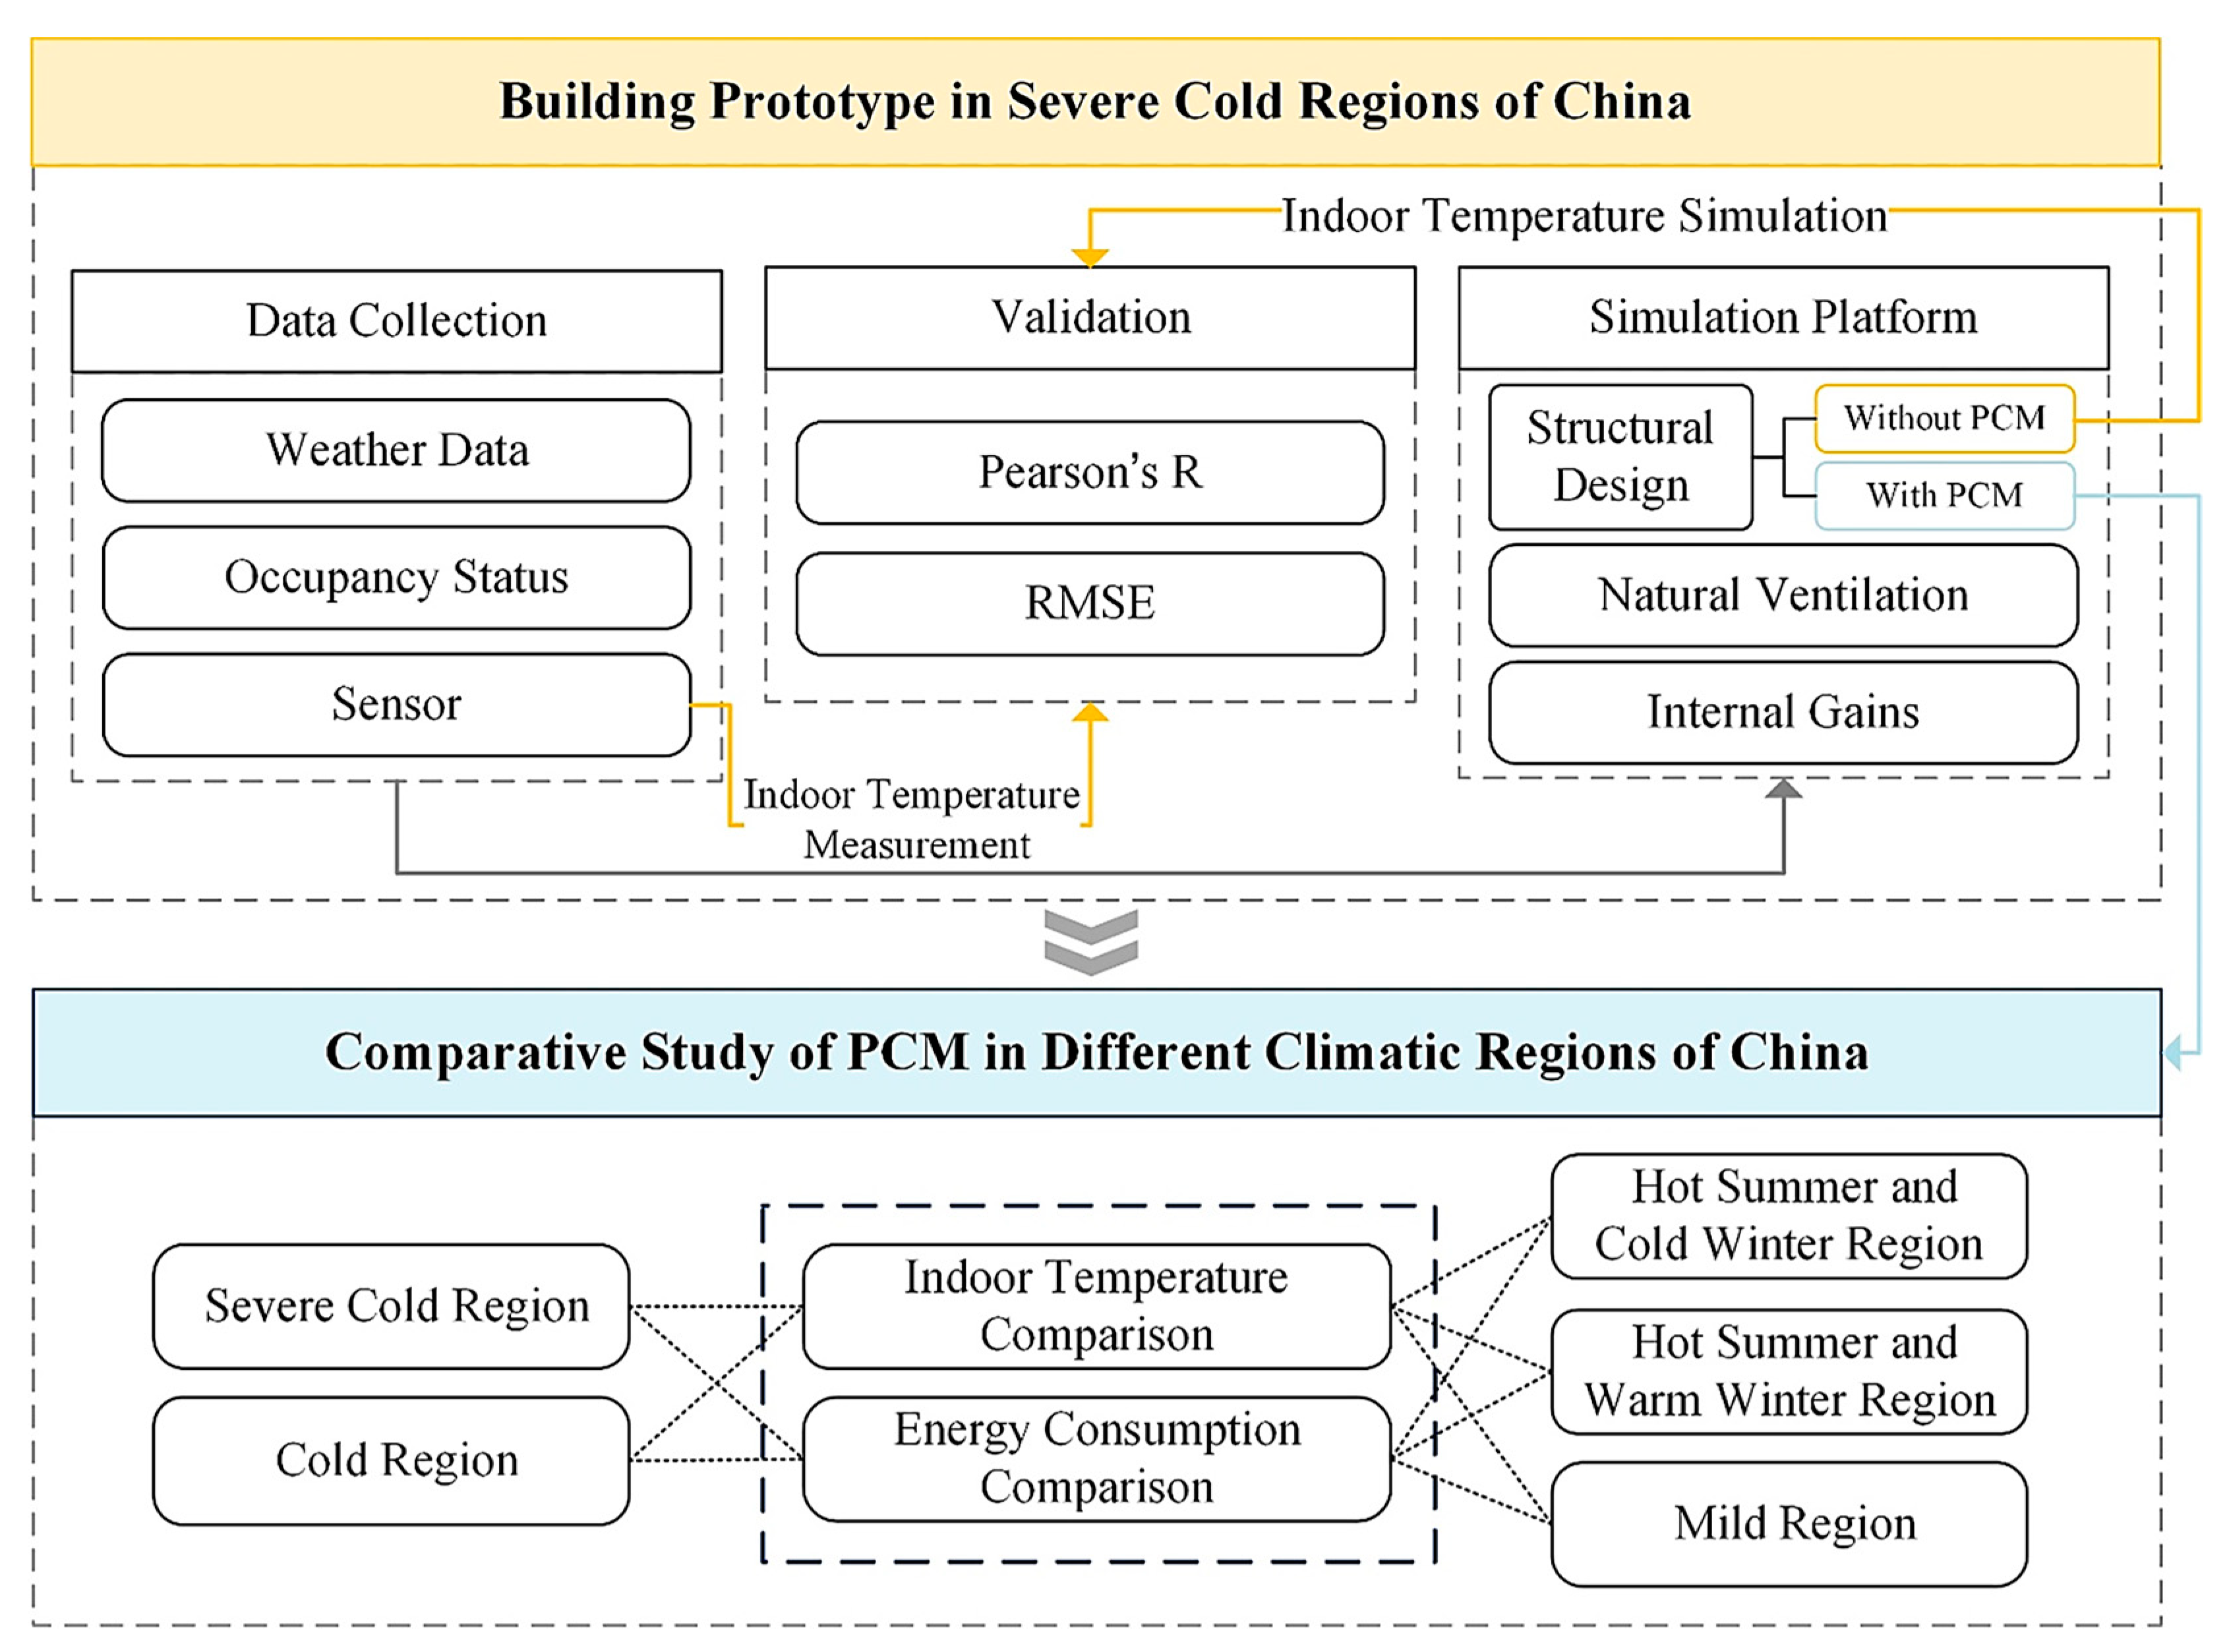
The first objective of this study was to validate the accuracy of numerical model simulation results using long-term monitored indoor temperature data from May to September. Second, the study aimed to explore the impact of integrating PCMs on summer indoor temperatures and cooling energy consumption in cold regions of China. Finally, the study sought to compare and discuss the potential of PCM application to reduce cooling energy consumption in different climatic zones.

2. Methodology

The study selected residential areas in representative cities in severe cold regions of China as research cases. First, climate data, residential occupancy patterns, and indoor temperature data from May to September 2021 were collected to provide parameter settings for constructing a simulation platform. Second, Pearson’s R and the root mean squared error (RMSE) were utilized to conduct a fitting analysis between the measured indoor temperature data and simulated temperature data, verifying the model’s accuracy. Third, based on the calibrated model, the applicability of PCMs in severe cold regions of China was explored. Fourth, the effectiveness of using PCMs in different climatic regions was compared. The specific research framework is illustrated in Figure 1.

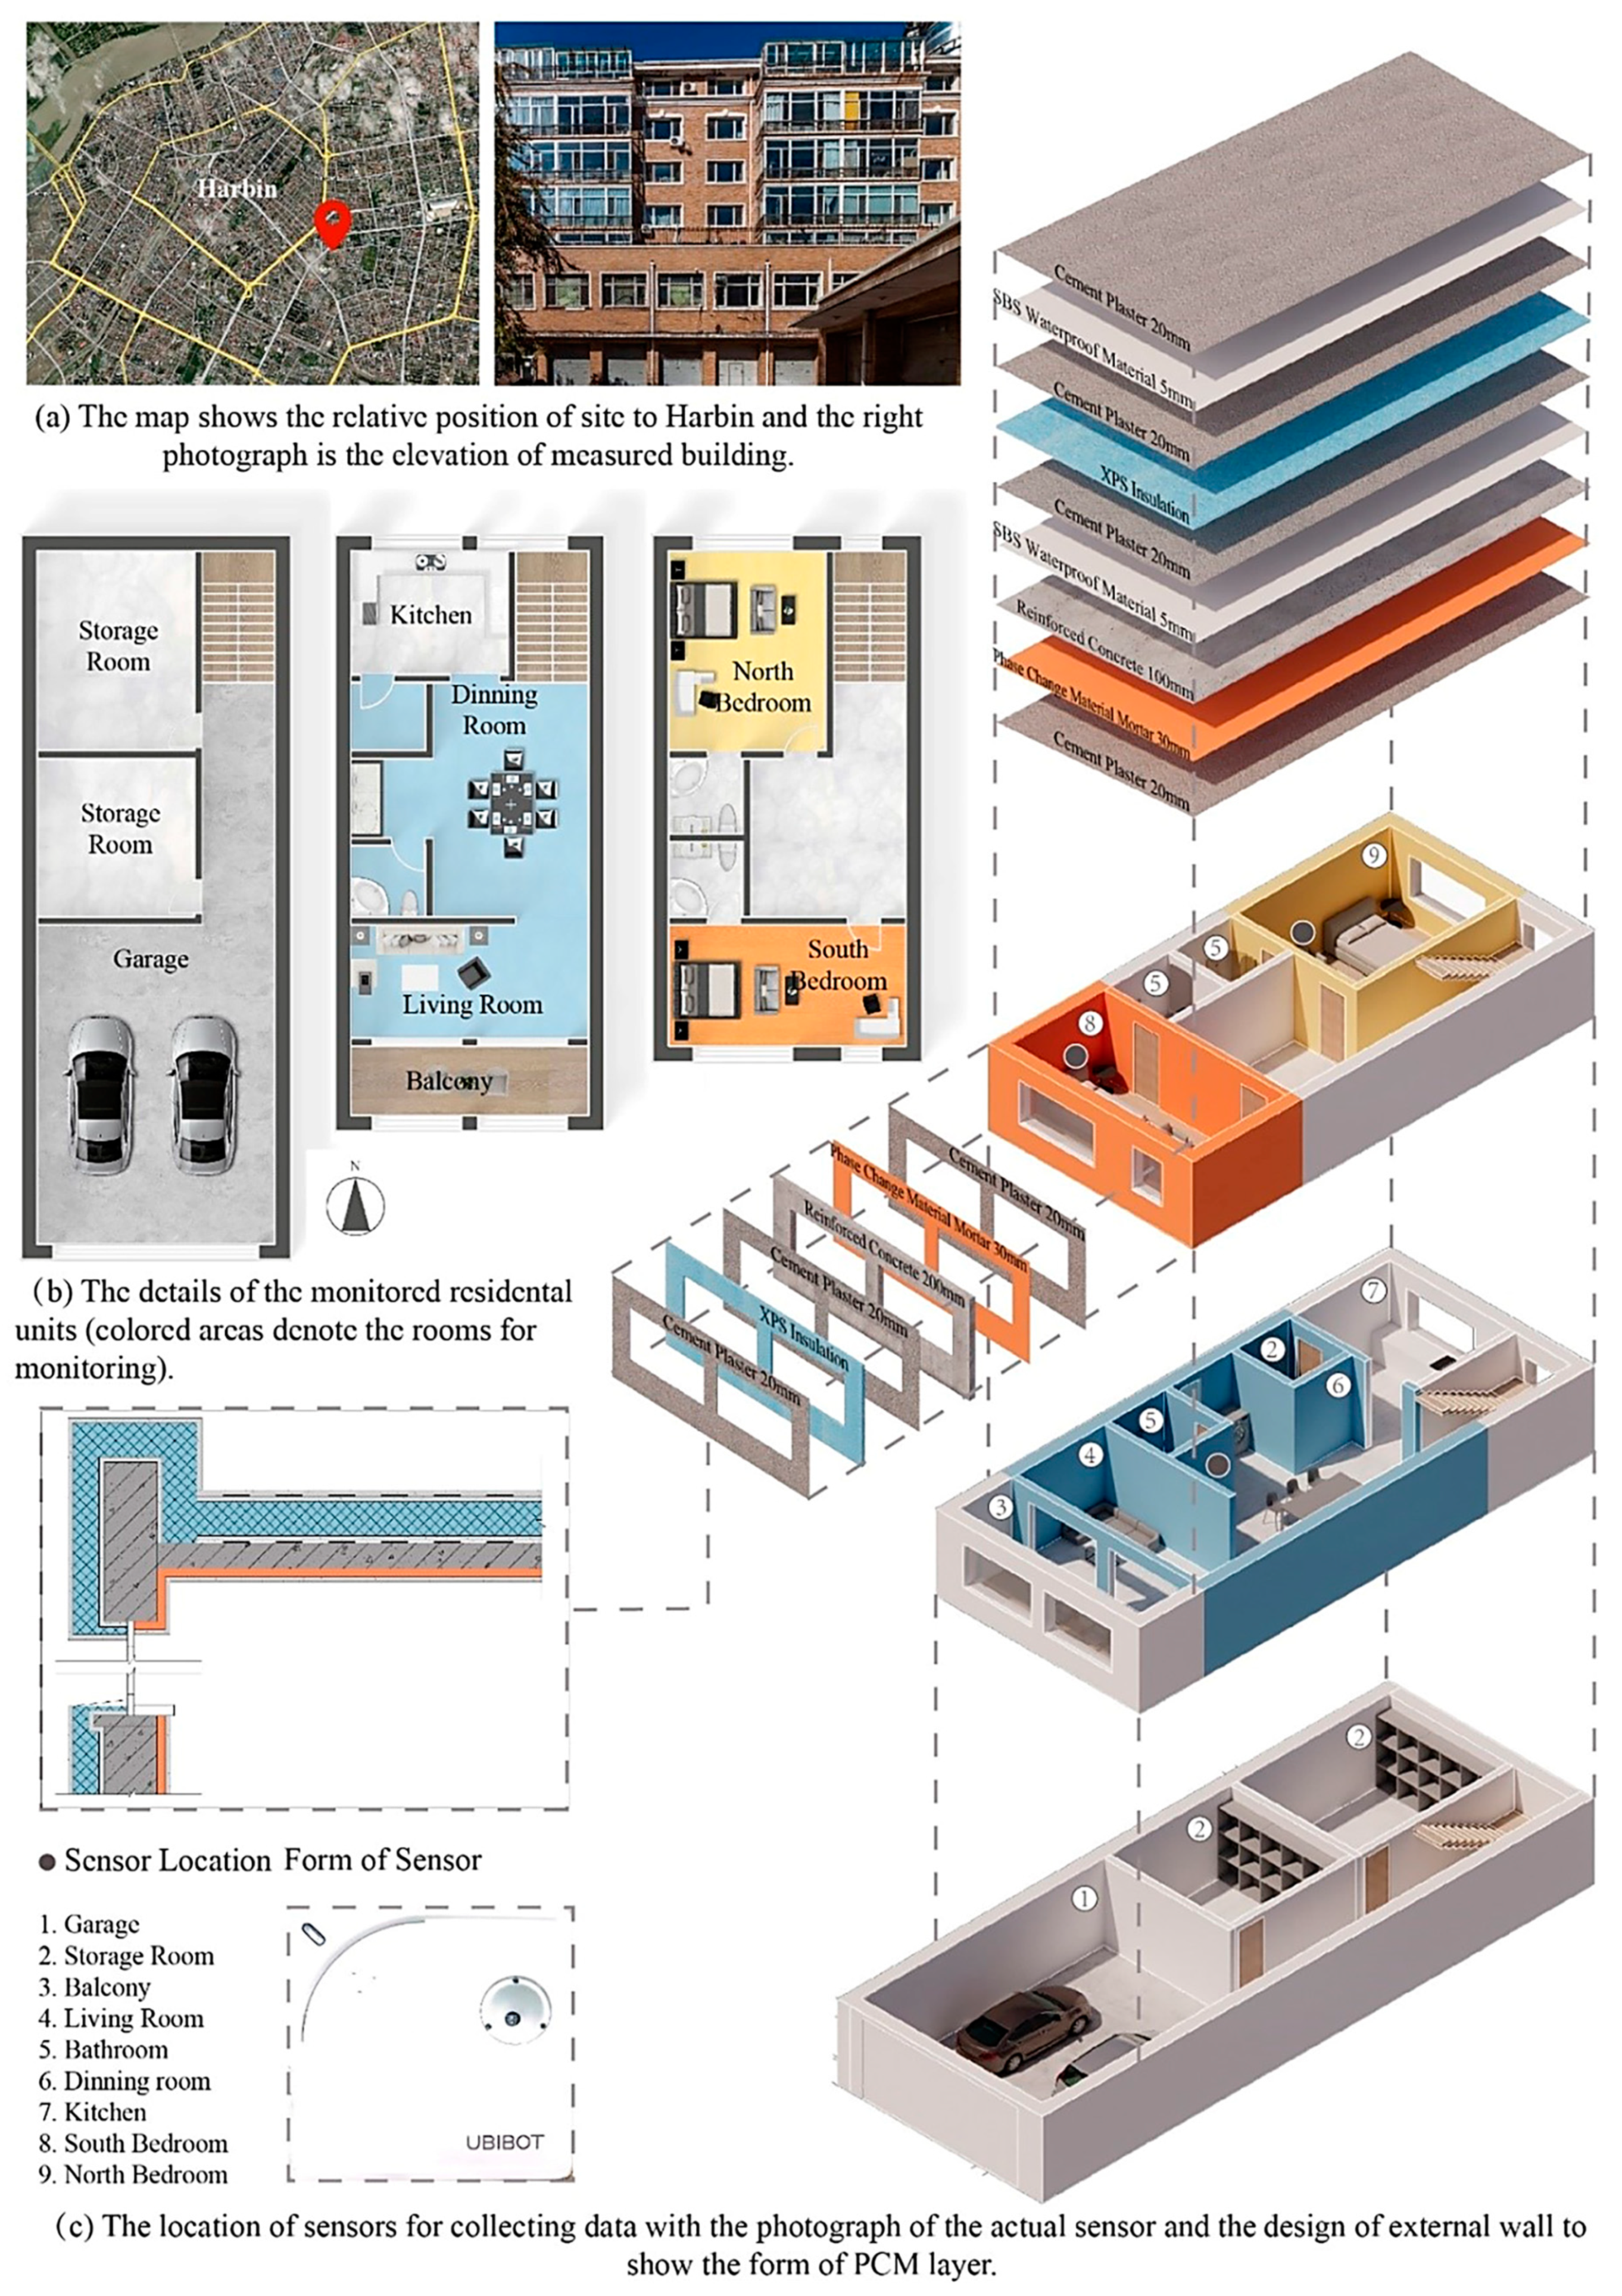
2.1. Building Description

The study initially selected a residential building in Harbin, a representative city in a severe cold region of China, as the target for practical measurements. As shown in Figure 2, the indoor temperature data were collected from a low-rise reinforced concrete residential building with three floors. The first floor consisted of a garage and storage room; the second floor comprised a living room, kitchen, dining room, and balcony; and the third floor had two bedrooms, one facing south and the other facing north. The design of the residence followed the style typical of severely cold regions, ensuring good ventilation; accordingly, no air conditioning system had been installed in the building. The temperature in the living room, south-facing bedroom, and north-facing bedroom was measured. Sensors were placed on walls without direct sunlight exposure to gather relevant data such as temperature and humidity, providing data support for subsequent simulation experiments.

2.2. Climate Zones and Representative Cities

Based on the average temperature in the coldest month and the average temperature in the hottest month, the Chinese Code for Thermal Design of Civil Buildings divides China into five climatic zones: severe cold regions, cold regions, hot summer and cold winter regions, hot summer and warm winter regions, and mild regions [52]. In this study, a residential building in Harbin, which is located in a severe cold region of China, was selected as the initial target for practical measurements. The resulting data were used to validate the accuracy of the simulation model and to preliminarily explore the effectiveness of PCM application in severe cold and cold regions of China. To further compare the applicability of PCMs across climate conditions in China, two typical cities from each climate zone were selected for further in-depth analysis. Table 2 illustrates the corresponding climate zones, specific locations, and thermal design standards for the total 11 selected cities.

2.3. Simulation and Validation

EnergyPlus software was used for the building simulation. The phase change process in PCMs was simulated using the conduction finite difference (CondFD) method. Numerical models for building envelopes, weather data, operational conditions, and other parameters were constructed based on the actual conditions of different cities (specific input parameters are provided in the Appendix A). To further investigate the impact of PCMs on cooling energy consumption, in conjunction with the actual cooling energy demand in different cities, cooling cycles were implemented with an automatic activation temperature set at 26 °C. To calculate the cooling energy demand, the coefficient of performance (COP) of cooling was set to 3.4. Considering the variation in indoor temperature ranges in different cities during the summer, optimal PCMs with different phase change temperatures were selected for the simulation. Phase change mortar materials with a thickness of 30 mm were simulated. These PCMs were placed on the inner side of the building envelope structures (external walls and roofs). Specific parameters of the PCMs are detailed in Table 3.
To validate the reliability of the model, a correlation analysis and error analysis were conducted between the measured temperatures and simulated temperatures. Adjustments were made to the ventilation environment and internal heat values of the rooms to make the simulated environment as close as possible to the measured environment. Pearson’s R was used to determine the linear correlation between measured values and simulated values, which can be calculated using Equation (1). A value closer to 1 indicates better model performance. Root Mean Square Error (RMSE) was used to quantify the degree of difference between simulated values and measured values; a lower RMSE value indicates a smaller difference between simulated and measured values, which can be calculated using Equation (2).
Pearson s   R = i = 1 n ( X i X ¯ ) ( Y i Y ¯ ) ( i = 1 n ( X i X ¯ ) 2 ) ( i = 1 n ( Y i Y ¯ ) 2 )
RMSE = i = 1 n ( X i Y i ) 2 n
Xi represents measured values, Yi represents simulated values, X ¯ and Y ¯ represent the means of measured and simulated values, respectively, and n is the number of data points.

3. Results

3.1. Measurement and Validation

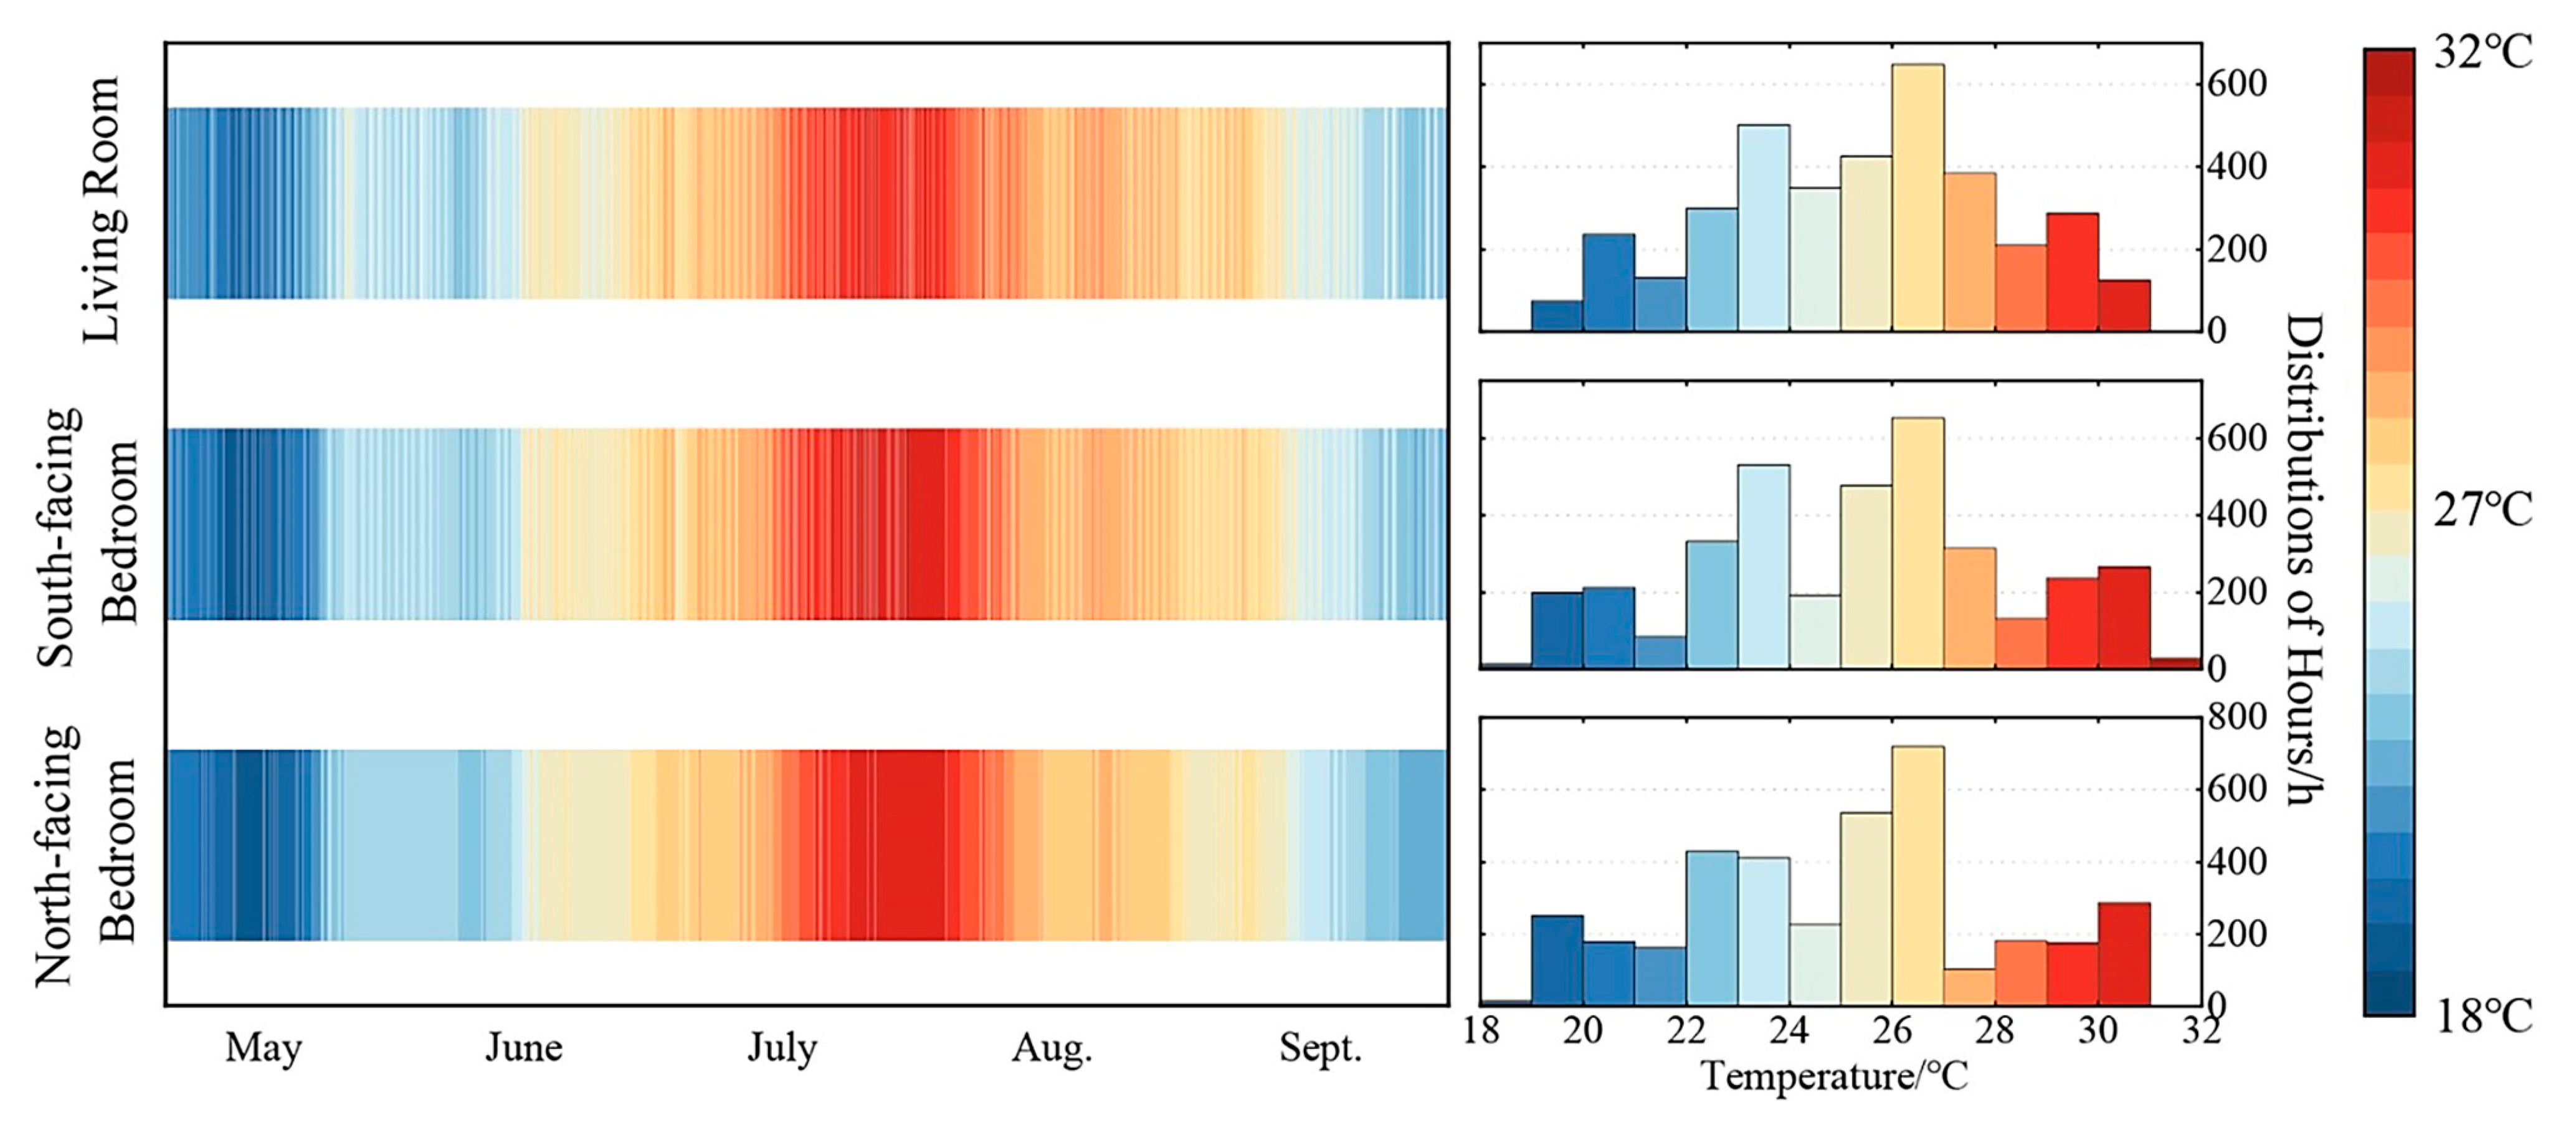
3.1.1. Indoor Temperature Measurement Results in the Severe Cold Region

Focusing on a typical residential building in Harbin, which is located in a severe cold region of China, this study monitored and collected indoor temperatures in the building’s north-facing bedroom, south-facing bedroom, and living room from May to September 2021 (Figure 3). The average indoor temperatures in the three rooms were 24.96 °C, 25.27 °C, and 25.34 °C, respectively. As shown in Figure 2, high temperatures were concentrated mainly in July, with Tmax values of 30.71 °C, 31.42 °C, and 30.95 °C, respectively. Compared with the north-facing bedroom, the south-facing bedroom experienced a longer duration of high temperature conditions, with temperatures exceeding 30 °C for 294 h, accounting for 8.01% of the total monitoring duration.

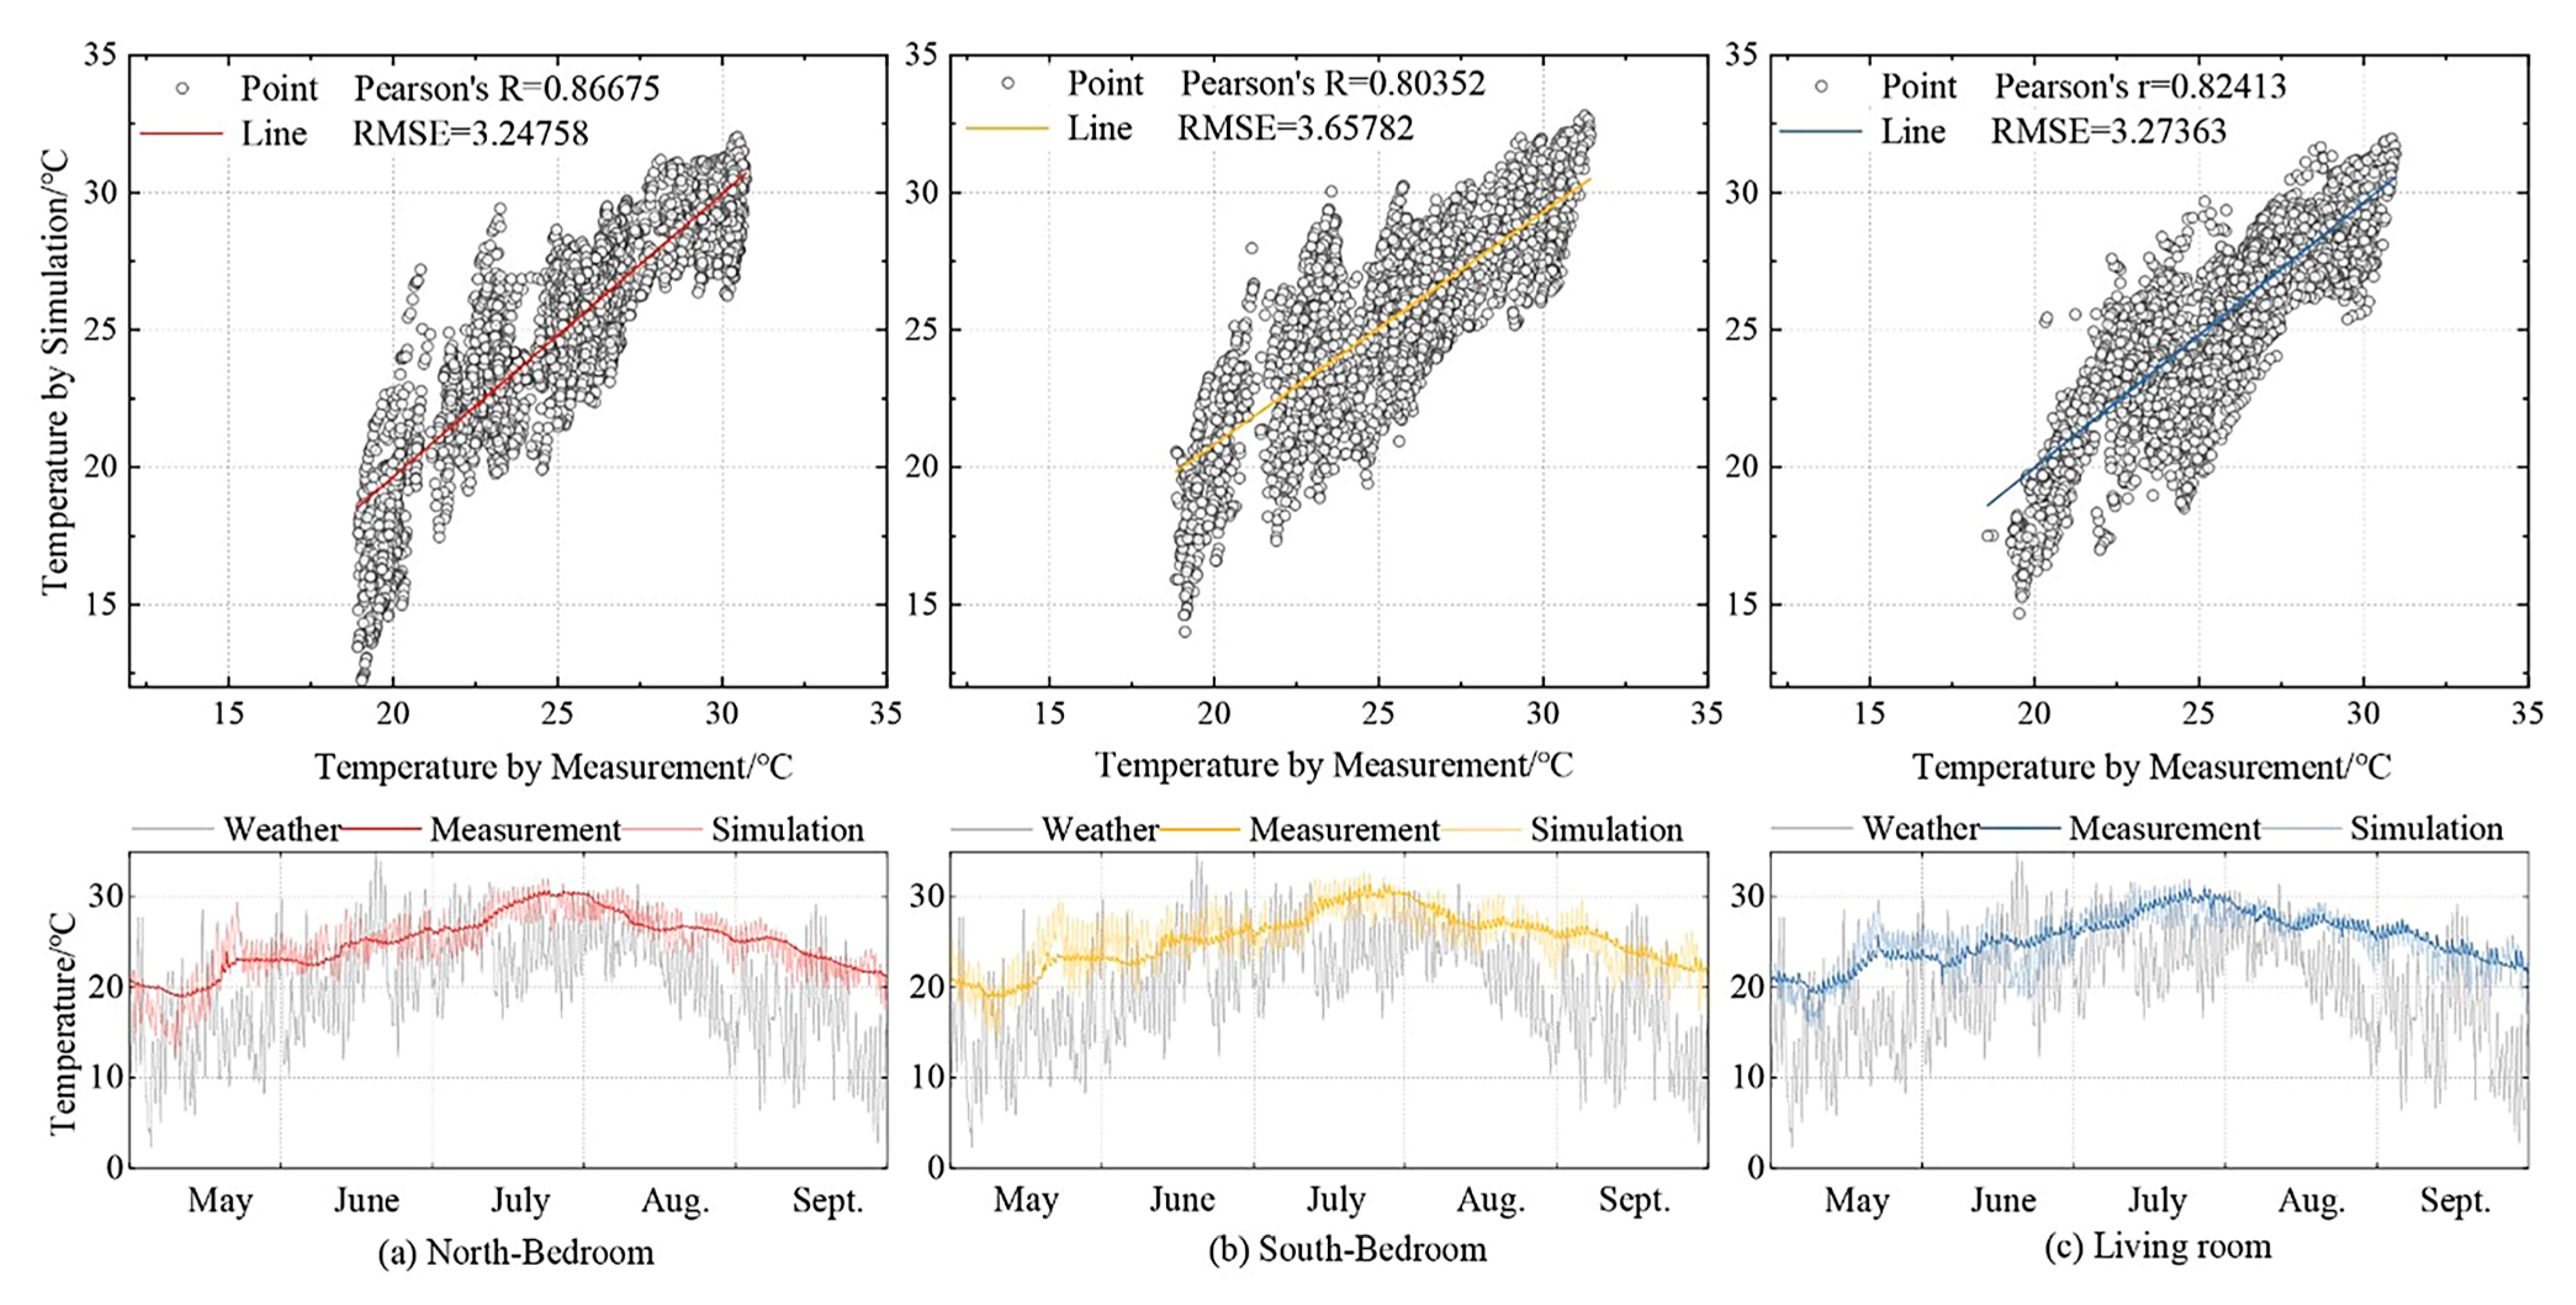
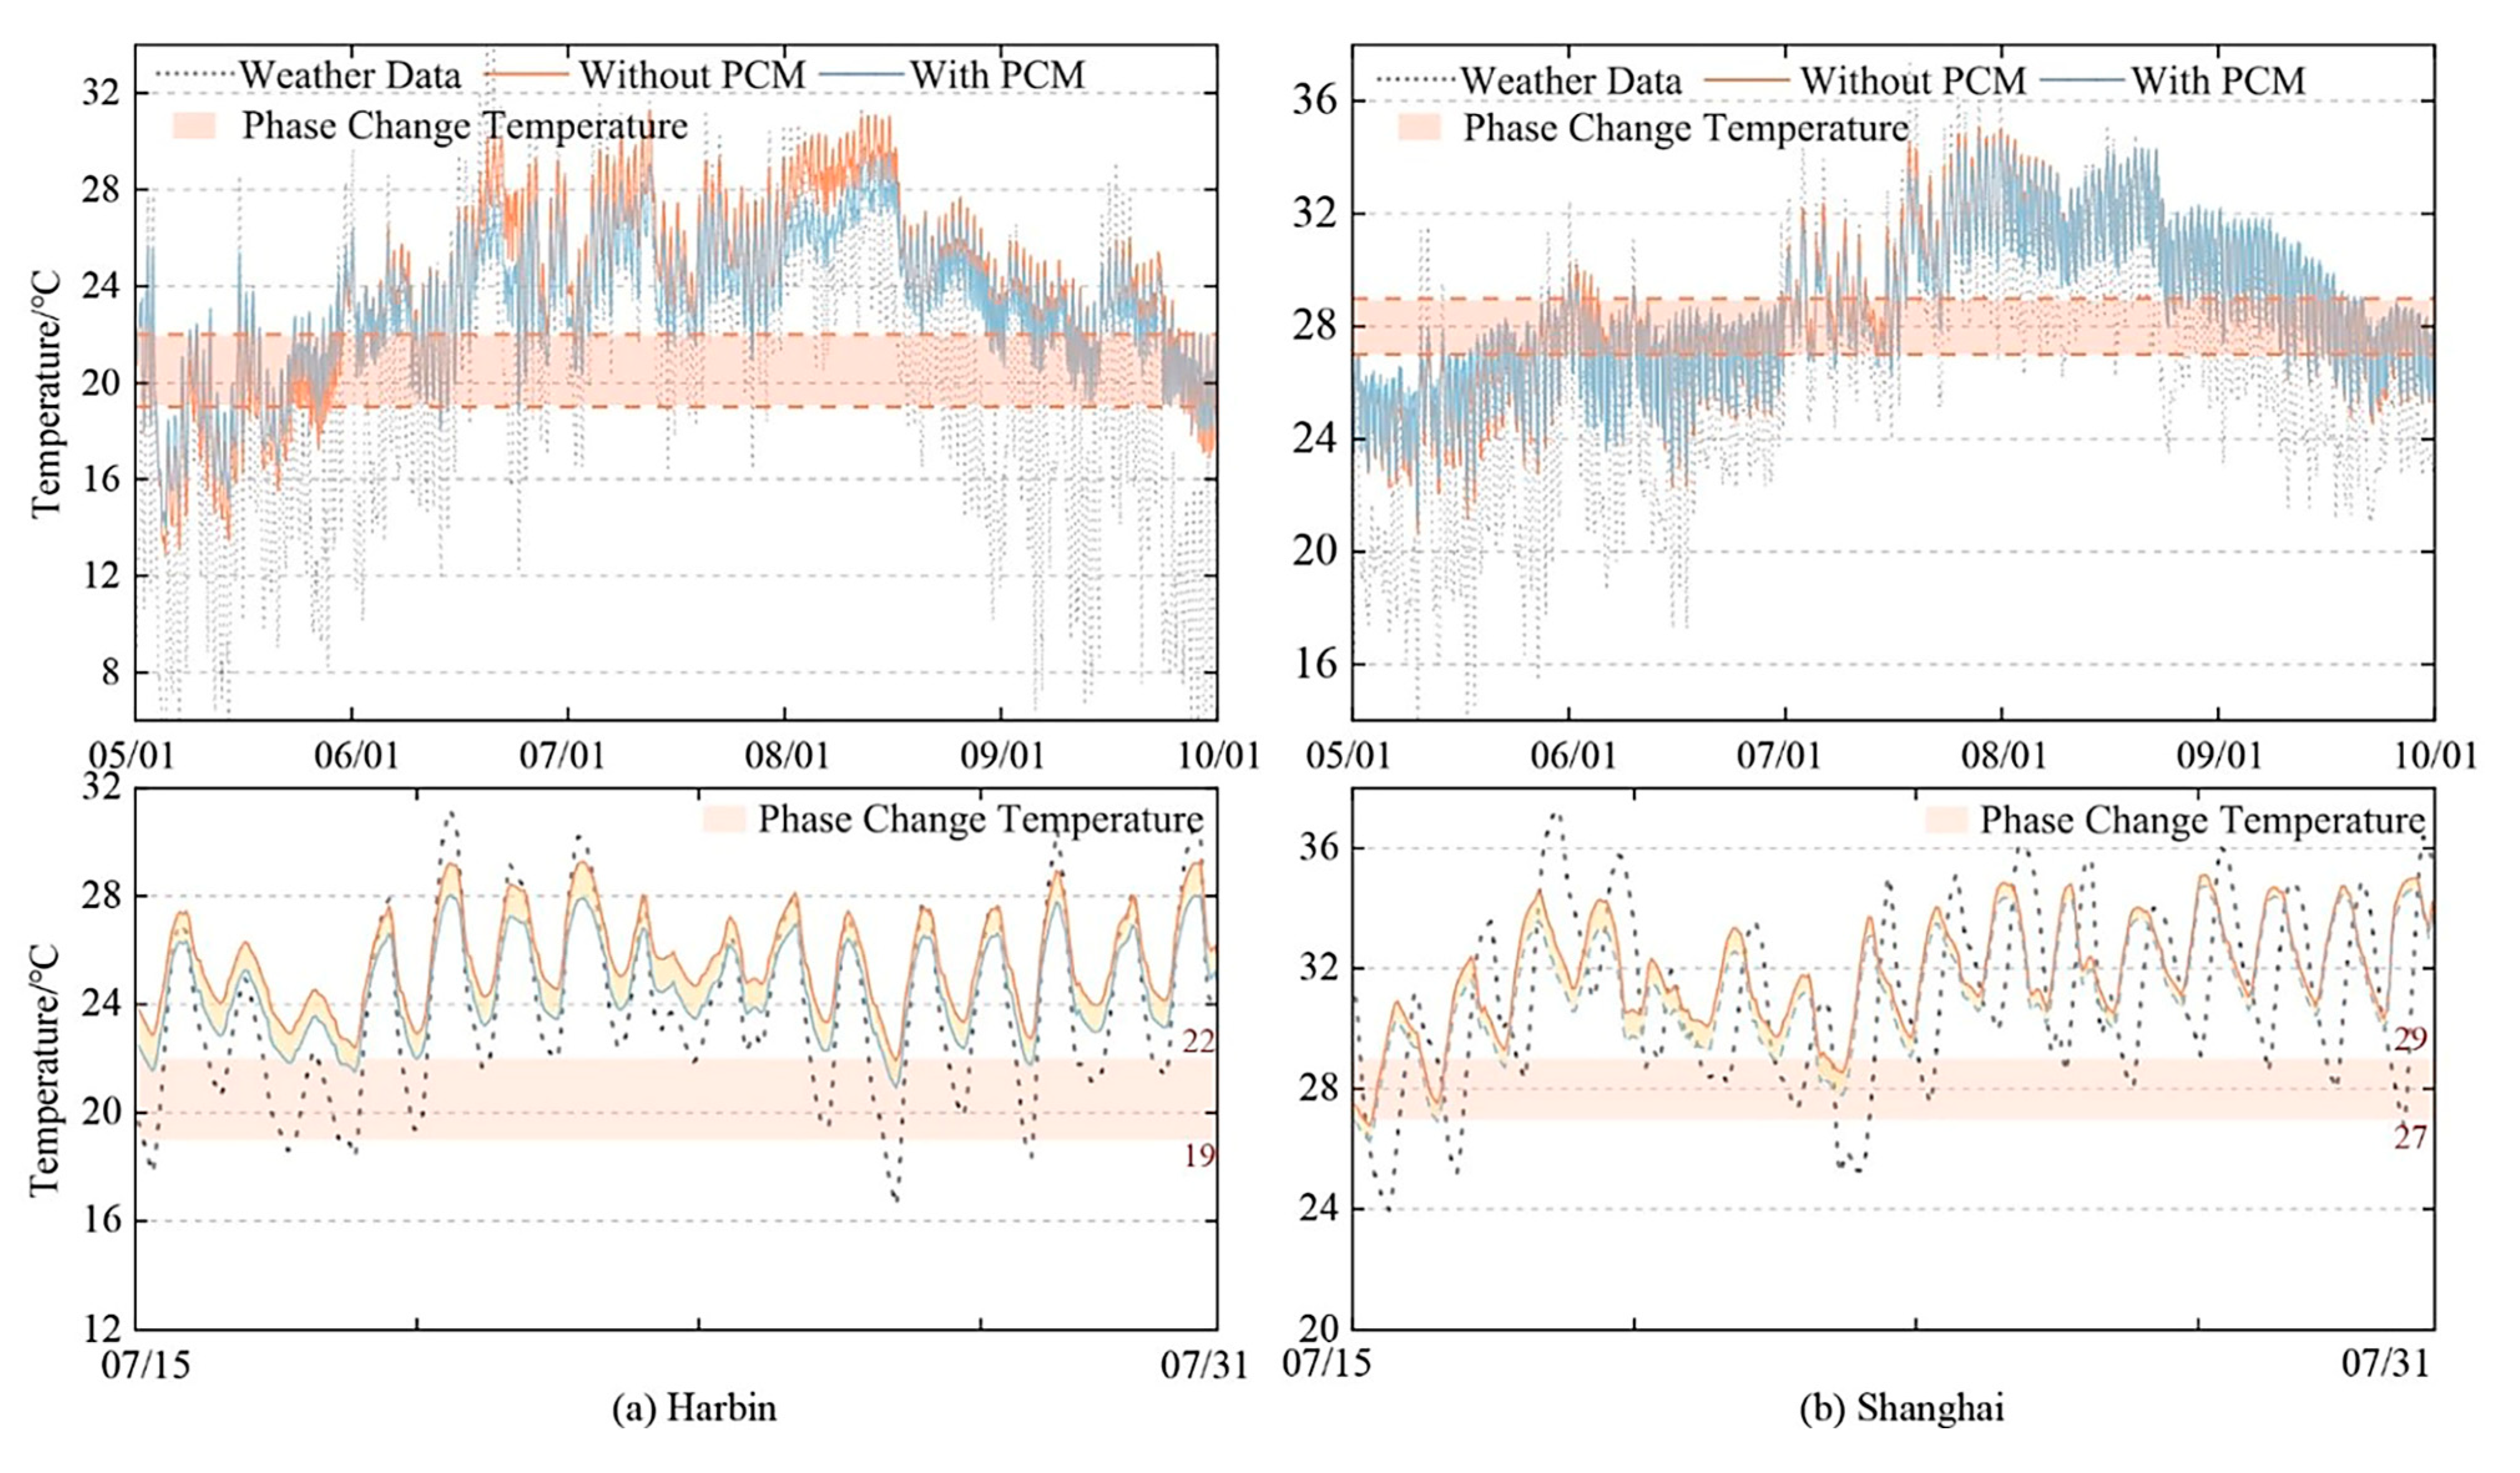
3.1.2. Validation Results

In order to enhance the accuracy of the numerical model, a study was conducted to refine the precision of simulated results. Data on building form, internal gain, occupancy, natural ventilation duration, and natural ventilation ACH were collected through field research. During simulation, these parameters were iteratively adjusted to ensure the accuracy of the validation model. To validate the reliability of the model predictions, the study utilized weather data from Harbin in 2021 to simulate indoor temperatures for north-facing bedrooms, south-facing bedrooms, and living rooms from May to September. The measured and simulated temperatures of 3672 sets of hourly data were compared, and the simulation results were ultimately found to be satisfactory. As shown in Figure 4, the simulated data for the three rooms closely matched the measured data, with Pearson’s R values of 0.86675, 0.80325, and 0.82413 and RMSE values of 3.24758 °C, 3.65782 °C, and 3.27363 °C, respectively. As the model was thus considered to be reliable and accurate, it was used in the subsequent comparative study, which involved adding PCM simulation models.

3.2. Simulation Results

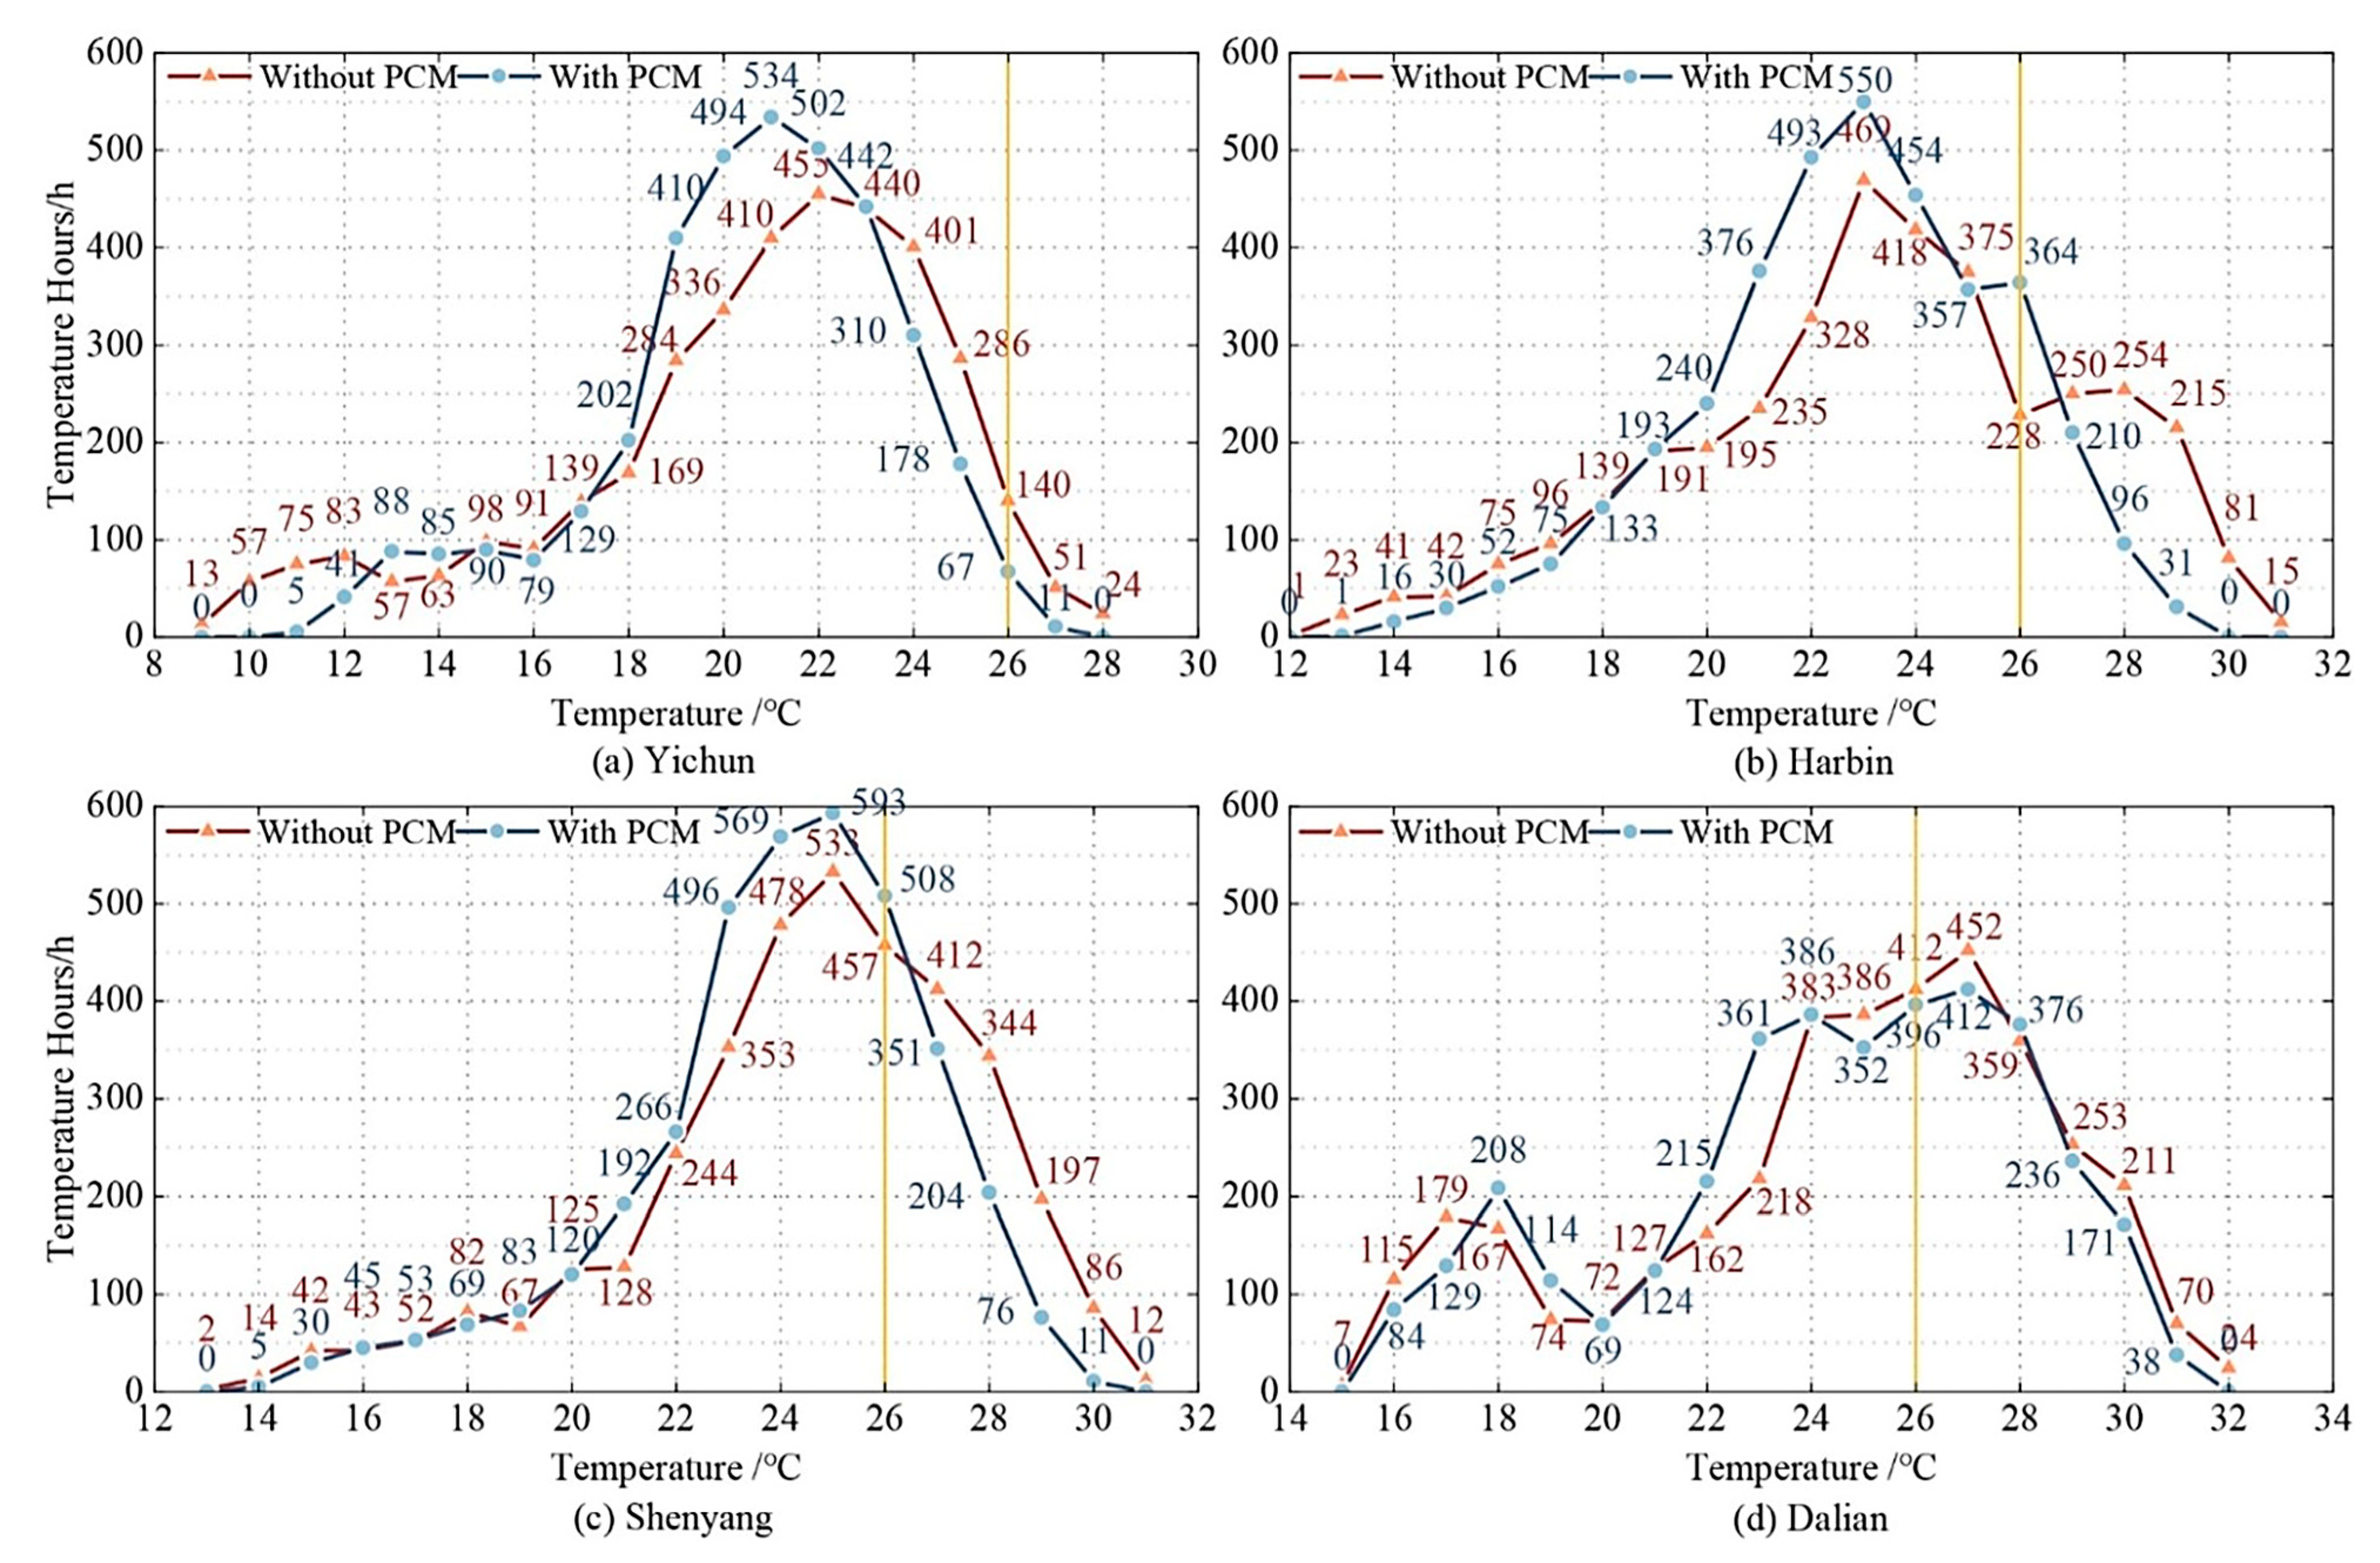
3.2.1. Effect of PCM on Indoor Temperature

After validating the model, a comparative study was conducted to evaluate the effects of applying PCMs on indoor temperature. The study used weather data from the 15-year period from 2007 to 2021. Residential buildings in severe cold and cold regions are generally naturally ventilated during the summer, with relatively infrequent use of air conditioning. In terms of the impact of PCMs on indoor temperature variations, the study conducted statistical analysis of simulated indoor temperature data for these regions. Focusing on north-facing bedrooms, as shown in Figure 5, the duration of extreme indoor temperatures significantly decreased when PCMs were applied. In Shenyang and Dalian, the duration of indoor temperatures exceeding 29 °C decreased by 206 h and 113 h, respectively. In Yichun and Harbin, the duration of indoor temperatures below 16 °C decreased by 137 h and 60 h, respectively.
According to the definition of overheating duration provided by CIBSE TM59 [53], the use of PCMs can reduce the duration of overheating, thereby improving indoor thermal comfort. Taking north-facing bedrooms as an example, the duration of overheating in Yichun, Harbin, Shenyang, and Dalian were reduced by 136 h (63.55%), 340 h (32.72%), 356 h (23.69%), and 153 h (8.6%), respectively, after PCMs were applied.

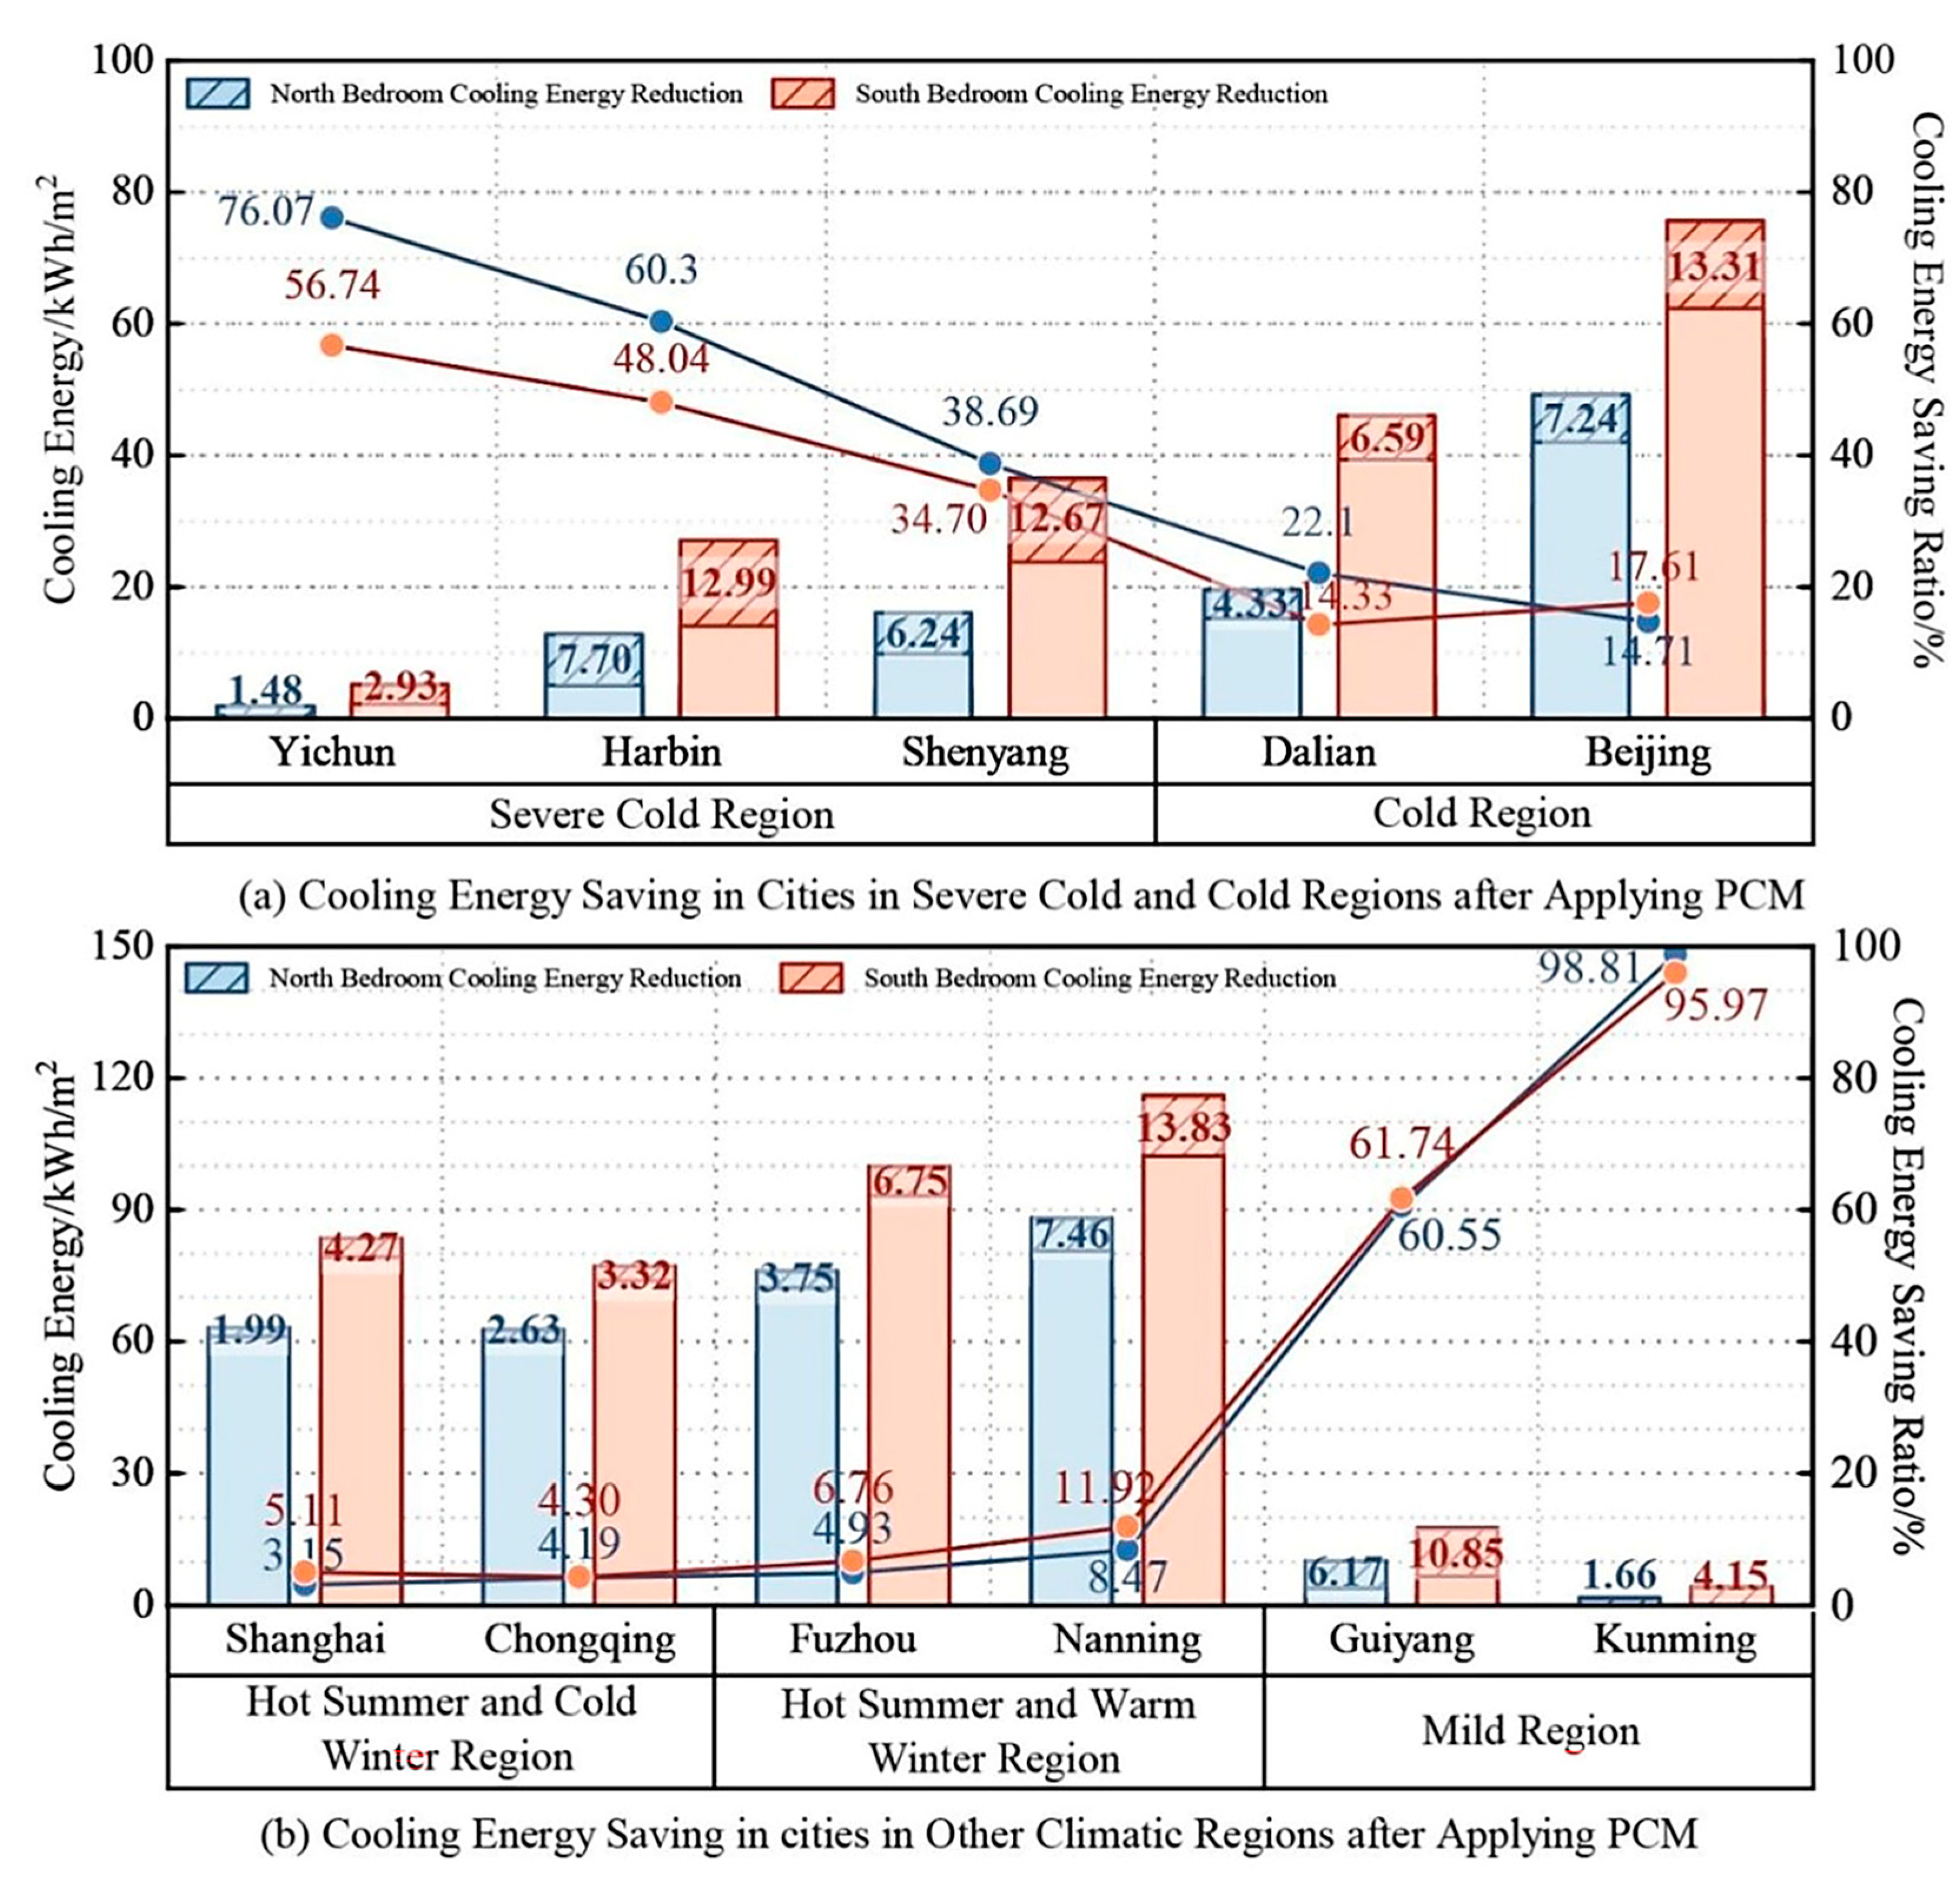
3.2.2. Effect of PCM on Cooling Energy Consumption

Climate change is leading to a rise in extreme climate events. This trend is expected to gradually increase the demand for cooling energy in residential buildings during the summer. Focusing on energy conservation, this study examined the impact of applying PCMs on cooling energy consumption in China’s severe cold and cold regions during the summer. The cooling energy consumption data for north-facing and south-facing bedrooms are shown in Table 4 and Table 5, respectively. Due to climatic variations, different cities exhibit varying cooling demands. The results of this study indicate that cities with hotter climates generally consume more cooling energy. In terms of energy conservation rates, the influence of PCMs on residential energy efficiency was most pronounced in severe cold regions. For instance, in north-facing bedrooms, the cooling energy conservation rates in three cities in severe cold regions, namely Yichun, Harbin, and Shenyang, were as high as 76.07%, 60.30%, and 38.69%, respectively, while in Dalian and Beijing, cities in cold regions, the conservation rates were 22.10% and 14.71%, respectively.
To verify the effectiveness of applying PCMs in other climate zones, a study was conducted. It compared cooling energy consumption in buildings located in hot summer and cold winter regions, hot summer and warm winter regions, and temperate regions. As shown in Table 6 and Table 7, PCMs saved the most cooling energy in temperate regions, with energy conservation rates of 60.55% and 98.81% for north-facing bedrooms in Guiyang and Kunming, respectively. The impact of applying PCMs on cooling energy consumption in hot summer and cold winter regions, as well as hot summer and warm winter regions, was relatively small. For example, again focusing on north-facing bedrooms, the energy conservation rates for Shanghai and Chongqing, cities in hot summer and cold winter regions, were only 3.15% and 4.19%, respectively. In Fuzhou and Nanning, which are located in hot summer and warm winter regions, the energy conservation rates were 4.93% and 10.25%, respectively (Table 8).

4. Discussion

4.1. Energy Saving Potential of PCM in the Severe Cold Region

Simulation results indicate that PCM is suitable for energy-saving applications. This is particularly true under the climatic conditions of the severe cold region of China. As shown in Figure 6a, the cooling energy conservation rates in Harbin (60.30% and 48.04%) are much higher than those in Beijing (14.71% and 17.61%). However, the actual energy savings values in Beijing and Harbin are comparable, with the north-facing bedroom at 7.70 kWh/m2 and 7.24 kWh/m2, and the south-facing bedroom at 12.99 kWh/m2 and 13.31 kWh/m2. Beijing has a larger base for cooling energy consumption, resulting in a smaller conservation rate, but from the perspective of energy savings, the application of PCMs in Beijing still yielded a considerable reduction in cooling energy consumption. To further elucidate the energy-saving effects of applying PCMs on cooling energy consumption under different climatic conditions in China, a comparative study was conducted. The simulation results for different cities indicated that the energy-saving effect of PCMs on cooling energy consumption during the summer was generally greater in severe cold and cold regions than in hot summer and cold winter regions or hot summer and warm winter regions. This is probably because the use of PCMs is best suited to summer climate conditions in severe cold and cold regions. As depicted in Figure 6b, the cooling energy conservation rates for cities in hot summer and cold winter regions, as well as hot summer and warm winter regions, were mostly below 10%. The application of PCMs in these climate zones did not yield a significant energy-saving effect. For cities in temperate regions, such as Guiyang and Kunming, where the original cooling energy demand during the summer is low, although the conservation rates observed in this study were relatively high, the application of PCMs to reduce cooling energy consumption should be considered in conjunction with a comprehensive assessment of buildings’ overall lifecycle operating costs.
Additionally, as shown in Figure 6, south-facing bedrooms were more energy-efficient than north-facing bedrooms in the same city. This may be attributable to the fact that the external envelope of south-facing (vs. north-facing) rooms is exposed to solar radiation for a longer duration, resulting in higher surface temperatures of the building envelope and hence better PCM performance. Similar results have been obtained from previous research, indicating that higher levels of solar radiation are conducive to the improved performance of PCM [54]. In summary, to better address the challenges posed by climate change to meeting the demand for cooling energy in summer in severe cold and cold regions, future studies could select PCMs with a reasonable phase change temperature for actual engineering applications to reduce the energy consumption of buildings during operation. Furthermore, when formulating relevant policies and regulations, policy makers are advised to consider integrating PCMs into building envelopes as a passive strategy, providing guidance for practical engineering applications.

4.2. Effects of Climate Differences on the Applicability of PCM

From the simulation results, it is evident that there are significant differences in the cooling energy conservation values among representative cities in China’s five major climate zones. Taking the north-facing bedrooms in Harbin, Beijing, Shanghai, Fuzhou, and Kunming as examples, after integrating PCM, the cooling energy consumption is reduced by 7.70 kWh/m2, 7.24 kWh/m2, 1.99 kWh/m2, 3.75 kWh/m2, and 1.66 kWh/m2, respectively. Harbin exhibits the highest energy conservation rate (60.30%), while Shanghai has the lowest rate (3.15%). Table 9 illustrates the existing research results about PCMs in severe cold and cold regions of China. It is observed that the studies draw similar conclusions regarding the energy-saving potential of PCMs in buildings. In the five climatic zones of China, the energy-saving effect of PCM is more pronounced in severe cold and cold regions. The occurrence of the phase change process requires significant outdoor temperature fluctuations. From Figure 7, it can be seen that the outdoor temperature fluctuation is the greatest in the typical representative city of Harbin in the severe cold region. In contrast, Shanghai located in the hot summer and cold winter region, experiences the smallest outdoor temperature fluctuation from May to September, with a longer duration of high temperatures. This condition may impede the solidification of the PCM after melting, as there are insufficient low temperatures to facilitate the process. Consequently, the material is unable to efficiently store and release heat.
In Harbin and Shanghai, simulations were conducted using PCMs with phase change temperatures in the ranges of 19–22 °C and 27–29 °C, respectively. Figure 8 shows the variation in indoor temperature from May to September with and without the application of PCMs, with Harbin showing better temperature control than Shanghai. As shown in Figure 8a, taking late July as an example, Harbin experienced significant outdoor temperature fluctuations, such that the temperature fluctuation range exceeded the phase change temperature range for an extended period, facilitating the complete occurrence of the phase change process in the PCMs. In contrast, in Shanghai, the outdoor temperature fluctuation range was generally higher than the phase change temperature range (as shown in Figure 8b). This explains the significant difference in cooling energy savings between Harbin and Shanghai. Considering the characteristics of PCMs mentioned above, decision-makers are advised to carefully evaluate local climate conditions when choosing to implement PCMs. Assessing the suitability of PCM applications in cities within a specific climate zone is essential.

5. Conclusions

This article provides an overview of the impact of PCMs on the summer cooling energy consumption of residential buildings in severe cold and cold regions of China. Through simulations, the study validates the variation in the cooling energy saving effects of PCMs in cities across different climate zones. The results indicate that PCMs exhibit the most significant cooling energy-saving effects in severe cold and cold regions. The main findings and conclusions of the study are as follows.
(1) PCMs can effectively alleviate summer overheating in non-air-conditioned residential buildings in severe cold and cold regions, thereby improving indoor thermal comfort. The simulation results indicate that the use of PCMs reduces the duration of indoor temperatures falling below 16 °C by 137 h and 60 h in Yichun and Harbin. It also decreases the duration of indoor temperatures exceeding 29 °C by 206 h and 113 h in Shenyang and Dalian. Additionally, the simulation results indicated that the reduction in overheating duration in four representative cities in severe cold and cold regions was 136 h (63.55%) in Yichun, 340 h (32.72%) in Harbin, 356 h (23.69%) in Shenyang, and 153 h (8.6%), respectively.
(2) In severe cold and cold regions, PCMs make a significant contribution to saving summer cooling energy consumption. The research results indicated that after the application of PCMs, cooling energy consumption in five representative cities in severe cold and cold regions was reduced by 1.48 kWh/m2 (76.07%), 7.70 kWh/m2 (60.30%), 6.24 kWh/m2 (38.69%), 4.33 kWh/m2 (22.10%), and 7.24 kWh/m2 (14.71%), respectively.
(3) PCMs perform better in climates with larger outdoor temperature fluctuations. Comparative studies of the use of PCMs in representative cities under different climate zones in China indicated that PCMs showed good adaptability to severe cold and cold regions. The energy consumption of rooms utilizing PCM in Shanghai, Chongqing, Fuzhou, and Nanning decreased by 1.99 kWh/m2 (3.15%), 2.63 kWh/m2 (4.19%), 3.75 kWh/m2 (10.25%), and 7.46 kWh/m2 (4.93%), respectively. Compared with hot summer and cold winter regions, as well as hot summer and warm winter regions, severe cold and cold regions experience larger fluctuations in outdoor temperatures during the summer, which activates the phase change process and is thus conducive to the improved performance of PCM.

Author Contributions

Methodology, H.G.; Software, Y.S. and B.Z.; Validation, J.Y.; Formal analysis, B.Z. and Y.C.; Resources, Y.S. and H.G.; Data curation, C.W., Y.C. and J.Y.; Writing—original draft, C.W. and J.Y. All authors have read and agreed to the published version of the manuscript.

Funding

This research was funded by the National Natural Science Foundation of China, grant number 52078153.

Data Availability Statement

The original contributions presented in the study are included in the article, further inquiries can be directed to the corresponding authors.

Conflicts of Interest

The authors declare no conflict of interest.

Appendix A

Table A1. Simulation model ventilation parameters of representative cities in different climate zones.
CityMonthPeriodNature VentilationInfiltration
Yichun
(IA)
1 June−30 June7:00−9:00; 17:00−20:003 h−10.4 h−1
1 July−31 August0:00−24:00
1 September−31 May (next year)7:00−8:00; 17:00−18:00
Harbin
(IB)
1 May−30 June7:00−9:00; 17:00−20:003 h−10.4 h−1
1 July−31 August0:00−24:00
1 September−30 September8:00−20:00
1 October−30 April7:00−8:00; 17:00−18:00
Shenyang
(IC)
1 May−31 May7:00−9:00; 17:00−20:003 h−10.4 h−1
1 June−31 August0:00−24:00
1 September−30 September8:00−21:00
1 October−30 April7:00−8:00; 17:00−19:00
Dalian
(IIA)
1 April−14 May7:00−9:00; 17:00−20:006 h−10.4 h−1
15 May−15 September0:00−24:00
16 September−30 September8:00−21:00
1 October−31 March7:00−8:00; 17:00−19:00
Beijing
(IIB)
16 March−15 May7:00−9:00; 17:00−20:006 h−10.4 h−1
16 May−1 October0:00−24:00
2 October−15 March7:00−8:00; 17:00−19:00
Shanghai
(IIIA)
1 May−30 June0:00−7:00; 17:00−20:006 h−10.4 h−1
1 July−30 September0:00−24:00
1 October−30 November0:00−7:00; 17:00−20:00
1 December−30 April (next year)7:00−11:00; 17:00−20:00
Chongqing
(IIIB)
1 May−14 June0:00−7:00; 17:00−20:006 h−10.4 h−1
15 July−15 October0:00−24:00
16 October−30 November0:00−7:00; 17:00−20:00
1 December−30 April (next year)7:00−11:00; 17:00−20:00
Fuzhou
(IVA)
1 May−31 May0:00−7:00; 17:00−20:006 h−10.4 h−1
1 June−31 October0:00−24:00
1 November−30 November0:00−7:00; 17:00−20:00
1 December−30 April (next year)7:00−11:00; 17:00−20:00
Nanning
(IVA)
1 May−31 May0:00−7:00; 17:00−21:006 h−10.4 h−1
1 June−31 October0:00−24:00
1 November−30 November0:00−7:00; 17:00−21:00
1 December−30 April (next year)7:00−11:00; 17:00−21:00
Guiyang
(VA)
1 May−30 June7:00−10:00; 17:00−20:003 h−10.4 h−1
1 July−31 August0:00−24:00
1 September−30 September7:00−10:00; 17:00−20:00
1 October−30 April7:00−9:00; 17:00−19:00
Kunming
(VB)
1 May−30 June7:00−10:00; 17:00−20:003 h−10.4 h−1
1 July−31 August0:00−24:00
1 September−30 September7:00−10:00; 17:00−20:00
1 October−30 April7:00−9:00; 17:00−19:00
Table A2. Thermal physical properties of the materials used in the envelope.
ConstructionLayerλ (W/m K)ρ (kg/m3)Cp (J/kg K)
External wallCement Plaster0.9318001050
XPS0.03351380
Render0.9318001050
Reinforced concrete1.742500920
Cement Plaster0.9318001050
RoofCement Plaster0.9318001050
SBS waterproof material0.176001470
Render0.9318001050
XPS0.03351380
Render0.9318001050
SBS waterproof material0.176001470
Reinforced concrete0.742500920
Cement Plaster0.9318001050
Ground floorTimber flooring0.146501200
Cement Plaster0.9318001050
SBS waterproof material0.176001470
Reinforced concrete1.742500920
Render0.9318001050
XPS0.03351380
Cast concrete1.1320001000
Table A3. Details of the envelope in different climate regions.
CityU-Values for Envelope Components (W/m2⋅K)
External WallsRoofGround
Yichun (IA)0.350.150.23
Harbin (IB)0.350.200.23
Shenyang (IC)0.400.200.27
Dalian (IIA)0.450.250.32
Beijing (IIB)0.450.300.32
Shanghai (IIIA)1.000.400.48
Chongqing (IIIB)1.200.400.48
Fuzhou (IVA)1.500.401.30
Nanning (IVA)1.500.401.30
Guiyang (VA)1.000.400.70
Kunming (VB)1.801.001.30
Table A4. Internal gains of the simulation building.
TypeRoom TypeValue/WTime
PeopleBedrooms (facing north)1 × 756: 00−8: 00; 22: 00−23: 00
0.7 × 7523: 00−6: 00
Bedrooms (facing south)2 × 756: 00−8: 00; 22: 00−23: 00
1.4 × 7523: 00−6: 00
Livingroom2 × 759:00−22:00
Electric EquipmentBedrooms608:00−23:00
7.823:00−8:00
Livingroom83.68:00−23:00
10.823:00−8:00
LightingBedrooms7517:00−23:00
Livingroom11017:00−23:00

References

  1. Wang, H.; Chen, Q. Impact of climate change heating and cooling energy use in buildings in the United States. Energy Build. 2014, 82, 428–436. [Google Scholar] [CrossRef]
  2. Zhai, Z.J.; Helman, J.M. Implications of climate changes to building energy and design. Sustain. Cities Soc. 2019, 44, 511–519. [Google Scholar] [CrossRef]
  3. The Paris Agreement. Available online: https://unfccc.int/process-and-meetings/the-paris-agreement (accessed on 30 January 2024).
  4. Kalbasi, R.; Samali, B.; Afrand, M. Taking benefits of using PCMs in buildings to meet energy efficiency criteria in net zero by 2050. Chemosphere 2023, 311, 137100. [Google Scholar] [CrossRef] [PubMed]
  5. Jensen, S.Ø.; Marszal-Pomianowska, A.; Lollini, R.; Pasut, W.; Knotzer, A.; Engelmann, P.; Stafford, A.; Reynders, G. IEA EBC Annex 67 Energy Flexible Buildings. Energy Build. 2017, 155, 25–34. [Google Scholar] [CrossRef]
  6. Ürge-Vorsatz, D.; Cabeza, L.F.; Serrano, S.; Barreneche, C.; Petrichenko, K. Heating and cooling energy trends and drivers in buildings. Renew. Sustain. Energy Rev. 2015, 41, 85–98. [Google Scholar] [CrossRef]
  7. Khawaja, S.A.; Memon, S.A. Novel indicators to evaluate PCM performance under different ventilation strategies by considering the impact of climate change. J. Build. Eng. 2023, 74, 106848. [Google Scholar] [CrossRef]
  8. Chakraborty, D.; Alam, A.; Chaudhuri, S.; Başağaoğlu, H.; Sulbaran, T.; Langar, S. Scenario-based prediction of climate change impacts on building cooling energy consumption with explainable artificial intelligence. Appl. Energy 2021, 291, 116807. [Google Scholar] [CrossRef]
  9. Van Ruijven, B.J.; De Cian, E.; Wing, I.S. Amplification of future energy demand growth due to climate change. Nat. Commun. 2019, 10, 2762. [Google Scholar] [CrossRef]
  10. Deng, Z.; Javanroodi, K.; Nik, V.M.; Chen, Y. Using urban building energy modeling to quantify the energy performance of residential buildings under climate change. Build. Simul. 2023, 16, 1629–1643. [Google Scholar] [CrossRef]
  11. Xiong, J.; Guo, S.; Wu, Y.; Yan, D.; Xiao, C.; Lu, X. Predicting the response of heating and cooling demands of residential buildings with various thermal performances in China to climate change. Energy 2023, 269, 126789. [Google Scholar] [CrossRef]
  12. Bo, R.; Chang, W.S.; Yu, Y.; Xu, Y.; Guo, H. Overheating of residential buildings in the severe cold and cold regions of China: The gap between building policy and performance. Build. Environ. 2022, 225, 109601. [Google Scholar] [CrossRef]
  13. Wang, R.; Lu, S.; Feng, W.; Xu, B. Tradeoff between heating energy demand in winter and indoor overheating risk in summer constrained by building standards. Build. Simul. 2021, 14, 987–1003. [Google Scholar] [CrossRef]
  14. Bo, R.; Shao, Y.; Xu, Y.; Yu, Y.; Guo, H.; Chang, W.S. Research on the Relationship between Thermal Insulation Thickness and Summer Overheating Risk: A Case Study in Severe Cold and Cold Regions of China. Buildings 2022, 12, 1032. [Google Scholar] [CrossRef]
  15. Del Grosso, A.E.; Basso, P. Adaptive building skin structures. Smart Mater. Struct. 2010, 19, 124011. [Google Scholar] [CrossRef]
  16. Nematchoua, M.K.; Noelson, J.C.V.; Saadi, I.; Kenfack, H.; Andrianaharinjaka, A.Z.F.; Ngoumdoum, D.F.; Sela, J.B.; Reiter, S. Application of phase change materials, thermal insulation, and external shading for thermal comfort improvement and cooling energy demand reduction in an office building under different coastal tropical climates. Sol. Energy 2020, 207, 458–470. [Google Scholar] [CrossRef]
  17. Chen, X.N.; Xu, B.; Fei, Y.; Gan, W.T.; Pei, G. Parameter optimization of phase change material and the combination of phase change material and cool paint according to corresponding energy consumption characteristics under various climates. Energy 2023, 277, 127625. [Google Scholar] [CrossRef]
  18. Dong, Y.; Zhang, L.; Wang, P.; Liu, Z.; Su, X.; Liao, H.; Jiang, X. Potential evaluation of energy flexibility and energy-saving of PCM-integrated office building walls. J. Build. Eng. 2023, 79, 107857. [Google Scholar] [CrossRef]
  19. Memon, S.A.; Cui, H.Z.; Zhang, H.; Xing, F. Utilization of macro encapsulated phase change materials for the development of thermal energy storage and structural lightweight aggregate concrete. Appl. Energy 2015, 139, 43–55. [Google Scholar] [CrossRef]
  20. Royon, L.; Karim, L.; Bontemps, A. Thermal energy storage and release of a new component with PCM for integration in floors for thermal management of buildings. Energy Build. 2013, 63, 29–35. [Google Scholar] [CrossRef]
  21. Li, D.; Zheng, Y.; Liu, C.; Wu, G. Numerical analysis on thermal performance of roof contained PCM of a single residential building. Energy Convers. Manag. 2015, 100, 147–156. [Google Scholar] [CrossRef]
  22. Yang, Y.; Shen, Z.; Wu, W.; Zhang, H.; Ren, Y.; Yang, Q. Preparation of a novel diatomite-based PCM gypsum board for temperature-humidity control of buildings. Build. Environ. 2022, 226, 109732. [Google Scholar] [CrossRef]
  23. Silva, T.; Vicente, R.; Soares, N.; Ferreira, V. Experimental testing and numerical modelling of masonry wall solution with PCM incorporation: A passive construction solution. Energy Build. 2012, 49, 235–245. [Google Scholar] [CrossRef]
  24. Cui, H.; Tang, W.; Qin, Q.; Xing, F.; Liao, W.; Wen, H. Development of structural-functional integrated energy storage concrete with innovative macro-encapsulated PCM by hollow steel ball. Appl. Energy 2017, 185, 107–118. [Google Scholar] [CrossRef]
  25. Yu, B.; Li, S.; Zhu, H.; Jiang, Q.; Wang, D.; Chen, Y. A composite phase change material for improving the freeze-thaw resistance performance of cement mortars. Constr. Build. Mater. 2023, 387, 131657. [Google Scholar] [CrossRef]
  26. Hu, J.Y.; Yu, X. Adaptive building roof by coupling thermochromic material and phase change material: Energy performance under different climate conditions. Constr. Build. Mater. 2020, 262, 120481. [Google Scholar] [CrossRef]
  27. Kishore, R.A.; Bianchi, M.V.; Booten, C.; Vidal, J.; Jackson, R. Optimizing PCM-integrated walls for potential energy savings in US Buildings. Energy Build. 2020, 226, 110355. [Google Scholar] [CrossRef]
  28. Zhang, C.; Chen, Y.; Wu, L.; Shi, M. Thermal response of brick wall filled with phase change materials (PCM) under fluctuating outdoor temperatures. Energy Build. 2011, 43, 3514–3520. [Google Scholar] [CrossRef]
  29. Zhou, D.; Eames, P. Phase Change Material Wallboard (PCMW) melting temperature optimisation for passive indoor temperature control. Renew. Energy 2019, 139, 507–514. [Google Scholar] [CrossRef]
  30. Godoy-Vaca, L.; Vallejo-Coral, E.C.; Martínez-Gómez, J.; Orozco, M.; Villacreses, G. Predicted medium vote thermal comfort analysis applying energy simulations with phase change materials for very hot-humid climates in social housing in Ecuador. Sustainability 2021, 13, 1257. [Google Scholar] [CrossRef]
  31. Kuznik, F.; Virgone, J.; Johannes, K. In-situ study of thermal comfort enhancement in a renovated building equipped with phase change material wallboard. Renew. Energy 2011, 36, 1458–1462. [Google Scholar] [CrossRef]
  32. Beemkumar, N.; Yuvarajan, D.; Arulprakasajothi, M.; Elangovan, K.; Arunkumar, T. Control of room temperature fluctuations in the building by incorporating PCM in the roof. J. Therm. Anal. Calorim. 2021, 143, 3039–3046. [Google Scholar] [CrossRef]
  33. Ascione, F.; Bianco, N.; De Masi, R.F.; Mastellone, M.; Vanoli, G.P. Phase Change Materials for Reducing Cooling Energy Demand and Improving Indoor Comfort: A Step-by-Step Retrofit of a Mediterranean Educational Building. Energies 2019, 12, 3661. [Google Scholar] [CrossRef]
  34. Terhan, M.; Ilgar, G. Investigation of used PCM-integrated into building exterior walls for energy savings and optimization of PCM melting temperatures. Constr. Build. Mater. 2023, 369, 130601. [Google Scholar] [CrossRef]
  35. Hammid, A.T.; Jebur, Y.M.; Lafta, H.A.; Parwata, I.W.; Patra, I.; Arenas, L.A.B. The arrangement of phase change materials inside a building wall and its energy performance. Sustain. Energy Technol. Assess. 2023, 57, 103158. [Google Scholar] [CrossRef]
  36. Salihi, M.; El Fiti, M.; Harmen, Y.; Chhiti, Y.; Chebak, A.; Alaoui, F.E.M.H.; Achak, M.; Bentiss, F.; Jama, C. Evaluation of global energy performance of building walls integrating PCM: Numerical study in semi-arid climate in Morocco. Case Stud. Constr. Mater. 2022, 16, e00979. [Google Scholar] [CrossRef]
  37. Nicolalde, J.F.; Cabrera, M.; Martínez-Gómez, J.; Salazar, R.B.; Reyes, E. Selection of a phase change material for energy storage by multi-criteria decision method regarding the thermal comfort in a vehicle. J. Energy Storage 2022, 51, 104437. [Google Scholar] [CrossRef]
  38. Santosh, C.; Ramesh, R.; Selvaraj, M. A comprehensive review on current advances of thermal energy storage and its applications. Alex. Eng. J. 2022, 61, 5455–5463. [Google Scholar]
  39. Deepak, S.R.; Jian, W.; Imran, A.; Yulong, D.; Alkaabi, A.K. Melting performance enhancement in a thermal energy storage unit using active vortex generation by electric field. J. Energy Storage 2023, 67, 107593. [Google Scholar]
  40. Prieto, C.; Cabeza, L.F. Thermal energy storage (TES) with phase change materials (PCM) in solar power plants (CSP). Concept and plant performance. Appl. Energy 2019, 254, 113646. [Google Scholar] [CrossRef]
  41. Nghana, B.; Tariku, F. Phase change material’s (PCM) impacts on the energy performance and thermal comfort of buildings in a mild climate. Build. Environ. 2016, 99, 221–238. [Google Scholar] [CrossRef]
  42. Hasan, A.; Al-Sallal, K.A.; Alnoman, H.; Rashid, Y.; Abdelbaqi, S. Effect of Phase Change Materials (PCMs) Integrated into a Concrete Block on Heat Gain Prevention in a Hot Climate. Sustainability 2016, 8, 1009. [Google Scholar] [CrossRef]
  43. Yu, J.; Dong, Y.; Zhao, Y.; Yu, Y.; Chen, Y.; Guo, H. Using phase change materials to alleviate overheating phenomenon of residential buildings in severe cold and cold regions of China. Case Stud. Therm. Eng. 2023, 49, 103207. [Google Scholar] [CrossRef]
  44. Liu, J.; Liu, Y.; Yang, L.; Liu, T.; Zhang, C.; Dong, H. Climatic and seasonal suitability of phase change materials coupled with night ventilation for office buildings in Western China. Renew. Energy 2020, 147, 356–373. [Google Scholar] [CrossRef]
  45. Soares, N.; Gaspar, A.R.; Santos, P.; Costa, J.J. Multi-dimensional optimization of the incorporation of PCM-drywalls in lightweight steel-framed residential buildings in different climates. Energy Build. 2014, 70, 411–421. [Google Scholar] [CrossRef]
  46. Li, W.; Jing, M.; Li, R.; Gao, J.; Zhu, J.; Li, R. Study of the optimal placement of phase change materials in existing buildings for cooling load reduction- Take the Central Plain of China as an example. Renew. Energy 2023, 209, 71–84. [Google Scholar] [CrossRef]
  47. Liu, X.; Yang, Y.; Sheng, Z.; Wu, W.; Wang, Y.; Dumoulin, J. Study on thermal storage effectiveness of a novel PCM concrete applied in buildings located at four cities. Renew. Energy 2023, 218, 119262. [Google Scholar] [CrossRef]
  48. Dehkordi, B.S.; Afrand, M. Energy-saving owing to using PCM into buildings: Considering of hot and cold climate region. Sustain. Energy Technol. Assess. 2022, 52, 102112. [Google Scholar]
  49. ASHRAE Standard 169-2013; Weather Data for Building Design Standards. American Society of Heating, Refrigerating and Air-Conditioning Engineers: Atlanta, GA, USA, 2013.
  50. Kim, Y.U.; Yang, S.; Yun, B.Y.; Kim, S. Evaluation of energy consumption in apartment buildings with biochar and phase-change material aggregate-applied artificial stone finishing materials. Int. J. Energy Res. 2022, 46, 12772–12786. [Google Scholar] [CrossRef]
  51. Calene, B.; Cynthia, A.C. Economics and lifecycle carbon assessment of coconut oil as an alternative to paraffin phase change materials in North America. Energy Build. 2023, 294, 113268. [Google Scholar]
  52. GB 50176-2016; Code for Thermal Design of Civil Building. Ministry of Housing and Urban-Rural Development of the People’s Republic of China (MOHURD): Beijing, China, 2016.
  53. The Chartered Institution of Building Services Engineers. Design Methodology for the Assessment of Overheating Risk in Homes; The Chartered Institution of Building Services Engineers: London, UK, 2017. [Google Scholar]
  54. Qureshi, W.A.; Nair, N.-K.C.; Farid, M.M. Impact of energy storage in buildings on electricity demand side management. Energy Convers. Manag. 2011, 52, 2110–2120. [Google Scholar] [CrossRef]
  55. Wang, Y.; Zeng, C.; Hu, C.X. Thermal Performance and Energy Conservation Effect of Grain Bin Walls Incorporating PCM in Different Ecological Areas of China. Processes 2022, 10, 2360. [Google Scholar] [CrossRef]
  56. Na, Z.; Fuli, L.; Pengpeng, L.; Pingfang, H.; Mengdu, W. Energy Sav. potential of a novel phase change material wallboard in typical climate regions of China. Energy Build. 2016, 128, 360–369. [Google Scholar]
  57. Xuming, M.; Ran, L.; Hongzhi, C.; Shazim Ali, M.; Feng, X.; Yiu, L. Energy and economic analysis of building integrated with PCM in different cities of China. Appl. Energy 2016, 175, 324–336. [Google Scholar]
Figure 1. Research framework.
Energies 17 01527 g001
Figure 2. Details of the residential unit being monitored and the location of the sensor.
Energies 17 01527 g002
Figure 3. Heat maps showing indoor temperature and bar charts showing temperature distribution in Harbin residential building from May to September.
Energies 17 01527 g003
Figure 4. Correlation between monitoring data and simulation results from May to September 2021.
Energies 17 01527 g004
Figure 5. Comparison of indoor temperature distribution hours between non-air-conditioned buildings without PCM and with PCM.
Energies 17 01527 g005
Figure 6. Cooling energy saving values and rates after using PCMs in cities in different climatic regions.
Energies 17 01527 g006
Figure 7. Box plots comparing outdoor temperatures in five case cities from May to September 2021.
Energies 17 01527 g007
Figure 8. Comparing the indoor temperature variations between scenarios without PCM and with PCM.
Energies 17 01527 g008
Table 1. Summary of existing PCM research in different countries and climate regions.
CountryCityASHRAE ClimateConclusionsRef.
USAPhoenix3BIn cities with extreme and longer winters, integrating PCM was effective for the heating season.[27]
Las Vegas4B
Baltimore4A
Denver5B
Billings6B
SpainSevilla3APCMs were suitable for Mediterranean climates, increasing energy efficiency by up to 62% in the Csb-Coimbra climate.[45]
PortugalCoimbra3A
ItalyMilan4A
FranceParis4A
RomaniaBucharest4A
PolandWarsaw5B
SwedenKiruna7
IndiaNew Delhi1BThe cooling energy decrease was concentrated in cold climate regions, such as in the Incheon, Chicago, and Moscow.[50]
ChinaHongkong2A
AustraliaBrisbane2A
South AfricaJohannesburg3C
SpainMadrid3C
KoreaIncheon4A
USAChicago5A
RussiaMoscow6A
CanadaOttawa6APCM would minimize lifetime carbon emissions beyond coconut oil in both Houston and Yellowknife.[51]
Yellowknife8
USAHouston2A
Table 2. Basic information about 11 case study cities under five climate zones.
Climate RegionSub-RegionMain IndicatorsRepresentative CityPrecise
Location
U-Value (W/m2·K)
Temperature/°CHDD and CDD
Severe cold region1Atmin·m ≤ −10 °C6000 ≤ HDD18Yichun128.84 E 47.71 NRoof: ≤0.15
Wall: ≤0.35
1B5000 ≤ HDD18 < 6000Harbin126.58 E 45.93 NRoof: ≤0.20
Wall: ≤0.35
1C3800 ≤ HDD18 < 5000Shenyang123.51 E 41.73 NRoof: ≤0.20
Wall: ≤0.40
Cold region2A−10 °C < tmin·m ≤ 0 °C2000 ≤ HDD18 < 3800
CDD26 ≤ 90
Dalian121.66 E 438.91 NRoof: ≤0.25
Wall: ≤0.45
2B2000 ≤ HDD18 < 3800
CDD26 > 90
Beijing116.58 E 40.08 NRoof: ≤0.30
Wall: ≤0.45
Hot summer and cold winter region3A0 °C < tmin·m ≤ 10 °C
25 °C < tmax·m ≤ 30 °C
1200 ≤ HDD18 < 2000Shanghai121.44 E 31.39 NRoof: ≤0.40
Wall: ≤1.00
3B700 ≤ HDD18 < 1200Chongqing106.46 E 29.58 NRoof: ≤0.40
Wall: ≤1.20
Hot summer and warm winter region4A10 °C < tmin·m
25 °C < tmax·m ≤ 29 °C
500 ≤ HDD18 < 700Fuzhou119.29 E 26.08 NRoof: ≤0.40
Wall: ≤1.50
4BHDD18 < 500Nanning108.55 E 22.78 NRoof: ≤0.40
Wall: ≤1.50
Mild region5A0 °C < tmin·m ≤ 13 °C
18 °C < tmax·m ≤ 25 °C
CDD26 < 10
700 ≤ HDD18 < 2000
Guiyang106.73 E 26.59 NRoof: ≤0.40
Wall: ≤1.00
5BCDD26 < 10
HDD18 < 700
Kunming102.74 E 24.99 NRoof: ≤1.00
Wall: ≤1.80
Table 3. Parameter selection of PCM in different climatic regions.
Climate RegionSub-RegionCityPeaking Melting Temperature (°C)Phase Change
Temperature Range (°C)
Enthalpy (kJ/kg)
Severe ColdIAYichun2219–22170
IBHarbin2421–25180
ICShenyang2523–26180
ColdIIADalian2523–26180
IIBBeijing2523–26180
Hot Summer and Cold WinterIIIAShanghai2827–29250
IIIBChongqing2827–29250
Hot Summer and Warm WinterIVAFuzhou2827–29250
IVBNanning2827–29250
MildVAGuiyang2523–26180
VBKunming2421–25180
Table 4. The maximum, average, and minimum indoor temperatures from May to September.
RoomMayJuneJulyAug.Sept.
TmaxNorth Bedroom23.92 °C26.61 °C30.71 °C30.32 °C25.67 °C
South Bedroom23.91 °C27.26 °C31.42 °C30.54 °C26.77 °C
Living Room25.81 °C27.32 °C30.95 °C30.02 °C27.47 °C
TmeanNorth Bedroom21.06 °C24.37 °C28.56 °C27.16 °C23.60 °C
South Bedroom21.26 °C24.60 °C28.78 °C27.47 °C24.16 °C
Living Room21.85 °C24.60 °C28.47 °C27.38 °C24.35 °C
TminNorth Bedroom18.92 °C22.36 °C25.86 °C25.02 °C21.14 °C
South Bedroom18.83 °C22.39 °C24.82 °C25.46 °C21.40 °C
Living Room18.57 °C20.33 °C25.44 °C25.30 °C21.50 °C
Table 5. Cooling energy consumption for the north-facing bedroom in severe cold and cold regions.
Climate RegionSub-RegionCityCooling Energy (kWh/m2)Cooling Energy Reduction
Without PCMWith PCMValue (kWh/m2)Ratio (%)
Severe ColdIAYichun1.950.471.4876.07
IBHarbin12.775.077.7060.30
ICShenyang 16.139.896.2438.69
ColdIIADalian19.6115.284.3322.10
IIBBeijing49.2341.997.2414.71
Table 6. Cooling energy consumption for the south-facing bedroom in severe cold and cold regions.
Climate RegionSub-RegionCityCooling Energy (kWh/m2)Cooling Energy Reduction
Without PCMWith PCMValue (kWh/m2)Ratio (%)
Severe ColdIAYichun5.172.242.9356.74
IBHarbin27.0414.0512.9948.04
ICShenyang 36.5023.8312.6734.70
ColdIIADalian45.9939.406.5914.33
IIBBeijing75.6262.3113.3117.61
Table 7. Cooling energy consumption for the north-facing bedroom in other climatic zones.
Climate RegionSub-RegionCityCooling Energy (kWh/m2)Cooling Energy Reduction
Without PCMWith PCMValue (kWh/m2)Ratio (%)
Hot Summer and Cold WinterIIIAShanghai63.1361.141.993.15
IIIBChongqing62.7360.102.634.19
Hot Summer and Warm WinterIVAFuzhou75.9972.243.754.93
IVBNanning88.1180.657.468.47
MildVAGuiyang10.194.026.1760.55
VBKunming1.680.021.6698.81
Table 8. Cooling energy consumption for the south-facing bedroom in other climatic zones.
Climate RegionSub-RegionCityCooling Energy (kWh/m2)Cooling Energy Reduction
Without PCMWith PCMValue (kWh/m2)Ratio (%)
Hot Summer and Cold WinterIIIAShanghai83.4779.204.275.11
IIIBChongqing77.1473.823.324.30
Hot Summer and Warm WinterIVAFuzhou99.8893.136.756.76
IVBNanning116.05102.2213.8311.92
MildVAGuiyang17.576.7210.8561.74
VBKunming4.320.174.1595.97
Table 9. Summary of existing PCM research about cold regions in China.
CityClimate RegionSub-RegionConclusionsRef.
YichunSevere coldIAPCM saved cooling energy in south-facing bedrooms in these four cities by 25.67%, 15.36%, 14.61%, and 15.34%, respectively.[43]
HarbinIB
ShenyangIC
DalianColdIIA
UrumqiSevere coldICThe PCM strategy was the best choice for the transition season in cities in severe cold zone.[44]
AltayIB
TurpanColdIIB
Xi’anIIB
ChongqingHot summer and cold winterIIIB
ChengduIIIA
NanningHot summer and warm winterIVB
HechiIVA
GuiyangMildVA
KunmingVA
HarbinSevere coldIBIn these three cities, the percentages of energy saving were 17.5%, 14.8%, and 12.5%, respectively.[55]
ZhengzhouColdIIB
GuangzhouHot summer and warm winterIVB
HarbinSevere coldIBEnergy saving rates of using PCM novel wallboards were 11.9% in Harbin, 6.6% in Beijing, 4.1% in Wuhan, 3.8% in Guangzhou, and 12.3% in Kunming.[56]
BeijingColdIIB
WuhanHot summer and cold winterIIIA
GuangzhouHot summer and warm winterIVB
KunmingMildVA
ShenyangSevere coldICEnergy saving potential of Shenyang was found to be the best. Zhengzhou and Changsha followed Shenyang.[57]
ZhengzhouColdIIB
ChangshaHot summer and cold winterIIIA
KunmingMildVA
Disclaimer/Publisher’s Note: The statements, opinions and data contained in all publications are solely those of the individual author(s) and contributor(s) and not of MDPI and/or the editor(s). MDPI and/or the editor(s) disclaim responsibility for any injury to people or property resulting from any ideas, methods, instructions or products referred to in the content.

