


Abstract
Reservoir permeability is an important parameter for reservoir characterization and the estimation of current and future production from hydrocarbon reservoirs. Logging data is an important means of evaluating the continuous permeability curve of the whole well section. Nuclear magnetic resonance logging measurement results are less affected by lithology and have obvious advantages in interpreting permeability. The Coates model, SDR model, and other complex mathematical equations used in NMR logging may achieve a precise approximation of the permeability values. However, the empirical parameters in those models often need to be determined according to the nuclear magnetic resonance experiment, which is time-consuming and expensive. Machine learning, as an efficient data mining method, has been increasingly applied to logging interpretation. XGBoost algorithm is applied to the permeability interpretation of carbonate reservoirs. Based on the actual logging interpretation data, with the proportion of different pore components and the logarithmic mean value of T2 in the NMR logging interpretation results as the input variables, a regression prediction model is established through XGBoost algorithm to predict the permeability curve, and the optimization of various parameters in XGBoost algorithm is discussed. The determination coefficient is utilized to check the overall fitting between measured permeability versus predicted ones. It is found that XGBoost algorithm achieved overall better performance than the traditional models.
1. Introduction
A significant proportion of the world’s oil reserves are found in carbonate reservoirs. Carbonate reservoirs have huge potential for exploration and development and play an indispensable role in the world’s oil and gas distribution. However, carbonate reservoirs have complex properties, which have the characteristics of large burial depth, complex and diverse pore space, and strong heterogeneity [1,2,3]. The existing mature evaluation techniques for conventional sandstone reservoirs cannot be effectively used in carbonate reservoirs. In the process of oil and gas field exploration and development, the main methods for evaluating reservoir parameters include two categories: direct measurement and indirect interpretation. The direct measurement method is accurate, but it needs to invest more manpower and material resources, and the rock samples obtained are generally small in number and affected by various factors, which is not conducive to the accurate estimation of reservoir parameters. Well logging data is generally easier to obtain and can be used to calculate reservoir parameters for the entire well section. Reservoir permeability is one of the most important pieces of information for reservoir evaluation, production prediction, field development parameter design, and reservoir numerical simulation [4,5,6]. Compared to conventional logging, nuclear magnetic resonance (NMR) logging is not affected by the rock skeleton and can provide information about pore space, permeability, and fluid properties. The permeability interpreted by NMR logging takes into account the influence of the pore structure of the rock. It overcomes the shortcomings of conventional methods that only consider porosity but ignore the influence of pores with different pore sizes on permeability and fail to calculate the permeability accurately. Based on NMR technology, Kenyon et al. proposed the SDR model and Coates proposed the Coates model, which are two classic and well-known formulas for calculating permeability [7,8]. For the conventional reservoirs with simple pore structure, the permeability calculated by these two models is in good agreement with the core experiments [9,10,11], but for reservoirs with multi-scale pore characteristics and wide pore throat distribution, the result is not satisfactory [12].
Due to the strong heterogeneity of carbonate reservoirs, it is difficult to find a clear mapping relationship between permeability and logging data [12]. Moreover, the relationship between permeability and logging data is generally nonlinear, which further leads to the difficulty of reservoir permeability evaluation. Machine learning algorithms have a strong advantage in mining the data nonlinear relationships and can automatically extract the hidden features in the data and the complex relationships between the data [13,14]. They can avoid building the complex physical model and directly establish the nonlinear relationship between input and output data. The establishment of a nonlinear intelligent prediction model between permeability and logging data has become an effective way to solve this problem. Many researchers have predicted the reservoir permeability based on machine learning technology and have achieved satisfactory results [15,16,17,18,19,20,21,22,23]. Huang et al. constructed a permeability prediction model based on a back-propagation artificial neural network (BP-ANN) using logging data and indicated the efficacy of BP-ANNs as a means of obtaining multivariate, nonlinear models for difficult problems [24]. Huang et al. proposed a new prediction model based on the Gaussian process regression method to determine the porosity and permeability without iterative adjustment of user-defined model parameters [25]. Zhu et al. proposed a permeability prediction method integrating deep belief network (DBN) and Kernel extreme learning machine (KELM) algorithm to improve the accuracy of permeability prediction in low-porosity and low-permeability reservoirs based on NMR data [26]. Zhang et al. constructed permeability prediction models using different machine learning algorithms, and then compared and analyzed the accuracy of those prediction models to obtain the best model with highest accuracy [27]. Huang et al. constructed a permeability prediction model that combined the median radius and NMR data based on a neural network algorithm [28]. Mahdaviara et al. attempted to estimate the permeability of carbonate reservoirs using the Gaussian process regression method with few input parameters to meet the requirements of high accuracy and simplicity at the same time [20]. The previous studies played an important role in improving the accuracy of reservoir rock permeability calculation, but they did not fully utilize the information from NMR logging and did not analyze the sensitivity between NMR data and permeability in detail.
In this paper, based on previous research, the permeability of carbonate reservoirs was predicted based on machine learning technology using conventional logging and NMR logging data. Firstly, the limitations of the traditional NMR logging permeability model are analyzed. Secondly, the correlation between conventional logging, NMR logging data, and permeability is analyzed in detail, and the permeability sensitive logging curve is finally selected as the input data of the machine learning algorithm. Finally, the XGBoost machine learning algorithm is used to predict the permeability, and the parameter adjustment method and prediction results were analyzed in detail.
2. Theory and Methods
2.1. NMR Logging
NMR logging is a technique used in petrophysics and petroleum exploration to assess the properties of rocks and fluids in underground formations. It utilizes the principles of nuclear magnetic resonance to measure the relaxation times and diffusion coefficients of hydrogen atoms in these materials [29]. Compared with other conventional logging techniques, NMR logging provides several advantages when it comes to permeability prediction in reservoir characterization. It can directly measure the diffusion coefficient of fluids within the formation, and this parameter is directly related to the permeability of the rock. By analyzing the NMR measurements, it is possible to obtain permeability estimates without relying on correlations or assumptions based on other properties. Permeability is strongly influenced by the size and connectivity of the pores in the reservoir rock. NMR measurements can reveal information about the range and distribution of pore sizes, enabling the assessment of permeability variations at different scales. NMR logging can determine both total porosity and effective porosity, which refers to the interconnected pore space available for fluid flow. Effective porosity is a key factor controlling permeability. NMR measurements can identify regions of high effective porosity, indicating regions of potential permeability enhancement.
2.2. Data Preprocessing
2.2.1. Feature Scaling
Generally, the well log curves that are used in reservoir parameter prediction are different in units, and these data have significant differences in scale or range. If these logging data are used directly without processing, the prediction results obtained will have problems such as low accuracy and slow convergence speed. Normalized data can prevent the model’s prediction results from being affected by outliers or extreme values. Normalization is an important process in machine learning, which can improve the training efficiency and prediction accuracy of models. For different types of log curve data, it is necessary to use appropriate methods for normalization [30]. Curves with a narrow distribution range, such as gamma ray (GR), and formation density (DEN) are directly normalized according to Equation (1).
where is the arbitrary logging data to be normalized, is the minimum value of the corresponding logging data, is the maximum value of the corresponding logging data, and is the normalized logging data.
For the resistivity logging curves with a wide range of data distribution, the resistivity data is first logarithmic and then normalized (Equation (2)).
where is the normalized resistivity logging data, is the resistivity logging data, is the minimum value of resistivity logging data, and is the maximum value of resistivity logging data.
2.2.2. Principal Component Analysis
The statistical method of regrouping multiple original variables into a new set of mutually unrelated composite variables that reflect the main information of the original variables is called principal component analysis (PCA). Principal component analysis can simplify the complexity of data and models, improve the generalization ability and computational efficiency of models, and help us understand the relationships and structures of data. The main steps for PCA are as follows [31,32].
(1) Generate the sample matrix: Assume the number of samples is and each sample has features, then sample can be expressed as and the whole sample matrix can be written as:
(2) Standardize the data: If the variables are measured in different units, it is essential to standardize the data (subtract the mean and divide by the standard deviation for each variable) to ensure that each variable contributes equally to the analysis.
where is the mean of feature , is the standard deviation of feature .
The standardized sample matrix can be written as:
(3) Calculate the covariance matrix: Compute the covariance matrix of the standardized data. The covariance matrix summarizes the relationships between variables. It shows how much two variables vary together.
(4) Calculate the eigenvalues and eigenvectors of the covariance matrix: The eigenvalues represent the amount of variance explained by each principal component, and the eigenvectors form the principal components.
The eigenvalues and the eigenvector can be obtained by solving the characteristic equation (Equation (7)) using the Jacobi method [33].
Sort by the data value, i.e., , is the eigenvector corresponding to .
(5) Calculate contribution ratio: The contribution ratio (also known as the proportion of explained variance) in PCA is a measure of how much each principal component contributes to the total variance of the data. It can be calculated using the eigenvalues of the covariance matrix.
The cumulative contribution ratio can be used to get the optimal number of principal components.
2.3. XGBoost Principle
XGBoost (eXtreme Gradient Boosting, version 2.0.1) is a powerful machine learning algorithm that has gained significant popularity and achieved remarkable success in various data science competitions and real-world applications. It is an implementation of the gradient boosting framework, which is an ensemble learning method that combines multiple weak predictive models to create a stronger and more accurate final model. When using the XGBoost algorithm to build a logging interpretation model, the first objective function is defined based on the categorical regression tree (CART) as the base classifier, which contains the loss function and the regular term.
After that, the input logging data are accumulated for training and for the tth iteration. The model objective function can be expressed as Equation (11).
where denotes the tth added categorical regression tree. The constant denotes the complexity of the first t − 1 trees.
The objective function is approximated by Taylor’s formula, and Equation (11) is expanded by the second-order Taylor’s formula.
where denotes the first-order derivative of with respect to . denotes the second-order derivative of with respect to . The final objective function can be obtained after simplification.
The objective function takes the partial derivative of and sets it equal to 0. Then, the optimal weight can be obtained.
Substituting Equation (14) into Equation (13), the optimal value of the objective function is obtained.
The XGBoost algorithm borrows the idea of the random forest in the training process, and instead of using all the sample features in the iterative process, it adopts the random subspace method [34,35,36]. If the input feature variable consists of i different logging parameters Li, each node randomly selects some features from them and compares the optimal split among them for node splitting, which can effectively improve the generalization ability of the model. To this end, when selecting the subtree splitting points, the gain is defined as:
where , are the gradient values of the left subtree at the split point. is the total set of split points of the left subtree. , are the gradient values of the right subtree at the split point. is the total set of split points of the right subtree.
The input logging parameter features are arranged to traverse each split point of each one-dimensional feature using Equation (16), and the best-split point is identified by maximizing the value of the gain.
3. Results and Discussion
3.1. Data Information
The logging data used in this paper are taken from the carbonate reservoirs of four wells and contain both conventional and NMR logging data. The conventional logging curves are mainly nature gamma-ray (GR), Caliper (CAL), deep resistivity (RD), medium resistivity (RS), wave sonic (DT), formation density (RHOB), and neutron logs (NPHI). The NMR logging data mainly includes T2 spectra and other parameters after processing, such as logarithmic mean of T2 (T2LM), bound water volume (BFV), free fluid volume (FFV), interval porosity of different bins (MBP1, MBP2, …, MBP8), and so on. At the same time, relevant experimental tests were carried out in the study area, as shown in Table 1.
Table 1.
Basic information about the experimental tests.
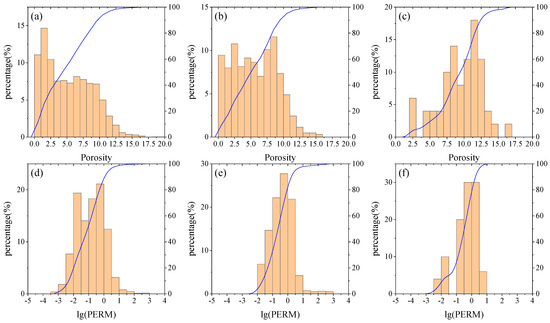
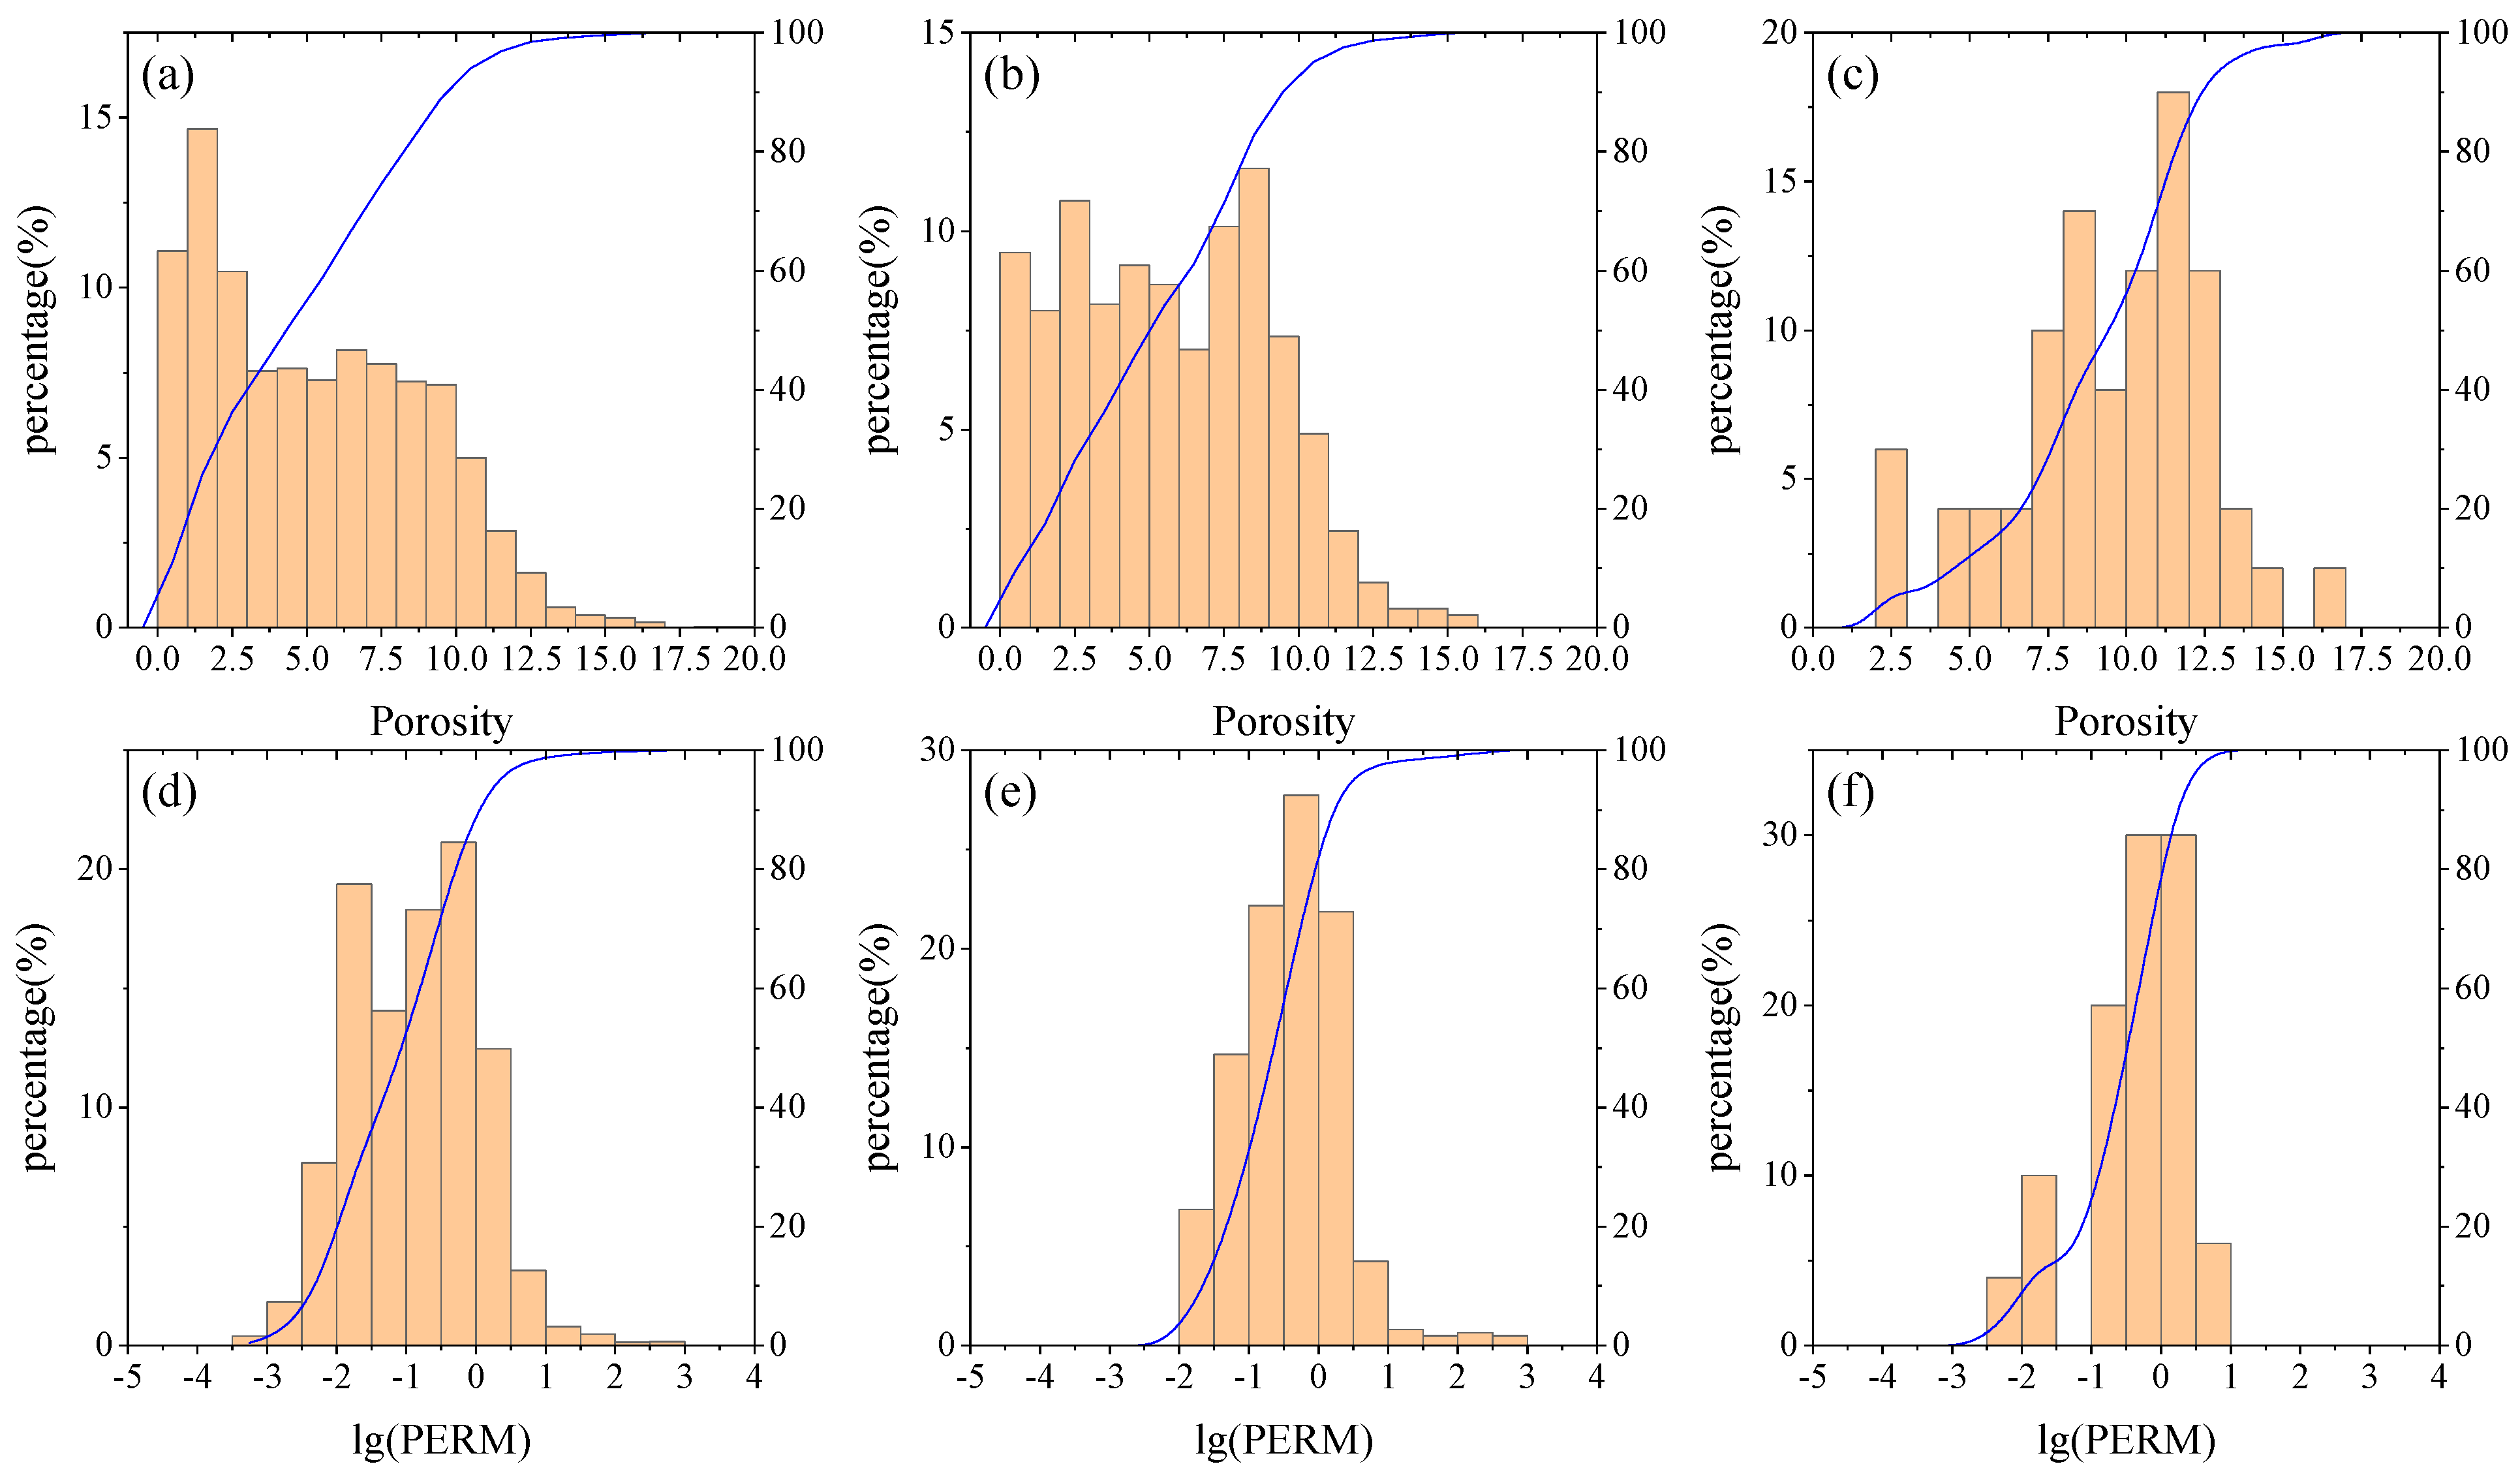
In order to compare and analyze the pore and permeability experimental data from different sources, the same scale intervals were used to draw the pore and permeability distribution histograms (Figure 1). Figure 1a,b show the distribution of He porosity of core plugs and whole diameter cores, respectively. Figure 1c shows the distribution of NMR porosity of core plugs. Figure 1d,e show the corresponding Klingenberg permeability distribution of core plugs and full diameter cores, respectively. Figure 1f shows the Klingenberg permeability distribution of core plug samples for NMR experiments. The histograms of porosity and permeability distribution show that there are differences in the pore and permeability results obtained from different experimental methods. Considering the heterogeneity of carbonate rocks, the permeability measured from full-diameter cores was chosen as the training data for machine learning during the study.
Figure 1.
Histogram of porosity and permeability distribution obtained from different experimental measurements (a) porosity distribution from core plug experimental data, (b) porosity distribution from full diameter core experimental data, (c) porosity distribution from NMR experiment, (d) permeability distribution from core plug experimental data, (e) permeability distribution from full diameter core experimental data, (f) permeability distribution of plug rock samples for NMR experiments.
3.2. Permeability Prediction Based on NMR Empirical Equation
The classical permeability models for NMR logging are categorized into the SDR model and the Coates model, where the SDR model uses the geometric mean of the T2 distribution, which is only applicable to fully water-saturated formations, and the Coates model uses the ratio of movable to bound fluid, which is unaffected by pore fluids.
In 1987, Kenyon et al. proposed the SDR model for permeability calculation based on the geometric mean of T2 with the following equation [7].
In the formula, is the calculated permeability of the SDR model. is the total porosity calculated by NMR. is the geometric mean of T2. , , and are empirical coefficients for the region.
The SDR model is based on a large amount of experimental data, and the key is to calculate the geometric mean of T2 in the formation.
In 1991, George R. Coates proposed the commonly used Coates permeability model with the following equation [8].
In the formula, is the permeability calculated by the Coates model. is the total porosity calculated by NMR. is the saturation of free fluid. is the saturation of bound fluid. , , and are the empirical coefficients of the area.
The Coates model and the SDR model are commonly used models for calculating the permeability of NMR logs. For conventional reservoirs with simple pore structure, the results of the two methods on the calculation of permeability are more satisfactory. However, for reservoirs with cross-scale pores and wide pore throat distribution, such as carbonate reservoirs, due to the continuous distribution of pore throats of different sizes and the large difference in their contribution to permeability, it is necessary to modify and improve the model in a targeted manner.
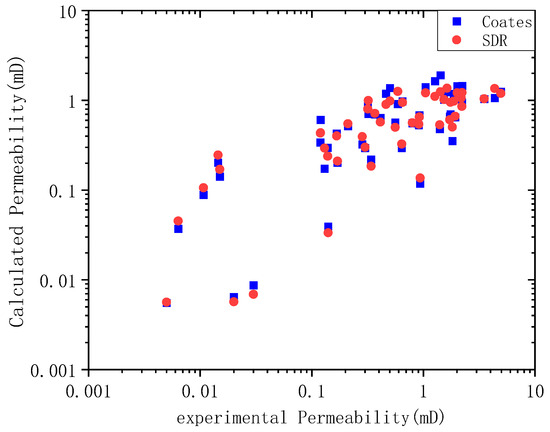
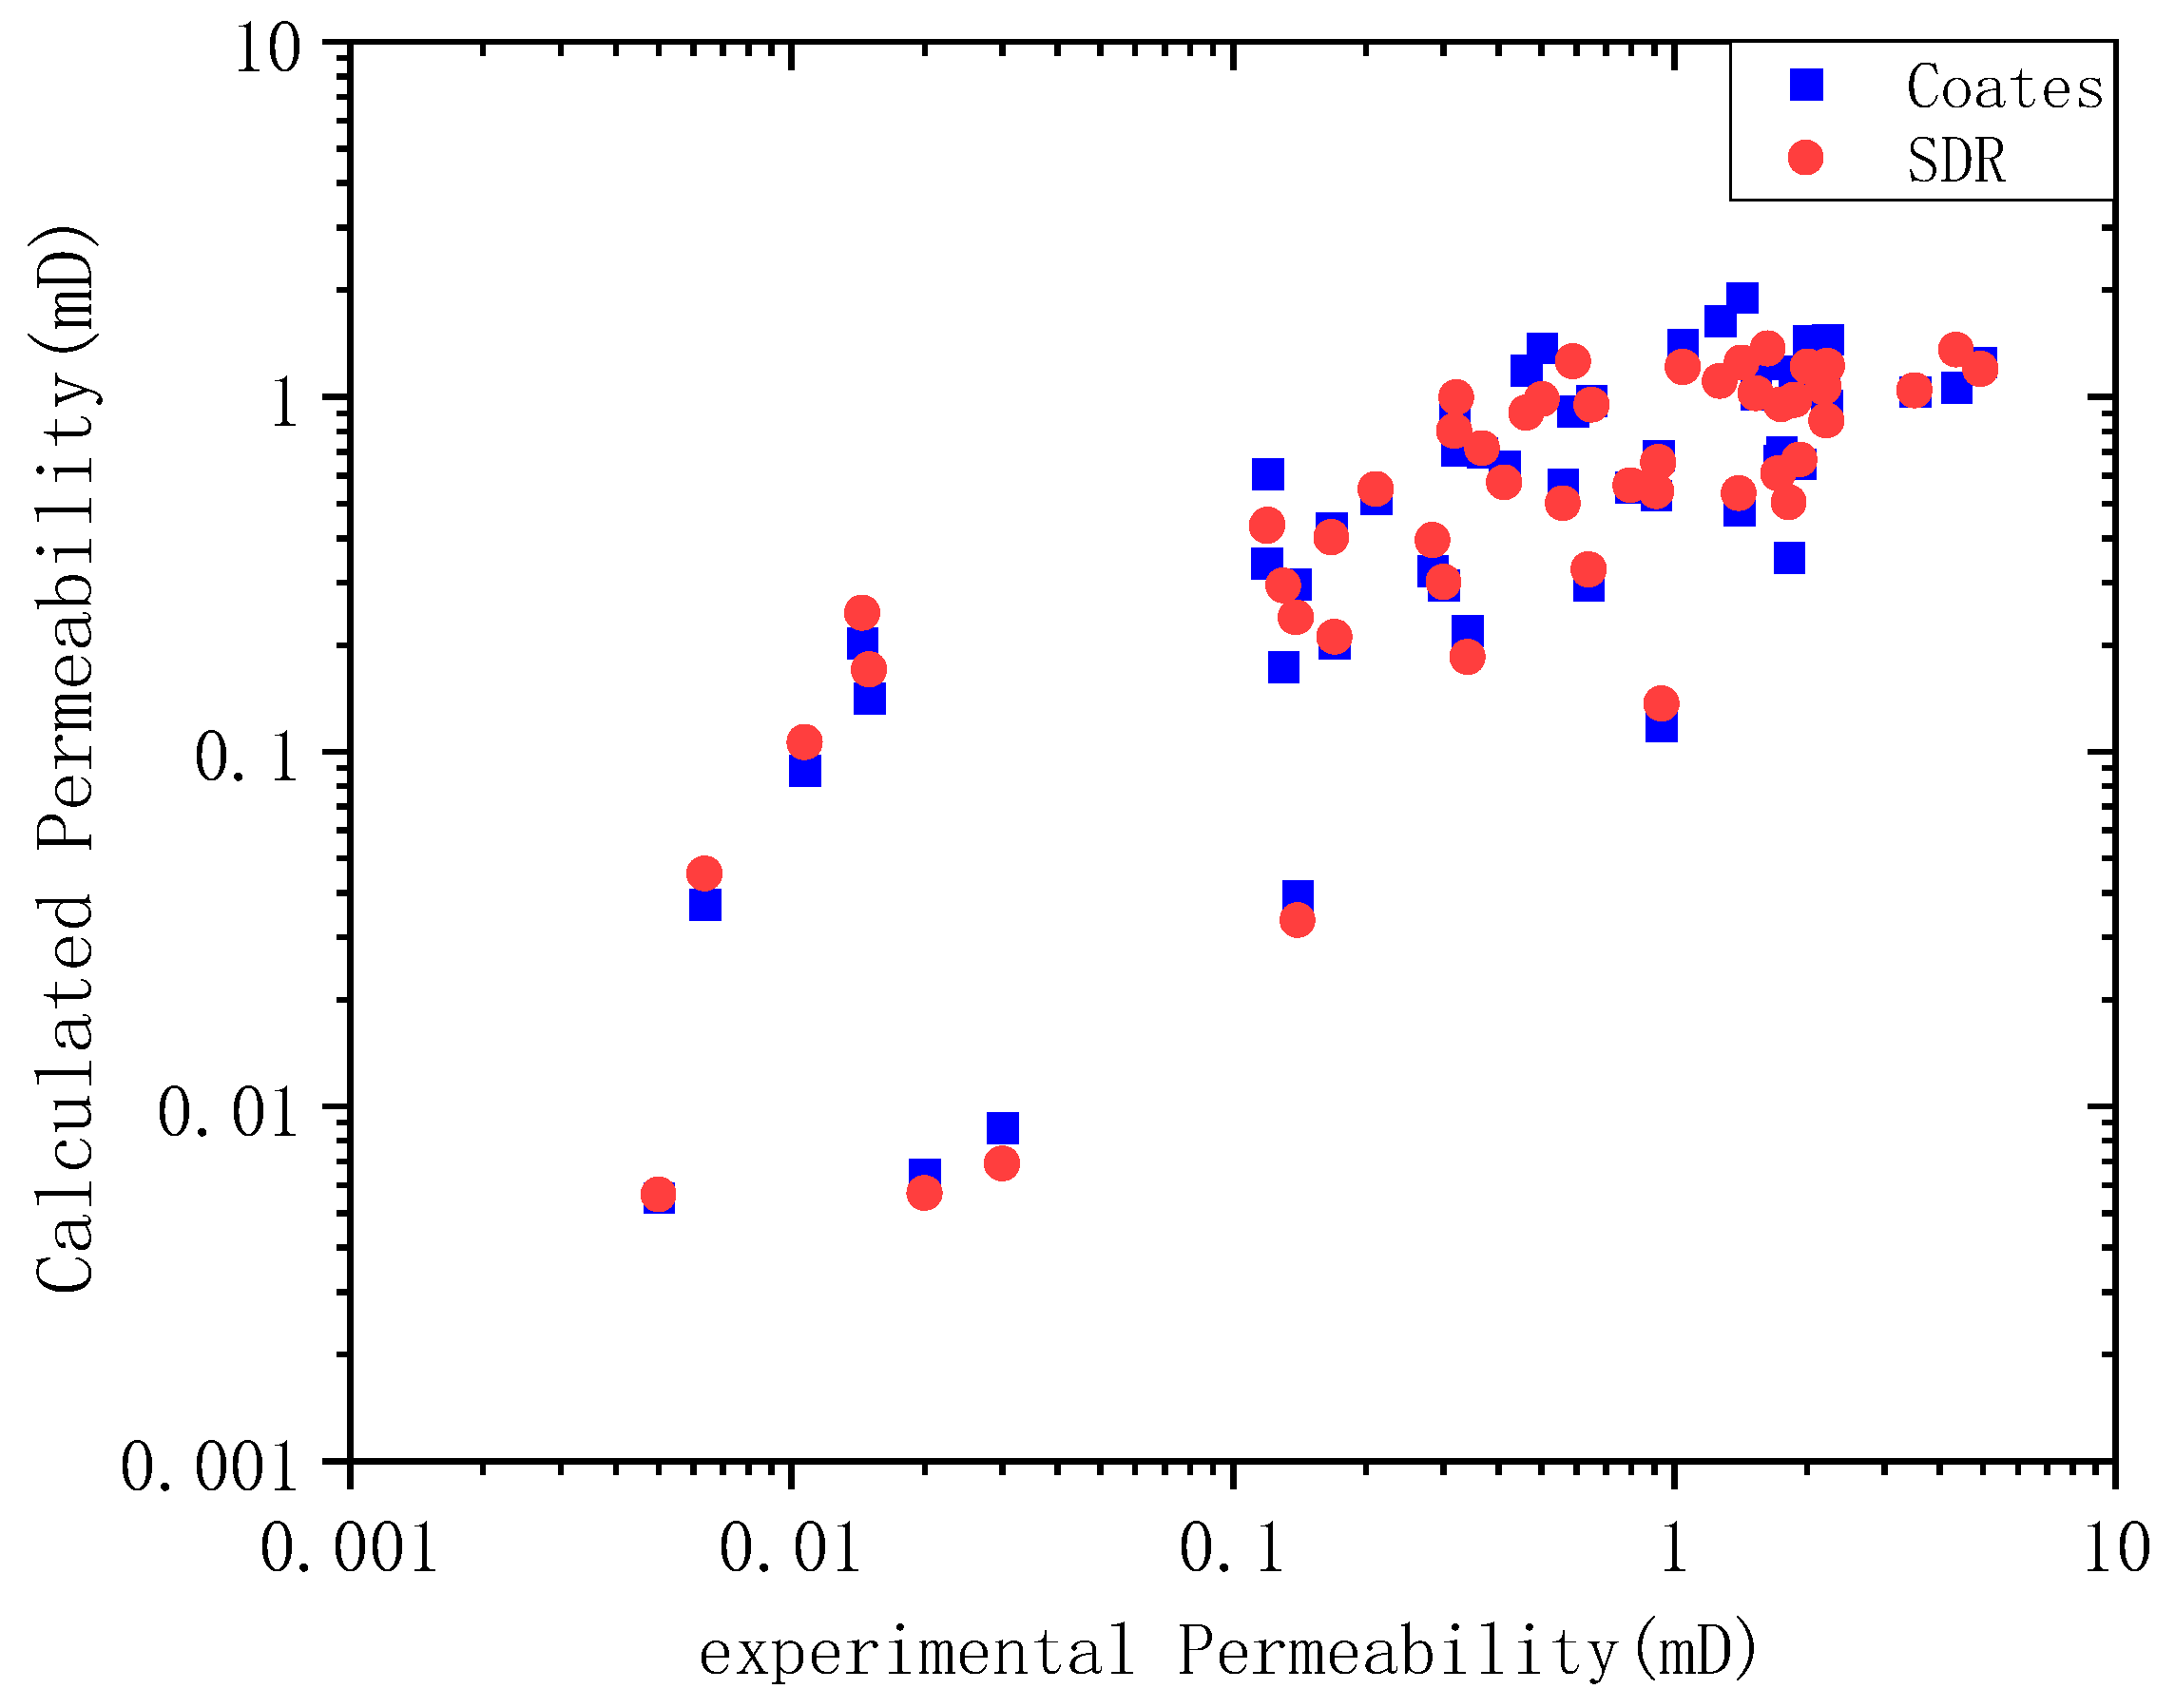
The key to calculating the permeability of the Coates model is to accurately calculate the bound fluid saturation, that is, to determine the T2 cutoff value. For carbonate reservoirs, the empirical value of the T2 cutoff value can be taken as 92 to 100 ms. The coefficients , , and in the Coates and SDR models can be obtained using multiple regression, as shown in Table 2. The Coates model and the SDR model were used to calculate the permeability and compare it with the experimental results (Figure 2). As can be seen from Figure 2, the data points of the calculated permeability and the experimental permeability are distributed near the 45-degree line, and when the permeability is low, the error between the model calculated results and the experimental results is large.
Table 2.
Permeability models obtained based on NMR experimental data.
Figure 2.
Comparison of calculated permeability and experimental permeability.
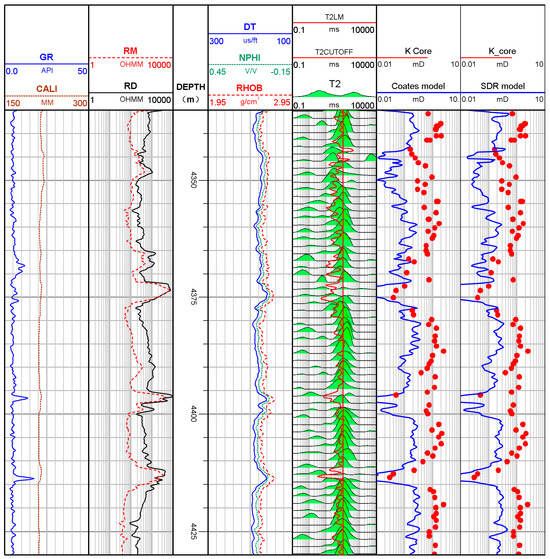
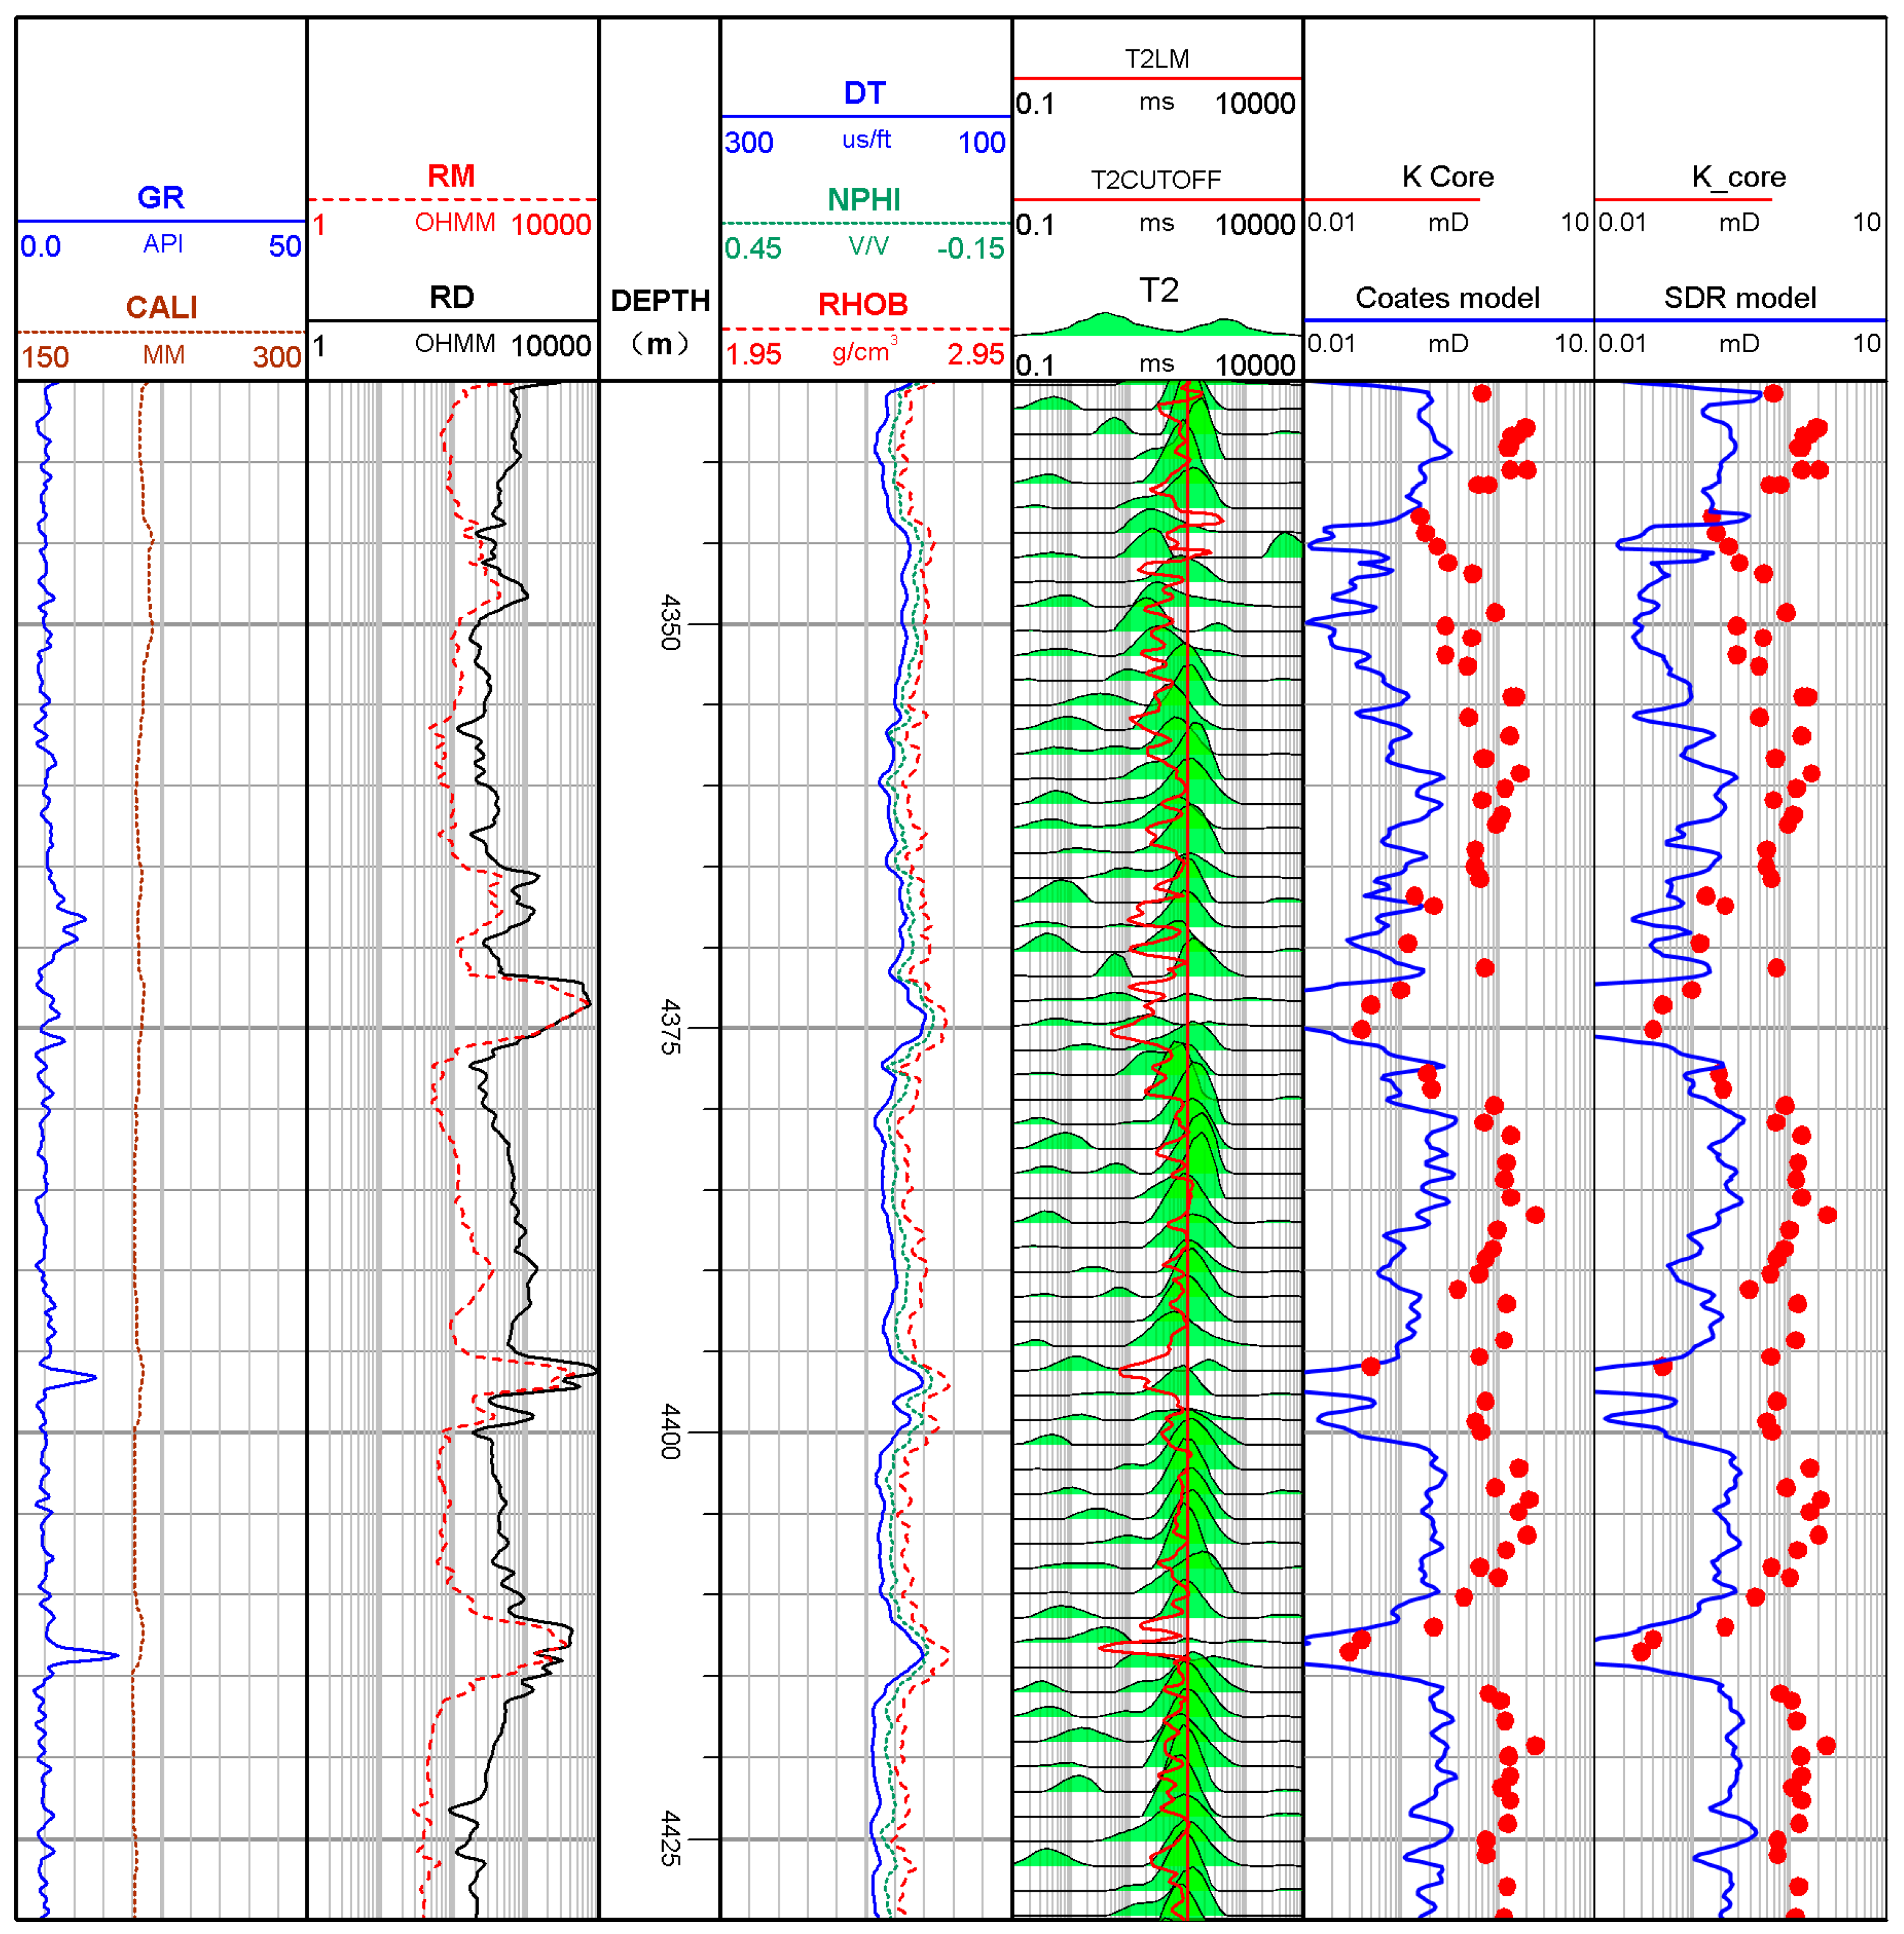
Applying the Coates and SDR models to Well X3 (Figure 3), it can be found that the permeability calculated by the Coates and SDR models is poorly matched with the permeability of the core analysis, and the correlation coefficients are 0.401 and 0.238 for the Coates model and SDR model, respectively. This is mainly because the cores used in nuclear magnetic resonance experiments are generally plug samples, which are difficult to reflect the heterogeneity characteristics of carbonate reservoirs. At the same time, due to the cost of NMR experiments, the NMR test data of rock is less, and the depth of the covered formation is short. Therefore, the traditional Coates and SDR models obtained by nuclear magnetic resonance (NMR) experiments are not suitable for carbonate reservoirs in some cases.
Figure 3.
Results of Coates model and SDR model permeability calculations for well X3.
3.3. Permeability Prediction Based on XGboost
3.3.1. Feature Selection
Blindly introducing too many inputs will make the prediction effect worse, so the correlation is analyzed first, and only the correlated features will be selected. Most of the data feature correlations are characterized by the coefficient method, which mainly includes the Pearson coefficient method, Kendall coefficient method, Spearman coefficient method, etc. [37,38]. Among them, the Pearson coefficient method is often used to measure the degree of linear correlation, and the Kendall coefficient method and Spearman coefficient method are often used to measure the degree of nonlinear correlation. Considering the characteristics of logging data and the potential correlation between logging curves and permeability parameters, this paper adopts a combination of Pearson coefficient and Spearman coefficient to select the permeability-sensitive logging curves. Specifically, the correlation criteria described in Table 3 are used to determine the strength of the correlation [39].
Table 3.
Criteria for the strength of correlation based on correlation coefficient.
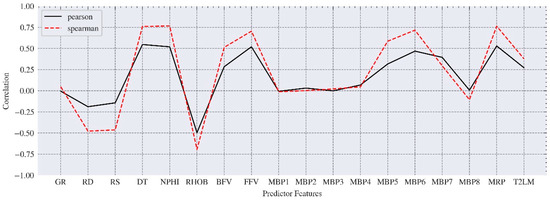
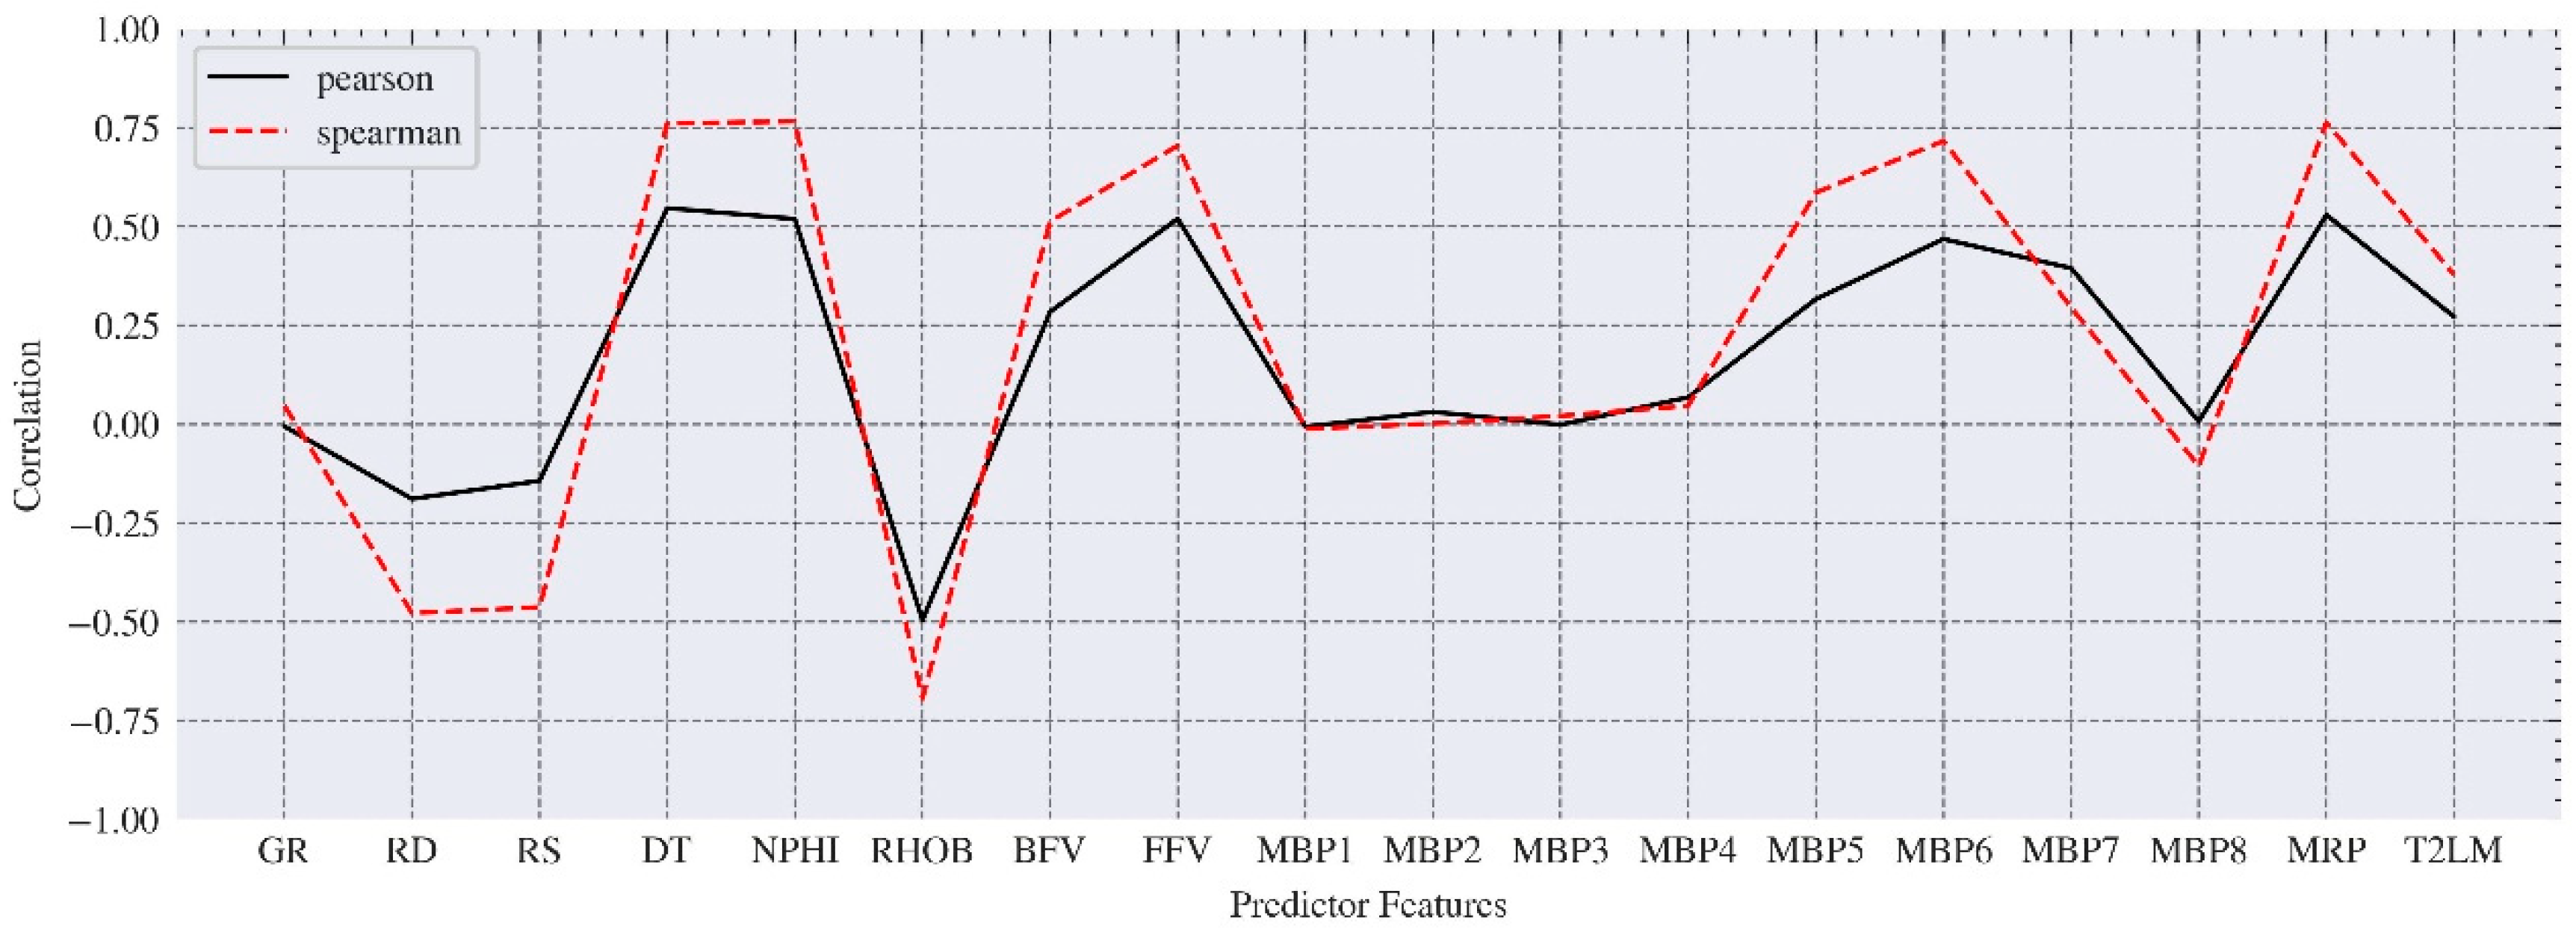
On the basis of core depth correction, the correlation between logging curves and experimental permeability is analyzed by the Pearson coefficient and Spearman coefficient (Figure 4). According to the criteria described in Table 3, it can be seen that the Pearson correlation coefficients are generally less than 0.5 (except for DT, NPHI, and FFV), which indicates that the linear correlation between predictors and permeability is weak. In the nonlinear relationship obtained by the Spearman coefficient method, the correlation between each logging curve and permeability is shown in Table 4. Among them, PERM is strongly correlated with DT, NPHI, RHOB, BFV, FFV, MBP5, MBP6, and MRP, and those logging curves that strongly correlated with the permeability are selected to predict the permeability during the study. However, the correlated logging curves are differences between different regions or different lithologies [40], and the correlation analysis shown in Figure 4 needs to be re-conducted.
Figure 4.
Correlation analysis between logging curves and permeability.
Table 4.
Correlation between logging curves and permeability.
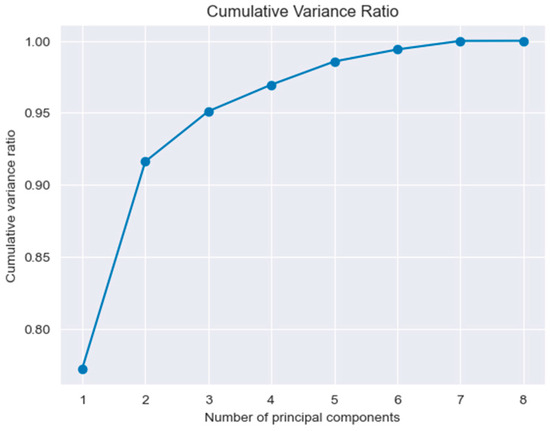
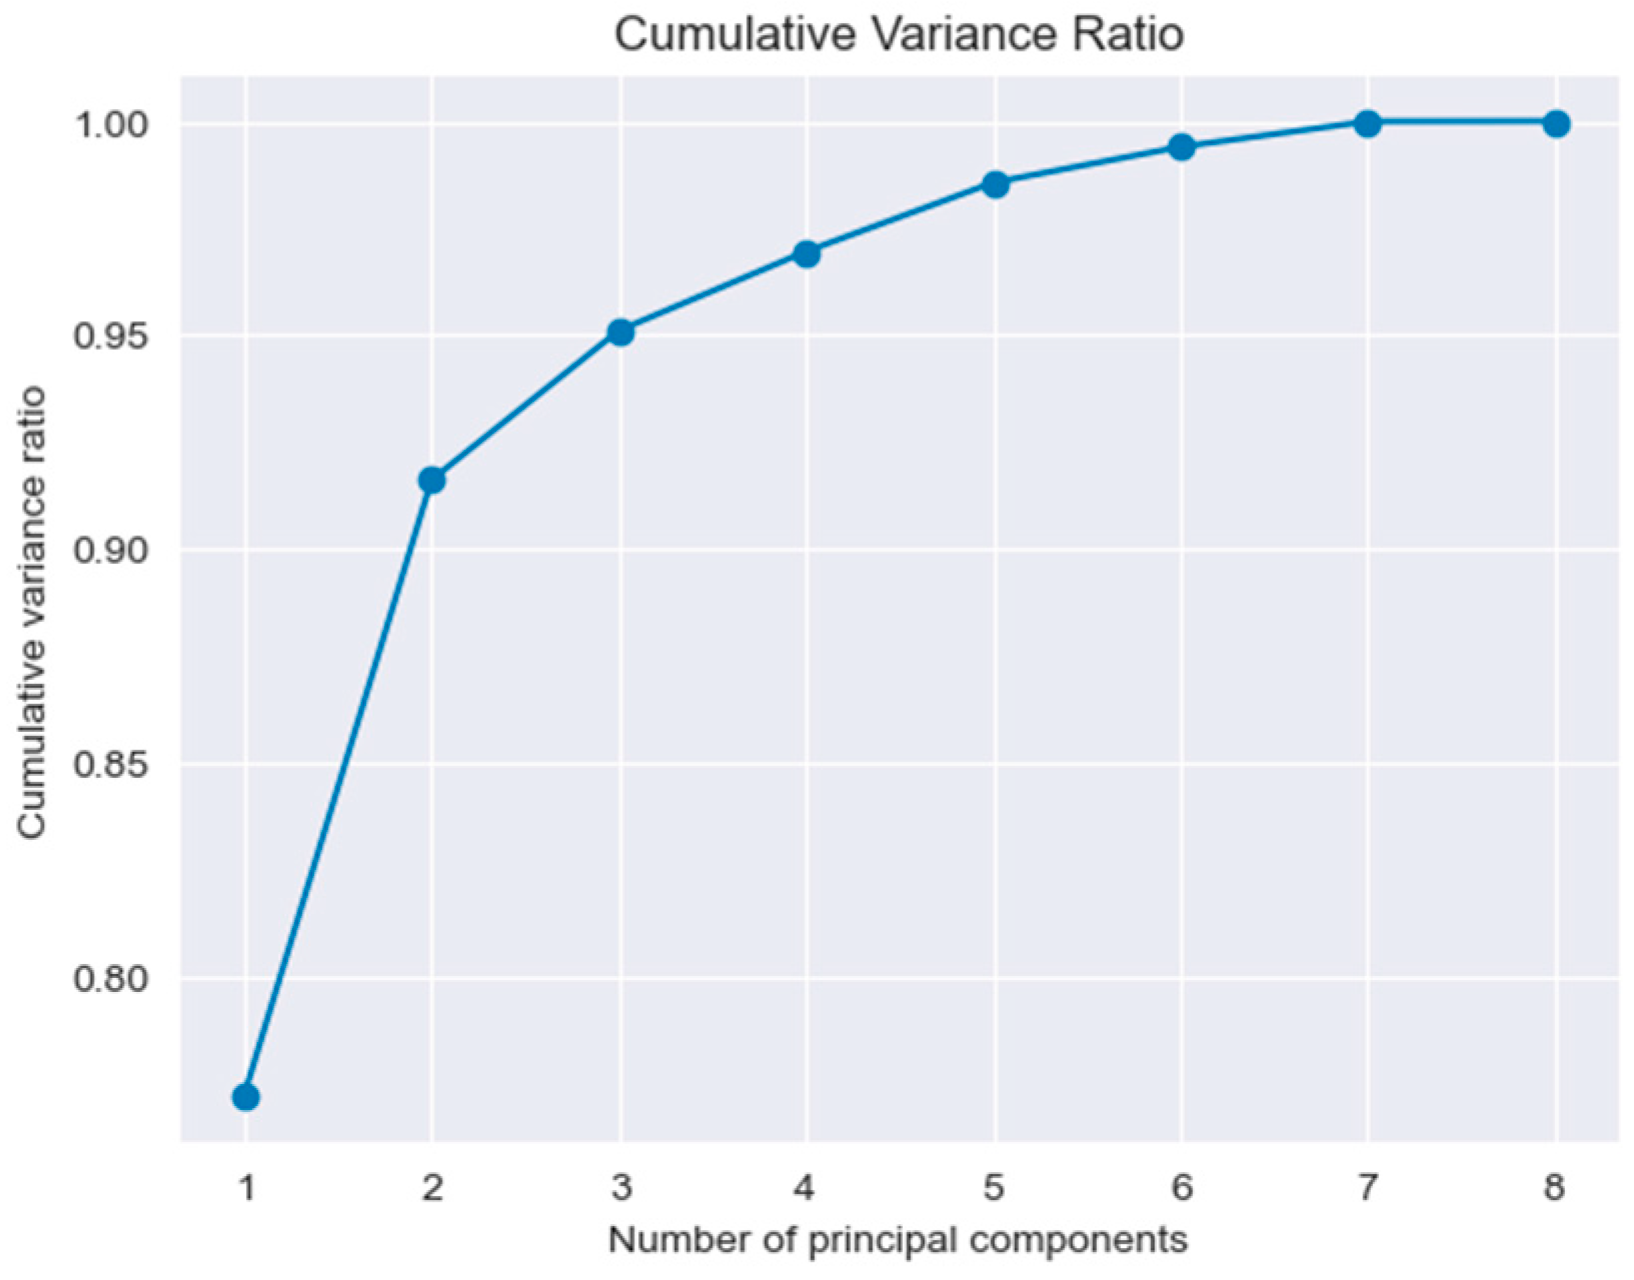
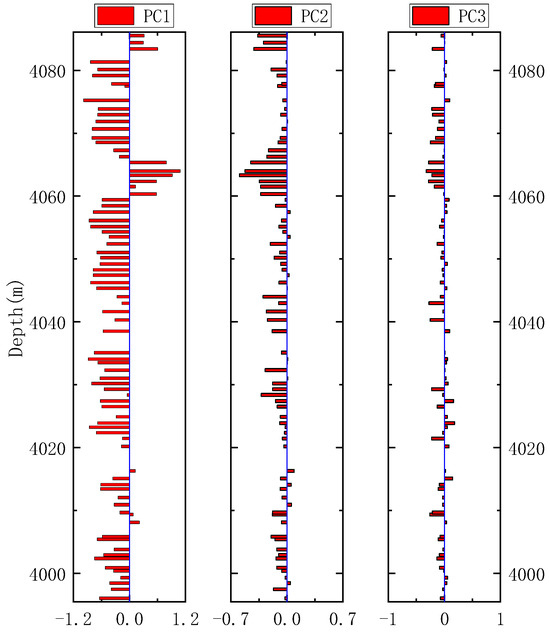
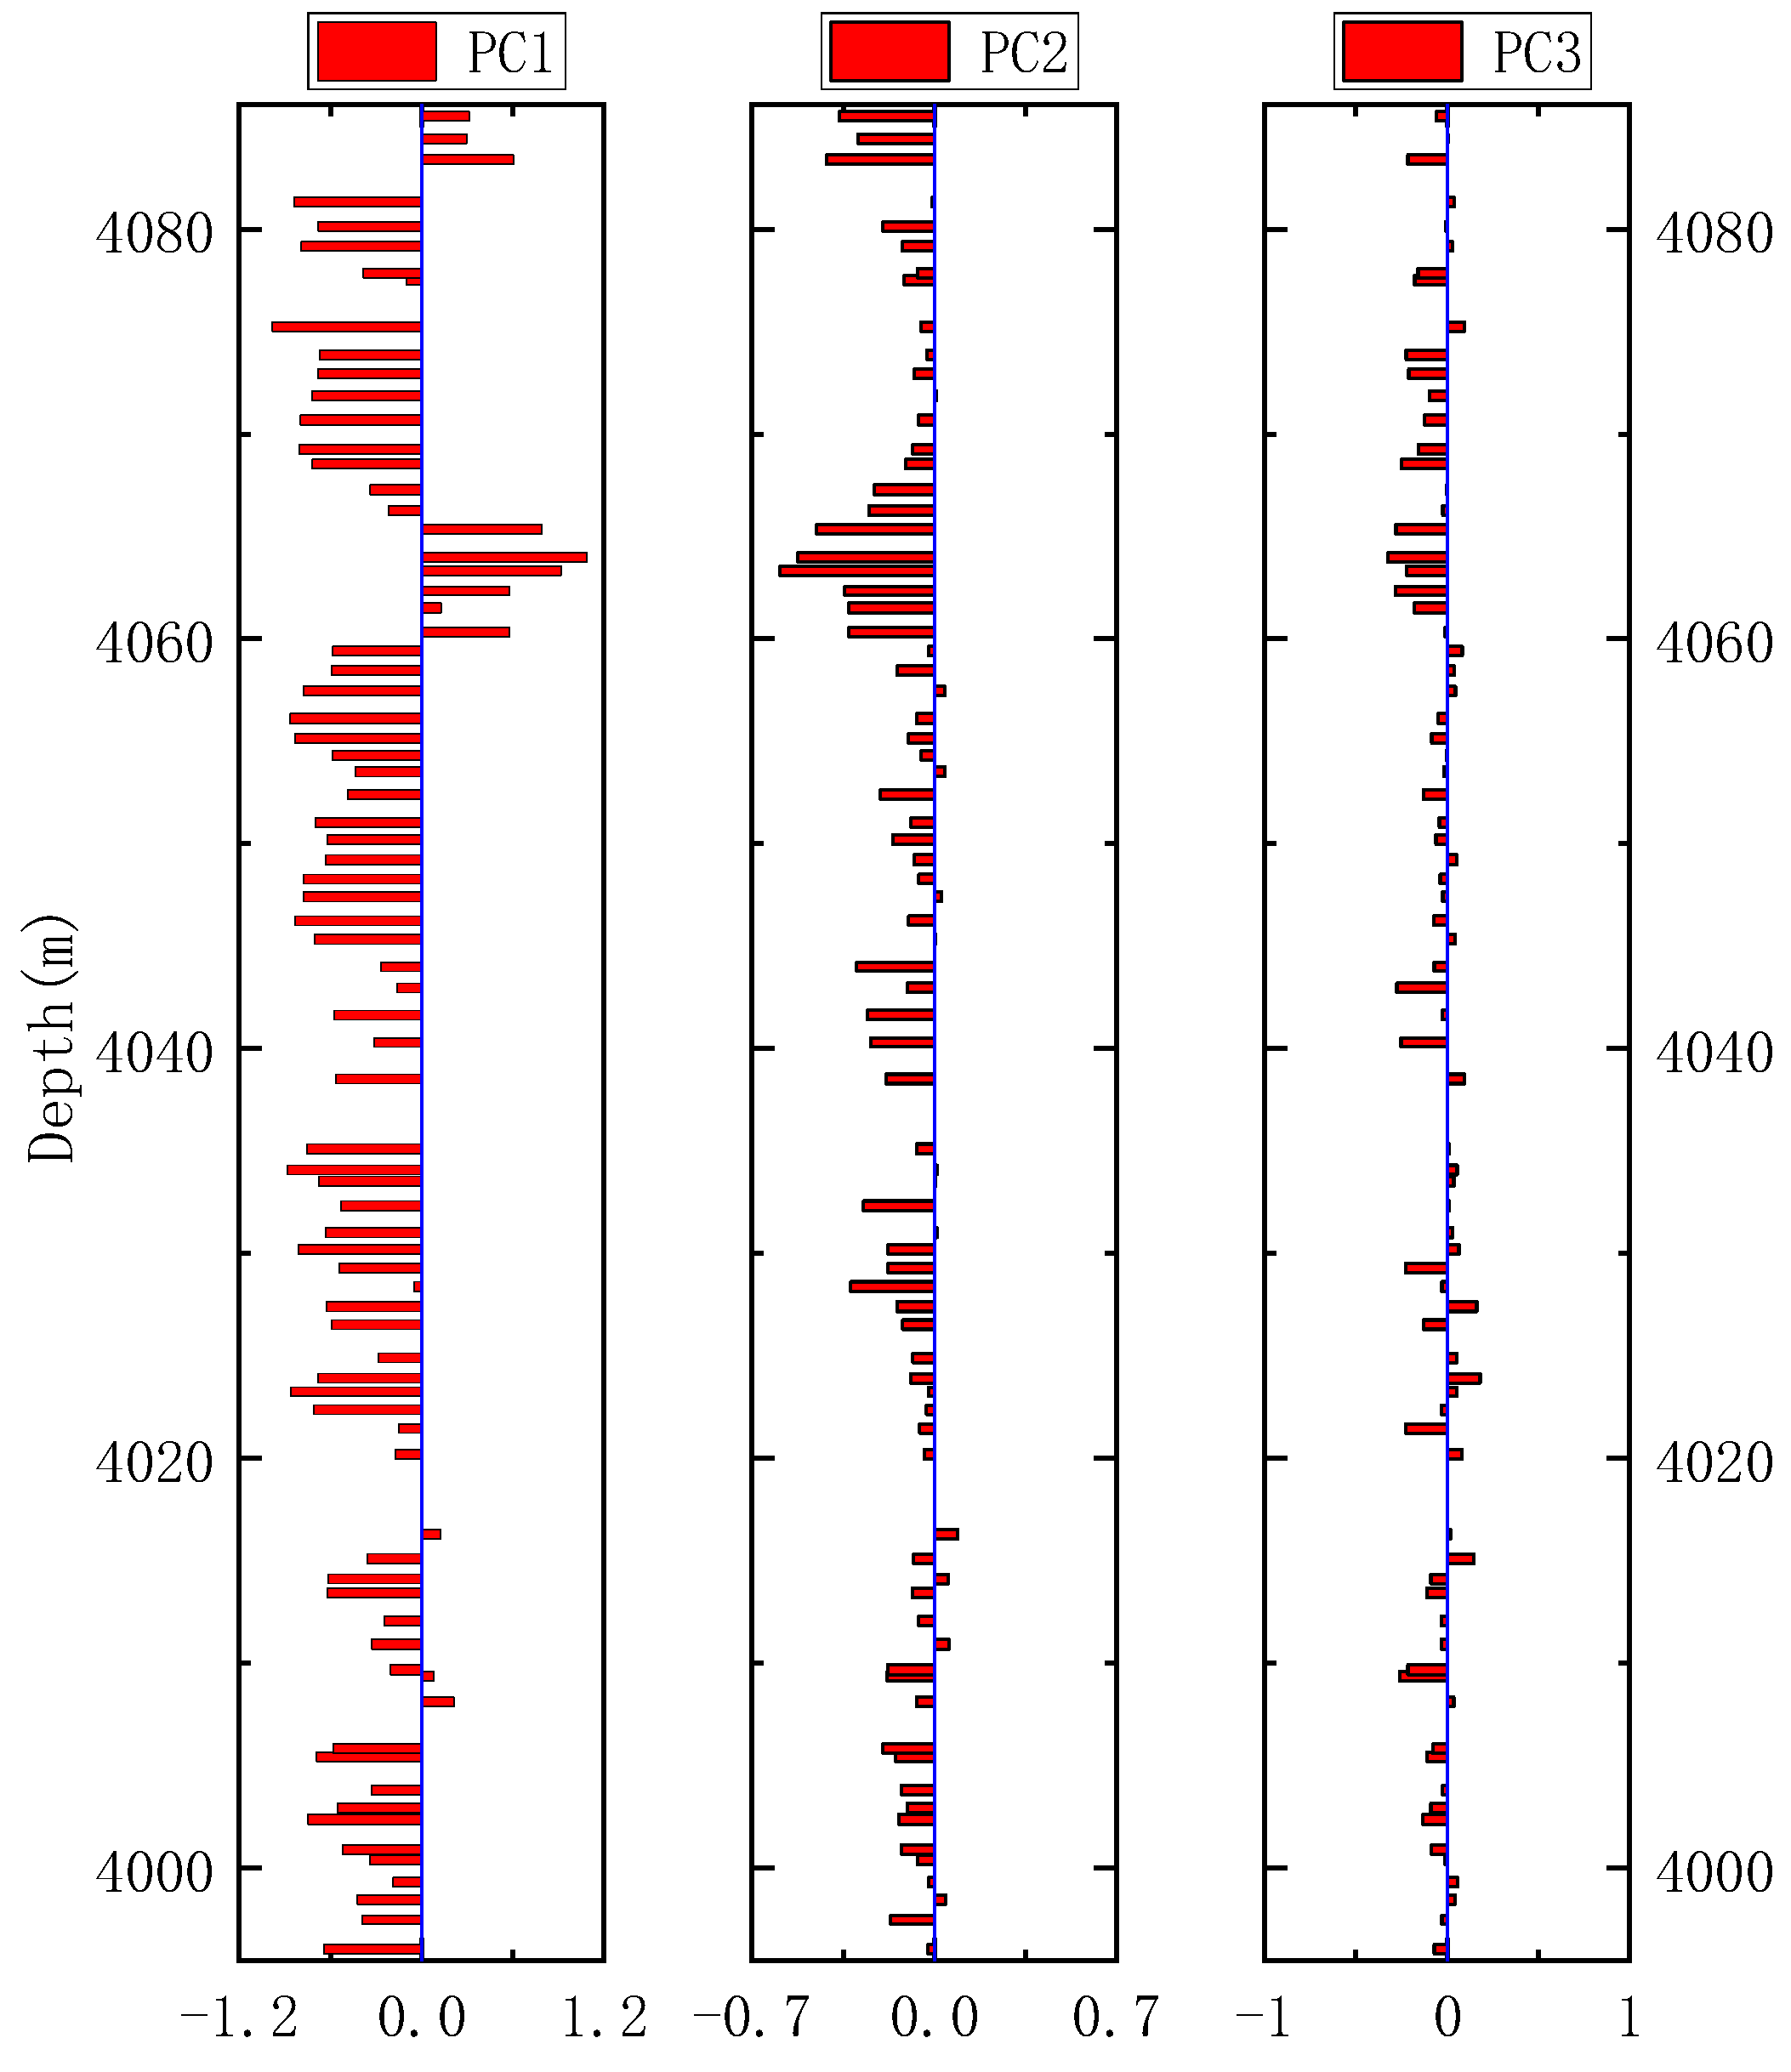
For the selected logging curves with strong correlation with permeability, the logging data were processed using the normalization method to regularize the distribution interval of the original data to [0, 1]. Subsequently, the normalized data were downscaled using principal component analysis. The downscaled data simplified the computation and visualization to a certain extent, and the noise and redundant information in the original data could be removed [41,42]. A line graph of the cumulative variance and the number of principal components was plotted (Figure 5), and the number of principal components corresponding to the cumulative contribution rate of 0.95 was used as the optimal number of principal components. The number of principal components can be determined as 3 from Figure 5, and the variation of the determined principal component curve with depth of Well X2 is shown in Figure 6.
Figure 5.
The relationship between the number of principal components and the cumulative variance.
Figure 6.
Principal component analysis curve of permeability of Well X2.
3.3.2. Model Parameter Configuration and Analysis of Prediction Results
The dataset after principal component analysis is divided into the training set and test set according to the ratio of 8:2, and the data are trained and predicted by the XGBoost machine learning method. The training process of the model is to find the optimal combination of hyper-parameters for the model, so that the model has good robustness while ensuring sufficient accuracy. The XGBoost parameter optimization methods mainly include manual parameter tuning method, grid search method, random search method, and Bayesian search method [35,43,44]. Among them, the grid search method is simple and intuitive, which can systematically explore the parameter combination space, and it is an exhaustive search method, which finds the optimal parameter combination by defining the range of possible values of parameters and iterating through these parameter combinations. The grid search method is used to determine the main parameters of the model in the research process, and considering the correlation between the optimal parameters, we carried out the optimal search for six key parameters at the same time.
The prediction error is the key point to evaluate the accuracy of the model. After the prediction model is established, it is necessary to select appropriate model evaluation indicators to analyze the accuracy of the model. The permeability prediction model established in this paper belongs to the regression model, so it is necessary to select the evaluation function applicable to the regression model. R2 score, also known as the coefficient of determination or R-squared, is a statistical measure used to evaluate the performance of a regression model. It represents the proportion of the variance in the dependent variable that can be explained by the independent variables in the model. It can be expressed as Equation (19).
where represents the true value, represents the average of the true values, and represents the predicted value. The closer the R2 value is to 1, the higher the accuracy of the model prediction.
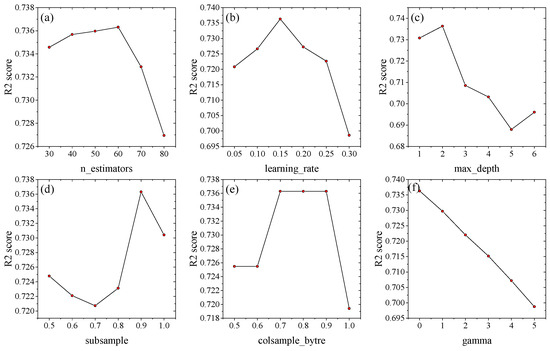
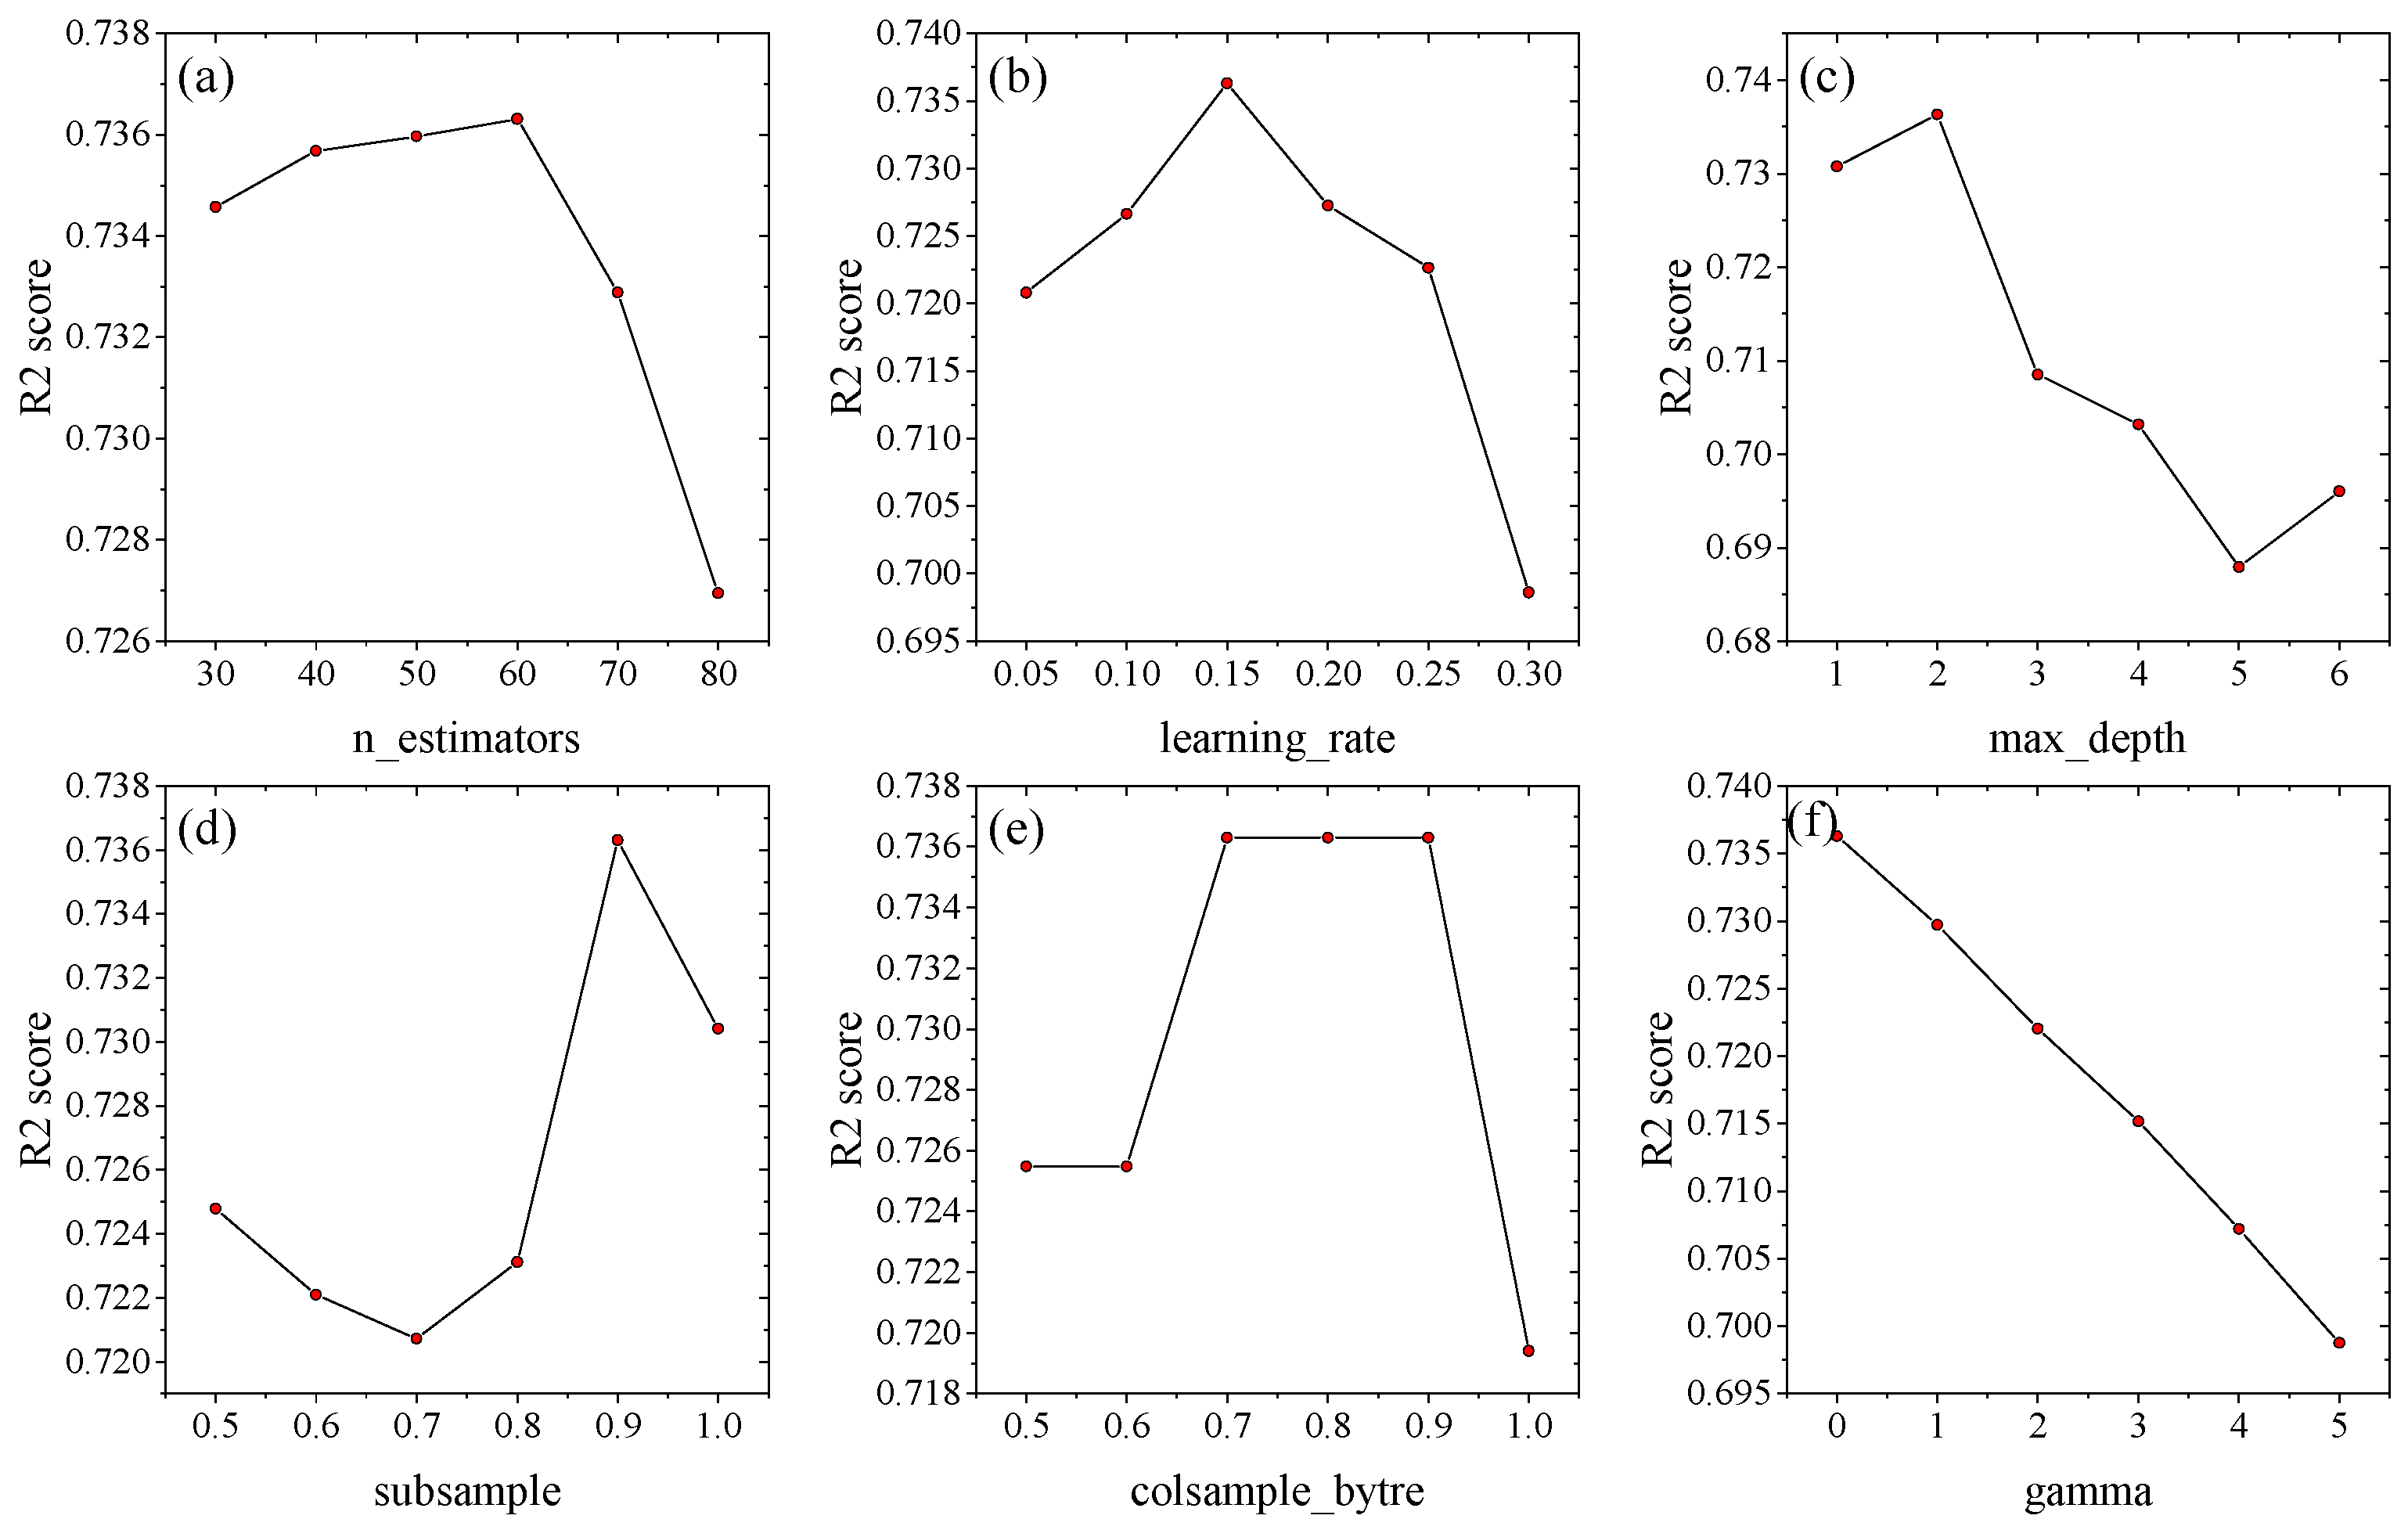
The final optimization parameters of the model are shown in Table 5, and the influence of each parameter on the accuracy is shown in Figure 7. Using the optimization parameters shown in Table 5, the R2 score is 0.736.
Table 5.
The optimal parameters of XGBRegressor.
Figure 7.
The effects of parameters on the prediction accuracy. (a) Number of gradient boosted trees, (b) boosting learning rate, (c) maximum tree depth for base learners, (d) subsample ratio of the training instance, (e) subsample ratio of columns when constructing each tree, and (f) minimum loss reduction required to make a further partition on a leaf node of the tree.
4. Conclusions
The relationship between permeability and logging curve is generally nonlinear, and it is difficult to find a clear mapping relationship between permeability and logging parameters. Machine learning algorithms are a good technical entry point to solve this conundrum as they can automatically extract the hidden features in the data and the relationship between the data. The paper predicted the permeability of carbonate reservoirs by the regression model established by the XGBoost method. The correlation between the logging curve and the experimental permeability was analyzed by using the Pearson coefficient and the Spearman coefficient, and the results showed that the linear correlation between predictors and permeability was weak. In the nonlinear relationship obtained by the Spearman coefficient, permeability is strongly correlated with DT, NPHI, RHOB, BFV, FFV, MBP5, MBP6, and MRP in this region. The dimension of the model can be greatly reduced by principal component analysis technology, and the noise and redundant information in the original data can be removed, thus improving the computational efficiency and accuracy of the model. The optimization parameters of the XGBoost model are correlated with each other, so the grid search technique is used to optimize the main parameters. The optimized model parameters can improve the prediction accuracy of the model. By comparing the permeability with the full-diameter core analysis, it can be seen that the permeability prediction accuracy of the carbonate reservoir based on the XGBoost method is significantly improved compared with the traditional Coates and SDR models, which is different from most of the siliciclastic rocks. Due to the heterogeneity of carbonate rocks, carbonate reservoirs have poor pore connectivity and large isolated holes. This part of the isolated pores does not contribute to the permeability. However, the correlation analysis between logging curves and permeability needs to be re-conducted, and there are differences between different regions or different lithologies.
Author Contributions
Methodology, J.Z. (Jianpeng Zhao) and H.C.; Validation, J.Z. (Jingbo Zeng) and Y.R.; Investigation, J.Z. (Jingbo Zeng); Resources, W.R.; Writing—original draft, J.Z. (Jianpeng Zhao); Writing—review & editing, Q.W., W.R., Y.R. and H.C.; Supervision, J.Z. (Jianpeng Zhao). All authors have read and agreed to the published version of the manuscript.
Funding
This research was funded by Natural Science Basic Research Program of Shaanxi grant number 2024JC-YBMS-202.
Data Availability Statement
The data presented in this study are available on request from the corresponding author. The data are not publicly available due to privacy.
Conflicts of Interest
Authors Wei Rong, Jingbo Zeng, Yawen Ren and Hui Chen were employed by the China Petroleum Logging Co., Ltd. (Xi’an). The remaining authors declare that the research was conducted in the absence of any commercial or financial relationships that could be construed as a potential conflict of interest.
References
- Sha, F.; Xiao, L.; Mao, Z.; Jia, C. Petrophysical Characterization and Fractal Analysis of Carbonate Reservoirs of the Eastern Margin of the Pre-Caspian Basin. Energies 2018, 12, 78. [Google Scholar] [CrossRef] [Scilit]
- Chen, X.; Zheng, Y.; Wang, G.; Wang, Y.; Luo, X.; Pan, Q.; Wang, Z.; Ping, W. Pore Structure and Fluid Mobility of Tight Carbonate Reservoirs in the Western Qaidam Basin, China. Energy Sci. Eng. 2023, 11, 3397–3412. [Google Scholar] [CrossRef] [Scilit]
- Li, W.; Mu, L.; Zhao, L.; Li, J.; Wang, S.; Fan, Z.; Shao, D.; Li, C.; Shan, F.; Zhao, W.; et al. Pore-Throat Structure Characteristics and Its Impact on the Porosity and Permeability Relationship of Carboniferous Carbonate Reservoirs in Eastern Edge of Pre-Caspian Basin. Pet. Explor. Dev. 2020, 47, 1027–1041. [Google Scholar] [CrossRef] [Scilit]
- Mo, F.; Du, Z.; Peng, X.; Liang, B.; Tang, Y.; Yue, P. Analysis of Pressure-Dependent Relative Permeability in Permeability Jail of Tight Gas Reservoirs and its Influence on Tight Gas Production. J. Porous Media 2019, 22, 1667–1683. [Google Scholar] [CrossRef] [Scilit]
- Xue, K.; Liu, Y.; Yu, T.; Yang, L.; Zhao, J.; Song, Y. Numerical Simulation of Gas Hydrate Production in Shenhu Area Using Depressurization: The Effect of Reservoir Permeability Heterogeneity. Energy 2023, 271, 126948. [Google Scholar] [CrossRef] [Scilit]
- Sanei, M.; Duran, O.; Devloo, P.R.B.; Santos, E.S.R. Evaluation of the Impact of Strain-Dependent Permeability on Reservoir Productivity Using Iterative Coupled Reservoir Geomechanical Modeling. Geomech. Geophys. Geo-Energy Geo-Resour. 2022, 8, 54. [Google Scholar] [CrossRef] [Scilit]
- Kenyon, W.E.; Day, P.I.; Straley, C.; Willemsen, J.F. A Three-Part Study of NMR Longitudinal Relaxation Properties of Water-Saturated Sandstones. SPE Form. Eval. 1988, 3, 622–636. [Google Scholar] [CrossRef] [Scilit]
- Coates, G.R.; Miller, M.; Gillen, M.; Henderson, C. The MRIL in Conoco 33-1 An Investigation of a New Magnetic Resonance Imaging Log. In Proceedings of the SPWLA 32nd Annual Logging Symposium, Midland, TX, USA, 16 June 1991. [Google Scholar]
- Xiao, L. Some Important Issues for NMR Logging Applications in China. Well Logging Technol. 2007, 31, 401–407. [Google Scholar] [CrossRef]
- Freedman, R. Advances in NMR Logging. J. Pet. Technol. 2006, 58, 60–66. [Google Scholar] [CrossRef] [Scilit]
- Wang, K.; Zhou, H.; Lai, J.; Wang, K.; Liu, Y. Application of NMR technology in characterization of petrophysics and pore structure. Chin. J. Sci. Instrum. 2020, 41, 101–114. [Google Scholar] [CrossRef] [Scilit]
- Wang, M.; Xie, J.; Guo, F.; Zhou, Y.; Yang, X.; Meng, Z. Determination of NMR T2 Cutoff and CT Scanning for Pore Structure Evaluation in Mixed Siliciclastic–Carbonate Rocks before and after Acidification. Energies 2020, 13, 1338. [Google Scholar] [CrossRef] [Scilit]
- Rezaee, R. Synthesizing Nuclear Magnetic Resonance (NMR) Outputs for Clastic Rocks Using Machine Learning Methods, Examples from North West Shelf and Perth Basin, Western Australia. Energies 2022, 15, 518. [Google Scholar] [CrossRef] [Scilit]
- Tamoto, H.; Gioria, R.D.S.; Carneiro, C.D.C. Prediction of Nuclear Magnetic Resonance Porosity Well-Logs in a Carbonate Reservoir Using Supervised Machine Learning Models. J. Pet. Sci. Eng. 2023, 220, 111169. [Google Scholar] [CrossRef] [Scilit]
- Gu, Y.; Zhang, D.; Ruan, J.; Wang, Q.; Bao, Z.; Zhang, H. A new model for permeability prediction in appraisal of petroleum reserves. Prog. Geophys. 2022, 37, 588–599. [Google Scholar]
- Bishop, C.M. Pattern Recognition and Machine Learning; Information Science and Statistics; Springer: New York, NY, USA, 2006; ISBN 978-0-387-31073-2. [Google Scholar]
- Al-Anazi, A.F.; Gates, I.D. Support Vector Regression to Predict Porosity and Permeability: Effect of Sample Size. Comput. Geosci. 2012, 39, 64–76. [Google Scholar] [CrossRef] [Scilit]
- Bagheripour, P. Committee Neural Network Model for Rock Permeability Prediction. J. Appl. Geophys. 2014, 104, 142–148. [Google Scholar] [CrossRef] [Scilit]
- Anifowose, F.; Labadin, J.; Abdulraheem, A. Improving the Prediction of Petroleum Reservoir Characterization with a Stacked Generalization Ensemble Model of Support Vector Machines. Appl. Soft Comput. 2015, 26, 483–496. [Google Scholar] [CrossRef] [Scilit]
- Mahdaviara, M.; Rostami, A.; Keivanimehr, F.; Shahbazi, K. Accurate Determination of Permeability in Carbonate Reservoirs Using Gaussian Process Regression. J. Pet. Sci. Eng. 2021, 196, 107807. [Google Scholar] [CrossRef] [Scilit]
- Ben-Hur, A.; Horn, D.; Siegelmann, H.T.; Vapnik, V. Support Vector Clustering. J. Mach. Learn. Res. 2001, 2, 125–137. [Google Scholar] [CrossRef] [Scilit]
- Al-Bulushi, N.I.; King, P.R.; Blunt, M.J.; Kraaijveld, M. Artificial Neural Networks Workflow and Its Application in the Petroleum Industry. Neural Comput. Appl. 2012, 21, 409–421. [Google Scholar] [CrossRef] [Scilit]
- Mathew Nkurlu, B.; Shen, C.; Asante-Okyere, S.; Mulashani, A.K.; Chungu, J.; Wang, L. Prediction of Permeability Using Group Method of Data Handling (GMDH) Neural Network from Well Log Data. Energies 2020, 13, 551. [Google Scholar] [CrossRef] [Scilit]
- Huang, Z.; Shimeld, J.; Williamson, M.; Katsube, J. Permeability Prediction with Artificial Neural Network Modeling in the Venture Gas Field, Offshore Eastern Canada. Geophysics 1996, 61, 422–436. [Google Scholar] [CrossRef] [Scilit]
- Huang, X.B.; Zhang, Q.; Zhu, H.H.; Zhang, L.Y. An Estimated Method of Intact Rock Strength Using Gaussian Process Regression. In Proceedings of the 51st U.S. Rock Mechanics/Geomechanics Symposium, San Francisco, CA, USA, 25 June 2017; p. ARMA-2017-0125. [Google Scholar]
- Zhu, L.; Zhang, C.; Zhou, X.; Wei, Y.; Huang, Y.; Gao, Q. Nuclear magnetic resonance logging reservoir permeability prediction method based on deep belief network and kernel extreme learning machine algorithm. Comput. Appl. 2017, 37, 3034–3038. [Google Scholar]
- Zhang, G.; Wang, Z.; Mohaghegh, S.; Lin, C.; Sun, Y.; Pei, S. Pattern Visualization and Understanding of Machine Learning Models for Permeability Prediction in Tight Sandstone Reservoirs. J. Pet. Sci. Eng. 2021, 200, 108142. [Google Scholar] [CrossRef] [Scilit]
- Huang, Y.; Feng, J.; Song, W.; Guan, Y.; Zhang, Z. Intelligent prediction of improved permeability in sandstone reservoirs combining NMR transverse relaxation time spectra with piezomercury data. Comput. Tech. Geophys. Geochem. Explor. 2020, 42, 338–344. [Google Scholar]
- Xu, H.; Li, C.; Fan, Y.; Hu, F.; Yu, J.; Zhou, J.; Wang, C.; Yang, C. A New Permeability Predictive Model Based on NMR Data for Sandstone Reservoirs. Arab. J. Geosci. 2020, 13, 1085. [Google Scholar] [CrossRef] [Scilit]
- Wang, Y. Research and Application of Machine Learning for Predicting Porosity. Master’s Thesis, China University of Petroleum, Beijing, China, 2020. [Google Scholar]
- Liu, Y.; Lu, Z.; Lv, J.; Xie, R. Application of Principal Component Analysis Method in Lithology Identification for Shale Formation. Fault Block Oil Gas Field 2017, 24, 360–363. [Google Scholar]
- Li, Y.; Wang, H.; Wang, M.; Lian, P.; Duan, T.; Ji, B. Automatic Identification of Carbonate Sedimentary Facies Based on PCA and KNN Using Logs. Well Logging Technol. 2017, 41, 41–57. [Google Scholar]
- Strang, G. Introduction to Linear Algebra; Wellesley-Cambridge Press: Wellesley, MA, USA, 2022. [Google Scholar]
- Chen, J.; Zhao, F.; Sun, Y.; Yin, Y. Improved XGBoost Model Based on Genetic Algorithm. Int. J. Comput. Appl. Technol. 2020, 62, 240. [Google Scholar] [CrossRef] [Scilit]
- Chen, T.; Guestrin, C. XGBoost: A Scalable Tree Boosting System. In Proceedings of the 22nd ACM SIGKDD International Conference on Knowledge Discovery and Data Mining, San Francisco, CA, USA, 13–17 August 2016; ACM Press: San Francisco, CA, USA, 2016; pp. 785–794. [Google Scholar]
- Pan, S.; Zheng, Z.; Guo, Z.; Luo, H. An Optimized XGBoost Method for Predicting Reservoir Porosity Using Petrophysical Logs. J. Pet. Sci. Eng. 2022, 208, 109520. [Google Scholar] [CrossRef] [Scilit]
- Hsu, H.-H.; Hsieh, C.-W. Feature Selection via Correlation Coefficient Clustering. J. Softw. 2010, 5, 1371–1377. [Google Scholar] [CrossRef] [Scilit]
- Ratnasingam, S.; Muñoz-Lopez, J. Distance Correlation-Based Feature Selection in Random Forest. Entropy 2023, 25, 1250. [Google Scholar] [CrossRef] [Scilit] [PubMed]
- Cohen, J. Statistical Power Analysis for the Behavioral Sciences, 2nd ed.; Erlbaum, L., Ed.; Associates: Hillsdale, NJ, USA, 1988; ISBN 978-0-8058-0283-2. [Google Scholar]
- Zhou, C.; Li, C.; Wang, C.; Hu, F. Logging Petrophysics and Evaluation of Complex Clastic Rock; Petroleum Industry Press: Beijing, China, 2013. [Google Scholar]
- Gang, A.; Bajwa, W.U. FAST-PCA: A Fast and Exact Algorithm for Distributed Principal Component Analysis. IEEE Trans. Signal Process 2022, 70, 6080–6095. [Google Scholar] [CrossRef] [Scilit]
- Park, K.-Y.; Woo, D.-O. PMV Dimension Reduction Utilizing Feature Selection Method: Comparison Study on Machine Learning Models. Energies 2023, 16, 2419. [Google Scholar] [CrossRef] [Scilit]
- Bentéjac, C.; Csörgő, A.; Martínez-Muñoz, G. A Comparative Analysis of Gradient Boosting Algorithms. Artif. Intell. Rev. 2021, 54, 1937–1967. [Google Scholar] [CrossRef] [Scilit]
- Caruana, R.; Niculescu-Mizil, A. An Empirical Comparison of Supervised Learning Algorithms. In Proceedings of the 23rd International Conference on Machine Learning—ICML ’06, Pittsburgh, PA, USA, 25–29 June 2006; ACM Press: Pittsburgh, PA, USA, 2006; pp. 161–168. [Google Scholar]

Disclaimer/Publisher’s Note: The statements, opinions and data contained in all publications are solely those of the individual author(s) and contributor(s) and not of MDPI and/or the editor(s). MDPI and/or the editor(s) disclaim responsibility for any injury to people or property resulting from any ideas, methods, instructions or products referred to in the content. |
© 2024 by the authors. Licensee MDPI, Basel, Switzerland. This article is an open access article distributed under the terms and conditions of the Creative Commons Attribution (CC BY) license (https://creativecommons.org/licenses/by/4.0/).