
A Review on Digital Twins and Its Application in the Modeling of Photovoltaic Installations


 , ,
, , 
Abstract
1. Introduction
- (1)
- Study and describe the term Digital Twin, its parts and how it functions;
- (2)
- Analyse the different applications and use of Digital Twins, summarising the significant tools that could be interesting for this study;
- (3)
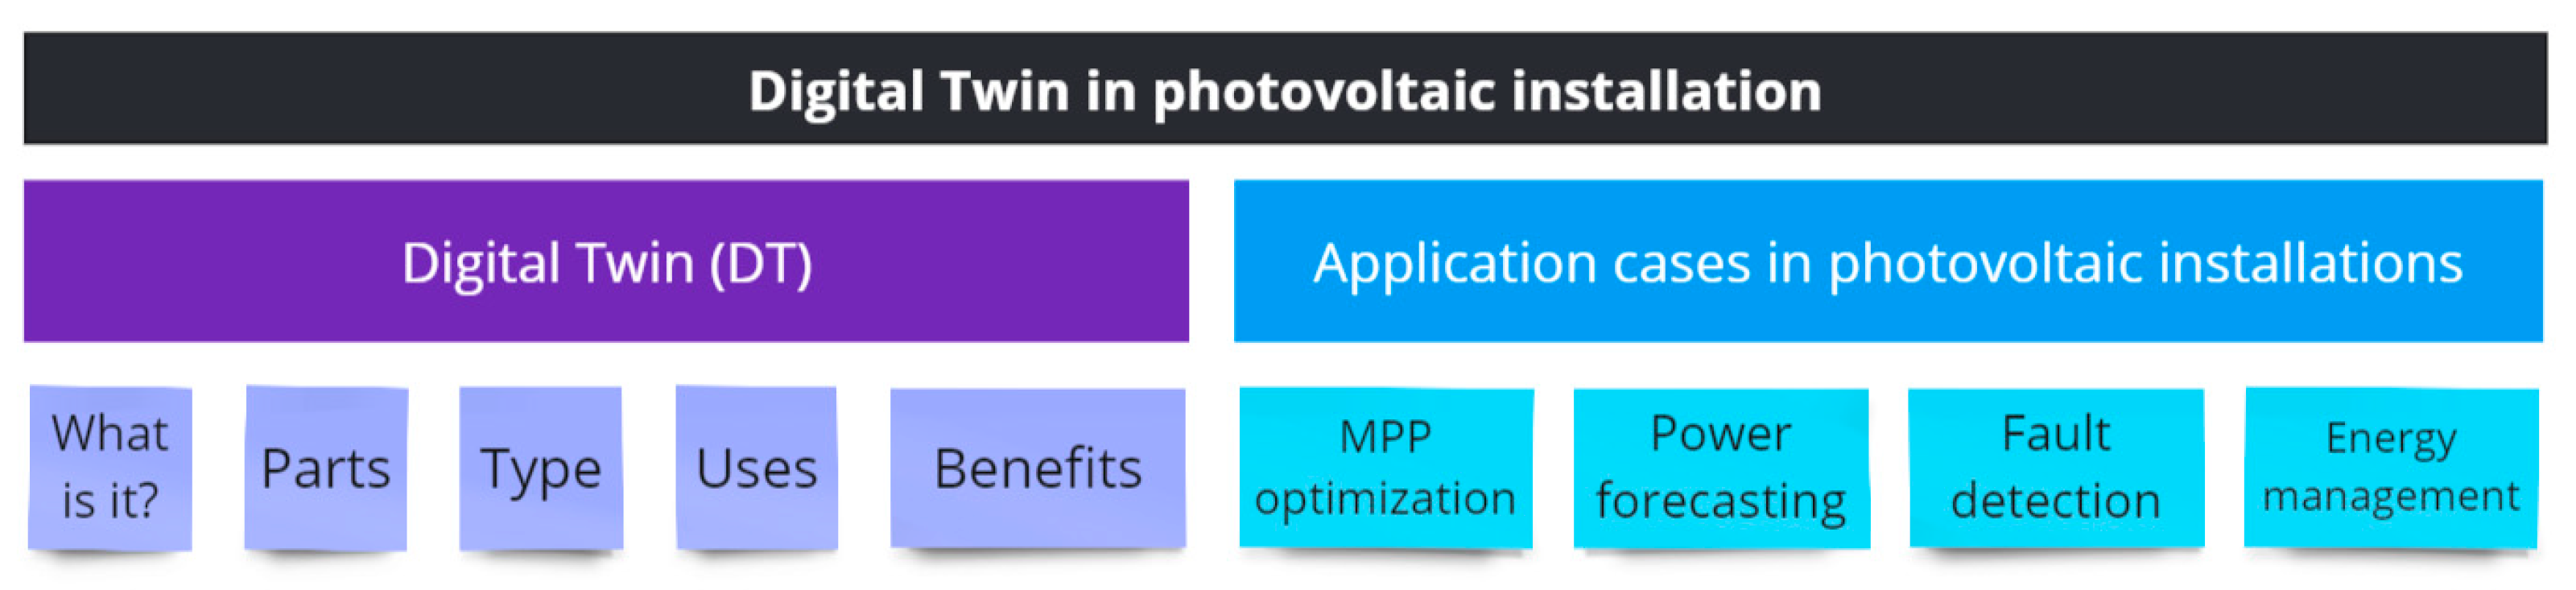
- Analyse and compare studies in which Digital Twins have been applied to photovoltaic installations. An outline of the objectives of this article can be seen in Figure 1.
2. Materials and Methods
2.1. Classification Criteria
2.2. Methodology
3. The Digital Twin (DT)
3.1. The Digital Twin Concept
- Digital Process Twin. The term Digital Process Twin is used when the physical model in the real environment is a manufacturing process. In this way, the DT of a process can predict the operation of the manufacturing process, thus detecting possible faults. This facilitates preventive maintenance, knowing the right time to carry it out.
- Digital Product Twin. This is a digital representation of a given product, so that manufacturers can predict the product’s lifecycle and optimise the performance of their products before producing the product. This translates into cost savings.
- System Digital Twin. In this case, the characteristics of the two types seen above are encompassed. To create the DT, a large amount of data is needed on how the system works, what the system’s devices produce and what the system produces in general.
3.2. Physical Model or Real System
3.3. Data Exchange
4. Digital Twin Applications
4.1. The Digital Twin in Agriculture
4.2. Digital Twin in the Food Industry
4.3. Digital Twin in Photovoltaic Systems
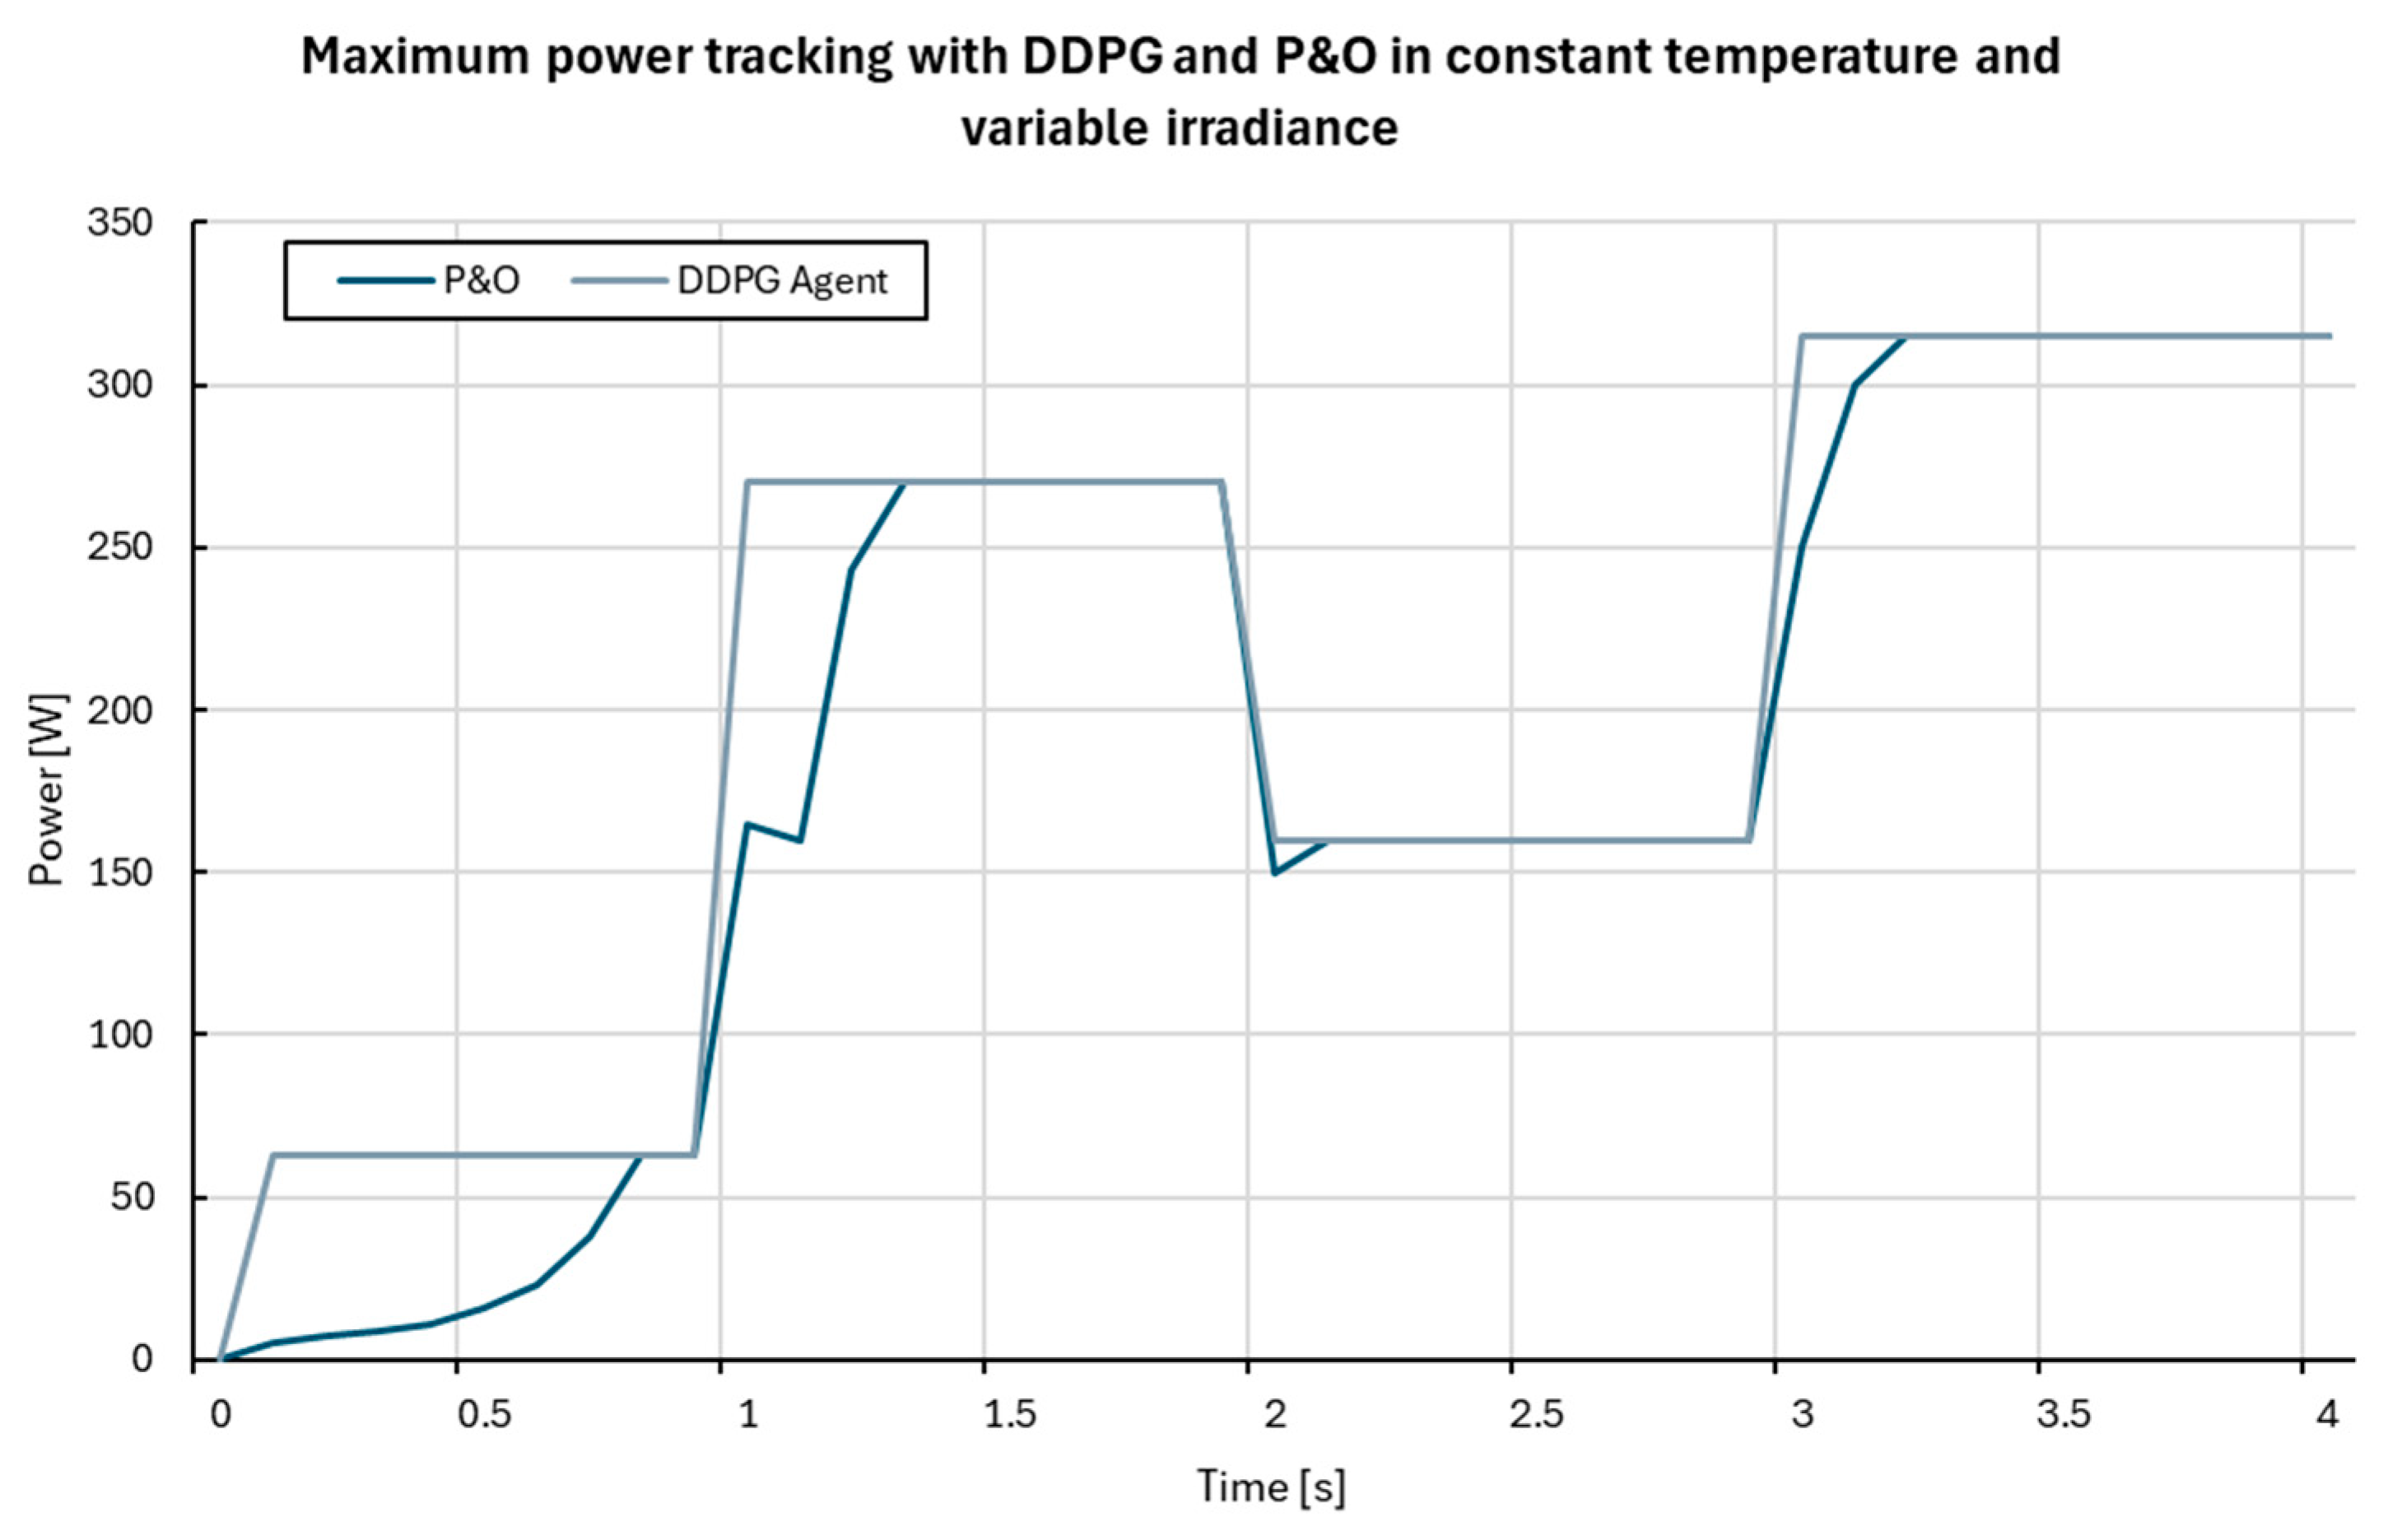
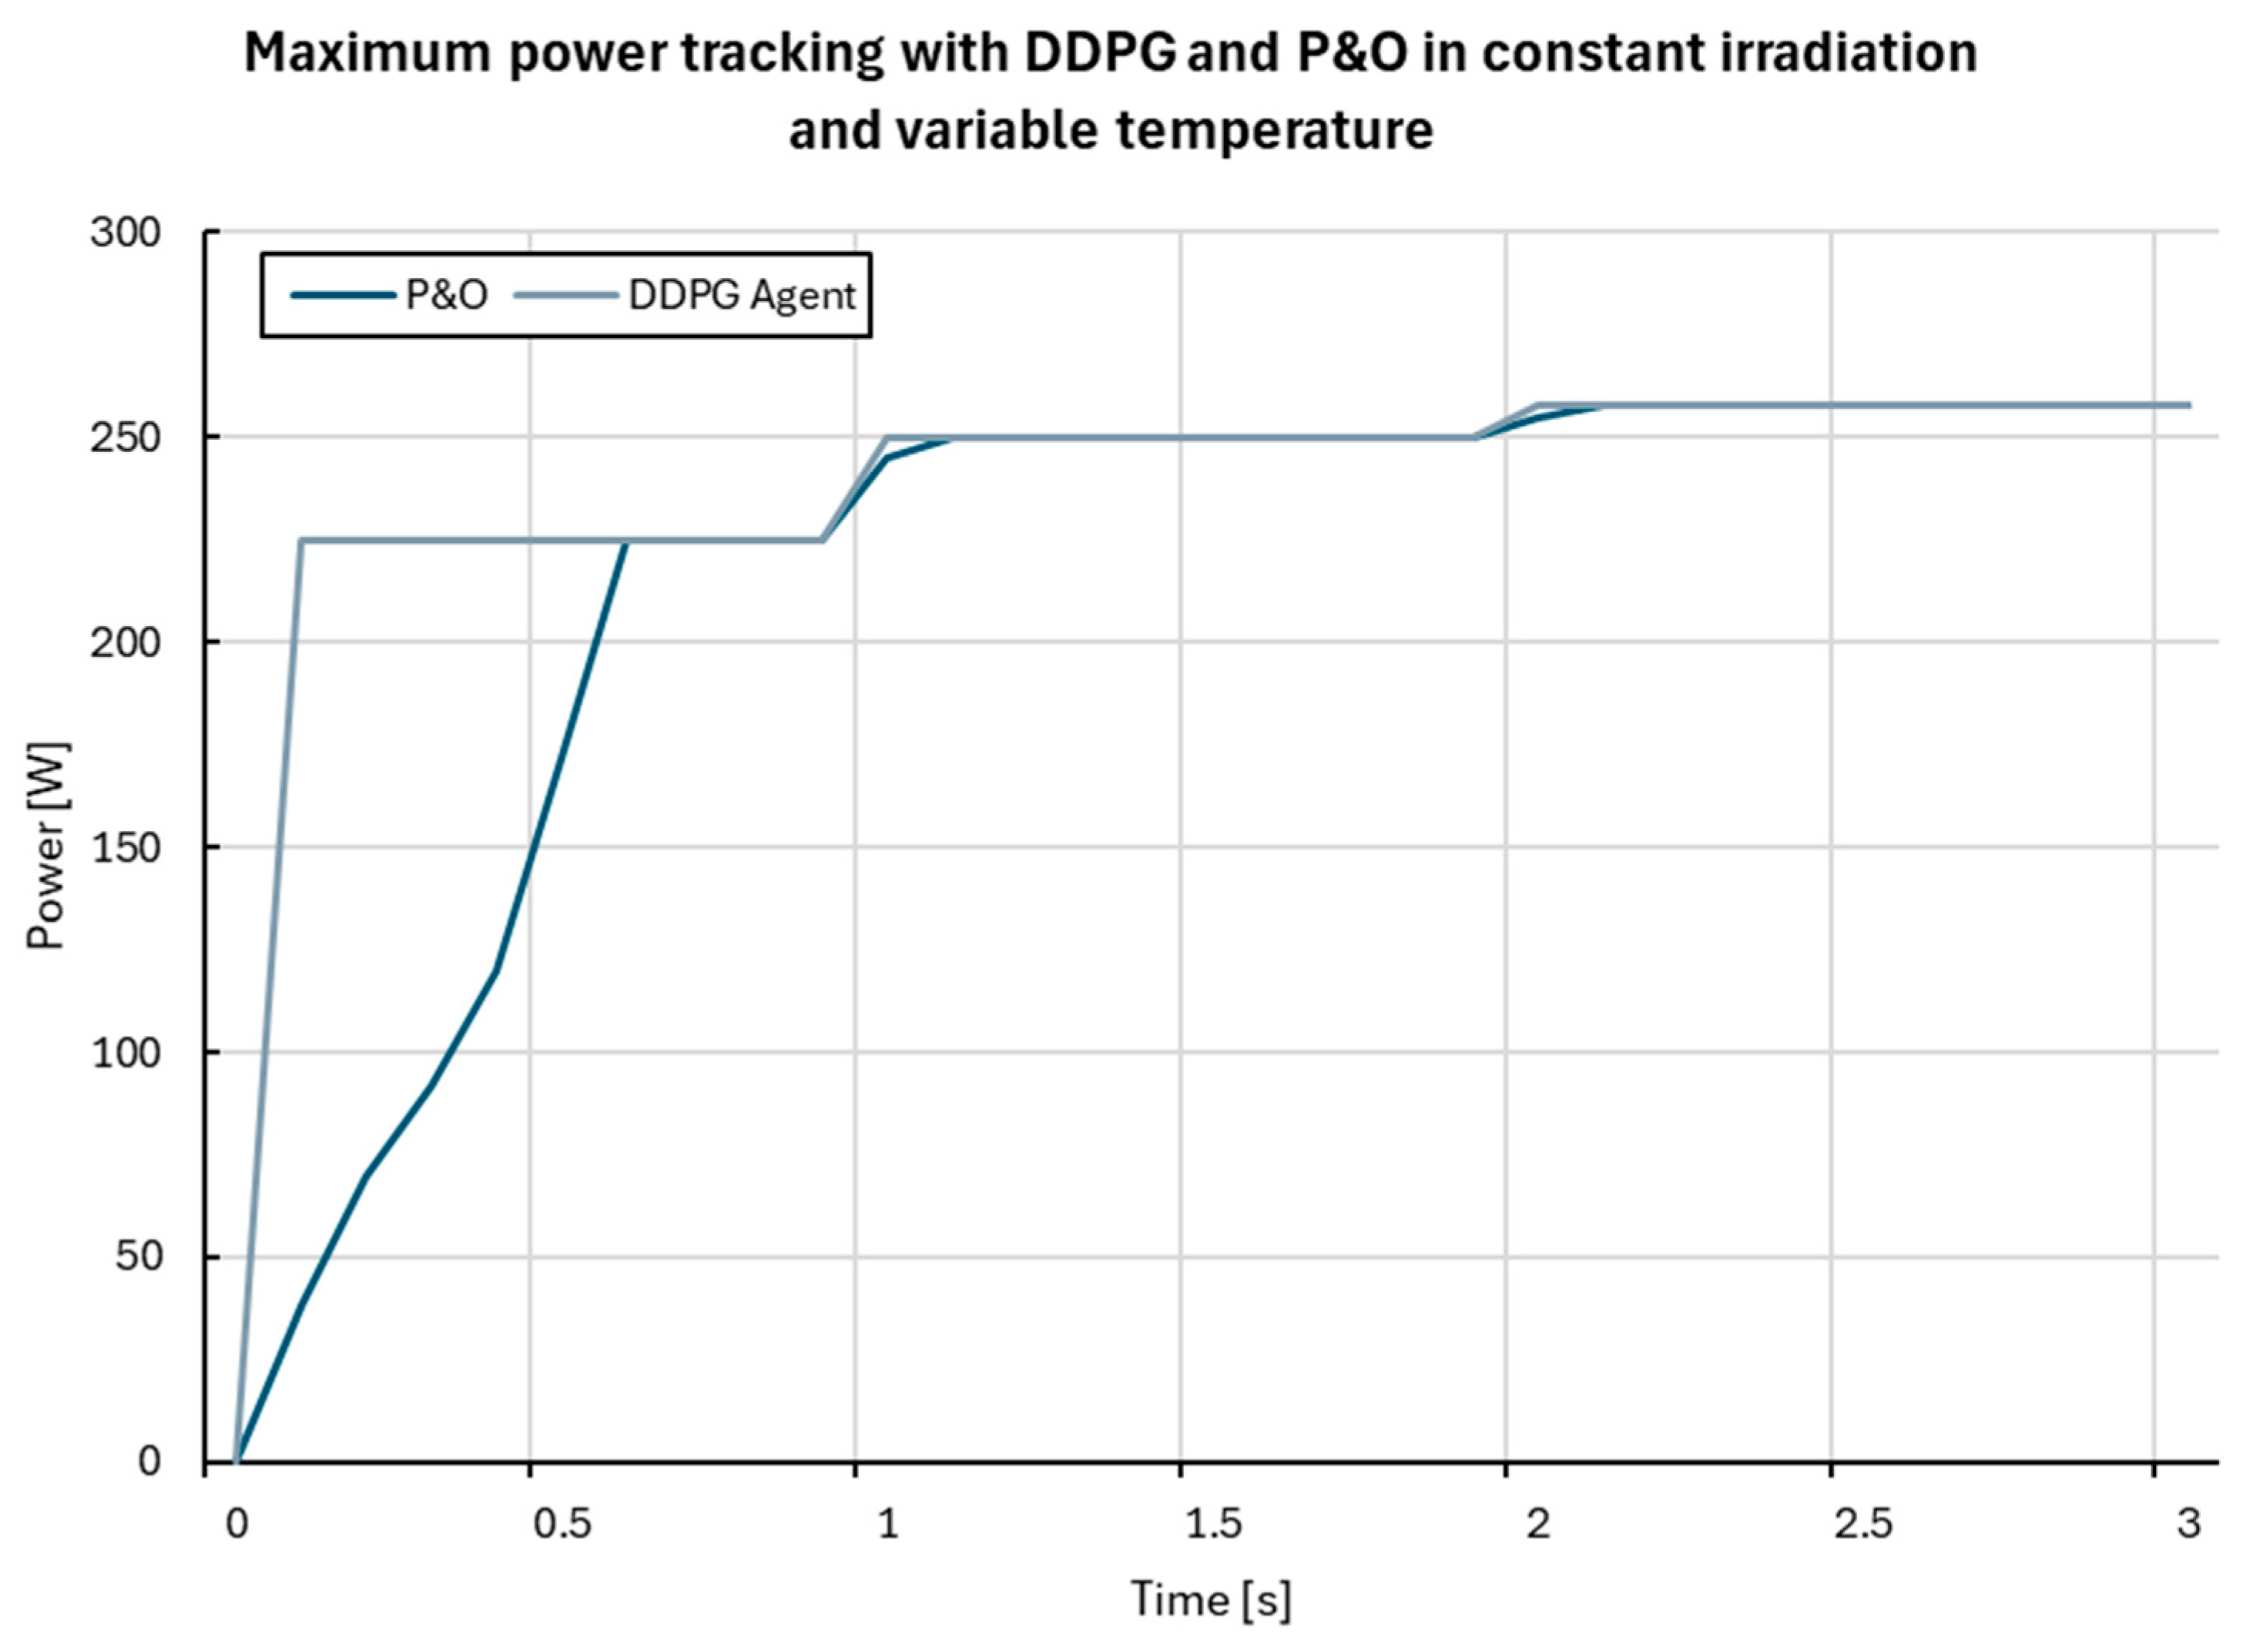
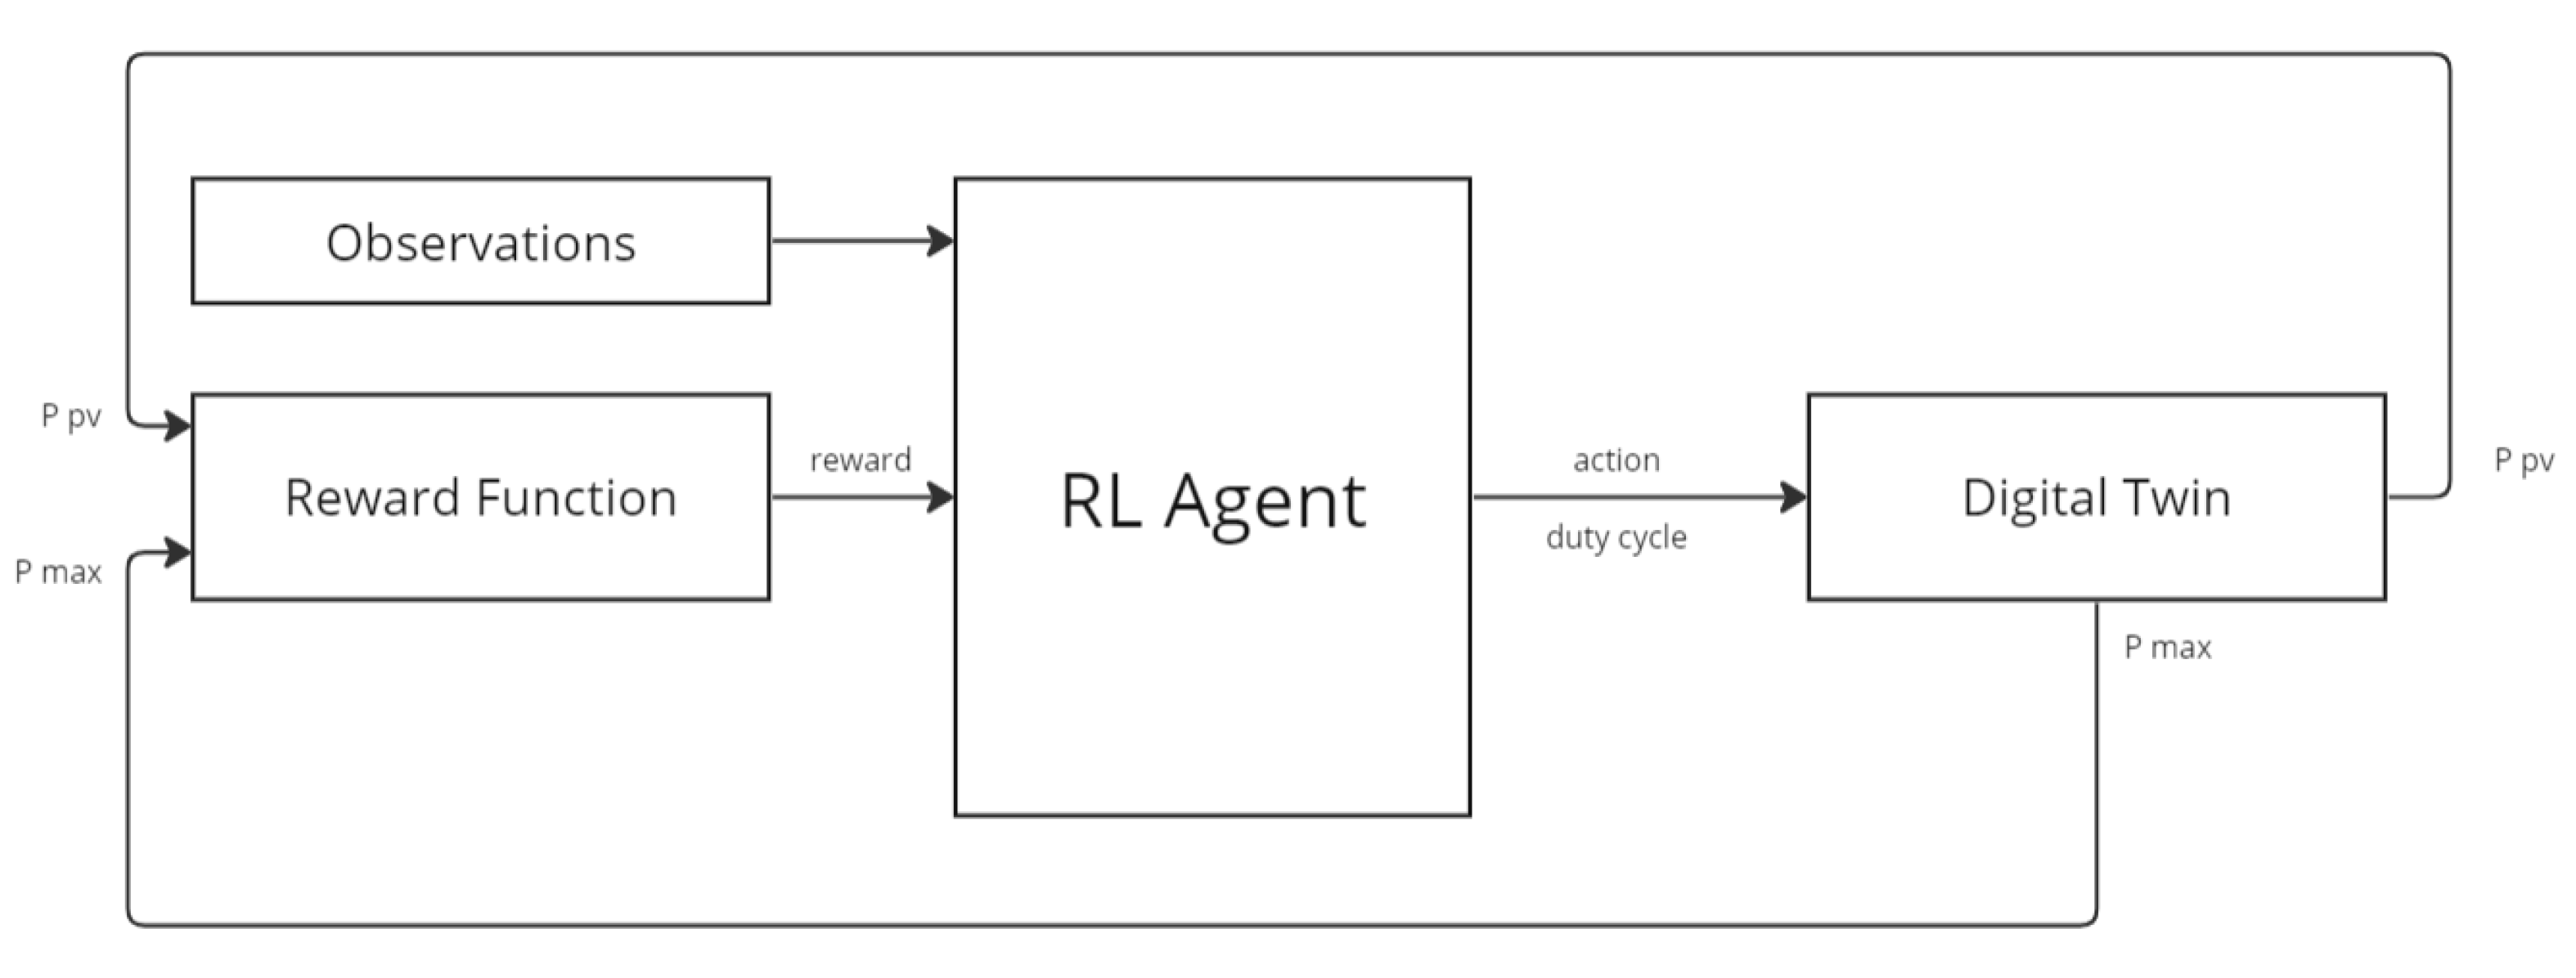
4.3.1. Optimisation of the Search for the Maximum Power Point
Maximum Power Point Search (MPP)
Digital Twin (DT) Model
Simulation
Testing in a Real Environment
Results
4.3.2. Power Prediction
Digital Twin (DT) Model
Simulation
Results
4.3.3. Energy Management in Buildings
Digital Twin (DT) Model
Simulation
Testing in a Real Environment
Results
4.3.4. Fault Detection in Distributed Photovoltaic Systems
Digital Twin (DT) Model
Simulation
Testing in a Real Environment
Results
5. Conclusions
Author Contributions
Funding
Data Availability Statement
Acknowledgments
Conflicts of Interest
Nomenclature
| MPPT | Maximum Power Point Tracking |
| PMPP | Maximum PV module power |
| P&O | Perturb and Observe |
| MPPT | Maximum Power Point Tracking |
| RCC | Ripple Correlation Control |
| PSO | Particle Swarm Optimization |
| EOA | Earthquake Optimization Algorithm |
| InCond | Incremental Conductance Algorithms |
| RL | Reinforcement Learning |
| RL-QT | Table Q |
| RL-QN | Network Q |
| DDPG | Deep Deterministic Policy Gradient |
| MSE | Mean square error |
| MAE | Mean absolute root mean square error |
| RMSE | Radical root mean square error |
| LSTM | Long Short-Term Memory |
| GWOA | Grey Wolf Optimisation Algorithm |
| ConvMixer | Convolutional mixer |
| LoRa | Long Range Notification |
| MTF | Markov Transition |
| ML | Machine Learning |
| DNN | Deep Neural Networks |
| RF | Random Forest |
References
- International Renewable Energy Agency; Global Renewables Alliance. Global Renewables Alliance Tripling Renewable Power and Doubling Energy Efficiency by 2030 Crucial Steps towards 1.5 °C. [Online]. Available online: www.globalrenewablesalliance.org/ (accessed on 10 February 2024).
- Liu, X.; Jiang, D.; Tao, B.; Xiang, F.; Jiang, G.; Sun, Y.; Kong, J.; Li, G. A systematic review of digital twin about physical entities, virtual models, twin data, and applications. Adv. Eng. Inform. 2023, 55, 101876. [Google Scholar] [CrossRef]
- Ramírez, M. Digital twins: The road to the transformation of the industrial sector. Técnica Ind. 2023, 336, 6–7. Available online: https://www.tecnicaindustrial.es/gemelos-digitales-el-camino-hacia-la-transformacion-del-sector-industrial/ (accessed on 17 February 2024).
- Saracco, R. Digital Twins: Bridging Physical Space and Cyberspace. Computer 2019, 52, 58–64. [Google Scholar] [CrossRef]
- Arnautova, Y. If You Build Products, You Should Be Using Digital Twins. [Online]. Available online: https://www.globallogic.com/insights/blogs/if-you-build-products-you-should-be-using-digital-twins/ (accessed on 18 February 2024).
- El Bazi, N.; Mabrouki, M.; Laayati, O.; Ouhabi, N.; El Hadraoui, H.; Hammouch, F.E.; Chebak, A. Generic Multi-Layered Digital-Twin-Framework-Enabled Asset Lifecycle Management for the Sustainable Mining Industry. Sustainability 2023, 4, 3470. [Google Scholar] [CrossRef]
- Conroy, M. Modeling, Simulation, Information Technology and Processing Roadmap. 2010. [Online]. Available online: https://www.researchgate.net/publication/280310295 (accessed on 10 February 2024).
- Grieves, M. Digital Twin: Manufacturing Excellence through Virtual Factory Replication. [Online]. Available online: https://www.researchgate.net/publication/275211047 (accessed on 10 February 2024).
- Wu, Y.; Zhou, L.; Zheng, P.; Sun, Y.; Zhang, K. A digital twin-based multidisciplinary collaborative design approach for complex engineering product development. Adv. Eng. Inform. 2022, 52, 101635. [Google Scholar] [CrossRef]
- Liu, M.; Fang, S.; Dong, H.; Xu, C. Review of digital twin about concepts, technologies, and industrial applications. J. Manuf. Syst. 2021, 58, 346–361. [Google Scholar] [CrossRef]
- Sepasgozar, S.M.E. Differentiating digital twin from digital shadow: Elucidating a paradigm shift to expedite a smart, sustainable built environment. Buildings 2021, 11, 151. [Google Scholar] [CrossRef]
- Fuller, A.; Fan, Z.; Day, C.; Barlow, C. Digital Twin: Enabling Technologies, Challenges and Open Research. IEEE Access 2020, 8, 108952–108971. [Google Scholar] [CrossRef]
- Sepasgozar, S.M.E. Digital twin and web-based virtual gaming technologies for online education: A case of construction management and engineering. Appl. Sci. 2020, 10, 4678. [Google Scholar] [CrossRef]
- Errandonea, I.; Beltrán, S.; Arrizabalaga, S. Digital Twin for maintenance: A literature review. Comput. Ind. 2020, 123, 103316. [Google Scholar] [CrossRef]
- Yu, G.; Zhang, S.; Hu, M.; Wang, Y.K. Prediction of highway tunnel tunnel pavement performance based on digital twin and multiple time series stacking. Adv. Civil. Eng. 2020, 2020, 8824135. [Google Scholar] [CrossRef]
- Alam, K.M.; El Saddik, A. C2PS: A digital twin architecture reference model for the cloud-based cyber-physical systems. IEEE Access 2017, 5, 2050–2062. [Google Scholar] [CrossRef]
- Mostafa, F.; Tao, L.; Yu, W. An effective architecture of digital twin system to support human decision making and AI-driven autonomy. In Concurrency and Computation: Practice and Experience; John Wiley and Sons Ltd.: Hoboken, NJ, USA, 2021. [Google Scholar] [CrossRef]
- Onile, A.E.; Machlev, R.; Petlenkov, E.; Levron, Y.; Belikov, J. Uses of the digital twins concept for energy services, intelligent recommendation systems, and demand side management: A review. Energy Rep. 2021, 7, 997–1015. [Google Scholar] [CrossRef]
- Stark, R.; Kind, S.; Neumeyer, S. Innovations in digital modelling for next generation manufacturing system design. CIRP Ann Manuf Technol 2017, 66, 169–172. [Google Scholar] [CrossRef]
- Brosinsky, C.; Westermann, D.; Krebs, R. Recent and prospective developments in power system control centers: Adapting the digital twin technology for application in power system control centers. In Proceedings of the 2018 IEEE International Energy Conference (ENERGYCON), Limassol, Cyprus, 3–7 June 2018. [Google Scholar]
- Lee, J.; Azamfar, M.; Singh, J.; Siahpour, S. Integration of digital twin and deep learning in cyber-physical systems: Towards smart manufacturing. IET Collab. Intell. Manuf. 2020, 2, 34–36. [Google Scholar] [CrossRef]
- Yalçin, T.; Solà, P.P.; Stefanidou-Voziki, P.; Domínguez-García, J.L.; Demirdelen, T. Exploiting Digitalization of Solar PV Plants Using Machine Learning: Digital Twin Concept for Operation. Energies 2023, 16, 5044. [Google Scholar] [CrossRef]
- Han’guk Chŏngbo Kwahakhoe; Institute of Electrical and Electronics Engineers; IEEE Computer Society; Denshi Jōhō Tsūshin Gakkai (Japan) Tsūshin Sosaieti; Han’guk T’ongsin Hakhoe. The 34th International Conference on Information Networking (ICOIN 2020), Barcelona, Spain, 7–10 January 2020; AC Hotel Barcelona Forum: Barcelona, Spain, 2020. [Google Scholar]
- Castiglione, F.; Vergara, S.; Ramirez, G. Python software to monitor NCRE generation systems. In Proceedings of the 2021 IEEE CHILEAN Conference on Electrical, Electronics Engineering, Information and Communication Technologies, CHILECON 2021, Valparaíso, Chile, 6–9 December 2021; Institute of Electrical and Electronics Engineers Inc.: Piscataway, NJ, USA, 2021. [Google Scholar] [CrossRef]
- Global IT Research Institute; IEEE Communications Society; Institute of Electrical and Electronics Engineers. The 21st International Conference on Advanced Communications Technology: “ICT for 4th Industrial Revolution!”: ICACT 2019, Phoenix Park, Pyeongchang, Republic of Korea, 17–20 February 2019; IEEE: Piscataway, NJ, USA, 2019. [Google Scholar]
- RVS Technical Campus; IEEE Electron Devices Society; Institute of Electrical and Electronics Engineers. The Second International Conference on Electronics, Communication and Aerospace Technology (ICECA 2018), Coimbatore, India, 29–31 May 2018; IEEE: Piscataway, NJ, USA, 2018. [Google Scholar]
- Moghimi, M.; Bennett, C.; Leskarac, D.; Stegen, S.; Lu, J. Communication Architecture and Data Acquisition for Experimental MicroGrid Installations. In Proceedings of the 2015 IEEE PES Asia-Pacific Power and Energy Engineering Conference (APPEEC), Brisbane, QLD, Australia, 15–18 November 2015. [Google Scholar]
- Ariesen-Verschuur, N.; Verdouw, C.; Tekinerdogan, B. Digital Twins in greenhouse horticulture: A review. Comput. Electron. Agric. 2022, 199, 107183. [Google Scholar] [CrossRef]
- Kampker, A.; Stich, V.; Jussen, P.; Moser, B.; Kuntz, J. Business models for industrial smart services—The example of a digital twin for a product-service-system for potato harvesting. Procedia CIRP 2019, 83, 534–540. [Google Scholar] [CrossRef]
- Verboven, P.; Defraeye, T.; Datta, A.K.; Nicolai, B. Digital twins of food process operations: The next step for food process models? Curr. Opin. Food Sci. 2020, 35, 79–87. [Google Scholar] [CrossRef]
- OpenEMS Association, e.V. Open Energy Management System. [Online]. Available online: https://openems.github.io/openems.io/openems/latest/introduction.html (accessed on 10 June 2023).
- Yuan, G.; Xie, F. Digital Twin-Based economic assessment of solar energy in smart microgrids using reinforcement learning technique. Sol. Energy 2023, 250, 398–408. [Google Scholar] [CrossRef]
- Al-Isawi, O.A.; Amirah, L.H.; Al-Mufti, O.A.; Ghenai, C. Digital Twinning and LSTM-based Forecasting Model of Solar PV Power Output. In Proceedings of the 2023 Advances in Science and Engineering Technology International Conferences, ASET 2023, Dubai, United Arab Emirates, 21–24 February 2022; Institute of Electrical and Electronics Engineers Inc.: Piscataway, NJ, USA, 2023. [Google Scholar] [CrossRef]
- Xu, Y.; Sun, Y.; Liu, X.; Zheng, Y. A Digital-Twin-Assisted Fault Diagnosis Using Deep Transfer Learning. IEEE Access 2019, 7, 19990–19999. [Google Scholar] [CrossRef]
- Jain, P.; Poon, J.; Singh, J.P.; Spanos, C.; Sanders, S.R.; Panda, S.K. A digital twin approach for fault diagnosis in distributed photovoltaic systems. IEEE Trans. Power Electron. 2020, 35, 940–956. [Google Scholar] [CrossRef]
- Hong, Y.Y.; Pula, R.A. Diagnosis of PV faults using digital twin and convolutional mixer with LoRa notification system. Energy Rep. 2023, 9, 1963–1976. [Google Scholar] [CrossRef]
- Wang, K.; Ma, J.; Wang, J.; Xu, B.; Tao, Y.; Man, K.L. Digital Twin based Maximum Power Point Estimation for Photovoltaic Systems. In Proceedings of the International SoC Design Conference 2022, ISOCC 2022, Gangneung-si, Republic of Korea, 19–22 October 2022; Institute of Electrical and Electronics Engineers Inc.: Piscataway, NJ, USA, 2022; pp. 189–190. [Google Scholar] [CrossRef]
- Artetxe, E.; Uralde, J.; Barambones, O.; Calvo, I.; Martin, I. Maximum Power Point Tracker Controller for Solar Photovoltaic Based on Reinforcement Learning Agent with a Digital Twin. Mathematics 2023, 11, 2166. [Google Scholar] [CrossRef]
- Delussu, F.; Manzione, D.; Meo, R.; Ottino, G.; Asare, M. Experiments and Comparison of Digital Twinning of Photovoltaic Panels by Machine Learning Models and a Cyber-Physical Model in Modelica. IEEE Trans. Ind. Inf. 2022, 18, 4018–4028. [Google Scholar] [CrossRef]
- Wang, Y.; Qi, Y.; Li, J.; Huan, L.; Li, Y.; Xie, B.; Wang, Y. The Wind and Photovoltaic Power Forecasting Method Based on Digital Twins. Appl. Sci. 2023, 13, 8374. [Google Scholar] [CrossRef]
- Luis J., R.C.; José A., B.J.; Ian M., S.T.; Jesús H., M.L. Study of the Maximum Power Point Tracking Algorithm Perturb and Observe. RIEE&C 2010, 8, 17–23. [Google Scholar]
- Femia, N.; Petrone, G.; Spagnuolo, G.; Vitelli, M. Optimizing Duty-cycle Perturbation of P&O MPPT Technique. In Proceedings of the 2004 IEEE 35th Annual Power Electronics Specialists Conference, Aachen, Germany, 20–25 June 2004. [Google Scholar]
- Esram, T.; Chapman, P.L. Comparison of photovoltaic array maximum power point tracking techniques. IEEE Trans. Energy Convers. 2007, 22, 439–449. [Google Scholar] [CrossRef]
- Esram, T.; Kimball, J.W.; Krein, P.T.; Chapman, P.L.; Midya, P. Dynamic maximum power point tracking of photovoltaic arrays using ripple correlation control. IEEE Trans. Power Electron. 2006, 21, 1282–1290. [Google Scholar] [CrossRef]
- Kouta, J.; El-Ali, A.; Moubayed, N.; Outbib, R. Improving the incremental conductance control method of a solar energy conversion system. Renew. Energy Power Qual. J. 2008, 1, 273–276. [Google Scholar] [CrossRef]
- Femia, N.; Petrone, G.; Spagnuolo, G.; Vitelli, M. Optimization of perturb and observe maximum power point tracking method. IEEE Trans. Power Electron. 2005, 20, 963–973. [Google Scholar] [CrossRef]
- Ko, J.S.; Huh, J.H.; Kim, J.C. Overview of maximum power point tracking methods for PV system in micro grid. Electronics 2020, 9, 816. [Google Scholar] [CrossRef]
- Ahmed, J.; Salam, Z. An Enhanced Adaptive P&O MPPT for Fast and Efficient Tracking Under Varying Environmental Conditions. IEEE Trans. Sustain. Energy 2018, 9, 1487–1496. [Google Scholar] [CrossRef]
- Macaulay, J.; Zhou, Z. A fuzzy logical-based variable step size P&O MPPT algorithm for photovoltaic system. Energies 2018, 11, 1340. [Google Scholar] [CrossRef]
- Farhat, M.; Barambones, O.; Sbita, L. A real-time implementation of novel and stable variable step size MPPT. Energies 2020, 13, 4668. [Google Scholar] [CrossRef]
- Mendez, E.; Ortiz, A.; Ponce, P.; Macias, I.; Balderas, D.; Molina, A. Improved MPPT algorithm for photovoltaic systems based on the earthquake optimization algorithm. Energies 2020, 13, 3047. [Google Scholar] [CrossRef]
- Ajani, T.S.; Imoize, A.L.; Atayero, A.A. An overview of machine learning within embedded and mobile devices-optimizations and applications. Sensors 2021, 21, 4412. [Google Scholar] [CrossRef] [PubMed]
- Li, C.; Chen, Y.; Zhou, D.; Liu, J.; Zeng, J. A high-performance adaptive incremental conductance MPPT algorithm for photovoltaic systems. Energies 2016, 9, 288. [Google Scholar] [CrossRef]
- Kofinas, P.; Doltsinis, S.; Dounis, A.I.; Vouros, G.A. A reinforcement learning approach for MPPT control method of photovoltaic sources. Renew. Energy 2017, 108, 461–473. [Google Scholar] [CrossRef]
- Chou, K.Y.; Yang, S.T.; Chen, Y.P. Maximum power point tracking of photovoltaic system based on reinforcement learning. Sensors 2019, 19, 5054. [Google Scholar] [CrossRef] [PubMed]
- Phan, B.C.; Lai, Y.C.; Lin, C.E. A deep reinforcement learning-based MPPT control for PV systems under partial shading condition. Sensors 2020, 20, 3039. [Google Scholar] [CrossRef] [PubMed]
- Nicola, M.; Nicola, C.I.; Selișteanu, D. Improvement of the Control of a Grid Connected Photovoltaic System Based on Synergetic and Sliding Mode Controllers Using a Reinforcement Learning Deep Deterministic Policy Gradient Agent. Energies 2022, 15, 2392. [Google Scholar] [CrossRef]
- Humada, A.M.; Hojabri, M.; Mekhilef, S.; Hamada, H.M. Solar cell parameters extraction based on single and double-diode models: A review. Renew. Sustain. Energy Rev. 2016, 56, 494–509. [Google Scholar] [CrossRef]
- Wang, K.; Ma, J.; Man, K.L.; Huang, K.; Huang, X. Sim-to-Real Transfer with Domain Randomization for Maximum Power Point Estimation of Photovoltaic Systems. In Proceedings of the 21st IEEE International Conference on Environment and Electrical Engineering and 2021 5th IEEE Industrial and Commercial Power System Europe, EEEIC/I and CPS Europe 2021, Bari, Italy, 7–10 September 2021; Institute of Electrical and Electronics Engineers Inc.: Piscataway, NJ, USA, 2021. [Google Scholar] [CrossRef]
- Wang, K.; Ma, J.; Man, K.L.; Hong, D.; Huang, K.; Huang, X. Real-time Modeling of Photovoltaic Strings under Partial Shading Conditions. In Proceedings of the 2021 IEEE 10th Data Driven Control and Learning Systems Conference, DDCLS 2021, Suzhou, China, 14–16 May 2021; Institute of Electrical and Electronics Engineers Inc.: Piscataway, NJ, USA, 2021; pp. 1345–1349. [Google Scholar] [CrossRef]
- Lillicrap, T.P.; Hunt, J.J.; Pritzel, A.; Heess, N. Continuous Control with Deep Reinforcement Learning. 2015. [Online]. Available online: https://www.researchgate.net/publication/281670459 (accessed on 5 January 2024).
- Raj, A.; Gupta, M. Numerical Simulation and Performance Assessment of ANN-INC Improved Maximum Power Point Tracking System for Solar Photovoltaic System Under Changing Irradiation Operation. 2021. [Online]. Available online: http://annalsofrscb.ro790 (accessed on 5 January 2024).
- Fang, X.; Misra, S.; Xue, G.; Yang, D. Smart grid—The new and improved power grid: A survey. IEEE Commun. Surv. Tutor. 2012, 14, 944–980. [Google Scholar] [CrossRef]
- Pombo, D.V.; Bacher, P.; Ziras, C.; Bindner, H.W.; Spataru, S.V.; Sørensen, P.E. Benchmarking physics-informed machine learning-based short term PV-power forecasting tools. Energy Rep. 2022, 8, 6512–6520. [Google Scholar] [CrossRef]
- Cordeiro-Costas, M.; Villanueva, D.; Eguía-Oller, P.; Granada-Álvarez, E. Machine Learning and Deep Learning Models Applied to Photovoltaic Production Forecasting. Appl. Sci. 2022, 12, 8769. [Google Scholar] [CrossRef]
- Muzaffar, S.; Afshari, A. Short-term load forecasts using LSTM networks. Energy Procedia 2019, 158, 2922–2927. [Google Scholar] [CrossRef]
- Choi, H.; Ryu, S.; Kim, H. Short-Term Load Forecasting based on ResNet and LSTM. In Proceedings of the 2018 IEEE International Conference on Communications, Control, and Computing Technologies for Smart Grids, SmartGridComm 2018, Aalborg, Denmark, 29–31 October 2018; Institute of Electrical and Electronics Engineers Inc.: Piscataway, NJ, USA, 2018. [Google Scholar] [CrossRef]
- Tian, Y.; Wang, D.; Zhou, G.; Wang, J.; Zhao, S.; Ni, Y. An Adaptive Hybrid Model for Wind Power Prediction Based on the IVMD-FE-Ad-Informer. Entropy 2023, 25, 647. [Google Scholar] [CrossRef]
- Poczeta, K.; Papageorgiou, E.I. Energy Use Forecasting with the Use of a Nested Structure Based on Fuzzy Cognitive Maps and Artificial Neural Networks. Energies 2022, 15, 7542. [Google Scholar] [CrossRef]
- Dranka, G.G.; Ferreira, P.; Vaz, A.I.F. Integrating supply and demand-side management in renewable-based energy systems. Energy 2021, 232, 120978. [Google Scholar] [CrossRef]
- Dabbaghjamanesh, M.; Moeini, A.; Kavousi-Fard, A. Reinforcement Learning-Based Load Forecasting of Electric Vehicle Charging Station Using Q-Learning Technique. IEEE Trans. Ind. Inf. 2021, 17, 4229–4237. [Google Scholar] [CrossRef]
- Chen, H.; Li, Y.; Louie, R.H.Y.; Vucetic, B. Autonomous demand side management based on energy consumption scheduling and instantaneous load billing: An aggregative game approach. IEEE Trans. Smart Grid 2014, 5, 1744–1754. [Google Scholar] [CrossRef]
- Ma, T.; Pei, W.; Xiao, H.; Kong, L.; Mu, Y.; Pu, T. The energy management strategies based on dynamic energy pricing for community integrated energy system considering the interactions between suppliers and users. Energy 2020, 211, 118677. [Google Scholar] [CrossRef]
- Veras, J.M.; Silva, I.R.S.; Pinheiro, P.R.; Rabêlo, R.A.L.; Veloso, A.F.S.; Borges, F.A.S.; Rodrigues, J.J.P.C. A multi-objective demand response optimization model for scheduling loads in a home energy management system. Sensors 2018, 18, 3207. [Google Scholar] [CrossRef] [PubMed]
- Lu, Q.; Lü, S.; Leng, Y.; Zhang, Z. Optimal household energy management based on smart residential energy hub considering uncertain behaviors. Energy 2020, 195, 117052. [Google Scholar] [CrossRef]
- Li, W.; Cheng, D.; Bian, R.; Ishak, S.; Osman, O.A. Accounting for travel time reliability, trip purpose and departure time choice in an agent-based dynamic toll pricing approach. IET Intell. Trans. Syst. 2018, 12, 58–65. [Google Scholar] [CrossRef]
- Bellinguer, K.; Girard, R.; Bontron, G.; Kariniotakis, G. A generic methodology to efficiently integrate weather information in short-term Photovoltaic generation forecasting models. Sol. Energy 2022, 244, 401–413. [Google Scholar] [CrossRef]
- Güngör, O.; Akşanlı, B.; Aydoğan, R. Algorithm selection and combining multiple learners for residential energy prediction. Future Gener. Comput. Syst. 2019, 99, 391–400. [Google Scholar] [CrossRef]
- Nasyrov, R.; Ṭulbah, M.F. Moscow Power Engineering Institute, IEEE Industry Applications Society, and Institute of Electrical and Electronics Engineers. In Proceedings of the 2nd 2020 International Youth Conference on Radio Electronics, Electrical and Power Engineering (REEPE), Moscow, Russia, 12–14 March 2020. [Google Scholar]
- Goel, V.; Weng, J.; Poupart, P. Unsupervised Video Object Segmentation for Deep Reinforcement Learning. arXiv 2018, arXiv:1805.07780. [Google Scholar]
- Zhu, L.; Huang, K.; Hu, Y.; Tai, X. A Self-Adapting Task Scheduling Algorithm for Container Cloud Using Learning Automata. IEEE Access 2021, 9, 81236–81252. [Google Scholar] [CrossRef]
- Chand Bansal, J.; Deep, K.; Nagar, A.K. Applications of Artificial Intelligence in Engineering, Proceedings of First Global Conference on Artificial Intelligence and Applications (GCAIA 2020); Algorithms for Intelligent Systems Series Editors; Springer: Singapore, 2021; [Online]; Available online: http://www.springer.com/series/16171 (accessed on 5 January 2024).
- Bazzi, A.M.; Kim, K.A.; Johnson, B.B.; Krein, P.T.; Dominguez-García, A. Fault impacts on solar power unit reliability. In Proceedings of the IEEE Applied Power Electronics Conference and Exposition—APEC 2011, Fort Worth, TX, USA, 6–10 March 2011; pp. 1223–1231. [Google Scholar] [CrossRef]
- Köntges, M. Assessment of Photovoltaic Module Failures in the Field; International Energy Agency: Paris, France, 2017. [Google Scholar]
- Jamshidpour, E.; Poure, P.; Saadate, S. Photovoltaic Systems Reliability Improvement by Real-Time FPGA-Based Switch Failure Diagnosis and Fault-Tolerant DC-DC Converter. IEEE Trans. Ind. Electron. 2015, 62, 7247–7255. [Google Scholar] [CrossRef]
- Poon, J.; Jain, P.; Konstantakopoulos, I.C.; Spanos, C.; Panda, S.K.; Sanders, S.R. Model-based fault detection and identification for switching power converters. IEEE Trans. Power Electron. 2017, 32, 1419–1430. [Google Scholar] [CrossRef]
- Kim, K.A.; Seo, G.S.; Cho, B.H.; Krein, P.T. Photovoltaic Hot-Spot Detection for Solar Panel Substrings Using AC Parameter Characterization. IEEE Trans. Power Electron. 2016, 31, 1121–1130. [Google Scholar] [CrossRef]
- Yang, S.; Xiang, D.; Bryant, A.; Mawby, P.; Ran, L.; Tavner, P. Condition monitoring for device reliability in power electronic converters: A review. IEEE Trans. Power Electron. 2010, 25, 2734–2752. [Google Scholar] [CrossRef]
- Wang, H.; Liserre, M.; Blaabjerg, F.; Rimmen, P.d.P.; Jacobsen, J.B.; Kvisgaard, T.; Landkildehus, J. Transitioning to physics-of-failure as a reliability driver in power electronics. IEEE J. Emerg. Sel. Top Power Electron. 2014, 2, 97–114. [Google Scholar] [CrossRef]
- Mellit, A.; Tina, G.M.; Kalogirou, S.A. Fault detection and diagnosis methods for photovoltaic systems: A review. Renew. Sustain. Energy Rev. 2018, 91, 1–17. [Google Scholar] [CrossRef]
- Mellit, A.; Kalogirou, S. Artificial intelligence and internet of things to improve efficacy of diagnosis and remote sensing of solar photovoltaic systems: Challenges, recommendations and future directions. Renew. Sustain. Energy Rev. 2021, 143, 110889. [Google Scholar] [CrossRef]
- Pillai, D.S.; Rajasekar, N. A comprehensive review on protection challenges and fault diagnosis in PV systems. Renew. Sustain. Energy Rev. 2018, 91, 18–40. [Google Scholar] [CrossRef]
- Zheng, Y.; Yang, S.; Cheng, H. An application framework of digital twin and its case study. J. Ambient. Intell. Humaniz. Comput. 2019, 10, 1141–1153. [Google Scholar] [CrossRef]
- Nguyen, V.H.; Tran, Q.T.; Besanger, Y.; Jung, M.; Nguyen, T.L. Digital twin integrated power-hardware-in-the-loop for the assessment of distributed renewable energy resources. Electr. Eng. 2022, 104, 377–388. [Google Scholar] [CrossRef]
- Kasper, M.; Bortis, D.; Kolar, J.W. Classification and comparative evaluation of PV panel-integrated DC-DC converter concepts. IEEE Trans. Power Electron. 2014, 29, 2511–2526. [Google Scholar] [CrossRef]
- Perpiñan, O.; Lorenzo, E.; Castro, M.A. On the calculation of energy produced by a PV grid-connected system. Prog. Photovolt. Res. Appl. 2007, 15, 265–274. [Google Scholar] [CrossRef]
- Linares, L.; Erickson, R.W.; Macalpine, S.; Brandemuehl, M. Improved Energy Capture in Series String Photovoltaics via Smart Distributed Power Electronics. In Proceedings of the 2009 Twenty-Fourth Annual IEEE Applied Power Electronics Conference and Exposition, Washington, DC, USA, 15–19 February 2009. [Google Scholar]
- Karimi, S.; Gaillard, A.; Poure, P.; Saadate, S. FPGA-based real-time power converter failure diagnosis for wind energy conversion systems. IEEE Trans. Ind. Electron. 2008, 55, 4299–4308. [Google Scholar] [CrossRef]
- Youssef, A.B.; El Khil, S.K.; Slama-Belkhodja, I. State observer-based sensor fault detection and isolation, and fault tolerant control of a single-phase PWM rectifier for electric railway traction. IEEE Trans. Power Electron. 2013, 28, 5842–5853. [Google Scholar] [CrossRef]
- Solórzano, J.; Egido, M.A. Automatic fault diagnosis in PV systems with distributed MPPT. Energy Convers. Manag. 2013, 76, 925–934. [Google Scholar] [CrossRef]
- Nie, S.; Pei, X.; Chen, Y.; Kang, Y. Fault diagnosis of PWM DC-DC converters based on magnetic component voltages equation. IEEE Trans. Power Electron. 2014, 29, 4978–4998. [Google Scholar] [CrossRef]


| Reference | Photovoltaic System under Study | Input Data to the WP | Sensors for Input Data | Mathematical Equations of the DT Model | Model DT | Data Output from the DT | Neural Network Models in Simulation | Testing in a Real Environment | Result |
|---|---|---|---|---|---|---|---|---|---|
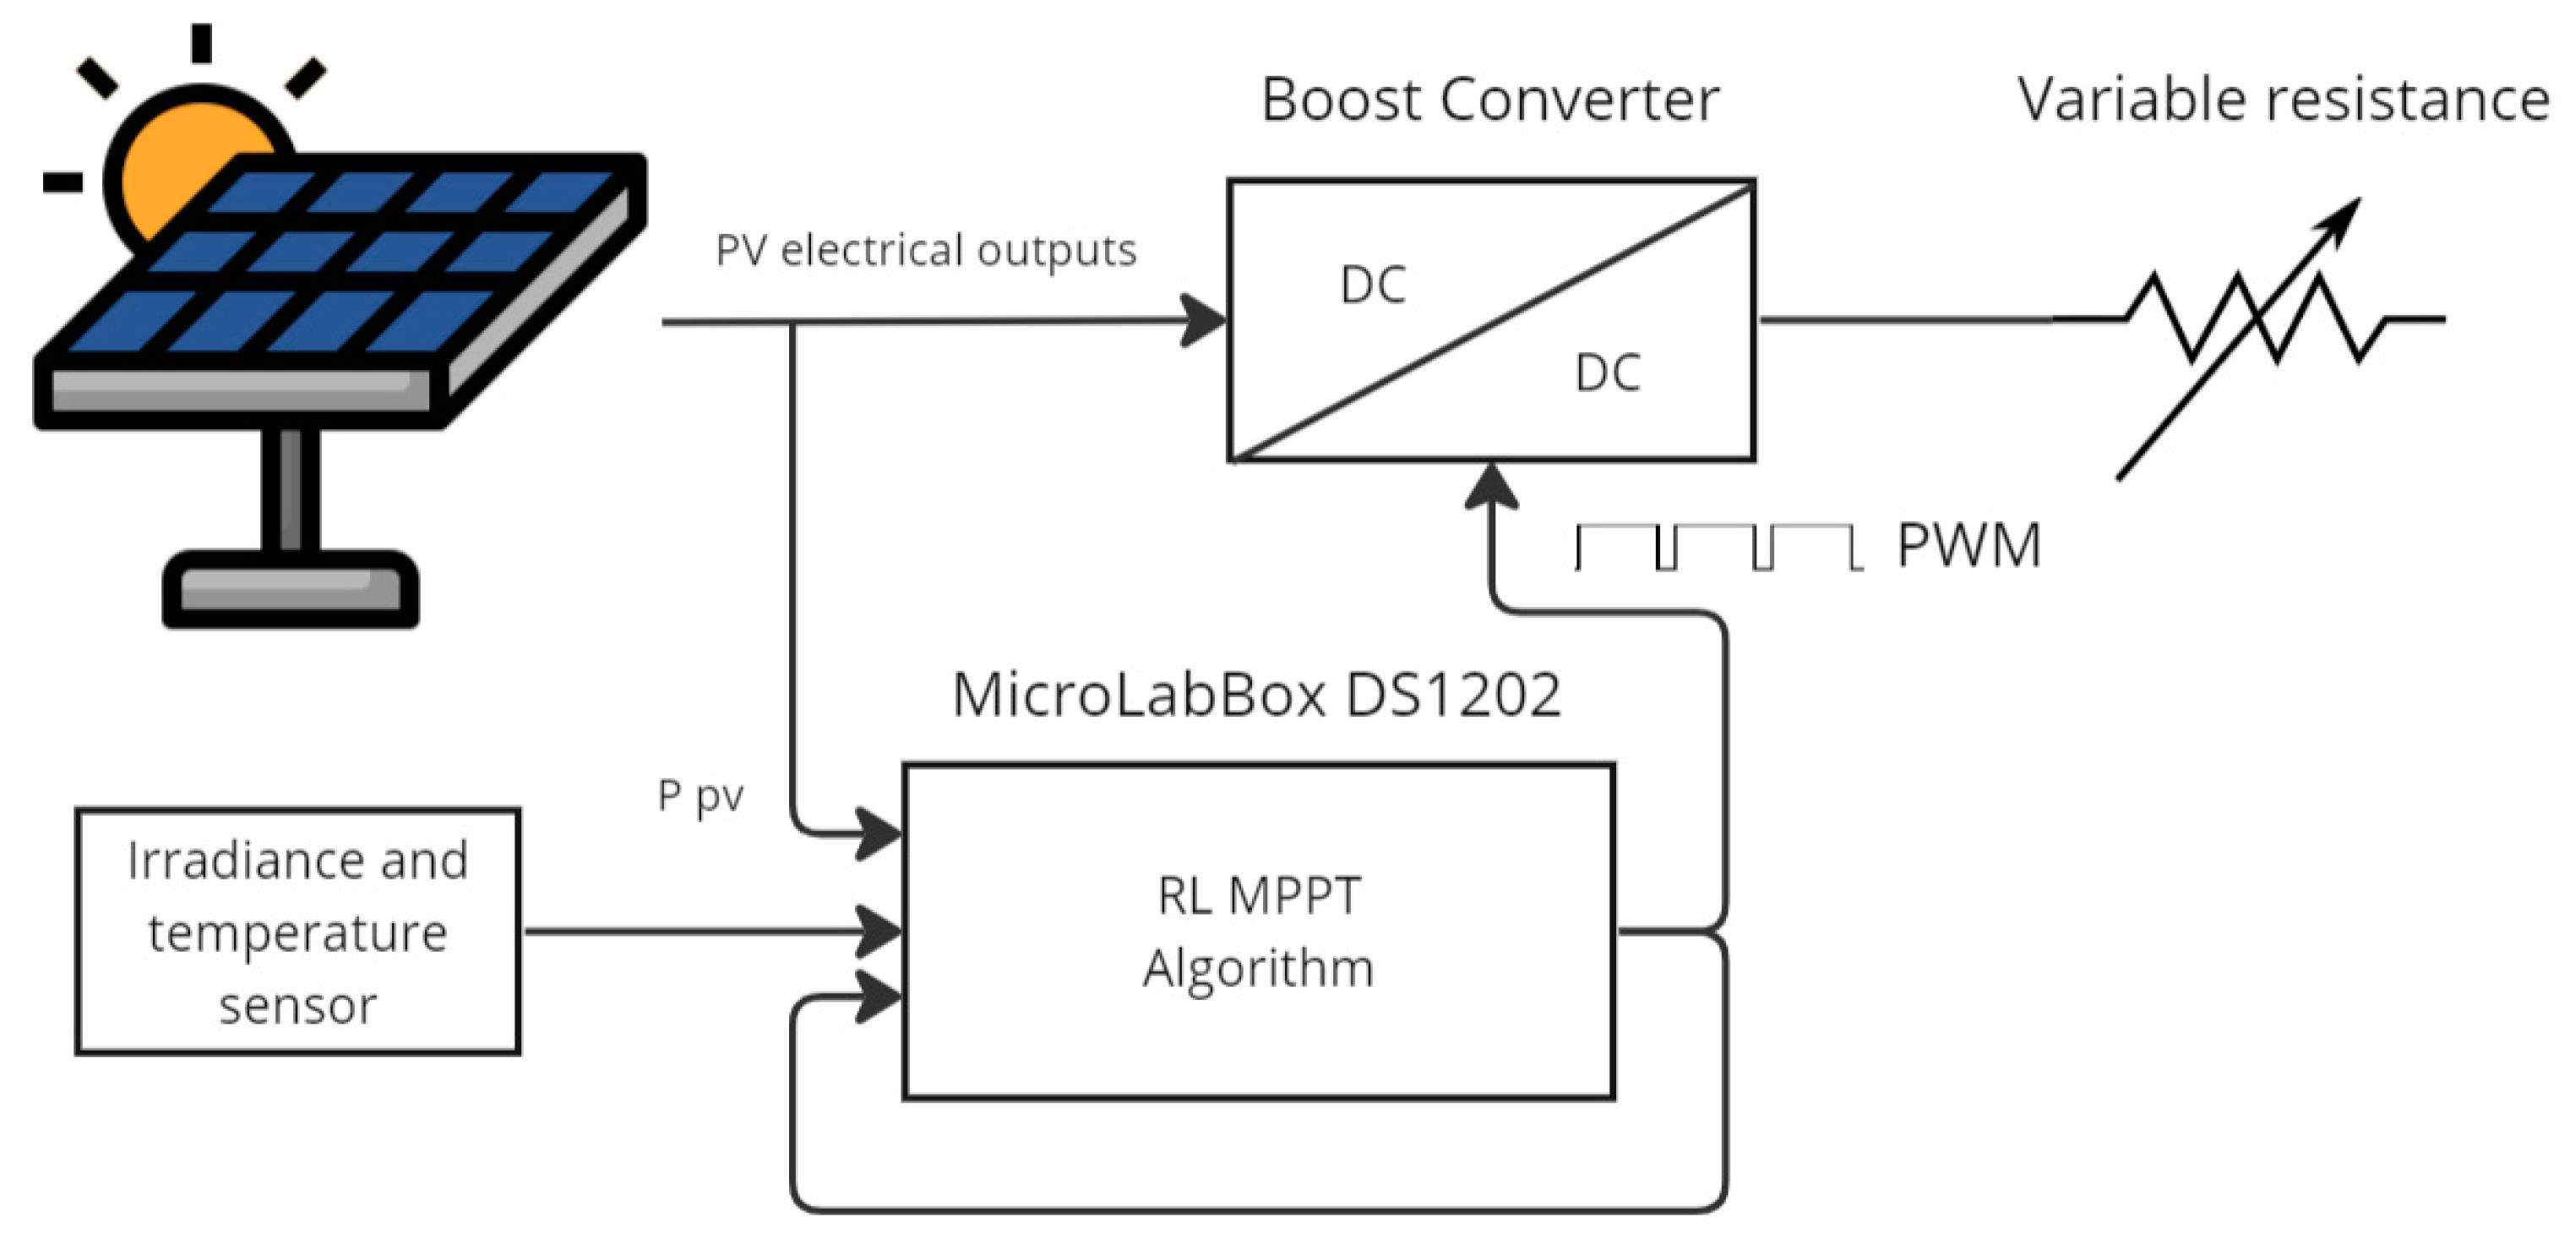
| [38] | A photovoltaic panel. | Temperature and irradiance. | Yes (irradiance and temperature sensor). | Yes. | Mathematical modelling in MATLAB/Simulink. | Power of the photovoltaic module. | Training of the reinforcement learning (RL) method with the DDPG agent. | A solar panel together with a boost converter and a variable resistor. | Estimation of the maximum power point of a solar panel. |
| [37] | String of photovoltaic panels. | Temperature and irradiance. | Yes (PROVA PV system analyser). | No. | Renewable energy block diagram, MATLAB/Simulink Simscape Electrical and a neural network. | Chain tension at maximum power point. | Training of a neural network (the article only mentions a neural network, without giving further details). | Three and five PV strings. | Global Maximum Power Point (GMPP) estimation. |
| Reference | Photovoltaic System under Study | Input Data to the WP | Sensors for Input Data | Mathematical Equations of the DT Model | Model DT | Data Output from the DT | Neural Network Models in Simulation | Testing in a Real Environment | Result |
|---|---|---|---|---|---|---|---|---|---|
| [40] | Grid-connected photovoltaic installation. |
| No. | No. | Wind and PV forecasting platform on a regional scale, for two regions in Belgium. |
| WPNet, LSTM, CNN, Attention and Transformer models. | No. |
|
| [39] | A solar panel. | The ambient temperature, the magnitude of the wind speed and the incident solar radiation. | No. | Yes. | Physical-numerical model built in Modelica. | Panel current, panel voltage and power. | LSTM long-term memory network model. | No. | Simulation and prediction of the energy produced by photovoltaic panels. |
| Reference | Photovoltaic System under Study | Input Data to the WP | Sensors for Input Data | Mathematical Equations of the DT Model | Model DT | Data Output from the DT | Neural Network Models in Simulation | Testing in a Real Environment | Result |
|---|---|---|---|---|---|---|---|---|---|
| [32] | Smart house with grid-connected photovoltaic system. | Solar radiation and temperature estimated using the Beta distribution function with one year’s historical data for radiation and temperature. | No. | Yes. | Multi-layer DT model in Smart Grid. The Electrical Digital Twin (top layer) represents the electrical control centre and the Domestic Digital Twin (bottom layer) represents the digital replication of the smart home devices. | Estimation of the photovoltaic power of the smart home. | RL model, LA and the GWOA algorithm. | No. All results were performed in simulation. | Algorithm for scheduling the operation of residential loads at the lowest electricity cost. |
| [33] | Grid-connected photovoltaic system | Temperature and irradiance. | Yes (Profitest measuring device). | No. | Renewable energy block diagram, MATLAB/Simulink Simscape Electrical. | Planned photovoltaic power. | LSTM model. | Photovoltaic system with two 335 W panels in series | Balance between energy generation (solar PV) and demand (energy consumption of buildings). |
| Reference | Photovoltaic System under Study | Input Data to the WP | Sensors for Input Data | Mathematical Equations of the DT Model | Model DT | Data Output from the DT | Fault Detection | Classification of Failures | Neural Network Models in Simulation | Testing in a Real Environment | Result |
|---|---|---|---|---|---|---|---|---|---|---|---|
| [35] | PVECU complete photovoltaic energy conversion unit (a photovoltaic panel together with a power converter). | Temperature and solar irradiation. | Yes (pyranometer and temperature sensor). | Yes. | Mathematical modelling of the whole system in MATLB/Simulink. | Panel current, panel voltage and DC converter inductor current. | Comparison of the response of the real system and the DT. | Creation of a fault library with simulation results. | The simulation was carried out in MATLB/Simulink without using neural networks. | A PVECU unit on the roof of a building on the campus of the National University of Singapore. | Development and design of a prototype source level power converter to create a fault detection and identification system for a distributed photovoltaic system. |
| [36] | 49 kW grid-connected photovoltaic system. | Temperature and solar irradiation. | Yes (Opal-RT eMegasim real-time simulator data). | Yes. | Mathematical modelling of the whole system in Python. | Photovoltaic energy. | Comparison of the response of the real system and the DT. | Training of neural networks in MATLAB/Simulink. | A novel Deep Learning ConvMixer method has been developed to classify faults. | No. The Opal-RT eMegasim real-time simulator has been used to validate the results. | Photovoltaic fault detection, classification and warning system. As well as the development of a new Deep Learning method (ConvMixer) for fault classification. |
| [22] | 150 kW grid-connected photovoltaic plant. | Historical temperature and irradiance data from the PVGIS database. | No. | No. | DT of each part of the PV system (solar panel, DC converter and final system/grid output power) with blocks in MATLB/Simulink Simscape Electrical. | Planned photovoltaic power. | Comparison of the response of the real system and the DT. | Training of neural networks in MATLAB/Simulink. | The regression models are Deep Neural Networks (DNN), Random Forest (RF) and CatBoost. | No. | Visualisation platform with operation and maintenance information for each DT of the photovoltaic installation. The performance of the PV system is predicted. |
Disclaimer/Publisher’s Note: The statements, opinions and data contained in all publications are solely those of the individual author(s) and contributor(s) and not of MDPI and/or the editor(s). MDPI and/or the editor(s) disclaim responsibility for any injury to people or property resulting from any ideas, methods, instructions or products referred to in the content. |
© 2024 by the authors. Licensee MDPI, Basel, Switzerland. This article is an open access article distributed under the terms and conditions of the Creative Commons Attribution (CC BY) license (https://creativecommons.org/licenses/by/4.0/).
Share and Cite
Angelova, D.D.; Fernández, D.C.; Godoy, M.C.; Moreno, J.A.Á.; González, J.F.G. A Review on Digital Twins and Its Application in the Modeling of Photovoltaic Installations. Energies 2024, 17, 1227. https://doi.org/10.3390/en17051227
Angelova DD, Fernández DC, Godoy MC, Moreno JAÁ, González JFG. A Review on Digital Twins and Its Application in the Modeling of Photovoltaic Installations. Energies. 2024; 17(5):1227. https://doi.org/10.3390/en17051227
Chicago/Turabian StyleAngelova, Dorotea Dimitrova, Diego Carmona Fernández, Manuel Calderón Godoy, Juan Antonio Álvarez Moreno, and Juan Félix González González. 2024. "A Review on Digital Twins and Its Application in the Modeling of Photovoltaic Installations" Energies 17, no. 5: 1227. https://doi.org/10.3390/en17051227
APA StyleAngelova, D. D., Fernández, D. C., Godoy, M. C., Moreno, J. A. Á., & González, J. F. G. (2024). A Review on Digital Twins and Its Application in the Modeling of Photovoltaic Installations. Energies, 17(5), 1227. https://doi.org/10.3390/en17051227