Article

Fluid–Structure Interaction Simulations of Wind Turbine Blades with Pointed Tips

1
Center for Energy & Environmental Sustainability, Prairie View A&M University, 700 University Drive, Prairie View, TX 77446, USA
2
Department of Mechanical Engineering, Prairie View A&M University, 700 University Drive, Prairie View, TX 77446, USA
3
Department of Civil & Environmental Engineering, Prairie View A&M University, 700 University Drive, Prairie View, TX 77446, USA
*
Author to whom correspondence should be addressed.
Energies 2024, 17(5), 1090; https://doi.org/10.3390/en17051090
Submission received: 28 December 2023 / Revised: 19 February 2024 / Accepted: 20 February 2024 / Published: 24 February 2024
(This article belongs to the Section A3: Wind, Wave and Tidal Energy)

Abstract

:
The aerodynamic shapes of the blades are of great importance in wind turbine design to achieve better overall turbine performance. Fluid–structure interaction (FSI) analyses are normally carried out to take into consideration the effects due to the loads between the air flow and the turbine structures. A structural integrity check can then be performed, and the structural/material design can be optimized accordingly. In this study, three different tip shapes are investigated based on the original blade of the test wind turbine (Phase VI) from the National Renewable Energy Laboratory (NREL). A one-way coupled simulation of FSI is conducted, and results with a focus on stresses and deformations along the span of the blade are investigated. The results show that tip modifications of the blade have the potential to effectively increase the power generation of wind turbines while ensuring adequate structural strength. Furthermore, instead of using more complicated but computationally expensive techniques, this study demonstrates an effective approach to making quality observations of this highly nonlinear phenomenon for wind turbine blade design.

1. Introduction

Wind power has recently grown rapidly, driven by technological advancement as well as government policies striving for energy transitions when facing the global climate challenge. While onshore wind development is comparably more mature than that of offshore, both still have great potential for development and improvement. Over the last few years, the industry has made a great effort and achieved a considerable reduction in the levelized cost of energy by increasing the size or optimizing the blade geometries of wind turbines. For instance, O’Brien et al. [1] reviewed horizontal axis wind turbine research by focusing on both numerical modeling and experimental practices; Madsen et al. [2] presented a curved tip shape design to a 10 MW reference wind turbine using a high-fidelity optimization approach based on computational fluid dynamics (CFD); and Posta et al. [3] presented an aeroelastic model to investigate the FSI for a reference 5 MW turbine, where both one-way and two-way coupled simulations were performed. With relatively fewer constraints in offshore applications, the trend of increasing the size of large wind turbines is expected to continue within this decade. To this day, the world’s largest wind turbine is the MySE 16-260 installed in Asia and is rated at 16 MW with a rotor diameter of 260 m. This giant wind turbine was successfully connected to the grid recently.
The rotor blades are generally regarded as the most critical component within a wind turbine system. Through the examination of common objectives in wind turbine optimization, Ning et al. [4] summarized the objectives and constraints with a focus on the design of rotor blades. Modern wind turbines utilize blades with advanced airfoil shapes to achieve better aerodynamic performance, therefore improving the power output. A great variety of variables of a rotary blade could affect its aerodynamic performance. For instance, Wang et al. [5] presented a design tool for wind turbine blade optimization and carried out an optimization study considering the chord, twist, and relative thickness of the blades. The optimization of the blade shape also includes the modification of blade tips [6,7], prebend of the blade [8], sweep [9], and winglets [10].
Moreover, optimizations of geometry based on the NREL Phase VI wind turbine have received considerable attention. By introducing the optimized winglet, Elfarra et al. [11] achieved a 9% increase in power generation, where CFD solving RANS with the k-ε turbulence model was used for investigation. Dhert et al. [12] developed a RANS-based shape optimization to achieve an average 20% increase in torque for multiple wind speeds. Sessarego et al. [8] presented a newly designed curved blade using neural networks and an aero-elastic vortex method to improve the power on average by about 1%. Zhong et al. [13] investigated aerodynamic performance with the introduction of a biplane airfoil based on the NREL Phase VI baseline blade. Optimized configuration in gag and stagger could increase the power coefficient by 23% at a certain wind speed. It also showed the potential of harvesting relatively more energy with even less increments in structural loading. Ke et al. [14] found that the aerodynamic performance could benefit from the design of introducing tubercles at the leading edge of blades, particularly for higher wind speeds.
On the other hand, the wind turbine is susceptible to blade deformation. With the continuous increase in size, particularly in aforementioned offshore applications, it has become even more crucial to the design and power performance of the wind turbine. A fluid–structure interaction (FSI) analysis is therefore needed in order to achieve more comprehensive optimizations for wind turbine blades.
FSI modeling generally consists of the fluid component that solves aerodynamic loads and the structural component that calculates corresponding structural responses. Wang et al. [15] summarized that depending on the method of coupling of these two components, FSI can be categorized into two groups: one-way coupling and two-way coupling. In a one-way coupling model, aerodynamic loads are mapped to the structural solver as boundary conditions to calculate the deflection of the structure. In a two-way coupling model, aerodynamic loads are mapped to the structural solver like in the one-way coupling model. The structural deflection is then mapped back to the aerodynamic solver to reassess the aerodynamic loads. This process will iterate until the convergence criterion is satisfied. The latter approach is capable of providing more accurate results but at a significant computational cost. Many available studies so far can be found using either of these two methods, e.g., Lipian et al. [16] and Posta et al. [3]. In addition, Hsu and Bazilevs [17] conducted a fully coupled FSI simulation of the full wind turbine system using a non-overlapping sliding-interface approach, where the aerodynamics were computed using a finite element-based technique and the blade structures were modeled using NURBS-based isogeometric analysis (IGA). This approach was later applied in modeling for fatigue-damage prediction on a full-scale 13 M wind turbine [18].
It is worth noting that various models including blade element momentum (BEM) and higher-fidelity CFD are widely used to conduct aerodynamic simulations of wind turbine blades. Wang et al. [19] provided a comprehensive review of the aeroelastic modeling of wind turbine blades by critically analyzing the advantages and disadvantages of each model available in both aerodynamic and structural analyses. Relevant studies can also be found in a wide variety of applications, e.g., [4,7,20,21,22].
Different structural models and coupling methods have been applied for FSI simulations. Studies like Grinderslev et al. [22] found that for a relatively stiff rotor, the impact of the flexibility of blades on overall power output is negligible. In other words, the aforementioned one-way coupling approach is effective and efficient when dealing with similar problems.
The objective of this present study is to demonstrate an effective and computationally efficient way to determine the effects of blade geometry modification using ANSYS software (ANSYS 15.0). Therefore, we extend previous studies [21,23,24] on the reference NREL Phase VI test wind turbine [25] and continue to conduct a one-way FSI analysis of three different tip shape modifications. Similar to the graph shown in Figure 1, seven different wind speeds in the range of 5 m/s to 25 m/s are selected to assess the overall power generation performance. Stresses and deformations along the span of the blade with different tips resulting from FSI simulations are extensively investigated. The results show that “small” modifications of the blade have the potential to effectively increase the power generation of wind turbines. At the same time, it also encounters highly nonlinear complexity when taking into consideration its structural stability.
The remainder of this article is organized as follows. Section 2 provides a detailed specification of the baseline wind turbine model and describes the methodology used in this analysis, including geometry modification, mesh, and boundary condition setups. Section 3 presents the comprehensive results of the FSI simulations. Finally, the conclusions from this study are presented in Section 4.

2. Materials and Methods

2.1. NREL Phase VI Test Wind Turbine

This present study focuses on the FSI investigations of modified wind turbine blades based on the NREL’s wind tunnel test, i.e., the experimental measurements of the NREL Phase VI test wind turbine [25]. It was a test model with a 10.058 m rotor diameter; more measurements are illustrated in Figure 2.
The NREL Phase VI blade’s twist and taper change gradually along the span, as shown in Figure 3. It can be seen from this graph that the root of a cylindrical section starts from 0.508 m from the center of the rotor, followed by the transition section, which starts from 0.883 to 1.257 m. The remaining blade is formed with the “S809 airfoil” profile starting from 1.257 to 5.029 m.
This “airfoil” section can be further decomposed into 16 subsections with a predefined thickness, which is about 21% of the relevant chord length at each subsection. The twist angle and chord length over the span are given as shown in Figure 4.

2.2. Methodology

The overall approach to investigate the effects of modified tip shape can be achieved by carrying out an FSI analysis as described below. The aerodynamics part has been performed using both the CFD tool and BEM in previous work. This study focuses only on the CFD analysis carried out on ANSYS Workbench using a fluid solver—CFX. The structural part is then conducted using ANSYS Workbench (15.0) using a structural solver (static-structural analysis). Between these two analyses, a one-way coupling approach is realized through a load mapping procedure, where the unidirectional load (pressure) calculated from CFX is transferred to a structural analysis as imported boundary conditions on the surface of the blades.

2.2.1. Geometry Setup

Based on the experimental setup of the NREL Phase VI blade introduced in the previous section, three different tip shapes have been considered. From the original geometry illustrated in Figure 3, the blade in this study is modified with different tips, as seen in Figure 5 and Figure 6. As shown in these figures, each blade is divided into sixteen sections, with the last three sections modified in certain ways to create the pointed-tip structure: Type 1 forms a tip that ends at the pitch axis, while Type 2 forms a tip tapered from the blade trailing edge, and Type 3 forms a tip tapered from the leading edge.
It is worth noting that the NREL blade also contains a web, a fixed structural member over the span to increase the bending resistance. Furthermore, to complete the whole model of a wind turbine, a hub is modeled to connect the two blades to the support tower, where a nacelle, a shaft, and a rotor are also included as illustrated in Figure 7. In order to provide a meaningful comparison against experimental measurement, the boom, camera, instrumentation enclosures, and other mechanical parts used in the NREL wind tunnel test are not directly modeled, but their relevant masses are taken into consideration.

2.2.2. Mesh Generation

An aerodynamics analysis (CFD) on the blades is first carried out using ANSYS CFX (15.0). The loads resulting on the blades are then transferred (via mapping) to the FEA-based structural analysis using a one-way FSI coupling method. It is worth noting that these two-step analyses are conducted in two different and independent computational domains, and meshes applied in each domain generally differ from each other in terms of characteristics and shapes. In addition, the mesh for structure analysis is much coarser than the mesh on the blade in a fluid analysis. An appropriate mesh size in the structural analysis, therefore, should be chosen to ensure a 100% mapping of the surface loads (pressure) from the CFD results.
A mesh sensitivity study is performed on the original NREL blade using three mesh sizes: coarse mesh (with size of 0.005 m), medium mesh (0.002 m), and fine mesh (0.0005 m). As mesh density increases, the results are expected to be more accurate and converge into a single value. The results of the comparisons between medium and fine meshes show that the percentage errors of the total deformation, equivalent elastic strain, and equivalent stress decrease to 0.11%, 0.12%, and 0.03%, respectively. The mesh size of 0.002 m is therefore considered appropriate for the simulations with low errors.
ANSYS provides tools to check the mesh quality. In this study, three criteria are used to validate the grid refinement, including element quality, skewness, and orthogonal quality, as illustrated in Figure 8.
The final meshes of the three types of blades in structural analysis are shown in Figure 9.

2.2.3. Material Properties in Modeling

A wind turbine can be considered to consist of two different types of parts: structural parts and mechanical parts. Structural parts are composed of the blades and the tower, while mechanical parts contain the nacelle, shaft, instrumentation, and power generator. In this study, the mechanical parts are treated as rigid bodies, with their structural strength depending on the tower’s stability. Therefore, the stresses and strains generated in the mechanical parts are neglected in the present study.
NREL report provided the tower material and dimensions of the Phase VI wind turbine, but not enough information about the material properties of the blades and the mechanical parts [24]. The blade’s complex 3-D shape obstructs the determination of the structural stiffness; thus, experimental measurements remain mandatory. For this reason, the natural frequency and eigenmode studies were held to verify the structural properties of the turbine. Table 1 summarizes the material properties that provide similar eigenmodes and natural frequencies to the NREL test model [24,25].

2.2.4. Loads and Boundary Conditions

In one of our previous studies, both BEM and one-way FSI approaches were used to apply the aerodynamic loads on the turbine blades [21]. The BEM approach was based on calculating the nodal loads from 2-D cross-sectional aerodynamic coefficients that were derived from CFD results. Two divisions over the blade span (i.e., 5-section division and 16-section division) were used. The nodal forces calculated were applied on each section to simulate the aerodynamic effect on the blades. On the other hand, in the one-way FSI approach, the pressure distribution resulting from CFD calculations was transferred to the original blade shape. Limited experimental data about the pressure characteristics in only five sections are available. Those data were used as a reference to investigate the accuracy of the two approaches. The results from the previous study showed that the one-way FSI provided better accuracy in terms of the displacement of the structure compared against the experimental results. Figure 10 illustrates the difference between these two approaches.
The one-way FSI approach is selected in the present study, and it is generally a coupling approach that combines the fluid and structural domains interactively. It is worth noting that the geometries for each domain are different physically but only bear the same dimensions on boundaries (i.e., the surface of the blade). This exact surface is treated as one part of the fluid domain in CFD simulation, while in the structural domain, it represents the outer shape of the concerned blade.
By solving the governing Navier–Stokes equations over the whole fluid domain, the CFD simulation is used to predict the behavior of surrounding fluid on and over the wind blade, such as the velocity, the aerodynamic coefficients, the streamline flow over the surface of the blade, the torque and thrust forces, as well as the pressure distribution on the blades.
The pressure distribution from CFD simulations is imported as the input for the structural analysis of the concerned blade. In particular, these pressure values on the blade surface are extracted from the CFD results and then mapped on the surface of the blades in the structural model. The CFX tool post-process is used as an input to the static-structural tool in ANSYS. For the three pointed-tip blades, the numerical data were transferred directly from the “CFX/solution” to the “static structural/setup”. The same approach is repeated for different wind speed conditions, i.e., 5 m/s, 7 m/s, 10 m/s, 13 m/s, 15 m/s, 20 m/s, and 25 m/s.
Figure 11 shows the schematic setup of one-way coupled FSI in ANSYS using Workbench, which in this study consists of Component System A (CFX) and Component System B (ANSYS structural). When the exact pressure distribution from the fluid domain is successfully transferred and applied as a surface load on the blades in the structural model, a load transfer summary indicating the percentage of the CFD loads that have been transferred to the FE model is provided. For each of the three types of blade shapes, 100% node-mapping is achieved on the blades.
To be more specific, the source pressures on the blade surface from the flow solver are mapped to the centroids of the target element in the structural analysis (i.e., “SURF154 element” in ANSYS). In addition, the fixed boundary conditions are applied at the tower base in the structural analysis.

3. Results and Discussion

Previous CFD studies have focused on the aerodynamics of the concerned blades modified with different tips [23], and verification and validation of this approach were carried out against the experimental measurement of the baseline wind turbine model by NREL [
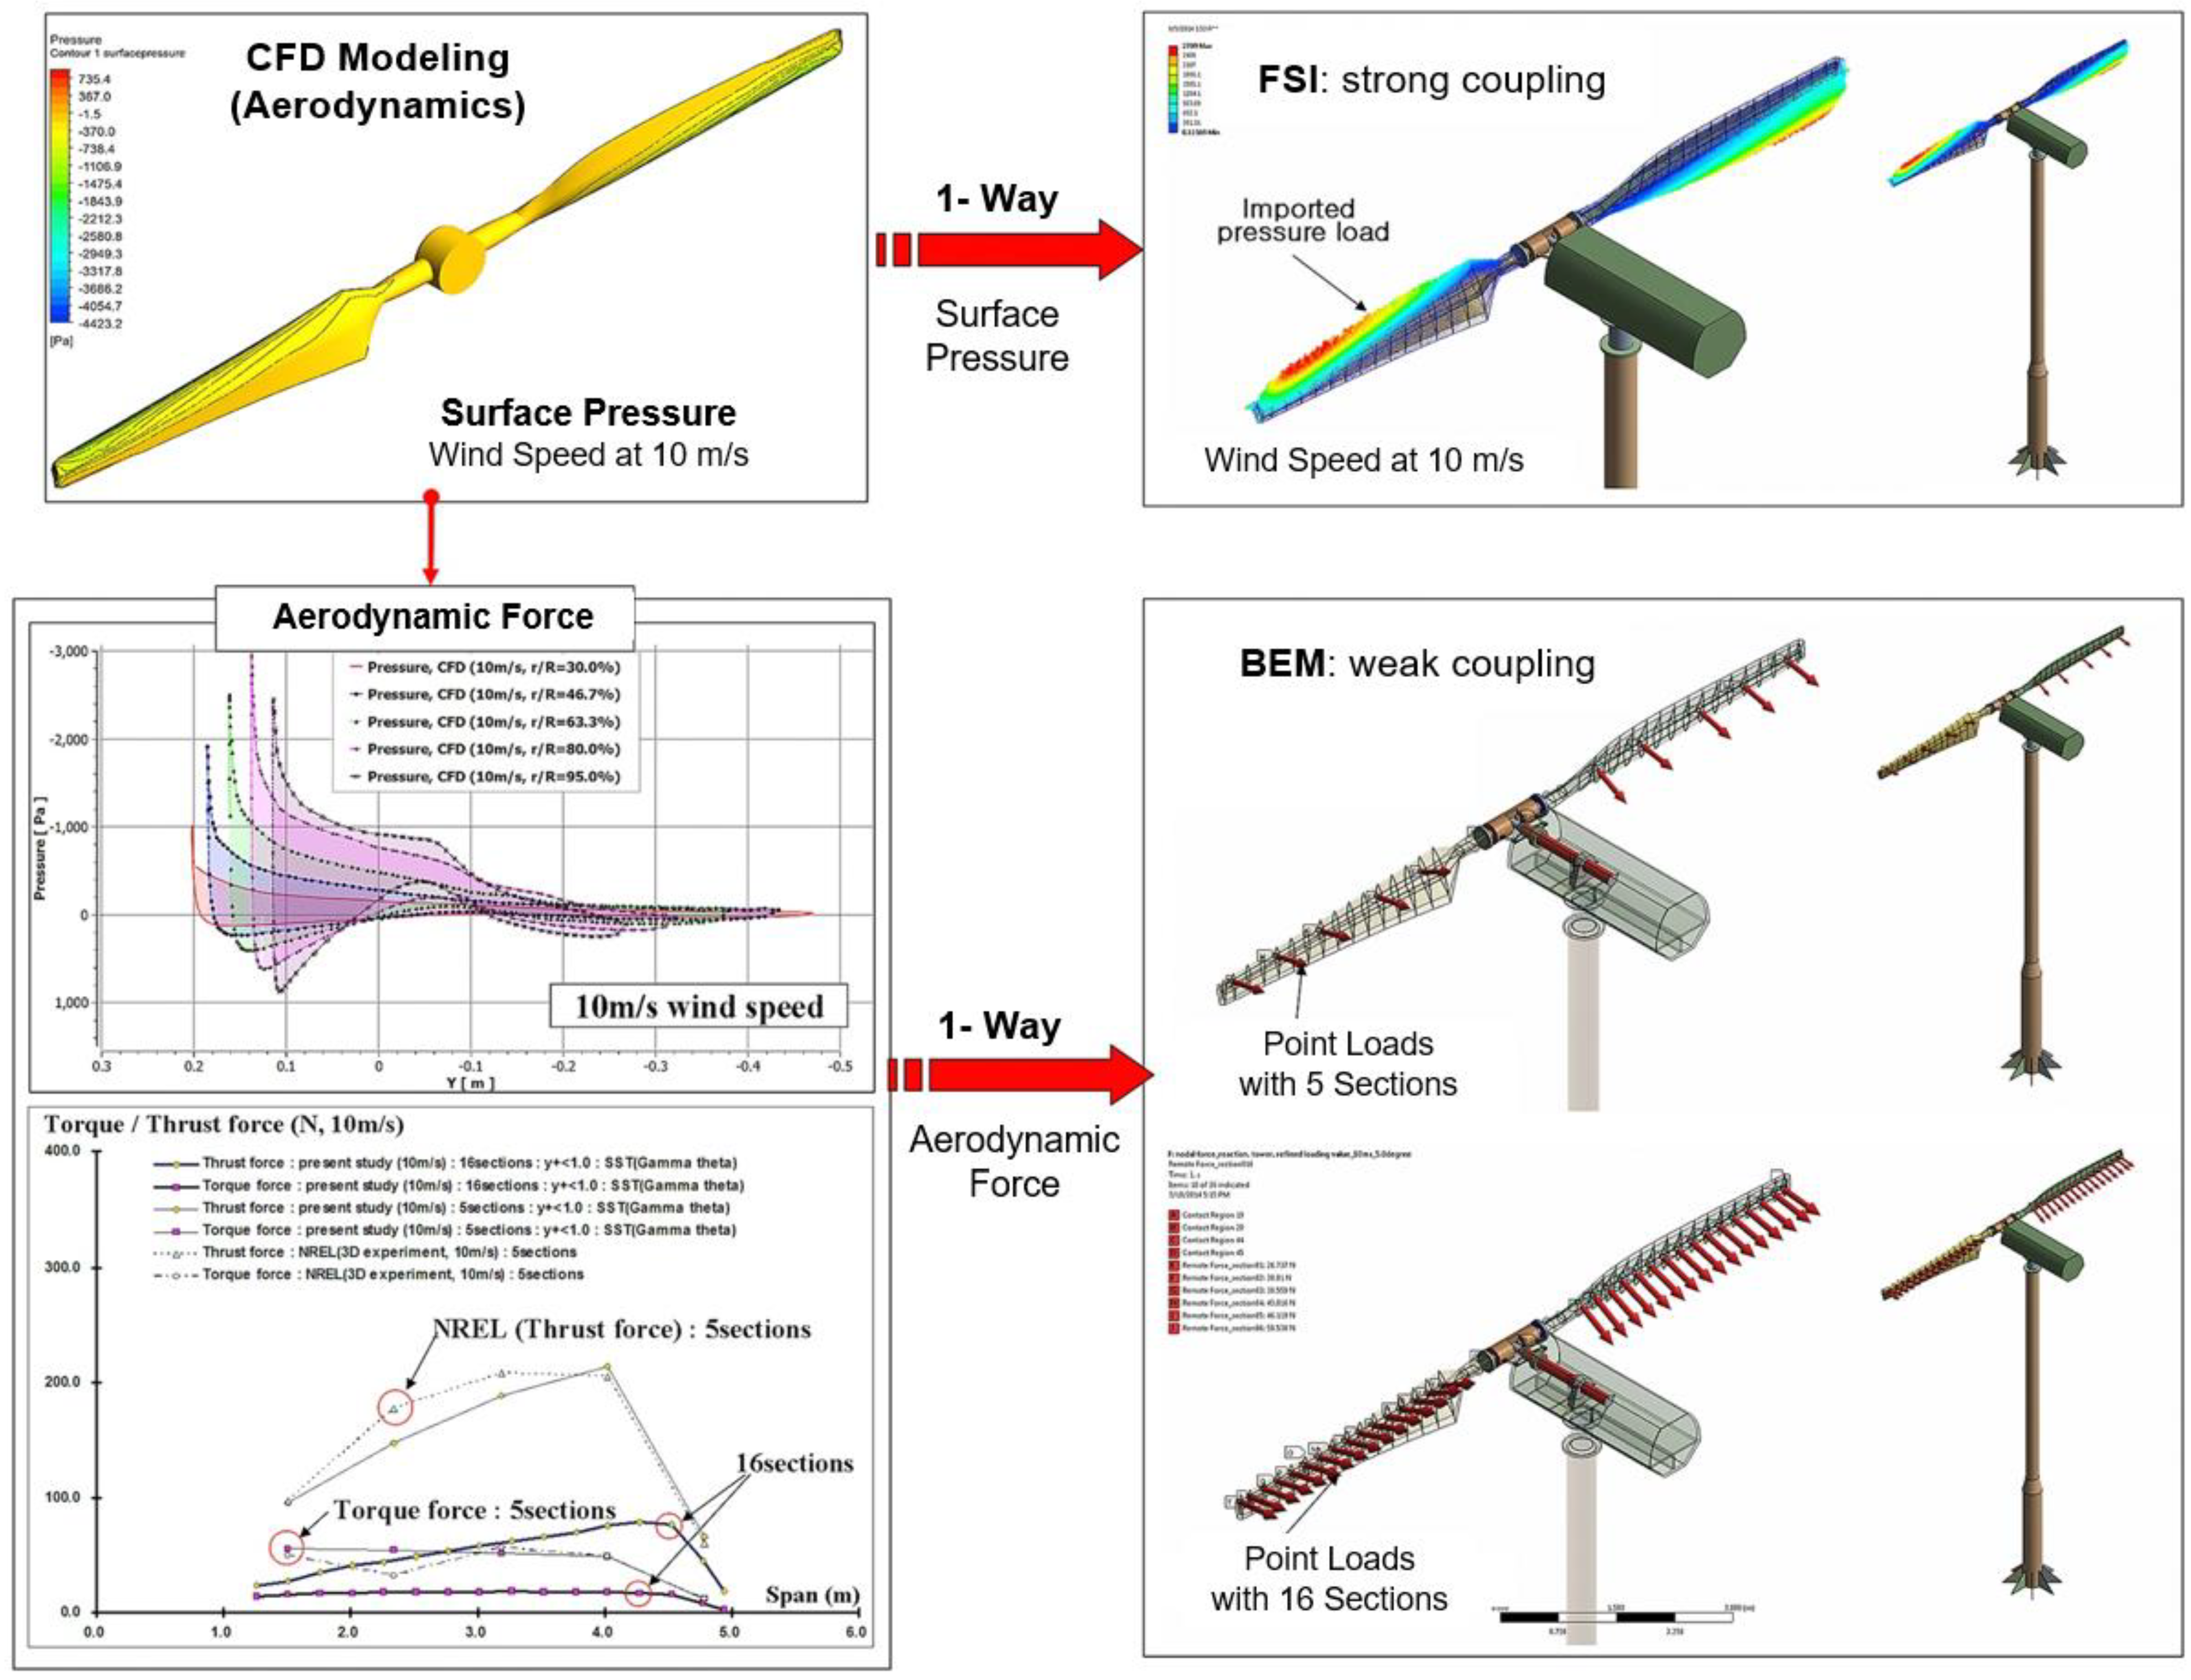
26]. In this study, as part of the FSI simulation, a CFD analysis is performed in the same manner as the previous one, i.e., the aerodynamics of these wind turbines at different wind speeds are solved in ANSYS CFX. The results from the aerodynamics analysis (pressure) are then transferred to the structural solver to complete the FEA-based structural analysis by evaluating the directional displacement, total deformation, stress distribution, and strain distribution.

3.1. Pressure Loads Imported from CFD Analysis

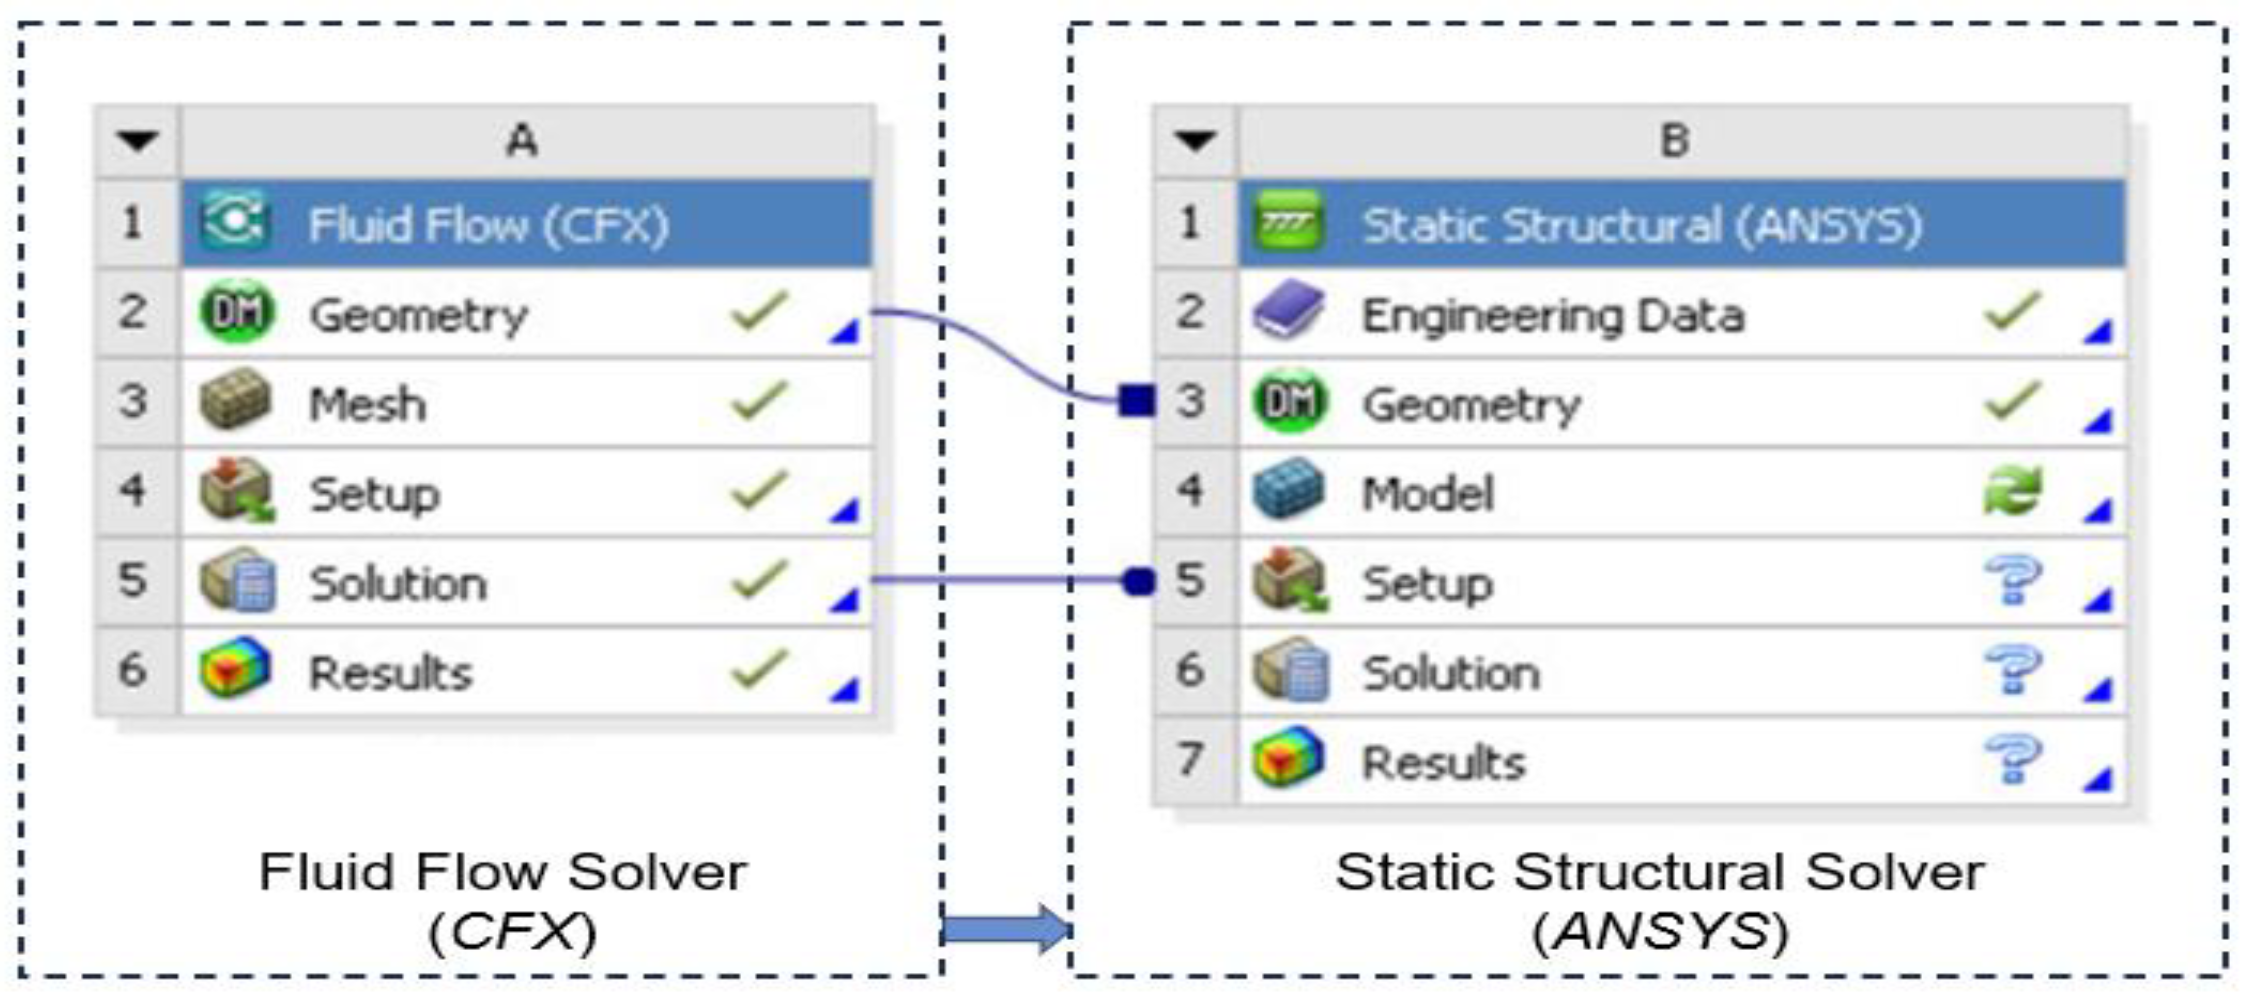
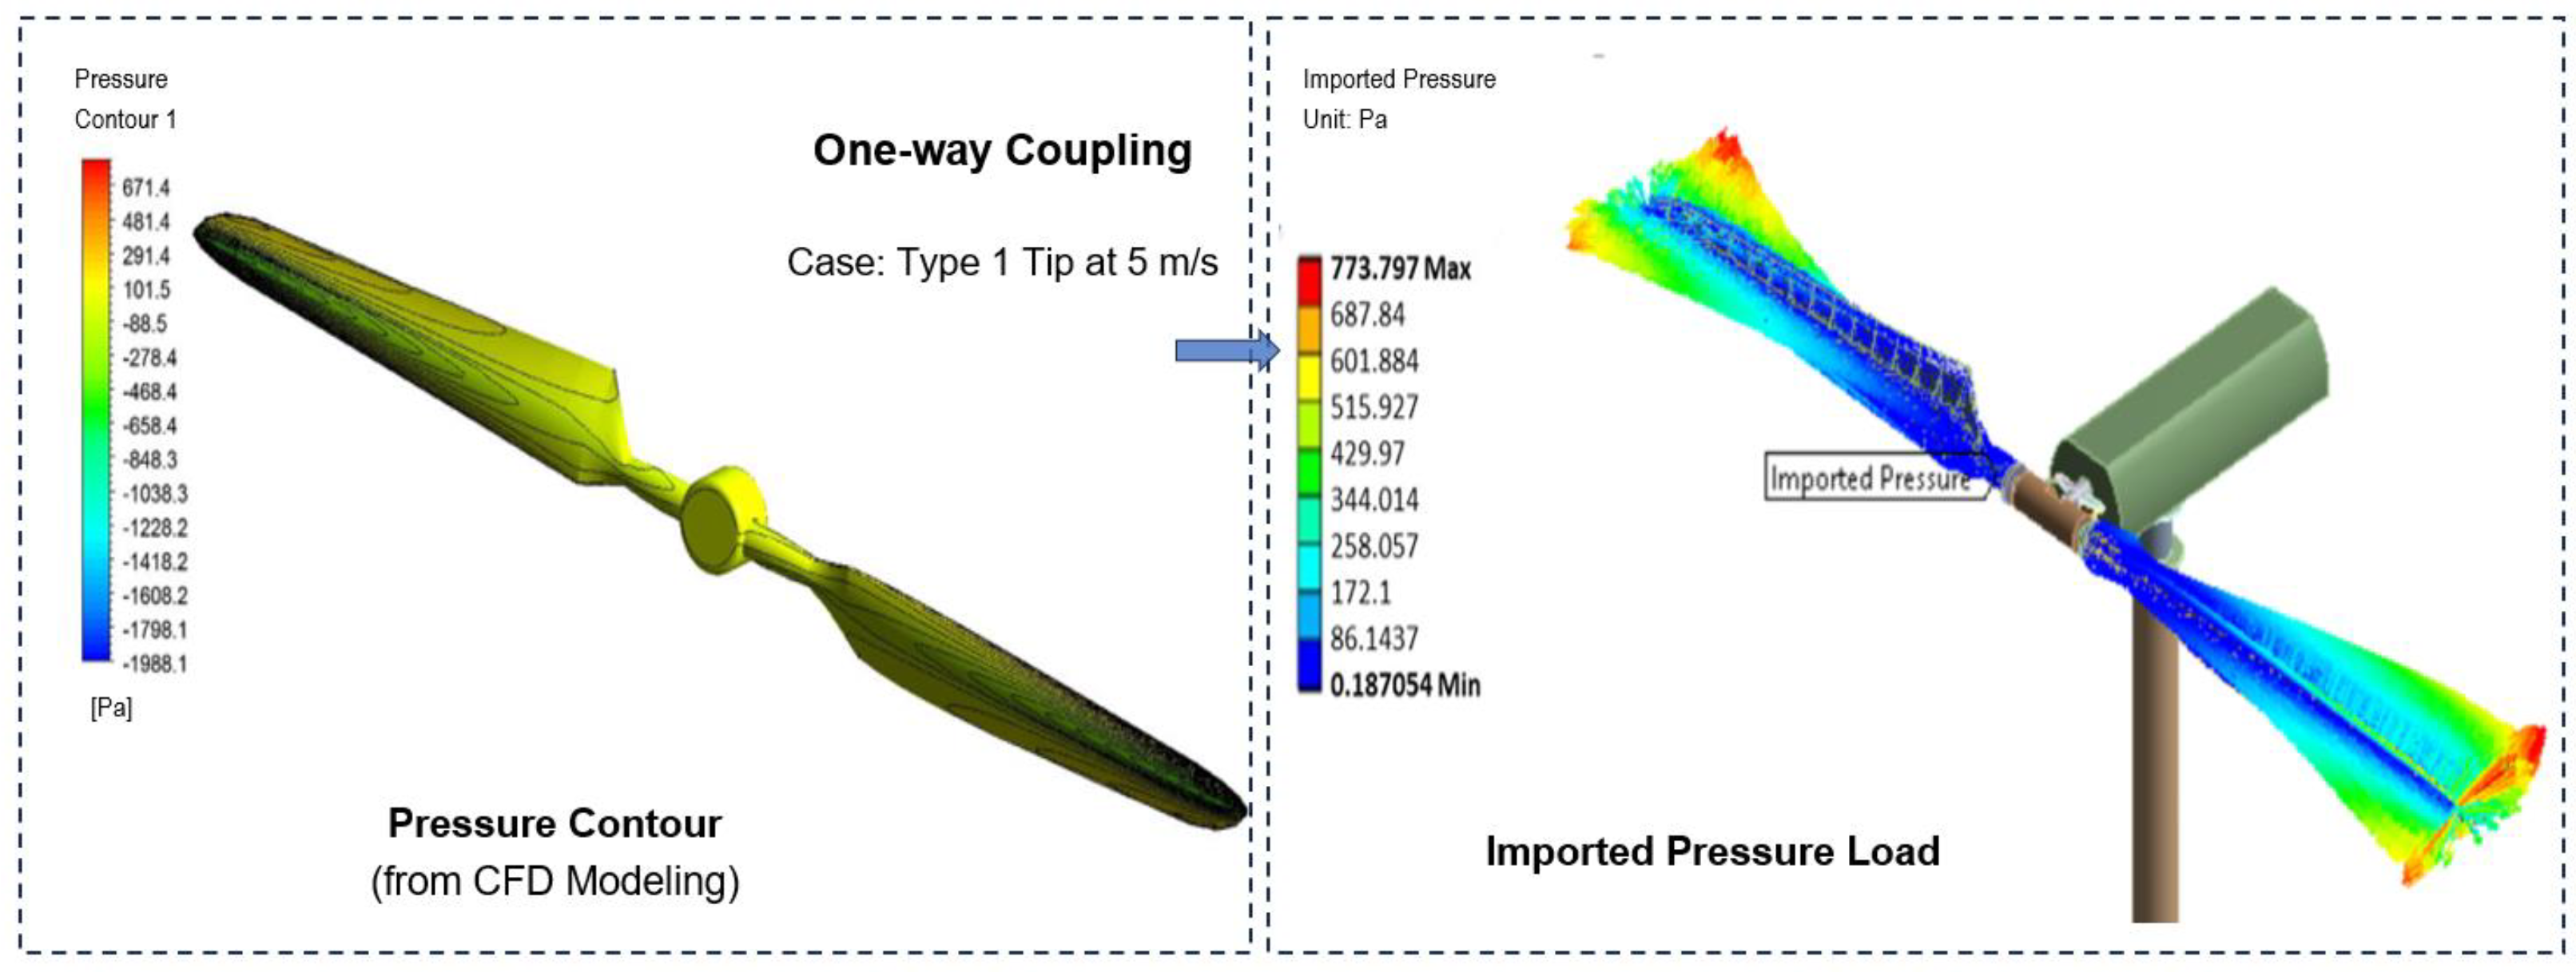
As described in the previous section, the pressure loads obtained from the fluid solver are transferred to the structural solver through mapping. Through the mapping, the scale value from the fluid solver (pressure) is imported to the structural solver as normal stress loads (dubbed as Imported Pressure) on the body surface. These loads on structures can be represented in a manner of vector plots as illustrated below (Figure 12).
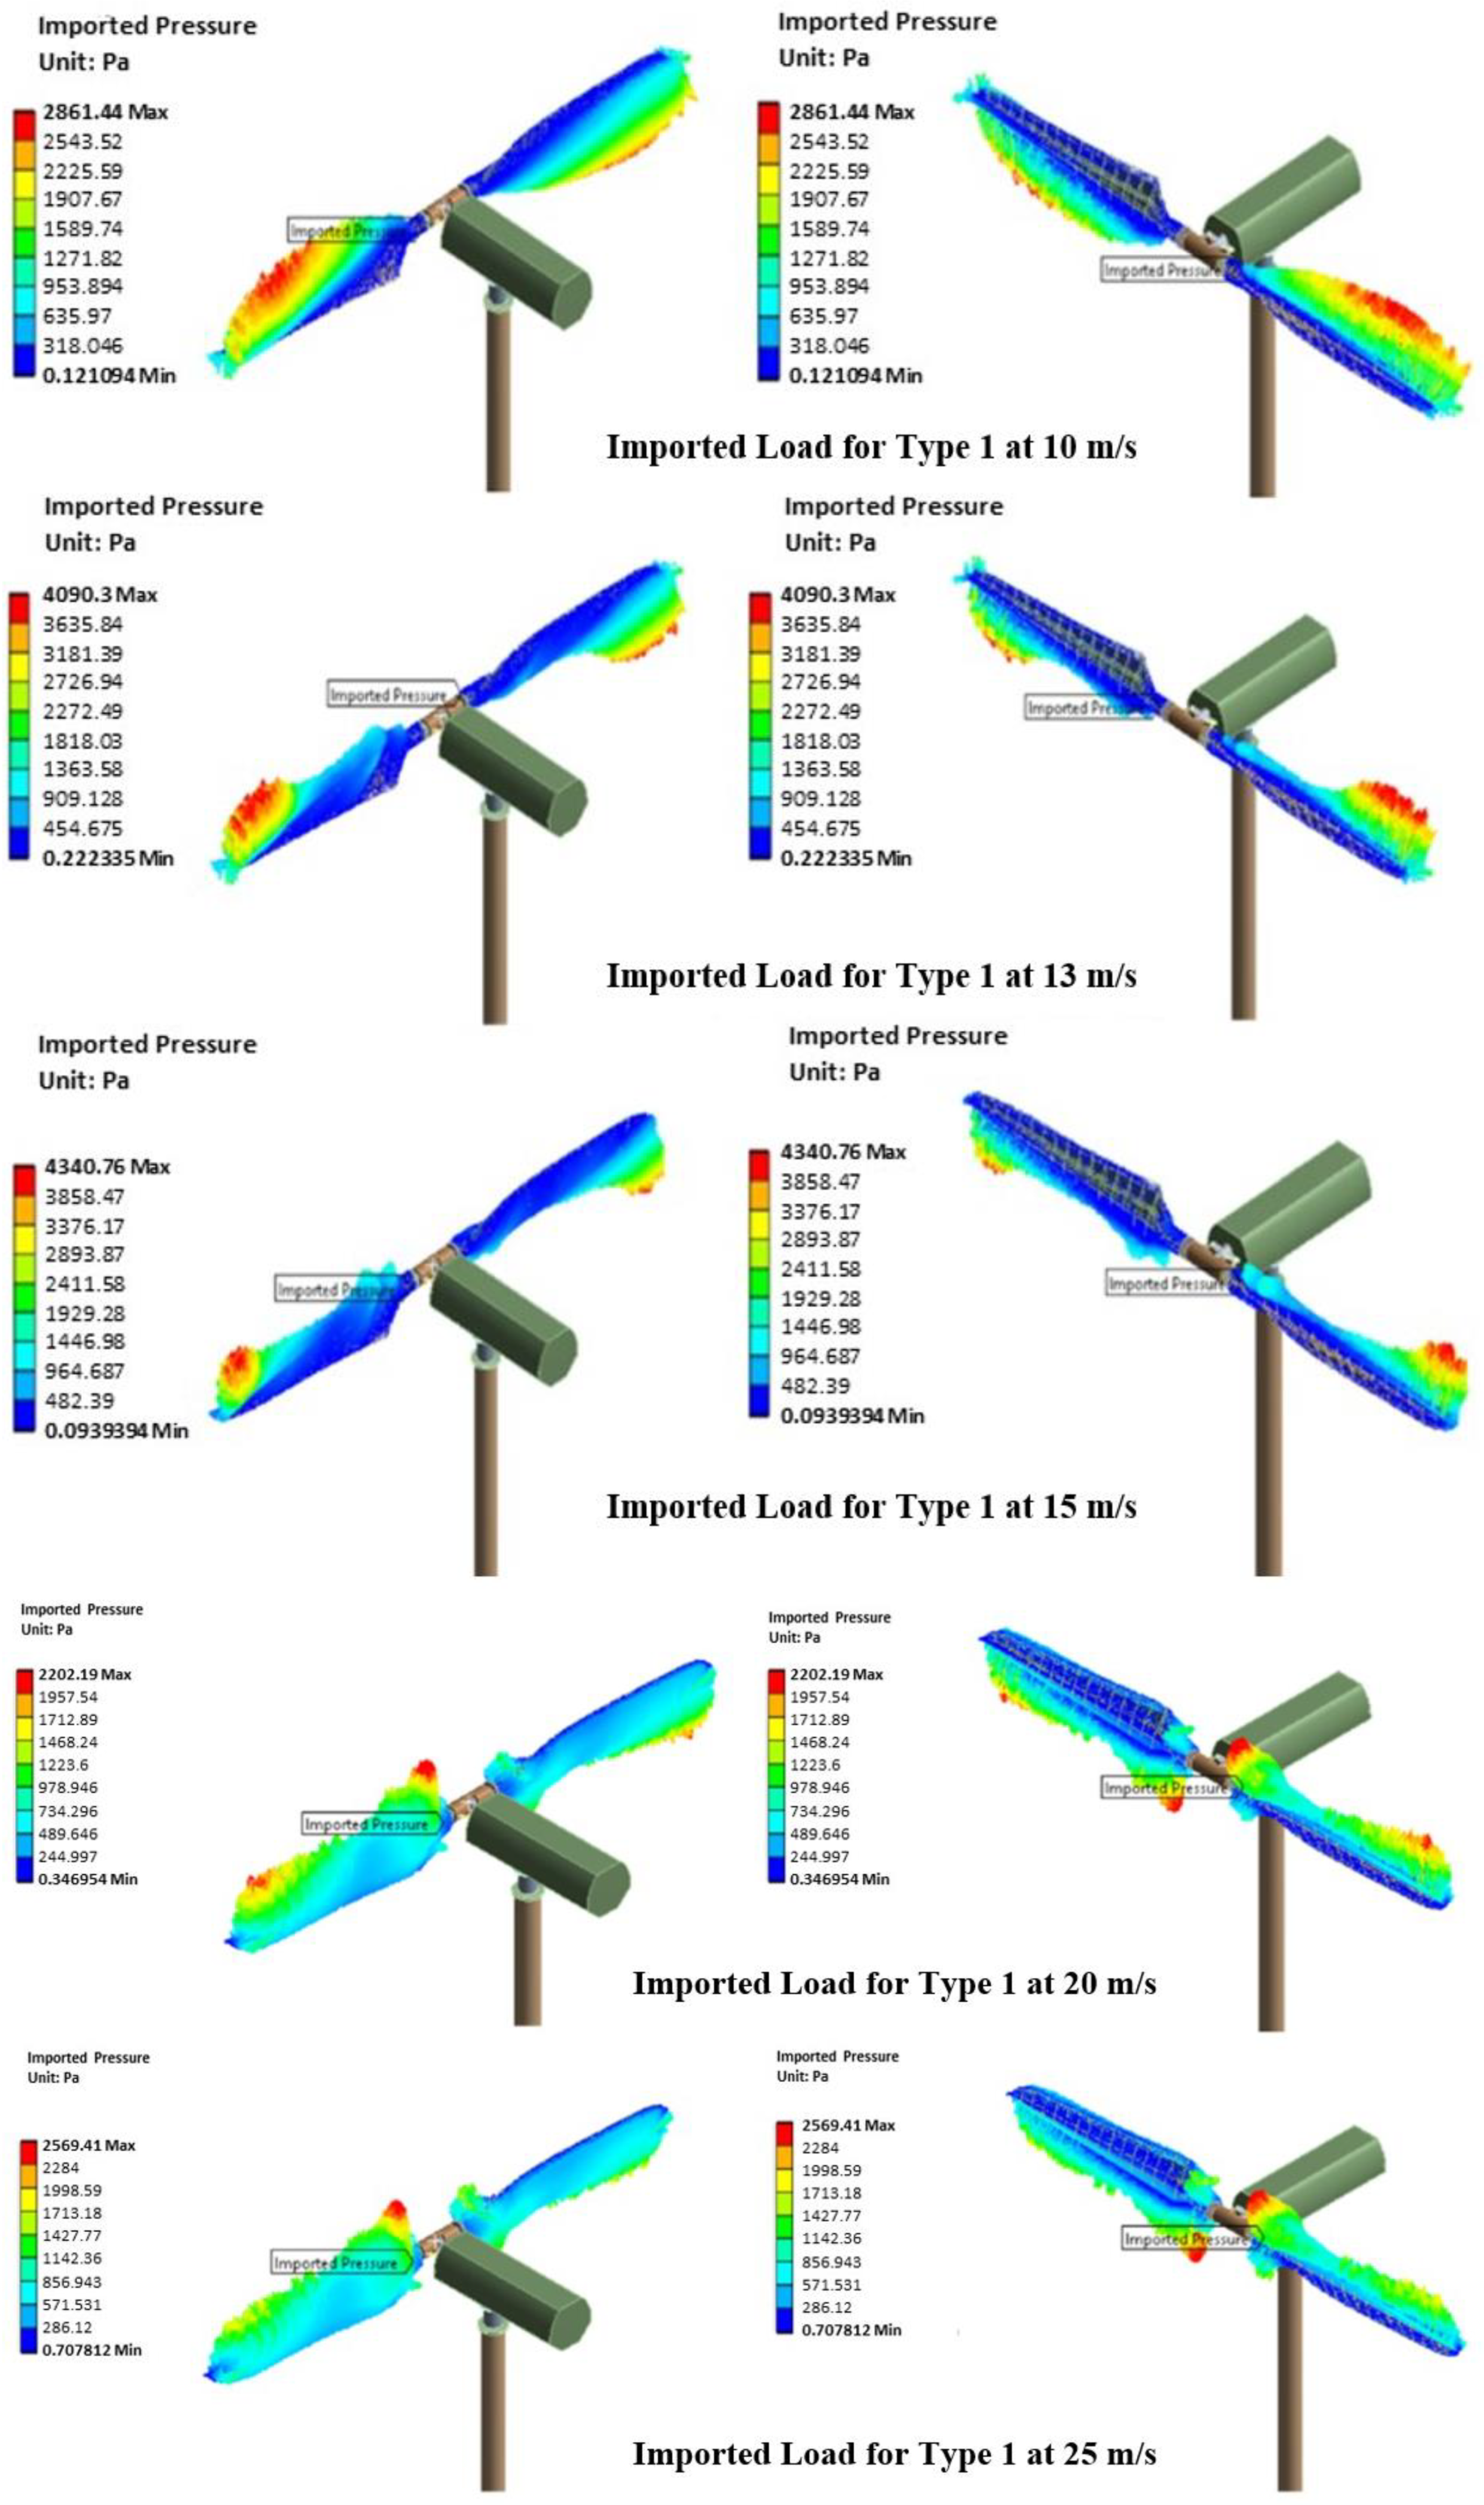
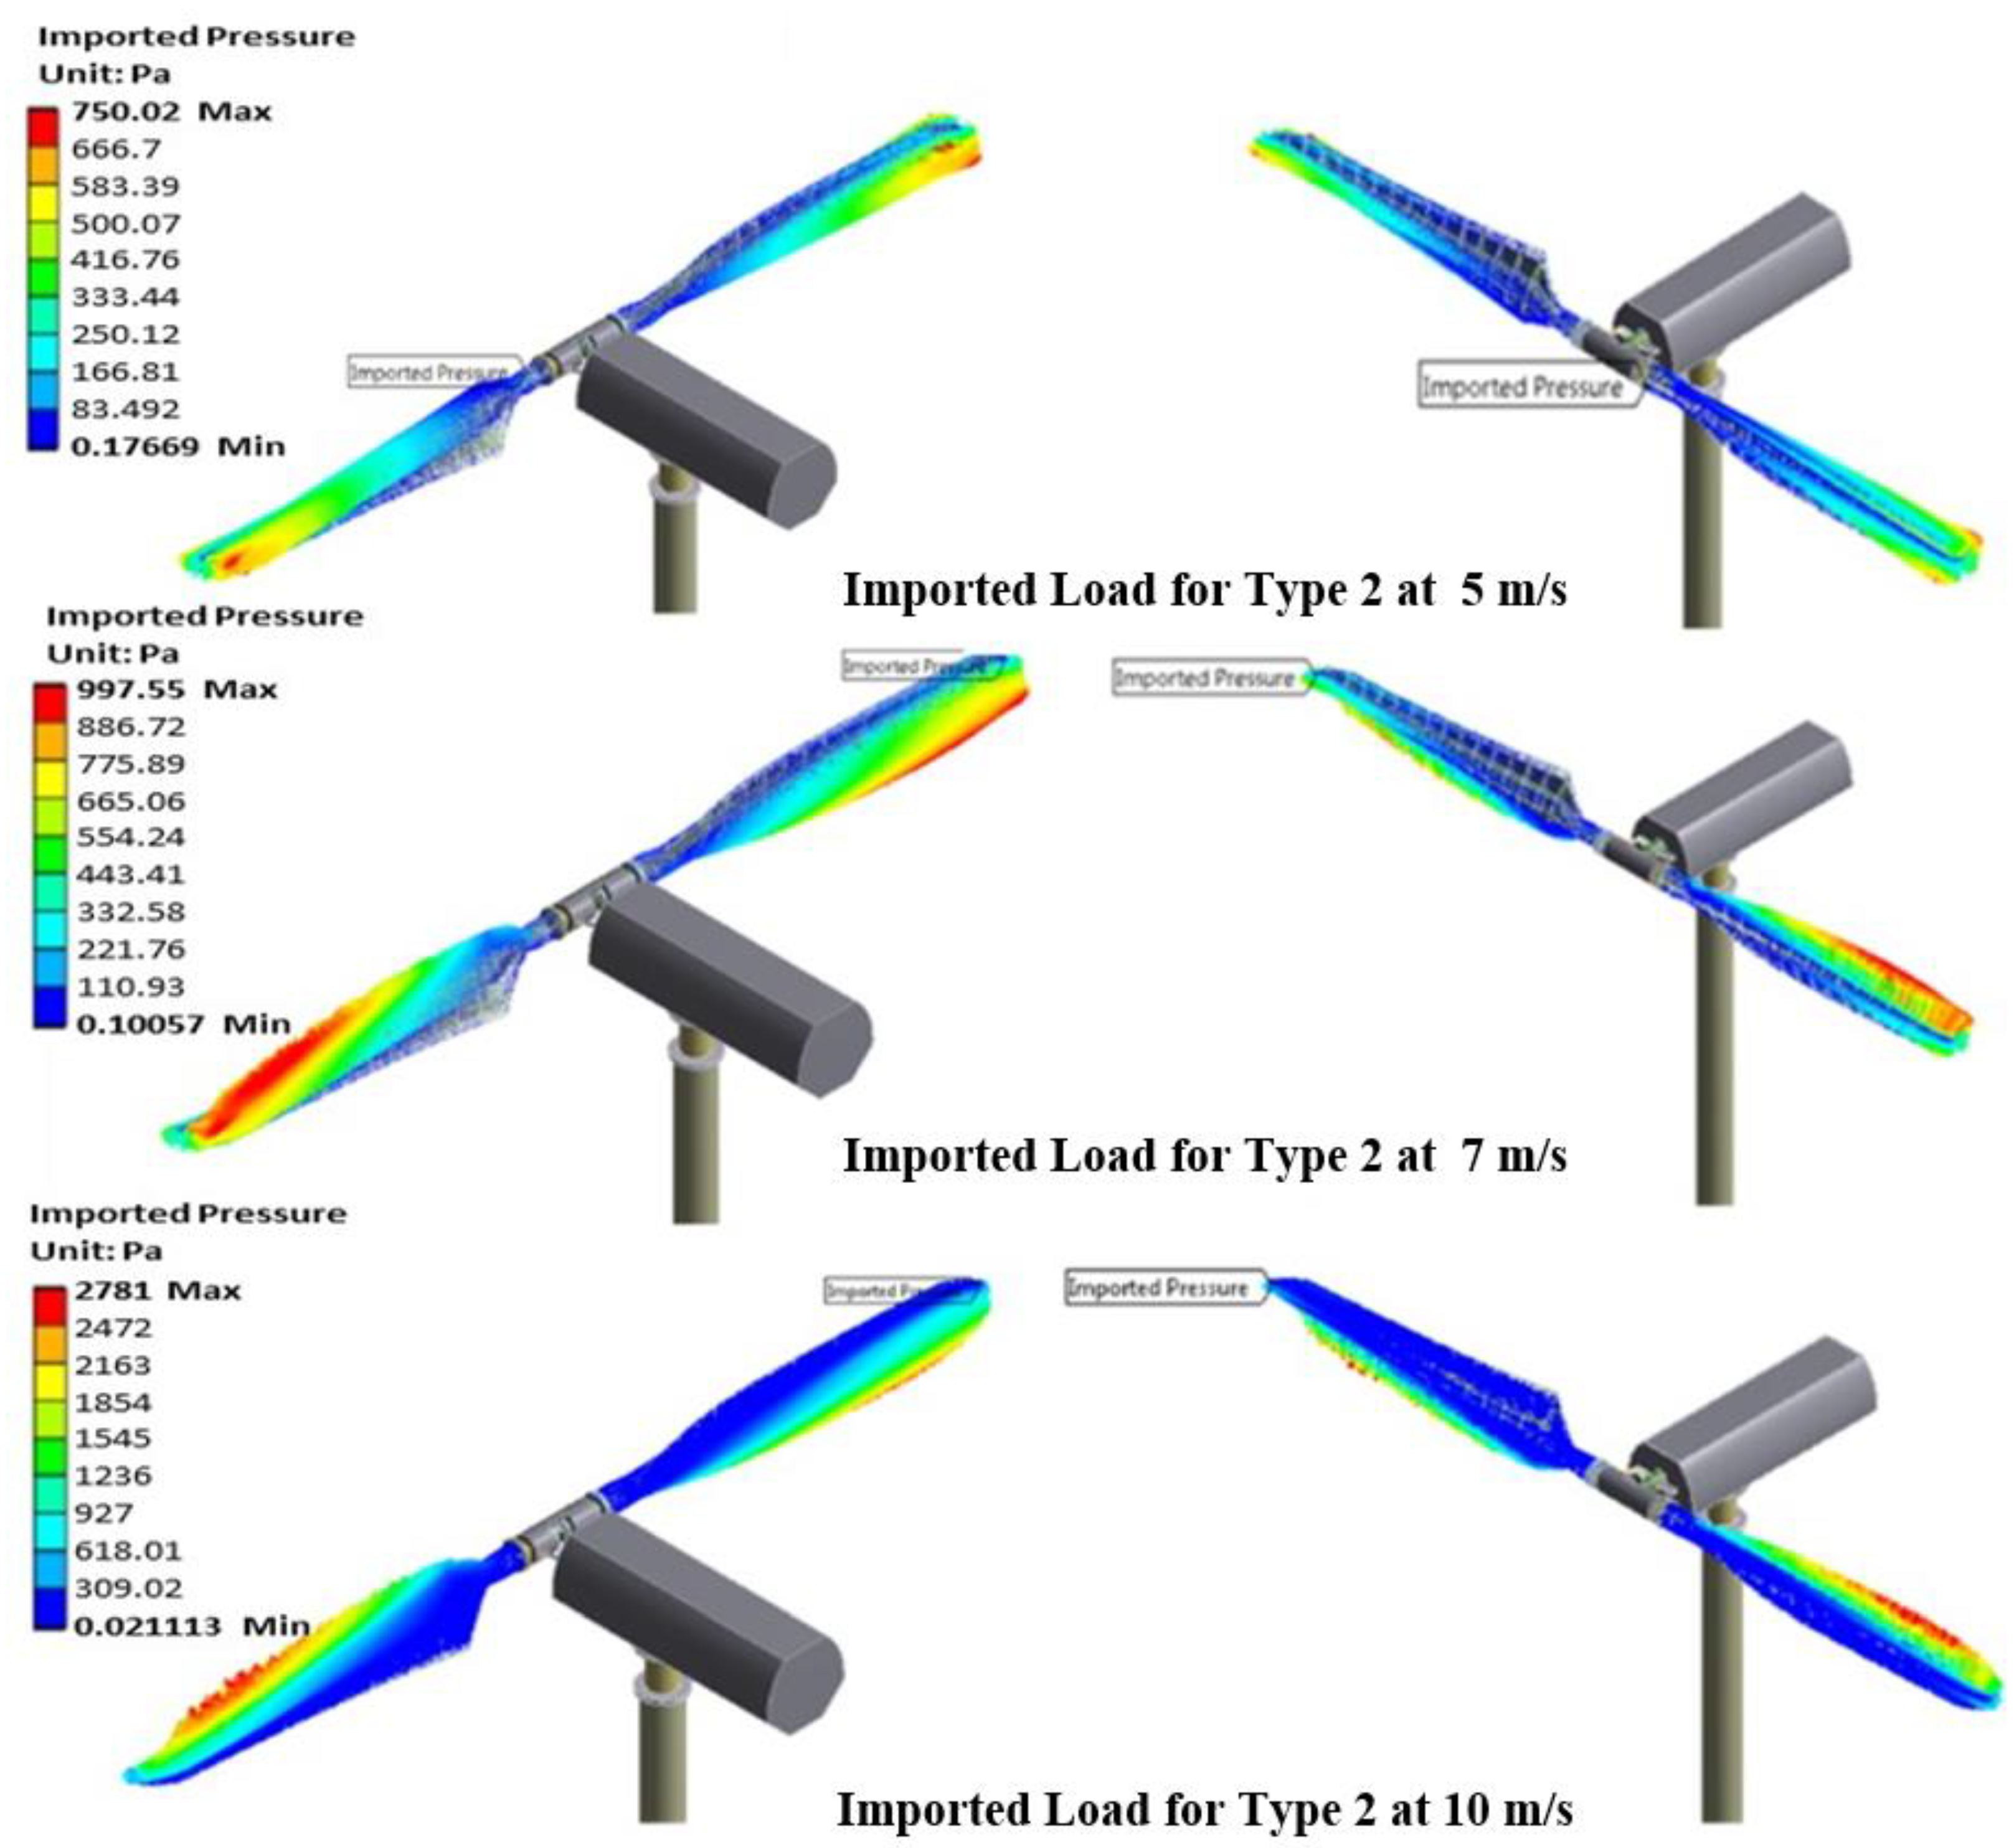
These imported loads (pressure) are presented in the following isometric views for each type of blade tip at different wind speeds, i.e., 5 m/s, 7 m/s, 10 m/s, 13 m/s, 15 m/s, 20 m/s, and 25 m/s.
For the blade modified with a Type 1 tip shape as shown in Figure 13, at low wind speeds of 5 m/s and 7 m/s, the maximum pressures for each case are 773.80 Pa and 1495.89 Pa, respectively. A drastic color variation is observed at its leading edge near the tip, which indicates the occurrence of a strong suction pressure. On the other hand, minimum pressures for both speeds are found near the hub and indicated by the blue color on the plot. Pressure magnitude is relatively increased over the span on the back side of the blades, i.e., the “suction side”. The pressure distribution on the surface is significantly affected by the wind speed as shown in the cases of medium- and high-wind speeds. Although the pressure distribution at 10 m/s seems to follow a similar pattern for the cases at lower wind speeds, the suction areas at the leading edge near the tip for speeds 13 m/s and 15 m/s are significantly decreased. It is also shown that at these speeds, unstable pressure distribution starts to present in the hub region. This observation is believed to be due to the occurrence of complex flow separation at these speeds. Moreover, the flow over the blades at higher wind speeds is fully separated across the span of the blade. Therefore, the suction pressure is not only placed at the leading edge near the tip and does not necessarily represent the maximum magnitude of the pressure. Suction effects at these speeds appear stronger on the leading edge near the hub.
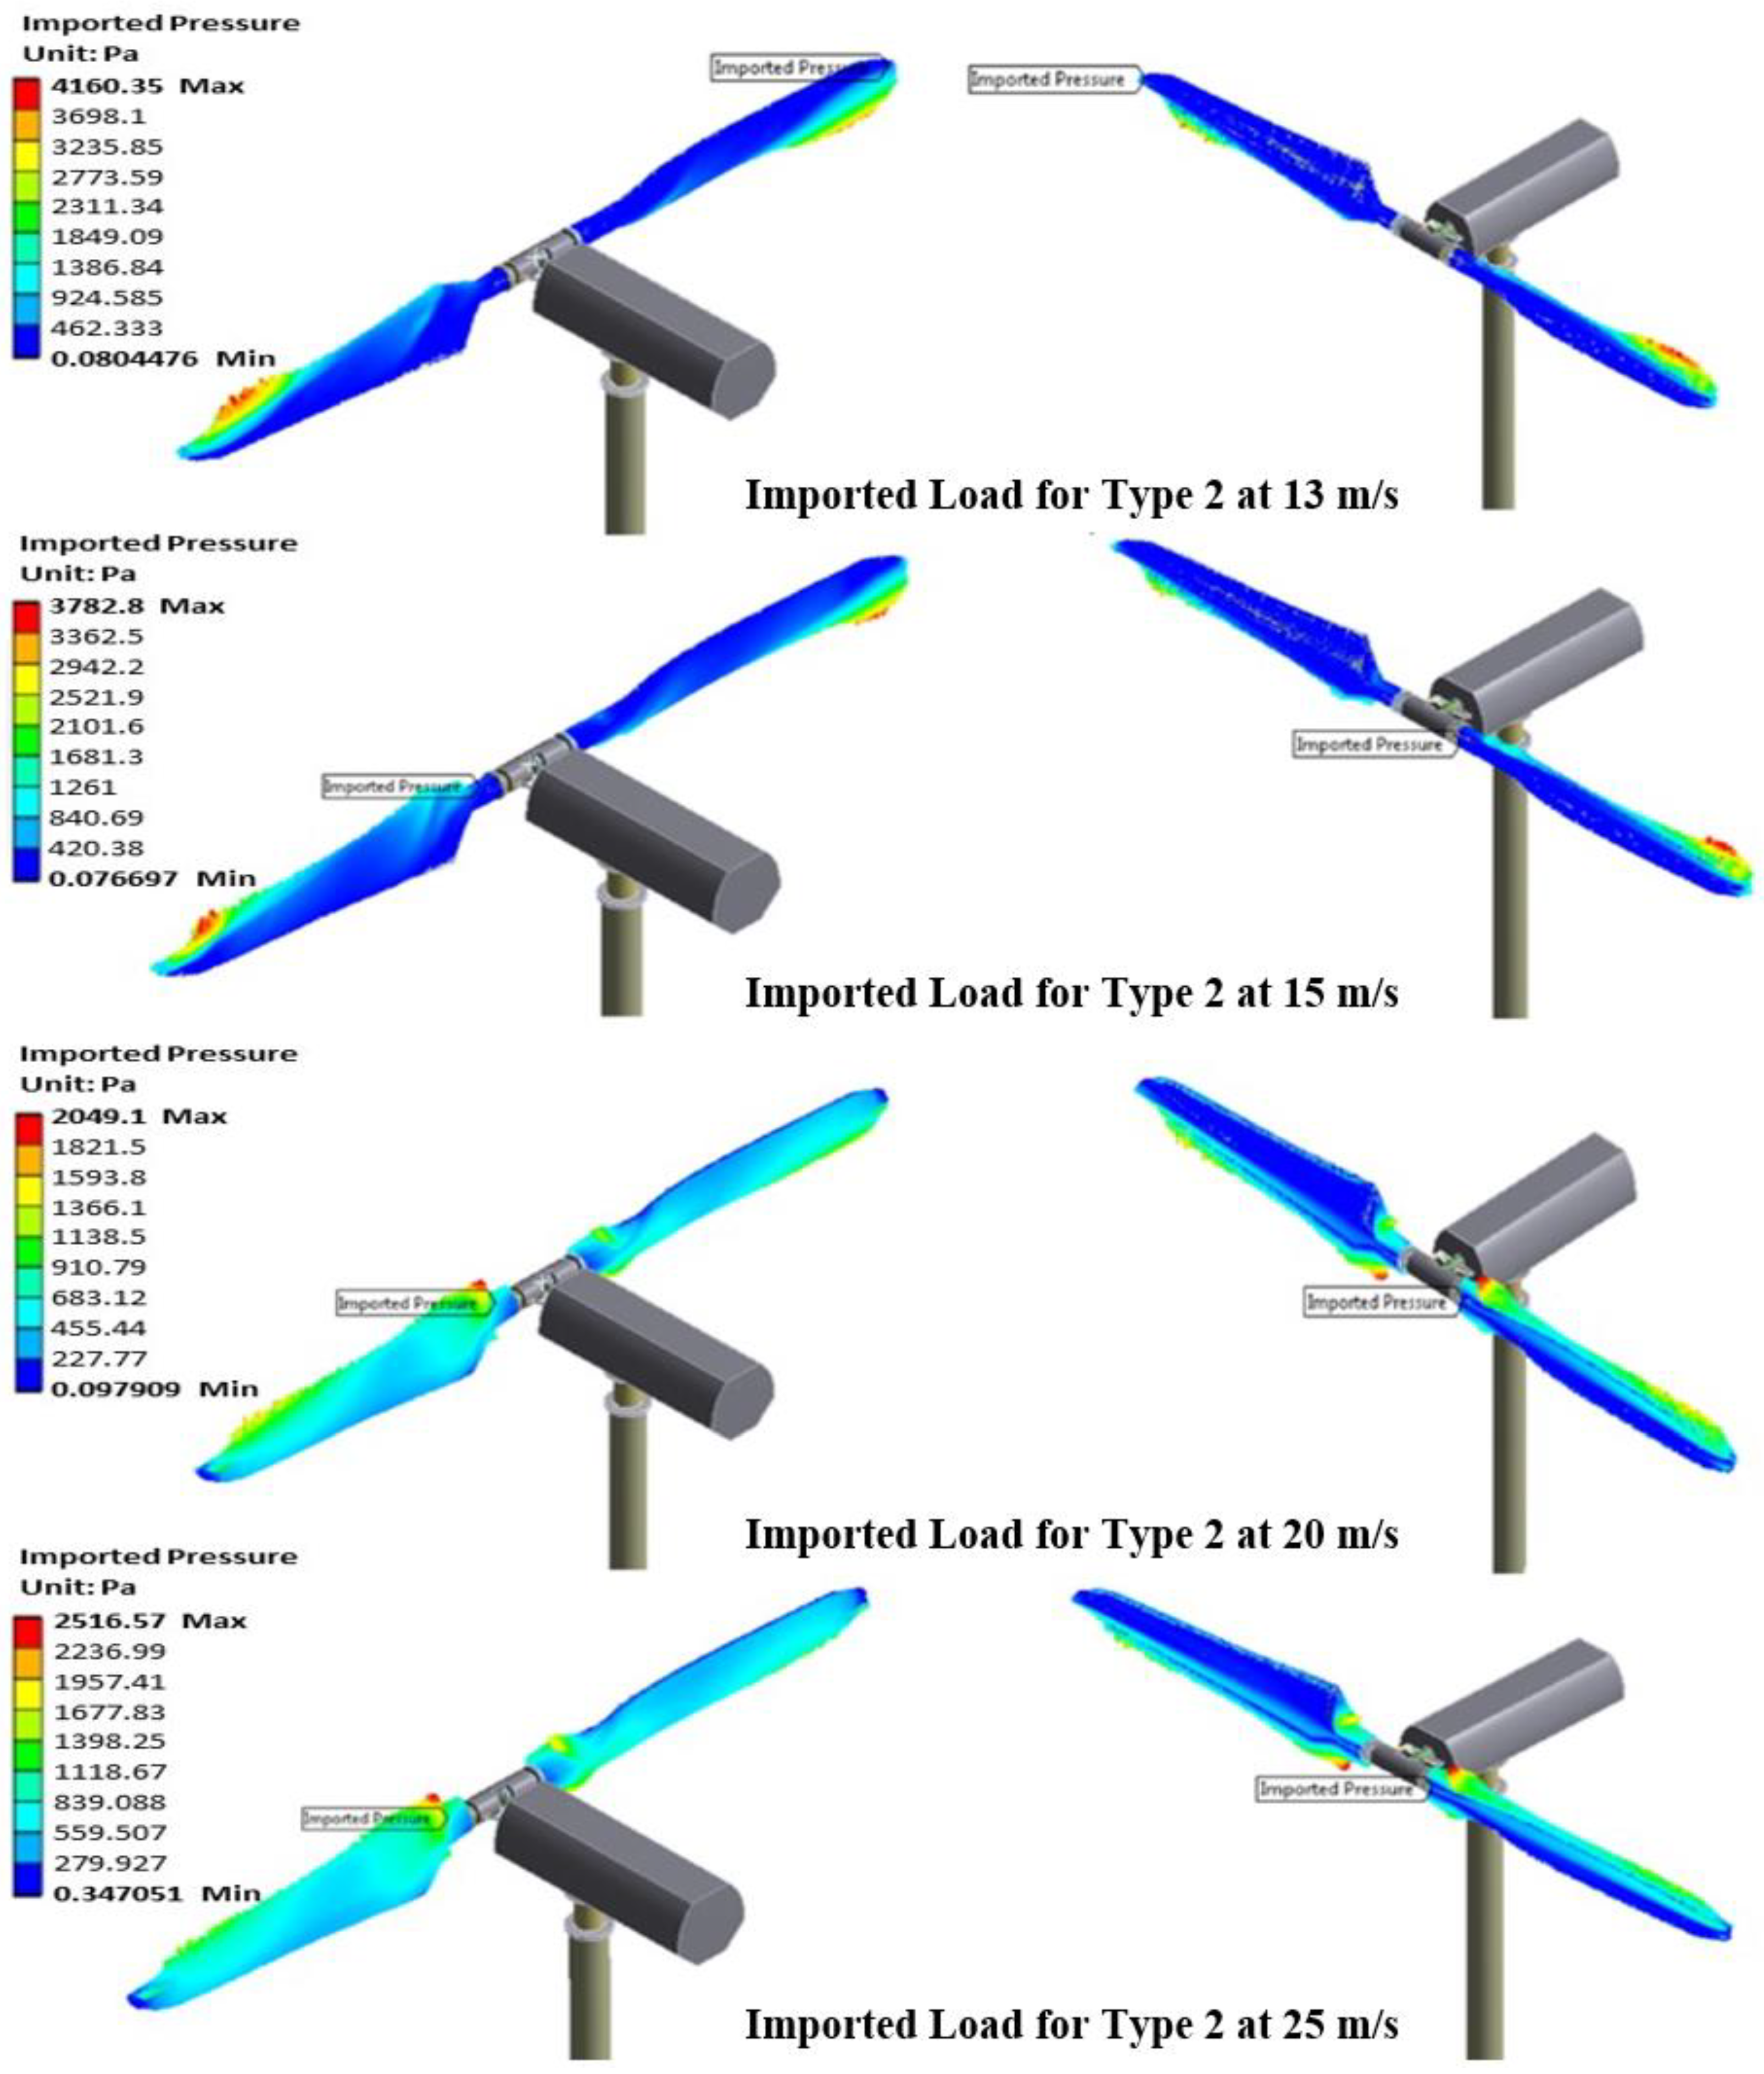
The pressure distributions after being imported to the structural solver for blades with a Type 2 tip are presented for all wind speeds in 
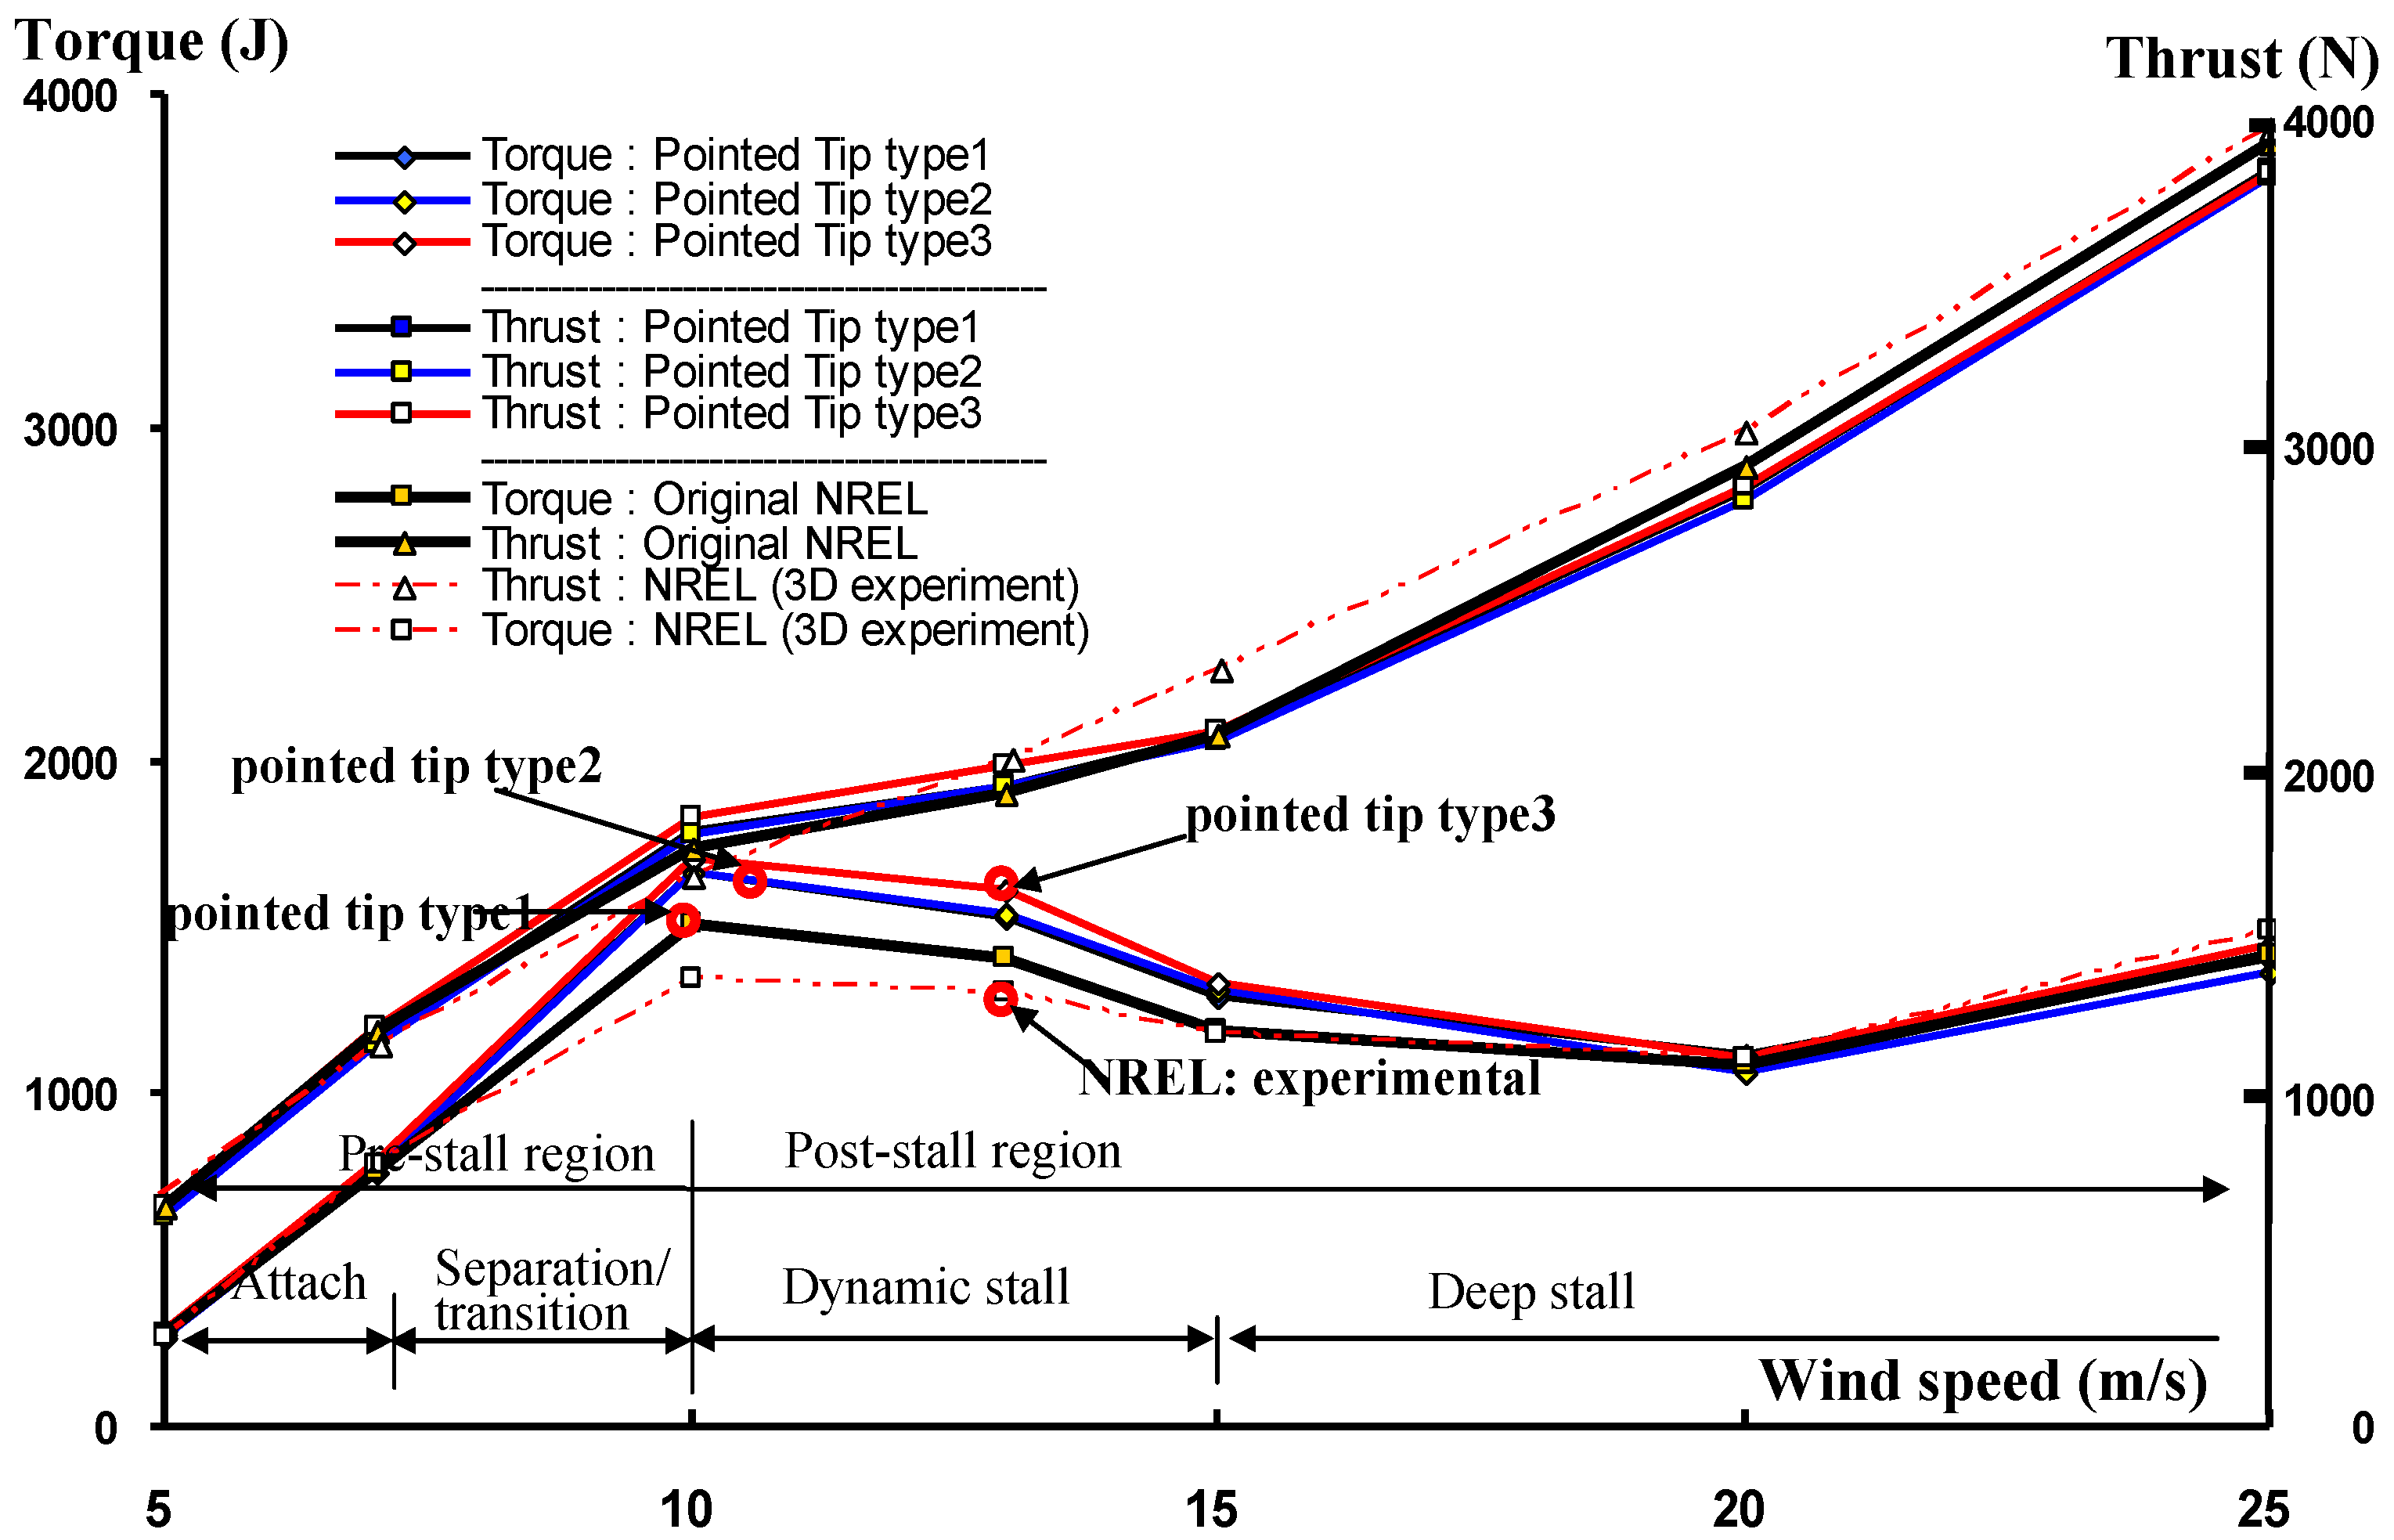
Figure 14. The effects of varying wind speeds and stall phenomenon are straightforward. In the pre-stall region (5 m/s and 7 m/s), the maximum pressure magnitude was seen to occur at the tip of the blade. In the dynamic stall region (10 m/s, 13 m/s, and 15 m/s), the suction effect was stronger at the leading edge near to the tip. The suction is more concentrated at the hub’s leading-edge location for the last two wind speeds that fall into the deep stall region (20 m/s and 25 m/s).
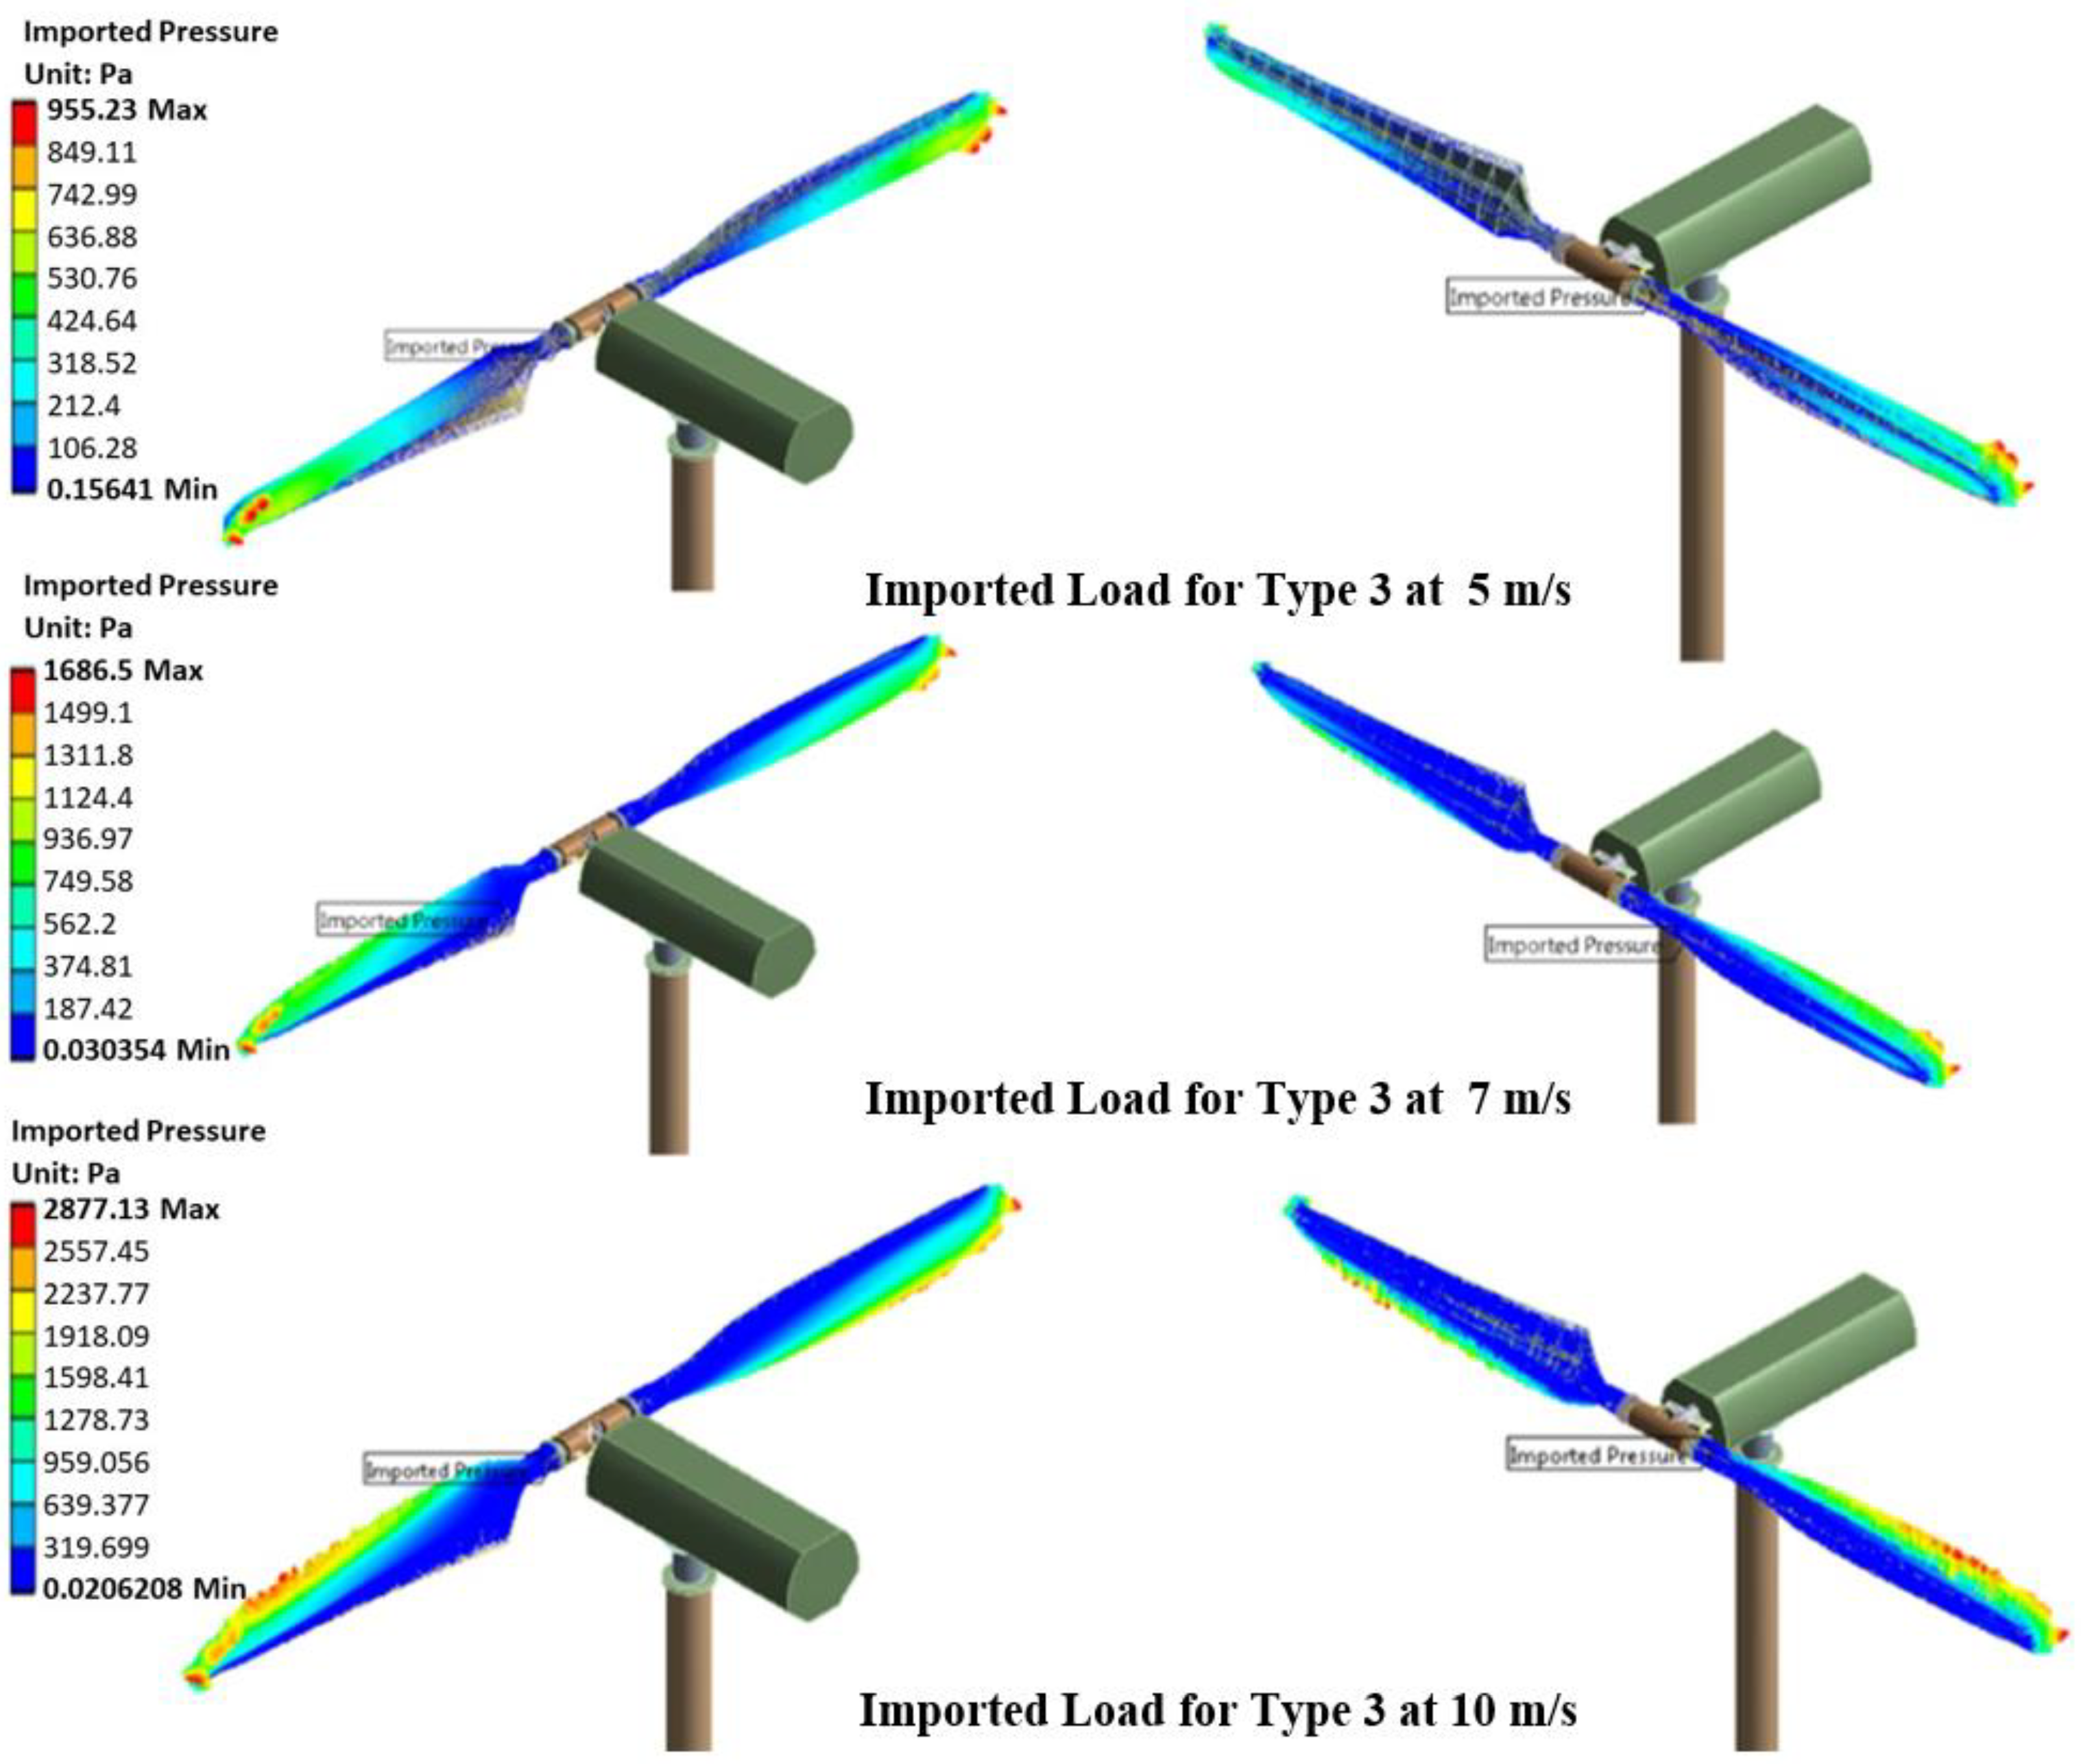
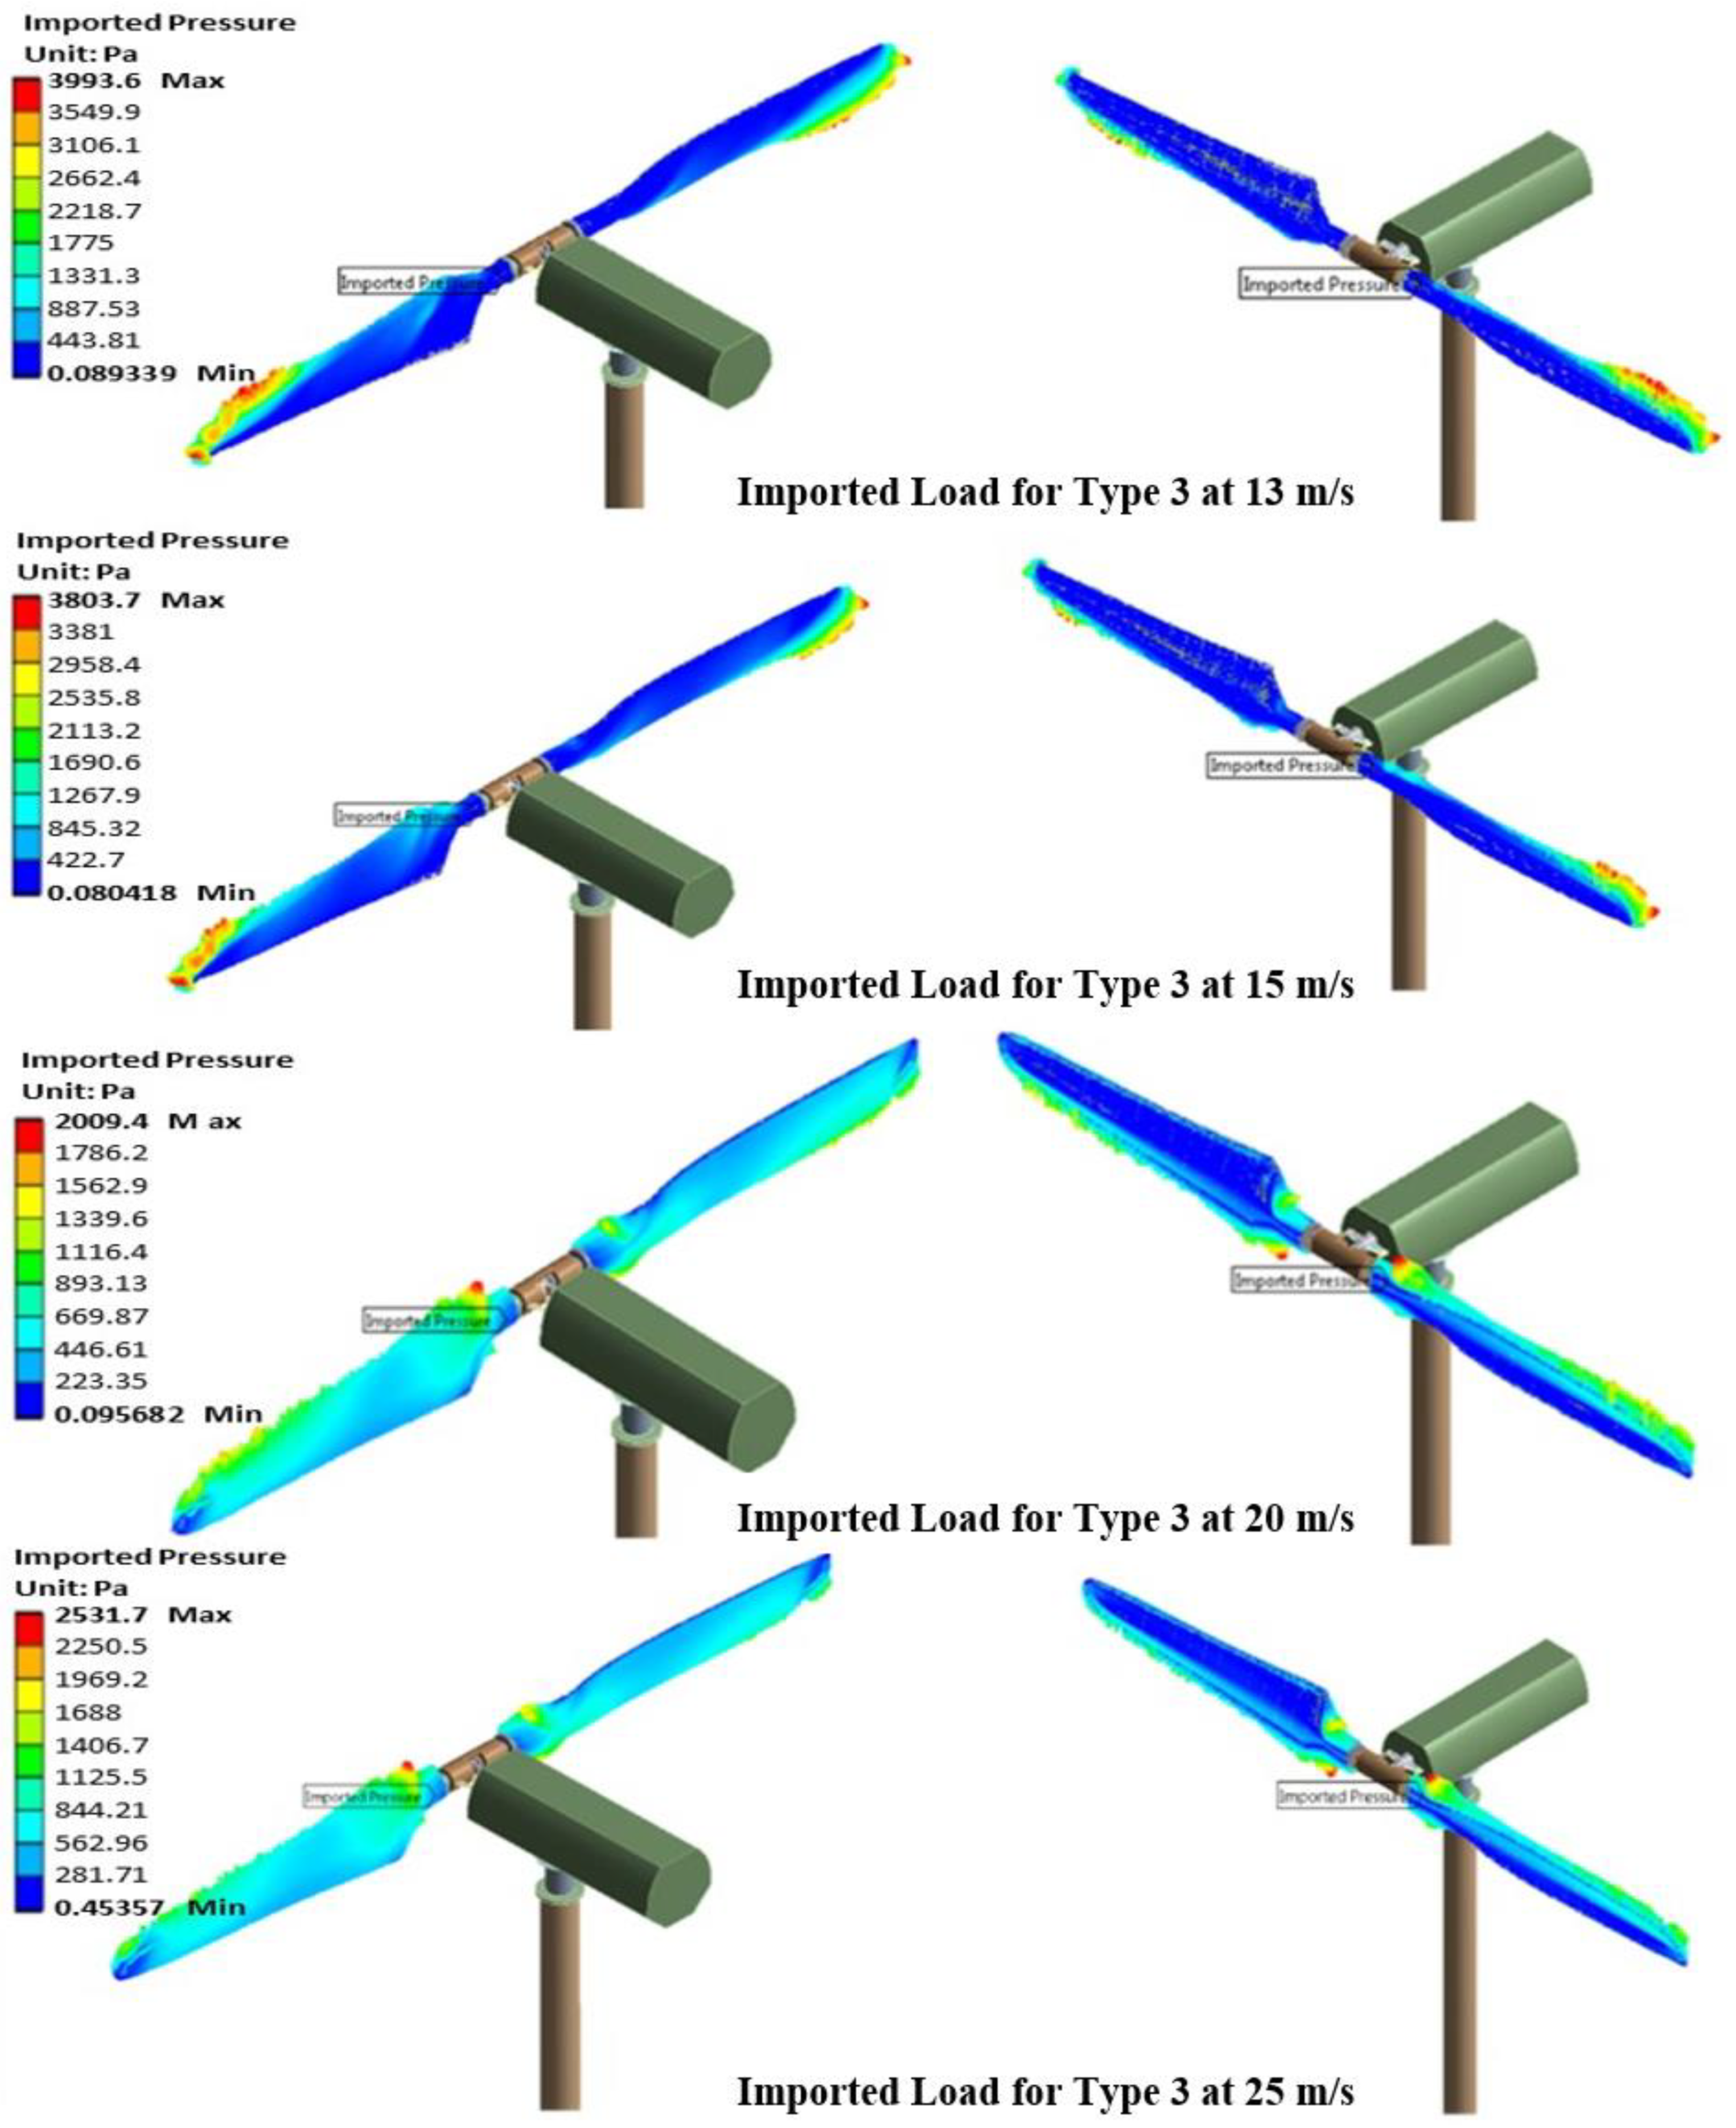
The pressure distributions on the blade with a Type 3 tip for all wind speeds are presented in Figure 15. The maximum pressure magnitude for the Type 3 blade was higher compared with the two other blades at 5 m/s, 7 m/s, and 10 m/s. The maximum pressure magnitude increased with the increase in the wind speed for those cases. The effect of flow separation started to show at the wind speed of 13 m/s. The influence of flow separation was remarkable on the maximum pressure magnitude in that it decreased from 3993 Pa at a 13 m/s wind speed to 3802 Pa at 15 m/s. In the deep stall region, the maximum pressure magnitude was seen to increase from 2009 Pa at 20 m/s to 2531 Pa at 25 m/s.
In short, at low wind speeds, the pressure distribution on the blade’s surface is found to be larger at the tip of the back side of the blades. The velocity at the tip is normally larger than the region near the hub; therefore, the pressure magnitude in that region increases due to the velocity difference between the suction side and the pressure side.
At medium wind speeds, the blade lays in three complex stall regions—the transition region, the dynamic stall region, and the deep stall region. This phenomenon results in a decrease in the suction area near the tip as the wind speed increases. The pressure reaches its maximum value in this wind speed region. As the wind speed continues to increase, a suction area occurs near the hub and the pressure magnitudes decrease compared to those of the medium wind speeds.

3.2. Directional Displacement

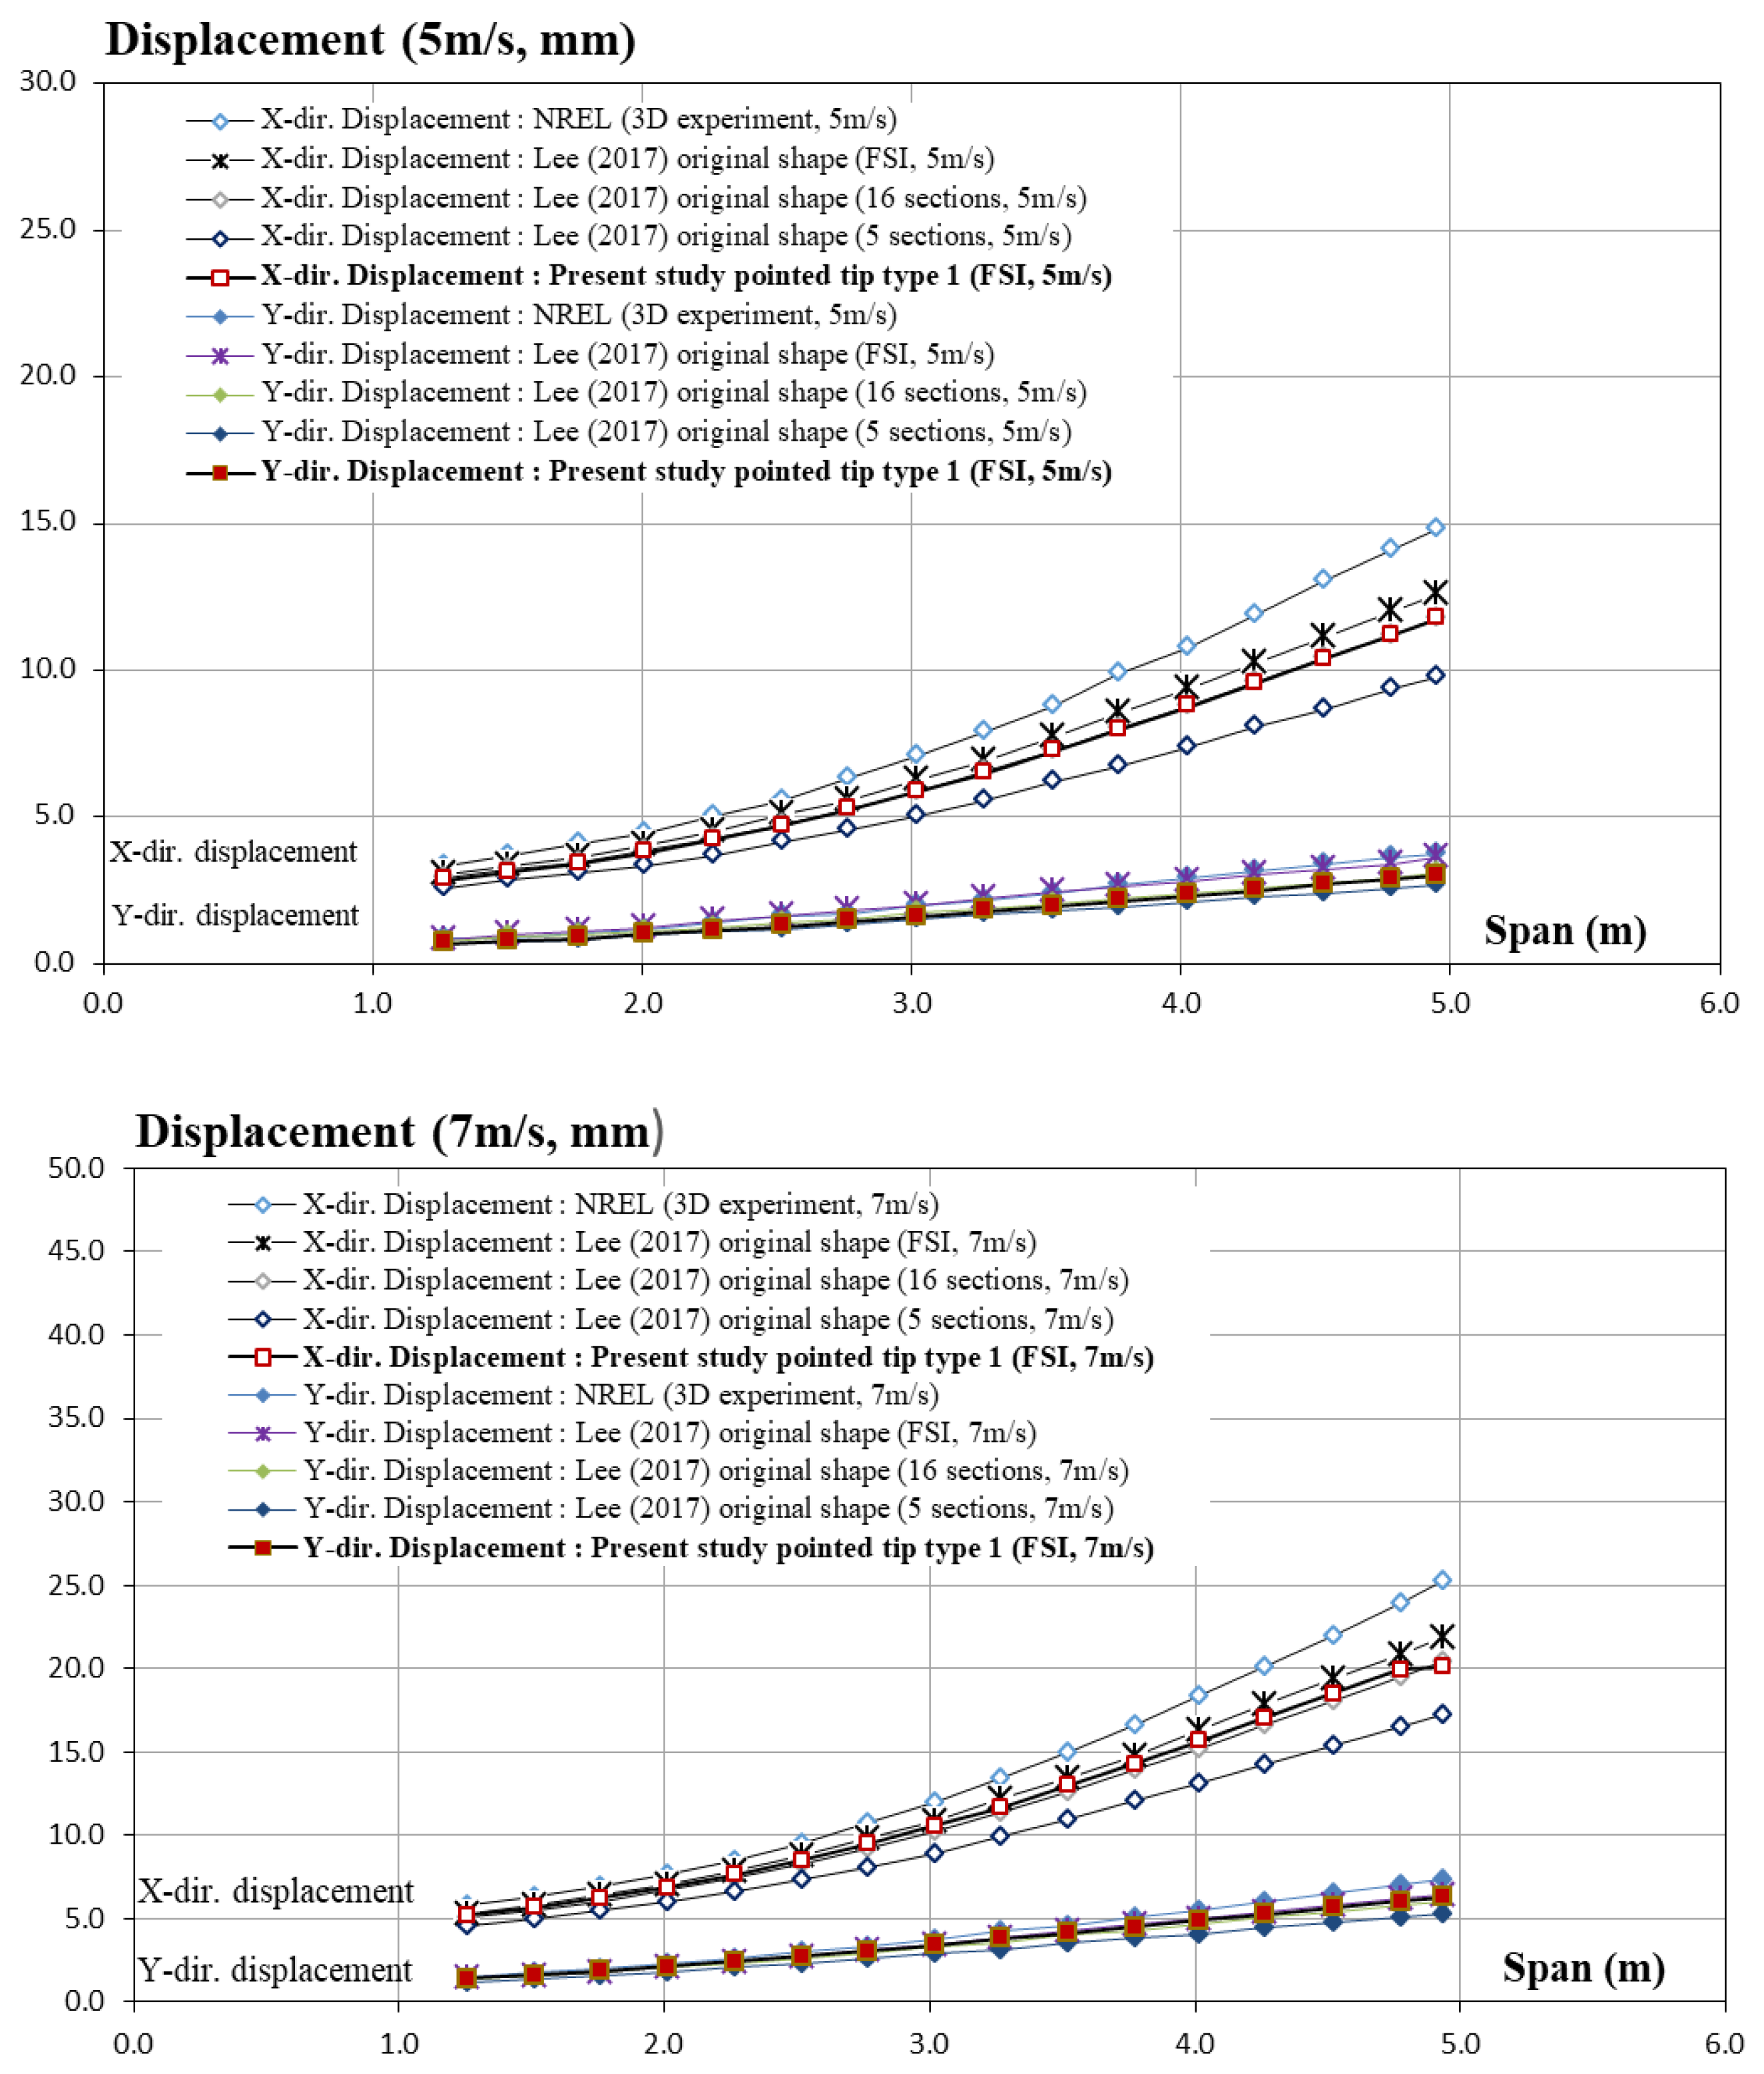
The pressure distribution on the turbine blades results in structural deformations of the whole wind turbine. In this section, the directional displacements of blades with a Type 1 tip in the X-axis (flow’s direction) and Y-axis (direction of the blade rotation) are extracted at 16 sections over the whole span and compared with the experimental measurements, the BEM (for both 5 and 16 sections), and the FSI results of blades with the NREL original shape. X- and Y-direction displacements are plotted in the same graph for each wind speed case. For all speed values, the deformation in the downstream direction (X-axis) is found to be larger than the one along the Y-axis. Figure 16 presents the displacements along the blade span at wind speeds of 5 m/s and 7 m/s. In both cases, the deformation from NREL measuring is the largest. Smaller displacements for a Type 1 blade are found compared to the FSI results using the original shape. The results were close to the results of the BEM analysis with 16 sections. The BEM results using five sections, however, show a significantly larger deviation from the experimental results. At low wind speeds (5 m/s and 7 m/s), the Type 1 blade resulted in less deformation than the blade of its original shape for both experimental measurements and FSI analysis. In the relevant CFD analysis [26], the thrust force of a Type 1 blade was found to be slightly less than that of the original blade. It indicates that the structural deformation along the X-axis is expected to be smaller. The structural results are, therefore, in good agreement with the previous CFD simulations, and the thrust effect of the pointed-tip shape can be found in the structural displacements over the span.
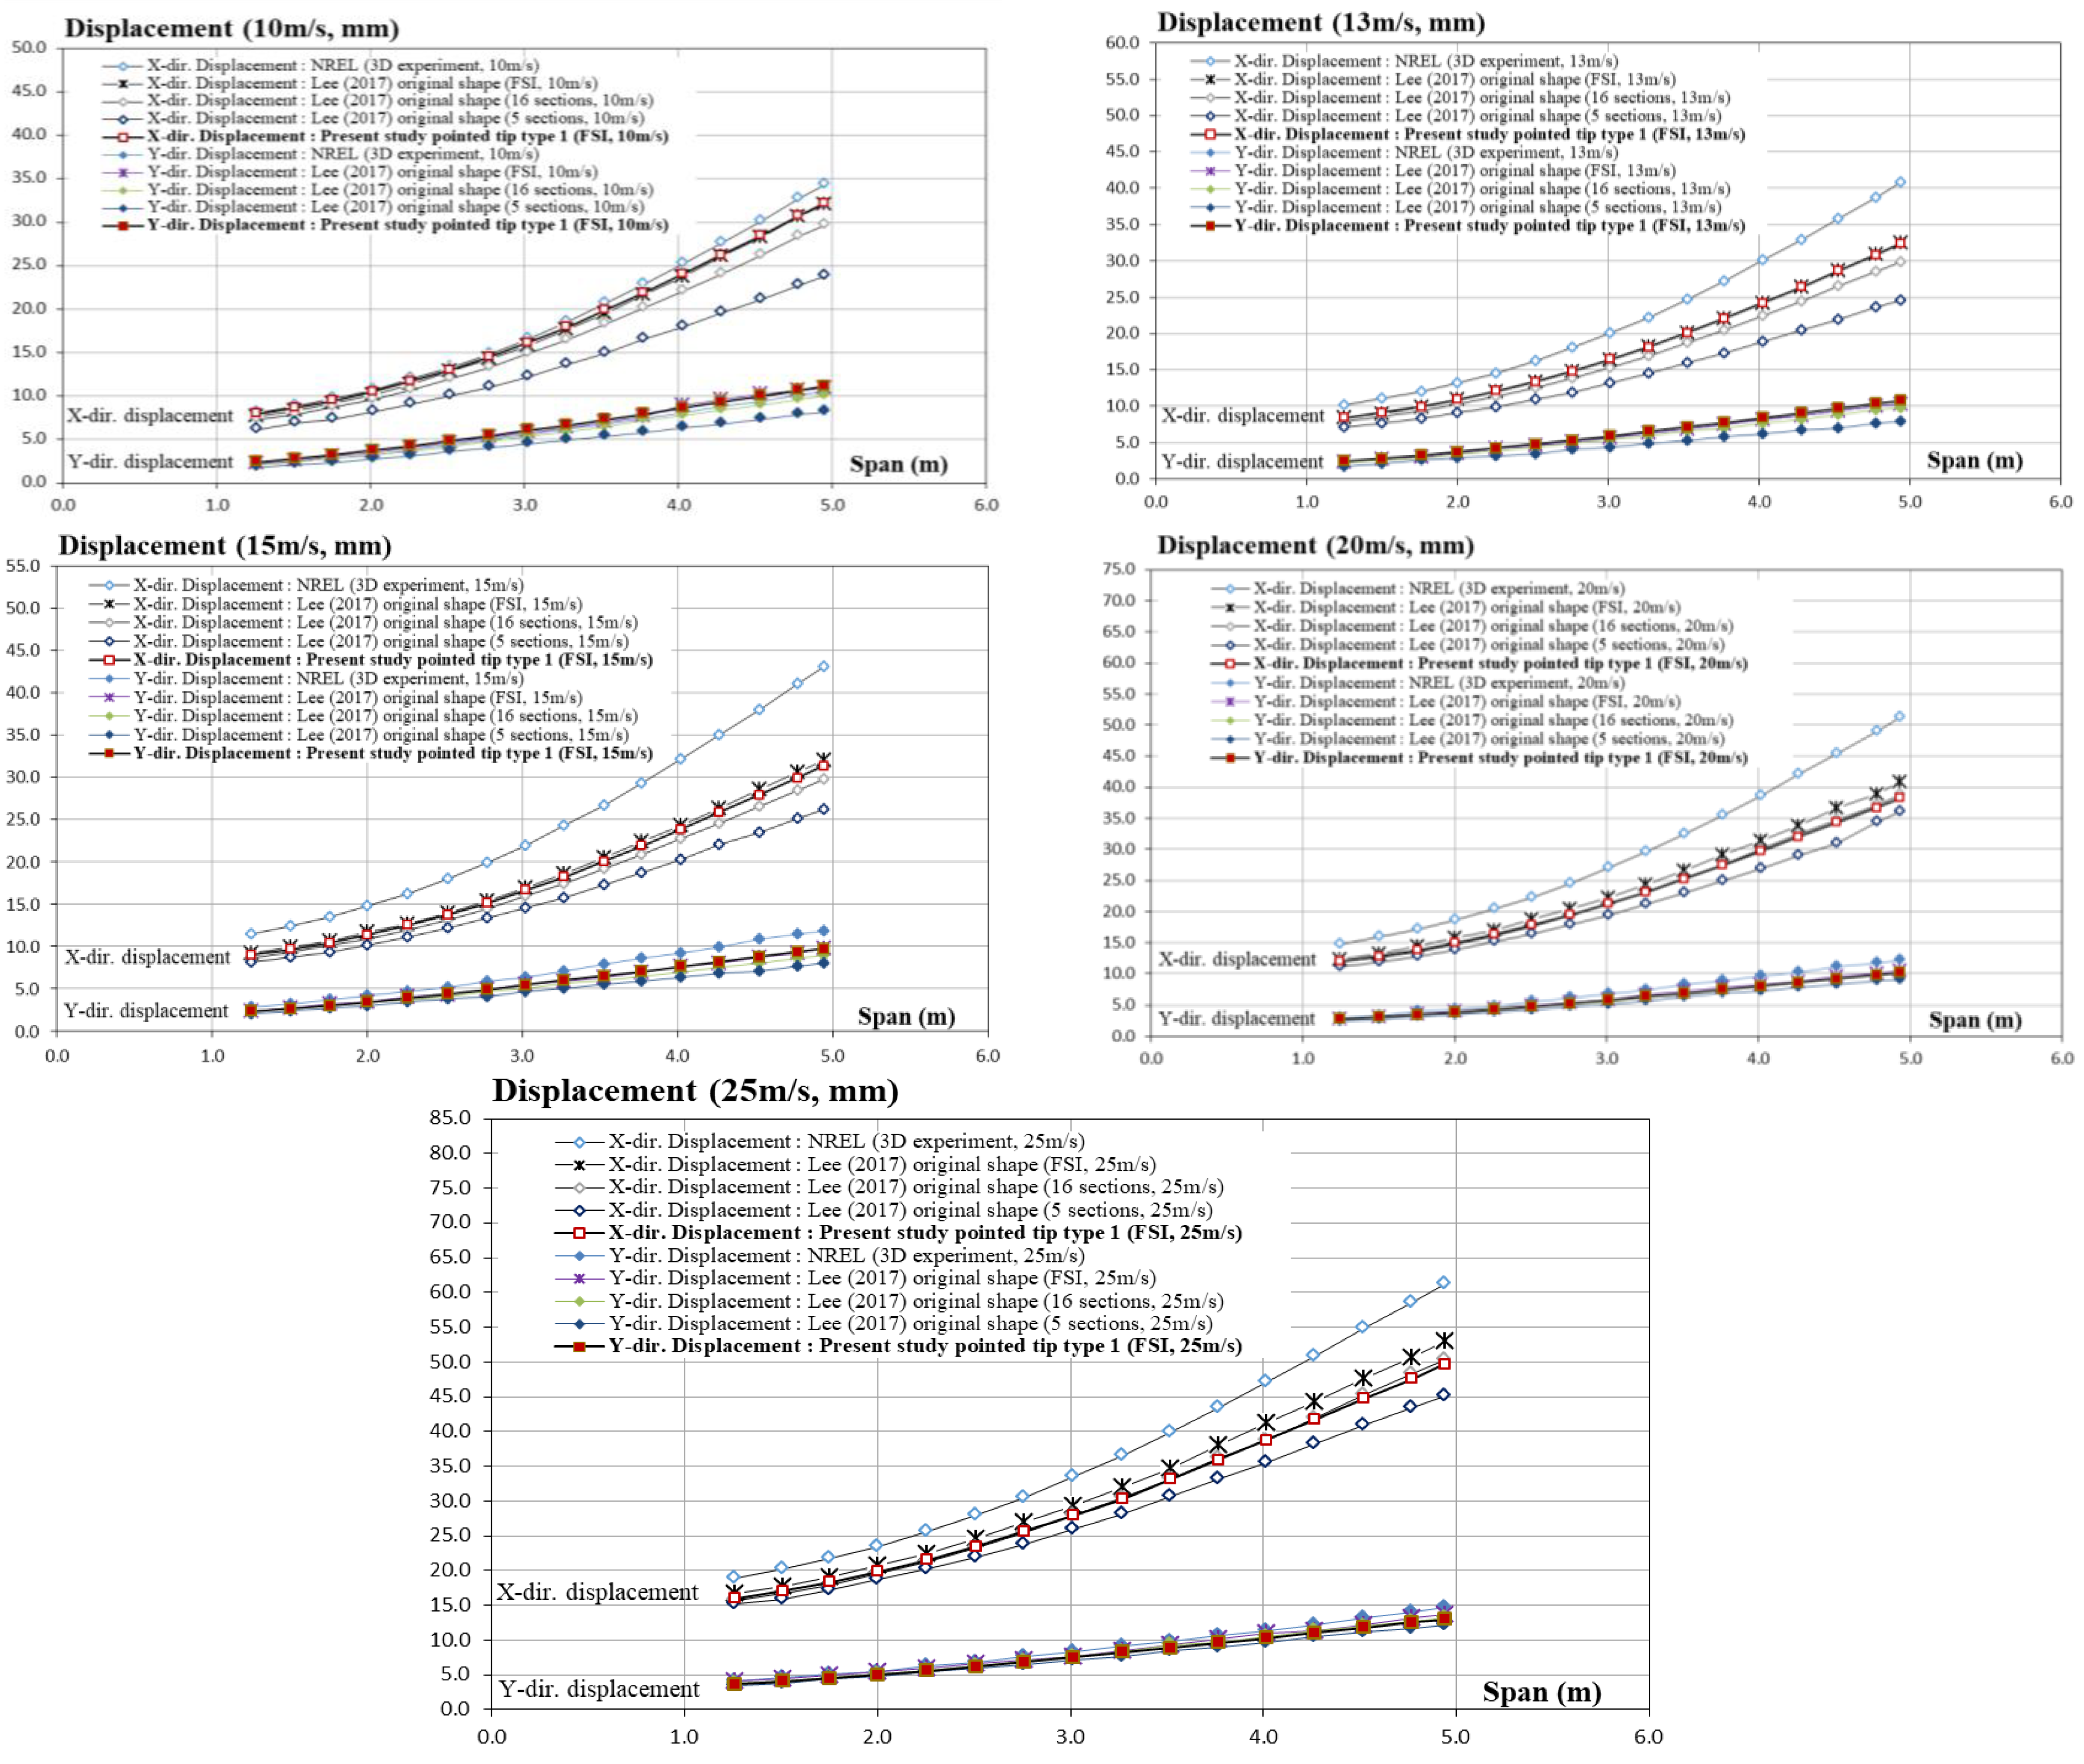
These X- and Y-displacements increase with the wind speed, as seen in Figure 17. At a wind speed of 10 m/s, the X-displacement reached 33 mm at the tip for the pointed shape (Type 1) which is 13 mm more than the displacement found at 7 m/s. It can be seen that the X-displacements for this case are the same as those from the original shape using the FSI method. The experimental measurements provided the largest displacement, although the difference between the FSI results and experimental measurements was not large. It is worth noting that the effect of the fluid on the tower was not considered, which resulted in smaller displacement values for all FSI cases compared to the experimental results. The main objective was to compare the structural performances of the three pointed blades with the performances of the original NREL wind turbine blade using FSI method. The torque generated by the wind turbine with a pointed tip was found to be larger than the blade with the original tip shape at 10 m/s; therefore, the Y-axis displacements at this speed were slightly larger than the original shape.
At wind speeds of 13 m/s and 15 m/s, the thrust forces on a blade Type 1 and the original shape calculated in CFD analyses were found to be lower than the experimental measurements. Significant differences are also observed in the directional displacements, accordingly, as seen in 
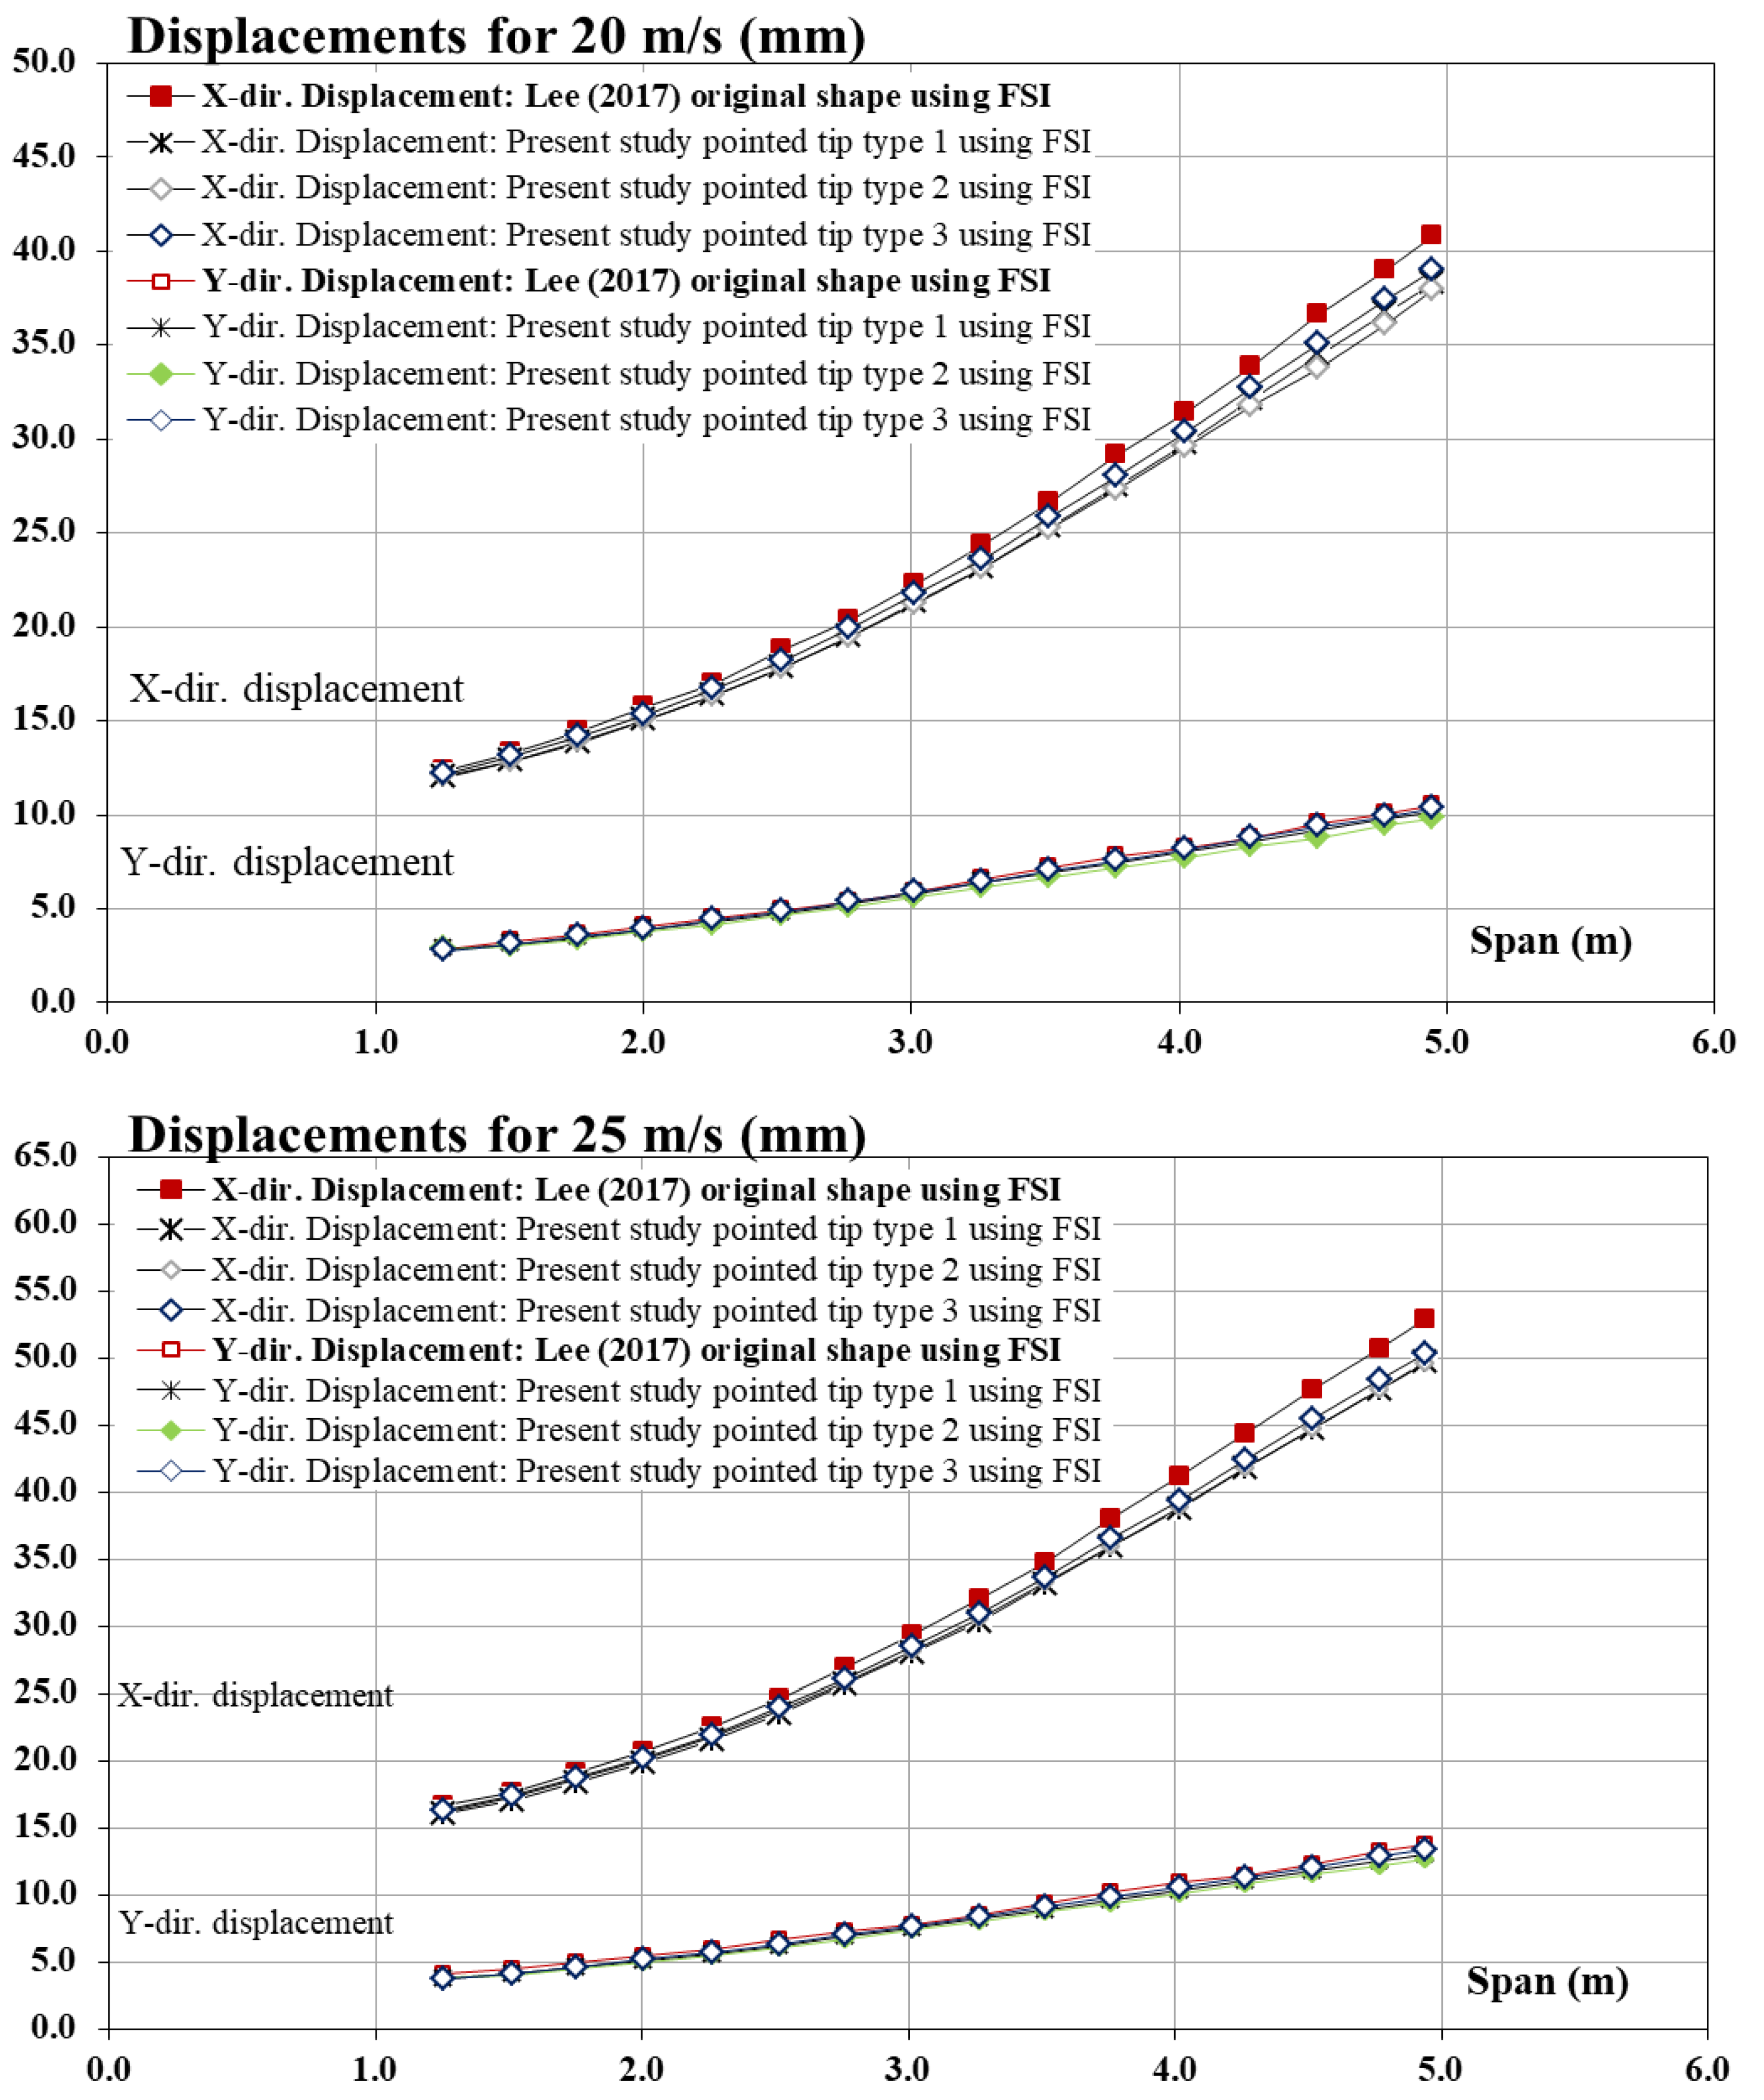
Figure 17. Furthermore, the CFD analysis results show no effects on the structural displacements between the tipped blade and the original blade at wind speeds of 10 m/s and 13 m/s. At a wind speed of 15 m/s, the shape effect is observed in the X-displacement values along the span. The pointed-tip X-displacements, in this case, were similar to the ones of the original NREL shape using FSI near the hub. Starting from approximately 60% of the span, the displacement of the tipped blade was slightly less than that of the original shape. For the medium wind speeds, the maximum X-directional displacements are observed to be in the range of 30–34 mm; meanwhile, the maximum value for Y-directional displacements remained between 9 mm and 11 mm.
At high speeds of 20 m/s and 25 m/s, the thrust value increased, which generated larger displacements in both X- and Y-directions. The displacements of blades with pointed tips were found to be less than those of the original shape. The results show that the X- and Y-displacements of the last section were increased by 29% from 20 m/s to 25 m/s, as seen in Figure 17.
The previous study has clearly shown that the deformation of the blades is dominated by the displacements along the X-axis. The blade modified with a Type 1 tip generates smaller displacements than the blade with the original shape in all wind speeds concerned in this study except 10 and 13 m/s. The blade with a Type 1 tip was observed to be subjected to lower thrust than the blade with the original shape and the shape effect was negligible at wind speeds of 10 m/s to 15 m/s due to the unstable flow observed within this region [26]. The shape effects demonstrated in the structural displacements were found to be similar to the original shape for wind speeds of 10 m/s and 13 m/s, and negligible for the wind speed of 15 m/s.
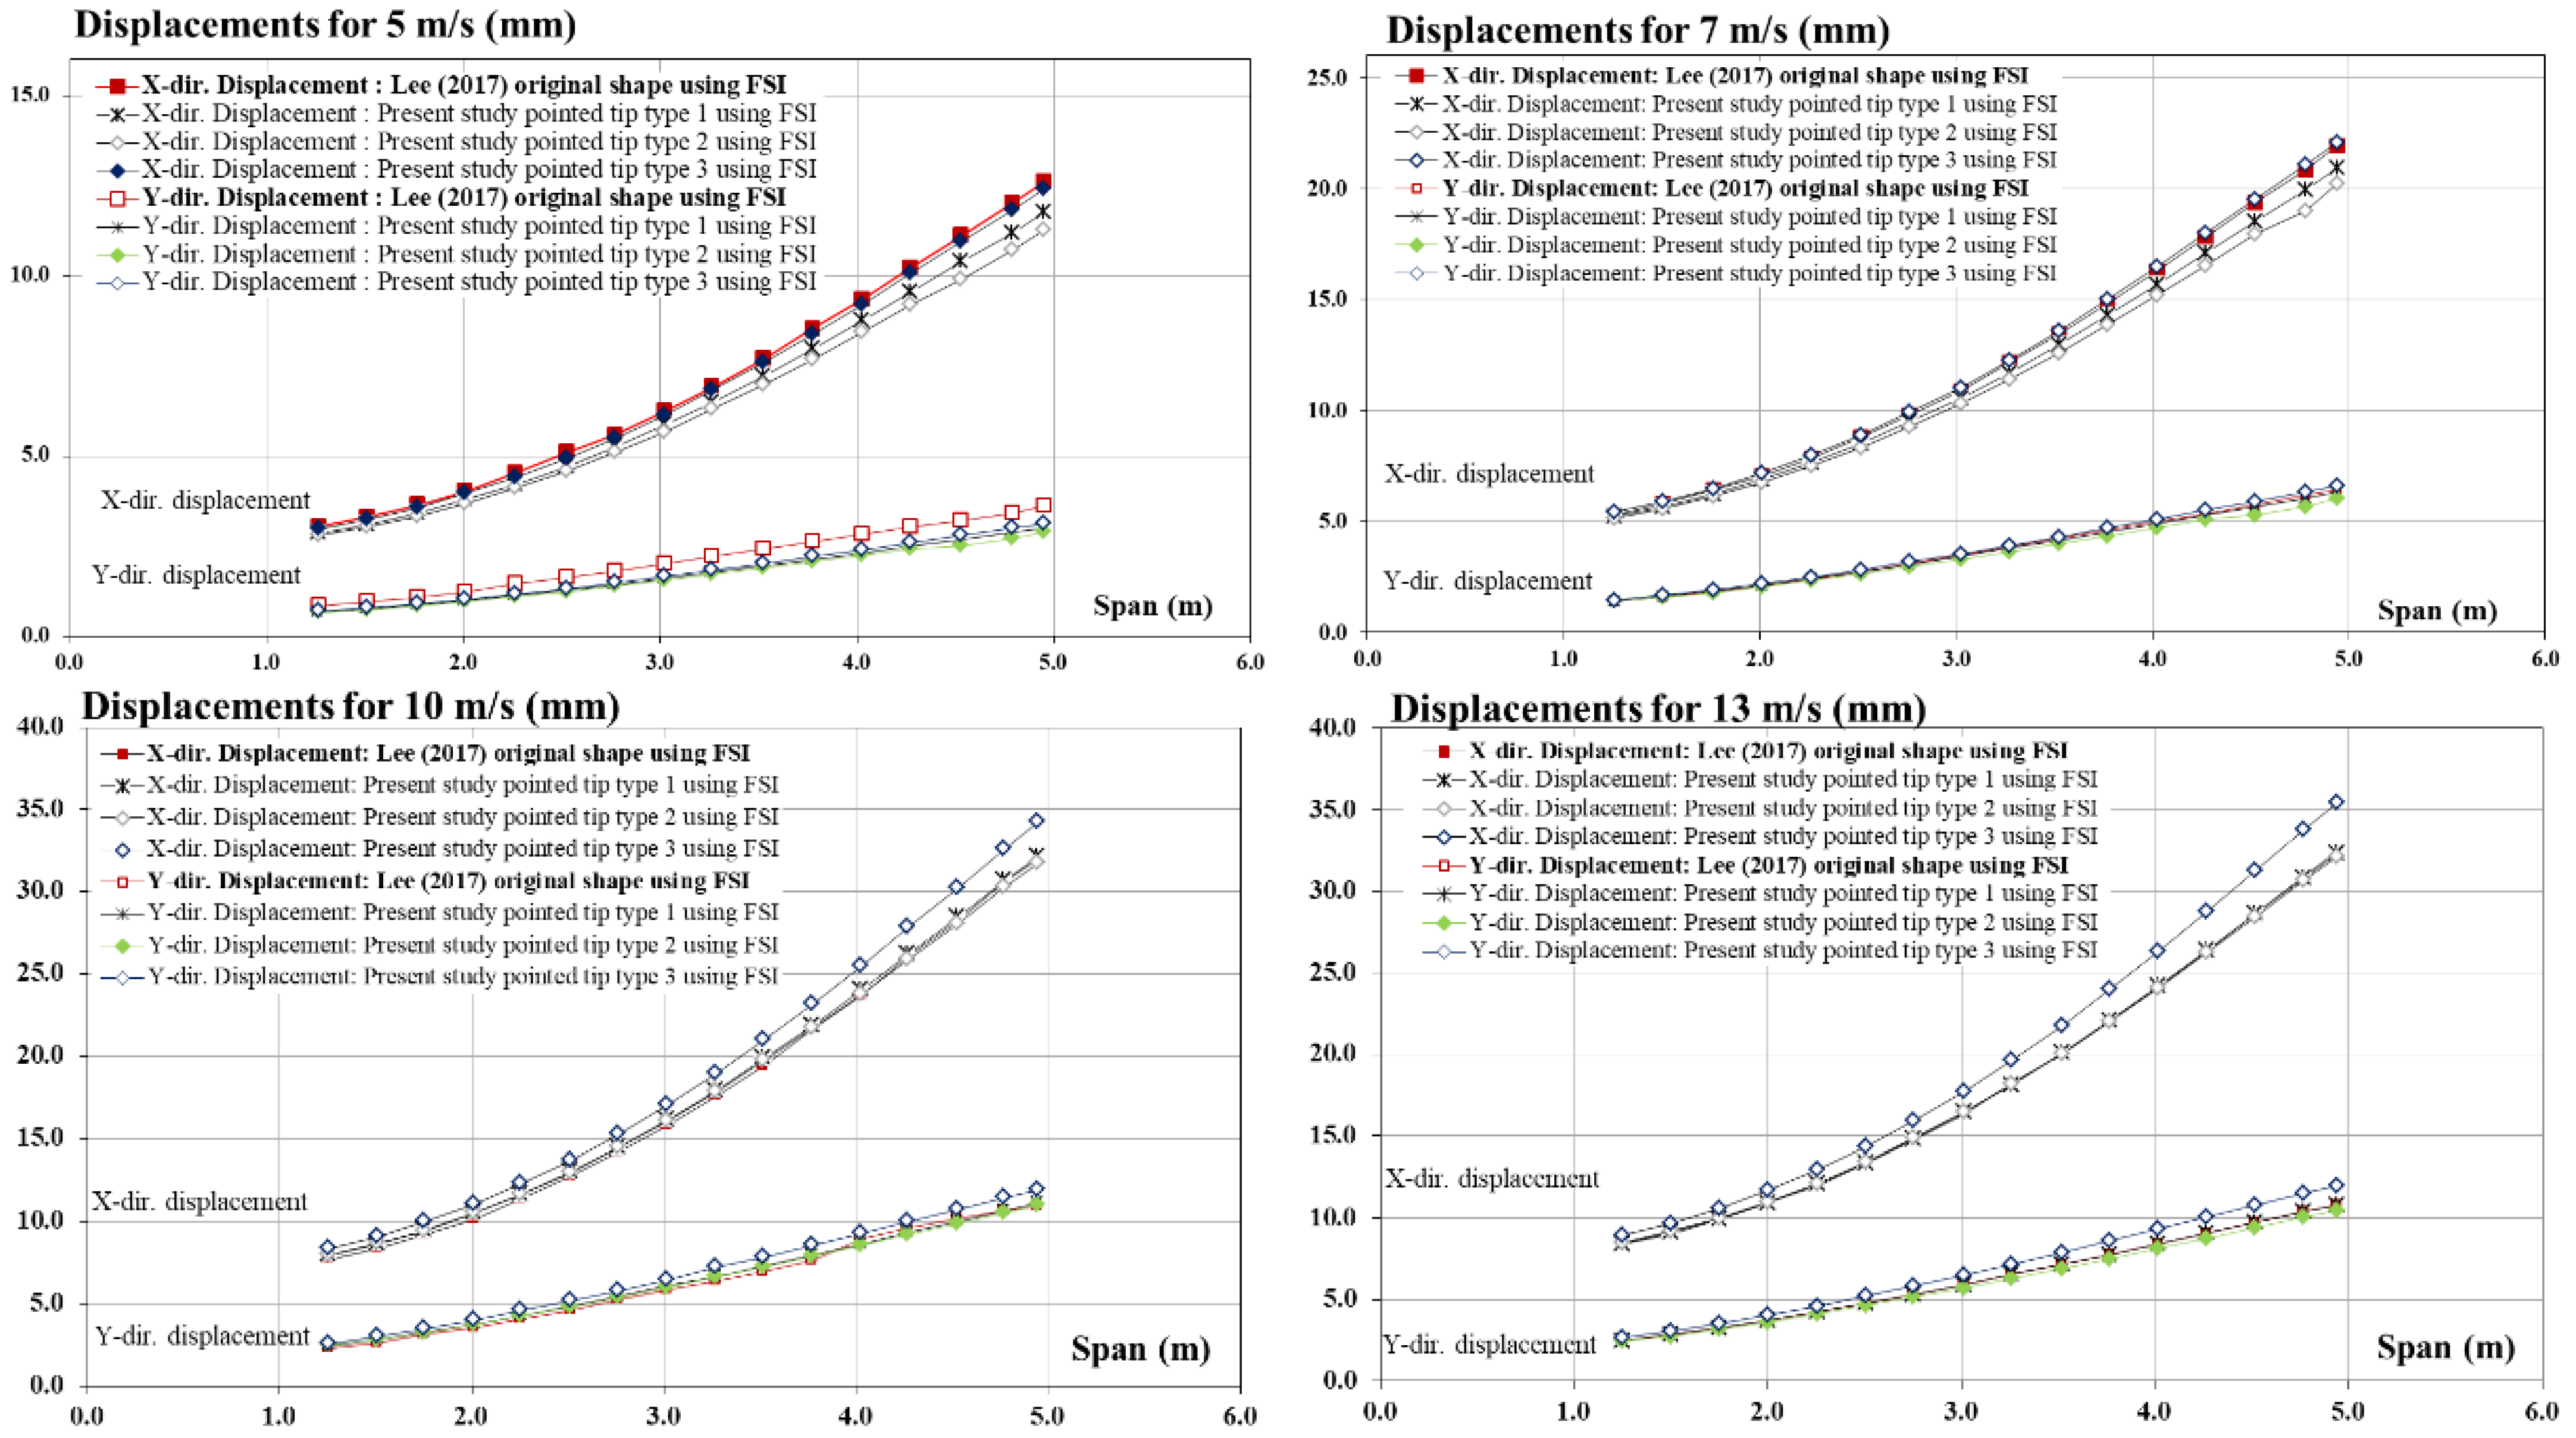
In this study, the directional displacements of blades with three different pointed-tip shapes are compared with those from the FSI analysis using the blade with the original shape, as seen in Figure 18. At low wind speeds (i.e., at 5 m/s and 7 m/s), the results of the blade with pointed tip Type 3 show a small deviation from those of the original shape. At a wind speed of 5 m/s, the blade of the original shape is found to undergo the largest X- and Y-displacements. For the blade with pointed tip Type 3, maximum displacements in the X- and Y-axes decreased by 1.58% and 15.32%, respectively, from the results of the original shape. At the wind speed of 7 m/s, an increase from the results of the original shape is observed in the maximum X- and Y-displacements of blade Type 3 by 0.67% and 2.6477%, respectively. The other two blade shapes (Type 1 and Type 2) generated smaller X-displacement compared with the original shape. For the Y-displacement, the blade with a Type 2 tip is found to be subjected to the smallest displacement within all the concerned blades.
At wind speeds of 10 m/s and 13 m/s, the shape effect is found to be insignificant for blades with the Type 1- and Type 2-pointed tips Type 1Type 2 in terms of X-axis and Y-axis displacements. However, the blade with the leading-edge-tapered tip (Type 3) is subjected to increased deformations along the X- and Y-axes by 7.01% and 9.27%, respectively. For those wind speeds, the CFD analysis results in higher torque and thrust values for blade Type 3, which explains the increase in the Y- and X-displacements, respectively.
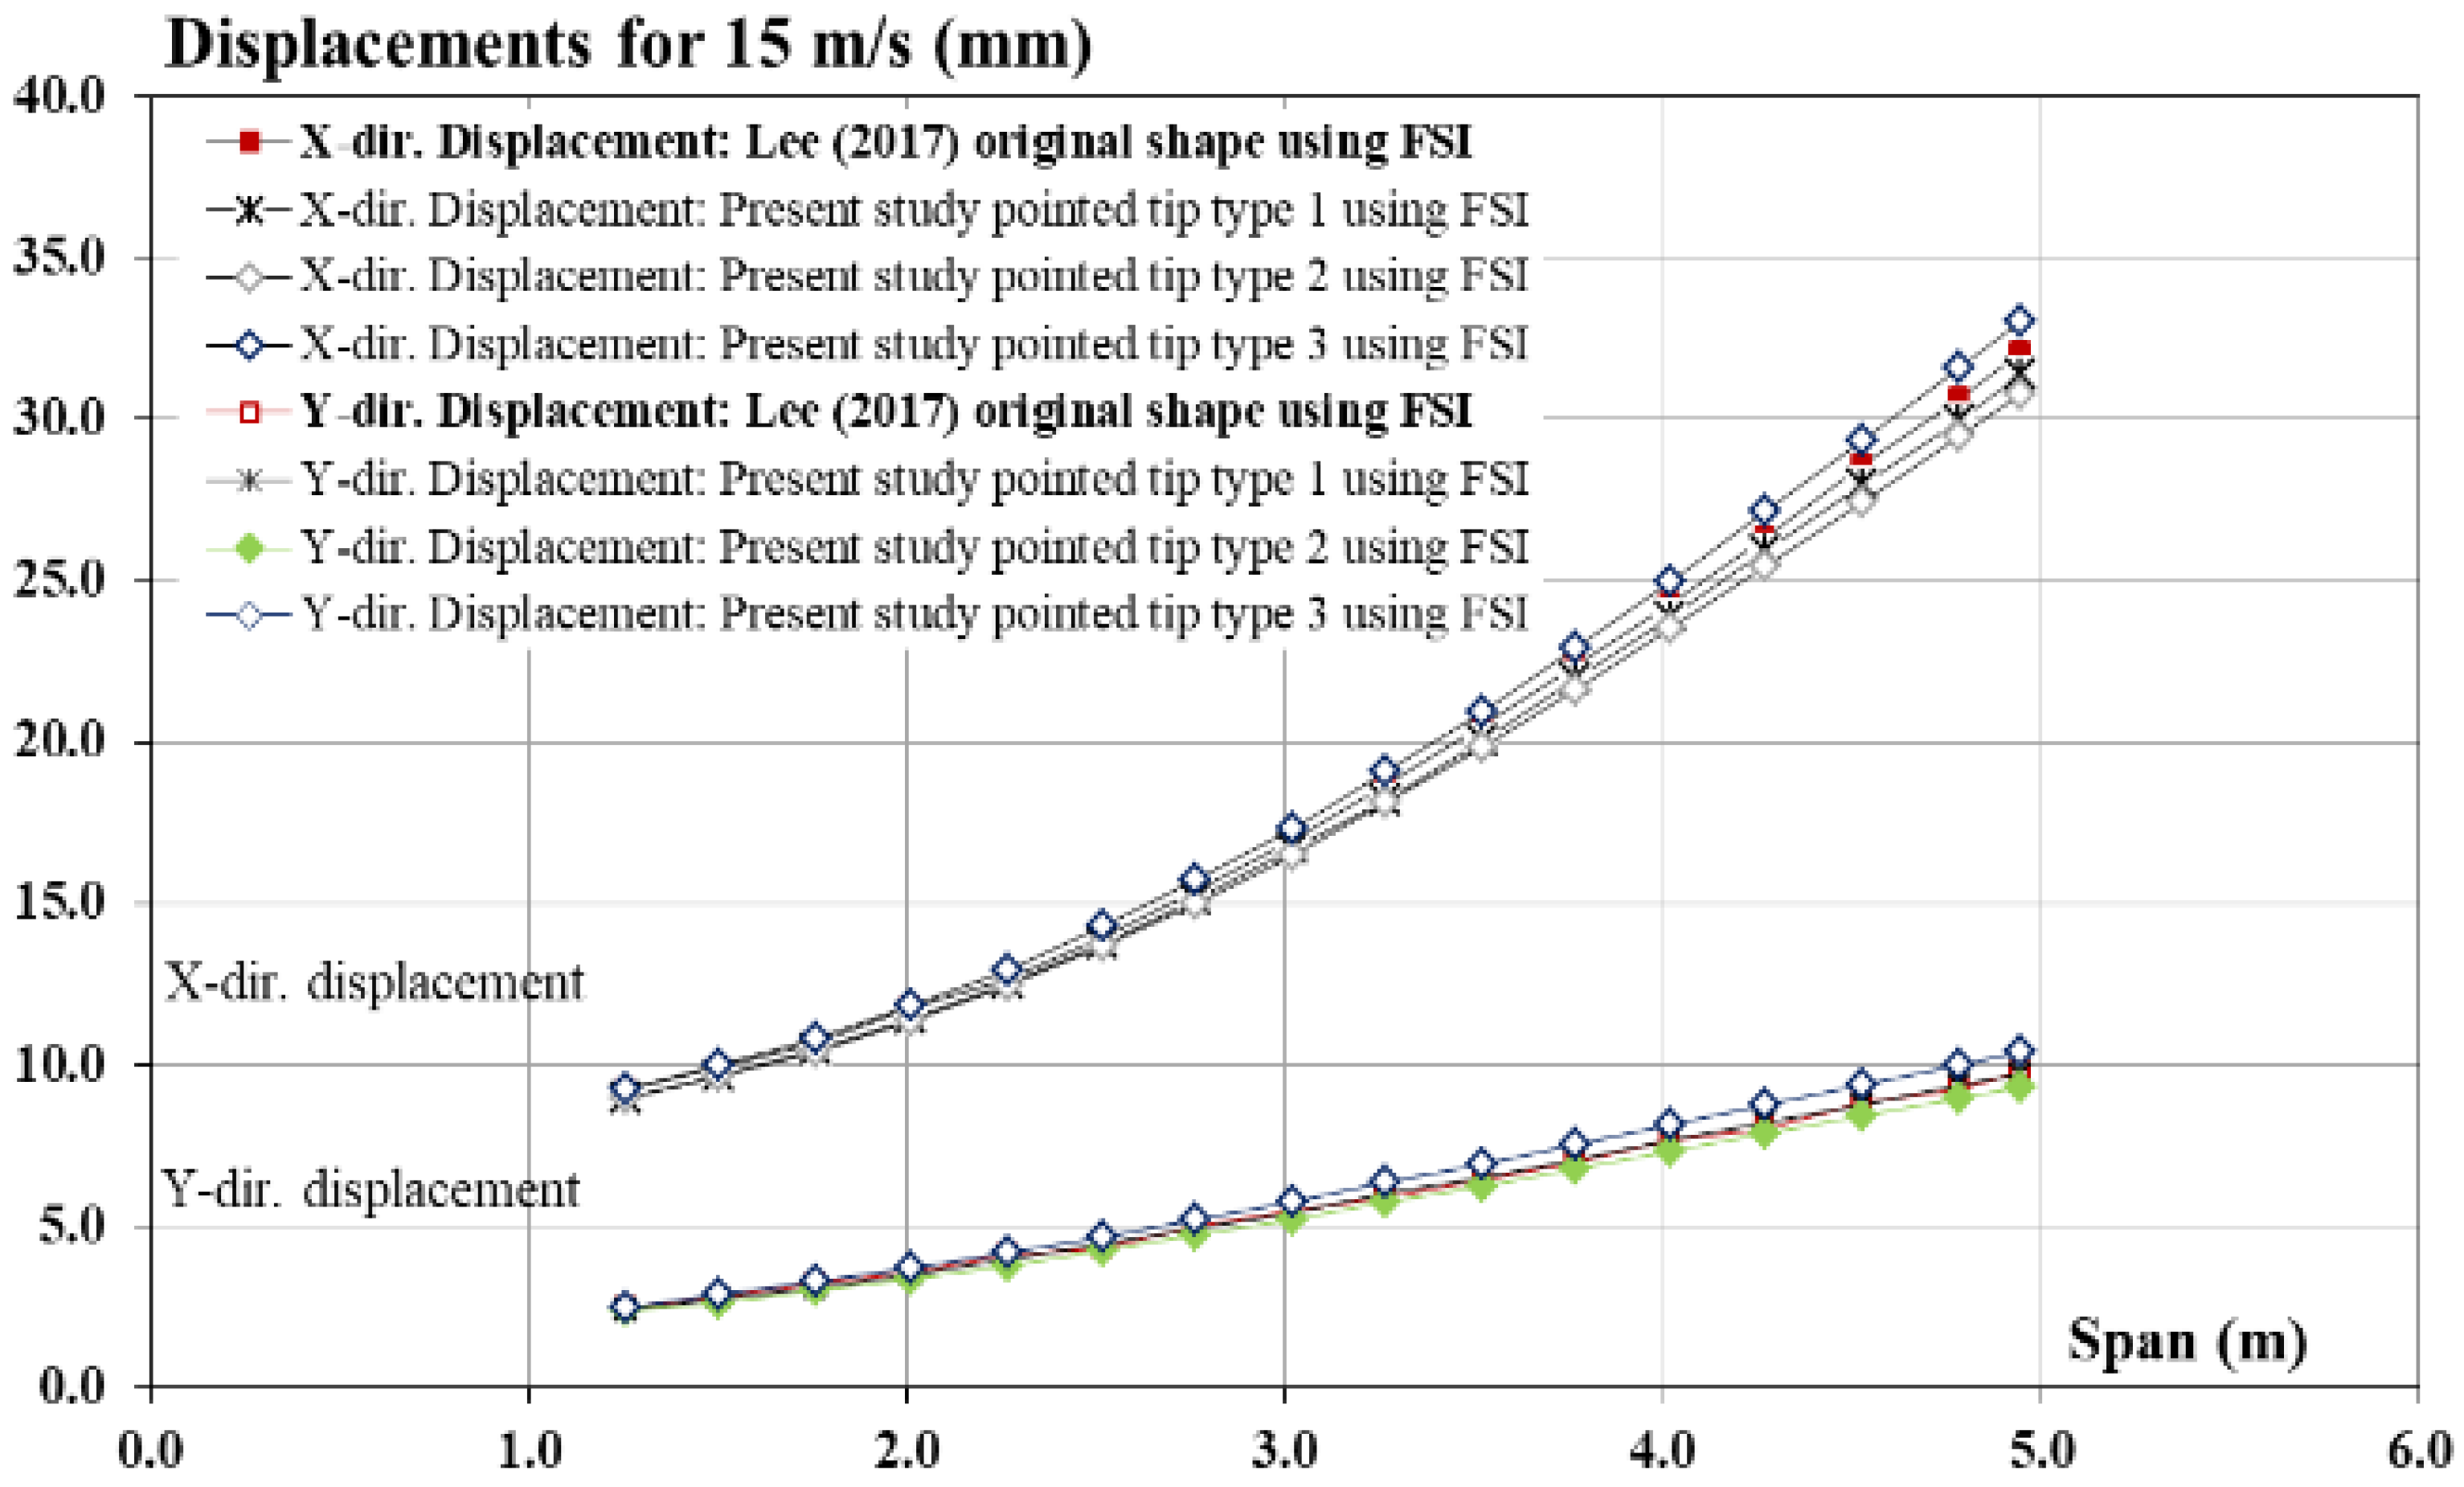
At a wind speed of 15 m/s, a decrease in the difference between the thrust and torque forces of the blade Type 3 and the original shape is observed compared with the results from lower wind speeds. As shown in Figure 19, the X-displacement deviation of Type 3 from the original shape decreases to 3%. The Y-displacements are still larger than the original shape, although the deviation decreased to 6.9%. The blade Type 2 undergoes the smallest displacements at this wind speed.
For high wind speeds (20 m/s and 25 m/s), the flow around the turbine gets separated from the back side of the blades due to the increase in the angle of attack that represents the angle between the airflow and the chord line of the airfoil. The change in the shape at the tip did not capture the effect of the pointed geometry; therefore, the thrust force (that is responsible for the X-displacements) of the original shape was the highest. This resulted in higher values of displacements along the X-axis compared to the other three cases. The change in torque was insignificant at these high wind speeds; therefore, Y-displacements of the three pointed tip cases were very close to those of the NREL shape. But, Type 2′s displacements remained the lowest. From 20 to 25 m/s, the deformation increased. The highest X- and Y-displacements were captured at 25 m/s and for all four shapes, an increase of more than 24% occurred as seen in Figure 20.
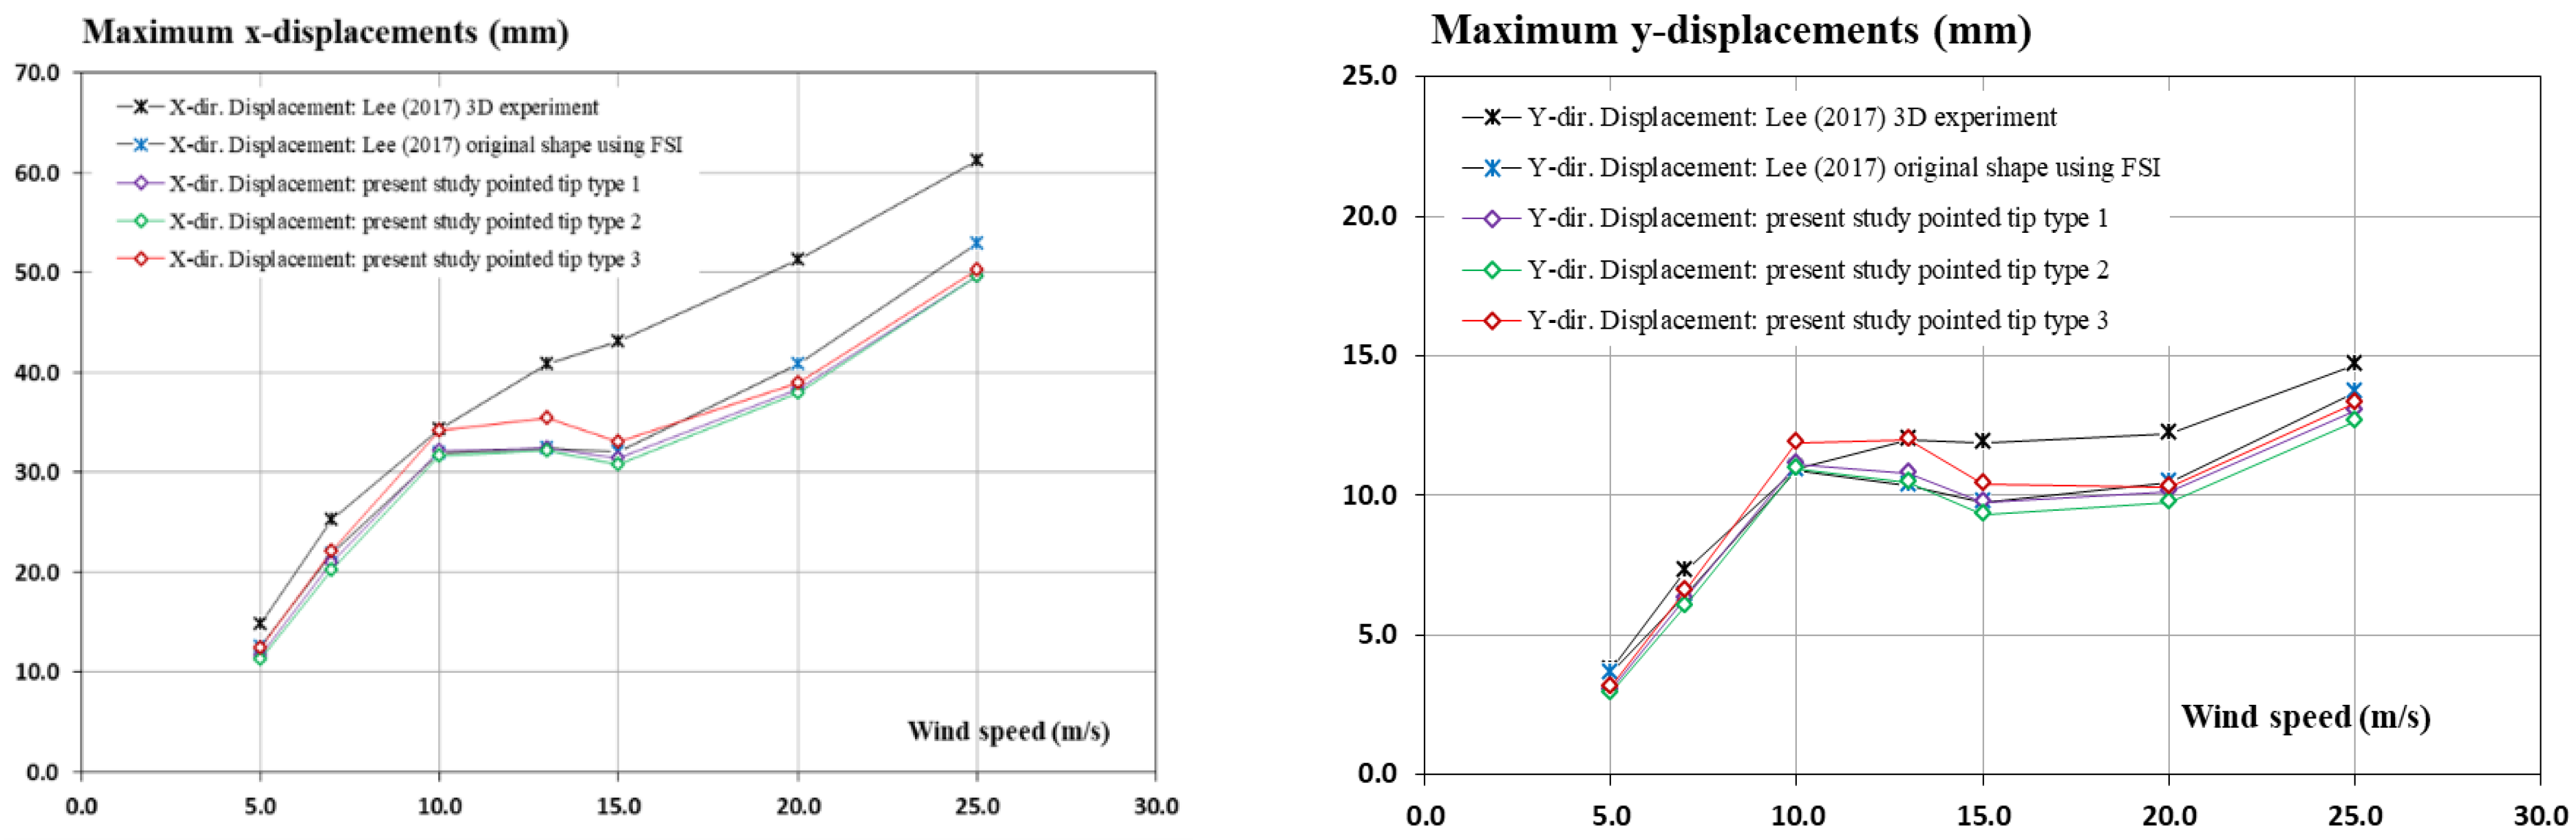
Figure 21 shows the comparison of maximum X- and Y-axes displacement for different blades. It is found that the experimental measurements overall undergo the largest maximum displacements along the X-axis, and these values increase with the wind speed. It can be concluded that the FSI method underestimated the displacements caused by the flow due to the complex three-dimensional effects of the air on the surface of the blades. The influence of modified tip shapes on the aerodynamic forces on the structures of the wind turbine is considerable, specifically on the blades. This shape effect results in a small reduction in the maximum X-axis displacements on the pointed-tip blades at low wind speeds. The blade with a Type 3 tip, however, undergoes a slightly higher deformation along the X-axis than the original shape using the FSI method. From wind speeds of 10 m/s to 15 m/s, the FSI simulations indicate that the Type 3 blade showed maximum displacements that exceeded the ones of the original NREL shape. Small variations from the original case are observed from the results with the other pointed tips (Type 1 and Type 2). At higher wind speeds, the maximum displacements of NREL blades are found to be larger than the results analyzed in our present study.
The maximum Y-axis displacements of different blades are also compared with the results of the original NREL blade. At low wind speeds, the blades with pointed tips undergo less displacement than the experimental measurements. At the mid-range speed (10–13 m/s), however, the pointed-tip effect augmented the displacements on blade Type 3 more than the experimental measurements. The maximum Y-axis displacement decreases again for the blade Type 3 at 15 m/s, while remaining larger than the blade with the original shape in FSI simulations. At higher speeds, the shape effect of the tip modification is relatively insignificant, as the change in the maximum displacements is found to be like each other with the original shape undergoing the largest displacement. Even though the Y-axis displacements are considerably smaller than those in the X-axis, one of the pointed-tip shapes resulted in larger deformations than the original shape along the Y-axis in the mid-range of wind speeds. The increase could cause further deformations in the structures and eventually reduce the stability of the wind turbine.

3.3. Total Deformation

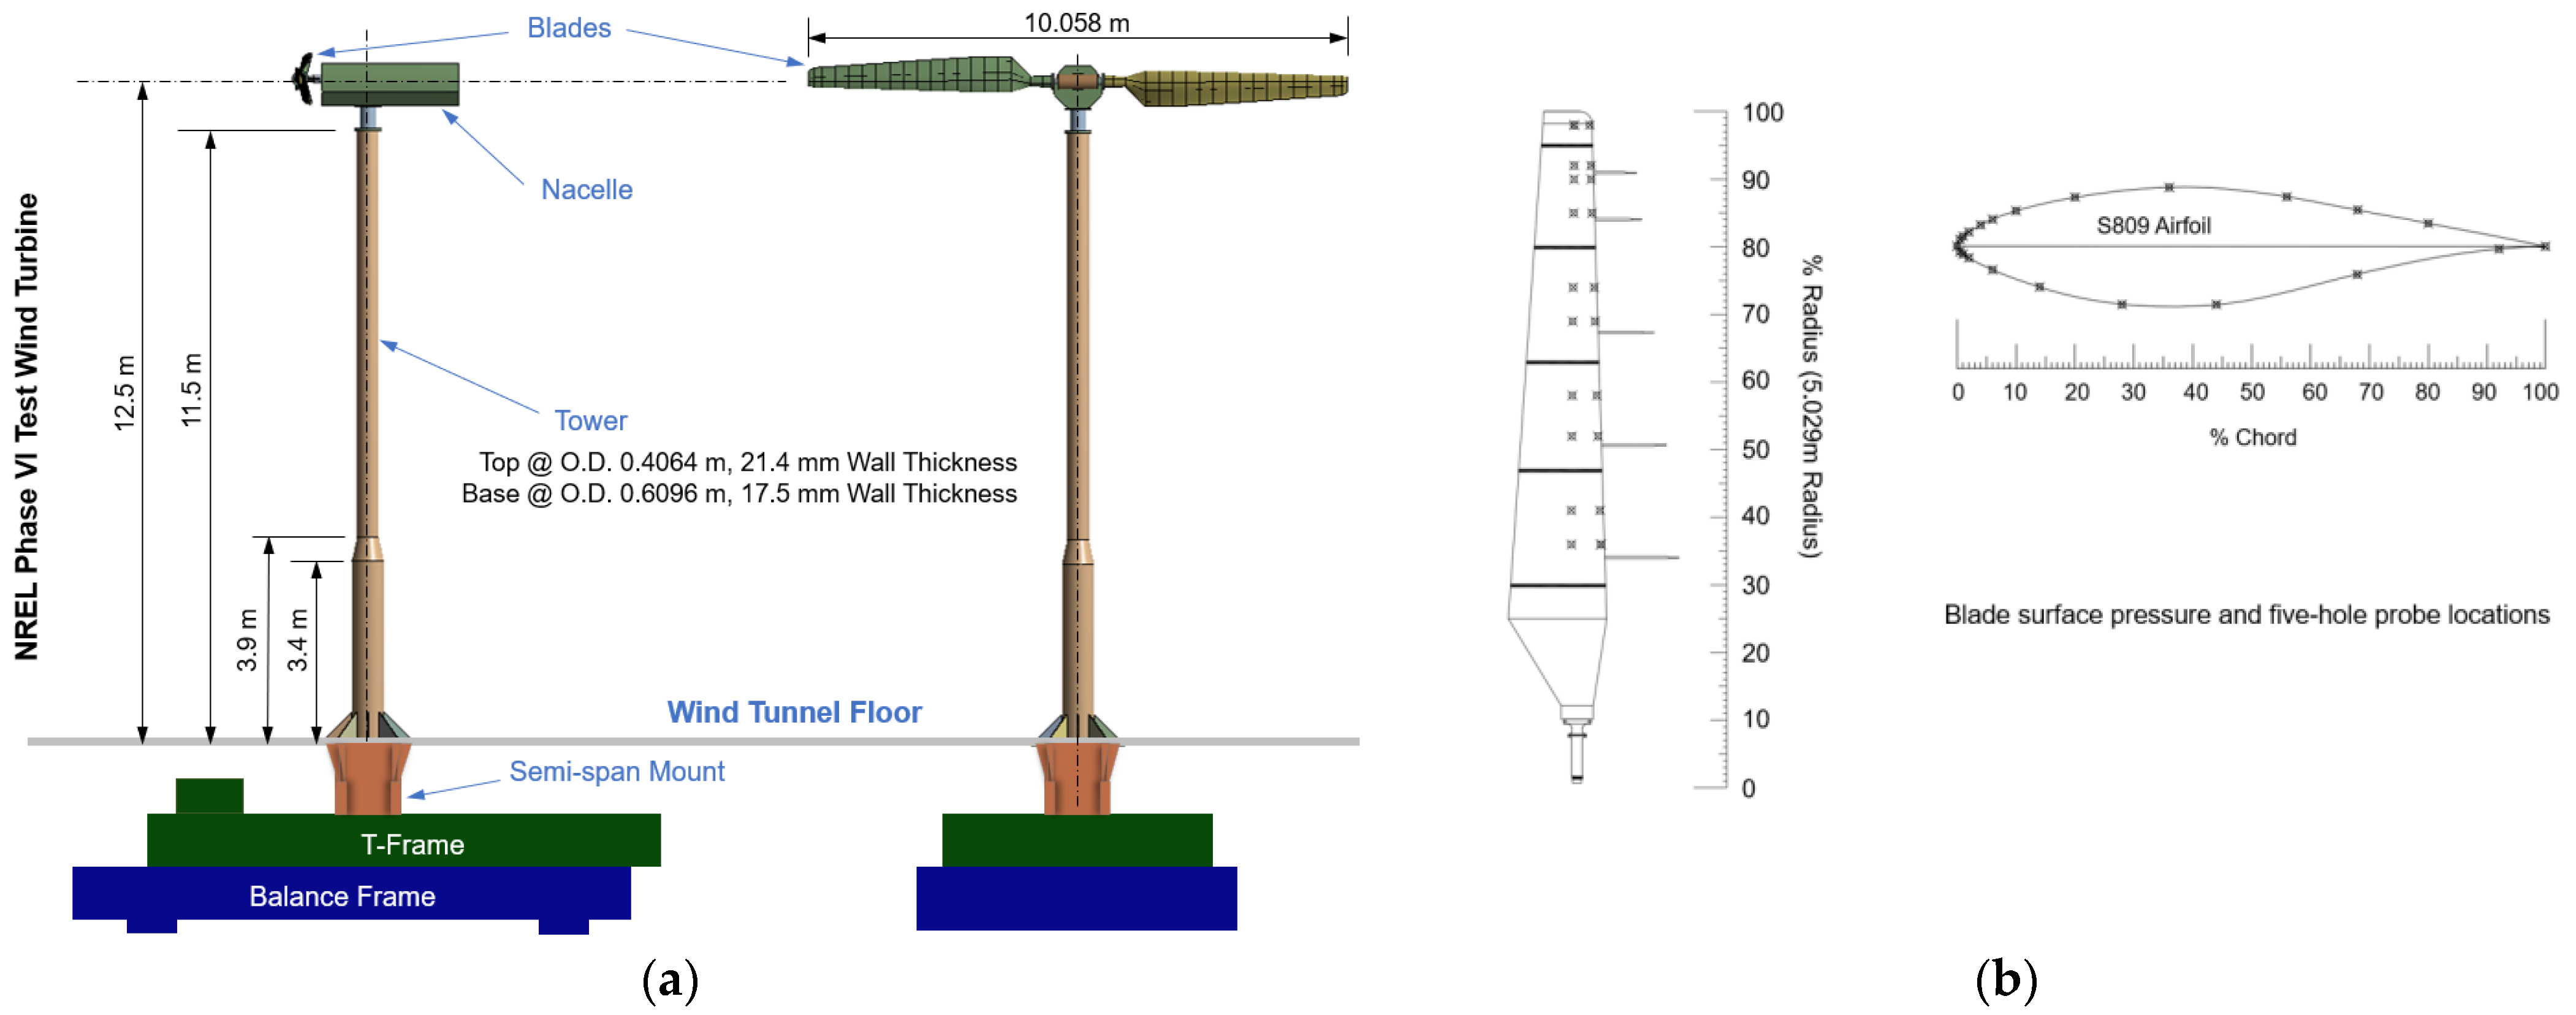
The aerodynamic loads that wind turbines encounter from the wind can be represented as thrust (in the X-axis direction) and torque (in the Y-axis direction), with the latter driving the rotor for power generation. These loads also result in the deformation of the wind turbine blades. For horizontal axis wind turbines, like the turbines considered in this study for instance, the maximum total deformation of the blade normally occurs at the tip. In the structural analysis of this study, the bottom of the tower is specified as a fixed support. Therefore, the minimum deformations occurred at the tower structure for all wind speeds. 
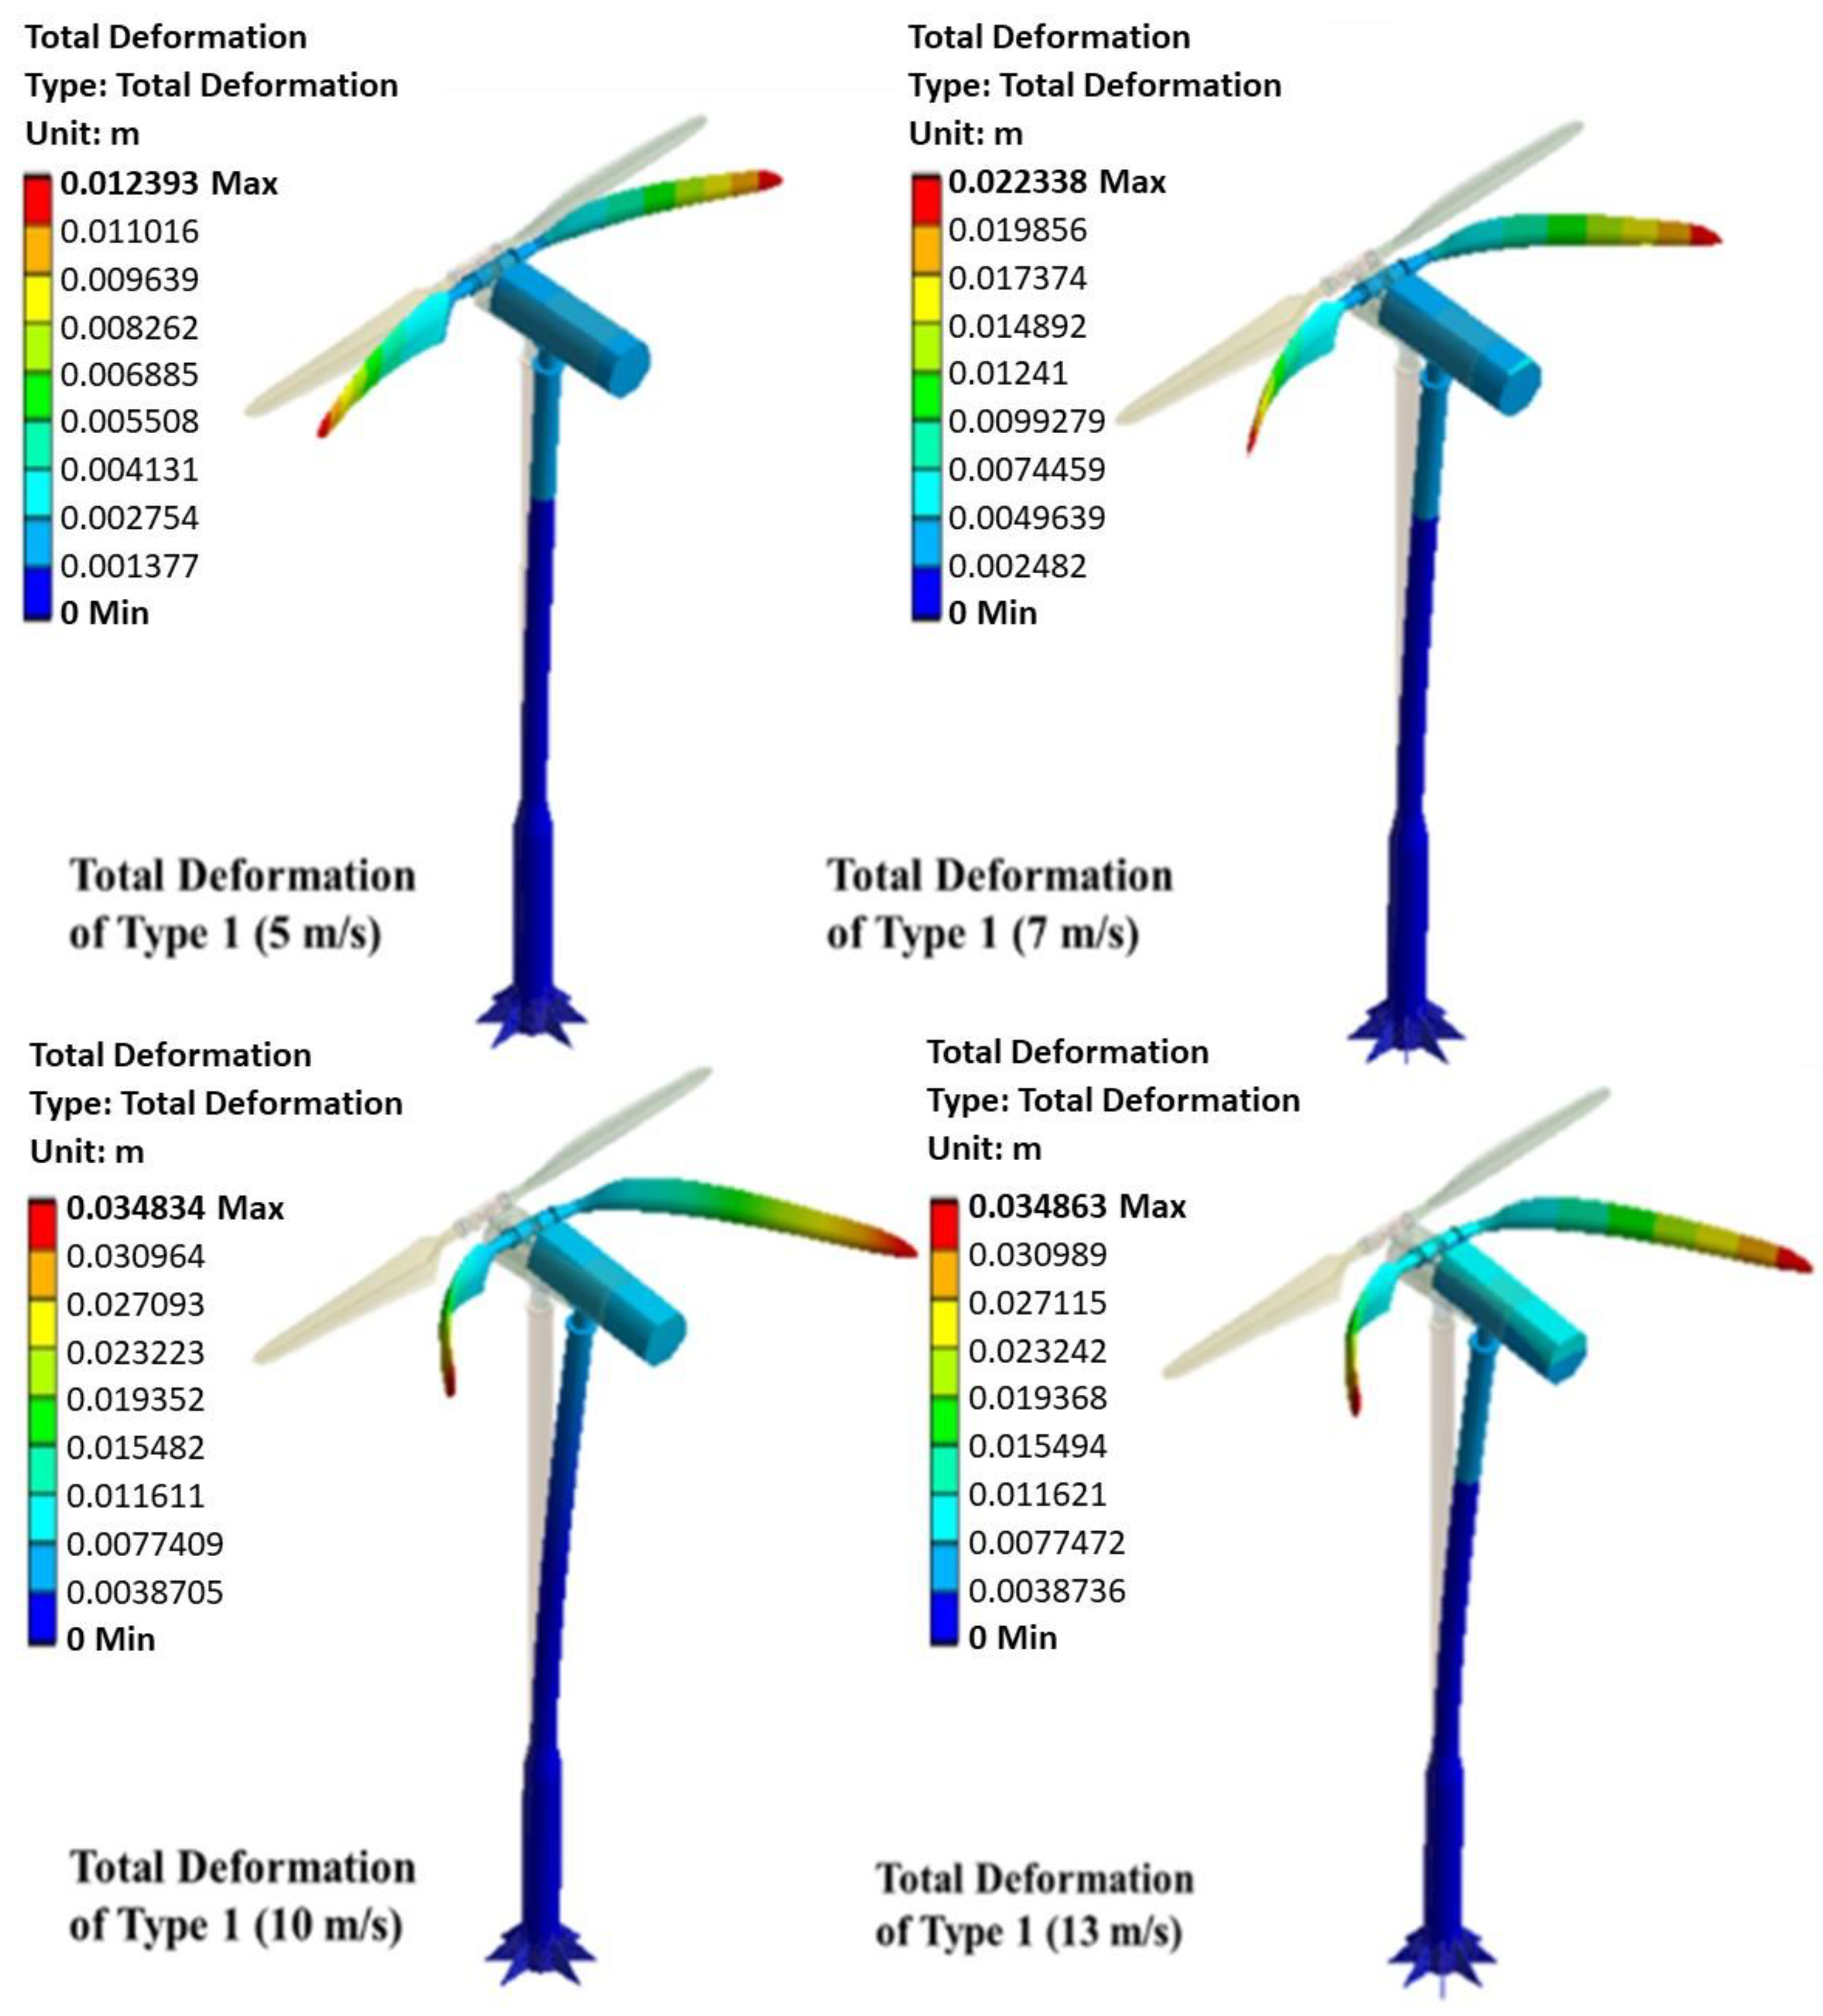
Figure 22 below shows the increase in the total deformation of blade Type 1 with the change in the wind speed. The deformation of the turbine and the shape of its original model are represented to investigate the load effect on the structure. The deformation is magnified 130 times to facilitate the observation of this effect. The color distribution indicates the deformation values distributed along the whole wind turbine structure and the maximum deflection is observed at the tip of the blades for all wind speeds. It can also be seen that the effect of the blades’ surface pressure distribution on the tower is negligible at low wind speeds, but increases gradually with the wind speed. Furthermore, the same change pattern of structural deformation along the blades is observed for all concerned blade shapes.
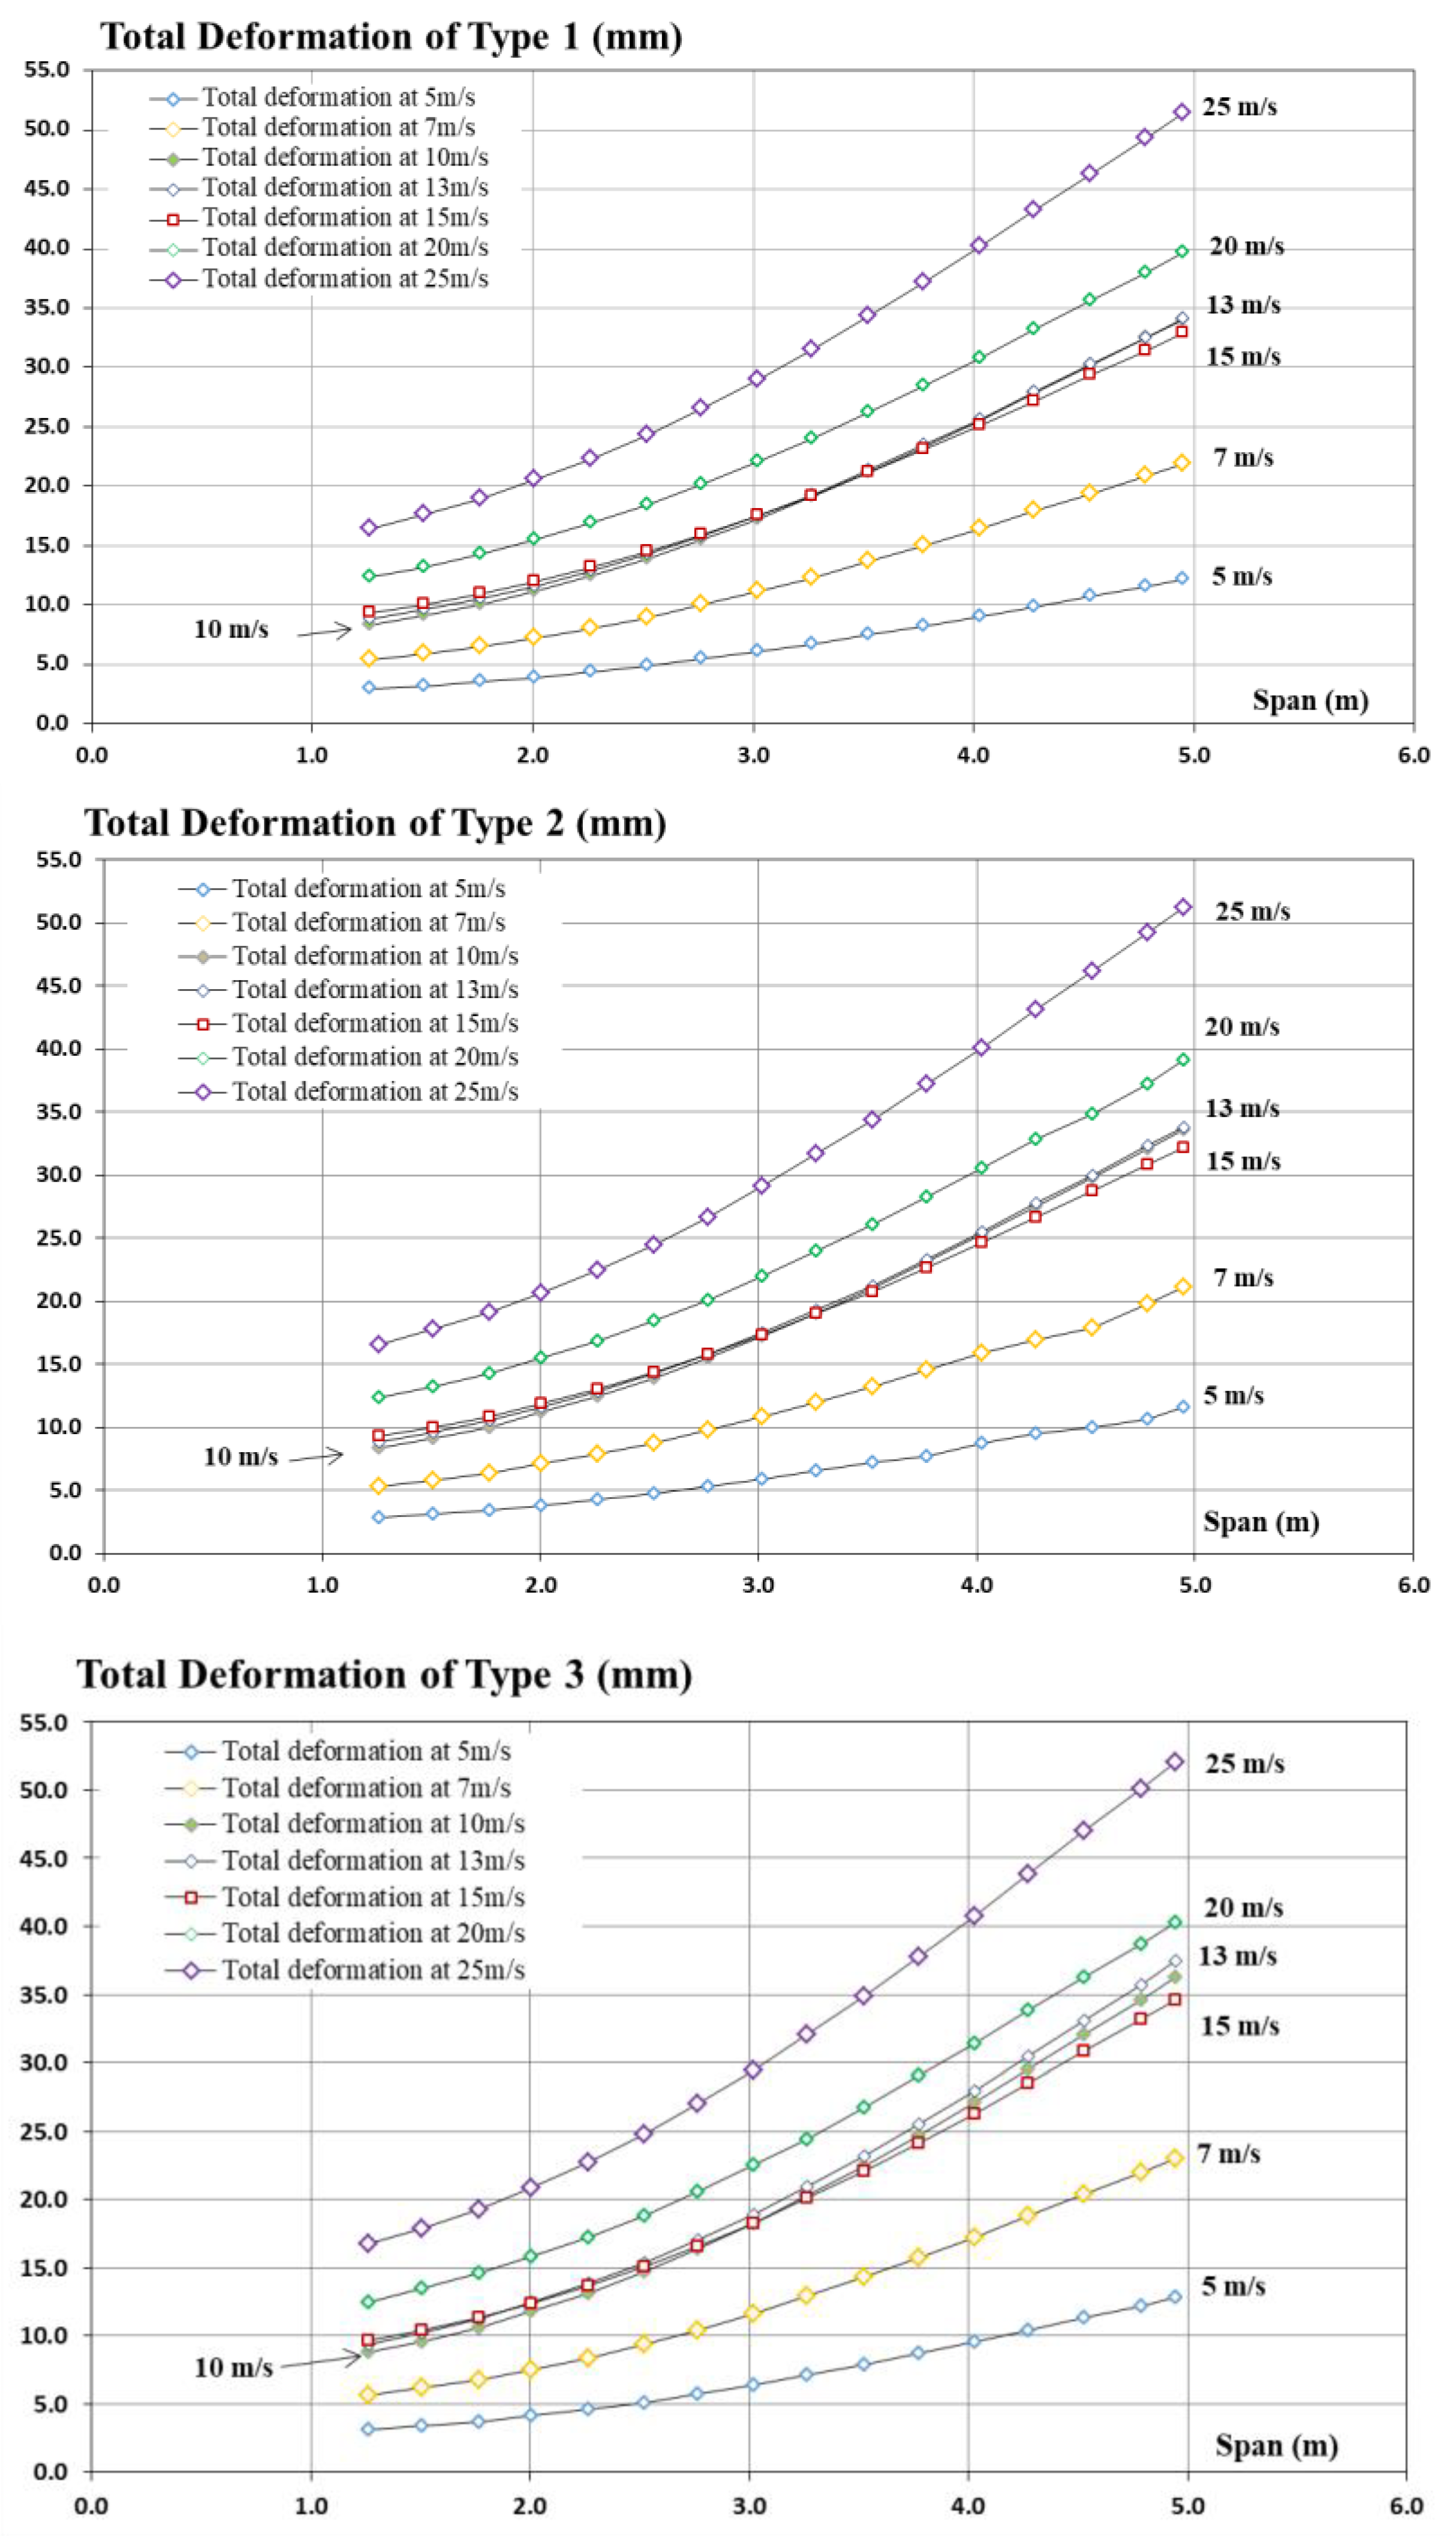
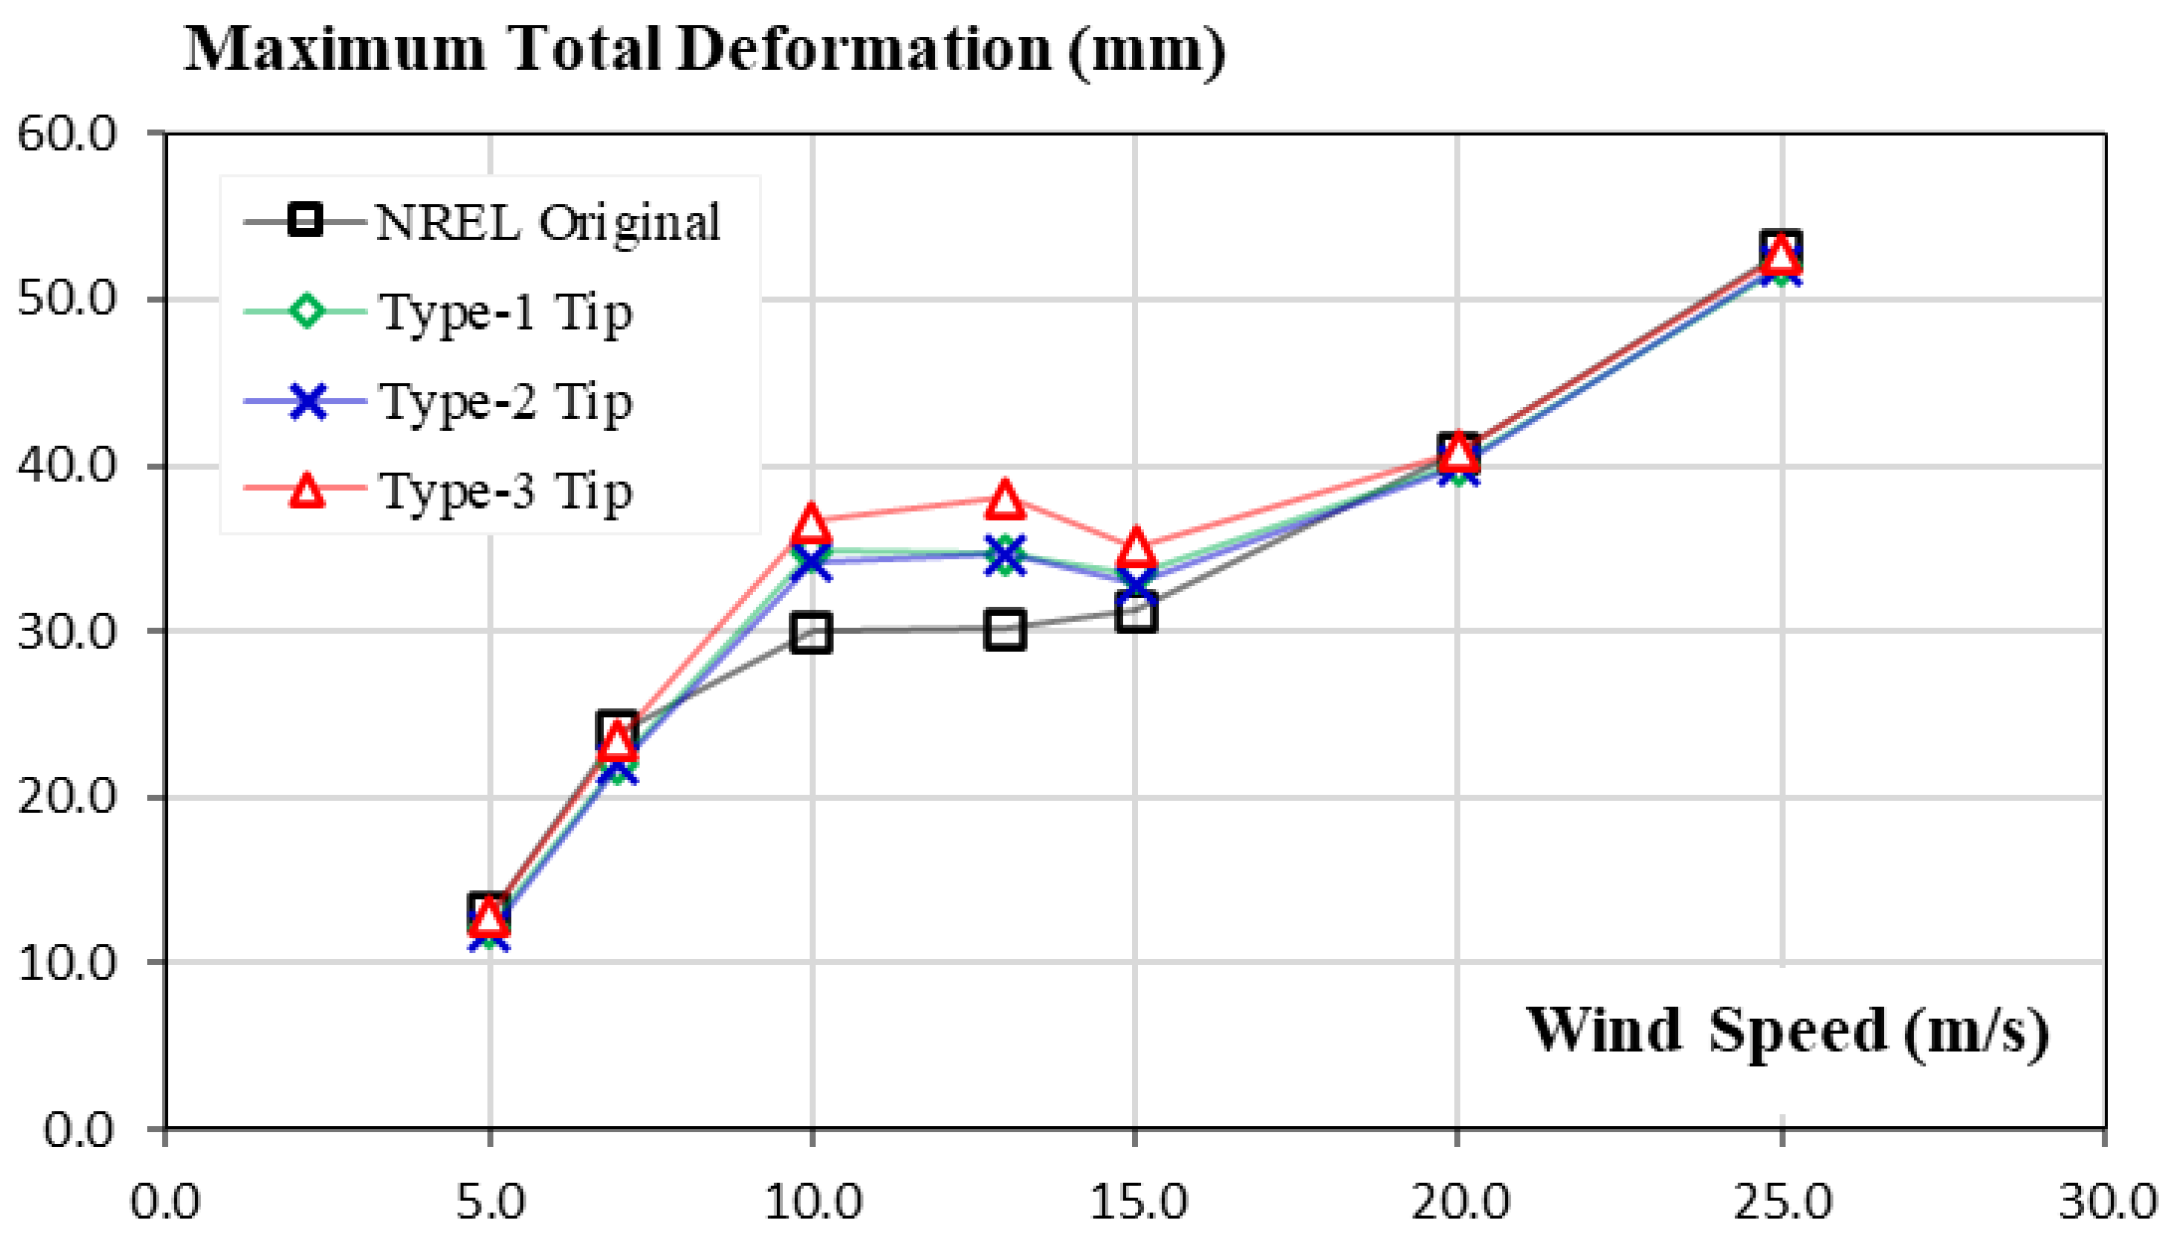
The intensity of aerodynamic loads depends on the wind speeds; therefore, the blade deformation over the span for all concerned speed cases is compared for each type of blade separately in 
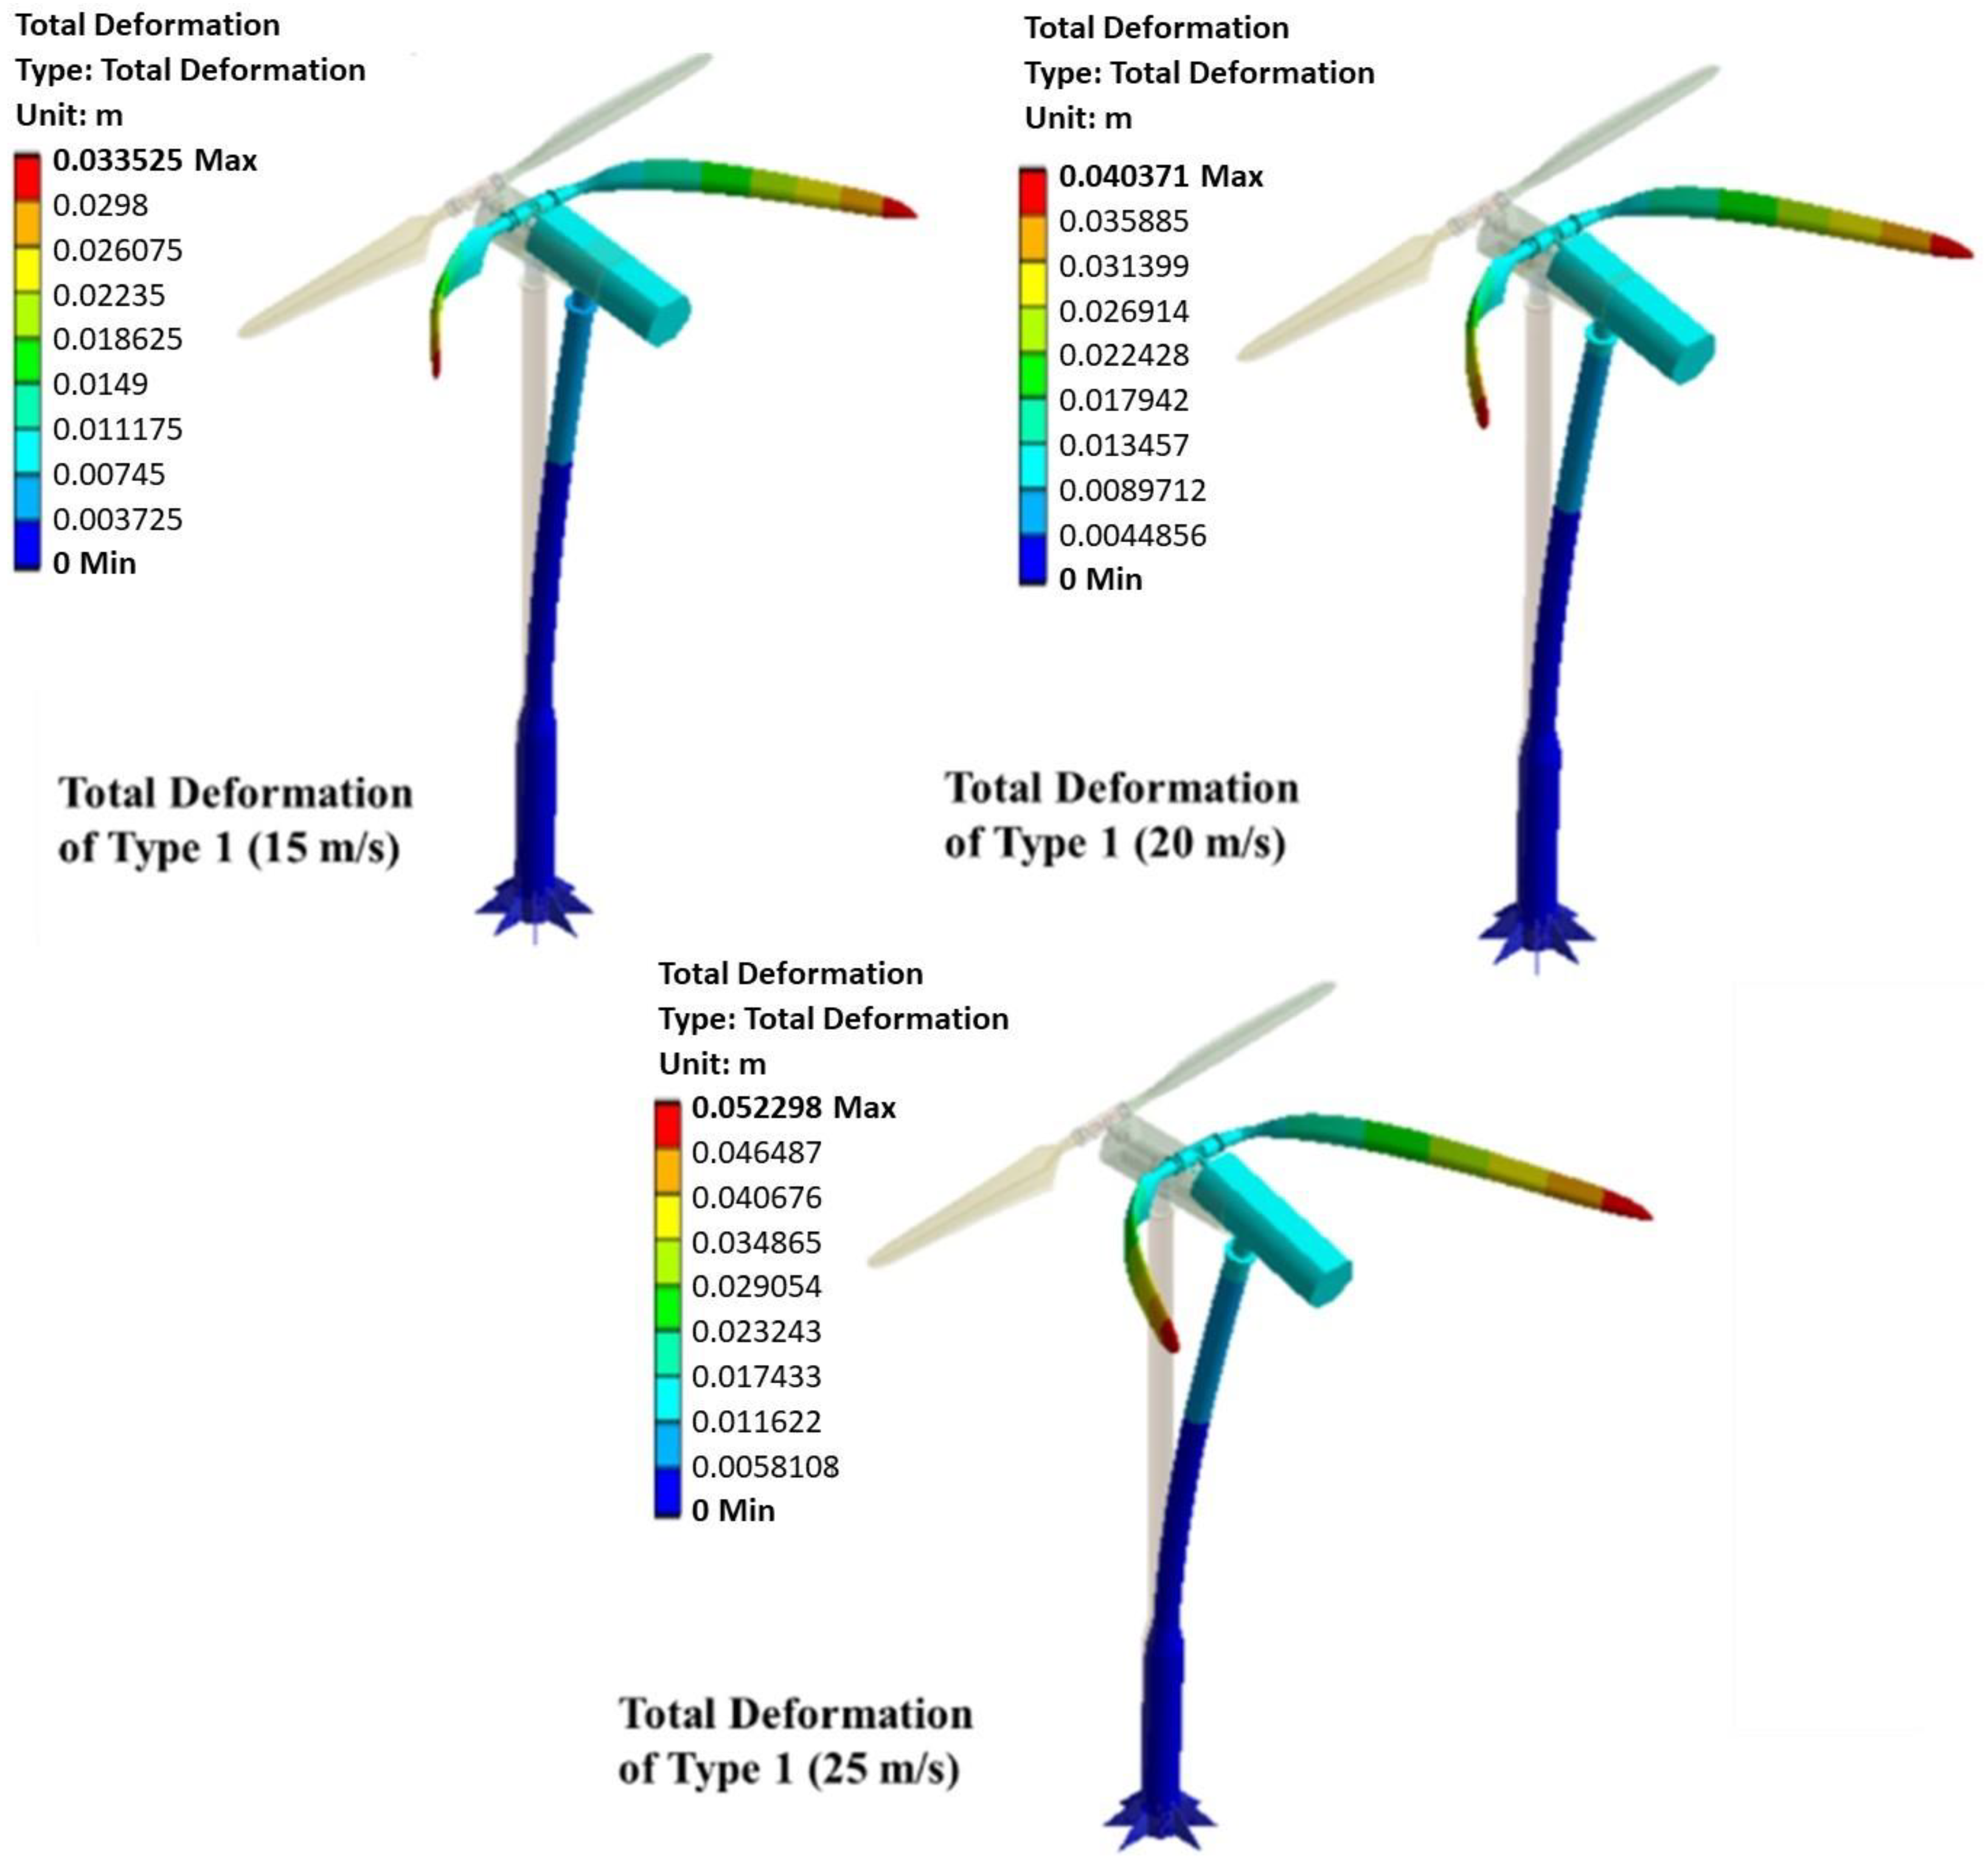
Figure 23. At wind speeds of 5 m/s and 7 m/s, the airflow (wind) striking the blades forms a small angle of attack with reference to the chord line of the airfoil of turbine blades. This small angle of attack results in attachment of the flow on the upper and lower surface of the airfoil. In this region, the ratio of the aerodynamic forces as lift-to-drag (also indicating the efficiency of the turbines) increases with the angle of attack. Both the thrust and torque, generated from the lift and drag forces, increased with the wind speed in this region. Therefore, the total deformation increases drastically from 5 m/s to 7 m/s for all three blades. The maximum values at wind speeds of 7 m/s for the pointed tips Type 1, Type 2, and Type 3 increased to 80.4%, 81.5%, and 80.2% compared with 5 m/s, respectively. For medium wind speeds (at 10 m/s, 13 m/s, and 15 m/s), the ratio of lift-to-drag is found to reach its local optimum value and then begins to decrease again. In this speed region, flow separation is observed to occur at certain blade locations. The torque force for all blades reaches its maximum value at 10 m/s. On the other hand, the thrust force increases gradually from 10 m/s to 15 m/s, although the deformations observed at the three wind speeds are similar. According to the relevant CFD results [26], the thrust force distribution along the span for 10 m/s, 13 m/s, and 15 m/s were shown to be close to each other towards the tip. Therefore, the overlapping of deformation results is found at those wind speeds. At high wind speeds (20 m/s and 25 m/s), the flow gets separated from the suction side of the blade. Therefore, the torque force decreased compared with lower-speed cases. The thrust force though continues to increase, and the relevant maximum total deformation is found at a wind speed of 25 m/s. The largest deformation overall is found on the blade Type 3 at a value of 52.06 mm.

3.4. Tip Deflection

The distance from the tip of the blades to the circumference of the tower structure of a wind turbine is considered as a safety measure for wind turbines. Therefore, a minimum distance should be maintained to prevent the blades from striking the tower structure, which could cause structural damage and even the collapse of the whole turbine. It is generally a problem for wind turbines with large rotor diameters operating under extreme wind conditions. The maximum total deformation at the tip of all blade shapes at each concerned wind speed is presented in Figure 24 below. It is observed that the tip of the blade Type 3 undergoes the largest deformation. Blade Type 3 results in a larger torque force than the original shape, and the other two shapes and this deviation reached its maximum from 10 m/s to 15 m/s. This increased torque effect observed in the tip deformation remained large from the lowest speed to the highest one and reached more than 26% augmentation from the original case. For the remaining lower and higher speeds, no significant change in terms of maximum total deformation is found between the blades modified with pointed tips and with the original shape.

3.5. Stress Distribution

Stress analysis is an important approach in the structural design practice as the failure of most structural components is usually due to stress. A material is determined to start failing when its Von Mises stress is larger than the yield stress of the material, which is known as the Von Mises Yield Criterion. FEA-stress analysis allows the prediction of the areas where the maximum stress value occurs. In this study, polyethylene is used as the material of the blades, and its tensile yield strength is 25 MPa.
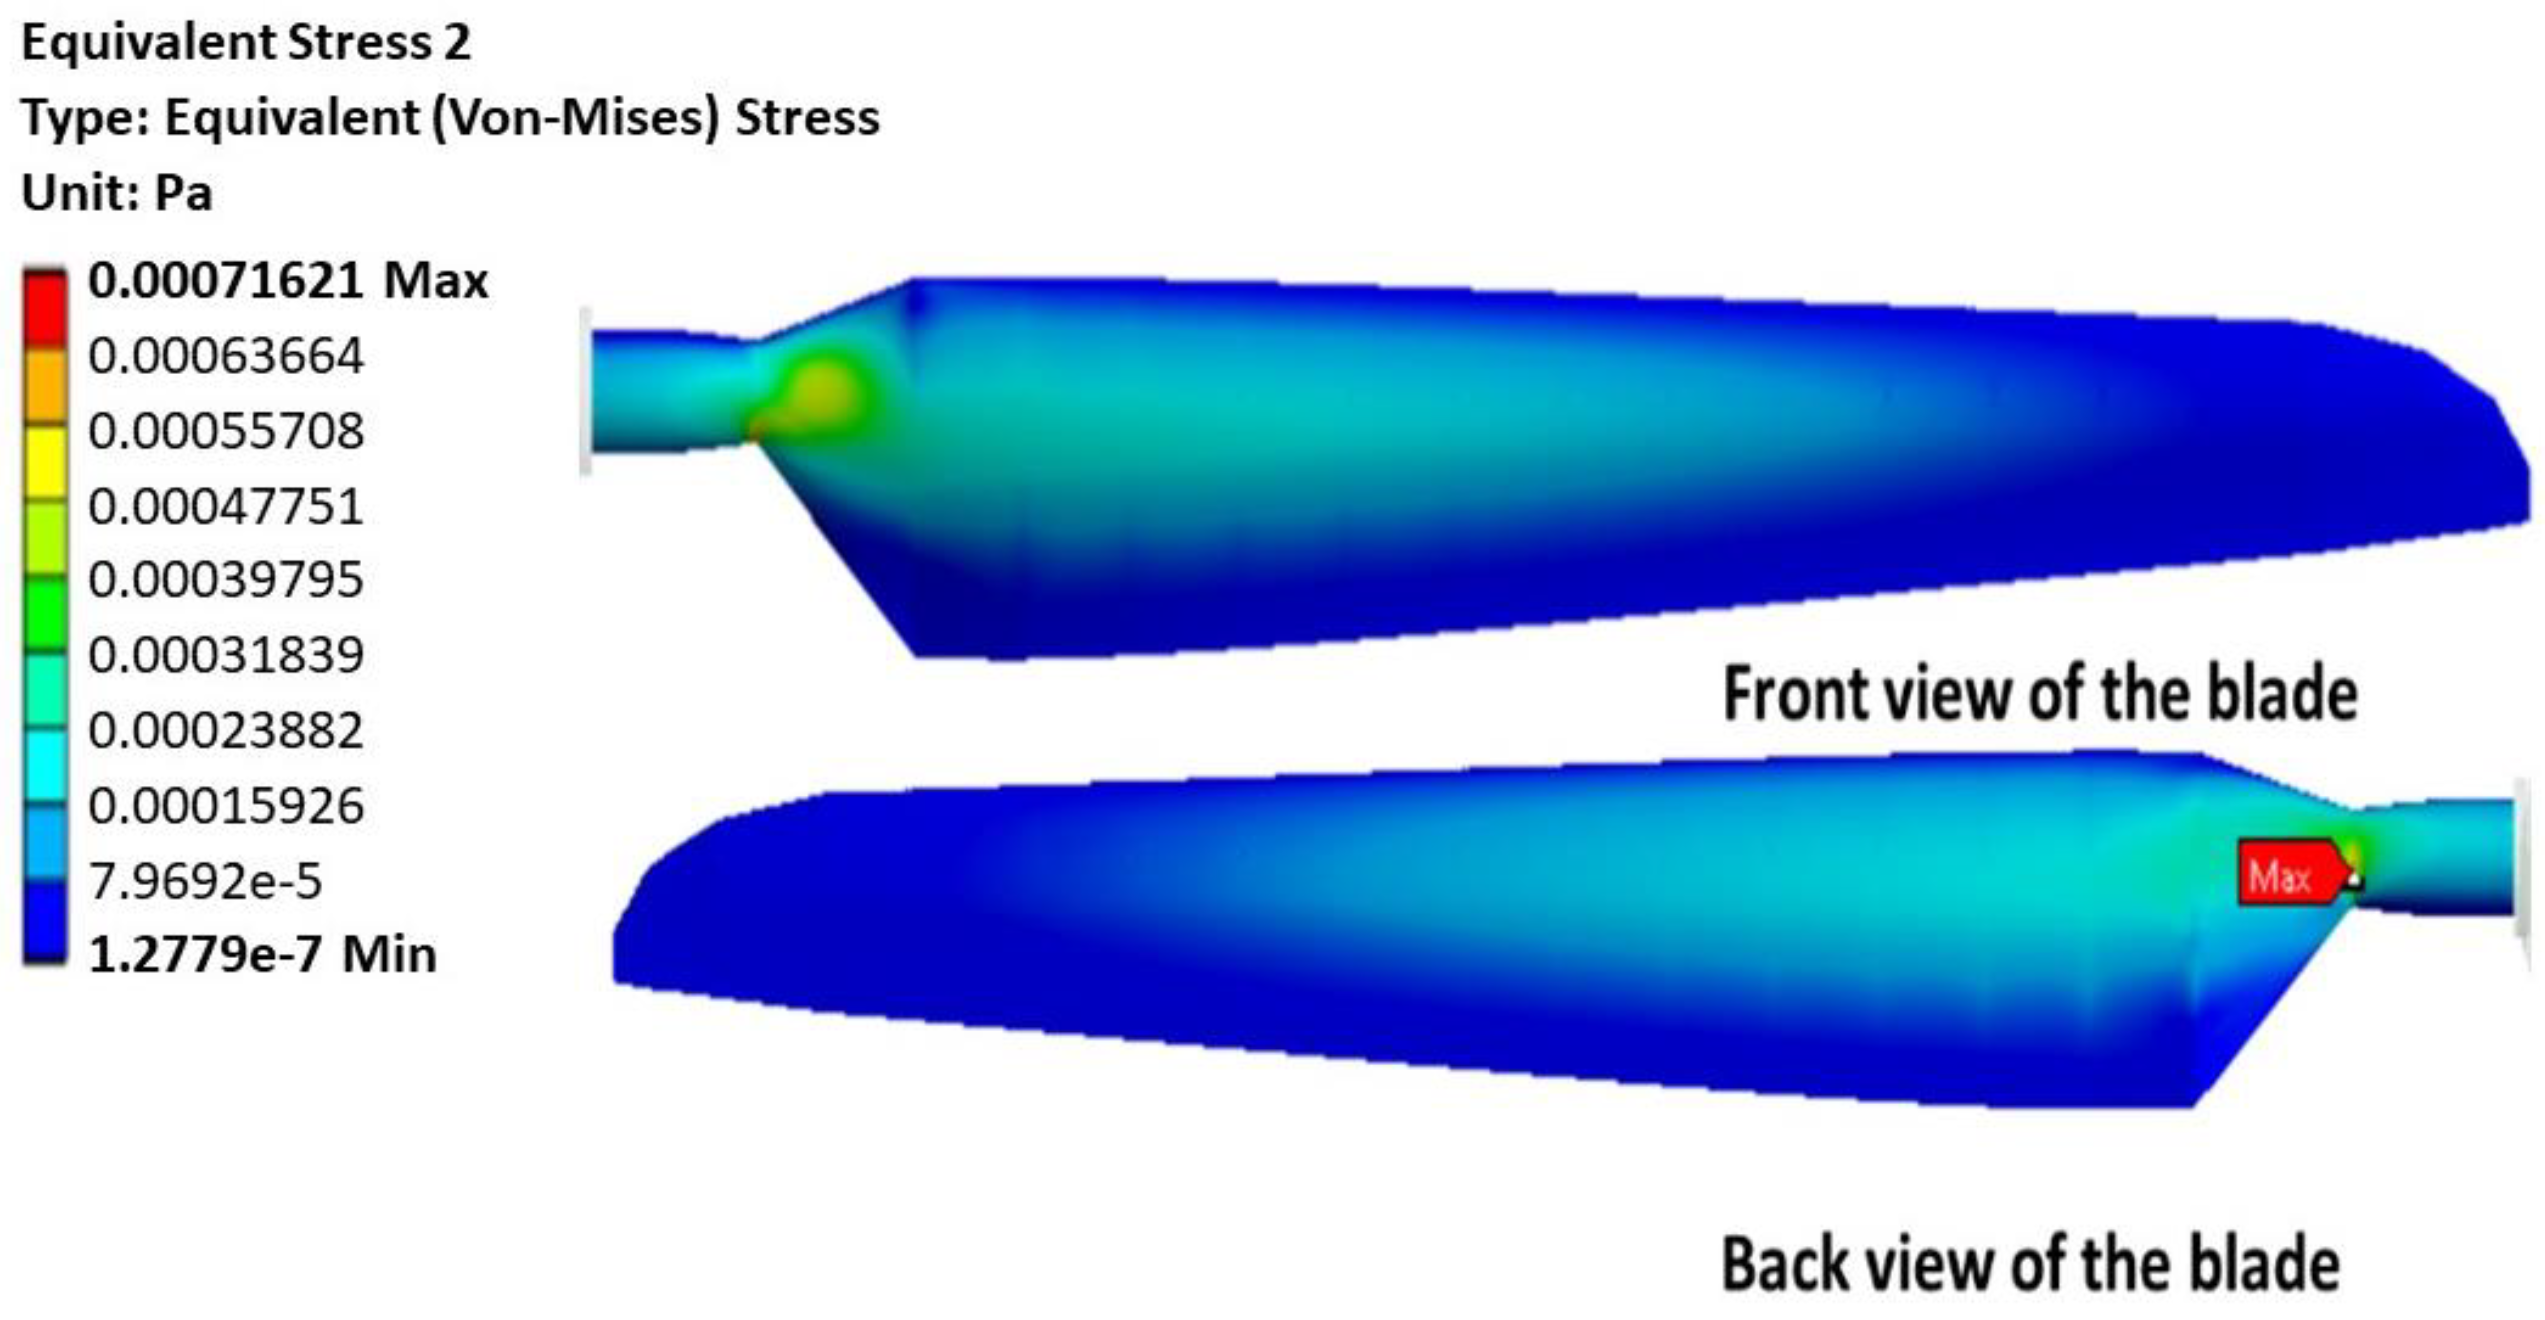
As shown in Figure 25, the stress distribution of blade Type 3 is represented for all wind speeds. It includes a front view of the blade which faces the wind, and a back view of the blade. For wind speed of 5 m/s, in particular, an internal view to visualize the stress distribution inside the blade is also plotted for illustration. The maximum stress was detected at the back of the blades on the transition between the root and the airfoil section of the blade. The wind speed of 5 m/s is the lowest considered in this analysis; therefore, the maximum equivalent stress value is considerably small compared with the material yield strength. The maximum stress value is 2.82 MPa which is about one-eighth of the yield strength of polyethylene. With the increase in wind speed, the maximum equivalent stress value increases, while its distribution along the blade remains similar. The stress becomes more concentrated in the back of the transition section of the blade.
From 5 m/s to 7 m/s, the maximum stress increases by 169%, which is due to the change in both thrust and torque forces that occurred between those two speeds. At the wind speed of 10 m/s, the maximum stress is found to be larger than the one at 7 m/s with an increase of 47%. After 10 m/s, the torque force experiences a small decrease, while the thrust force continues to increase. This effect results in a minor change in the maximum equivalent stress which is a 2% increase from 10 m/s to 13 m/s. For this blade with a Type 3 tip, the torque decreased after 13 m/s with a bigger slope. Therefore, a small decrease in the maximum stress value occurred at 15 m/s. At high wind speeds, the maximum stress reached 14.1 MPa and 18.3 MPa at wind speeds of 20 m/s and 25 m/s, respectively, and is almost three-fifths and four-fifths the yield strength, respectively. Blade Type 3 results in larger maximum stress values overall, but even at the highest speed, the equivalent stress remains smaller than its yield limit. The stress–strain for all the wind speeds is considered to remain linear, and the strain generated will not cause a break or a failure of the material.
The CFD results [26] showed that blade Type 3 generates the largest torque for all wind speeds and thrust is relatively larger compared to Type 1 and Type 2. The reaction of the blades to those loading forces shows that the largest stress values occurred with Type 3. 
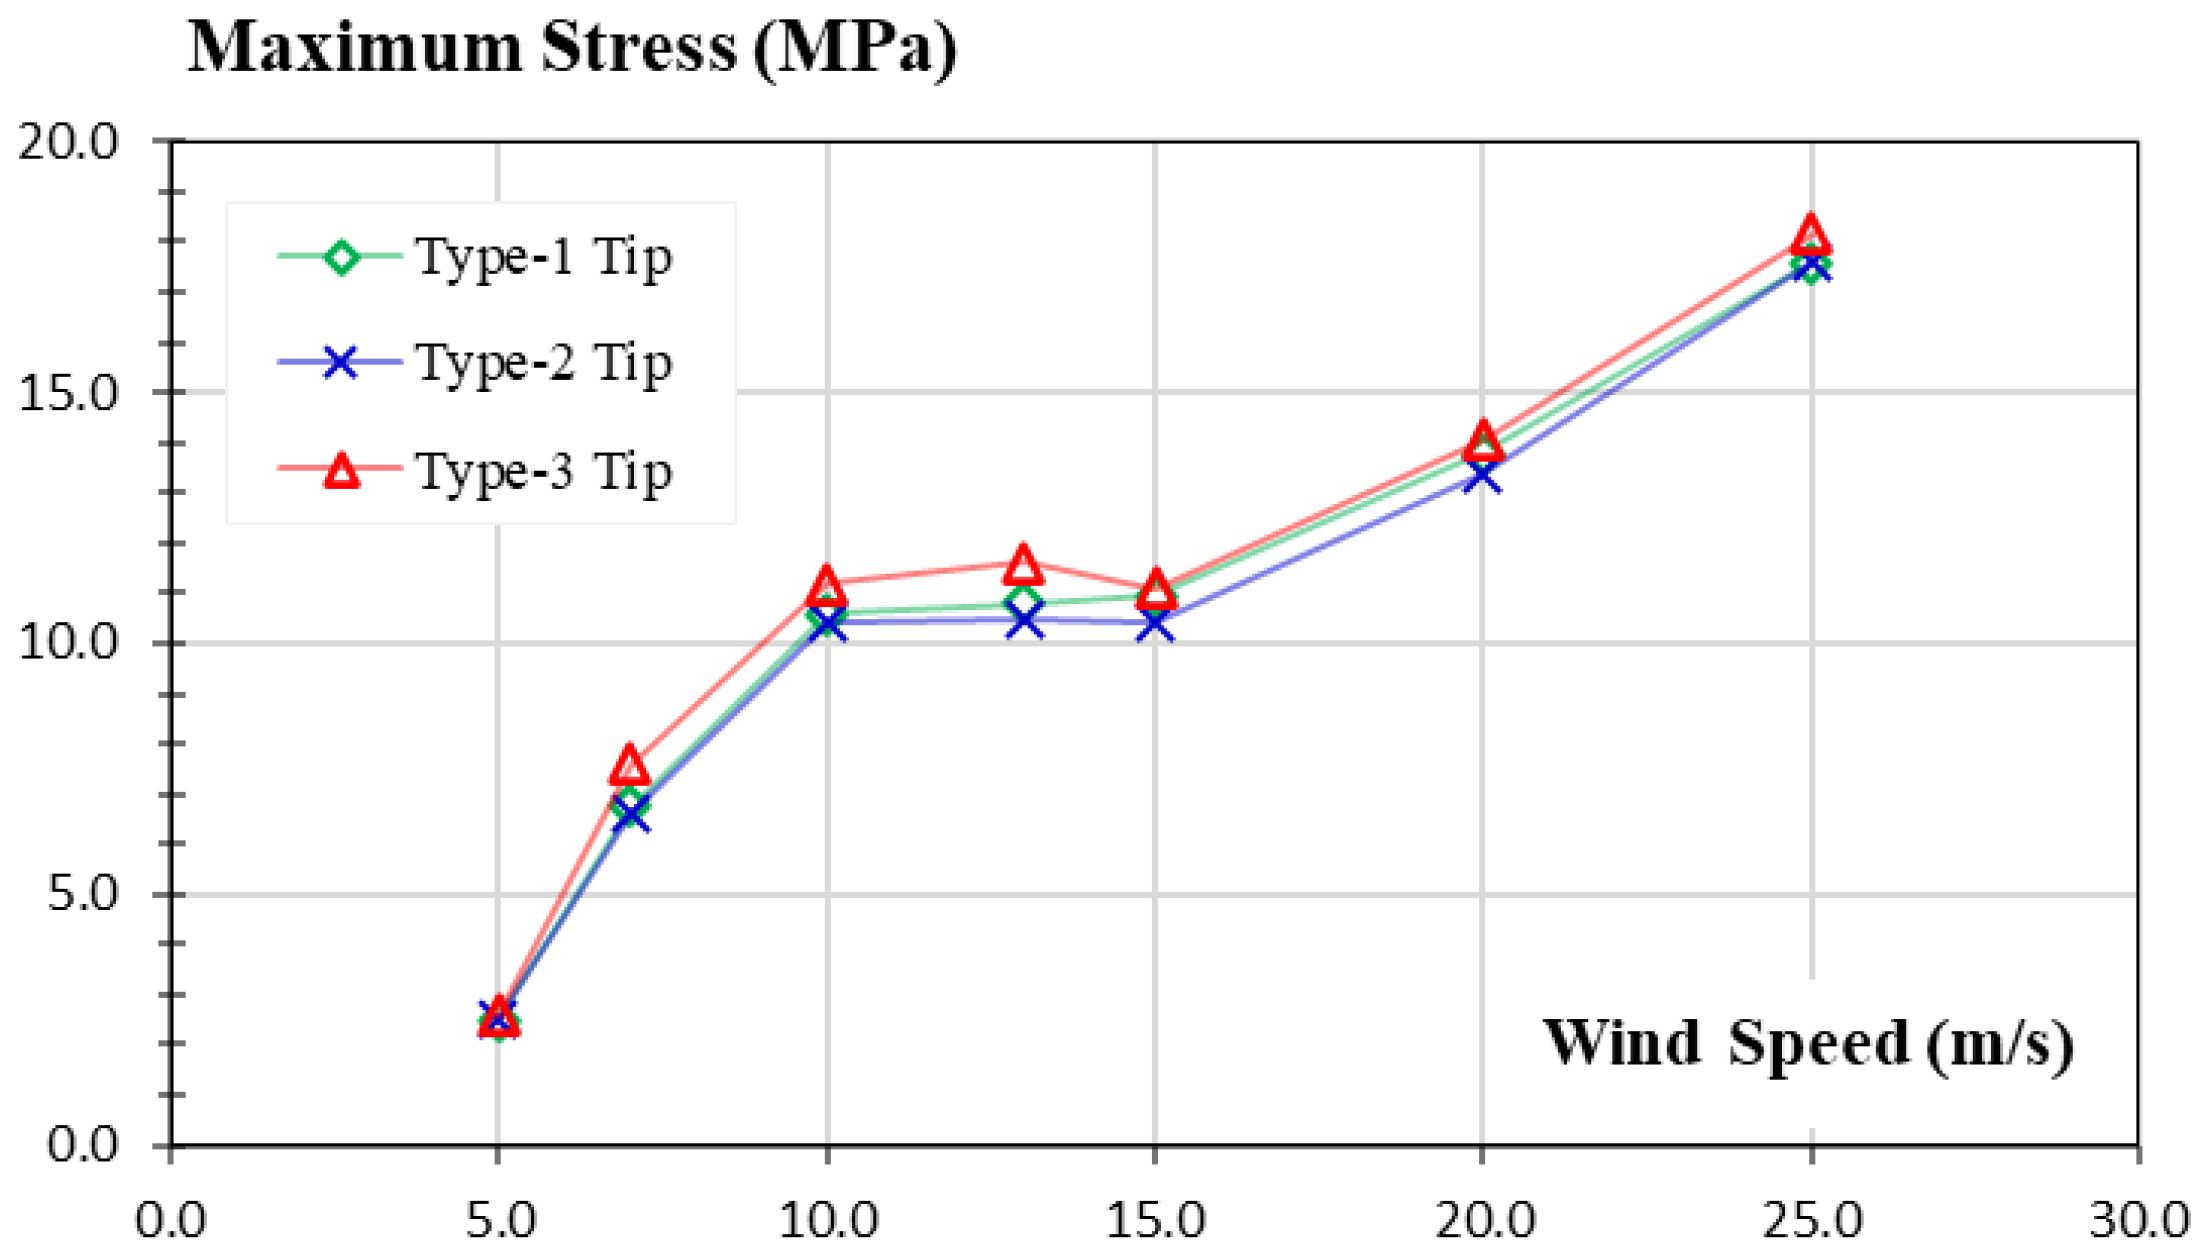
Figure 26 shows a comparison of the maximum stress values among blades with all three tip shapes at each of the seven considered wind speeds. It can be seen from the plot that the blade Type 2 experiences the lowest stress. At low speeds (5 m/s and 7 m/s), the difference of stress between the three types of blades is negligible. From a wind speed of 10 m/s to 13 m/s, the change in the maximum stress for each blade is also insignificant for the three blades. An increase in the maximum stress from the value captured at 10 m/s occurred, and at 13 m/s relevant increase reached 1.4%, 1.04%, and 2.5% for blades Type 1, Type 2 and Type 3, respectively. From 13 m/s to 15 m/s, the maximum stress decreases slightly. After 15 m/s, the stress starts to increase again to reach the maximum value of 17.655 MPa, 17.686 MPa, and 18.2972 MPa for Type 1, Type 2, and Type 3, respectively. These maximum stress values found at the highest wind speed is still less than the yield stress of the material for all three shapes.

3.6. Strain Distribution

Strain is the amount of deformation experienced by the body that results from an applied force (stress). It is calculated as the ratio of the deformed dimension to its original value. In this study, a static-structural analysis is performed, in other words, the variations of the loads and the structure’s response with respect to time are assumed to be insignificant in the analysis. The objective of this study is to predict the structural behavior of the wind turbine blades due to the geometry change with modified tips.
The results from the CFD analysis show the efficiency of the pointed tips in terms of aerodynamics, while the displacements resulting from structural analysis show that blades modified with pointed tips experience larger deformations compared with the original blade. Like stress, the equivalent strain is a scalar value that represents the complex 3-D strains in a structure with a single scalar value. The maximum strain is found on the root of the back side of the blades. An example of the strain distribution is shown in Figure 27 to illustrate the strain distribution along the blade with a Type 3 tip at a wind speed of 10 m/s. The front and back sides of the concerned blade present almost the same distributions. Both the leading and trailing edges exhibit smaller values while the middle area of the blade demonstrates a relatively larger strain value since the deformation is dominated by loading in the flap-wise direction. Among the three types of blades, it can be concluded that at low wind speeds (e.g., 5 m/s and 7 m/s), the tip effect is not relevant. The equivalent strain, therefore, is almost the same for the pointed-tip cases. At medium wind speeds (e.g., from 10 m/s to 15 m/s), the blade Type 3 (as predicted in the deformation values) experiences the highest value of the strain. At a wind speed of 10 m/s, the increase in the maximum equivalent strain value of blade Type 3 from those of blades Type 1 and Type 2 reached 11% and 8%, respectively. At 13 m/s, the strain values of blade Type 1 and Type 2 are close, while the value of blade Type 3 is about 9% higher. The deviation of strains between different blades decreases at 15 m/s and the value of blade Type 3 is about 4% and 7% higher than those of Type 1 and Type 2, respectively. At high wind speeds (e.g., 20 m/s and 25 m/s), blade Type 3 experiences larger deformations than the other two shapes, and the percentages of the increase are 2% and 3% for 20 m/s and 25 m/s, respectively. Two conclusions can then be made in this case; the first will be to neglect the effect of the tip on the structure of the blades since the strains were very small and focus on the increase in the torque force that was brought by the change in the tip shape. The second one will be to study the wind turbine’s structural response in extreme wind cases, and extract the strains and deformations generated to analyze the impact of the tip on higher wind speeds than the one used in this study.
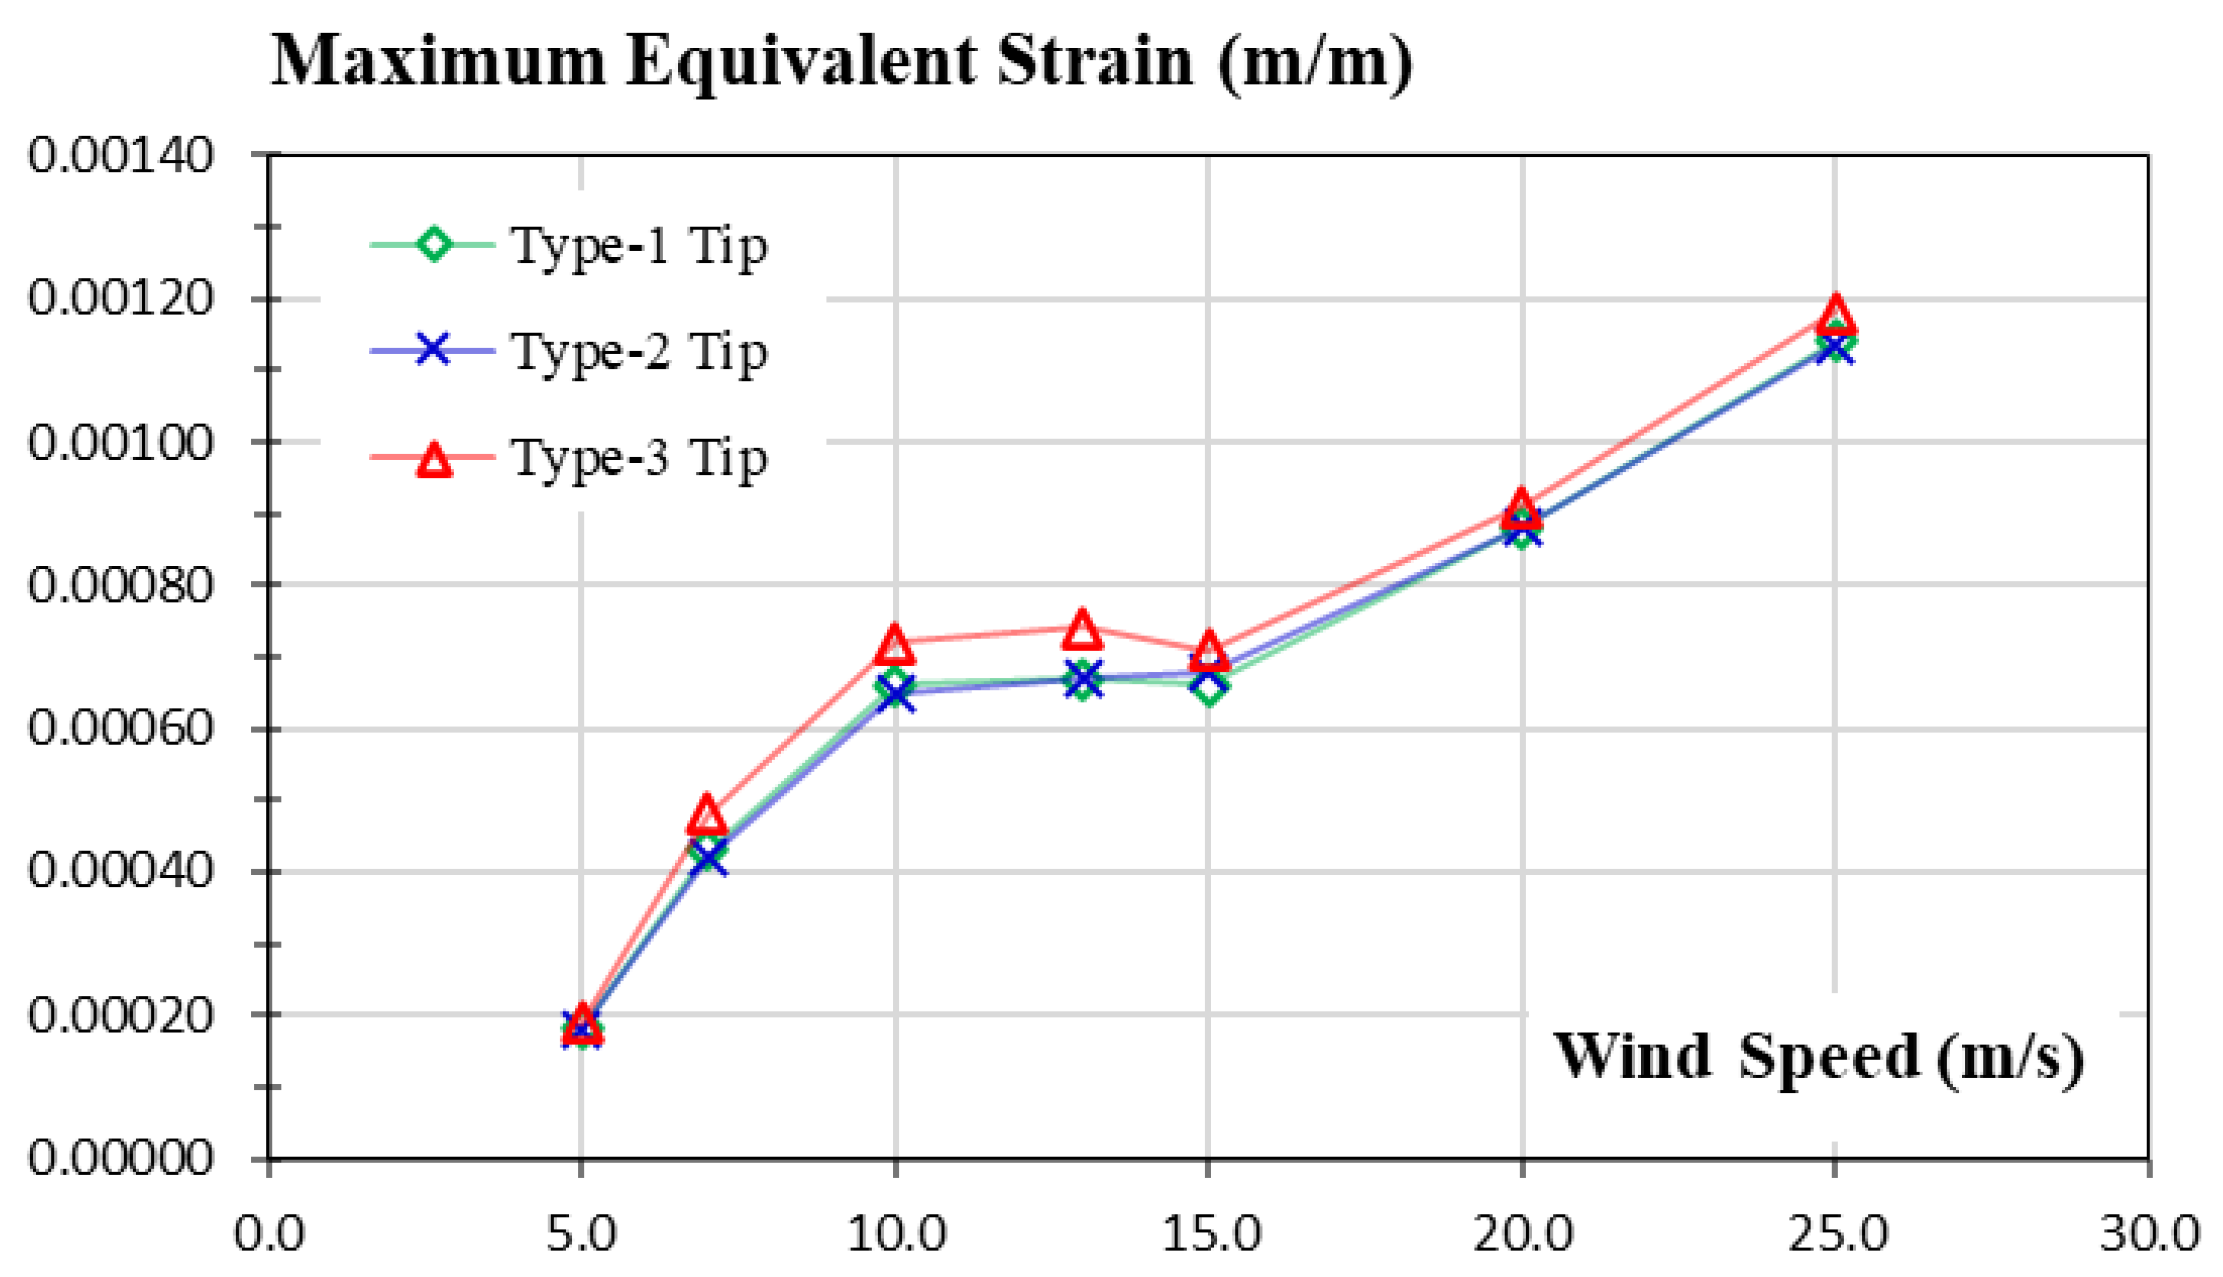
Figure 28 shows the maximum equivalent strain that occurs on the three blades at each wind speed considered in this study. Larger maximum strain values are found for blade Type 3 compared with the other two blades. For all blade types, the strain values start to increase with the incremental wind speeds in the low-speed region but become stable after a wind speed of 10 m/s. A slight decrease occurred in the maximum value of strain at 15 m/s for blade Type 3. For other blades, the strain value remains between 0.06% and 0.08% in the medium-speed range. After a wind speed of 15 m/s, the strain increases linearly with the wind speed for all blades. It is worth noting that strains observed on the blade modified with a pointed tip from its leading edge (Type 3) are larger than those of the other two blades for all concerned wind speeds, while strains of the blade with a pointed tip from the trailing edge (Type 2) are found to be the smallest at all wind speeds except for 15 m/s.

4. Conclusions

A static-structural study of three different shapes of pointed-tip blades was carried out to predict the effect of the tip-shape change on the structure of the blades. The NREL Phase VI turbine blade was selected as the baseline model. Three blades were created based on the original shape, but with only the end of the blade modified with three pointed-tip shapes. The tower, the nacelle, the hub, and the shafts were incorporated into the design of the turbine for an accurate structural analysis. Seven wind speeds in the range from 5 m/s to 25 m/s were investigated.
A previous CFD study compared the power generation efficiency of the three new blades in terms of the aerodynamics of the original NREL shape. At low wind speeds (i.e., 5 m/s and 7 m/s), CFD simulations resulted in small variations of the aerodynamic forces. At medium wind speeds (i.e., 10 m/s, 13 m/s, and 15 m/s), larger tangential forces are observed to occur on a Type 3 blade compared with other blades, indicating a larger value of torque force occurring with a Type 3 blade that could generate greater power. On the other hand, the thrust force on this blade (Type 3) is shown to be slightly larger than those of the other blades, indicating that the overall structural stability is close to each other for all three concerned blades. At high wind speeds (i.e., 20 m/s and 25 m/s), the torque from a Type 3 blade is still higher than that from a Type 1 and Type 2, while the thrust force is found to be smaller than the original NREL blade, indicating less deformation of the blades.
In this study, a one-way FSI approach is utilized using ANSYS by importing the pressure distribution from verified CFD calculations (fluid solver) to the structural solver. The load transfer between these two separate domains is completed by means of mapping. The static linear analysis based on FEA principles is then performed, and the results are presented in the directional displacements, the total deformation, and the stress and strain over the blades for further assessment.
In terms of displacement, blade Type 2 shows the lowest displacements compared with the other two blades at low speeds. At 10 and 13 m/s, the aerodynamic forces are similar for blades Type 1 and Type 2. Similar directional displacements are noticed at those wind speeds for the two blade cases and the original blade. The effect of the pointed-tip shape is negligible at these speeds (20 m/s and 25 m/s), while the original blades’ deformation is the highest. However, blade Type 3 experiences the largest displacement among the three modified blades. According to the previous results, the total deformation of the blades is governed by thrust which is the aerodynamic force along the X-axis.
The stress distributions show maximum values at the transition sections between the hub and the airfoil section of the blades. The aerodynamic forces are affected by the tip shape; however, this effect shows on the stress of the back side of the rotor precisely at the connection of the blades with their roots. The maximum stress values increase with the wind speed change, but blade Type 3 shows the highest values among the cases studied.
The strain generated is small for all three types of blades, and its maximum value changes linearly in low- and high-speed regions. However, the values remain in a fixed interval for the medium wind speeds where the maximum efficiency of the turbine studied occurs, which indicates that the structural behavior is mainly conducted by the stall phenomenon’s effect rather than the wind speed values.
It can be concluded that the modification of tip shapes shows a considerable effect on the structural behavior of the blades. The blade modified with a pointed tip that generates the highest torque forces is the one that exhibited more deformations and stresses, while it is still predicted to be structurally stable. The blade with a Type 2 tip presents the smallest deformation values at most wind speeds. Therefore, the compromise between power generation and structural stability is hard to achieve in this study. Static-structural studies include invariant loads that remain constant with time; therefore, the deformations generated in such analyses are small. The choice of the tip shape can be made with two different criteria: the first one is based on maximizing the power generation, and the second one is to focus on the blade’s structural stability. A practical approach that represents a better alternative in such cases is to perform an optimization technique to make the most effective conclusion on which type of pointed tips studied will be beneficial in terms of both power generation and structural strength.

Author Contributions

Conceptualization, Z.H. and R.R.K.; methodology, F.Z. and Z.H.; software, F.Z.; validation, F.Z. and Z.H.; formal analysis, F.Z. and Z.H.; investigation, F.Z. and Z.H.; data curation, F.Z.; writing—original draft preparation, F.Z., Z.H. and H.L.; writing—review and editing, H.L., Z.H. and R.R.K.; supervision, Z.H.; project administration, R.R.K.; funding acquisition, R.R.K. and Z.H. All authors have read and agreed to the published version of the manuscript.

Funding

This research was funded by the U.S. National Science Foundation (NSF) through the CREST Center for Energy & Environmental Sustainability, NSF CREST #1914692.

Data Availability Statement

Data are contained within the article.

Conflicts of Interest

The authors declare no conflicts of interest.

References

  1. O’Brien, J.M.; Young, T.M.; O’Mahoney, D.C.; Griffin, P.C. Horizontal axis wind turbine research: A review of commercial CFD, FE codes and experimental practices. Prog. Aerosp. Sci. 2017, 92, 1–24. [Google Scholar] [CrossRef]
  2. Madsen, M.; Zahle, F.; Horcas, S.G.; Barlas, T.K.; Sorensen, N.N. CFD-based curved tip shape design for wind turbine blades. Wind. Energy Sci. 2022, 7, 1471–1501. [Google Scholar] [CrossRef]
  3. Posta, G.D.; Leonardi, S.; Bernardini, M. A two-way coupling method for the study of aeroelastic effects in large wind turbines. Renew. Energy 2022, 190, 971–992. [Google Scholar] [CrossRef]
  4. Ning, S.A.; Damiani, R.; Moriarty, P.J. Objectives and Constraints for Wind Turbine Optimization; ASME Wind Energy Symposium: Grapevine, TX, USA, 2013. [Google Scholar]
  5. Wang, X.; Shen, W.; Zhu, W.; Soerensen, J.N.; Chen, J. Shape optimization of wind turbine blades. Wind Energy 2009, 12, 781–803. [Google Scholar]
  6. Ferrer, E.; Munduate, X. Wind turbine blade tip comparison using CFD. J. Phys. Conf. Ser. 2007, 75, 012005. [Google Scholar] [CrossRef]
  7. Chattot, J.J. Effects of blade tip modifications on wind turbine performance using vortex model. Comput. Fluids 2009, 38, 1405–1410. [Google Scholar] [CrossRef]
  8. Sessarego, M.; Feng, J.; Ramos-Garcia, N.; Horcas, S.G. Design optimization of a curved wind turbine blade using neural networks and an aero-elastic vortex method under turbulent inflow. Renew. Energy 2020, 146, 1524–1535. [Google Scholar] [CrossRef]
  9. Kaya, M.N.; Kose, F.; Uzol, O.; Ingham, D.; Ma, L.; Pourkashanian, M. Aerodynamic optimization of a swept horizontal axis wind turbine blade. J. Energy Resour. Technol. 2021, 143, 091301. [Google Scholar] [CrossRef]
  10. Johansen, J.; Soerensen, N.N. Aerodynamic Investigation of Winglets on Wind Turbine Blades Using CFD; Technical Report, Risoe-R No. 1543(EN); Risø National Lab: Roskilde, Denmark, 2006. [Google Scholar]
  11. Elfarra, M.A.; Sezer-Uzol, N.; Akmandor, I.S. NREL VI rotor blade: Numerical investigation and winglet design and optimization using CFD. Wind Energy 2014, 17, 605–626. [Google Scholar] [CrossRef]
  12. Dhert, T.; Ashuri, T.; Martins, J. Aerodynamic shape optimization of wind turbine blades using a Reynolds-averaged Navier–Stokes model and an adjoint method. Wind Energy 2017, 20, 909–926. [Google Scholar] [CrossRef]
  13. Zhong, J.; Li, J. Aerodynamic performance prediction of NREL phase VI blade adopting biplane airfoil. Energy 2020, 206, 118182. [Google Scholar] [CrossRef]
  14. Ke, W.; Hashem, I.; Zhang, W.; Zhu, B. Influence of leading-edge tubercles on the aerodynamic performance of a horizontal-axis wind turbine: A numerical study. Energy 2022, 239, 122186. [Google Scholar] [CrossRef]
  15. Wang, L.; Quant, R.; Kolios, A. Fluid structure interaction modelling of horizontal-axis wind turbine blades based on CFD and FEA. J. Wind. Eng. Ind. Aerodyn. 2016, 158, 11–25. [Google Scholar] [CrossRef]
  16. Lipian, M.; Czapski, P.; Obidowski, D. Fluid–structure interaction numerical analysis of a small, urban wind turbine blade. Energies 2020, 13, 1832. [Google Scholar] [CrossRef]
  17. Hsu, M.C.; Bazilevs, Y. Fluid–structure interaction modeling of wind turbines: Simulating the full machine. Comput. Mech. 2012, 50, 821–833. [Google Scholar] [CrossRef]
  18. Bazilevs, Y.; Korobenko, A.; Deng, X.; Yan, J. Fluid–Structure Interaction Modeling for Fatigue-Damage Prediction in Full-Scale Wind-Turbine Blades. J. Appl. Mech. 2016, 83, 061010. [Google Scholar] [CrossRef]
  19. Wang, L.; Liu, X.; Kolios, A. State of the art in the aeroelasticity of wind turbine blades: Aeroelastic modelling. Renew. Sustain. Energy Rev. 2016, 64, 195–210. [Google Scholar] [CrossRef]
  20. Pourrajabian, A.; Afshar, P.A.N.; Ahmadizadeh, M.; Wood, D. Aero-structural design and optimization of a small wind turbine blade. Renew. Energy 2016, 87, 837–848. [Google Scholar] [CrossRef]
  21. Lee, K.; Huque, Z.; Kommalapati, R.; Han, S. Fluid-structure interaction analysis of NREL phase VI wind turbine: Aerodynamic force evaluation and structural analysis using FSI analysis. J. Renew. Energy 2017, 113, 512–531. [Google Scholar] [CrossRef]
  22. Grinderslev, C.; Soerensen, N.N.; Horcas, S.G.; Troldborg, N.; Zahle, F. Wind turbines in atmospheric flow: Fluid–structure interaction simulations with hybrid turbulence modeling. Wind. Energy Sci. 2021, 6, 627–643. [Google Scholar] [CrossRef]
  23. Lee, K.; Roy, S.; Huque, Z.; Kommalapati, R.; Sui, C.; Munir, N. Pointed tip shape effect on aerodynamic load for NREL Phase VI wind turbine blade. J. Clean Energy Technol. 2015, 4, 284–289. [Google Scholar] [CrossRef]
  24. Lee, K.; Huque, Z.; Kommalapati, R.; Han, S. Evaluation of equivalent structural properties of NREL phase VI wind turbine blade. J. Renew. Energy 2016, 86, 796–818. [Google Scholar] [CrossRef]
  25. Hand, M.; Simms, D.; Fingersh, L.; Jager, D.; Cotrell, J.; Schreck, S.; Larwood, S. Unsteady Aerodynamics Experiment Phase VI: Wind Tunnel Test Configurations and Available Data Campaigns; Technical Report, NREL/TP-500-29955; National Renewable Energy Laboratory: Golden, CO, USA, 2001. [Google Scholar]
  26. Roy, S. Effect of Tip Shape on Aerodynamic Characteristic of 3D Wind Turbine Blade. Master’s Thesis, Prairie View A&M University, Prairie View, TX, USA, 2015. [Google Scholar]
Figure 1. Torque and thrust of NREL Phase VI blade with modified pointed tips at different wind speeds.
Energies 17 01090 g001
Figure 2. Experimental setup: (a) schematic of NREL Phase VI wind turbine; (b) blade surface pressure and probe locations. (Sources: NREL, 2001 [25]).
Energies 17 01090 g002
Figure 3. Measurements of NREL Phase VI blade (original test shape).
Energies 17 01090 g003
Figure 4. Twist angle and chord length of NREL Phase VI blade.
Energies 17 01090 g004
Figure 5. Three-dimensional geometries of NREL Phase IV blade and blade modified with a pointed tip at pitch axis (Type 1).
Energies 17 01090 g005
Figure 6. Three-dimensional models of NREL Phase IV blade and variants with different modified tips.
Energies 17 01090 g006
Figure 7. Numerical model of NREL Phase VI wind turbine with different tips.
Energies 17 01090 g007
Figure 8. Mesh quality check in ANSYS: (a) element quality; (b) skewness; and (c) orthogonal quality.
Energies 17 01090 g008
Figure 9. Mesh of different blades in the ANSYS model.
Energies 17 01090 g009
Figure 10. CFD-based one-way FSI and BEM approaches.
Energies 17 01090 g010
Figure 11. Schematic setup of one-way FSI analysis within ANSYS Workbench.
Energies 17 01090 g011
Figure 12. Pressure from fluid solver (CFD) imported to static-structural analysis.
Energies 17 01090 g012
Figure 13. Imported load on the blade with Type 1 tip at different wind speeds.
Energies 17 01090 g013aEnergies 17 01090 g013b
Figure 14. Imported load on the blade with Type 2 tip at different wind speeds.
Energies 17 01090 g014aEnergies 17 01090 g014b
Figure 15. Imported load on the blade with Type 3 tip at different wind speeds.
Energies 17 01090 g015aEnergies 17 01090 g015b
Figure 16. Directional displacements of blade Type 1 and original NREL shape [21] at wind speeds of 5 m/s and 7 m/s.
Energies 17 01090 g016
Figure 17. Directional displacements of blade Type 1 and original NREL shape [21] at wind speeds of 10 to 25 m/s.
Energies 17 01090 g017
Figure 18. Comparison of directional displacements between different blades [21] at wind speeds from 5 to 13 m/s.
Energies 17 01090 g018
Figure 19. Comparison of directional displacements between different blades [21] at wind speed of 15 m/s.
Energies 17 01090 g019
Figure 20. Comparison of directional displacements between different blades [21] at wind speeds of 20 and 25 m/s.
Energies 17 01090 g020
Figure 21. Comparison of maximum X- and Y-axes displacement for different blades [21].
Energies 17 01090 g021
Figure 22. Total deformation of the whole turbine with blade Type 1 at different wind speeds.
Energies 17 01090 g022aEnergies 17 01090 g022b
Figure 23. Comparison of total deformations of three blades at different wind speeds.
Energies 17 01090 g023
Figure 24. Maximum total deformation at blade tips.
Energies 17 01090 g024
Figure 25. Stress distribution on Type 3 blade at different wind speeds.
Energies 17 01090 g025
Figure 26. Maximum stress values on the three blades.
Energies 17 01090 g026
Figure 27. Strain distribution over the Type 3 blade at wind speed of 10 m/s.
Energies 17 01090 g027
Figure 28. Maximum strain values on the three blades.
Energies 17 01090 g028
Table 1. Material properties.
ComponentsMaterial 1Density (kg/m3)
BladesE = 1.56 × 10¹⁰ Pa
ν = 0.42
σy = 2.50 × 10⁷ Pa
1035
Nacelle, Hub, Shaft, etc.Steel-
TowerSteel (ASTM A106)7850
1 E indicates Young’s modulus, ν Poisson’s ratio, and σy Yield strength.
Disclaimer/Publisher’s Note: The statements, opinions and data contained in all publications are solely those of the individual author(s) and contributor(s) and not of MDPI and/or the editor(s). MDPI and/or the editor(s) disclaim responsibility for any injury to people or property resulting from any ideas, methods, instructions or products referred to in the content.

