Article

Research on the Multiscale Microscopic Pore Structure of a Coalbed Methane Reservoir

1
Pilot Test Base for Coalbed Methane Production, China National Petroleum Corporation, Renqiu 062550, China
2
Exploration and Development Research Institute, HuaBei Oilfield Company, Renqiu 062550, China
3
Research & Development Center of Bureau of Geophysical Prospecting, China National Petroleum Coproration, Zhuozhou 072750, China
4
National Key Laboratory of Deep Oil and Gas, China University of Petroleum (East China), Qingdao 266580, China
5
School of Petroleum Engineering, China University of Petroleum (East China), Qingdao 266580, China
6
Research Centre of Multiphase Flow in Porous Media, China University of Petroleum (East China), Qingdao 266580, China
7
Engineering Technology Research Institute, Huabei Oilfield Company, Renqiu 062550, China
*
Author to whom correspondence should be addressed.
Energies 2024, 17(5), 1081; https://doi.org/10.3390/en17051081
Submission received: 24 December 2023 / Revised: 19 January 2024 / Accepted: 29 January 2024 / Published: 24 February 2024
(This article belongs to the Section H1: Petroleum Engineering)

Abstract

:
Coal rock pores are the space in which coalbed gas is stored and flows. Accurately characterizing the pore structure of coalbed gas is the foundation of coalbed gas reserve assessment and production forecasting. Traditional experimental methods are unable to characterize the multi-scale pore structure characteristics of coal rock. In this paper, a multi-scale pore structure characterization method is proposed by coupling various experimental methods, including low-pressure nitrogen gas adsorption experiments, X-ray computed tomography (XCT) imaging technology, and scanning electron microscopy (SEM). Using Zhengzhuang coalbed gas as an example, the micro-pore structure of coalbed gas reservoirs is characterized and depicted from a multi-scale perspective. The results indicate that a single experimental approach can only partially reveal the microstructure of coal rock pores. The combined use of multiple methods can accurately reveal the full-scale microstructure of coal rock pores. The pore structure of the experimental coal rock samples exhibits multi-scale characteristics, with a complex variety of pore types, including inorganic pores, organic pores, and fractures. Organic pores are predominant, with a small number of inorganic pores, and their sizes range from 2 nm to 50 μm. Mineral particles and fractures are observed at both the nanoscale and microscale, exhibiting typical multi-scale characteristics, with quartz being the predominant mineral.

1. Introduction

Coalbed methane (CBM), as an unconventional and environmentally friendly energy source, has been gaining increasing attention both domestically and internationally. China, being abundant in CBM resources, holds tremendous development potential [1,2,3]. The Qingshui Basin is one of the earliest coalbed methane fields in China to achieve commercial production [4,5]. The basin covers an area of nearly 3 × 10⁴ km2 [4]. The main coal-bearing formations are the Taiyuan Formation and the Shanxi Formation. The Fanzhuang Block is the main development area, which has been in large-scale production since 2006, with over 1500 producing wells [6,7]. Among them, there are 463 low-production vertical wells with a daily output of less than 500 m3/d and 44 low-production horizontal wells with a daily output of less than 2000 m3/d [8,9]. The Zhengzhuang Block, developed in 2011, is located in the southern part of the Qingshui Basin, with complex coal geological conditions. The structural attitude of the strata within the Zhengzhuang Block is broad and gently inclined, with a general dip angle ranging from 3 to 7 degrees, and an average dip angle of around 4 degrees [8]. During the “13th Five-Year Plan” period, the Zhengzhuang gas field added 193 demonstration project wells, all of which were put into production, with well depths ranging from 600 to 850 m. In 2020, the average daily gas production of a single vertical well was 1800 m3, with a new capacity of 1.51 × 10⁸ m3, a capacity utilization rate of 97%, and broad prospects for commercial development [10].
Unlike conventional oil and gas resources, CBM exists in an adsorbed or free state within coal seams, and coal seams serve as both source rocks and reservoirs [11]. Researchers worldwide have conducted extensive studies on CBM reservoirs, commonly recognizing that coal seams exhibit complex pore structures comprising matrix pores and cleat pores. Matrix pores serve as the storage space for CBM, while cleat pores represent the primary conduits for CBM production [12,13,14]. Therefore, accurately characterizing and describing the micro-pore structure of coal seams is crucial for assessing CBM reserves, predicting production, and forming the foundation for the efficient exploitation and utilization of CBM resources [15].
At present, there are many methods used to characterize the pore microstructure of coalbed methane reservoirs, and there are three main types: The first is the non-material contact method, such as X-ray diffraction (XRD) [16] and nuclear magnetic resonance (NMR) [17], in which X-ray diffraction is used to determine the mineral structure of coal seams and the analysis of coal phase composition [16]. Although nuclear magnetic resonance technology can quickly and non-destructively determine the pore structure of coal and rock, its microscopic morphology cannot be intuitively observed [18,19]. The fluid injection method is widely used as a traditional experimental method to characterize the pore structure of coal and rock, but it has limitations, the main measurement range of mercury intrusion method is the pores with pore size of 0.1~100 μm, and it will cause irreversible damage to the experimental rock samples, while the gas adsorption desorption method mainly measures the pores with pore size of 2~100 nm, but can only effectively characterize the adsorbed pores [20,21]. The third type is image analysis methods such as CT imaging technology (XCT) [22,23], focused ion beam scanning electron microscopy (FIB-SEM), and nano-CT et al.; although CT imaging technology and scanning electron microscopy can accurately and intuitively obtain the microscopic pore structure of coal seams, there is a contradiction between image resolution and rock sample size. For instance, traditional CT scans can offer a larger field of view, but their resolution is generally greater than 1 micron, rendering them incapable of reflecting nano-scale pores in coal rocks at relatively low resolutions [24]. The maximum volume of focused ion beam scanning electron microscopy (FIB-SEM) samples is a few hundred cubic micrometers, smaller than the minimum required to characterize the micro-pore structure of the target coal rocks [25]. In other words, FIB-SEM samples cannot represent the microscopic pore structure of the coal rocks under study [26].
Numerous studies indicate that coal rock, as the reservoir and carrier of CBM, exhibits an exceptionally complex pore structure characterized by both pores and fractures [27,28]. Moreover, pore sizes vary significantly, ranging from nanometers to micrometers, resulting in a multi-scale pore structure. Using a single experimental technique limits the understanding and analysis of pore structures to only what can be captured by that method [29]. Therefore, it is essential to comprehensively understand and characterize the multi-type, multi-scale micro-pore structure of heterogeneous coal rock.
In this study, coal rock samples from the Zhengzhuang Block in the Qinshui Basin were used to conduct a series of experiments in the following sequence: first, low-pressure adsorption was employed, then an XCT experiment was performed, and finally, SEM-MAPs and SEM experiments were performed. The main goal of this work is to characterize the pore structure of coal rock at various scales.

2. Experimental Methods

2.1. Principle of Low Pressure Nitrogen Adsorption

The low-pressure adsorption method for determining solid surface area and pore size distribution is based on the adsorption behavior of gases on the surface of a solid material. When gas molecules come into contact with a solid surface, they are attracted to the surface due to the interactions between gas molecules and the solid surface molecules. Gas molecules become adsorbed on the solid surface until they can overcome the forces acting on them from the solid surface, at which point desorption occurs. At a specific pressure, when the rate of adsorption equals the rate of desorption, adsorption equilibrium is reached. In equilibrium, a certain gas pressure corresponds to a specific amount of gas adsorption, and as the equilibrium pressure changes, the amount of gas adsorption varies. The curve depicting the change in equilibrium adsorption with pressure is known as the adsorption isotherm, and studying the adsorption isotherm can provide information about the types of pores, surface area, and pore size distribution within the solid. Low-pressure nitrogen adsorption experiments can yield fundamental parameters and pore size distribution characteristics of coal pores, providing an overall reflection of coal porosity and permeability [30]. Given that coal rocks typically exhibit significant compressibility, conducting low-pressure nitrogen adsorption experiments under low-pressure conditions often allows for accurate data collection regarding micro-pores within coal samples.
Currently, the standardized method recognized for measuring solid surface area is the multilayer adsorption theory, specifically the BET (Brunauer–Emmett–Teller) adsorption isotherm method [18]. According to this theory, gas molecule adsorption on a solid surface occurs in multiple layers. The first layer can lead to the adsorption of a second layer, and the second layer can, in turn, result in the adsorption of a third layer, with each layer reaching its own adsorption equilibrium [31]. The specific adsorption equation is as follows:
V = V m C P P 0 P 1 + ( C 1 ) P / P 0
After transformation, we can obtain:
P V P 0 P = 1 C V m + C 1 C V m P P 0
where V is the gas adsorption capacity, mL/g; V m is the gas adsorption capacity, mL/g; P is the gas adsorption capacity, MPa; P 0 is the gas adsorption capacity, MPa; C is the gas adsorption capacity.
According to the experimental pressure and the corresponding adsorption amount, draw a straight line from P / V P 0 P to P / P 0 ; the slope and intercept of the straight line can be obtained and then calculated V m = 1 / (slope + intercept). In the low-pressure nitrogen adsorption experiment, the specific surface area can be calculated from the expression below:
S g = 4.36 V m

2.2. XCT Experiment

X-ray Computed Tomography (XCT) has been widely utilized in rock physics experiments due to its non-destructive, flexible, and fast characteristics. It involves statistically analyzing the numerical data obtained from X-rays passing through the sample to generate microstructural images of rock cores [32]. In this experiment, a Micro CT 500 system manufactured by Xradia (Pleasanton, CA, USA) was employed to conduct scanning experiments on shale samples, acquiring XCT microstructural images of the samples. The choice of the most suitable sample size and lens magnification was made based on the CT machine’s specifications, the different available lenses, and the physical properties of the rock core itself. Considering the scanning requirements for this study and balancing the scanning time with the clarity of the results, precise scans were conducted on coal samples from the core well in the target research area with resolutions of 25 μm and 4 μm.

2.3. SEM-MAPs and SEM Experiments

Due to the limited resolution of XCT at the micrometer scale and the presence of abundant nanoscale pores within coal rock, a secondary scan of the experimental coal rock samples was conducted using high-resolution equipment. SEM (scanning electron microscopy) technology was chosen to meet the demand for high-resolution imaging [25]. SEM operates by using high-energy electrons to interact with the experimental coal rock samples, generating various types of information on the sample’s surface and producing SEM images of the shale. However, it should be noted that SEM has a limited field of view [33,34]. To overcome this limitation, SEM-MAPs were employed. SEM-MAPs involve the sequential scanning of a series of high-resolution small images with overlapping edges in selected areas of interest on the XCT coal rock microstructural images. These high-resolution small images are then stitched together to create a large-field, high-resolution two-dimensional scanning electron image of the shale. Based on this high-resolution, large-field two-dimensional coal rock scanning image, specific areas of interest were selected for further ultra-high-resolution SEM experiments to obtain detailed characteristics of the shale’s micro-pore structure. In this experiment, the SEM-MAP technique was utilized. It involved scanning selected regions of interest in the coal rock experimental samples sequentially and then stitching the images together to create a large-field, high-precision image of the coal rock samples [35]. The resolution used in SEM-MAP was 50 nm, and the image field of view was 3.1 mm × 2.9 mm. Upon obtaining the stitched scanning electron microscope image, specific coal phase areas were selected for SEM scanning. High-precision scanning was carried out using the HELIOS NanoLab 660 device, with a resolution of 5 nm and a pixel size of 1024 × 1024.

3. Pore Development at a Single Scale

3.1. Low-Pressure Nitrogen Adsorption Experiment

3.1.1. Low-Pressure Nitrogen Adsorption–Desorption Curve Analysis

The experimental equipment used for the low-pressure nitrogen adsorption–desorption experiment in this study was the Kubo-X1000. Prior to the experiment, the coal rock samples needed to be ground to a particle size of 300 mesh, and the instrument was evacuated. The measurable pore size range was between 0.35 and 500 nm, covering the range of micropores, mesopores, and macropores. During the experiment, when gas molecules came into contact with the solid surface, some gas molecules were adsorbed on the solid surface. Desorption occurred when the thermal motion of gas molecules was sufficient to overcome the potential energy barrier of the solid surface, reaching adsorption equilibrium when the adsorption and desorption rates were equal [33]. When the temperature is constant, the adsorption amount is a function of relative pressure, and measuring the adsorption amount at different relative pressures yields adsorption–desorption isotherms. Low-pressure nitrogen gas adsorption experiments were conducted on salt rocks from four cores in the region, and adsorption–desorption curves for all coal rock samples were obtained, as shown in Figure 1. From Figure 1, it can be seen that hysteresis phenomena appeared in all other coal rock samples, where the liquid nitrogen adsorption and desorption curves did not overlap and the hysteresis occurred at relatively high relative pressures, indicating that the tested coal rock samples were typical medium- to high-rank coals. Previous studies have shown that the hysteresis phenomenon is mainly due to capillary condensation in the mesopores and macropores on the adsorbent’s surface. This indicates that the tested coal rock samples have well-developed micropores.
The differences in the shape of the adsorption hysteresis loop of coal rock samples are closely related to the pore shapes of the coal. It can be observed from Figure 1 that for core #123-4, with a specific surface area of 19.271 m2/g, the desorption curve of the coal rock sample exhibits a sudden drop at a relative pressure of about 0.55, indicating the presence of a significant number of ink bottle-shaped pores in the coal rock sample. For core #132-3, the adsorption and desorption curves of the coal rock sample are relatively flat, indicating the presence of a significant number of cylindrical pores in the coal rock.

3.1.2. Distribution Characteristics of Coal Rock Adsorption Pore Structure

The pore types in coal rock determine the shape of the adsorption–desorption isotherms, while the magnitude of coal rock’s adsorption capacity is mainly related to the characteristics of pore structure distribution. The analysis method for pore size distribution in low-pressure nitrogen adsorption experiments uses the non-local density functional theory (NLDFT), which provides insights into the distribution of adsorption pores in coal rock.
From the pore structure distribution chart in Figure 2, it is evident that there is a significant presence of pores in the coal rock samples, with diameters ranging from 2 to 40 nm. Typical peaks are observed in the chart, indicating that a substantial number of pores are concentrated around 2 nm and 4 nm. Combining the cumulative pore volume with the pore diameter-related chart, it can be inferred that although there are a greater number of small-diameter pores, they contribute less to the overall pore volume. The primary contribution to pore volume comes from larger-diameter pores.
From Figure 2, it is evident that for core #123-4, the pore diameter distribution ranges from 0 to 40 nm, with the majority concentrated below 5 nm, accounting for over 80% of the total. For core #132-3, the pore diameters are mainly distributed between 0 and 20 nm, and the distribution is relatively uniform.

3.2. XCT Petrographic Analysis

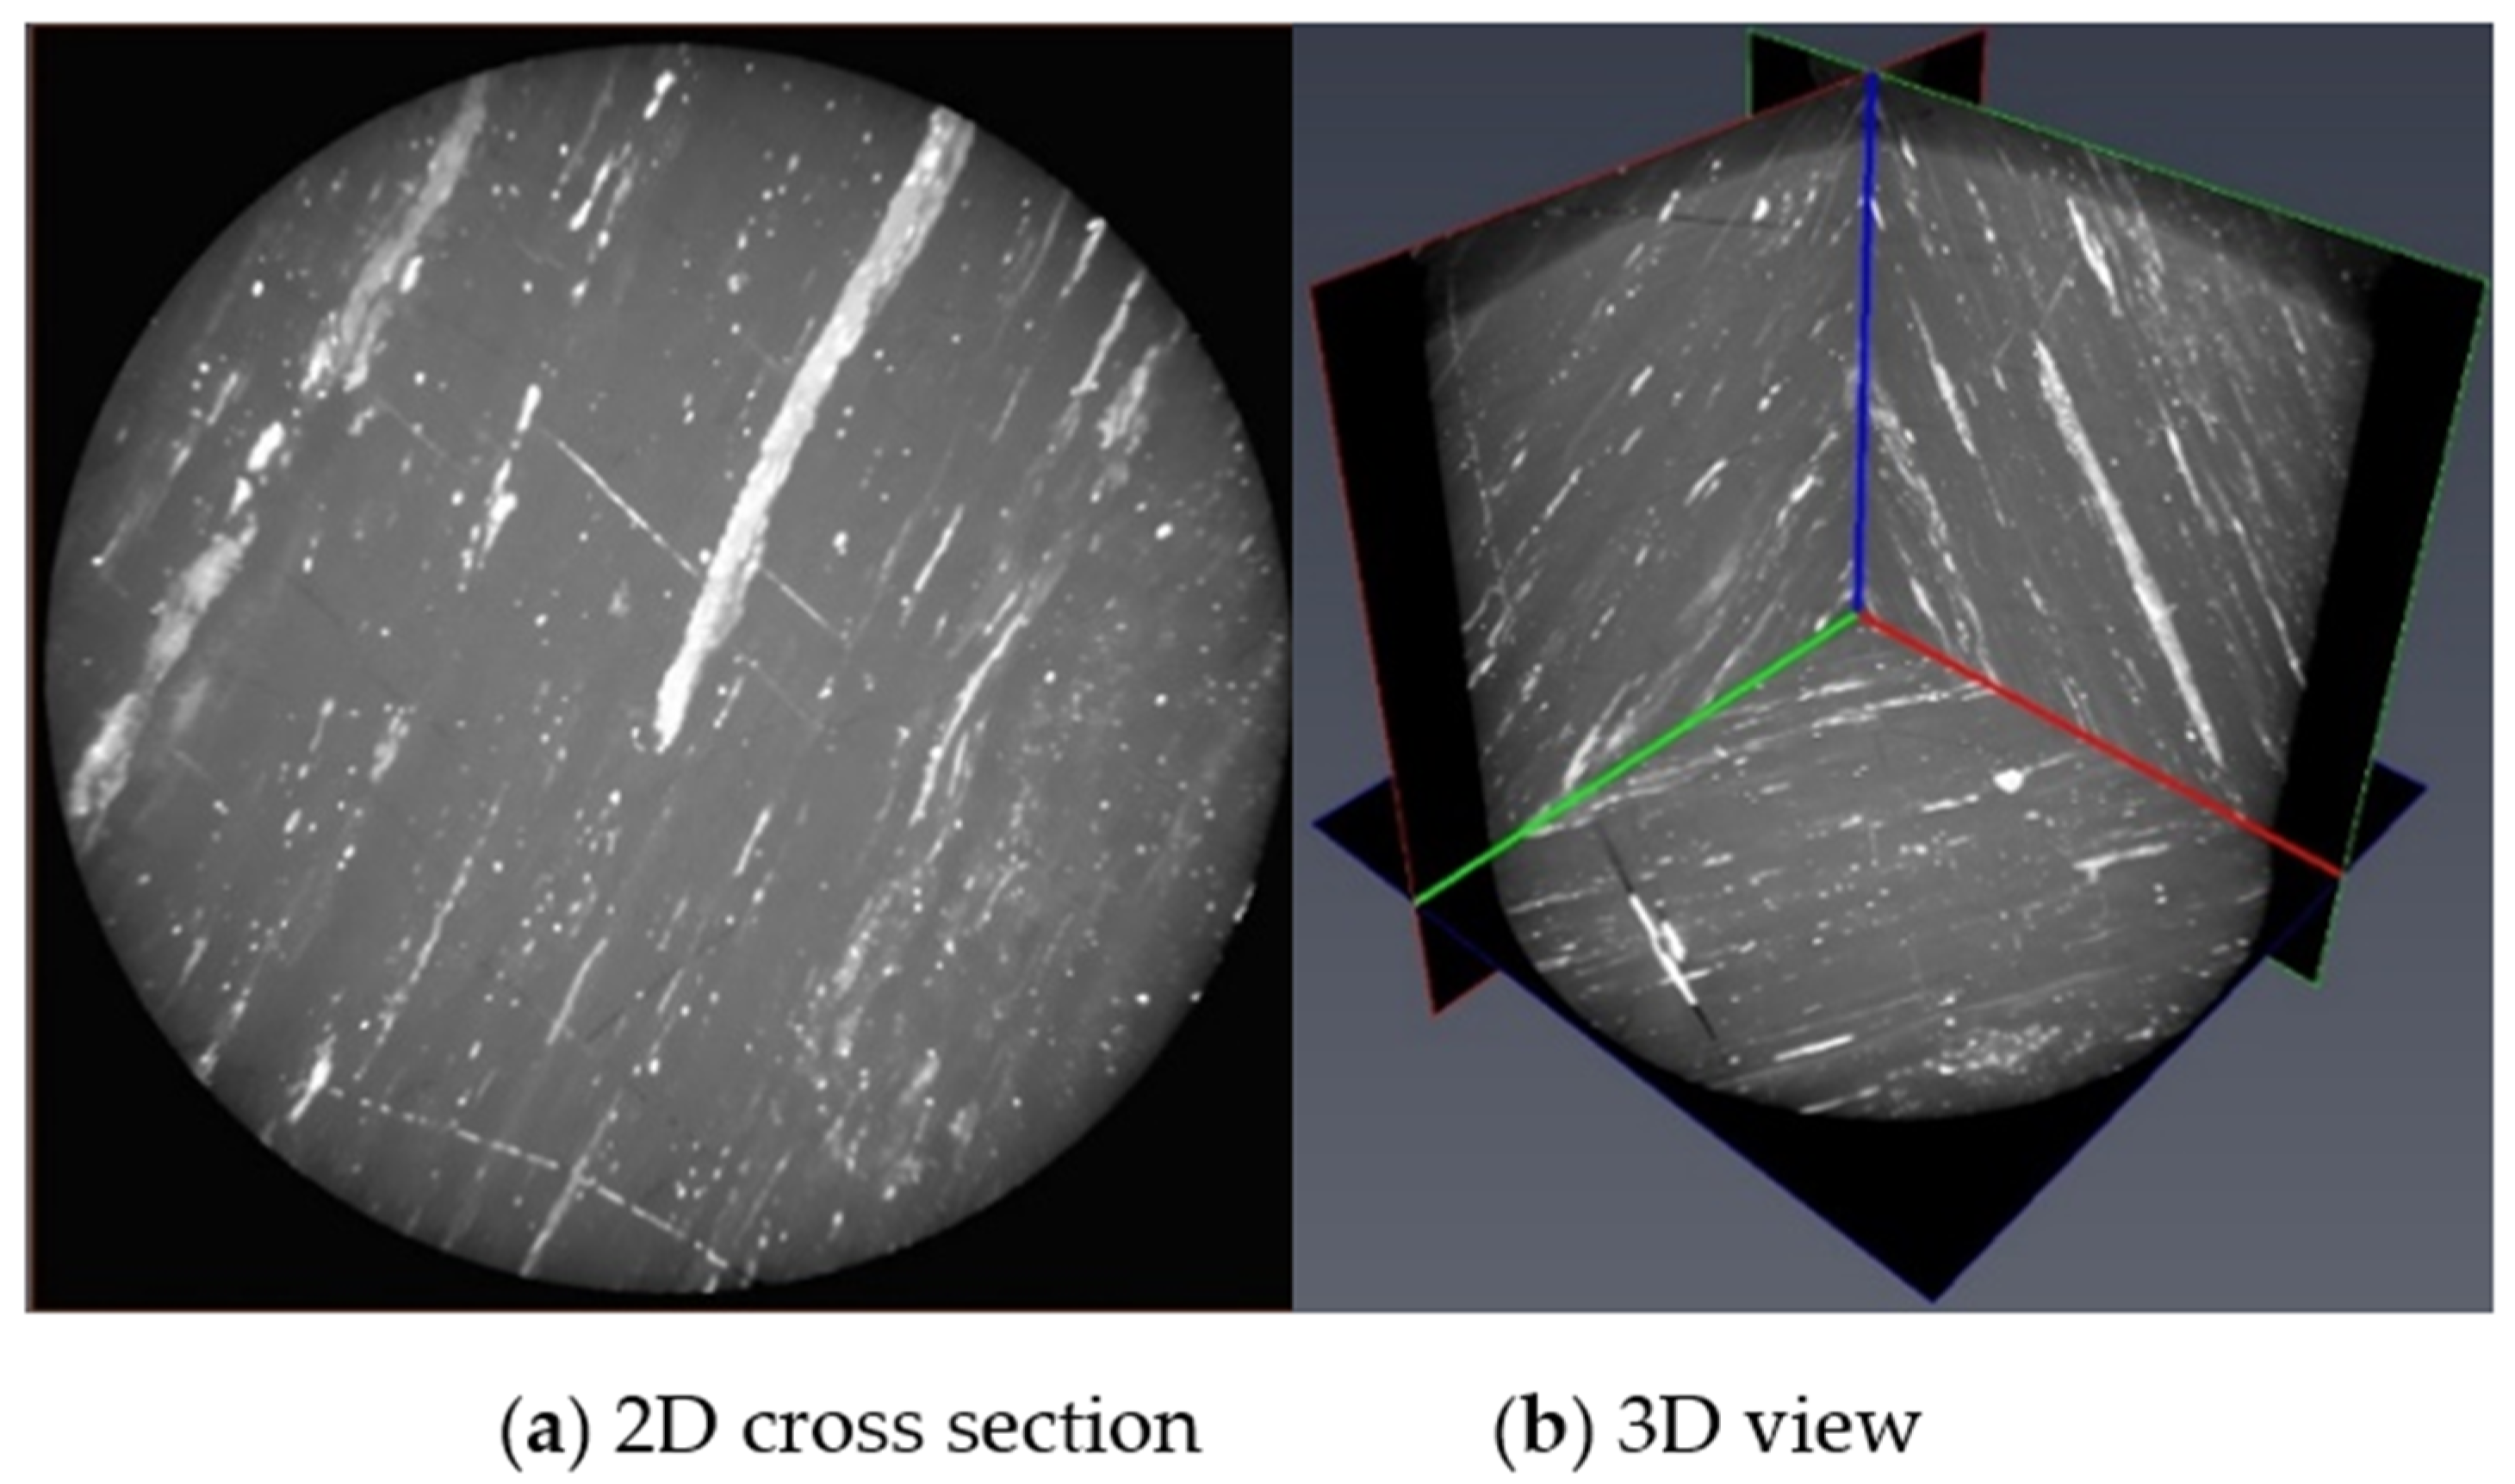
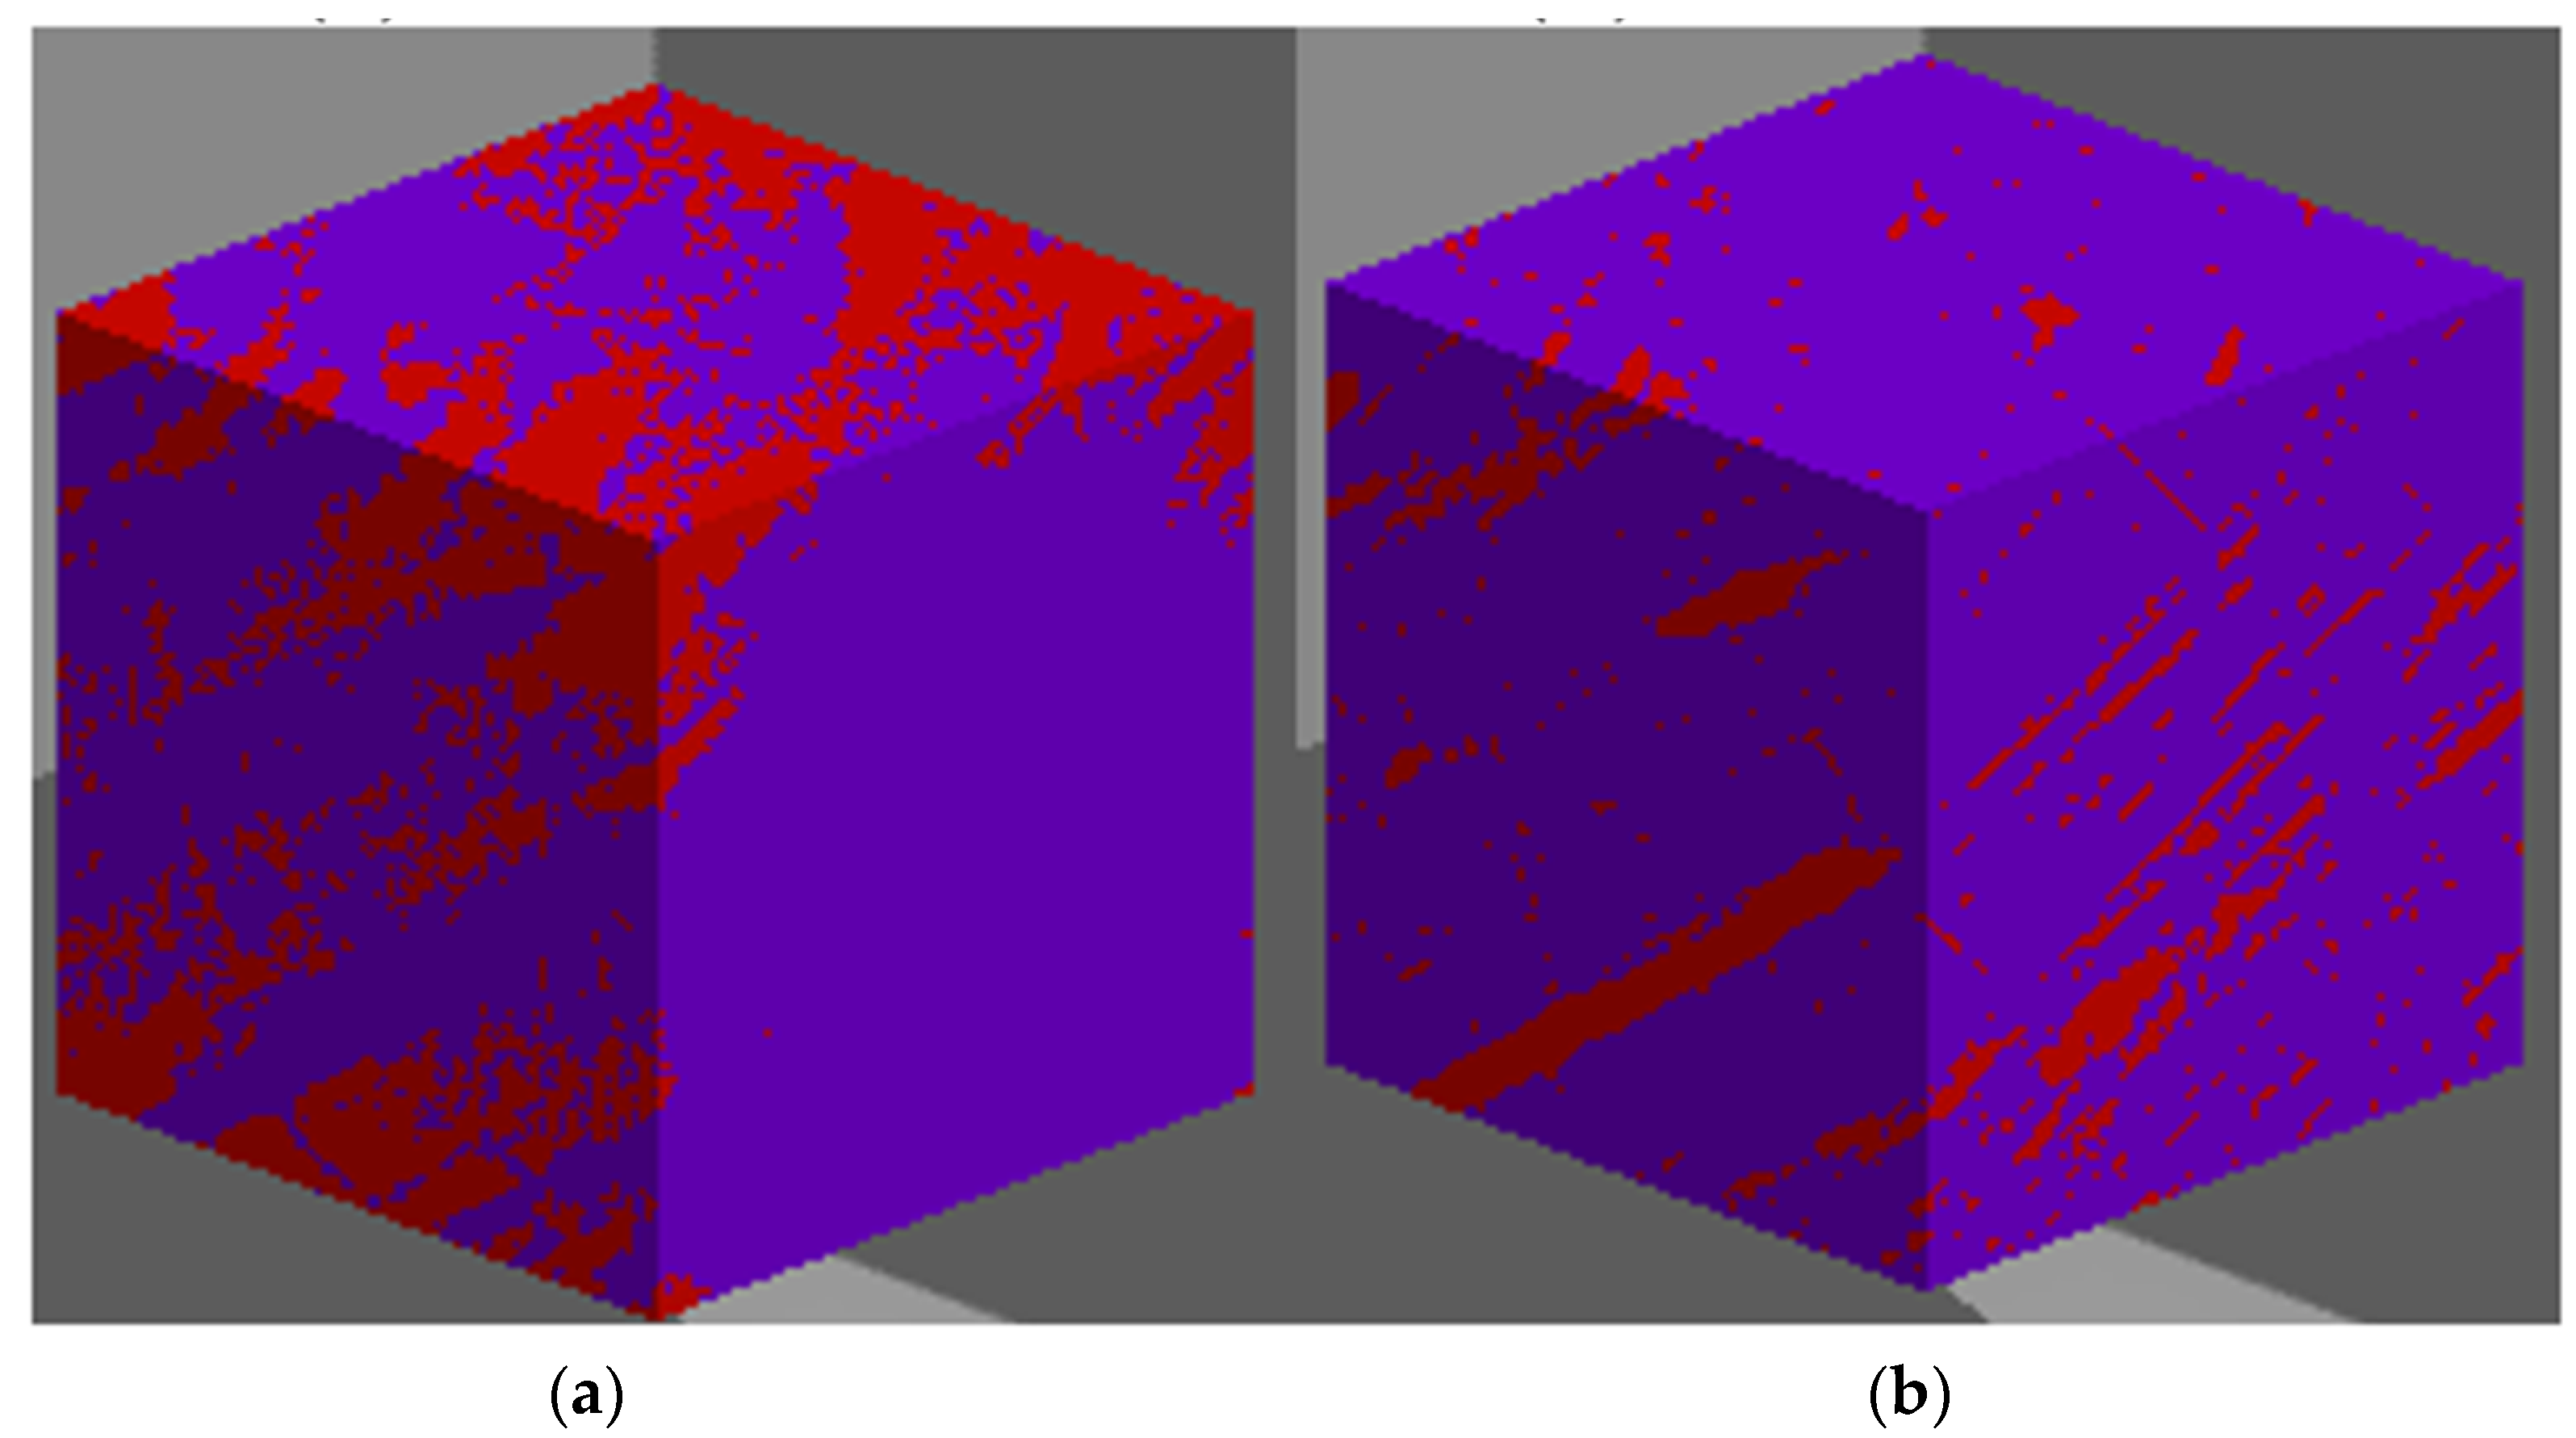
To obtain XCT (X-ray Computed Tomography) images of the coal rock experimental samples, the Micro CT 400 equipment produced by Xradia was used for scanning. The experimental scanning process for the rock samples proceeded as follows: Firstly, the samples were drilled, cut, and polished into cylindrical shapes with a diameter of 25 mm to ensure clear visualization of the microstructure of the samples. Subsequently, the rock samples were secured, and the X-ray source was activated. In this experiment, a 0.4× lens was used with an X-ray voltage of 75 keV, a power of 7 watts, and a resolution of 25 μm. The X-rays, after attenuation through the sample, were directed onto a detector and automatically captured and stored by image acquisition software [36]. By measuring the absorption of X-rays by the material, the composition of the substance can be determined. After completing the scanning process described above, the projection data of the rock core was obtained, which was then used to reconstruct grayscale images of the rock sample. Image reconstruction essentially involves solving the absorption coefficients of individual pixels in the image matrix from the acquired data and then reconstructing the image [31]. Taking core #132-3 as an example, both low-resolution and medium-resolution XCT scans were conducted, and the specific scan results are described below. Figure 3 shows the grayscale image of the low-resolution scan. It can be observed that the bright areas represent minerals, while the black areas represent pores. The distribution of minerals and pores is discrete, and there is poor connectivity. Bright and dark coal phases alternate, and there is a consistent cleavage direction. Using the Avizo image processing platform, the three-dimensional grayscale data of the rock core obtained from the CT scan underwent grayscale correction, brightness correction, sharpening, binary segmentation, and other image processing steps to construct the corresponding three-dimensional digital rock core. As shown in Figure 4, when the voxel size is set to 500 × 500 × 500 voxels, the porosity values stabilize. Therefore, a voxel size of 500 × 500 × 500 was selected for constructing the digital rock core. After image processing and binarization, the rock core was constructed using the watershed algorithm, as seen in the figure. In Figure 4a, the red portion represents the dark coal component, accounting for 17.07%; the purple portion represents the bright coal component, accounting for 73.05%. In Figure 4b, the red portion represents the quartz mineral component, accounting for 9.88%. The image shows alternating appearances of different coal phases, and mineral distribution is parallel to the coal phase boundaries. The calculated dip angle is 33°, and the vertical average width of the dark coal phase is 2.61 mm, consistent with the observations of the external appearance of the coal rock experimental samples.
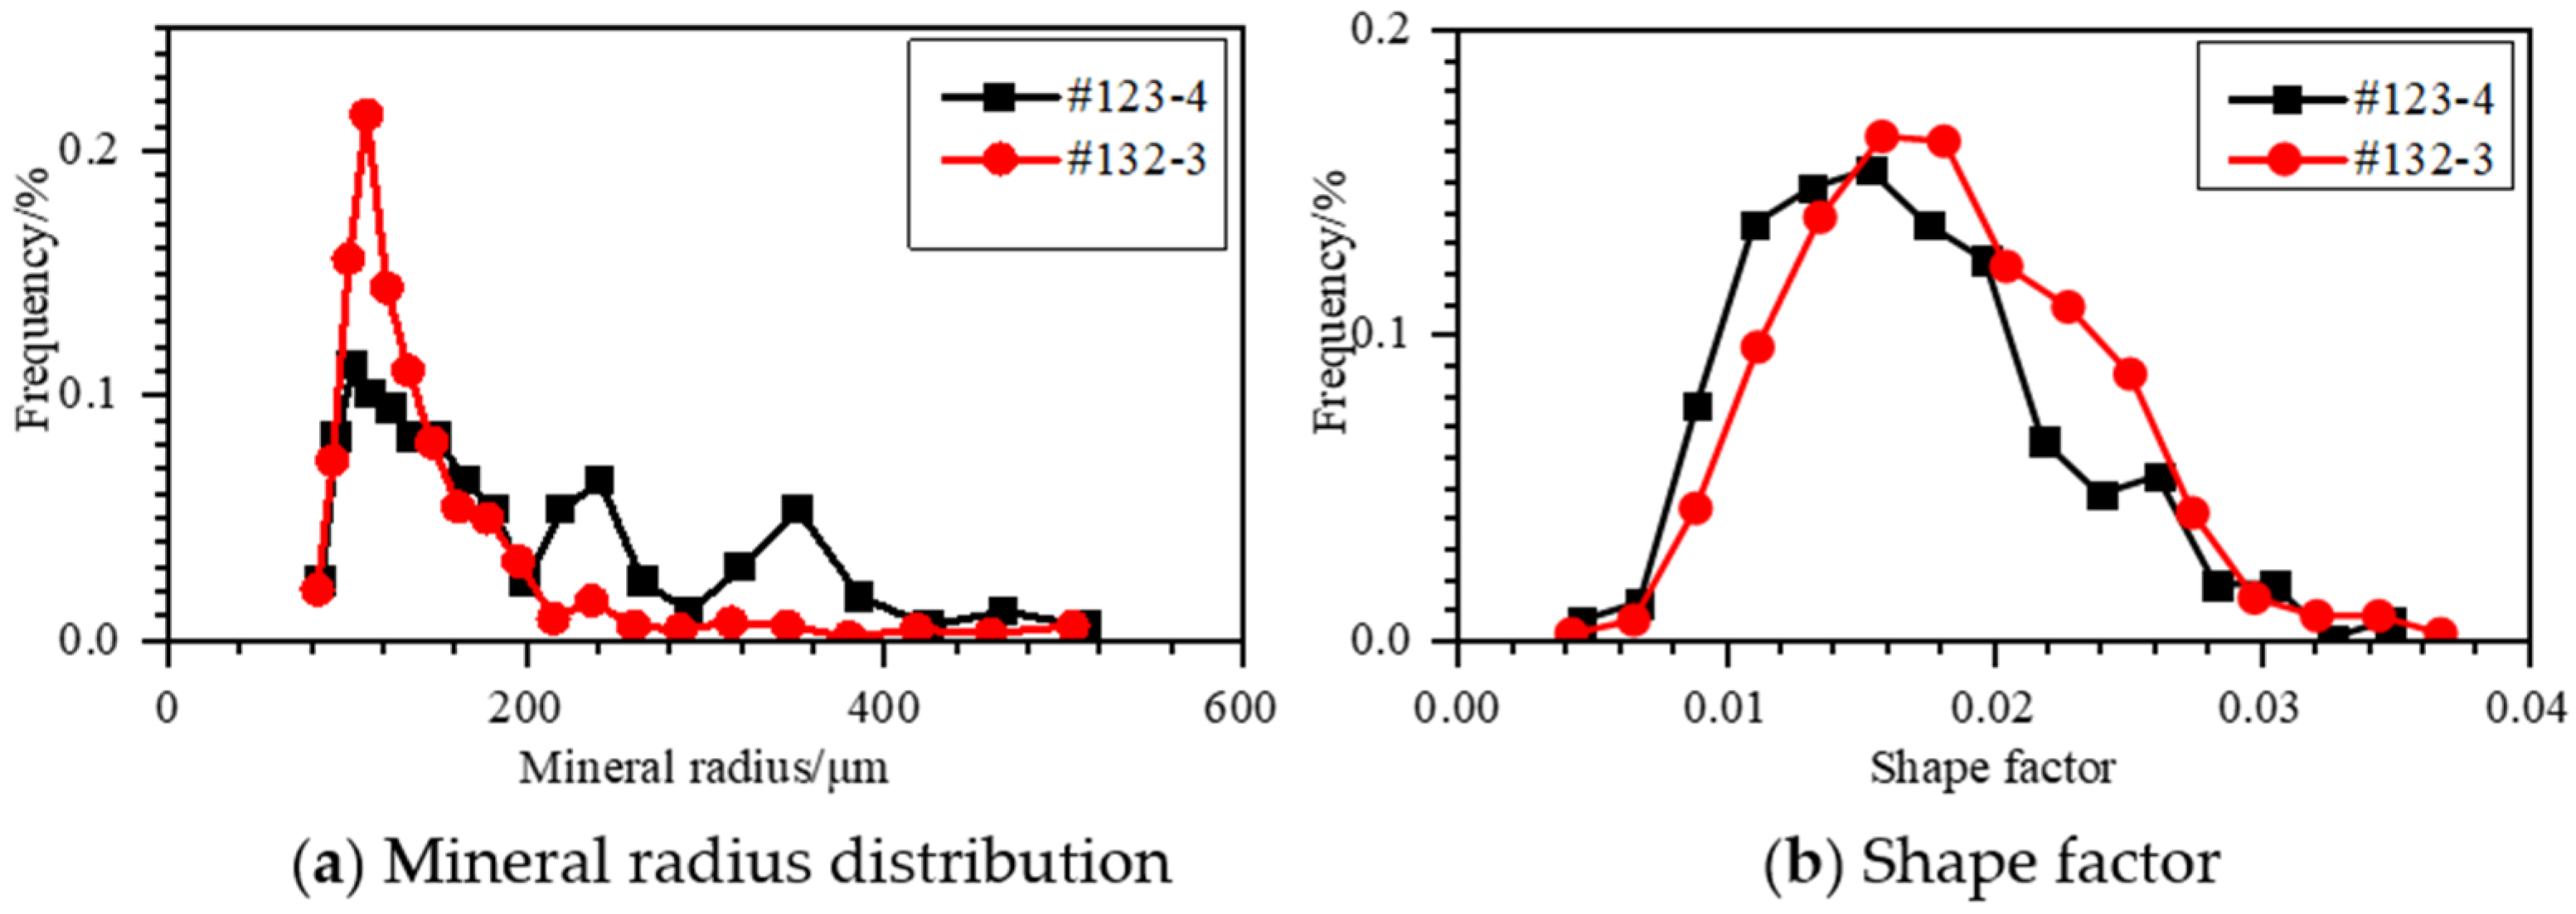
Based on the reconstructed low-resolution digital rock cores of coal rock, the characteristics of minerals in all coal rock samples were analyzed, as shown in Figure 5. Combined with the constructed low-resolution digital rock cores of coal rock, it can be observed from Figure 5 that the radius of minerals mainly falls in the range of 50 to 500 μm and exhibits a multi-peak distribution. Analysis of the shape factor reveals that it primarily falls between 0.01 and 0.04, indicating that the shape of minerals is mainly triangular, suggesting a complex mineral shape.

3.3. Pore Structure Analysis Based on SEM-MAPs

To further analyze the microscopic structure of fractures in the coal rock experimental samples, the samples were subjected to helium ion polishing, followed by scanning electron microscopy (SEM) experiments using the HELIOS NanoLab 660 equipment. Due to the inherent trade-off between resolution and field of view in the instrument, where higher resolution results in a smaller field of view, the experiment used SEM-MAP (SEM-microscopy mapping) technology to sequentially scan selected areas of the coal rock experimental samples. The resolution used in the experiment was 50 nm, and the image field of view size was 3.1 mm × 2.9 mm.
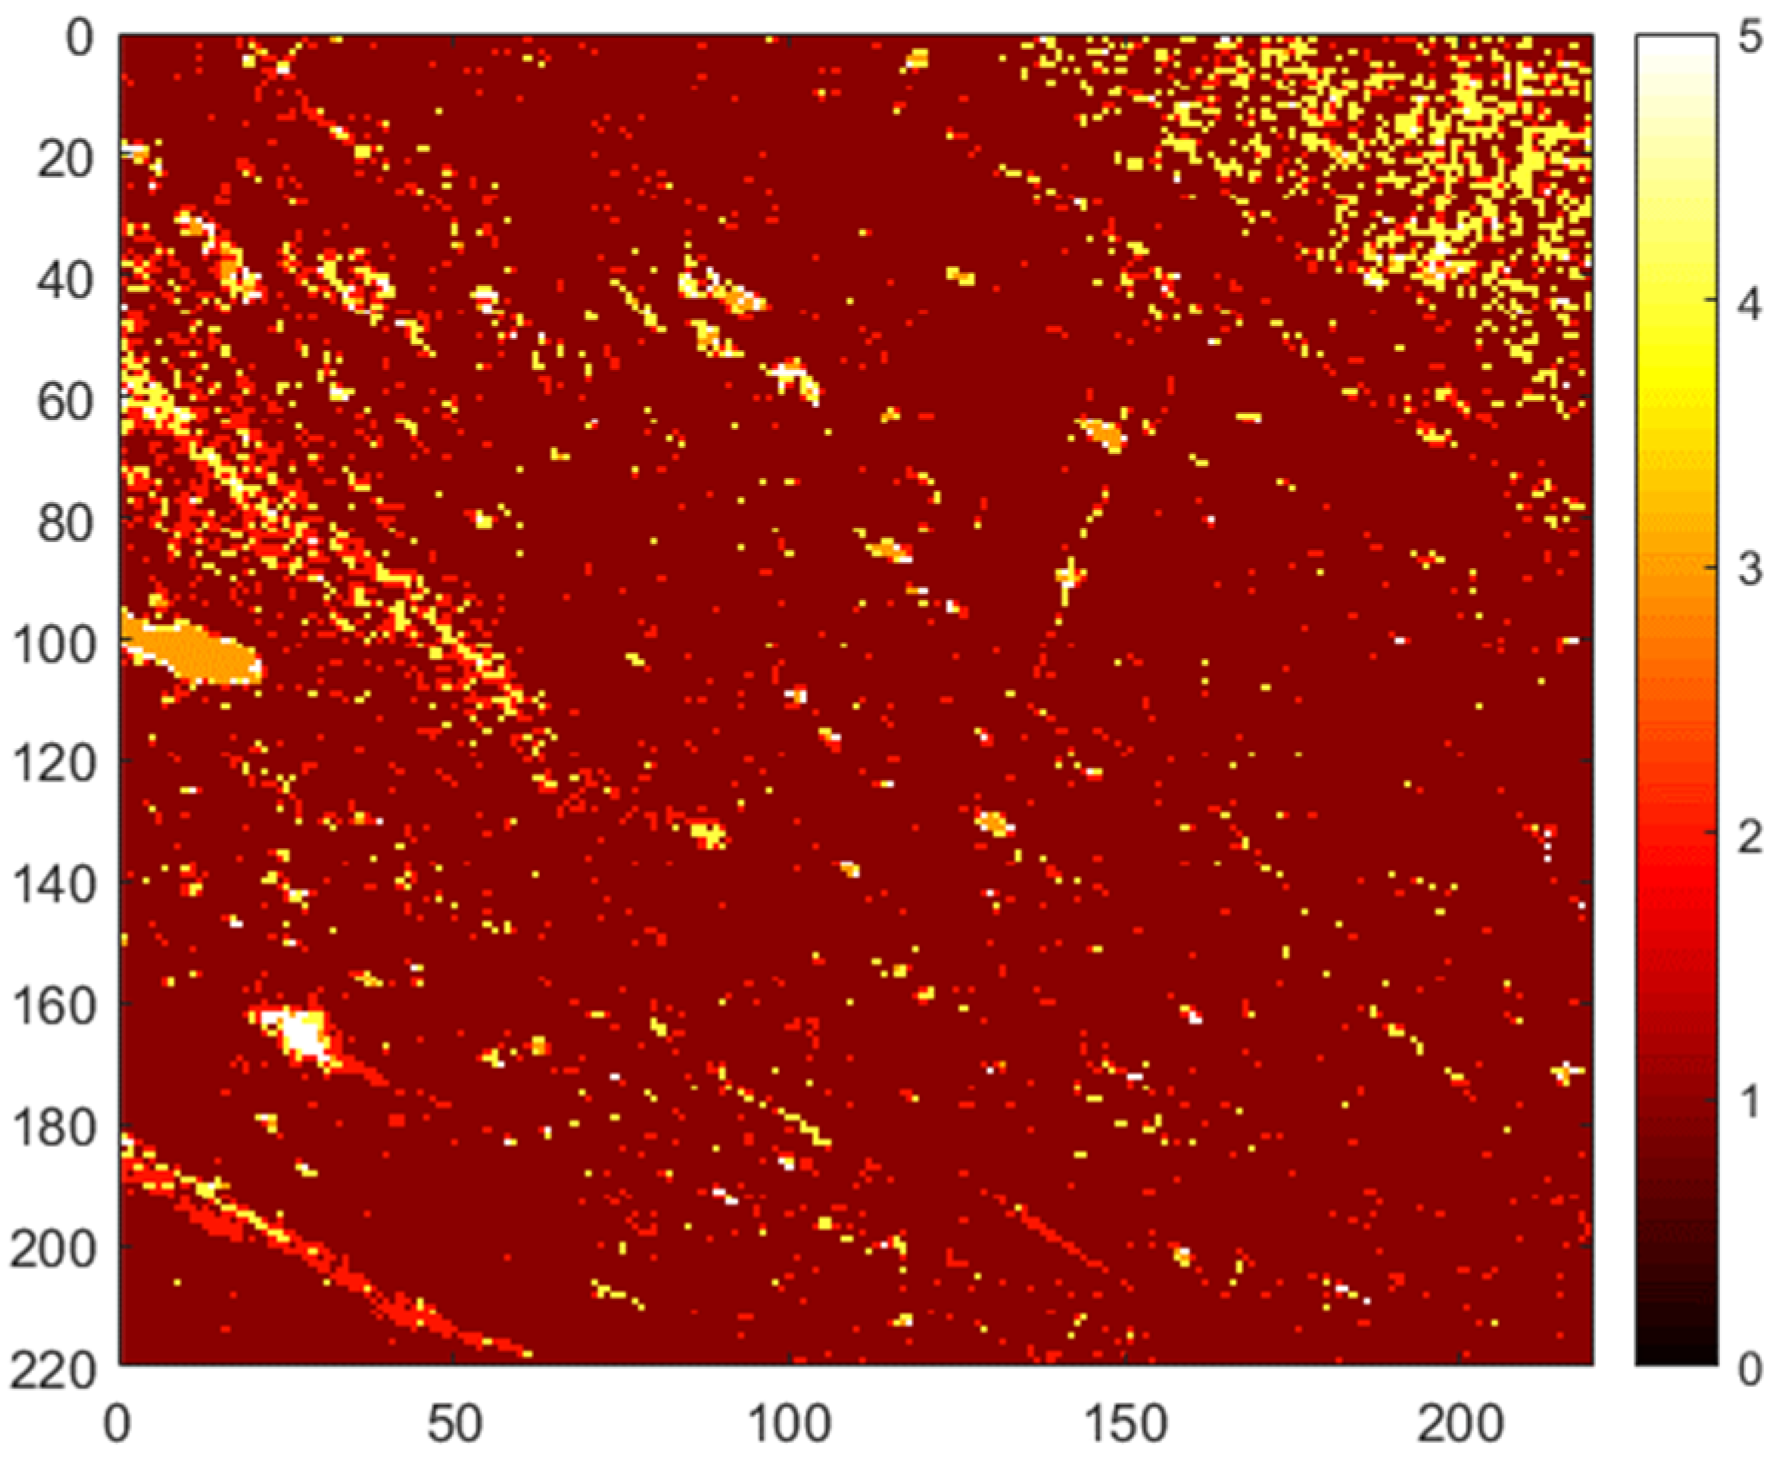
SEM microscopy experiments were conducted on the #132-3 sample and the #121-6 sample, and SEM-MAPs were obtained for both coal samples. The SEM-MAP images were then subjected to image segmentation, gray-level co-occurrence matrix extraction, and cluster analysis. Taking #132-3 as an example, based on the binarized image, the distribution of pore structures for Mode 2 was calculated, as shown in Figure 6. From the image, it can be observed that Mode 1 represents the bright coal phase, accounting for 89.66%, Mode 2 represents the dark coal phase, accounting for 5.19%, Mode 3 represents the high-brightness mineral phase, accounting for 0.51%, Mode 4 represents the interaction region between bright coal, dark coal, and minerals, accounting for 4.08%, and Mode 5 represents the bright coal phase with typical minerals added, accounting for 0.56%.

3.3.1. Micro-Fractures

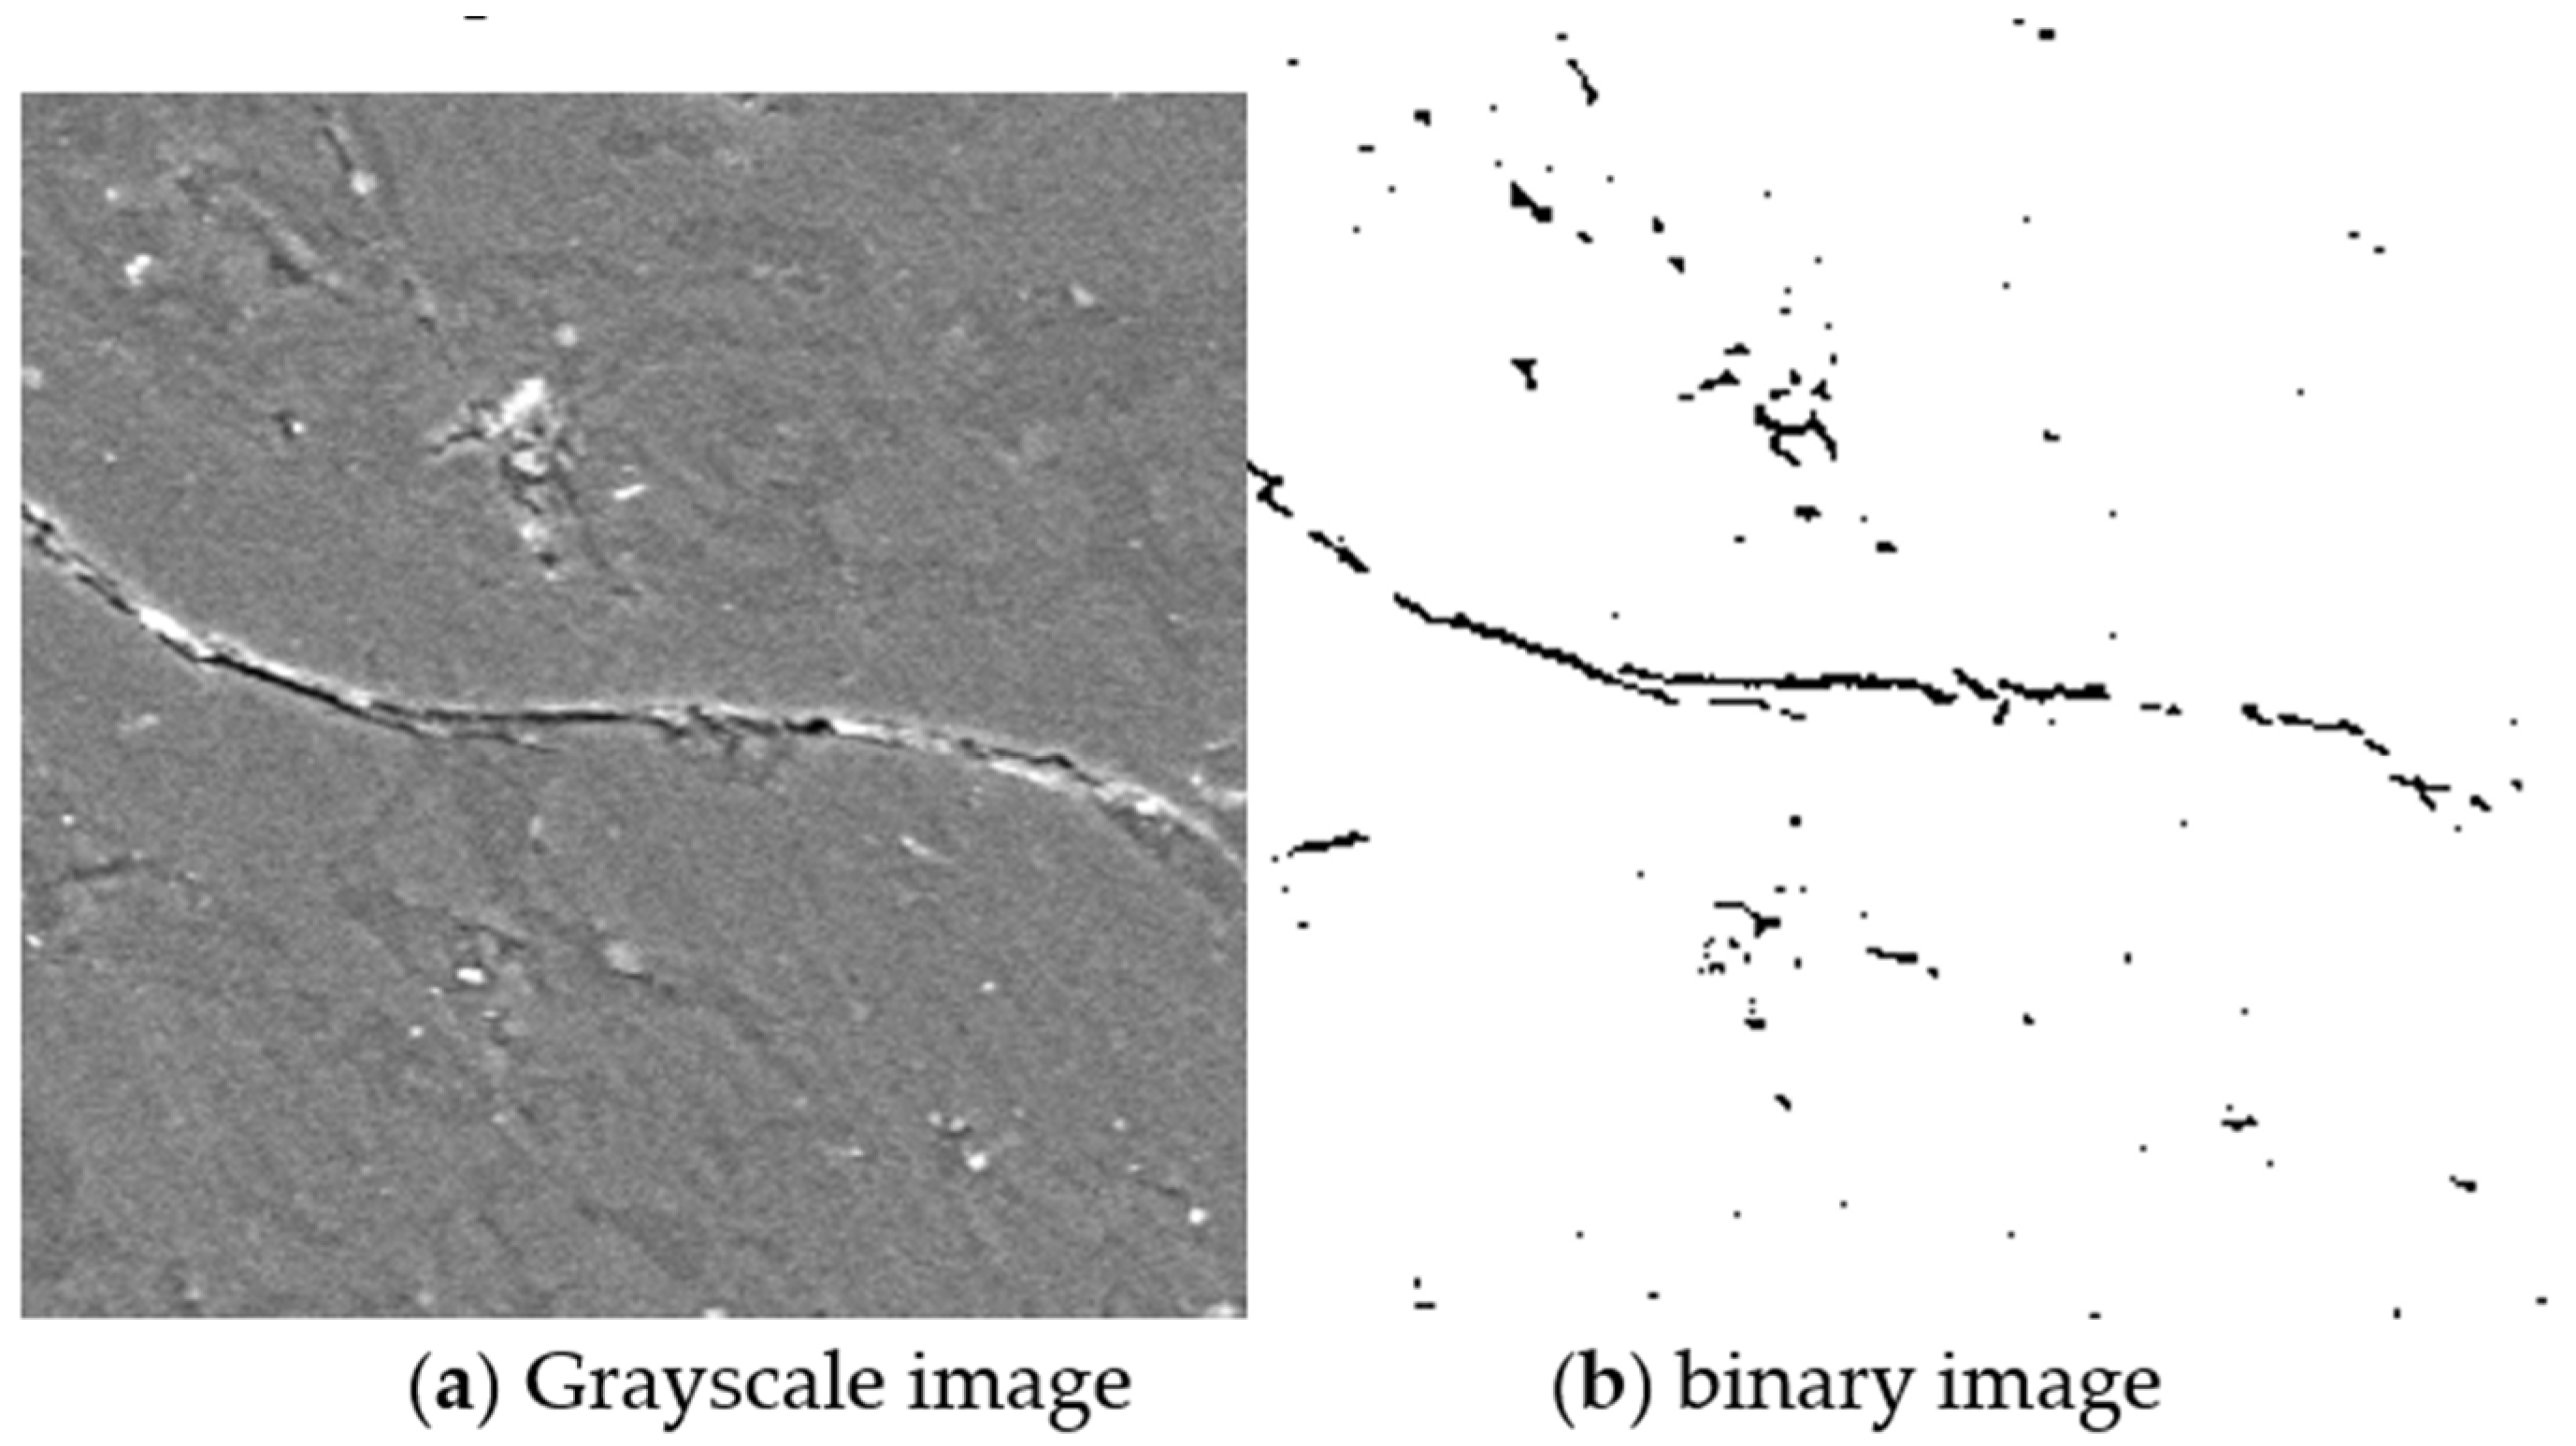
For the randomly selected typical grid area in Mode 2 of #132-3, the pore structure distribution for Mode 1 was calculated based on the binarized image, as shown in Figure 7, it is evident that a crack traverses the entire field of view. Due to the presence of fillings, the surface of the crack appears irregular and jagged, with some portions sealed. The crack aperture is primarily concentrated in the range of 90 nm to 200 nm, with an average microcrack aperture of 146.95 nm.

3.3.2. Organic Matter Pores

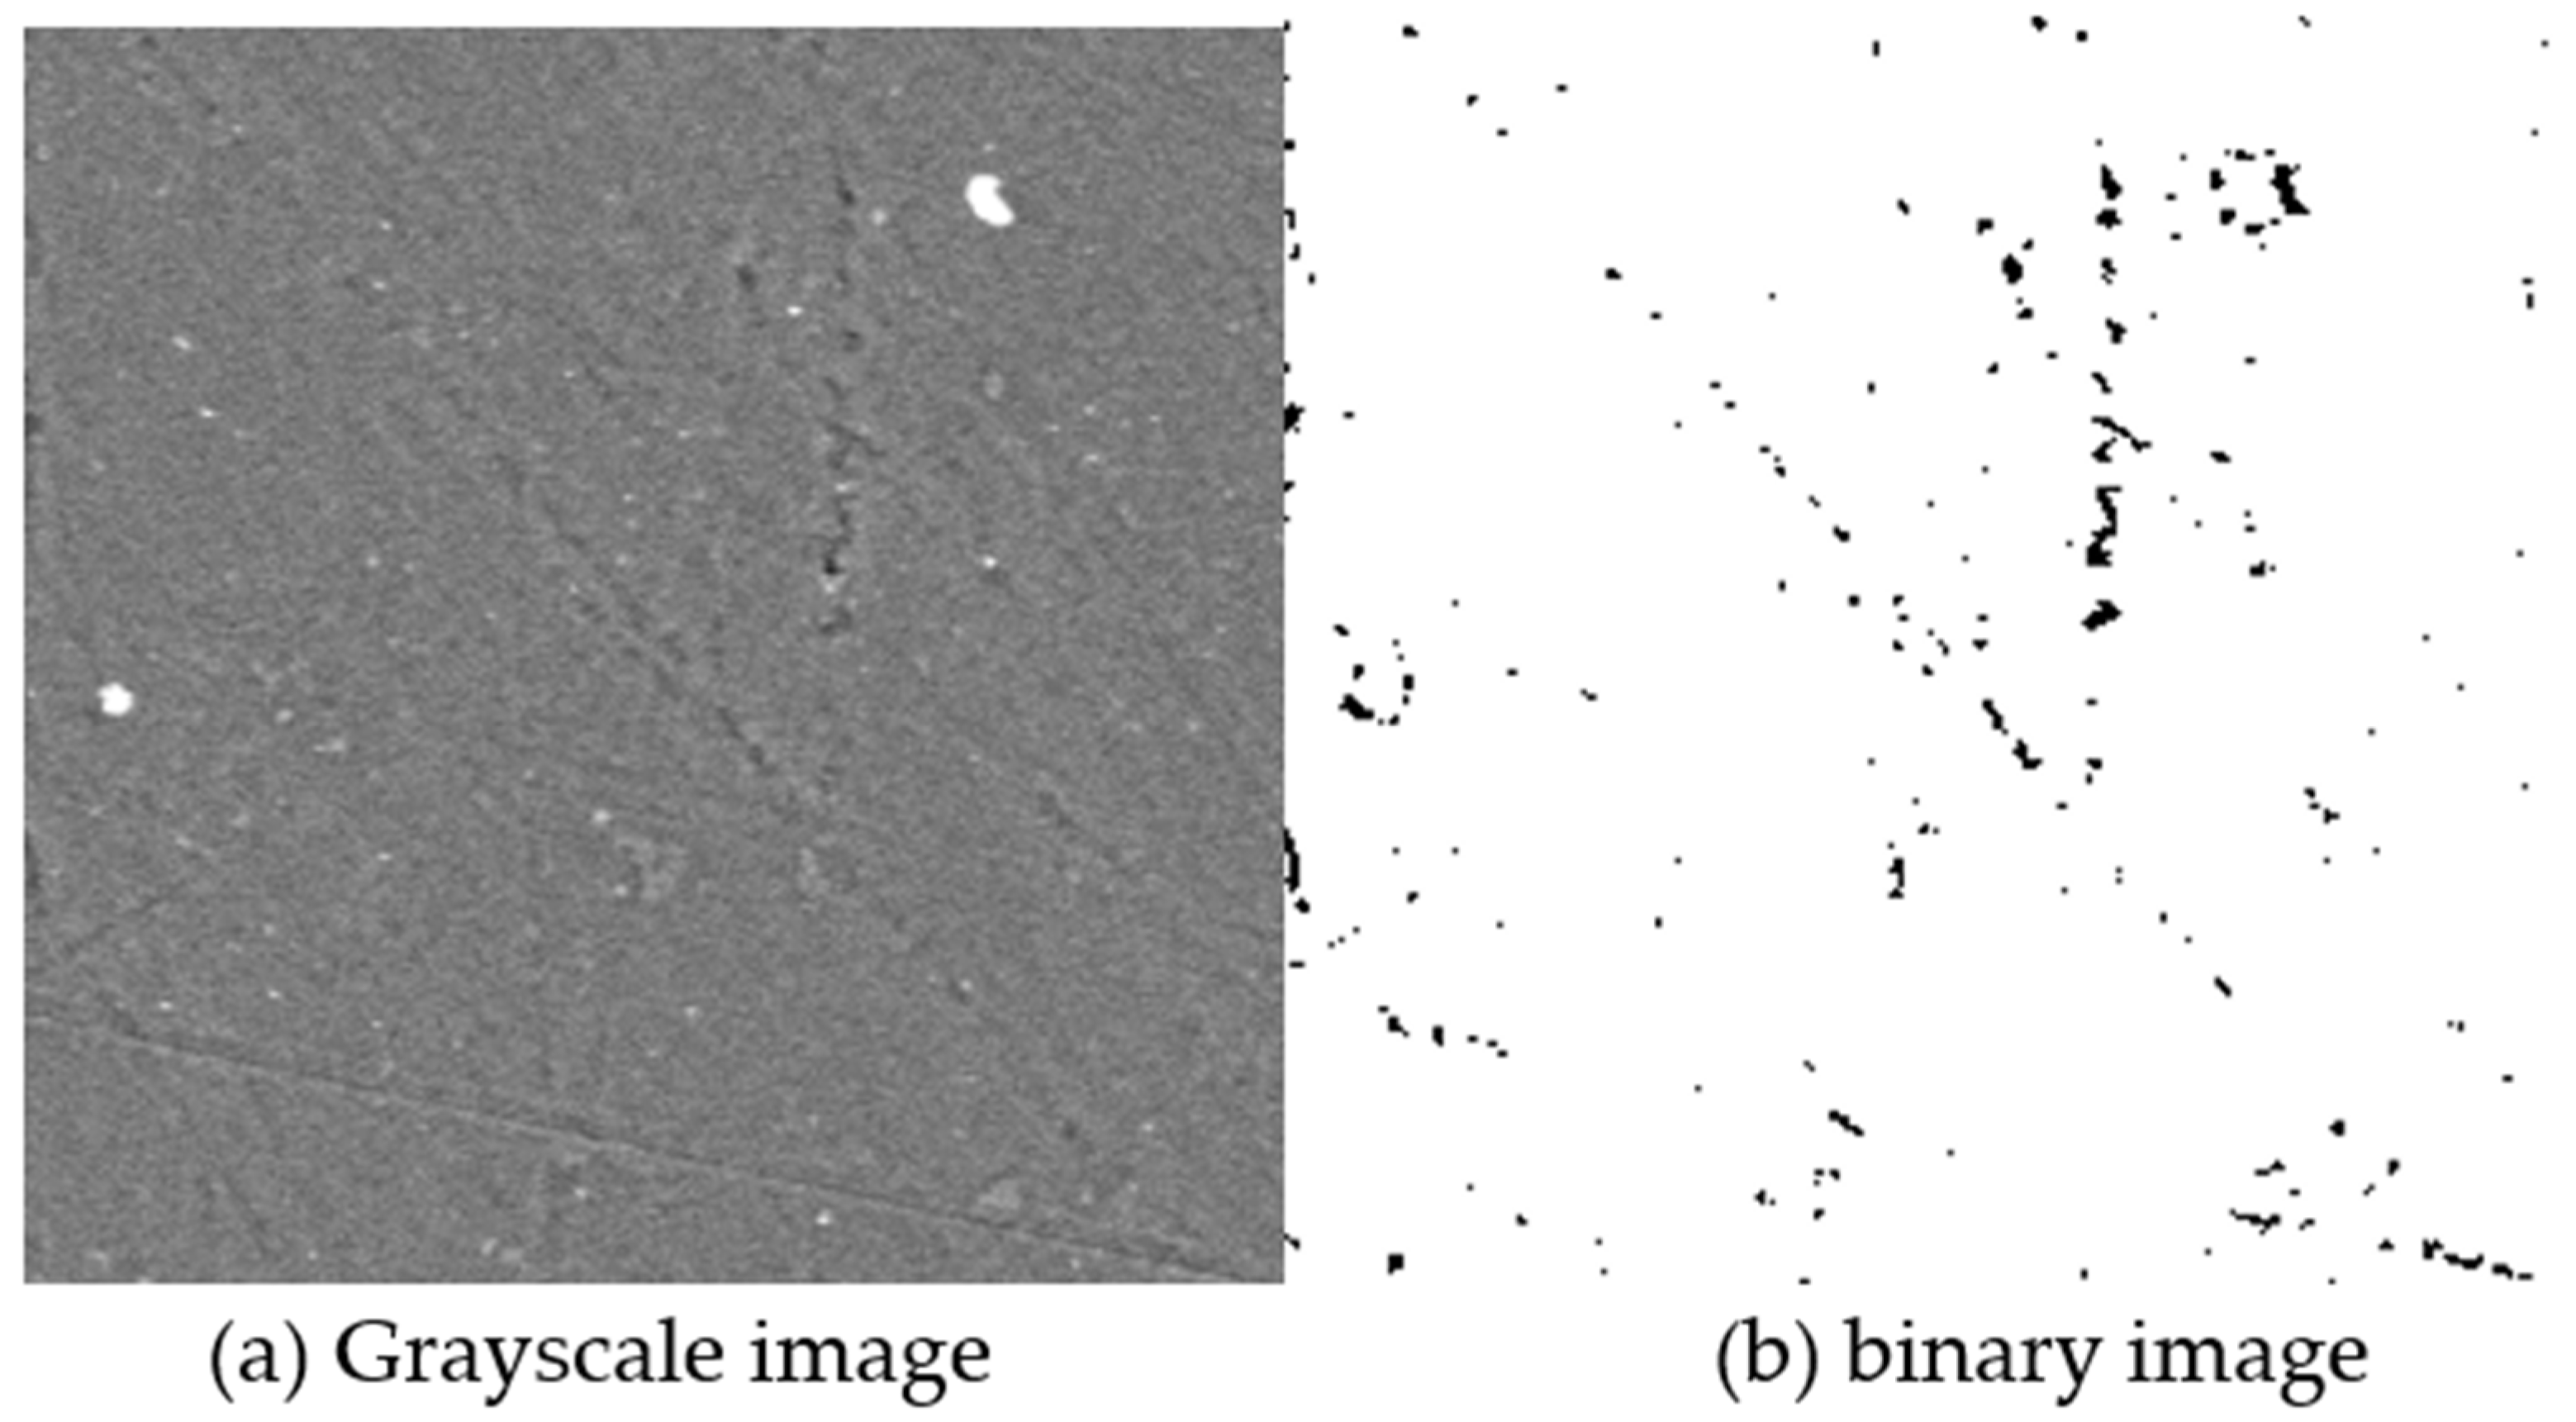
For core #132-3, a randomly selected typical grid area in Mode 1 is shown in Figure 8. The pores are relatively underdeveloped, with the primary pore radius concentrated around 100 nm, 120 nm, and 140 nm, representing typical organic matter pores. The mean pore radius is 118.44 nm.

3.3.3. Inorganic Pores

For core #132-3, a randomly selected typical grid area in Mode 4 is shown in Figure 9. The pore structure distribution for Mode 4 was calculated based on the binarized image. The pores are relatively scarce and primarily developed between the bedrock and minerals. These are primarily inorganic matter pores, with pore radii mainly concentrated in the range of 80 nm to 180 nm. The mean pore radius is 117.76 nm.

3.4. SEM-Based Pore Structure Analysis

3.4.1. Micro-Fractures

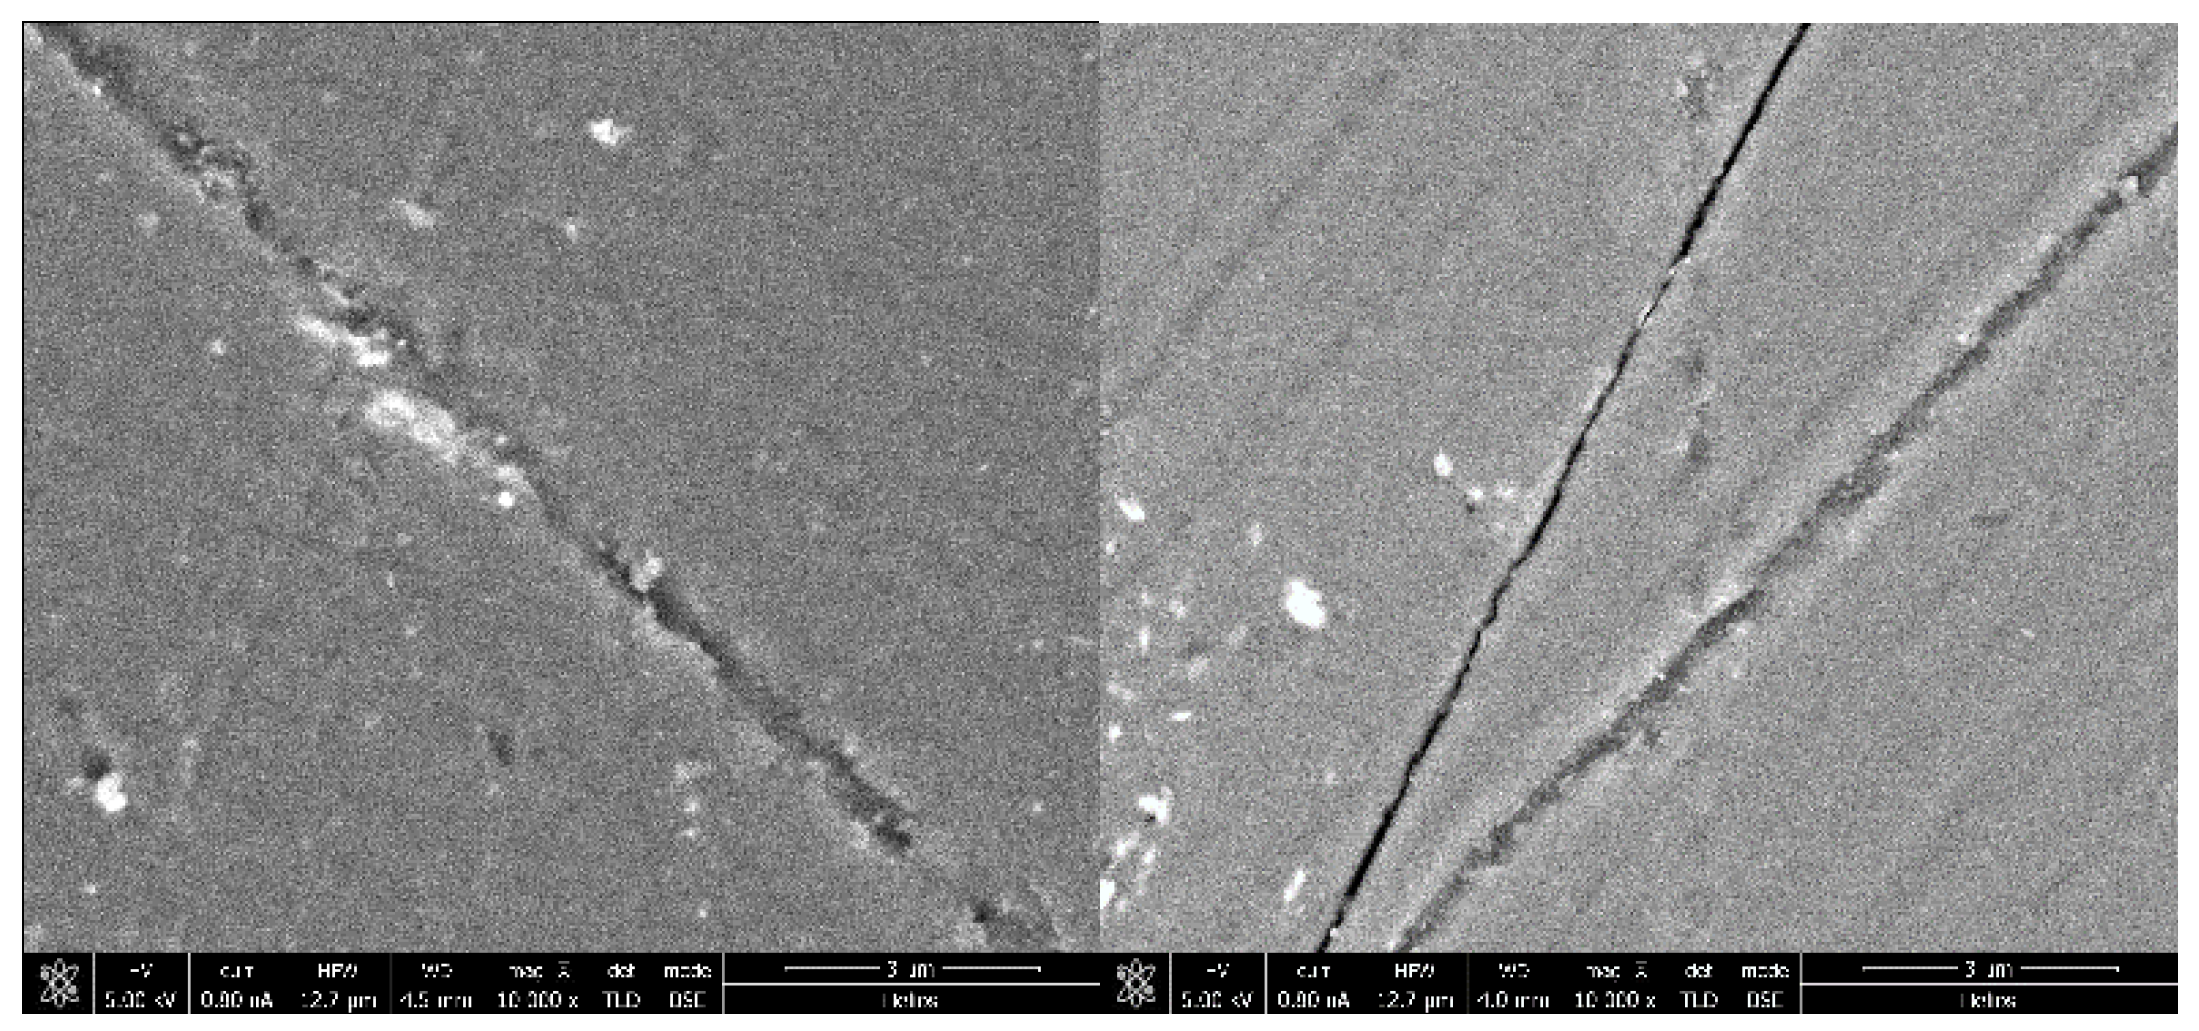
To further explore the microstructure characteristics of the coal phase in the experimental coal-rock samples, typical coal phase regions were selected based on the stitched scanning electron microscope images. High-precision scanning was conducted using the HELIOS NanoLab 660 equipment, with a resolution of 5 nm and a pixel size of 1024 × 1024, as shown in Figure 10. These images depict narrow fissure-type cracks and discrete organic matter pores, with organic matter filling the cracks in an elongated shape.

3.4.2. Organic Matter Pores

Figure 11 shows the organic matter pores in core #132-3 under SEM. From Figure 11, black represents organic matter pores, while gray represents organic matter components. Organic matter pores are well developed and are predominantly found within the coal phase. They are primarily formed during the coal-rock formation process. The organic matter in both types of rock samples exhibits three main states: organic matter filling the cracks in an elongated shape, organic matter filling the interstitial spaces between particles, and organic matter existing in blocky clusters.

3.4.3. Inorganic Pores

Figure 12 illustrates the inorganic matter pores in core #132-3, observed under high-precision SEM. The inorganic matter pores in both rock samples are relatively uniform and consist primarily of mineral intergranular pores, interparticle pores, and intragranular dissolution pores. Mineral intergranular pores are relatively less developed and are mainly located between minerals and at the interfaces between mineral and matrix. Interparticle pores are well developed and are commonly found in coal-rock samples. This type of pore is almost universally present in all minerals, and it exhibits good connectivity. Intragranular dissolution pores are relatively less developed and are often found between minerals and the coal phase.

4. Multi-Scale Pore Structure Characteristics

Comparison of Low Pressure Nitrogen Adsorption Experiments

Based on low-pressure nitrogen adsorption experiments, XCT, and SEM image analysis, the pore types in the coal samples are mainly composed of organic pores and inorganic pores, and the proportion of organic pores is larger than that of inorganic pores. Inorganic pores mainly include intragranular pores, intergranular pores, and cracks. Intragranular pores mainly exist in mineral particles, pores formed by dissolution in original clastic particles, pores between strawberry pyrite grains, and structural pores in biological cavities; intergranular pores are composed of granular minerals, flake minerals, and pores formed by mutual support between clastic particles; cracks are mainly formed by tectonic stress, shrinkage of clay minerals, and edges between minerals. Organic matter pores are abundant and mainly formed during the diagenetic process of coal rocks.
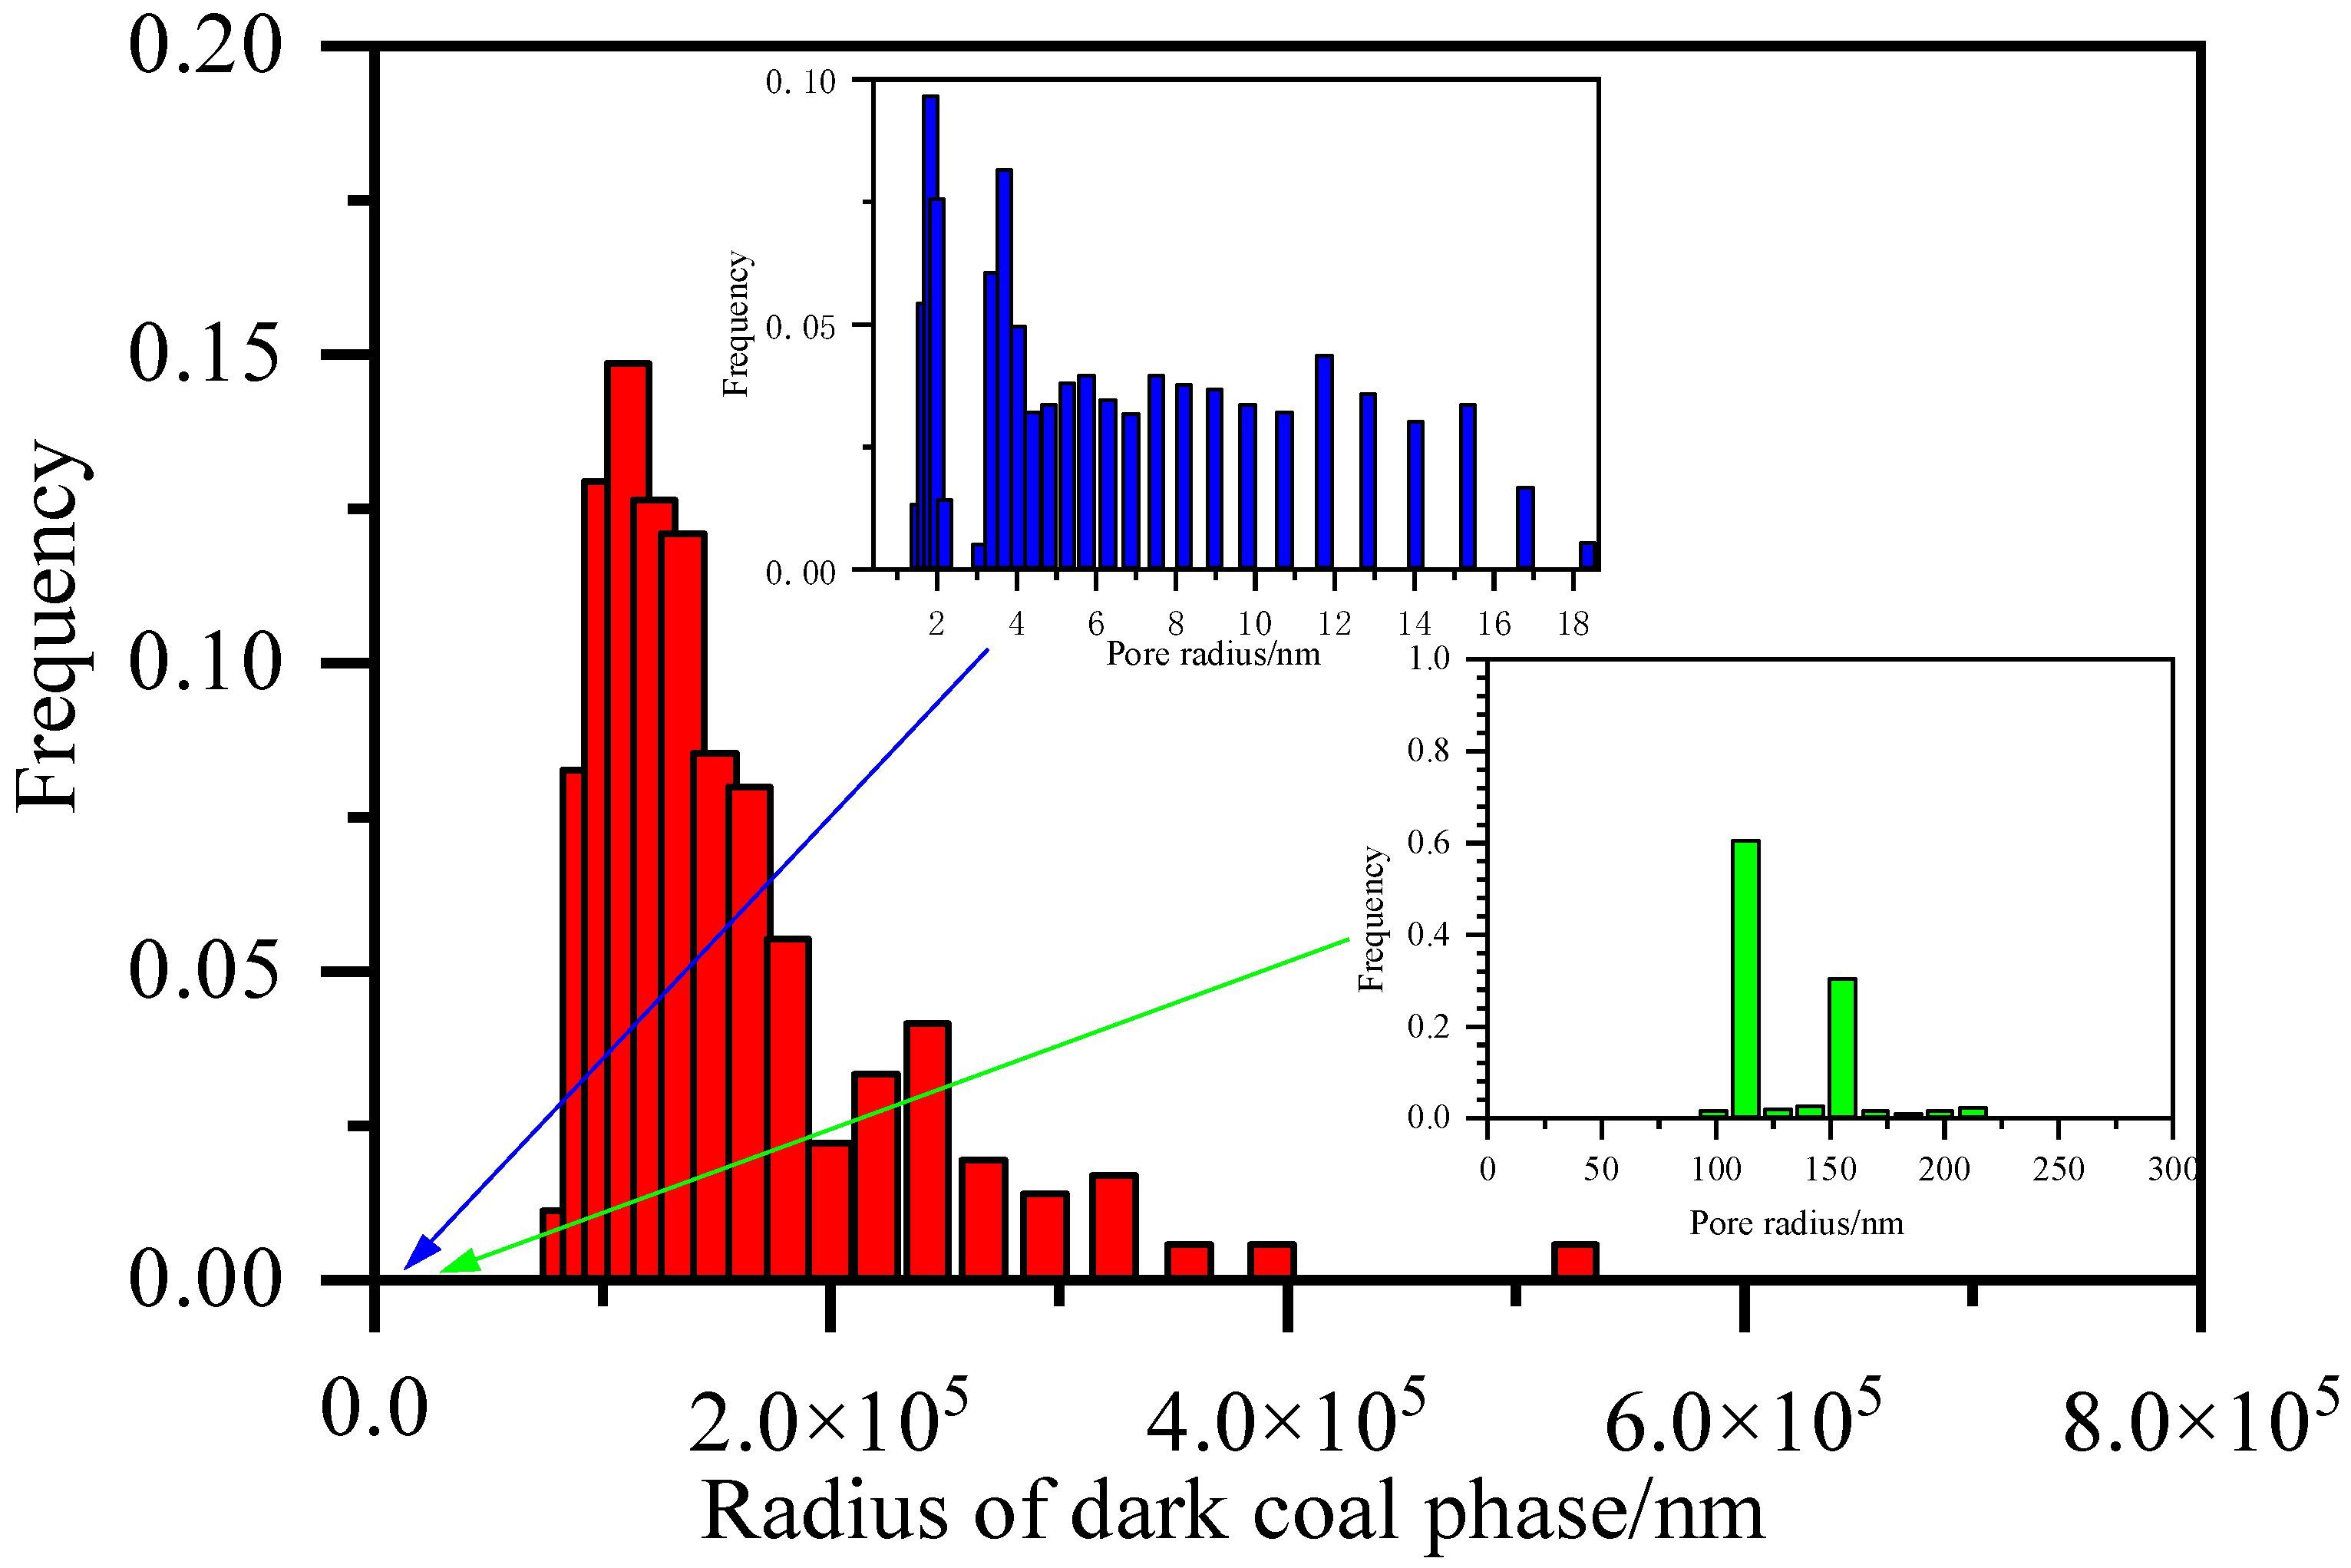
Figure 13 represents the pore size distribution considering multi-scale features. The red curve is XCT characterizing the coal phase distribution; the blue curve is the low-pressure nitrogen adsorption experiment characterizing the pore structure distribution; the green curve is the pore structure distribution under SEM-MAP; the pore structure of the sample shows multi-scale characteristics, from the nanoscale to the micron scale. A single experimental method cannot comprehensively and accurately characterize the pore structure characteristics of coal samples. It is not difficult to find in the figure that the pore structure of coal rock ranges from a few nanometers to tens of micrometers, and the curve shows a typical multi-modal distribution, with peaks concentrated around 10 nm and 10 μm, and the nanoscale pore distribution characteristic map is consistent with low-pressure nitrogen. The results of adsorption experiments can be matched.

5. Conclusions

This paper proposes a multi-scale pore structure characterization method that couples low-pressure nitrogen adsorption experiments, X-ray tomography (XCT) imaging technology, and scanning electron microscopy (SEM) experimental methods, and takes Zhengzhuang coalbed methane as an example to reveal the distribution characteristics of rock reservoir pore structure. The following conclusions can be drawn:
(1)
A single experimental method cannot accurately and comprehensively reveal the microstructure of coal and rock reservoirs. Through the combined use of low-pressure nitrogen adsorption experiments, XCT imaging technology, and scanning electron microscopy experiments, the pore size distribution and pore shape of coal and rock samples can be simultaneously realized. Qualitative, quantitative, and visual single-scale and multi-scale representations of topological structures provide technical support for understanding the pore structure of coal and rock.
(2)
Based on XCT images, SEM-MAP images, and SEM images, combined with image feature extraction and classification algorithms, establish the relationship between coal and rock sample graphics from the nanoscale to the micron scale. The microscopic pore structure properties of coal rock samples are determined by the structural characteristics of various types of pores and their proportions. Inorganic pores mostly exist between minerals and are abundantly developed; they are composed of individual mineral pores and bright and dark coal. Mineral pores account for a relatively small proportion in coal and rock samples; organic pores are developed in the bright coal phase and dark coal phase, with good connectivity. The development of organic pores and inorganic pores is balanced. The entire rock sample pore structure is composed of bright coal, as determined by the pore structure.
(3)
The pore structure of the experimental coal and rock samples shows multi-scale characteristics with complex pore types, including inorganic pores, organic pores, and fractures. Among them, the mineral particles are mainly quartz, mostly distributed at the interface of lithofacies and parallel to it, with sizes ranging from nanoscale to millimeter scale; pores are mainly organic pores, and inorganic pores are developed in a small amount of minerals, with sizes concentrated at 2 nm~50 μm; cracks show typical multi-scale characteristics, mostly appearing at the interface of lithofacies and parallel to the interface, with sizes ranging from nanoscale to micron and millimeter scales.

Author Contributions

Methodology, Z.L.; software, X.L. and L.Z.; investigation, H.S.; data curation, Z.L. and H.W.; writing—original draft preparation, X.L; writing—review and editing, L.L. and G.I.; funding acquisition, H.F.; visualization, L.L.; formal analysis, L.Z.; conceptualization, G.I.; project administration, H.W. and H.F.; supervision, H.S. All authors have read and agreed to the published version of the manuscript.

Funding

This research was funded by the National Natural Science Foundation of China (No. 52122402, 42090024, 12172334) and the APC was funded by No. 52122402, 42090024, 12172334.

Data Availability Statement

The data that support the findings of this study are available from the corresponding author upon reasonable request.

Acknowledgments

This work was supported by the National Natural Science Foundation of China (No. 52122402, 42090024, 12172334), Shandong Provincial Natural Science Foundation (No. ZR2022JQ23), the Fundamental Research Funds for the Central Universities (No. 22CX01001A-4), and Program for Changjiang Scholars and Innovative Research Team in University (IRT_16R69).

Conflicts of Interest

The authors declare that they have no known competing financial interests or personal relationships that could have appeared to influence the work reported in this paper.

References

  1. Yao, Y.; Liu, D.; Tang, D.Z.; Tang, S.-H.; Huang, W. Preservation and deliverability characteristics of coalbed methane, North China. Pet. Explor. Dev. 2007, 34, 664–668. [Google Scholar]
  2. Liu, S.Q.; Sang, S.X.; Liu, H.H.; Zhu, Q.-P. Growth characteristics and genetic types of pores and fractures in a high-rank coal reservoir of the southern Qinshui basin. Ore Geol. Rev. 2015, 64, 140–151. [Google Scholar] [CrossRef]
  3. Sun, J.; Cheng, A.; Liu, K.; Yan, X.; Zhang, L.; Zhao, X. Current situation and development trend of coalbed methane development and utilization technology in coal mine area. J. China Coal Soc. 2020, 45, 258–267. [Google Scholar]
  4. Liu, S.; Xue, H.; Zhao, M. Pore Structure and Fractal Characteristics of Coal Measure Shale in the Wuxiang Block in the Qinshui Basin. Processes 2023, 11, 3362. [Google Scholar] [CrossRef]
  5. Zou, C.; Yang, Z.; Huang, S.; Ma, F.; Sun, Q.; Li, F.; Pan, S.; Tian, W. Resource types, formation, distribution and prospects of coal-measure gas. Pet. Explor. Dev. 2019, 46, 451–462. [Google Scholar] [CrossRef]
  6. Hu, Q.; Jia, H.; Zhang, C.; Fan, B.; Mao, C.; Zhang, Q. Stable-production period prediction method and application in high-rank coalbed methane wells: A case study of Fanzhuang-Zhengzhuang Block in southern Qinshui Basin. Coal Geol. Explor. 2022, 50, 137–144. [Google Scholar] [CrossRef]
  7. Liu, H.; Sang, S.; Xue, J.; Lan, T.; Xu, H.; Ren, B.; Li, S. Evolution and geochemical characteristics of gas phase fluid and its response to inter-well interference during multi-well drainage of coalbed methane. J. Pet. Sci. Eng. 2018, 162, 491–501. [Google Scholar] [CrossRef]
  8. Zhang, Z.; Ren, J.; Zhao, Y.; Wang, M.; Yang, J.; Zhang, C. Geological Characteristics of Low-Yield and Low-Efficiency CBM Wells and Practical Measures for Production Increase in the Qinshui Basin. ACS Omega 2023, 8, 47530–47539. [Google Scholar] [CrossRef] [PubMed]
  9. Chen, F.; Wu, C.; Huo, Z.; Zhao, Q. Productivity characteristics and controlling factors of coal-bed methane vertical well in a coal block of Qinshui Basin. Energy Explor. Exploit. 2023, 01445987231219766. [Google Scholar] [CrossRef]
  10. Ye, J.; Hou, S.; Zhang, S. Progress of coalbed methane exploration and development in China during the 13th Five-Year Plan period and the next exploration direction. Coal Geol. Explor. 2022, 50, 15–22. [Google Scholar] [CrossRef]
  11. Keshavarz, A.; Sakurovs, R.; Grigore, M.; Sayyafzadeh, M. Effect of maceral composition and coal rank on gas diffusion in Australian coals. Int. J. Coal Geol. 2017, 173, 65–75. [Google Scholar] [CrossRef]
  12. Meng, Q.; Zhao, Y.; Hu, Y.; Feng, Z.; Yu, Y. Experimental study on pore structure and pore shape of coking coal. J. China Coal Soc. 2011, 36, 487–490. [Google Scholar]
  13. Meng, Z.; Zhang, K.; Shen, Z. Difference analysis of methane diffusion properties between tectonic coal and primary coal. Coal Geol. Explor. 2022, 50, 102–109. [Google Scholar]
  14. Li, H.Y.; Ogawa, Y.; Shimada, S. Mechanism of methane flow through sheared coals and its role on methane recovery. Fuel 2003, 82, 1271–1279. [Google Scholar] [CrossRef]
  15. Yang, C.L.; Meng, Y.Y.; Li, X.C.; Nie, B.; Zhu, F. Effects of Nanoscale Pore Structure Characteristics on Coalbed Methane Diffusion. J. Nanosci. Nanotechnol. 2017, 17, 6347–6355. [Google Scholar]
  16. Zhao, Y.Q.; Wang, S.; Cheng, G.; He, L. Study on coal and gangue recognition method based on the combination of X-ray transmission and diffraction principle. Energy Sources Part A-Recovery Util. Environ. Eff. 2022, 44, 9716–9728. [Google Scholar] [CrossRef]
  17. Cheng, J.; Xia, X.; Wang, L. Determining Nuclear Magnetic Resonance Surface Relaxivity of Shales. Energy Fuels 2023, 37, 4986–4995. [Google Scholar] [CrossRef]
  18. Li, S.; Tang, D.; Xu, H.; Yang, Z. Advanced characterization of physical properties of coals with different coal structures by nuclear magnetic resonance and X-ray computed tomography. Comput. Geosci. 2012, 48, 220–227. [Google Scholar] [CrossRef]
  19. Yao, Y.B.; Liu, D.M.; Cai, Y.D.; Li, J.Q. Advanced characterization of pores and fractures in coals by nuclear magnetic resonance and X-ray computed tomography. Sci. China Earth Sci. 2010, 53, 854–862. [Google Scholar] [CrossRef]
  20. Jiang, W.; Song, X.; Zhong, L. Research on the pore properties of different coal body structure coals and the effects on gas outburst based on the low-temperature nitrogen adsorption method. J. China Coal Soc. 2011, 36, 609–614. [Google Scholar]
  21. Chen, P.; Tang, X. The research on the adsorption of nitrogen in low temperature and micro-pore properties in coal. J. China Coal Soc. 2001, 26, 552–556. [Google Scholar]
  22. Yu, Y.; Hu, Y.; Liang, W.; Meng, Q.; Feng, Z. Study on pore characteristics of lean coal at different temperature by CT technology. Chinese J. Geophys. 2012, 55, 637–644. (In Chinese) [Google Scholar]
  23. Yao, Y.; Liu, D.; Che, Y.; Tang, D.; Tang, S.; Huang, W. Non-destructive characterization of coal samples from China using microfocus X-ray computed tomography. Int. J. Coal Geol. 2009, 80, 113–123. [Google Scholar] [CrossRef]
  24. Ji, L.; Lin, M.; Cao, G.; Jiang, W. A multiscale reconstructing method for shale based on SEM image and experiment data. J. Pet. Sci. Eng. 2019, 179, 586–599. [Google Scholar] [CrossRef]
  25. Kelly, S.; El-Sobky, H.; Torres-Verdín, C.; Balhoff, M.T. Assessing the utility of FIB-SEM images for shale digital rock physics. Adv. Water Resour. 2016, 95, 302–316. [Google Scholar] [CrossRef]
  26. Keller, L.M.; Schuetz, P.; Erni, R.; Rossell, M.D.; Lucas, F.; Gasser, P.; Holzer, L. Characterization of multi-scale microstructural fea-tures in Opalinus Clay. Microporous Mesoporous Mater. 2013, 170, 83–94. [Google Scholar] [CrossRef]
  27. Li, Z.Q.; Peng, J.S.; Li, L.; Qi, L.; Wai, Y. Novel Dynamic Multiscale Model of Apparent Diffusion Permeability of Methane through Low-Permeability Coal Seams. Energy Fuels 2021, 35, 7844–7857. [Google Scholar] [CrossRef]
  28. Sun, H.; Zhou, L.; Fan, D.Y.; Zhang, L.; Yang, Y.; Zhang, K.; Yao, J. Permeability prediction of considering organic matter distribution based on deep learning. Phys. Fluids 2023, 35, 032014. [Google Scholar] [CrossRef]
  29. Wang, H.; Zhang, J.; Yang, Y.S.; Li, R.; Li, J.; Yang, J.; Liu, K. Microstructure-based multi-scale evaluation of fluid flow in an anthracite coal sample with partially-percolating voxels. Model. Simul. Mater. Sci. Eng. 2019, 27, 065003. [Google Scholar] [CrossRef]
  30. Li, X.; Gao, Z.; Fang, S.; Ren, C.; Yang, K.; Wang, F. Fractal Characterization of Nanopore Structure in Shale, Tight Sandstone and Mudstone from the Ordos Basin of China Using Nitrogen Adsorption. Energies 2019, 12, 583. [Google Scholar] [CrossRef]
  31. Tian, Y.; Chen, Q.; Yan, C.; Chen, H.; He, Y. A New Adsorption Equation for Nano-Porous Shale Rocks and Its Application in Pore Size Distribution Analysis. Energies 2022, 15, 3199. [Google Scholar] [CrossRef]
  32. Giffin, S.; Littke, R.; Klaver, J.; Urai, J.L. Application of BIB-SEM technology to characterize macropore morphology in coal. Int. J. Coal Geol. 2013, 114, 85–95. [Google Scholar] [CrossRef]
  33. Song, W.; Liu, L.; Sun, H.; Zhang, K.; Yang, Y.; Yao, J. Pore structure characterization and flow ability of shale oil reservoir based on digital cores. Reserv. Eval. Dev. 2021, 11, 497–505. [Google Scholar]
  34. Zhao, J.; Chen, H.; Zhang, J.; Zhang, W.; Chen, G. Quantitative characterization of organic and inorganic pores in shale based on FIB-SEM. Front. Earth Sci. 2022, 10, 994312. [Google Scholar] [CrossRef]
  35. Saif, T.; Lin, Q.; Butcher, A.R.; Bijeljic, B.; Blunt, M.J. Multi-scale multi-dimensional microstructure imaging of oil shale pyrolysis using X-ray micro-tomography, automated ultra-high resolution SEM, MAPS Mineralogy and FIB-SEM. Appl. Energy 2017, 202, 628–647. [Google Scholar] [CrossRef]
  36. Chen, Q.; Tian, Y.; Li, P.; Yan, C.; Pang, Y.; Zheng, L.; Deng, H.; Zhou, W.; Meng, X. Study on Shale Adsorption Equation Based on Monolayer Adsorption, Multilayer Adsorption, and Capillary Condensation. J. Chem. 2017, 2017, 1496463. [Google Scholar] [CrossRef]
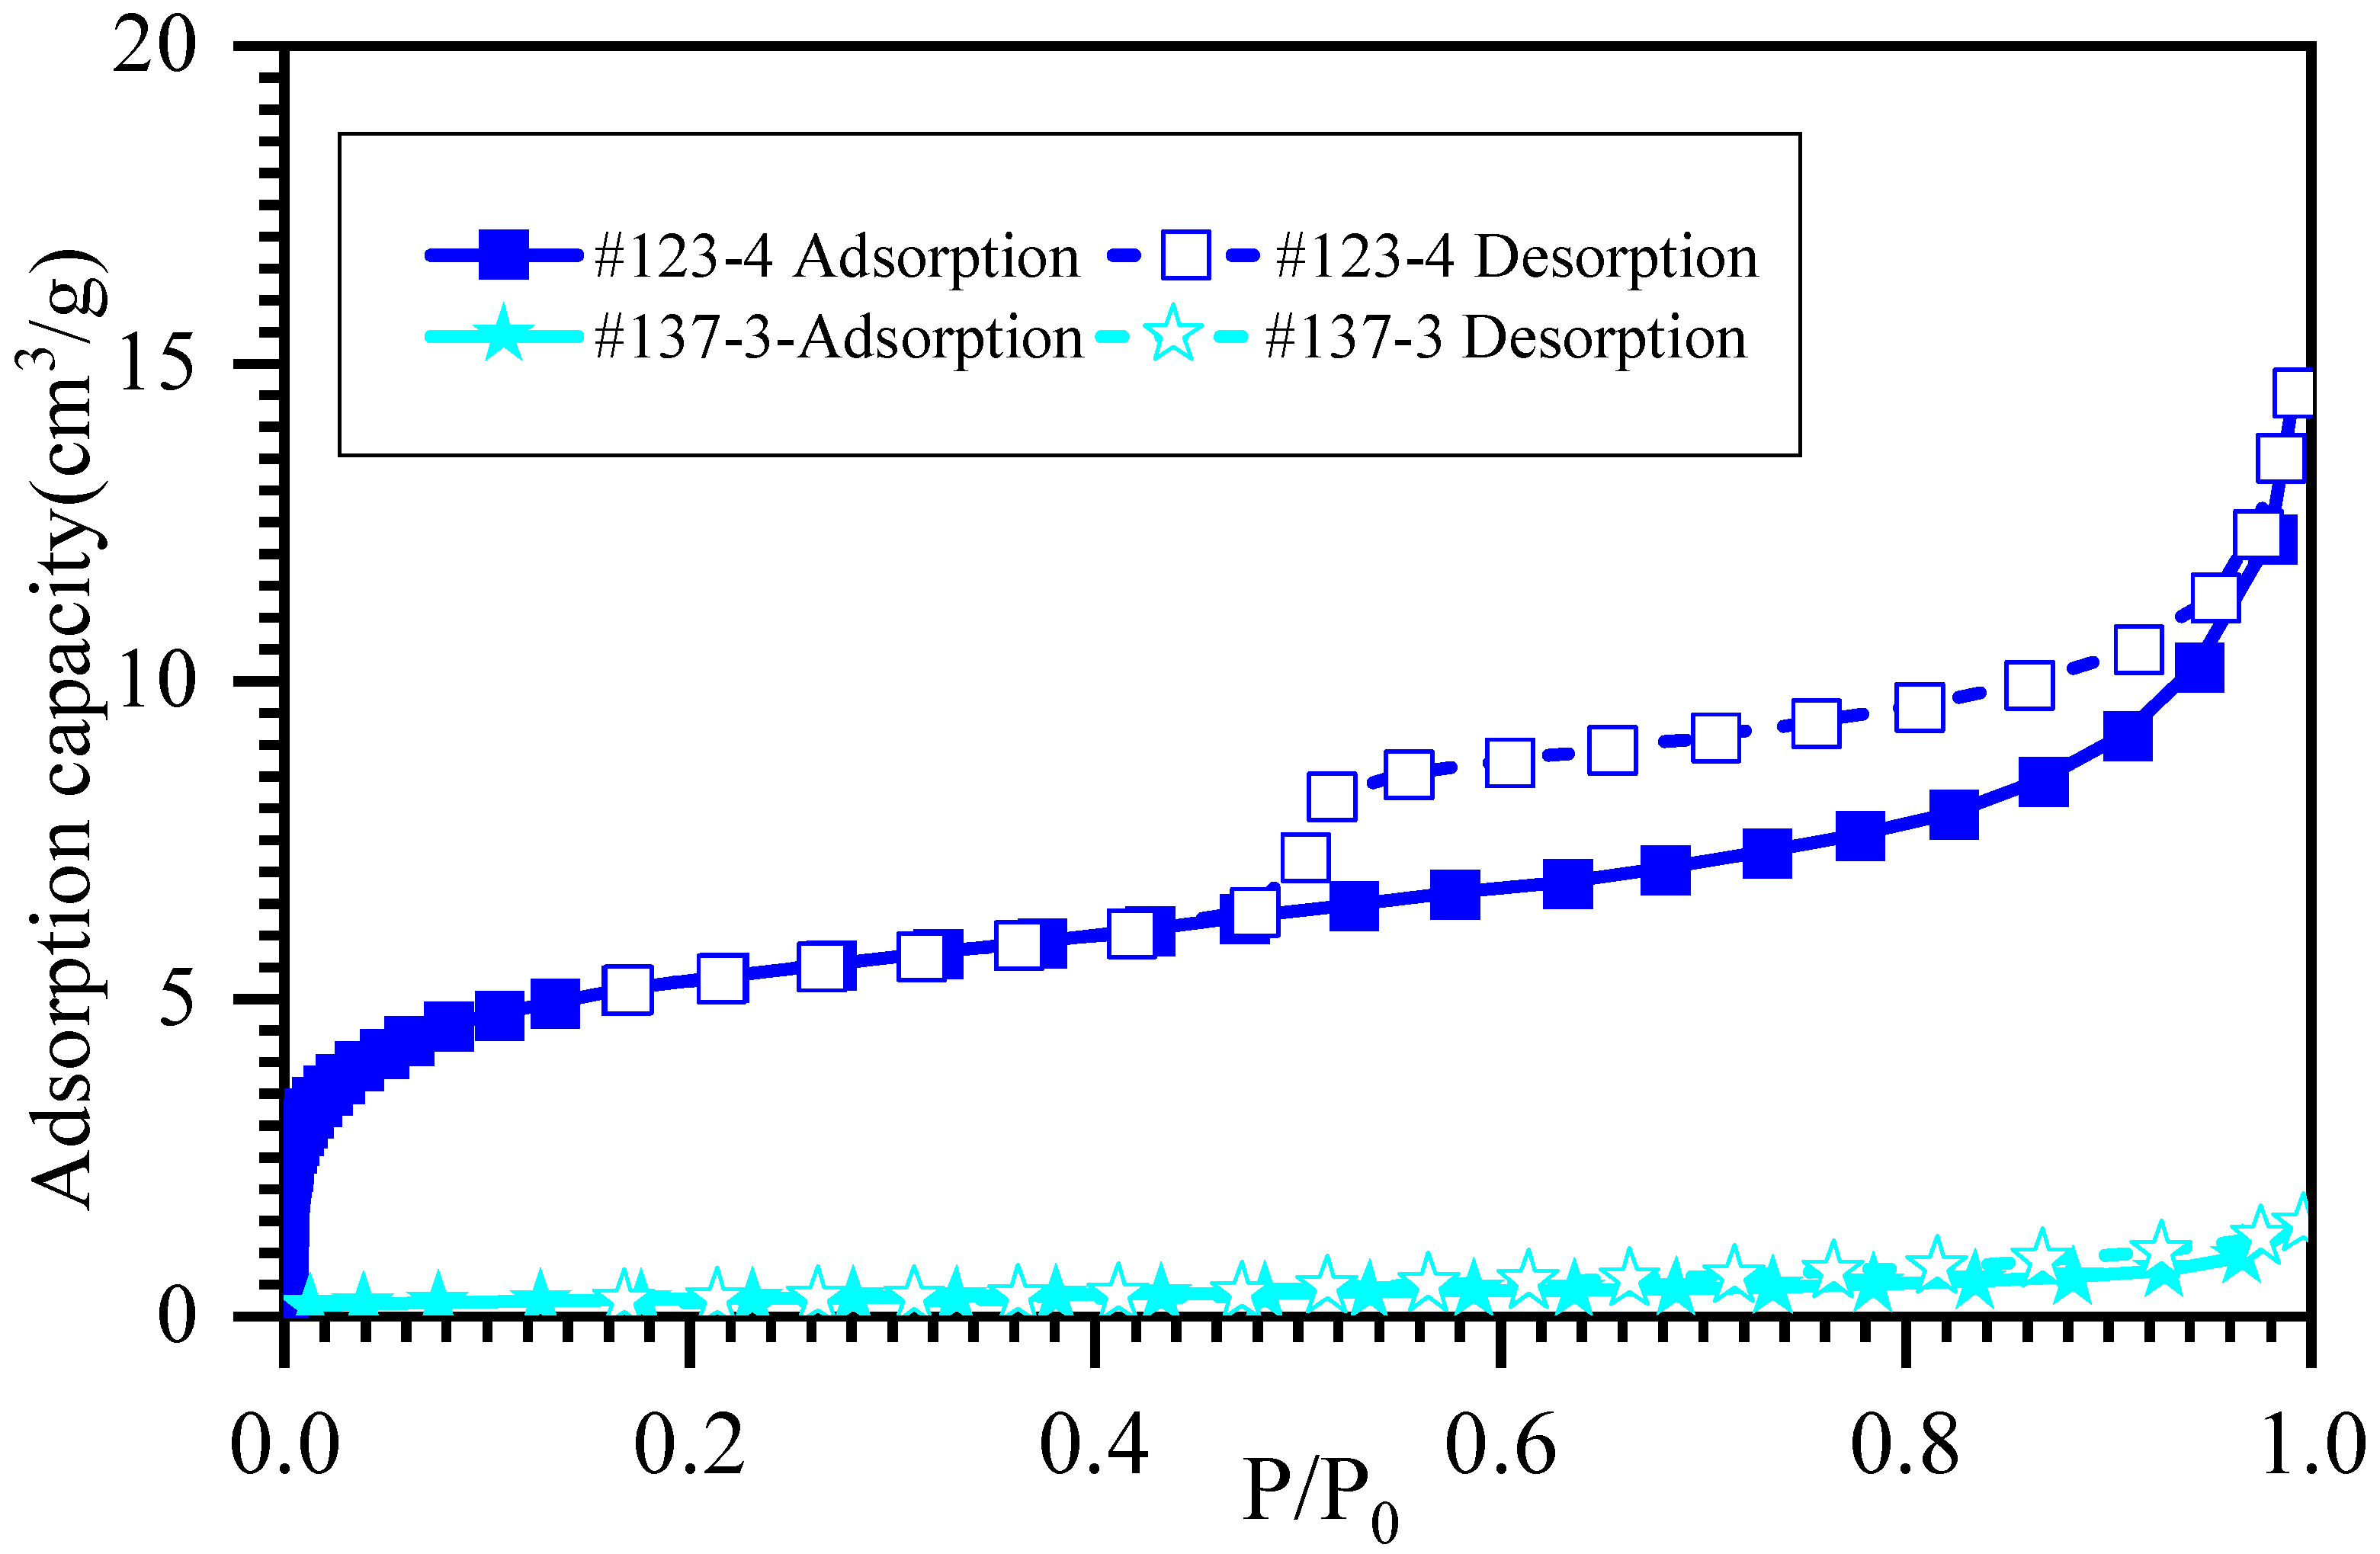
Figure 1. The low-pressure nitrogen adsorption–desorption isotherms of the coal rock samples.
Energies 17 01081 g001
Figure 2. Distribution characteristics of coal rock pore size types.
Energies 17 01081 g002
Figure 3. Low-resolution scanned core grayscale image. The highlighted areas represent minerals, and the black color indicates pores.
Energies 17 01081 g003
Figure 4. Digital core #132-3 data volume (a) Fracture phase, (b) Mineral phase. In the figure, red represents pores, and blue represents the solid matrix.
Energies 17 01081 g004
Figure 5. Coal rock mineral structure characteristics.
Energies 17 01081 g005
Figure 6. Core #132-3 image feature distribution map. In the figure, Pattern 1 represents bright coal phase, Pattern 2 represents dark coal phase, Pattern 3 represents high-brightness minerals, Pattern 4 represents the interaction zone between bright coal phase and minerals, and Pattern 5 represents bright coal phase with added typical minerals.
Energies 17 01081 g006
Figure 7. Mode 2 typical characteristic diagram for core #132-3. In (a), the bright color represents the bright coal phase, the gray color represents the dark coal phase, and the black color represents pores. (b) is the pore distribution map of (a) after binary processing.
Energies 17 01081 g007
Figure 8. Mode 1 typical characteristic diagram for core #132-3. In (a), the bright color represents the bright coal phase, the gray color represents the dark coal phase, and the black color represents pores. (b) is the pore distribution map of (a) after binary processing.
Energies 17 01081 g008
Figure 9. Typical characteristic diagram of mode 4 for core #132-3. In (a), the bright color represents the bright coal phase, the gray color represents the dark coal phase, and the black color represents pores. (b) is the pore distribution map of (a) after binary processing.
Energies 17 01081 g009
Figure 10. Micro-fractures under SEM in core #132-3 slit type fracture.
Energies 17 01081 g010
Figure 11. SEM132-3 organic matter pore type.
Energies 17 01081 g011
Figure 12. Core #132-3 inorganic pores under SEM.
Energies 17 01081 g012
Figure 13. Multi-scale multi-experimental pore structure distribution comparison chart.
Energies 17 01081 g013
Disclaimer/Publisher’s Note: The statements, opinions and data contained in all publications are solely those of the individual author(s) and contributor(s) and not of MDPI and/or the editor(s). MDPI and/or the editor(s) disclaim responsibility for any injury to people or property resulting from any ideas, methods, instructions or products referred to in the content.