Article

A Novel Method for Line Selection for Cross-Line Two-Point Successive Grounding Faults Utilizing Transient and Steady-State Information

1
School of Electrical Engineering, Xi’an University of Technology, Xi’an 710054, China
2
State Grid Shaanxi Electric Power Research Institute, Xi’an 710054, China
3
State Grid Shaanxi Economic Research Institute, Xi’an 710061, China
*
Author to whom correspondence should be addressed.
Energies 2024, 17(4), 950; https://doi.org/10.3390/en17040950
Submission received: 6 January 2024 / Revised: 11 February 2024 / Accepted: 15 February 2024 / Published: 18 February 2024

Abstract

:
In order to improve the performance of an arc suppression coil grounding system in handling cross-line two-point successive grounding faults (CTSGs), the applicability of the transient quantity method and the steady-state quantity method for assessing CTSGs is analyzed. Then, a novel method for line selection for CTSGs was proposed, which comprehensively utilizes transient and steady-state information. Specifically, this method adopts a continuous line selection process, with priority given to the transient quantity method, and a supplementary line selection process, with priority given to the steady-state quantity method. After accurately selecting some faulty lines, such lines are tripped, and then, the process proceeds with continuous line selection again. When the number of cycles exceeds the set value, and the fault line cannot be completely cut off, they are tripped one by one according to the degree to which they are approaching the steady-state method criterion, from large to small. Furthermore, in response to the dramatic increase in computing volume that is caused by the continuous application of the transient method in on-site applications and the impact of current transformer accuracy on the steady-state method, this paper proposes corresponding solutions. PSCAD simulation, full-scale tests, and field recording data tests verify that this paper’s method can accurately detect a CTSG.

1. Introduction

In recent years, scholars have achieved many research results on grounding fault line selection, and the accuracy of line selection has also reached a high level in practice. However, more research must be carried out on cross-line two-point successive grounding faults (CTSGs) in distribution networks. For distribution networks with high cable rates, it is not uncommon for cable trench fires to occur due to the failure to completely cut off the grounding fault lines after a CTSG occurs. Among the 427 grounding faults that were continuously tracked and recorded by the authors, there were 12 CTSGs, accounting for about 2.81%. The authors dealt with two cable trench fires caused by CTSGs within one month, and although the line selection device correctly removed the first grounding line in both cases, the cable trench fires were caused by the second grounding faults that were not removed in time. Therefore, CTSG detection in distribution networks is very valuable and meaningful [1].
A CTSG contains same-phase cross-line two-point successive grounding faults (SP-CTSGs) and different-phase cross-line two-point successive grounding faults (DP-CTSGs). Reasons why existing devices cannot handle successive faults: When a traditional grounding line selection device of a small-current grounding system is put into the tripping function, it generally uses the bus’s zero-sequence voltage to start. After starting, it carries out the grounding line selection once. After selecting the fault line, it enters the delay and monitors the bus’s zero-sequence voltage. If the zero-sequence voltage drops below the return value, it will return; otherwise, the outlet will trip when the delay time is reached. Due to the absence of line selection during the delayed waiting process, the line selection device cannot select the two faulty lines of the CTSG and can only cut off the first selected grounding line. Due to the presence of subsequent grounding faults, the zero-sequence voltage of the bus is still high, causing the line selection device to be unable to return and restart the line selection process, further losing the opportunity to detect subsequent grounding faults.
Although there is little research on CTSGs, the results on grounding fault line selection can be used as the basis for solving CTSGs. In recent years, according to this principle, the research on ground fault line selection can be divided into active and passive methods:
(1)
The active method is identified by injecting signals or artificially creating disturbances, which requires additional devices for implementation and increases the workload of the operation and maintenance. Hence, the application of this method in the field is relatively limited. Ref. [2] uses the transient measurement information after arc extinction to determine the operating state of the distribution network. Ref. [3] proposes to regulate the arc suppression coil to obtain the trajectory matrix, for which a gray correlation analysis is used to identify faults. Ref. [4] identifies faulty lines based on the voltage and current variations under multiple disturbances. Ref. [5] uses a single-phase flexible arc elimination device to detect fault phases, providing a new method for detecting faulty lines. Ref. [6] uses the injected characteristic signal to detect the fault location. Ref. [7] uses the transient voltage and current variations that are generated by the regulation of the arc suppression coil to achieve fault line selection.
(2)
The passive method is divided into the steady-state quantity method and the transient quantity method, which only uses the electrical quantity of the fault process itself. The amount of equipment renovation is small, but it has been widely used in the field. Steady-state quantity method: Ref. [8] calculates the power factor of each line to detect the faulty line. Ref. [9] uses three fault characteristics to detect the fault location. Ref. [10] uses the complete residual current magnitude after the fault has occurred to detect the faulty line. Transient quantity method: Ref. [11] makes full use of the transient component after the grounding fault and distinguishes the faulty line from the healthy line by comparing the magnitude and polarity of the projected component of the transient current. Ref. [12] uses the cumulative generation operator to preprocess the transient currents while identifying the faulty lines by improving the cosine similarity. Ref. [13] uses the fault characteristics of the third harmonic amplitude and phase angle to detect faulty lines. Ref. [14] extracts voltage and current information in the characteristic frequency band range after a grounding fault occurrence to construct a dynamic trajectory of voltage–current characteristics to carry out fault line selection. Ref. [15] combines the instantaneous energy of the transient signal with the cosine similarity to achieve fault line selection. Ref. [16] distinguishes the fault from the healthy section based on the third harmonic phase difference. Ref. [17] uses the zero-crossing time difference of the transient currents to detect the faulty line. In [18], the inner product is calculated for the transient current of each line, and the fault location is distinguished based on the symbol of the inner product. Ref. [19] uses the magnitude and sign of the integrated inner product’s value to distinguish between faulty and healthy lines, and the method is adapted to various extreme conditions. Ref. [20] detects faulty lines based on the integrated harmonic energy and correlation of transient signals. In [21], the cosine similarity between the bus voltage and line current is calculated for the fault’s initial phase to distinguish the faulty line. Ref. [22] detects the fault location by comparing the amplitude characteristics of the transient components. Ref. [23] uses mathematical morphology to extract the fault characteristics and adopts correlation analysis to achieve fault detection. Ref. [24] proposes advanced distortion detection techniques for waveform analysis to distinguish and detect high-impedance faults. Ref. [25] combines three typical transient fault characteristics with D-S evidence fusion theory to achieve fault line selection. In [26], a multi-terminal traveling wave location network is developed. Ref. [27] uses the complete ensemble empirical mode decomposition with adaptive noise (CEEMDAN) algorithm to extract transient signals and develops three complementary fault line selection methods. Ref. [28] identifies the fault location based on the fault characteristics of voltage and current in the characteristic frequency band. Ref. [29] uses the voltage traveling wave after the fault occurs to measure the fault location. Ref. [30] uses the transient energy difference between the faulty and healthy lines in the characteristic frequency band. Ref. [31] combines clustering methods with similarity analysis, thus detecting faulty lines with a high degree of sensitivity. Ref. [32] uses the variational mode decomposition (VMD) algorithm to extract transient characteristics after the occurrence of faults. Ref. [33] uses stochastic resonance to extract transient signals under strong noise. Ref. [34] uses transient voltage and current features and combines these with neural networks to achieve detection of the fault location. Ref. [35] uses the disturbance generated by the small resistance input of a flexible grounding system to achieve fault location detection.
This paper analyzes the problems of using transient and steady-state quantity methods to detect CTSGs and proposes a novel faulty line selection method for CTSGs. This method is verified by PSCAD simulation. In addition, the selection device of a substation in a city in China has been upgraded using this method, and the upgraded substation has successfully detected CTSGs three times.

2. Adaptation Analysis of Transient and Steady-State State Quantity Methods for CTSGs

2.1. Transient Quantity Method

The transient quantity method applies to both stable and intermittent arcing ground faults and does not require high precision for zero-sequence current transformers. Although the transient characteristics have a short duration, this also means that, as long as the interval of the CTSG is long enough, subsequent faults are not affected by previous faults, and continuous detection measures are taken to detect subsequent ground faults.
When two successive ground faults occur close together, the transient zero-sequence current of the faulty and healthy lines can be analyzed from the CTSG topology. Figure 1 shows the topology of the distribution network when the CTSG occurs. We assume that the first ground fault occurs on line n − 1 and the second ground fault occurs on line n. The zero-sequence equivalent network for the successive fault is shown in Figure 2.
In Figure 2, Lp is the inductance of the arc suppression coil, Llk and Rlk are the zero-sequence inductance and resistance of the healthy line, respectively, C0k is the zero-sequence capacitance of the healthy line to ground, and C0∑ is the sum of the zero-sequence capacitance of all lines to ground, where k = 1, 2, …, n − 2. Llf1 and Rlf1 are the first fault line’s zero-sequence inductance and resistance; C0f1 and Rf1 are the first fault line’s line-to-ground capacitance and ground resistance; Llf2 and Rlf2 are the second fault line’s zero-sequence inductance and resistance. C0f2 and Rf2 are the second fault line’s line-to-ground capacitance and ground resistance; Uf2 is the second fault point’s virtual power. As shown in Figure 2, the equivalent circuit is a fourth-order circuit. The voltage and current expressions cannot be obtained directly through the analytical method, so the circuit needs to be simplified due to the small value of the line resistance and inductance, ignoring their impact. The specific simplified results are shown in Figure 3.
In Figure 3, i0f1 is the zero-sequence current of the first fault line outlet, i0f2 is the zero-sequence current of the second fault line outlet, i0k is the zero-sequence current of the healthy line, i0p is the zero-sequence current flowing through the arc suppression coil, i0r is the zero-sequence current flowing through the first grounding resistor, and u0 is the bus’s zero-sequence voltage. Further, the circuit of Figure 3 is simplified, as shown in Figure 4, and i0c is the zero-sequence current flowing through C0∑.
According to the equivalent circuit of Figure 4, the second-order differential equation can be obtained as follows:
L p C 0 Σ R f 2 d 2 i 0 p d t 2 + R f 2 L p R f 1 + L p d i 0 p d t + R f 2 i 0 p = u 0
Solving the second-order differential equation yields the characteristic roots as:
P 1 = R f 2 L p + L p R f 1 2 L p C 0 Σ R f 2 R f 1 + R f 2 L p + L p R f 1 2 L p C 0 Σ R f 2 R f 1 2 1 L p C 0 Σ
P 2 = R f 2 L p + L p R f 1 2 L p C Σ R f 2 R f 1 R f 2 L p + L p R f 1 2 L p C Σ R f 2 R f 1 2 1 L p C Σ
When the first and second ground resistances satisfy Equation (4), the transient equivalent circuit of Figure 4 is in an overdamped state. Set u0 = Umsin(ω0t + θ), where Um and θ are the phase voltage and initial phase angle before the fault at the second fault point, respectively, and ω0 is the angular frequency.
R f 2 L p + L p R f 1 2 > 4 R f 2 2 R f 1 2 L p C 0 Σ
The flow through the neutral arc suppression coil current i0p is as follows:
i 0 p = B sin ( ω 0 t + φ ) + A 1 e p 1 t + A 2 e p 2 t
The first-order and second-order differences in i0p can be derived from Equation (5), and the specific results are Equations (6) and (7).
d i 0 p d t = ω 0 B cos ( ω 0 t + φ ) + p 1 A 1 e p 1 t + p 2 A 2 e p 2 t
d 2 i 0 p d t 2 = ω 0 2 B sin ω 0 t + φ + p 1 2 A 1 e p 1 t + p 2 2 A 2 e p 2 t
As the second ground fault is in the first ground fault on the basis of the occurrence of a fault, that is, the second ground fault is in the first ground fault when the arc suppression coil has begun to compensate for the ground’s current, the initial conditions of i0p is Equation (8). At the same time, since the arc suppression coil only compensates the fundamental wave current, assume that G = Bsinφsin(ω0t), which is assumed for the sake of convenience in achieving a solution.
i 0 p ( 0 ) = i 0 p ( 0 + ) = G
A 1 = G P 2 + B P 2 sin φ ω 0 B cos φ P 1 P 2 A 2 = ω 0 B cos φ + P 1 G B P 1 sin φ P 1 P 2 B = U m L p C 0 Σ R f 2 ω 0 2 R f 2 sin ( ω 0 t ) + R f 2 2 + R f 2 L p + L p R f 1 R f 1 2 ω 0 2 φ = θ arctan R f 2 L p + L p R f 1 ω 0 R f 1 L p C 0 Σ R f 2 ω 0 2 R f 2 sin ( ω 0 t ) + R f 2
Furthermore, it can be demonstrated that the zero-sequence voltage u0 of the bus is
u 0 = L p d i 0 p d t = ω 0 L p B cos ( ω 0 t + φ ) + p 1 A 1 L p e p 1 t + p 2 A 2 L p e p 2 t
From this, it can be demonstrated that the zero-sequence current i0k of a healthy line is
i 0 k = C k d u 0 d t = C k ω 0 2 L p B sin ( ω 0 t + φ ) + L p C k p 1 2 A 1 e p 1 t + L p C k p 2 2 A 2 e p 2 t
Furthermore, the line’s zero-sequence current i0f1 for the first ground fault is
i 0 f 1 = C f 1 d u 0 d t + u 0 R f 1 = C f 1 ω 0 2 L p B sin ( ω 0 t + φ ) + ω 0 L p B R f 1 cos ( ω 0 t + φ ) + C f 1 p 1 2 + p 1 R f 1 A 1 L p e p 1 t + C f 1 p 2 2 + p 2 R f 1 A 2 L p e p 2 t
The line’s zero-sequence current i0f2 for second ground fault is
i 0 f 2 = C Σ C f 2 d u 0 d t + u 0 R f 1 + i 0 p = 1 C Σ C f 2 ω 0 2 L p B sin ( ω 0 t + φ ) + ω 0 L p B R f 1 cos ( ω 0 t + φ ) + 1 + C Σ C f 2 p 1 2 L p + p 1 R f 1 L p A 1 e p 1 t + 1 + C Σ C f 2 p 2 2 L p + p 2 R f 1 L p A 2 e p 2 t
An analysis of Equations (11)–(13) can derive the transient zero-sequence current for the healthy line, the first fault line, and the second fault line as follows:
The healthy line’s transient zero-sequence current is
i 0 k _ t = L p C k p 1 2 A 1 e p 1 t + L p C k p 2 2 A 2 e p 2 t
The first fault line’s transient zero-sequence current is
i 0 f 1 _ t = C f 1 p 1 2 + p 1 R f 1 A 1 L p e p 1 t + C f 1 p 2 2 + p 2 R f 1 A 2 L p e p 2 t
The second fault line’s transient zero-sequence current is
i 0 f 2 _ t = 1 + C Σ C f 2 p 1 2 L p + p 1 R f 1 L p A 1 e p 1 t + 1 + C Σ C f 2 p 2 2 L p + p 2 R f 1 L p A 2 e p 2 t
The ground capacitance current of the distribution network is generally not greater than 200 A. Moreover, a single line’s maximum ground capacitance current does not exceed 50 A. Therefore, Equations (14)–(16) are analyzed based on the actual parameters. The specific settings are as follows: t = 0.2 s, C0∑ = 3.68 × 10⁻⁵ F, Lp = 0.25 H, Um = 3000 V, θ = 45°, C0k = 1.20 × 10⁻⁵ F, C0f1 = 1.20 × 10⁻⁵ F, and C0f2 = 1.20 × 10⁻⁵ F. We focus on the analysis of Rf1 and Rf2 on the line’s transient current impact, as shown in Figure 5.
When R2 is greater than R1, each line’s transient current is as shown in Figure 5a. It can be observed that the second fault line’s transient current polarity is opposite to those of healthy lines. But the second fault line’s transient current amplitude will be lower than that of the first fault line, and the second fault line’s transient current polarity and the first fault line’s transient current are the same. Therefore, the transient amount method may miss the second ground fault.
Based on the above analysis, it can be concluded that when a CTSG occurs, the transient quantity method may detect two grounding faults. However, there is also a possibility of missing the second ground fault. Once missed, the steady-state quantity method must be used to select the faulty line. In addition, for intermittent arc grounding, each arc is accompanied by a transient process; that is, the transient quantity method provides an opportunity to detect faults.
The recording data of an SP-CTSG and DP-CTSG are shown in Appendix A.

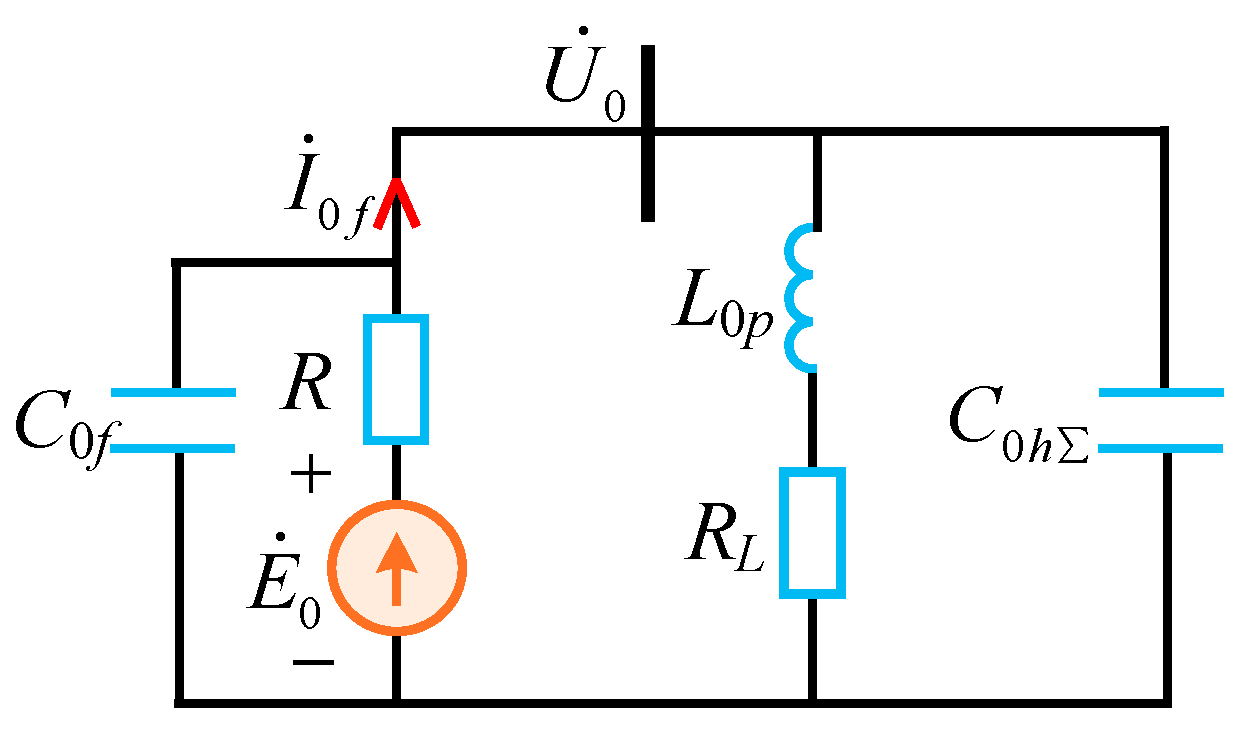
2.2. Steady-State Quantity Method

Based on the direction of the zero-sequence active power, the steady-state method has a clear physical significance. When a ground fault occurs, the zero-sequence active power of the line flows to the bus, while the healthy line flows out of the bus. However, the performance of the steady-state method could be better in field applications, mainly because the accuracy of the current transformers often needs to meet the requirements of the method. As shown in Figure 6, the equivalent circuit is widely used for analyzing the steady-state zero-sequence characteristics. Since the zero-sequence impedance of the line is much smaller than the capacitive impedance, it is generally approximated to be neglected. At the same time, the zero-sequence active power direction of the faulty line is from the line to the bus, and the direction of the healthy line is from the bus to the line.
In Figure 6, E ˙ 0 is the equivalent zero-sequence voltage source at the grounding point. U ˙ 0 is the bus’s zero-sequence voltage. L is the arc suppression coil inductance. RL is the resistance of the arc suppression coil. R is the grounding resistance. I ˙ 0 f is the zero-sequence current of the faulty line, and C0f is the ground capacitance of the faulty line. C0h is the sum of grounding capacitances of the healthy line. Further, we obtained the steady-state equivalent circuit for a CTSG, as shown in Figure 7.
In Figure 7, E ˙ 01 and E ˙ 02 are equivalent zero-sequence voltage sources for the two grounding points. R1 and R2 are the grounding resistances corresponding to the first and second faults, respectively. I ˙ 01 and I ˙ 02 are the zero-sequence currents of the two faulty lines, respectively. I ˙ 0 Σ is the total zero-sequence current, except for the two fault lines. C01 and C02 are the capacitance to ground of the first and second grounding lines, respectively. C 0 h * is the sum of ground capacitances of all healthy lines, except for two faulty lines.
In Figure 7, the phase of the current flowing through the faulty line is 90° ahead of the zero-sequence voltage, and it does not generate active power. Therefore, in analyzing the zero-sequence active power direction of the two faulty lines, the capacitance of the faulty line to the ground can be ignored. Therefore, Figure 7 is further simplified, and the branch of the arc suppression coil and the branch of the system-to-ground capacitance are combined equivalently to the form of R + jX, and the equivalent circuit is shown in Figure 8.
From the superposition theorem, it follows that
U ˙ 0 = E ˙ 01 R 2 / / ( R + j X ) R 1 + R 2 / / ( R + j X ) + E ˙ 02 R 1 / / ( R + j X ) R 2 + R 1 / / ( R + j X )
I ˙ 01 = E ˙ 01 U ˙ 0 R 1
I ˙ 02 = E ˙ 02 U ˙ 0 R 2
(1)
Analysis of steady-state fault characteristics and the adaptability of the steady-state quantity method for SP-CTSGs
Based on Equations (18) and (19), it can be obtained that I ˙ 01 and I ˙ 02 satisfy the relationship shown in Equation (20):
E ˙ 01 I ˙ 01 R 1 = E ˙ 02 I ˙ 02 R 2 I ˙ 01 + I ˙ 02 = I ˙ 0 Σ
For an SP-CTSG, E ˙ 01 and E ˙ 02 can be approximated as equal, which can be obtained from Equation (20):
I ˙ 01 = R 2 R 1 + R 2 I ˙ 0 Σ I ˙ 02 = R 1 R 1 + R 2 I ˙ 0 Σ
According to Equation (21), it can be further demonstrated that the zero-sequence active power P01 and P02 of the two faulty lines will satisfy Equation (22).
P 01 = P 0 Σ R 2 R 1 + R 2 P 02 = P 0 Σ R 1 R 1 + R 2
Equation (22) shows that after the occurrence of an SP-CTSG, the zero-sequence active power direction of both fault lines flows from the line to the bus, and the active power value is inversely proportional to the ground fault resistance of this line. In theory, a steady-state method based on the direction of the zero-sequence active power can simultaneously detect two faulty lines. But in the case of low-impedance grounding followed by high-impedance grounding, the zero-sequence active power of the high-impedance grounding line may be minimal. If the line itself is considered conductive, its active power direction may be the same as that of the healthy line.
(2)
Analysis of steady-state fault characteristics and the adaptability of the steady-state quantity method for DP-CTSGs
When a DP-CTSG and the E ˙ 01 and E ˙ 02 amplitudes are the same, and the phase is related to the two ground phases, set E ˙ 02 to be E∠0°, and E ˙ 01 to overrun E ˙ 02 by 120°; at this time, the bus’s zero-sequence voltage is shown in Equation (23).
U ˙ 0 = E   R 1 R 1 2 R 2 R 3 2 R 2 X + j R 1 X 1 2 R 2 X + 3 2 R 2 R   R 1 R 2 + R 1 R + R 2 R + j X ( R 1 + R 2 )
where I ˙ 01 and I ˙ 02 are shown in Equations (24) and (25), respectively:
I ˙ 01 = 1 2 + j 3 2 E U ˙ 0 R 1
I ˙ 02 = E U ˙ 0 R 2
(1) When both groundings have low resistance:
That is when R1 < 0.1|R + jX| and R2 < 0.1|R + jX|; at this time, in Figure 8, the system is approximately equivalent to disconnecting the R + jX branch. Therefore, we have that
U ˙ 0 = E ˙ 02 E ˙ 02 E ˙ 01 R 1 + R 2 R 2           = R 1 1 2 R 2 + j 3 2 R 2 E R 1 + R 2
I ˙ 01 = 3 2 + j 3 2 E R 1 + R 2 = I ˙ 02
According to Equations (26) and (27), the phase angles φ1 and φ2 of the bus’s zero-sequence voltage U ˙ 0 are ahead of I ˙ 01 and I ˙ 02 , and the following applies:
φ 1 = φ R 1 1 2 R 2 + j 3 2 R 2 150 °
φ 2 = φ 1 180 °
According to Equations (28) and (29), it can be concluded that when R1 > R2, then −150° < φ1 < −90° and 30° < φ2 < 90°; when R1 < R2, then −90° < φ1 < −30° and 90° < φ2 < 150°. That is, whether R1 > R2 or R2 > R1, the two fault lines’ zero-sequence active power directions are always opposite, and lines with less grounding resistance flow towards lines with higher grounding resistance, so based on the zero-sequence active power direction, the steady-state method can only detect the smaller grounding resistance of lines.
(2) When one-time grounding with low impedance and one-time grounding with high impedance occurs, the equivalence of the two faulty voltage source branches in Figure 8 yields the equivalent circuit that is shown in Figure 9.
In Figure 9, the voltage E ˙ * of the equivalent voltage source is as follows:
E ˙ * = E ˙ 01 R 2 + E ˙ 02 R 1 R 1 + R 2
The equivalent resistance R * is
R * = R 1 R 2 R 1 + R 2
When R1 < 0.1R2, Figure 9 includes E ˙ * E ˙ 01 and R * R 1 , which are equivalent to the second fault line in the approximate disconnected state for Figure 8; that is, only the first fault line exists, and at this time, the first fault line’s active power flows from the line to the bus, while the second fault line that flows through the active power is very small. When R2 < 0.1R1, the second fault line’s active power flows from the line to the bus, and the active power that flows through the first fault line is very small.
Therefore, under the condition of multiple groundings coexisting, the steady-state quantity method, based on the direction of the zero-sequence active power, can only detect fault lines with small grounding resistances.
(3) Both faults are caused by high-impedance grounding when |R + jX| < 0.1R1 and |R + jX| < 0.1R2; at this time, the system is approximately equivalent to shortening the R + jX branch. Therefore, it can be concluded that
I ˙ 01 E ˙ 01 R 1
I ˙ 02 E ˙ 01 R 2
The approximate equivalent of the two equivalent power supplies to the R + jX branch supply is a smaller current with less power exchange between the two supplies, and the zero-sequence active power direction is pointed to the bus. Theoretically, under the condition of multiple groundings coexisting, the steady-state quantity method, based on the direction of the zero-sequence active power, can simultaneously detect the two ground fault lines. However, the detection is more difficult, because the zero-sequence active power is small.

3. New Method of Line Selection for CTSGs

Based on the analysis in Section 2, it can be concluded that using transient and steady-state quantity methods alone cannot ensure that all fault lines are detected. However, they need to make up for each other. Considering that the transient method does not require high accuracy of the transformer and applies to both continuous grounding and intermittent arc grounding, in the integrated application, we use the strategy of giving priority to the transient quantity method, and only if the transient quantity method cannot select all fault lines is the steady-state quantity method used to supplement.
Therefore, a CTSG selection method that integrates the use of transient and steady-state information is proposed, and its flow is shown in Figure 10. The core idea of this detection method is to use the steady-state quantity method as the backup of the transient quantity method and the wheel cut method as the backup of the steady-state quantity method.
First, the selection device is activated when the bus’s zero-sequence voltage exceeds the threshold U0,set, and continuous detection is performed before the trip delay occurs. In the process of continuous detection, the transient method is preferred. Only when the transient method cannot select any faulty lines, and I0 is greater than the threshold I0,set that ensures the accuracy of the transformer, the steady-state method is applied for detection. The detected faulty lines are stored in a queue, Q.
Second, when the pre-set trip delay time is reached, if the zero-sequence voltage still does not meet the return condition, indicating a non-instantaneous fault, all lines in queue Q will be removed.
Then, after tripping, if the monitored zero-sequence voltage still does not meet the return condition, after an appropriate delay of Δt, additional processing is carried out, and continuous detection and tripping are carried out again, and so on, until the zero-sequence voltage meets the return condition.
Finally, when the number of consecutive detections that are performed, i, exceeds the set upper limit imax, and the zero-sequence voltage still does not return to normal, the line is tripped in order of the degree of proximity to the fault criterion (zero-sequence active direction method) from largest to smallest.
The key to the engineering implementation of the above method lies in two aspects:
(1) The calculation of the continuous detection of the transient quantity method (when upgrading the selection device using the detection principle in Figure 10, it is necessary to consider whether the hardware platform can handle the increase in calculation quantity).
(2) The accuracy of the detection of the steady-state quantity method (reasonable configuration of the zero-sequence current transformer to meet the accuracy requirements of the steady-state quantity method).

3.1. Analysis of Calculation Amount for Continuous Detection in Transient Quantity Method

The main factor affecting the use of the transient method for continuous detection is the increase in the calculation amount. The existing selection device for transient detection generally takes about 60 to 100 ms; in continuous detection, to perform the process several times, the amount of calculations must be analyzed.
Since the data buffer requires dynamic storage, and the transient quantity method must be based on the information at the moment of the sudden change in zero-sequence voltage or zero-sequence current in order to perform selection, if a CTSG occurs intensively, when the subsequent fault information has been cleared out of the buffer after completing the analysis several times, the analysis of the subsequent ground fault cannot be completed, and missed detection occurs.
Let the total duration of data that are stored in the buffer be T. CTSG occurs intensively at intervals ∆t1, and the time required for each analysis process is ∆t2. If N analysis processes are completed without leakage, the following needs to be satisfied:
N Δ t 2 < T + N Δ t 1
Then, when ∆t2 < ∆t1, Equation (34) always holds, meaning that no leakage occurs, no matter how often the analysis is performed.
When ∆t2 > ∆t1, the maximum number of analysis processes that can be completed without missing a check is satisfied:
N < T Δ t 2 Δ t 1
Strictly speaking, the time required for one analysis process ∆t2 is 100 ms, when performed with this parameter. For one successive ground fault, only the moment of its occurrence causes a sudden change in the zero-sequence voltage or zero-sequence current, which triggers an analysis process. If the interval between two adjacent faults ∆t1 is greater than 100 ms, then theoretically, they can be detected no matter how many successive ground faults occur during the waiting delay. For intermittent arc grounding, the extreme case may be that every half-cycle (∆t1 = 10 ms), there is an arc reignition process to generate the required amount of mutation; if there is another intermittent arc grounding of a different phase at the same time, the half-cycle may have more than one arc process for generating the required amount of mutation to start the analysis process. With the current processing power of the selection device, it cannot deal effectively with such a large amount of calculations.
Considering the above factors, limiting the number of analysis processes that start within 20 cycles (400 ms) is adopted in the continuous detection process, limiting the number of starts of each analysis process to four when the CPU processing power still leaves enough margin. Considering that a CTSG has a certain time dispersion, this response strategy can meet the requirements of line selection for most CTSGs. However, in the extreme case, if the CTSG occurs in a very short time interval (such as 2~5 ms), it will fall into the same analysis process. The transient processes of two ground faults are intertwined, because the transient characteristics of the two ground faults weaken each other, which will increase the detection difficulty of the transient quantity method and may lead to missed detection, which needs to be supplemented by the steady-state quantity method.

3.2. Analysis of the Accuracy of the Steady-State Quantity Method of Detection

The smaller zero-sequence current is the main factor affecting the steady-state quantity method (zero-sequence active power direction method). The current selection device’s zero-sequence voltage starting condition is generally set at a minimum of 10% rated voltage. The arc suppression coil’s start voltage is 20% to 35% of the rated voltage, and the site is generally set to 25%; that is, the separation voltage of the damping resistor of the pre-conditioned arc extinguishing coil can be considered to be 25%. Therefore, the zero-sequence voltage in 10% to 25% of the rated voltage, corresponding to the higher grounding resistance case’s damping resistance, does not separate; the zero-sequence active power direction method is beneficial.
The cable line’s resistance current (active power loss) and system’s capacitive current ratio β is about 2% to 4%; insulation aging can be increased to 10%; the overhead line β is about 3% to 5%, and insulation accumulation of dirt and moisture can also be increased to 10%. Considering that the neutral point via the arc suppression coil’s grounding system’s cable rate is high and strict, β takes 3%. The damping rate γ of the damping resistance of the arc suppression coil is generally 5%, while the arc suppression coil’s over-compensation degree λ is generally 5~10%; strictly speaking, λ takes 10%. Cable lines in the rated voltage capacitive current are generally not less than 5 A; strictly speaking, this paper assumes 5 A. For the fault line, although the requirement of overcompensation does not exceed 10% of the system’s full capacitive current, because the capacitive current downstream of the grounding location does not flow through the first end of the fault line, the actual level of the residual current is also higher than a few amps; that is, the size of the zero-sequence current of the healthy line is the key to affect the accuracy of the zero-sequence active power direction method of detection. In general, the fault line is a capacitive current, which accounts for the system’s capacitive current ratio k, which does not exceed 10%.
According to the above parameters, the phase angle φh,0 of the healthy line’s zero-sequence current ahead of the zero-sequence voltage can be obtained as follows:
φ h , 0 = 90 a r c t g β = 88.3
When the line selection device is started and the damping resistance of the arc suppression coil has not exited, the healthy line capacitance current Ih,0 = 5 A × 10% = 0.5 A. When the arc suppression coil is overcompensated by 10%, the phase angle φf,1 of the grounding line’s zero-sequence current ahead of the zero-sequence voltage is
φ f , 1 = 90 + a r c t g β + γ λ + k = 111.8
In the selection device, the starting resistance and the damping resistance are separated in case of the most unfavorable situation (corresponding to the zero-sequence voltage of 25% of the rated value); the healthy line’s capacitance current Ih,0 = 5 A × 25% = 1.25 A, φh,0 is still as shown in Equation (36). When the arc suppression coil is overcompensated by 10%, the phase angle φf,2 of the grounded line’s zero-sequence current ahead of the zero-sequence voltage is
φ f , 2 = 90 + a r c t g β ρ + k = 98.5
The steady-state zero-sequence current and the zero-sequence voltage phase relationship of the line are shown in Figure 11. As seen in Figure 11, with U ˙ 0 as the reference direction, the non-fault line’s steady-state zero-sequence current I ˙ 0 h is in the first quadrant, and the zero-sequence current I ˙ 0 f is in the second quadrant when it is overcompensated.
The phase angle determination threshold φset can be as close as possible to the boundary of the faulty line. At the same time, a margin of about 5° needs to be set aside to cope with the data errors and leave a large fault tolerance space for healthy lines. According to U0’s adaptive fixed value, φset,1 = 106.8° can be taken when U0 ≤ 25%, and φset,2 = 93.5° when U0 > 25%. If it is impossible to distinguish whether the damping resistance is separated according to U0, φset = 93.5° must be used. According to the U0 adaptive threshold, the allowed angular difference of the zero-sequence current transformer is (106.8° − 88.3° = 18.5°) and (93.5° − 88.3° = 5.2°) when the zero-sequence current is in the range of 0.5 to 1.25 A and the zero-sequence current is greater than 1.25 A, respectively. If not based on the U0 adaptive threshold, the allowed angular difference of the zero-sequence current transformer is (93.5° − 88.3° = 5.2°) when the zero-sequence current is 0.5 A and above.
Through the rational configuration of the zero-sequence current transformer, the detection requirements of the zero-sequence active power direction method can be met. For example, if a 50/10.5 S grade zero-sequence current transformer can be used, then the ratio difference is less than 1.5% and the angle difference is less than 90′ (1.5°) in the range of 1~120% times the rated current (0.5 A~60 A), and then, the accuracy of the zero-sequence active power direction method can be ensured.
It is not easy to fully replace the zero-sequence current transformer in the substation in the field. If the existing zero-sequence current transformer is to be used, the impact of its accuracy on the line selection performance needs to be evaluated. According to the actual accuracy of the existing zero-sequence current transformer, the lower limit of the zero-sequence voltage U0D can be deduced to meet the detection requirements. The relationship between the bus’s zero-sequence voltage U ˙ 0 and the grounding resistance Rf is shown in Equation (39) (See Appendix A for the derivation):
U ˙ 0 = E ˙ 2 ( E ˙ + d I C Σ R f ) 2 + λ 2 I C Σ 2 R f 2
where E ˙ is the rated phase voltage, I is the system’s capacitance current at the rated voltage, λ is the overcompensation degree, and d is the damping ratio, which is 0 when the damping resistor is separated.
According to Equation (39), the grounding resistance corresponding to U0D can be obtained. If it meets the requirements of not being less than 1000 Ω, it can continue to use these zero-sequence current transformers and postpone the transformation and upgrade. In very few of the most unfavorable conditions, limited by the accuracy of the zero-sequence current transformer, the zero-sequence active power direction method is likely to fail. At this time, the non-tripped line can be close to the degree of the zero-sequence active power direction criteria, from large to small differences and tripped one by one; this strategy is equivalent to a judgment of the possibility of grounding from large to small types of automatic push–pull selection operations, which still meet the requirements of the selection device, which is that they must reliably remove all fault lines.

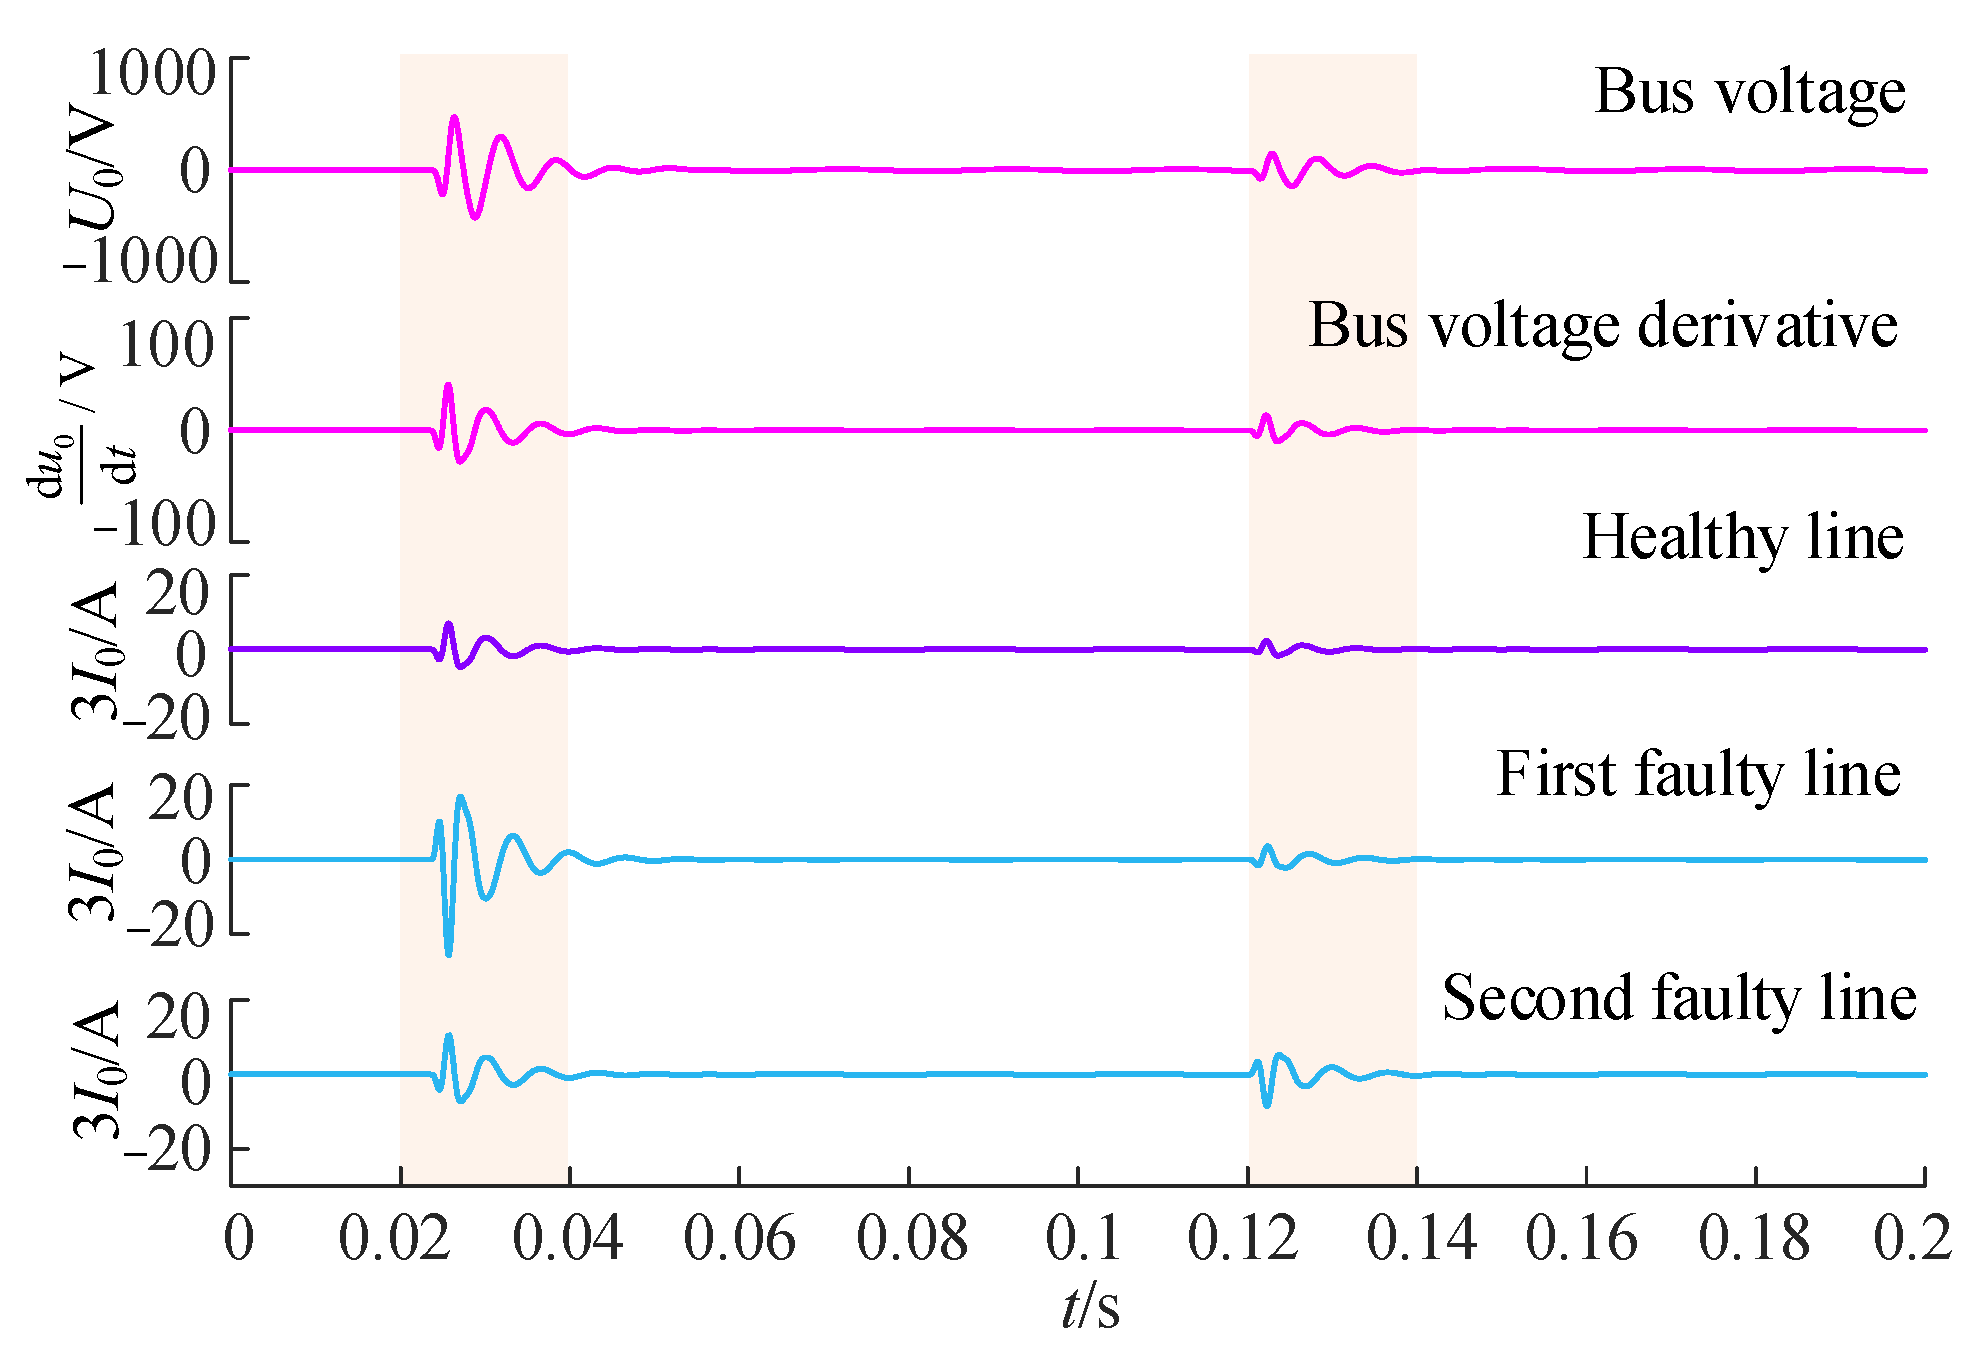
4. Simulation Testing

PSCAD was used for the simulation analysis of the 10 kV distribution system, as shown in Figure 12, where the sampling rate is 10 kHz.
In the simulation system, L3 denotes the cable lines, and L4 denotes the overhead lines. Line parameters are listed in Table 1.
① The first grounding is a continuous stable grounding, and the second grounding is a continuous stable grounding. ② The first grounding is an intermittent arc grounding, and the second is an intermittent arc grounding. ③ The first grounding is an intermittent arc grounding, and the second is a continuous stable grounding. ④ The first grounding is a continuously stable grounding, and the second is an intermittent arc-light grounding. Among them, the intermittent arc grounding parameters are shown in Figure 13 and Table 2 [36].
(1)
Condition ①:
The first fault feeder was L4, which experienced an A-phase ground fault at 0.2 s with a ground resistance of 3000 Ω. The second fault feeder was L1, which experienced an A-phase ground fault at 0.26s with a ground resistance of 2000 Ω. Assuming 0.32 s excision has been detected in the fault line, each line’s current waveform is shown in Figure 14.
Figure 14A–D represent: first fault, second fault, cut the first fault, cut the second fault. From Figure 14A, we can observe that after the first grounding, L4’s current amplitude is more significant than those of L1~L3, and the phase is opposite to L1~L3. This feature satisfies the transient quantity method so that L4 can be detected as a fault line. From Figure 14B, we can observe that after the second grounding, L4’s current phase is opposite to the other lines, a feature that consistently lasted until 0.32 s, but the L4 current amplitude is not the maximum, while L1’s amplitude is not the maximum. Using the transient amount method, this is not detected in the fault line. From Figure 14C, we can observe that after removing the detected faulty line L4, the remaining line’s current did not undergo a sudden significant change, and the remaining line’s current did not meet the transient quantity method. Observing Figure 14D, it can be seen that the current of feeder L1 crosses zero first. From this, it can be calculated that the leading voltage phase angles of the current from L2 to L3 are 97.37°, 89.23°, and 90.24°, respectively. When φset = 93.5°, the use of the steady-state amount method to detect the fault line for L1 for the successive fault that is shown in Figure 14 results in two grounding fault lines being visible.
(2)
Condition ②:
The first fault occurred in the intermittent arc grounding (Cement) for the A phase of L4 at 0.2 s, and the second fault occurred in the intermittent arc grounding (Dry grass) for the A phase of L1 at 0.26 s; assuming a 0.32 excision has been detected in the fault line, each current’s waveform is shown in Figure 15. Figure 15A–D represent: first fault, second fault, cut the first fault, cut the second fault. Observing Figure 15 indicates that the current has undergone a significant distortion with an over-zero phenomenon. Observing Figure 15A, the L4 current’s characteristics meet the fault characteristics of the transient quantity method, so L4 is detected as a faulty line. Observing Figure 15B, the fault line is not seen using the transient method, and the same characteristics as Figure 14B can be seen. Observing a part of Figure 15C, the remaining line’s current after removing the faulty line L5 does not satisfy the transient quantity method. Observing Figure 15D, L1’s current is initially over zero, and the calculated L1~L3 present phase angles ahead of the voltage of 103.58°, 88.47°, and 89.29°, respectively; the same is true when φset = 93.5°, when the steady-state method can detect a fault line for L1.
For conditions ①, ②, ③, and ④ of various verified working conditions, the specific results are shown in Table 3, Table 4, Table 5 and Table 6. In the tables, it can be seen that the use of the transient quantity method can detect two grounding fault lines; the tables also introduce the use of the transient quantity method and the steady-state quantity method, with the detection of two grounding fault lines, while the use of the wheel cut with the transient quantity method and the steady-state quantity method with the detection of two grounding fault lines is also included, indicating that the method proposed in this paper has a high accuracy and reliability.

5. Full-Scale Test Field Testing

For the 10 kV full-scale test field, we set up three lines, L1~L3. The line lengths and model are shown in Figure 16. The bus offers additional access to a three-phase capacitor cabinet (parameters of 2.5 μF), the rest of the alternative line-to-ground capacitance is simulated, the total capacitance of the system current is 19A, and the arc suppression coil’s overcompensation degree is set to 5%.
In the test, the L2 end grounding (14-D) is set first, and the L3 end grounding (F2) is set after about 2 s. Among them, for the same phase and different phase grounding faults, two scenarios are set:
① The second grounding before the first grounding line trip corresponds to the test scenarios of serial numbers 1 to 6 in Table 7.
② The second grounding occurs after the first grounding line trips, but the zero-sequence voltage does not return to normal, corresponding to the test scenarios in Table 7 with serial numbers 7 to 12. The test scenarios are shown in Table 7.
The test method shown in Figure 10 was used to upgrade the protection selection device for small-current grounding systems, and the upgraded selection device was tested using the 12 scenarios shown in Table 7. In the 12 test scenarios, the device correctly detected both grounding lines, including 4 scenarios where the transient quantity method did not see the second fault line but relied on the steady-state quantity method to select the fault line successfully.
In this section, two typical scenarios are selected for specific illustration.
In scenario 4, L2 and L3 are set to experience single-phase ground faults successively, with ground resistances of 60 Ω and 2000 Ω, respectively. The recording data near the two grounding moments are shown in Figure 17a,b. The waveforms are all on the secondary side, where the TV ratio is 60:1, and the TA ratio is 50:5.
As shown in Figure 17a, L2 experiences a single-phase ground fault at 0.28 s, with the maximum transient zero-sequence current amplitude and opposite polarity. Therefore, it can be determined that L2 is a faulty feeder. In the delay waiting to trip, zero-sequence voltage is always present, about 1.15 s. In the L3 grounding, the selection device again detects a transient process, as seen in Figure 17b, and the transient zero-sequence current amplitude of L3 is the largest; the polarity is opposite to other lines, meaning that L3 grounding occurs. At the end of the tripping delay, the line selection device trips L2 and L3 (in the experiment, tripping the grounding branch instead of the line switch), and the system voltage returns to normal.
In scenario 8, the L2 feeder first experiences a ground fault with a ground resistance of 60 Ω; after the L2 fault is eliminated, L3 experiences a ground fault with a ground resistance of 3000 Ω, indicating an abnormal zero-sequence voltage. The data recorded for the first grounding are very similar to Figure 17a, needing no further elaboration, and the data recorded during the second grounding are shown in Figure 18.
As seen in Figure 18, after L3 grounding, its fault characteristics are relatively weak, and the application of the continuous detection method did not lead to the detection of the second grounding fault. However, after the L2 grounding branch trips, the phase angles of L1~L3’s zero-sequence current ahead of the zero-sequence voltage are calculated to be 98.13°, 96.95°, and 104.72°. L3 is the most consistent within the fault criterion, and the second grounding line is successfully identified as L3 by the zero-sequence active power method.

6. Field Recording Test

The detection method shown in Figure 10 was used to upgrade and renovate some substations in certain cities in China. The existing standards only specify the accuracy requirements for P-level current transformers at the rated current and maximum limit current, and there are no relevant regulations for accuracy at low currents. Through the test of a batch of 100/5 10P10 level zero-sequence current transformers, the maximum value of the angular difference was shown to be 4.6° and 11.4°, respectively, when the primary current was 1 A and 0.5 A. At this time, it is necessary to identify the state of damping resistance according to U0 and adjust the fixed value automatically to ensure the accuracy of the detection of the zero-sequence active power direction method. Considering the large number of substations that are involved, the dispersion of the zero-sequence voltage values of their configured arc’s extinguishing coil separation damping resistors is large, and it is difficult to adopt an adaptive fixing strategy; therefore, it can only meet the accuracy requirement of an allowed angular difference of no more than 5.2 when the primary current is greater than 1 A.
The capacitance current of each line of these substations at a rated voltage is greater than 5 A, so the configured zero-sequence current transformer can only ensure the accuracy of line selection at a zero-sequence voltage that is higher than 20% of the rated voltage.
The maximum capacitance current (I) of each bus of these substations does not exceed 150 A, and the overcompensation degree λ of the arc suppression coil is less than 10%; in addition, the corresponding grounding resistance Rf is 1979 Ω and 1212 Ω when U0 is 20% of the rated voltage in the case of damping resistance separation and non-separation, which both meet the requirement of not being under 1000 Ω. Therefore, these zero-sequence current transformers can be used temporarily. Three CTSGs have been successfully detected in the substation, completed by the upgrade, including the following: at 16:03:10 on a certain day, a CTSG occurred between the A phase of line 171 and the A phase of line 167 in I bus of a 110 kV ZB substation; at 15:23:05 on a certain day, a CTSG occurred between the B phase of line 114 and the B phase of line 188 in III bus of a 110 kV WT substation; and at 15:01:40 on a certain day, a CTSG occurred between the C phase of line 146 and the A phase of line 145 in a 110 kV ZB substation II bus. In the three CTSGs, two grounding lines were detected continuously by applying the transient quantity method, and the recording wave data are shown in Figure 19a,c, respectively. The moment in black corresponds to the first ground fault, and the moment in red corresponds to the second ground fault. The recording wave data are excluded during the two grounding intervals, so the waveform is shown as a horizontal line segment during this period.
Figure 19. Field recording wave data. Among them, the transient zero-sequence current of each line, when two groundings occur in the I bus of the ZB substation, is shown in Table 8.
Energies 17 00950 g019aEnergies 17 00950 g019b
It can be seen that when the first grounding occurs, line 171’s transient zero-sequence current amplitude is the most significant and exhibits polarity with other lines; when the second grounding occurs, line 167’s transient zero-sequence current amplitude is the largest and exhibits polarity with other lines; the transient quantity method correctly elected the two grounding lines. Another two successive grounding fault calculation results are similar to this, but are no longer repeated; the specific results are shown in Table 9 and Table 10.

7. Conclusions

The transient quantity method can detect most of the CTSGs. However, it cannot handle the occurrence of intensive successive faults, and the presence of previous ground faults may weaken the transient characteristics of subsequent grounded lines, so the steady-state quantity method is needed to supplement it. The steady-state quantity method can be detected after the line has tripped again, but not for intermittent arcing ground faults, and zero-sequence current transformer accuracy has specific requirements.
The CTSG detection method prioritizes the transient quantity method and is supplemented by the steady-state quantity method. Some lines are tripped and then continuously detected again. For cycle numbers exceeding the set value and still unable to remove all the faulty lines, they are tripped one by one from the largest to the smallest according to their degree of closeness to the steady-state quantity method criterion. The method has been verified by PSCAD simulation and a full-scale test and successfully detected three occurrences of CTSGs in the actual distribution network.

Author Contributions

Y.W.: Conceptualization, Methodology. Software, Original Draft, Review & Editing; J.L.: Conceptualization, Methodology; Z.Z.: Formal analysis, Data Curation, Visualization. S.R.: Data Curation, Visualization. All authors have read and agreed to the published version of the manuscript.

Funding

This work was supported in part by Shaanxi Electric Power Co., Ltd., Of State Grid (5226KY23001C).

Data Availability Statement

Data available on request from the authors.

Conflicts of Interest

The authors declare that they have no known competing financial interests or personal relationships that could have appeared to influence the work reported in this paper.

Appendix A

Appendix A.1. Recording Data of SP-CTSGs and DP-CTSGs

As shown in Figure A1, which presents the full-scale teat field testing data, the occurrence of an SP-CTSG, the two faults’ grounding resistances at 100 Ω, and the phase angle at grounding are the same.
Figure A1. Recording of SP-CTSG.
Energies 17 00950 g0a1
It can be seen that the second grounding line’s transient zero-sequence voltage derivative and transient zero-sequence current polarity are opposite, in line with the fault line characteristics, and the first grounding line’s and non-fault line’s transient zero-sequence voltage derivative and transient zero-sequence current polarity are the same. Ideally, under the first ground fault, the transient quantity method can allow the subsequent fault lines to be selected in sequence.
As shown in Figure A2 of the full-scale teat field testing data, the occurrence of a DP-CTSG, the two faults’ grounding resistance at 100 Ω, and the phase angle at grounding is the same; it can be seen that the second grounding line’s transient zero-sequence voltage derivative and transient zero-sequence current polarity are opposite, which is in line with the fault line characteristics; and the first grounding line’s and non-fault line’s transient zero-sequence voltage derivative and transient zero-sequence current polarity is the same. Ideally, under the first ground fault, the transient quantity method can allow the subsequent fault lines to be selected in sequence.
Figure A2. Recording of DP-CTSG.
Energies 17 00950 g0a2

Appendix A.2. Process for Deriving the Relationship between Bus’s Zero-Sequence Voltage and Grounding Resistance Rf

The steady-state zero-sequence equivalent circuit of the system, when single-phase grounding occurs, is shown in Figure A3. L is the arc suppression coil inductance, CΣ is the total system capacitance to ground, L′ is the equivalent inductance in the dashed box, RL is the equivalent parallel damping resistance, and Rf is the grounding resistance. E ˙ is the equivalent zero-sequence voltage source. U ˙ 0 is the bus’s zero-sequence voltage. I ˙ f is the residual flow of the fault point.
Figure A3. Zero-sequence steady-state equivalent circuit in the event of single-phase grounding.
Energies 17 00950 g0a3
Figure A3a shows the steady-state equivalent circuit with metallic grounding, where the damping resistors have been separated; Figure A3b shows the steady-state equivalent circuit under the condition that the damping resistors are not separated.
In the case of metallic grounding, let the arc suppression coil compensate the residual current so that it is no more significant than the overcompensation degree λ, so for the most unfavorable, the following applies:
ω L = E ˙ λ I C Σ
where I C Σ is the system capacitance’s current amplitude at the rated zero-sequence voltage.
Let the damping rate at the rated zero-sequence voltage be d; then, the damping resistance RL is
R L = E ˙ d I C Σ
The zero-sequence voltage under the condition that the damping resistor is not separated is
U ˙ 0 = E ˙ 2 ( E ˙ + d I C Σ R f ) 2 + λ 2 I C Σ 2 R f 2

References

  1. Xiao, Y.; Ouyang, J.; Xiong, X.; Wang, Y.; Luo, Y. Fault protection method of single-phase break for distribution network considering the influence of neutral grounding modes. Prot. Control Mod. Power Syst. 2020, 5, 10. [Google Scholar] [CrossRef]
  2. Zhang, F.; Xue, Y.; Li, G.; Xu, B. A Method for Measuring and Adjusting the Detuning of Resonant Grounding Systems with Transient Information After Arc Extinction. IEEE Trans. Power Deliv. 2022, 38, 496–504. [Google Scholar] [CrossRef]
  3. Tang, J.; Xiong, B.; Li, Y.; Yuan, C.; Qiu, Y. Faulted Feeder Identification Based on Active Adjustment of Arc Suppression Coil and Similarity Measure of Zero-Sequence Currents. IEEE Trans. Power Deliv. 2021, 36, 3903–3913. [Google Scholar] [CrossRef]
  4. Zhang, Z.; Liu, J.; Shao, W.; Wang, Y. Fault line selection using multiple disturbance characteristics of fault phase active grounding in resonant grounded distribution networks. Int. J. Electr. Power Energy Syst. 2022, 138, 107931. [Google Scholar] [CrossRef]
  5. Guo, M.-F.; Cai, W.-Q.; Zheng, Z.-Y.; Wang, H. Fault Phase Selection Method Based on Single-Phase Flexible Arc Suppression Device for Asymmetric Distribution Networks. IEEE Trans. Power Deliv. 2022, 37, 4548–4558. [Google Scholar] [CrossRef]
  6. Li, Z.; Ye, Y.; Ma, X.; Lin, X.; Xu, F.; Wang, C.; Ni, X.; Ding, C. Single-phase-to-ground fault section location in flexible resonant grounding distribution networks using soft open points. Int. J. Electr. Power Energy Syst. 2020, 122, 106198. [Google Scholar] [CrossRef]
  7. Huang, C.; Tang, T.; Jiang, Y.; Hua, L.; Hong, C. Faulty feeder detection by adjusting the compensation degree of arc-suppression coil for distribution network. IET Gener. Transm. Distrib. 2018, 12, 807–814. [Google Scholar] [CrossRef]
  8. Chen, J.; Li, H.; Deng, C.; Wang, G. Detection of Single-Phase to Ground Faults in Low-Resistance Grounded MV Systems. IEEE Trans. Power Deliv. 2020, 36, 1499–1508. [Google Scholar] [CrossRef]
  9. Wang, X.; Du, H.; Gao, J.; Wei, X.; Liang, Z.; Guo, L.; Liu, W. Grounding fault location method of overhead line based on dual-axis magnetic field trajectory. Prot. Control Mod. Power Syst. 2023, 8, 4. [Google Scholar] [CrossRef]
  10. Granizo Arrabe, R.; Granados, J.M.G.; Gomez, F.A.; Gaona, C.A.P. New Selective Directional Ground Fault Protection Method for Ungrounded Systems. IEEE Trans. Power Deliv. 2022, 37, 5234–5243. [Google Scholar] [CrossRef]
  11. Xue, Y.; Chen, X.; Song, H.; Xu, B. Resonance Analysis and Faulty Feeder Identification of High-Impedance Faults in a Resonant Grounding System. IEEE Trans. Power Deliv. 2017, 32, 1545–1555. [Google Scholar] [CrossRef]
  12. Wei, X.; Wang, X.; Gao, J.; Yang, D.; Wei, K.; Guo, L.; Wei, Y. Faulty Feeder Identification Method Considering Inverter Transformer Effects in Converter Dominated Distribution Network. IEEE Trans. Smart Grid 2022, 14, 939–953. [Google Scholar] [CrossRef]
  13. Wei, M.; Shi, F.; Zhang, H.; Chen, W. Wideband Synchronous Measurement-Based Detection and Location of High Impedance Fault for Resonant Distribution Systems with Integration of DERs. IEEE Trans. Smart Grid 2022, 14, 1117–1134. [Google Scholar] [CrossRef]
  14. Wang, B.; Cui, X. Nonlinear Modeling Analysis and Arc High-Impedance Faults Detection in Active Distribution Networks With Neutral Grounding via Petersen Coil. IEEE Trans. Smart Grid 2022, 13, 1888–1898. [Google Scholar] [CrossRef]
  15. Wei, X.; Wang, X.; Gao, J.; Yang, D.; Wei, K.; Guo, L. Faulty Feeder Detection for Single-Phase-to-Ground Fault in Distribution Networks Based on Transient Energy and Cosine Similarity. IEEE Trans. Power Deliv. 2022, 37, 3968–3979. [Google Scholar] [CrossRef]
  16. Wei, M.; Zhang, H.; Shi, F.; Chen, W.; Terzija, V. Nonlinearity Characteristic of High Impedance Fault at Resonant Distribution Networks: Theoretical Basis to Identify the Faulty Feeder. IEEE Trans. Power Deliv. 2021, 37, 923–936. [Google Scholar] [CrossRef]
  17. Wang, Y.; Liu, J.; Zhang, Z.; Zheng, T.; Ren, S.; Chen, J. A faulty line detection method for single phase-to-ground fault in resonant grounding system with CTs reversely connected. Int. J. Electr. Power Energy Syst. 2023, 147, 108873. [Google Scholar] [CrossRef]
  18. Wang, X.; Gao, J.; Wei, X.; Guo, L.; Song, G.; Wang, P. Faulty Feeder Detection Under High Impedance Faults for Resonant Grounding Distribution Systems. IEEE Trans. Smart Grid 2022, 14, 1880–1895. [Google Scholar] [CrossRef]
  19. Wang, X.; Liu, W.; Liang, Z.; Guo, L.; Du, H.; Gao, J.; Li, C. Faulty feeder detection based on the integrated inner product under high impedance fault for small resistance to ground systems. Int. J. Electr. Power Energy Syst. 2022, 140, 108078. [Google Scholar] [CrossRef]
  20. Yuan, J.; Hu, Y.; Liang, Y.; Jiao, Z. Faulty Feeder Detection for Single Line-to-Ground Fault in Distribution Networks with DGs Based on Correlation Analysis and Harmonics Energy. IEEE Trans. Power Deliv. 2022, 38, 1020–1029. [Google Scholar] [CrossRef]
  21. Pandakov, K.; Høidalen, H.K.; Trætteberg, S. An additional criterion for faulty feeder selection during ground faults in compensated distribution networks. IEEE Trans. Power Deliv. 2018, 33, 2930–2937. [Google Scholar] [CrossRef]
  22. Li, Z.; Wan, J.; Wang, P.; Weng, H.; Li, Z. A novel fault section locating method based on distance matching degree in distribution network. Prot. Control Mod. Power Syst. 2021, 6, 20. [Google Scholar] [CrossRef]
  23. Busik, M.A.; Gargoom, A.; Mahmud, M.A.; Haque, M.E.; Al-Khalidi, H.; Than Oo, A.M. A decentralized fault detection technique for detecting single phase to ground faults in power distribution systems with resonant grounding. IEEE Trans. Power Deliv. 2018, 33, 2462–2473. [Google Scholar]
  24. Bhandia, R.; Chavez, J.D.J.; Cvetkovic, M.; Palensky, P. High Impedance Fault Detection using Advanced Distortion Detection Technique. IEEE Trans. Power Deliv. 2020, 35, 2598–2611. [Google Scholar] [CrossRef]
  25. Wei, X.; Yang, D.; Wang, X.; Wang, B.; Gao, J.; Wei, J. Faulty Feeder Detection Based on Fundamental Component Shift and Multiple-Transient-Feature Fusion in Distribution Networks. IEEE Trans. Smart Grid 2020, 12, 1699–1711. [Google Scholar] [CrossRef]
  26. Deng, F.; Zeng, X.; Pan, L. Research on multi-terminal traveling wave fault location method in complicated networks based on cloud computing platform. Prot. Control Mod. Power Syst. 2017, 2, 19. [Google Scholar] [CrossRef]
  27. Wang, X.; Gao, J.; Wei, X.; Zeng, Z.; Wei, Y.; Kheshti, M. Single Line to Ground Fault Detection in a Non-Effectively Grounded Distribution Network. IEEE Trans. Power Deliv. 2018, 33, 3173–3186. [Google Scholar] [CrossRef]
  28. Wang, Q.; Jin, T.; Mohamed, M.A.; Deb, D. A Novel Linear Optimization Method for Section Location of Single-Phase Ground Faults in Neutral Noneffectively Grounded Systems. IEEE Trans. Instrum. Meas. 2021, 70, 3513410. [Google Scholar] [CrossRef]
  29. Deng, F.; Zhong, Y.; Zeng, Z.; Zu, Y.; Zhang, Z.; Huang, Y.; Feng, S.; Zeng, X. A Single-Ended Fault Location Method for Transmission Line Based on Full Waveform Features Extractions of Traveling Waves. IEEE Trans. Power Deliv. 2023, 38, 2585–2595. [Google Scholar] [CrossRef]
  30. Wang, X.; Zhang, H.; Shi, F.; Wu, Q.; Terzija, V.; Xie, W.; Fang, C. Location of Single Phase to Ground Faults in Distribution Networks Based on Synchronous Transients Energy Analysis. IEEE Trans. Smart Grid 2019, 11, 774–785. [Google Scholar] [CrossRef]
  31. Ni, Y.; Zeng, X.; Liu, Z.; Yu, K.; Xu, P.; Wang, Z.; Zhuo, C.; Huang, Y. Faulty feeder detection of single phase-to-ground fault for distribution networks based on improved K-means power angle clustering analysis. Int. J. Electr. Power Energy Syst. 2022, 142, 108252. [Google Scholar] [CrossRef]
  32. Wang, X.; Gao, J.; Wei, X.; Song, G.; Wu, L.; Liu, J.; Zeng, Z.; Kheshti, M. High Impedance Fault Detection Method Based on Variational Mode Decomposition and Teager–Kaiser Energy Operators for Distribution Network. IEEE Trans. Smart Grid 2019, 10, 6041–6054. [Google Scholar] [CrossRef]
  33. Wang, X.; Wei, X.; Gao, J.; Song, G.; Kheshti, M.; Guo, L. High-Impedance Fault Detection Method Based on Stochastic Resonance for a Distribution Network with Strong Background Noise. IEEE Trans. Power Deliv. 2021, 37, 1004–1016. [Google Scholar] [CrossRef]
  34. Jamali, S.; Bahmanyar, A.; Ranjbar, S. Hybrid classifier for fault location in active distribution networks. Prot. Control Mod. Power Syst. 2020, 5, 17. [Google Scholar] [CrossRef]
  35. Wang, X.; Zhang, F.; Wei, X.; Gao, J.; Guo, L.; Wang, Y. Fault location of flexible grounding distribution system based on multivariate modes and kurtosis calibration. Int. J. Electr. Power Energy Syst. 2023, 150, 109108. [Google Scholar] [CrossRef]
  36. Gao, J.; Wang, X.; Wang, X.; Yang, A.; Yuan, H.; Wei, X. A High-Impedance Fault Detection Method for Distribution Systems Based on Empirical Wavelet Transform and Differential Faulty Energy. IEEE Trans. Smart Grid 2021, 13, 900–912. [Google Scholar] [CrossRef]
Figure 1. Cross-line two-point successive grounding faults.
Energies 17 00950 g001
Figure 2. Transient equivalent circuit of CTSG under significant line impedance.
Energies 17 00950 g002
Figure 3. Transient equivalent circuit of CTSG.
Energies 17 00950 g003
Figure 4. Simplified transient equivalent circuit for CTSG.
Energies 17 00950 g004
Figure 5. Transient current of CTSG.
Energies 17 00950 g005aEnergies 17 00950 g005b
Figure 6. Steady-state equivalent circuit in case of ground fault.
Energies 17 00950 g006
Figure 7. Steady-state equivalent circuit for CTSG.
Energies 17 00950 g007
Figure 8. Simplified steady-state equivalent circuit at CTSG.
Energies 17 00950 g008
Figure 9. The circuit of DP-CTSG after equivalence.
Energies 17 00950 g009
Figure 10. CTSG selection method.
Energies 17 00950 g010
Figure 11. Current and voltage phase’s relationship.
Energies 17 00950 g011
Figure 12. Typical distribution network simulation model.
Energies 17 00950 g012
Figure 13. Emanuel arc model.
Energies 17 00950 g013
Figure 14. Zero-sequence current of each line under condition ①.
Energies 17 00950 g014
Figure 15. Zero-sequence current of each line under condition ②.
Energies 17 00950 g015
Figure 16. The 10 kV full-scale test field wiring.
Energies 17 00950 g016
Figure 17. Scenario 4’s recorded waveform data.
Energies 17 00950 g017
Figure 18. Scenario 8’s recorded waveform data.
Energies 17 00950 g018
Table 1. Line parameters.
LinePhase SequenceR (Ω/km)L (mH/km)C (μF/km)
Cable linePositive sequence0.27000.25500.3390
Zero-sequence2.70001.01900.2800
Overhead
line
Positive sequence0.17001.21000.0097
Zero-sequence0.23005.47800.0080
Table 2. High-impedance fault parameters.
Arc TypesVρVρRpRp
Cement4.5 ± 10% kV2.0 ± 20% kV800 Ω750 Ω
Dry grass3.8 ± 10% kV3.6 ± 10% kV400 Ω350 Ω
Wet grass1.2 ± 10% kV1.0 ± 10% kV1200 Ω1100 Ω
Table 3. Simulation verification under condition ①.
Initial
Phase
Angle
1st Fault2nd FaultTransient Current
at 1st Fault/A
[L1 L2 L3 L4]
Transient Current
at 2nd Fault/A
[L1 L2 L3 L4]
Transient
Method
Results
Phase Ahead
at Steady-State
[L1 L2 L3 L4]
Steady-State
Method
Results
Wheel
Cut
L3 1500 Ω BL2 1000 Ω A[3.58 1.99 −5.18 0.43][−12.60 −6.00 −5.88 −0.70]L3[85.38° 105.36°/86.41°]L2/
L2 2000 Ω AL1 1000 Ω A[−1.11 1.53 −1.3 −0.21][−8.83 −7.3 −3.7 −0.43]L2[98.05°/88.56° 89.43°]L1/
L3 2000 Ω AL2 500 Ω C[−0.43 −1.85 1.33−0.16][−11.37 −7.72 −4.87 −0.73]L3[83.33° 99.85°/84.78°]L2/
30°L3 1500 Ω AL2 3000 Ω B[−0.94 −3.66 4.75 −0.36][−8.99 −10.95 2.21 −0.25]L3[92.61° 93.12°/91.82°]/L2
30°L2 1000 Ω BL1 500 Ω A[−0.11 5.31 −5.03 −0.41][−0.21 −22.31 −5.88 −0.7]L2[94.37°/91.51°92.92°]L1/
30°L4 100 Ω CL2 500 Ω A[12.52 10.79 4.09 −37.54][42.31 33.33 5.89 −9.19]L4[88.34° 100.4° 89.67°/]L2/
60°L4 500 Ω BL2 1000 Ω B[0.39 4.49 4.5 −10.25][−14.28 −13.61 −5.42 −1.71]L4[89.64° 94.99° 91.17°/]L2/
60°L3 2000 Ω CL2 1000 Ω A[0.44 1.056 −2.34 0.17][9.41 15.37 −3.68 0.035]L3[88.11° 102°/89.65°]L2/
60°L3 300 Ω AL2 1300 Ω A[−5.11 −20.1 25.84 −1.91][−1.81 −0.98 4.4 −0.06]L3[88.56° 92.03°/89.91°]/L2
90°L4 1500 Ω BL3 100 Ω A[−0.1 −0.55 −0.19 0.86][−44.76 −21.63 48.54 −2.69]L4, L3///
90°L4 100 Ω AL2 100 Ω A[−5.03 −44.33 −27.81 63.48][13.5 14.54 5.14 2.17]L4[88.26° 100.88° 89.59°/]L2/
Table 4. Simulation verification under condition ②.
Initial
Phase
Angle
1st Fault2nd FaultTransient Current
at 1st Fault/A
[L1 L2 L3 L4]
Transient Current
at 2nd Fault/A
[L1 L2 L3 L4]
Transient
Method
Results
Phase Ahead
at Steady-State
[L1 L2 L3 L4]
Steady-State
Method
Results
Wheel
Cut
L2 Cement CL3 Wet grass A[−0.21 −2.99 5.27 −0.43][0.23 4.36 9.87 0.55]L3[90.59° 127.49°/88.42°]L2/
30°L2 Cement BL3 Dry grass C[0.36 −5.52 4.73 0.70][−0.17 −13.93 −3.29 −0.39]L2[89.62°/93.99° 90.06°]L3/
60°L2 Dry grass AL3 Wet grass A[−0.04 7.33 −6.26 −1.01][0.59 11.22 7.48 0.10]L2[76.47°/94.30° 76.54°]L3/
90°L2 Dry grass BL3 Wet grass C[−0.05 5.88 −1.55 −0.32][0.42 5.43 −8.95 1.08]L2, L3///
L1 Cement AL4 Cement B[3.94 −3.98 −1.95 −0.27][1.96 16.29 8.01 −14.5]L1, L4///
30°L1 Cement AL4 Dry grass C[8.85 −7.34 −4.00 −0.37][6.51 9.26 3.99 −2.64]L1, L4///
60°L1 Cement BL4 Wet grass C[−3.85 1.75 1.90 0.14][−3.98 −1.41 −2.92 −6.03]L1[/81.58° 89.03° 91.19°]L4/
90°L1Dry grass CL4 Wet grass C[−7.54 4.21 1.82 0.33][−1.22 −6.91 −2.45 −1.06]L1[/99.87° 80.70° 100.88°]L4/
L2 Cement AL4 Cement B[−0.16 2.29 −1.94 −0.14][0.10 6.84 2.14 1.26]L2[85.27°/89.88° 188.85°]L4/
30°L2 Cement AL4 Dry grass C[−0.13 1.90 −1.61 −0.12][0.04 4.30 0.97 1.44]L2[85.39°/89.76° 193.70°]L4/
60°L2 Cement BL4 Wet grass C[0.46 −6.39 5.48 0.85][−0.38 −18.13 −5.14 4.58]L2, L4///
90°L2 Dry grass CL4 Wet grass C[−0.01 4.27 −0.60 −0.21][0.46 6.14 3.43 −11.18]L2, L4///
Table 5. Simulation verification under condition ③.
Initial
Phase
Angle
1st Fault2nd FaultTransient Current
at 1st Fault/A
[L1 L2 L3 L4]
Transient Current
at 2nd Fault/A
[L1 L2 L3 L4]
Transient
Method
Results
Phase Ahead
at Steady-State
[L1 L2 L3 L4]
Steady-State
Method
Results
Wheel
Cut
90°L2 Wet grass AL2 750 Ω C[0.28 −4.44 0.61 0.27][0.20 6.78 8.39 0.28]L2[61.57°/94.61° 60.04°]L3/
L1 Dry grass AL2 1000 Ω B[9.74 −5.12 −1.86 −0.35][12.23 1.61 3.06 0.78]L1[/105.85° 86.32° 86.38°]L2/
30°L2 Dry grass BL3 2000 Ω A[0.42 −6.40 5.39 0.43][−0.16 −17.01 0.90 −0.73]L2, L3///
60°L3 Dry grass CL1 500 Ω B[0.31 5.67 −7.24 0.14][23.16 −18.76 −9.91 −2.16]L3, L1///
90°L4 Dry grass AL1 750 Ω C[0.10 3.26 1.57 −3.08][−9.71 12.28 4.27 7.79]L4, L1///
L1 Cement AL2 2500 Ω B[7.42 −3.57 −1.42 −0.33][7.21 5.38 2.66 0.54]L1[/91.37° 78.29° 79.92°]/L2
30°L2 Cement BL3 1500 Ω C[0.35 −5.25 4.50 0.66][−0.22 −11.19 −3.77 −0.12]L2[82.74°/109.72° 82.14°]L3/
60°L3 Cement CL4 2000 Ω A[0.13 3.22 −3.39 0.28][−0.37 −8.06 −6.48 6.92]L3, L4///
90°L4 Cement AL1 750 Ω B[−0.33 −3.78 −4.20 8.39][11.72 −2.65 −0.83 −0.25]L4, L1///
L1 Wet grass AL3 1000 Ω B[4.39 −2.03 −2.20 −0.17][2.03 11.6 −7.84 0.98]L1, L3///
30°L2 Wet grass BL1 750 Ω B[0.29 −4.51 3.83 0.29][−10.21 −5.11 −1.11 −1.12]L1[95.73°/80.45° 83.73°]L1/
60°L3 Wet grass CL2 1500 Ω B[0.23 2.66 −3.17 0.23][−0.61 −11.00 −0.01 −0.77]L3[83.73° 92.72°/82.78°]/L2
Table 6. Simulation verification under condition ④.
Initial
Phase
Angle
1st Fault2nd FaultTransient Current
at 1st Fault/A
[L1 L2 L3 L4]
Transient Current
at 2nd Fault/A
[L1 L2 L3 L4]
Transient
Method
Results
Phase Ahead
at Steady-State
[L1 L2 L3 L4]
Steady-State
Method
Results
Wheel
Cut
L1 750 Ω CL2 Wet grass A[8.36 −4.44 −2.11 −0.55][3.19 2.49 0.73 0.06]L1[80.08° 96.83°/87.07°]L2/
L1 1000 Ω BL4 Dry grass A[−11.00 4.71 4.13 0.41][−8.32 −10.05 −4.61 11.60] L1, L4///
L1 2000 Ω CL2 Dry grass B[3.11 −1.45 −1.54 −0.12][2.89 −4.47 6.69 0.55]L1, L2///
30°L2 500 Ω AL3 Dry grass C[−0.06 4.46 −2.83 −1.37][0.20 16.73 3.44 0.33]L2[65.92°/96.17° 62.19°]L3/
30°L2 750 Ω BL4 Dry grass A[0.46 −7.50 5.56 0.89][−0.48 −20.23 −6.21 30.97]L2, L4///
30°L2 1000 Ω CL1 Cement A[0.03 −0.14 0.14 0.01][6.42 −2.23 −5.44 −0.37]L2, L1///
60°L3 1000 Ω AL2 Cement B[−0.52 −6.13 7.23 −0.66][0.45 5.86 13.82 0.62]L3[46.27° 93.30 °/47.49°]/L2
60°L3 1500 Ω BL1 Cement C[0.05 1.92 −2.30 0.17][−6.84 −0.74 −1.10 7.29]L3, L4///
60°L3 2000 Ω CL4 Cement A[0.16 1.90 −2.17 0.21][−0.54 −7.92 −2.02 10.11]L3, L4///
90°L4 500 Ω AL1 Wet grass A[−0.26 −6.20 −1.69 8.05][0.62 −3.72 −1.58 −1.37]L4, L1///
90°L4 1000 Ω BL2 Wet grass B[0.42 4.34 1.56 −5.22][−12.15 13.11 −2.90 −6.59]L4, L2///
90°L4 1500 Ω CL3 Wet grass C[0.25 5.42 2.88 −6.47][0.15 −8.03 1.68 −3.47]L4[90.66° 85.75° 94.45°/]L3/
Table 7. The 10 kV full-scale test scenario.
No.Test ProjectF1/ΩF2/Ω
1The 2nd grounding occurs6060
2before the 1st grounding line603000
3trips (same phase)300060
4The 2nd grounding occurs602000
5before the 1st grounding line603000
6trips (different phase)300060
7The 2nd grounding occurs after6060
8the 1st grounding line trips603000
9(same phase)300060
10The 2nd grounding occurs after602000
11the 1st grounding line trips603000
12(different phase)300060
Table 8. Transient zero-sequence current of each line in case of a fault in the I bus of ZB substation.
Line No.Transient Zero-Sequence
Current for Each Line of
the 1st Ground Fault/A
Transient Zero-Sequence
Current for Each Line of
the 2nd Ground Fault/A
1630.876−0.272
1222.408−0.69
1651.553−0.388
1240.639−0.162
1250.589−0.224
1260.576−0.271
171−14.16−13.04
1281.923−0.51
1411.055−0.328
1342.238−0.65
1672.20714.15
Table 9. Transient zero-sequence current of each line in case of a fault in the III bus of WT substation.
rTransient Zero-Sequence
Current for Each Line of
the 1st Ground Fault/A
Transient Zero-Sequence
Current for Each Line of
the 2nd Ground Fault/A
1790.1190.353
1140.761−14.16
1150.3800.967
1890.4961.671
1930.4941.472
1780.5071.22
1800.1470.521
188−9.25212.49
1900.2890.68
Table 10. Transient zero-sequence current of each line in case of a fault in the II bus of ZB substation.
Line No.Transient Zero-Sequence
Current for Each Line of
the 1st Ground Fault/A
Transient Zero-Sequence
Current for Each Line of
the 2nd Ground Fault/A
188−0.941.398
139−0.4150.835
158−0.6161.124
161−0.9241.496
166−0.1620.322
14614.151.339
152−1.2341.684
173−0.8631.642
180−0.4380.709
184−0.6871.165
186−0.2940.544
145−0.703−13.93
172−0.5751.127
Disclaimer/Publisher’s Note: The statements, opinions and data contained in all publications are solely those of the individual author(s) and contributor(s) and not of MDPI and/or the editor(s). MDPI and/or the editor(s) disclaim responsibility for any injury to people or property resulting from any ideas, methods, instructions or products referred to in the content.

