Article

Forecasting End-of-Life Wind Turbine Material Flows in Australia under Various Wind Energy Deployment Scenarios

1
Faculty of Engineering & IT, University of Technology Sydney, P.O. Box 123, Broadway, NSW 2007, Australia
2
Institute for Sustainable Futures, University of Technology Sydney, P.O. Box 123, Broadway, NSW 2007, Australia
*
Author to whom correspondence should be addressed.
Energies 2024, 17(4), 914; https://doi.org/10.3390/en17040914
Submission received: 1 December 2023 / Revised: 10 January 2024 / Accepted: 8 February 2024 / Published: 15 February 2024
(This article belongs to the Section A3: Wind, Wave and Tidal Energy)

Abstract

:
A circular economy involves managing and reducing the environmental and social impacts of products and materials throughout their entire lifecycle, from production to end of life, including clean energy technologies. The remarkable growth of wind turbine (WT) deployment in Australia, as a clean energy source, is promising, with over 10 gigawatts (GW) installed by 2023. Responsible management of wind turbines throughout the entire supply chain, including their end of life, is crucial to prevent potential environmental issues caused by significant waste volumes and to identify opportunities for resource recovery. This study offers a comprehensive overview of current and future WT waste through material flow analysis (MFA) under five national wind energy deployment scenarios, considering various wind turbine technologies. The results indicate that the projected cumulative WT installation capacity will range from 13 to 38 GW by 2041. Consequently, the cumulative WT waste volume is expected to range between 6.69 and 19.76 million tonnes in 2060, depending on the scenario, with the “slow change” scenario producing the least waste and the “step change” scenario generating the most. The estimated waste stream will see a rapid increase from about 2028, encompassing a variety of materials, primarily concrete at 10.20 million tonnes, followed by 3.21 million tonnes of steel and 35.41 kt of copper by 2060. Additionally, valuable materials such as rare earth elements (REEs) and composites, despite their smaller quantities, have significant environmental, economic, and supply chain security implications. This substantial waste material presents an opportunity for resource recovery and underscores the importance of adopting a circular economy approach for wind energy systems.

1. Introduction

In recent decades, a combination of factors, including high oil prices, reduced costs of some renewable energy technologies (due to the emergence of large-scale manufacturing), and climate and energy policy innovation, has resulted in increasing deployment of renewable energy technologies, especially photovoltaic panels and wind turbines (WTs) [1]. There are currently more than 26,383 wind farms with a capacity of 2019.1 GW (as of October 2023) across the world [2]. The International Renewable Energy Agency (IRENA) has anticipated that by 2050, onshore and offshore wind turbine installations will reach 5044 GW and 1000 GW, respectively [3].
Although the generation of energy from wind supports a clean energy transition with a relatively low carbon emission footprint [4] and low cost [5], there are further opportunities to improve the environmental impact considering the entire technology lifecycle and supply chain, specifically the management of wind turbine waste at the end of life (EoL) [6].
Considering the major growth in wind energy around the world and the limited useful lifetime of about 20–30 years [7,8,9,10], understanding future wind turbine waste streams [11,12] is very important to avoid adverse environmental impacts [13,14] and economic opportunities for resource recovery [15,16,17]. Accordingly, scholars have started to estimate the wind turbine waste volumes in different parts of the world, which are summarized in Table 1.
At the end of life, wind turbines present a diverse mix of materials, each requiring specific treatments to recover valuable resources. While steel and other ferrous components can typically be recycled, the challenge lies in recycling the fiberglass blades due to their complex composite structure. Efforts are underway to develop innovative techniques to repurpose or recycle fiberglass for alternative applications. Concrete used in the foundation can be crushed and reused, contributing to sustainable construction practices [25]. Overall, the treatment of materials in wind turbines at the end of their life varies based on recyclability, local capabilities, and ongoing efforts to develop more sustainable disposal and recycling methods within the renewable energy industry.
One of the most challenging components at EoL are the blades which are manufactured from carbon or glass fiber composites. Recycling technology remains undeveloped for blades and secondary materials are significantly higher in cost compared with primary products. In other words, currently producing composites from recycled carbon or glass fiber is more expensive than production from origin fibers. Although manufacturing recyclable blades is an emerging technology [26], it is often assumed that composite materials will be landfilled with limited options for recycling [27,28]. Therefore, some scholars have focused on estimating the volume of composite waste. For example, Arias and Bank [29] estimated the total amount of composite waste from installed wind turbines until 2015 and predicted the yearly magnitude of composite waste generation from the wind energy sector until 2055 in the United States. Also, a comprehensive study by Liu and Barlow [11] estimated the overall amount of composite (blade) waste produced worldwide. Examining methods to handle blade waste with regard to their economic and environmental consequences is a crucial subject of study. As illustrated by recent (2023) studies for example Gennitsaris et al. [30] and Diez-Cañamero et al. [31] there is also growing attention to studying and critiquing regulative structures and strategies for incentivizing EoL blade composite management [32].
With nearly one percent of the global wind energy capacity as of late September 2023, Australia is the seventh country in the world in terms of generating electricity via wind turbines. According to the latest data, in 2022, Australia’s wind farms produced 32 percent of the overall clean energy in the country and provided 11% of Australia’s overall electricity by around 10.18 GW [33]. The data indicates that the wind power market in Australia is growing rapidly. The Australian Clean Energy Council, in the absence of any formal policy or legislation, suggests that wind farm owners should be responsible for decommissioning wind farms after their operational lifetime [34]. However, we are not aware of any established approaches to decommissioning wind farms. Hence, if not correctly managed, this could result in a large new waste stream with potentially adverse environmental impacts and a missed opportunities for resource recovery [17]. Therefore, in alignment with the researchers who study other renewable energy wastes in Australia, such as solar panels [35,36], this paper aims to characterize waste volumes of WTs by a new methodology for the case study of Australia for the first time.
In previous studies conducted globally, estimating materials within wind turbines relied on assumptions about the installed turbine models. Acknowledging the critical role that turbine type and model play in material identification, this study delves into the precise identification of each installed turbine model in the case study of Australia. By doing so we enhance the accuracy and reliability of waste estimation, providing a more detailed and dependable assessment of the materials involved in these turbines. Finally, the effect of repowering on waste generation was also investigated.
The study offers valuable insights for both government and industry in addressing the anticipated waste management challenge and minimizing impacts on the natural environment.
The structure of this paper is as follows: (1) a comprehensive database of Australian operational wind farms is presented, (2) next we introduce forecasts for wind energy development in Australia until 2041, (3) this is used to quantify the material composition considering generator technology, and finally (4) we undertake an MFA to estimate the waste flows including a detailed breakdown by material until 2060.

2. Materials and Methods

There are many different wind turbines with various features including size, capacity, and gear technology, and this impacts our estimation of waste volumes. The authors took into account the entire wind turbine, consisting of the tower, nacelle, rotor, and foundation, for estimating waste volumes. Some relatively minor waste streams (compared with EoL volumes) associated with the production process and maintenance were not considered [21]. This article only estimates the waste generated by onshore wind farms and does not include offshore wind turbines since there are currently no offshore wind farms in Australia. However, this might change in the future, resulting in some differences in the forecasting data. Figure 1 provides a graphical description of the research workflow and scenario settings. The green blocks demonstrate the waste generation model for the installed wind turbines until 2021, and the orange section presents the waste generation model for future installations after 2021 according to the projection scenarios.

2.1. Wind Turbine Generator Technology

There are two main wind turbine generator technologies, known as gearbox (GB) and direct drive (DD). These two types have different designs and performance and there are also different considerations at EoL. For example, DD technology is newer and commonly uses permanent magnets that contain rare earth elements instead of gearboxes, resulting in different needs for EoL management to recover these valuable materials. In general, the materials embedded in wind turbines include concrete, steel, plastic, glass/carbon composites, aluminum, boron, copper, iron, manganese, nickel, zinc, and rare earth elements. The most common types of DD generators are high-temperature superconductors (HTSs), electrically excited synchronous generators (EESGs), and permanent magnet synchronous generators (PMSGs). Also, GB generator types include the electrically excited synchronous generator (EESG), permanent magnet synchronous generator (PMSG), double-fed induction generator (DFIG), single-fed induction generator with full converter (SFIG), squirrel cage induction generator (SCIG) without full converter, squirrel cage induction generator (SCIG) with full converter, and wound rotor induction generator (WRIG) [37].

2.2. Wind Energy Development in Australia

Starting with only 2.02 MW capacity in 1993, Australia’s wind turbine installation has now reached more than 10 GW. There are 138 onshore wind farms in the country as of 2023. In this study, as the first step, we developed a comprehensive database including size, location, WT generator type, and the number of wind turbines installed in the wind farms. This data was compiled from TheWindPower [2], which is an online database providing statistics on wind farms, windfarm official websites, IRENA wind energy reports [3], and wind turbine manufacturer publications. Table 2 presents an example of the data available on this database.

2.3. Wind Energy Forecast up to 2041

Australia is transitioning from generating most of its energy from burning coal to using a variety of renewable energy sources. In 2020, the Australian Energy Market Operator (AEMO) [38] projected future wind energy development in Australia by introducing five scenarios based on three key factors: (1) the extent of distributed energy resource (DER) uptake including small-scale energy resources such as rooftop solar panels and battery storage, (2) the growth rate of energy demand, and (3) the extent of variable renewable energy (VRE) uptake including wind and solar energy at large scale. These five AEMO forecasting scenarios are “Step Change”, “High DER”, “Fast Change”, “Central”, and “Slow Change”. “Slow Change” is the most conservative, and “Step Change” is the most optimistic scenario. Figure 2 presents these five scenarios in a graphical view.

2.4. Wind Turbine Lifetime

To calculate the waste generated from EoL wind farms, it is necessary to know the useful lifetime of wind turbines after commissioning. Previous studies assume various fixed lifetimes; for example, Tazi et al. [18] have considered 15 years for French wind farms, while Cooperman et al. [23] and Delaney et al. [24] assumed a life span of 20 years. In this study we modeled three different lifetime scenarios of 15, 20, and 25 years to provide a range of possible estimations. However, a 20-year lifetime was chosen for the MFA calculations based on its more common usage in the literature and wind turbine producers’ documents referring to it as an average lifespan [39].

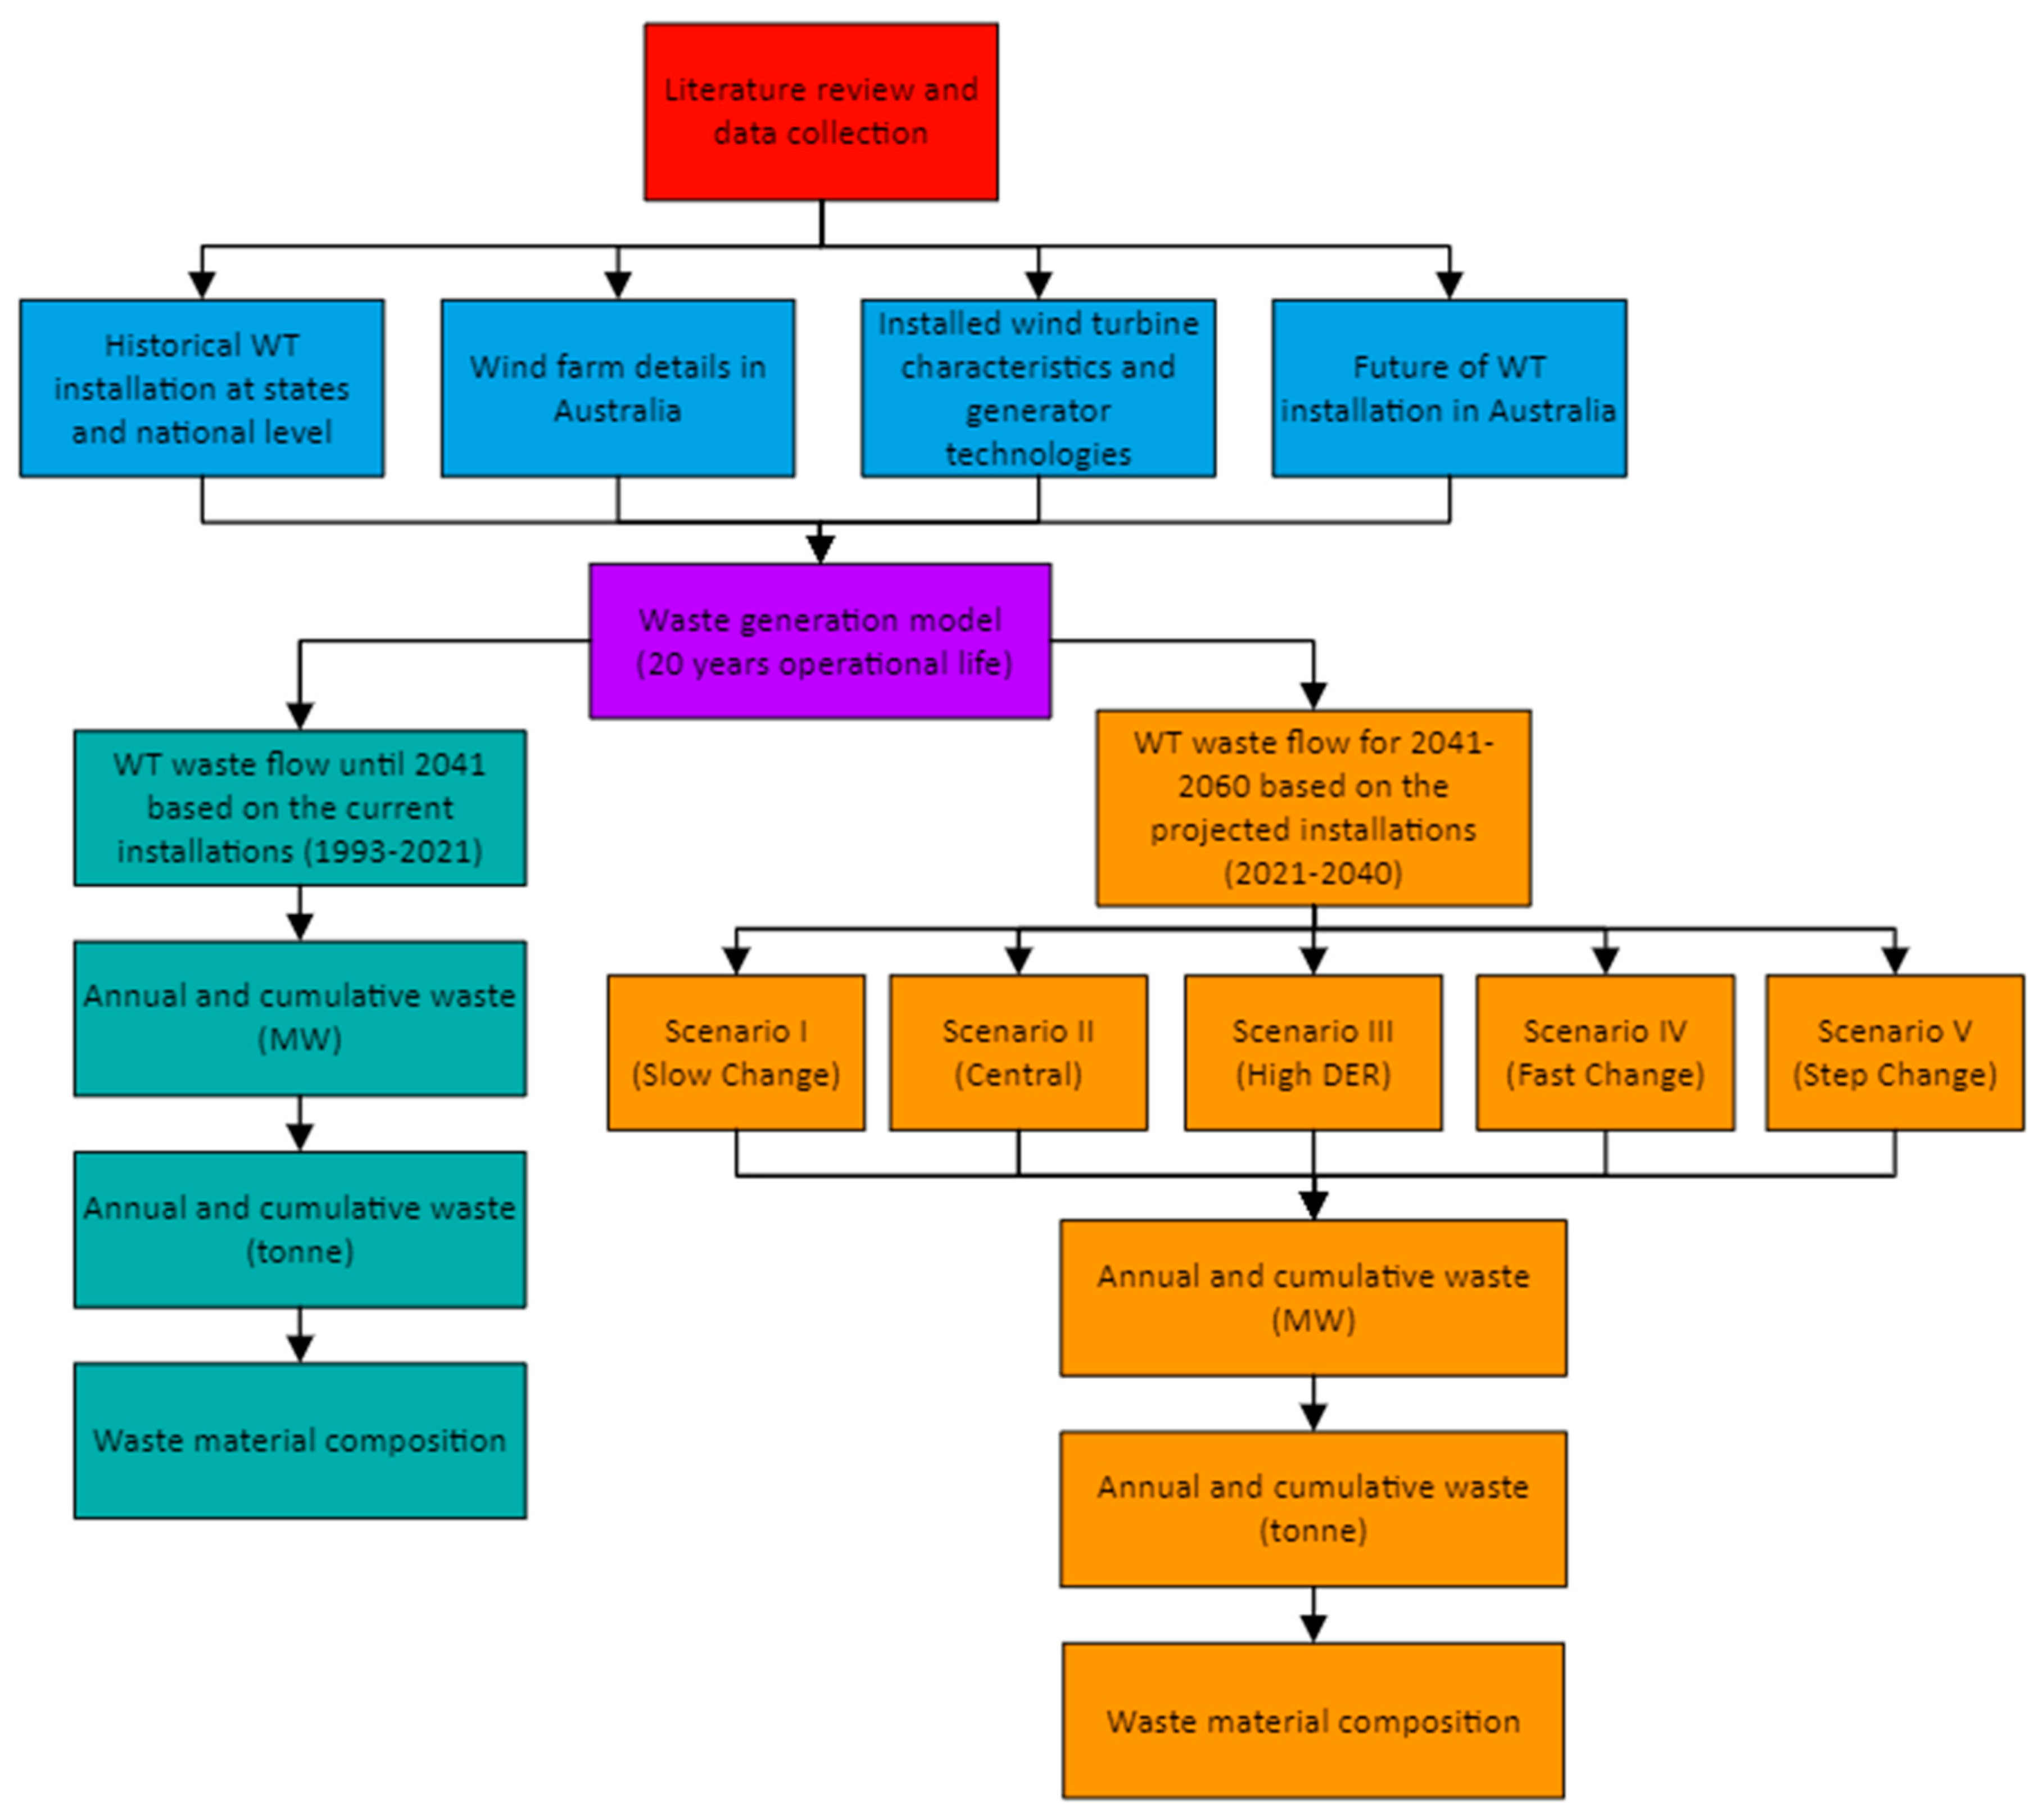
2.5. Material Flow Analysis

Material flow analysis (MFA) quantifies the flows and stocks of materials for a defined system in space [18] for a specific duration. There are numerous examples of MFAs applied to evaluate waste flows for wind turbines. For example, Tota-Maharaj et al. [19] and Chen et al. [21] assessed waste from discarded wind turbines over a period using MFA in the UK and Guangdong in China, respectively.
The approach can be described according to Equation (1), which shows how a mass balance is established considering materials stocks (fs), outputs from the system (fo), and input (fi) flows to the system [18].
f i = f o + f s
In this study, we employ the MFA method for measuring the amount of waste generated from Australian wind turbines installed in 1993–2021 and projected future installations until 2041. By utilizing a 20-year lifetime, the Australian wind turbines will be decommissioned from 2003–2060.
The mass of wind turbine components and their material breakdown were utilized to estimate the overall waste volumes. The methodology developed in this study is as follows:
  • Initially, the generator technology (different types of DD and GB generators) of each installed wind turbine in Australia was identified based on Section 2.2.
  • Total wind energy capacity in Australia until 2041 was categorized according to the available WT generator technologies.
  • The authors assumed that these turbines will be discarded after 20 years (discussed in Section 2.4), resulting in the annual and cumulative waste of Australian WTs in terms of MW until 2060.
  • Finally, a new formulation was developed to calculate the EoL wind turbine weight until 2060 according to Equation (1) and a technical report published by Carrara et al. [37] which provided essential information regarding the material composition of wind turbines. Hence, the total weight of the waste ( W w a s t e ) is calculated from the following:
    W w a s t e = i j W C i , j × C i                               i = 1 , , 5       &       j = 1 , , 14
In this equation, W stands for the weight (tonne), C stands for the wind turbine capacity (GW), i is the number of gear technology types, and j is the number of materials contained in wind turbines. W C i , j is obtained from [37], and C i is obtained from the collected database (Section 2.2). There are five major wind turbine types, namely DD-EESG, DD-PMSG, GB-SFIG, GB-DFIG, and GB-WRIG, in Australia, which will be considered in Equation (2) (i = 5). Also, 14 different materials (j = 14) constitute different parts of a wind turbine, namely concrete, steel, plastic, glass or carbon fiber composites, aluminum, boron, chromium, copper, rare earth elements (dysprosium, neodymium, praseodymium, terbium), iron, manganese, molybdenum, nickel, and zinc.

3. Results

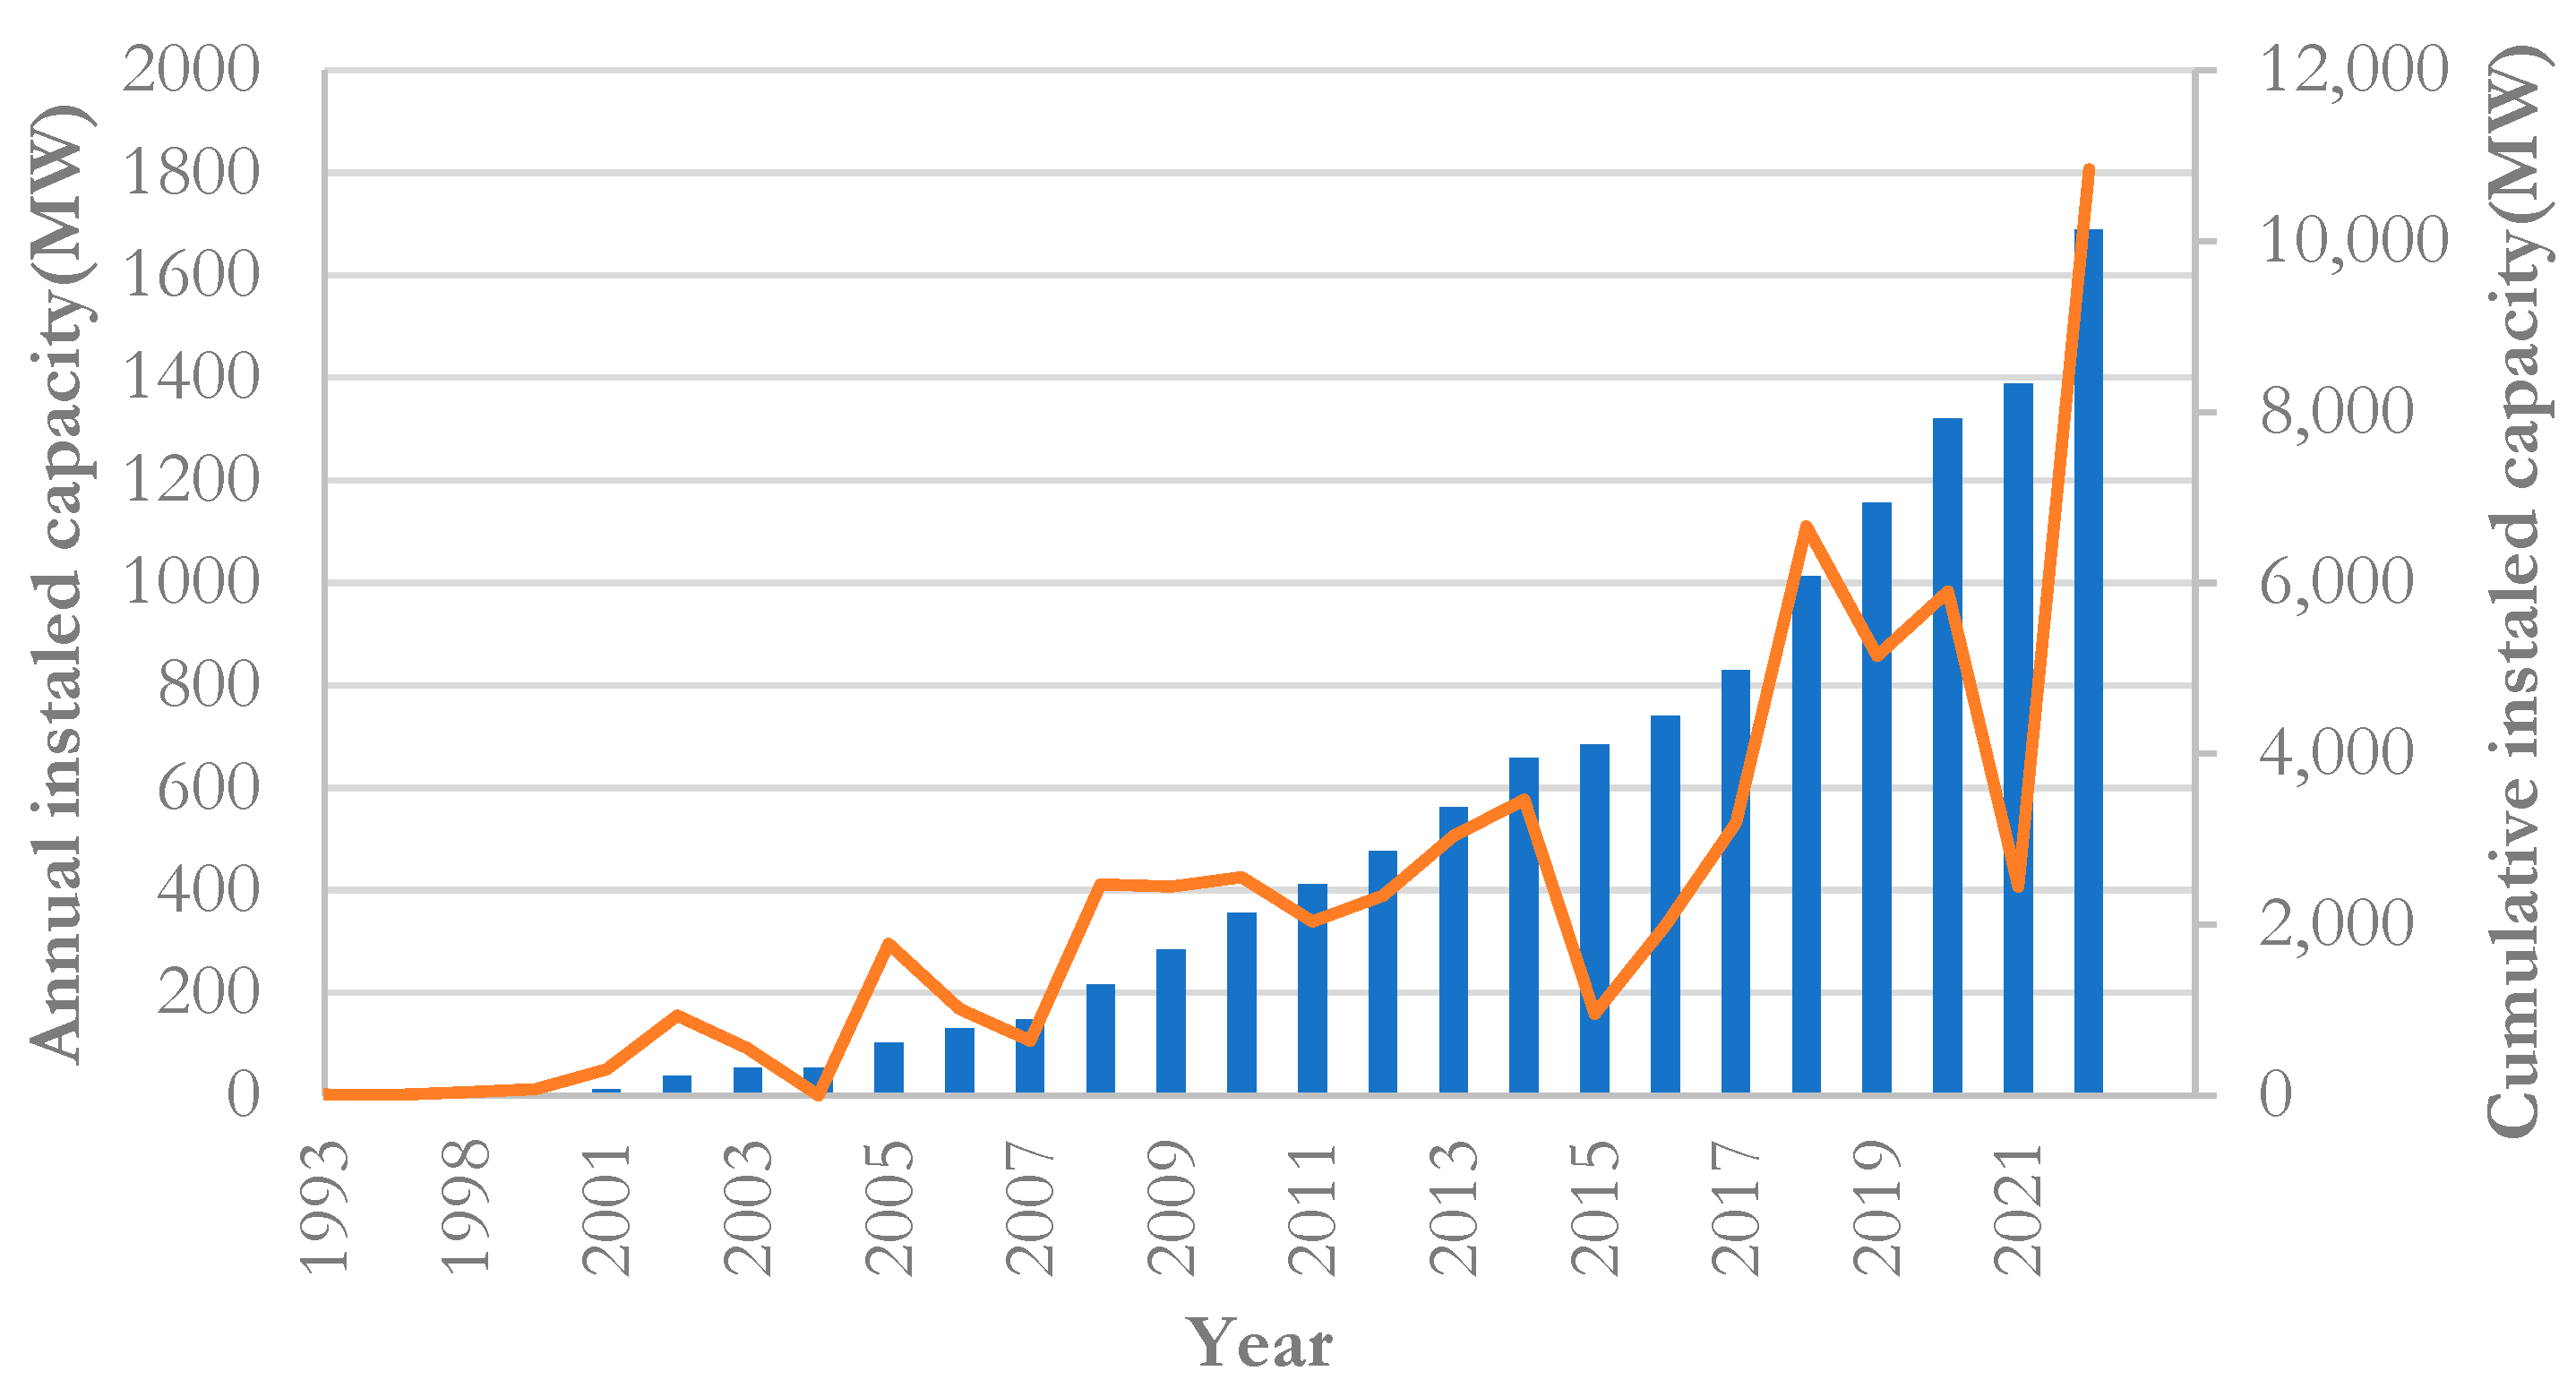
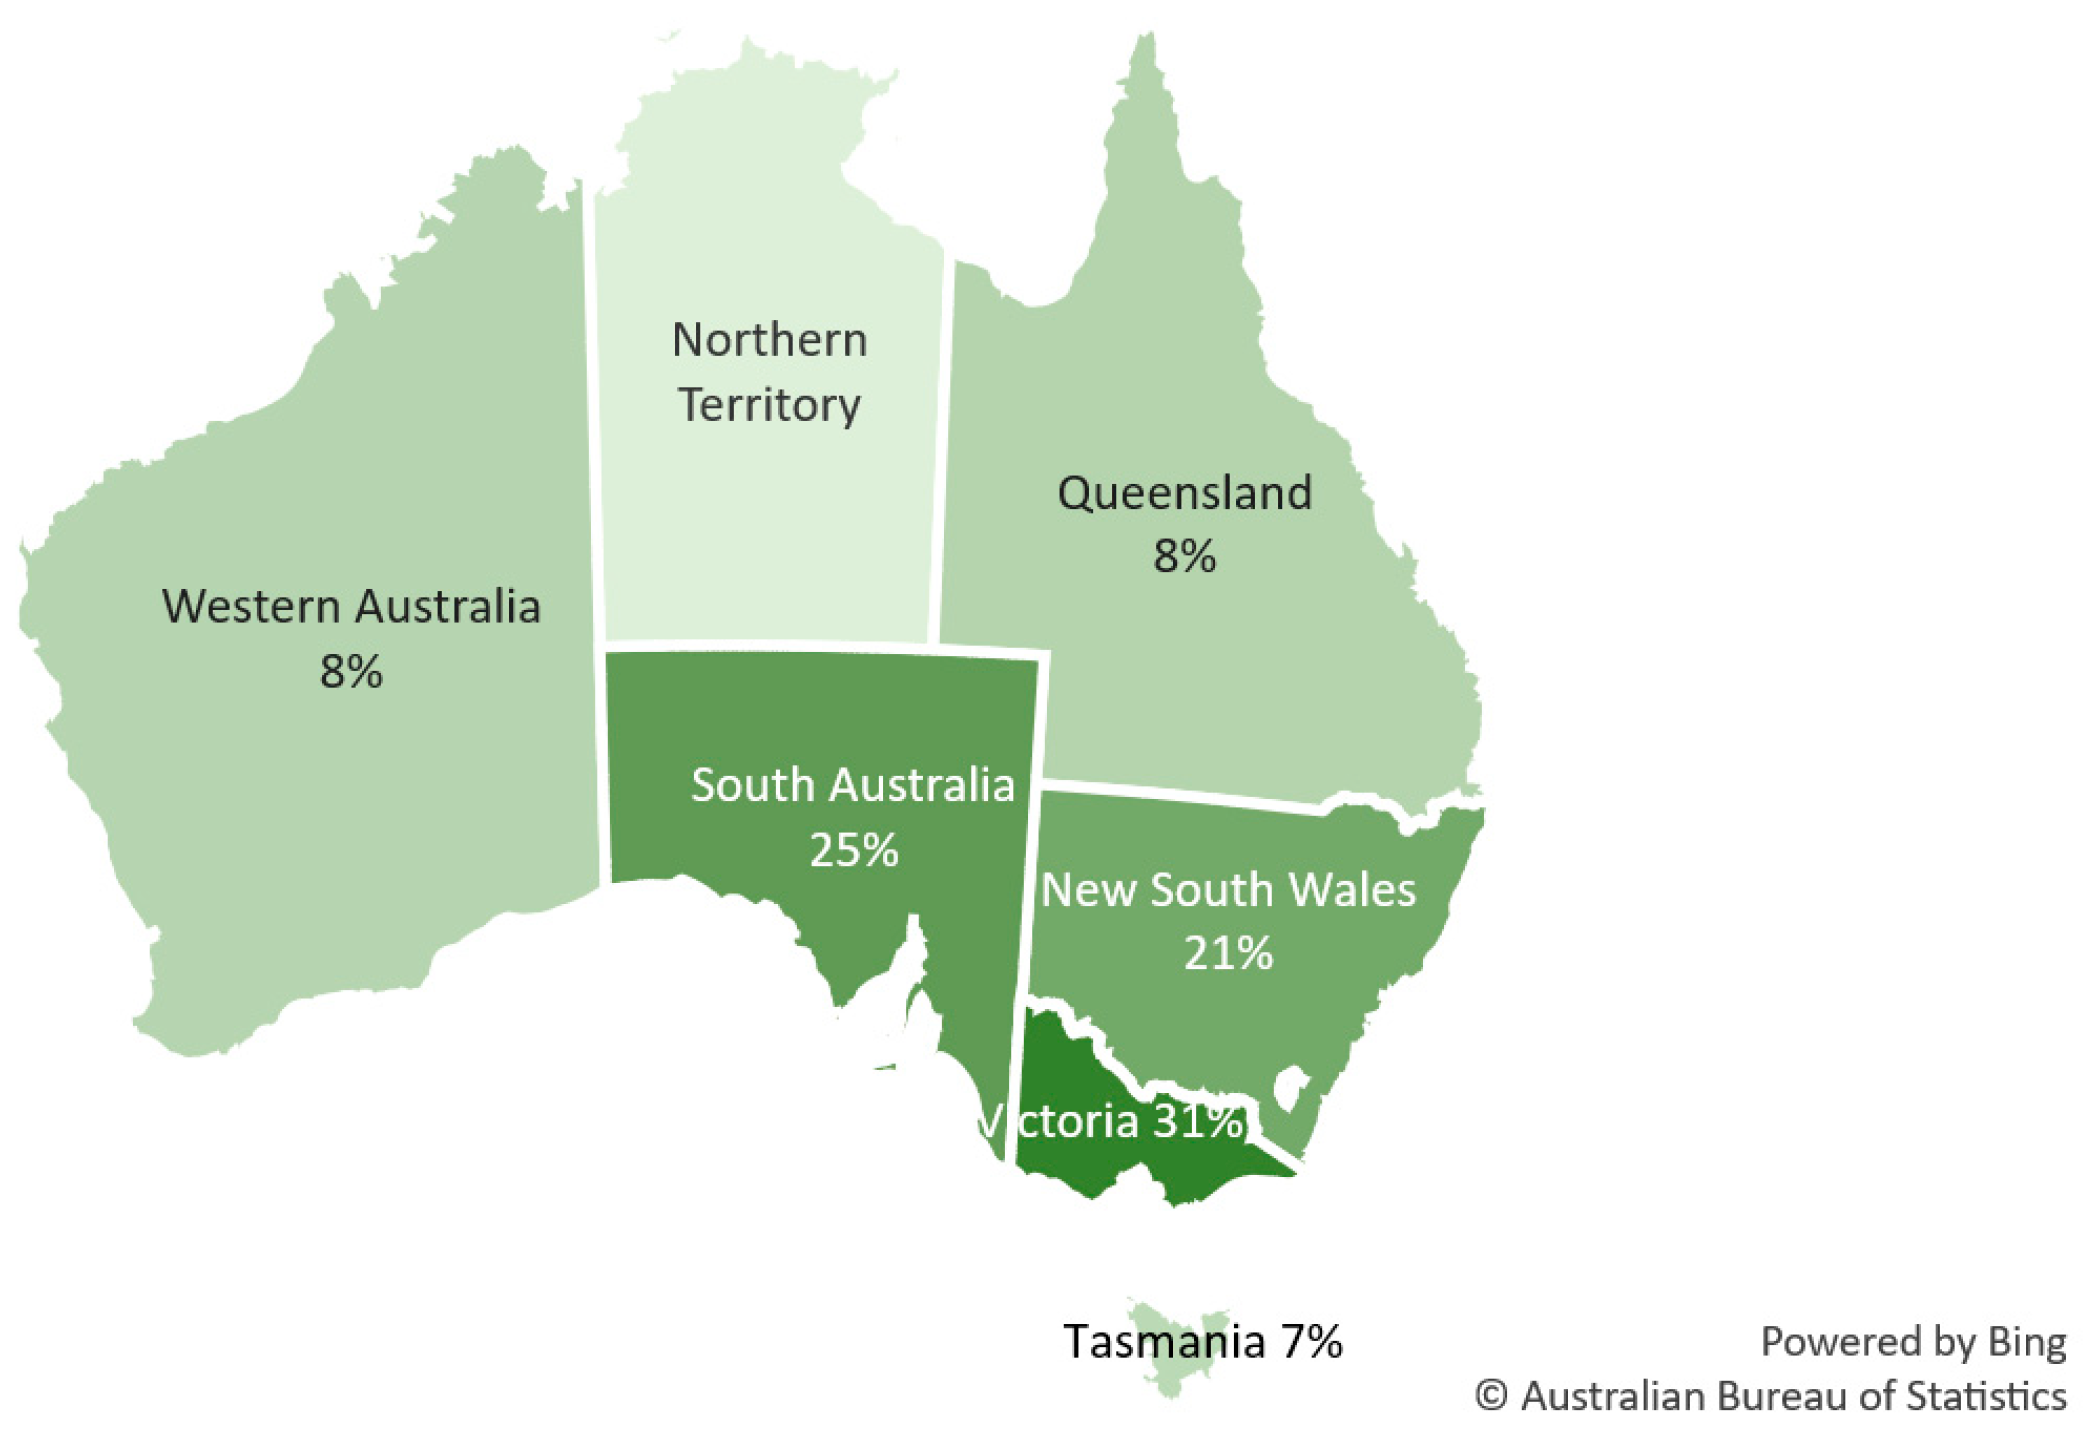
3.1. WT Deployment Outlook in Australia until 2022

The annual and cumulative installations in Australia over 29 years (from 1993 to 2022) are presented in Figure 3. Although the yearly installation capacity has fluctuated over the years, it grew considerably, reaching more than 1000 MW in 2018. The cumulative result shows continual growth in the WT installation deployment from just over 2 MW in 1993 to over 10,000 MW in 2022.
WT deployment varies in Australia. Using the data collected from all wind farms in Australia (Section 2), Victoria has the highest installed capacity, with 31% (2620 MW) of the total national capacity. South Australia and New South Wales have 25% and 21%, respectively. While Western Australia and Queensland were pioneers with some of the first installations in Australia, WT turbine deployment in these states has lagged over the past two decades compared to other jurisdictions. Presently, there is no WT capacity in the Northern Territory (Figure 4).

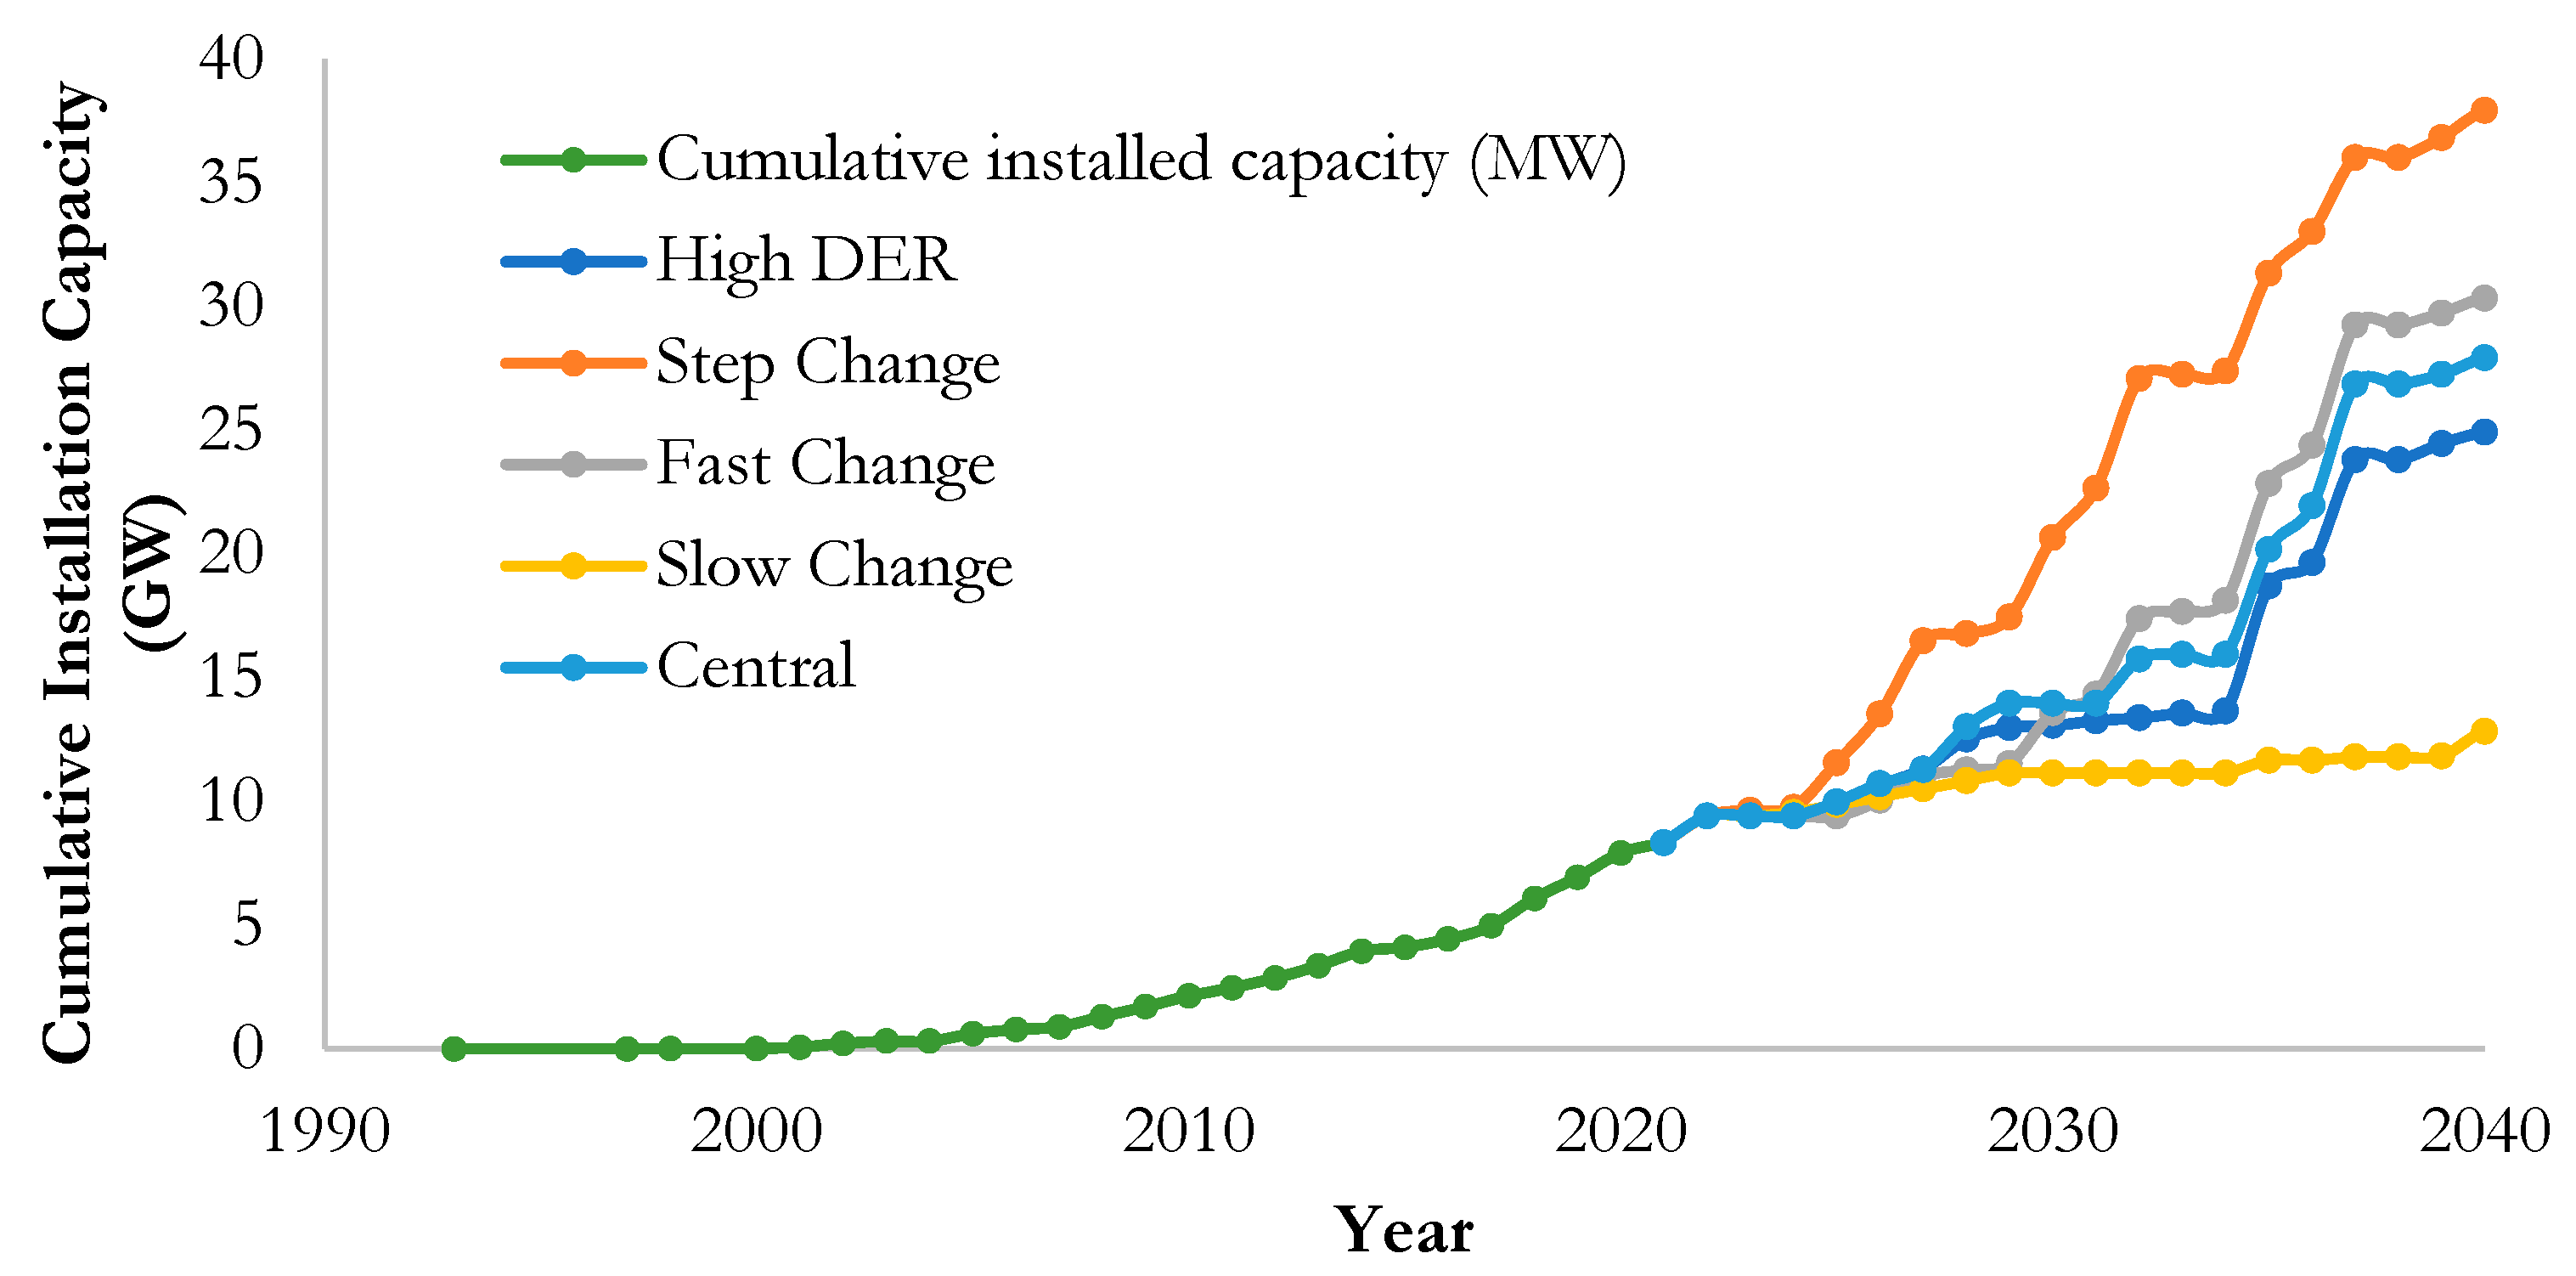
3.2. Wind Energy Projection in Australia from 2022 to 2041

The wind energy market is expected to grow between 54% (4500 GW) and 355% (30,000 GW) over the next two decades based on different scenarios in Australia elucidated below. Figure 5 indicates the overall outlook of the current and projected cumulative WT installation rate according to five AEMO forecasting scenarios. The cumulative installed capacity shows actual installations until 2021, then the cumulative capacity will continue based on the projection scenarios. With the exception of the “Slow Change” scenario the installation rate in Australia is predicted to increase rapidly compared to the last two decades under all the scenarios.

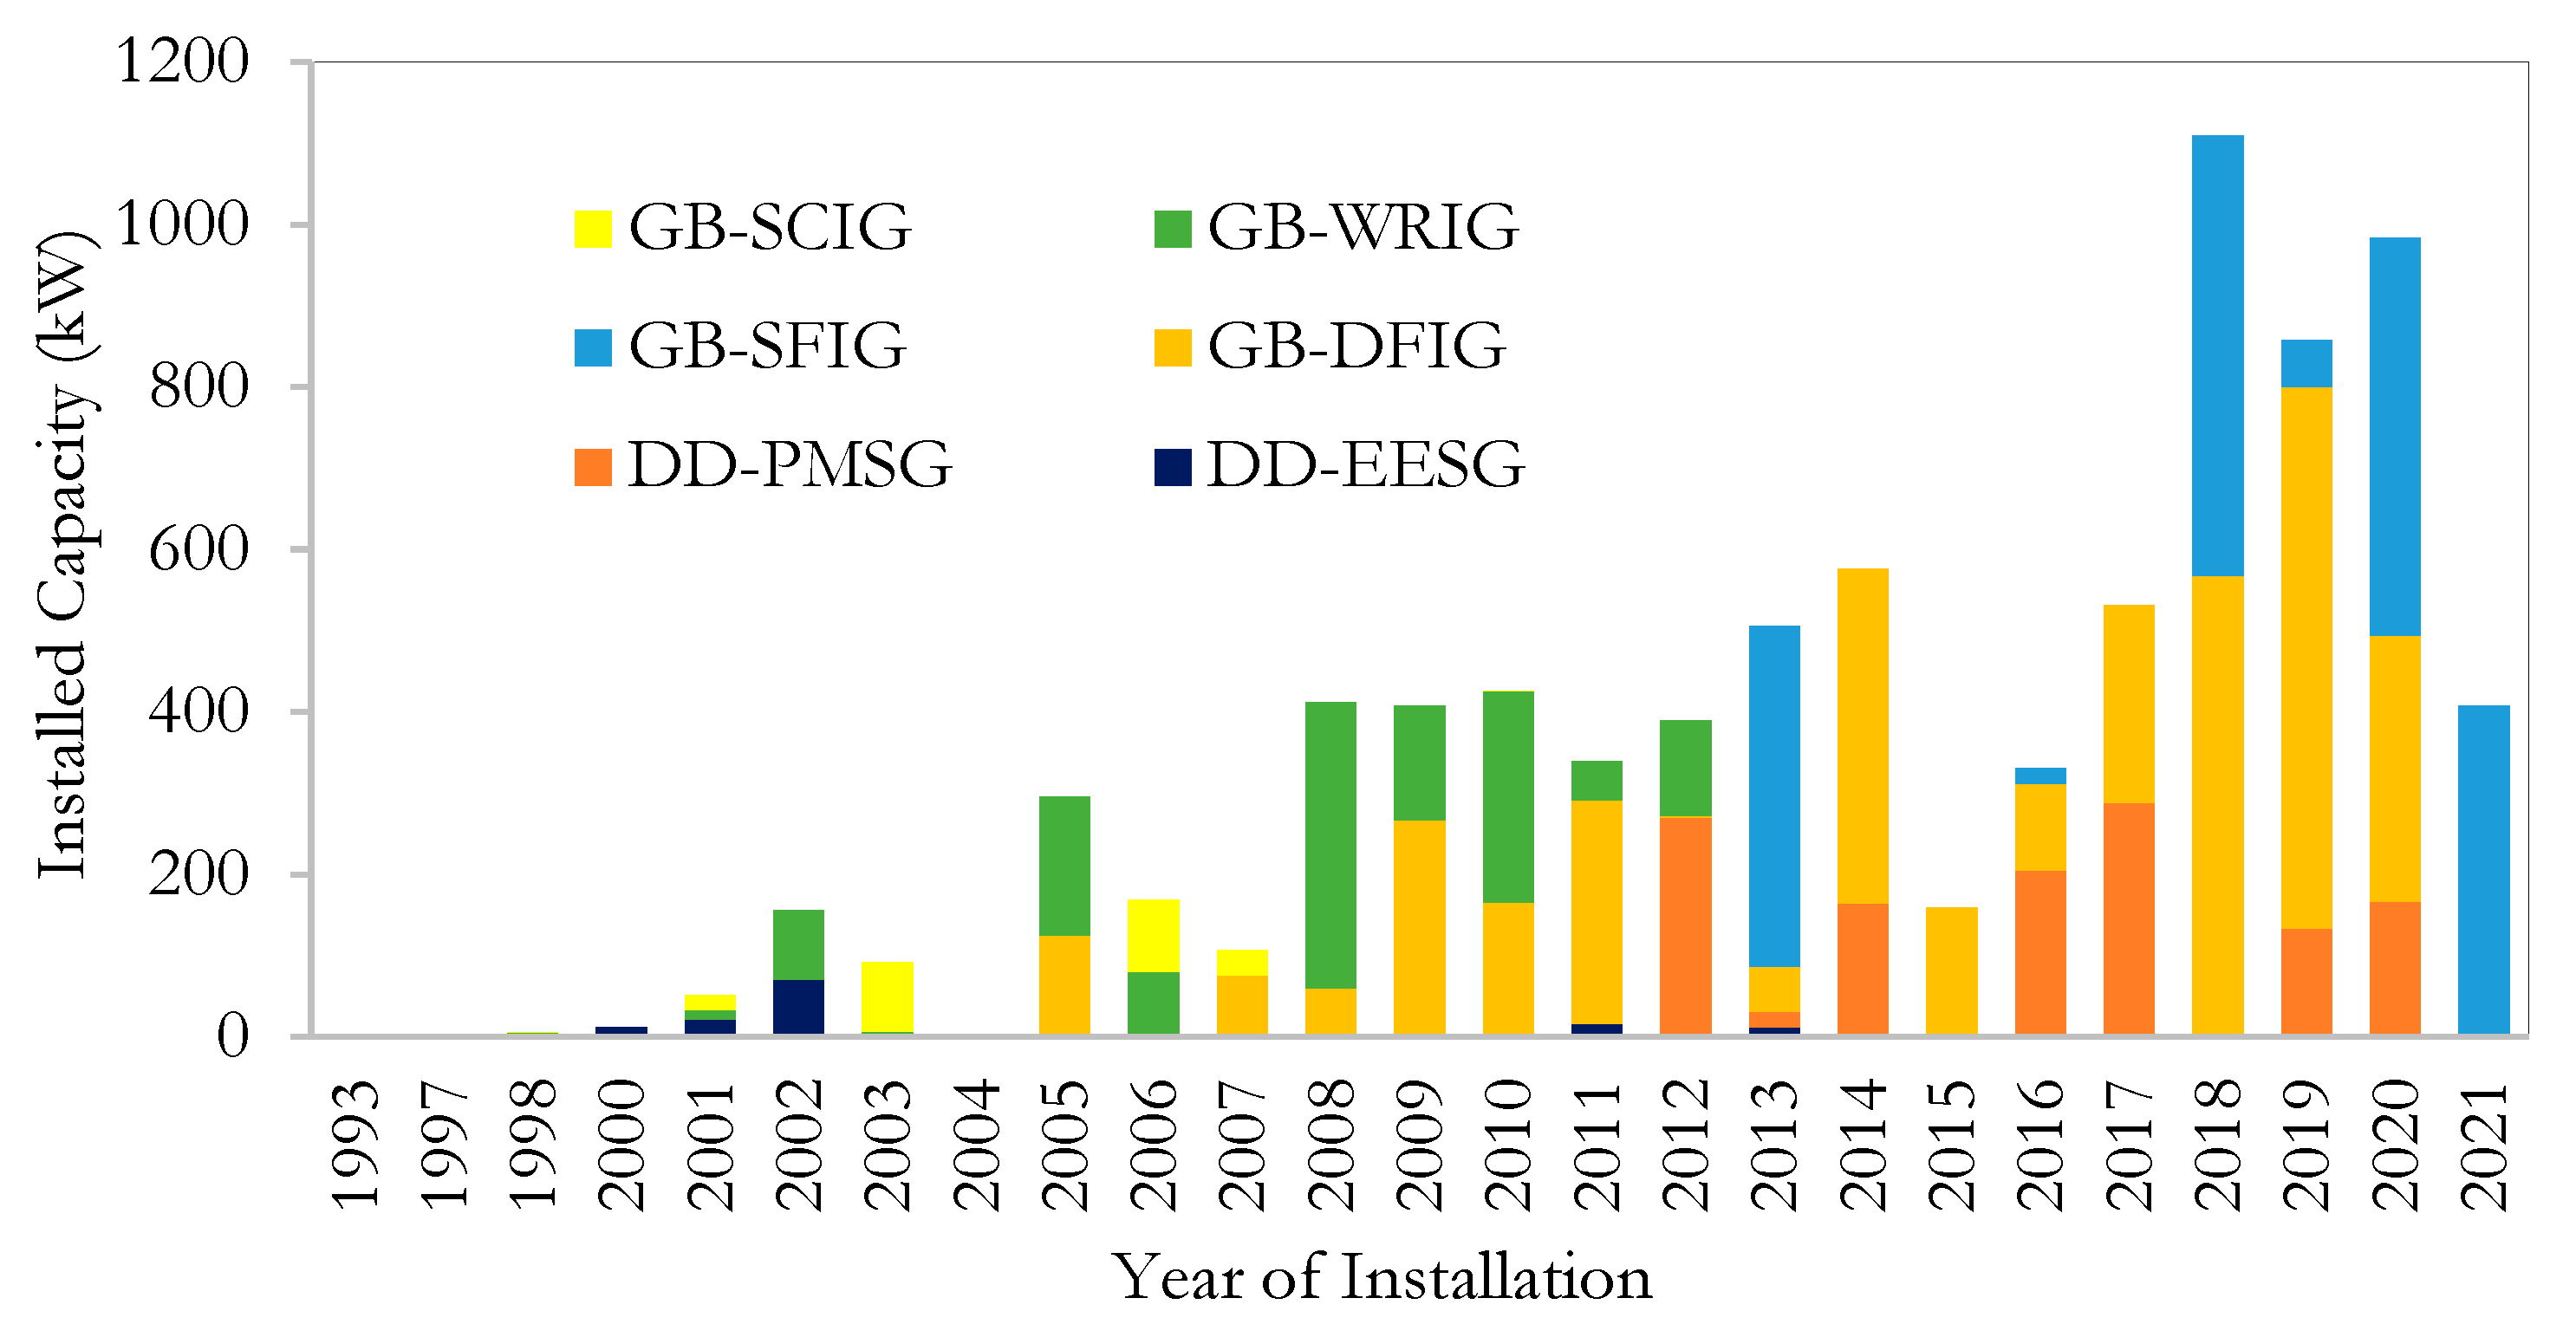
3.3. WT Classification

To identify the generator technology of the wind turbines, they were categorized by model and manufacturer. This helped in finding the generator technology of the wind turbines. The type of generator technology for installed wind turbines from 1993–2021 is shown in Figure 6 based on the year of wind turbine installation. Furthermore, the cumulative market share of each type of wind turbine technology is depicted in Figure 5. The authors used these data to compute the material inventory. As can be seen, GB-DFIG, a kind of gearbox wind turbine, had a 40% market share of the total installed wind turbines; however, in recent years, the GB-SFIG, another high-tech gearbox wind turbine, has increased in dominance. Also, DD-PMSG, a direct-drive technology wind turbine, has seen significant deployment after 2012. Direct-drive PMSG generators are lighter than gearbox ones because of the permanent magnet technology. This has resulted in an overall wind turbine weight reduction [37]. On the other hand, rare earth material consumption will increase, representing a relative increase in the potential resource value of the waste.
As shown in Figure 7, GB-DFIG has achieved the highest market share, 42%, among other available technologies. GB-SFIG follows with a 23% market share. Next, GB-WRIG and DD-PMSG technologies have a 15% market share. GB-SCIG and DD-EESG have a small stake in the Australian market, with a market share of 3% and 2%, respectively. These technologies have been superseded by other technologies in recent years.

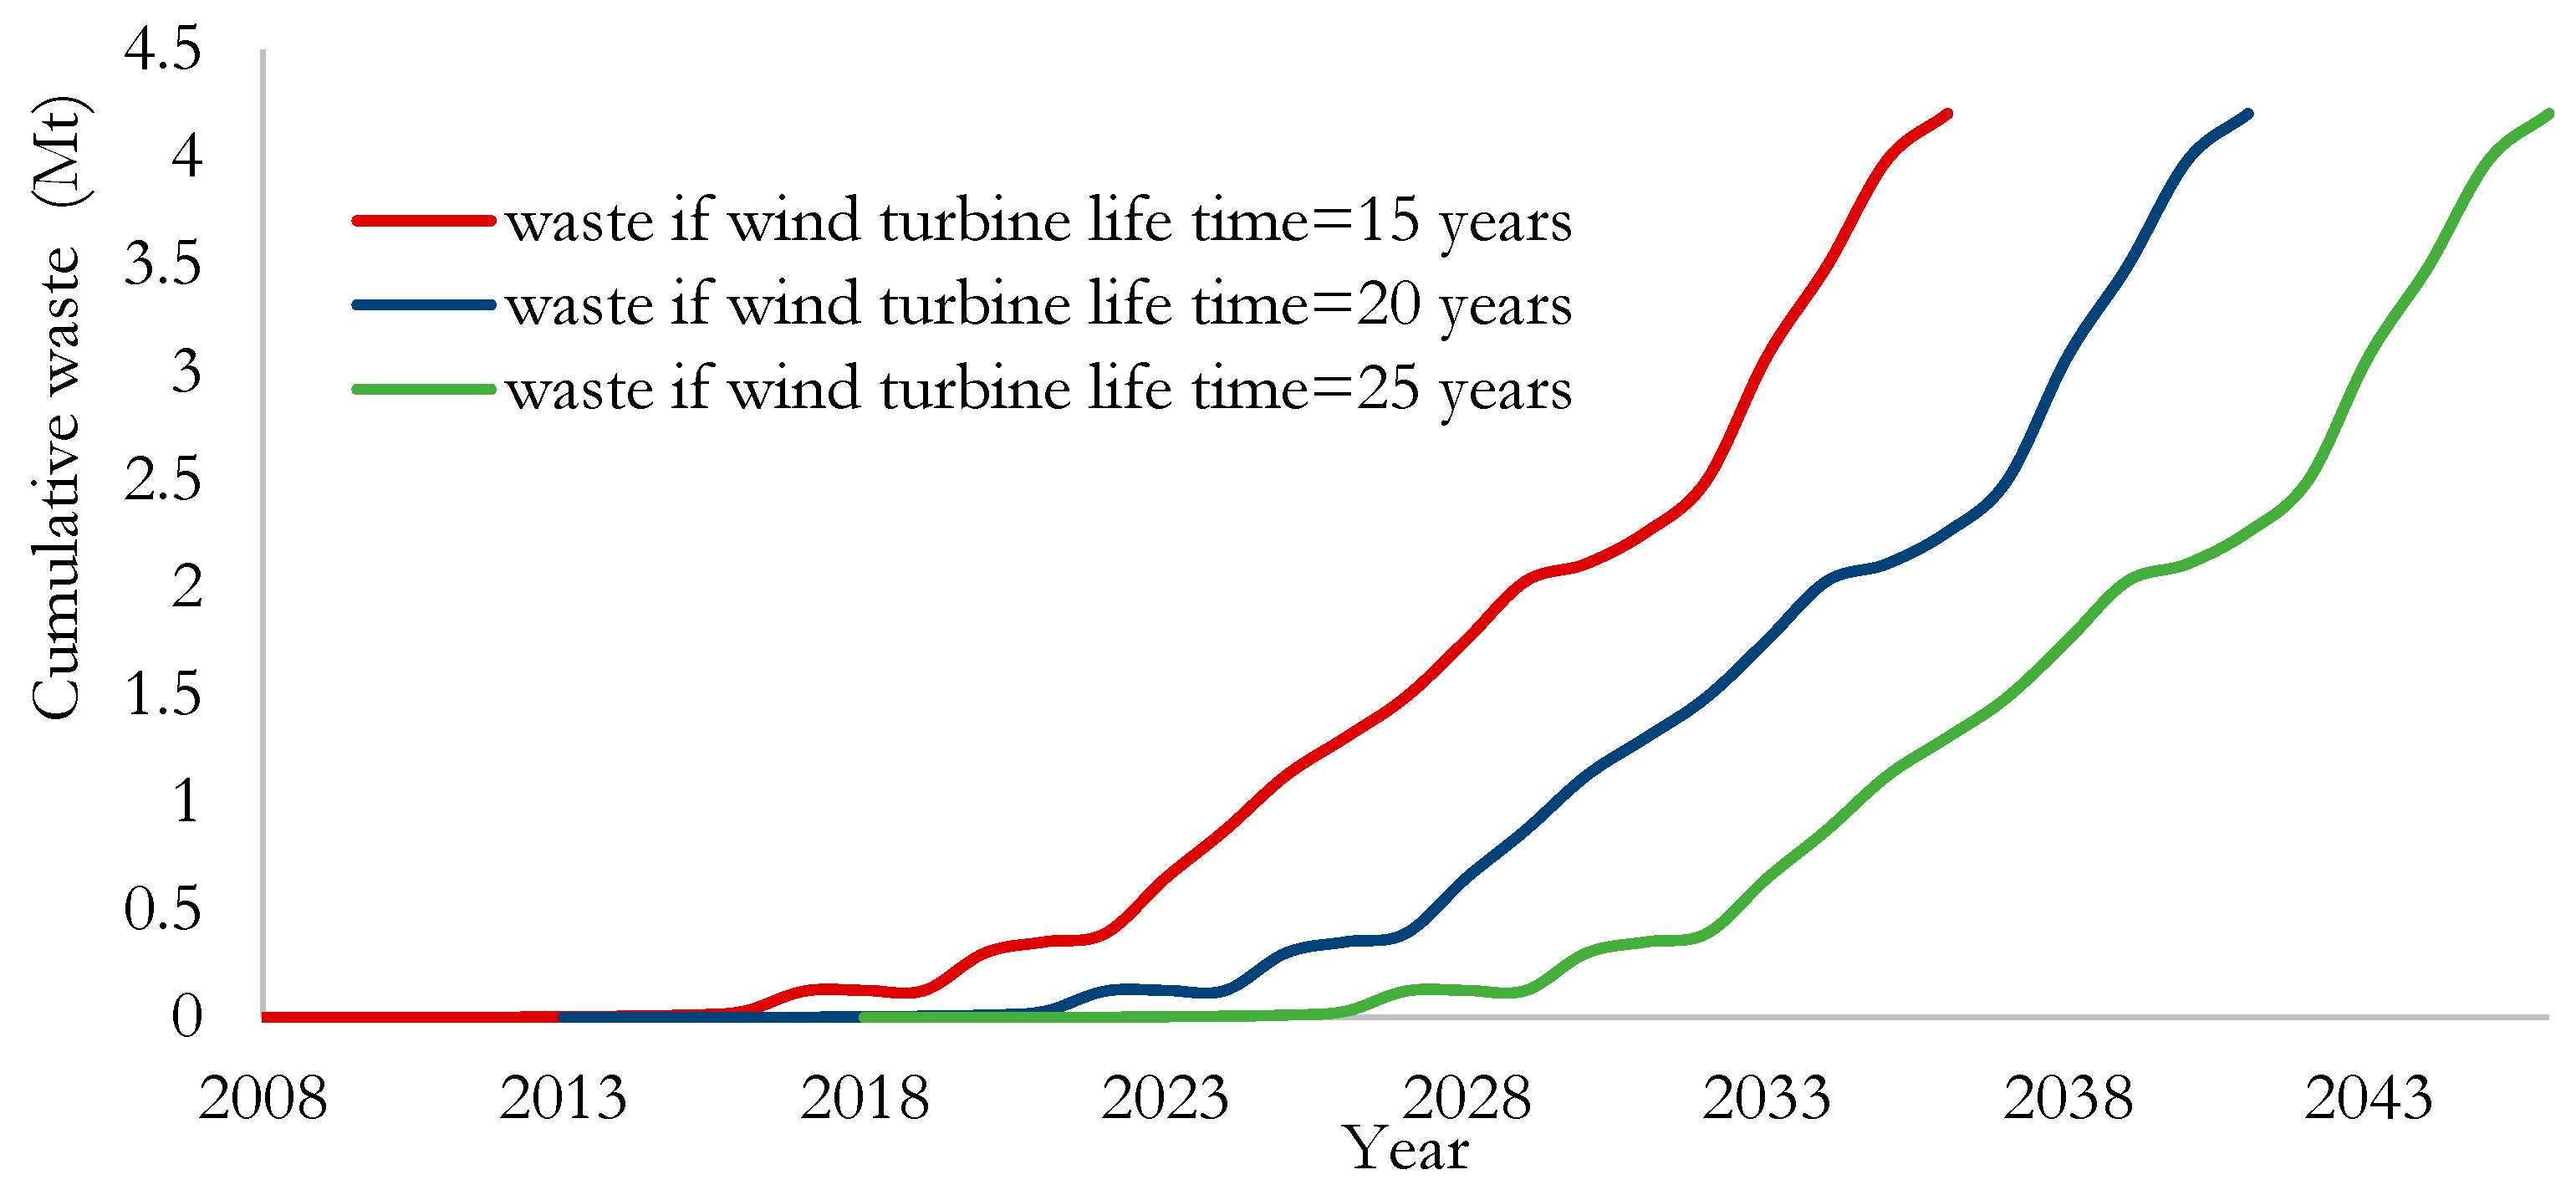
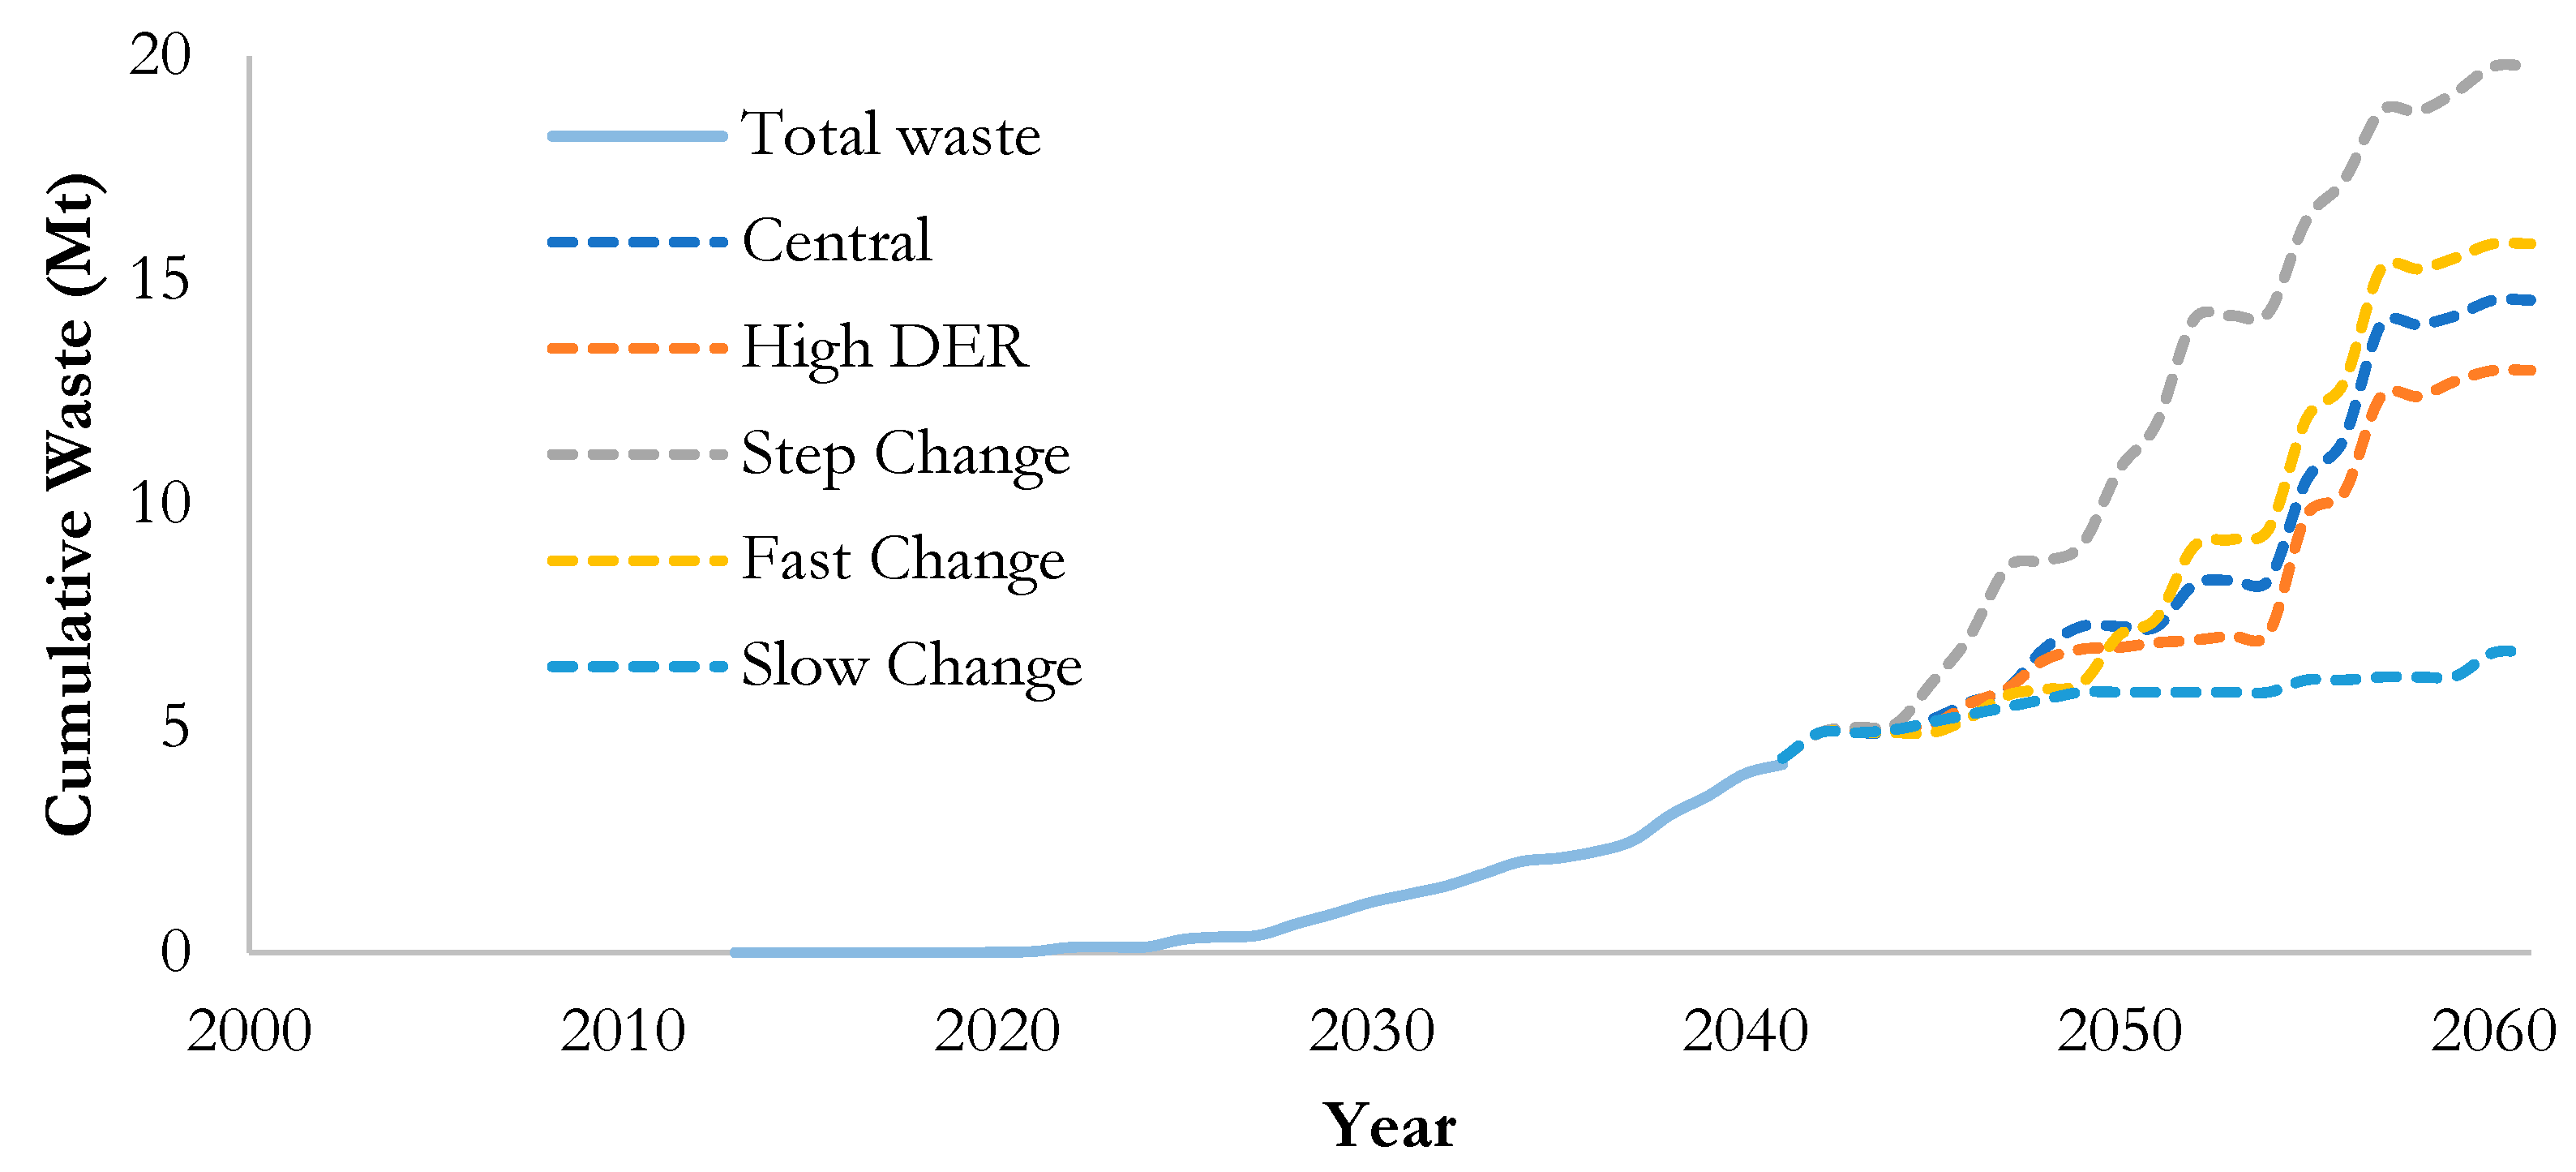
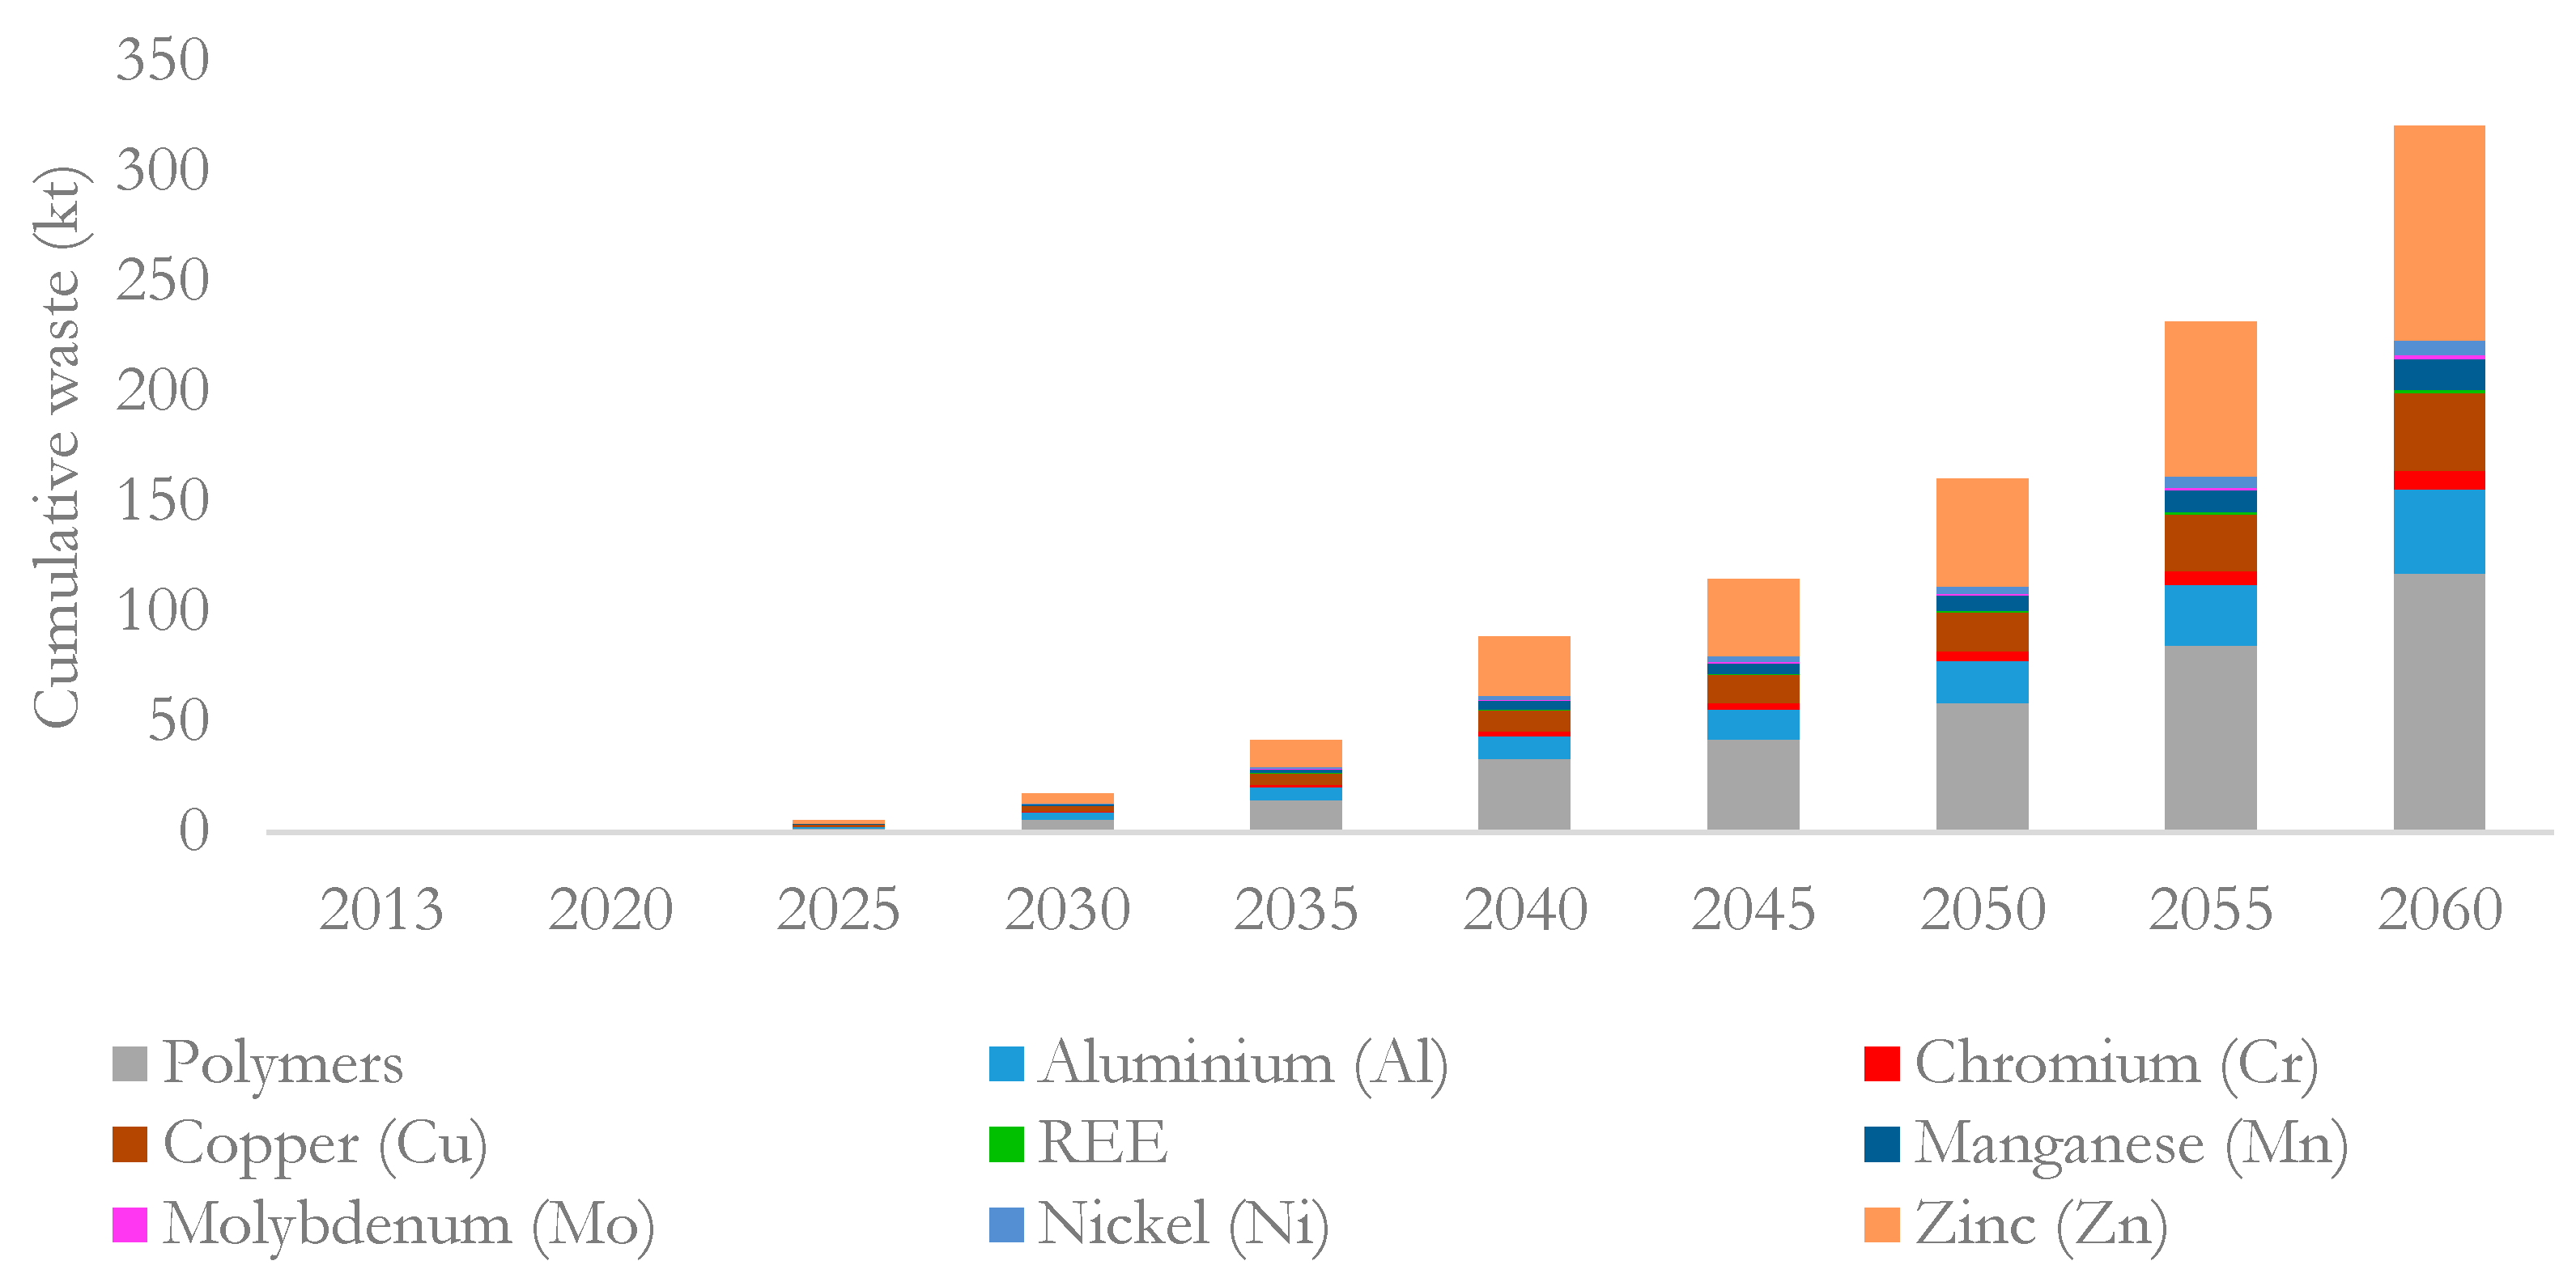
3.4. WT Waste Projection from 2013 to 2060

Similar to other technologies, as wind turbines age, their performance declines. At some point in their life, the costs of running the turbine (e.g., repair and/or replacement of failed parts) outweigh its benefits. This is the point when the turbine reaches its end of life [17]. Wind turbines display a range of lifetime between 15 and 25 years [12,17,18]. The most critical variable in estimating EoL waste is the lifetime. The mass quantity of discarded wind turbines is calculated using the method explained in Section 2.5 and the historical WT installation data (discussed in Section 3.1) considering three fixed lifetime scenarios: 15, 20, and 25 years.
As shown in Figure 8, waste generation starts to accelerate between 2016 and 2026, depending on the assumed lifetime. It is then projected to increase rapidly (exponentially) over the next decade, exceeding 4 million tonnes of waste between 2036 and 2046. Despite this variability, for the rest of the analysis in this paper, a fixed lifetime of 20 years (average lifetime) was considered consistent with the majority of the scientific papers reviewed [17,19,23,29]. The chosen lifetime is used to estimate the possible wind turbine waste generation stream in Australia until 2060 based on the historical and projected deployment of wind turbines nationwide. It should be noted that it is normal that some wind turbines would have a longer lifetime than 20 years owing to, for example, lifetime extension; however, the assumed fixed lifetime still allows for a detailed analysis of future EoL waste volumes.
As discussed earlier, the waste estimation has been carried out for different types of wind turbines based on the gear technologies. Figure 9 shows the cumulative decommissioned WT in million tonnes (Mt) for the various WTs between 2013 and 2041. GB-DFIG has the highest share compared to other technologies, reaching about 1.8 Mt of waste by 2041. GB-SFIG, at about 1.0 Mt, contributes to the second major waste flow.
DD-PMSG wind turbine installations are growing slowly, resulting in around 0.5 Mt waste as of 2041. This reveals that the direct-drive wind turbines will have less impact on the waste flow than the gearbox WTs over the next two decades. This means there is a lower amount of rare earth materials in the waste stream, which has potential implications for the value of the recovered materials.
To assess waste generation from future deployments the WT waste stream in Australia from 2042 to 2060 was forecasted according to the method discussed in Section 2. Therefore, while the total waste until 2041 related to the installed WTs until 2021 waste projections beyond this point are based on the projected wind energy deployment scenarios (Figure 10). The waste projections are influenced by a variety of factors, including waste policy, renewable energy and climate policy, and economic conditions, that will influence WT deployment in Australia until 2041. While all these five scenarios present an increasing trend for twenty years, the volume of the waste is 6.69 Mt for the Slow Change scenario as the lowest amount, followed by 12.99, 14.55, and 15.81 Mt for the scenarios of High DER, Central, and Fast Change, respectively. Step Change showed the highest volume of waste generation at 19.76 Mt.
These findings provide critical insight for decision-makers in developing and implementing new legislation ensuring the effective and sustainable management of WTs. Also, the results are helpful for businesses aiming to invest in recycling wind turbine waste in terms of informing resource assessments, cost–benefit analyses, and economic feasibility assessments.

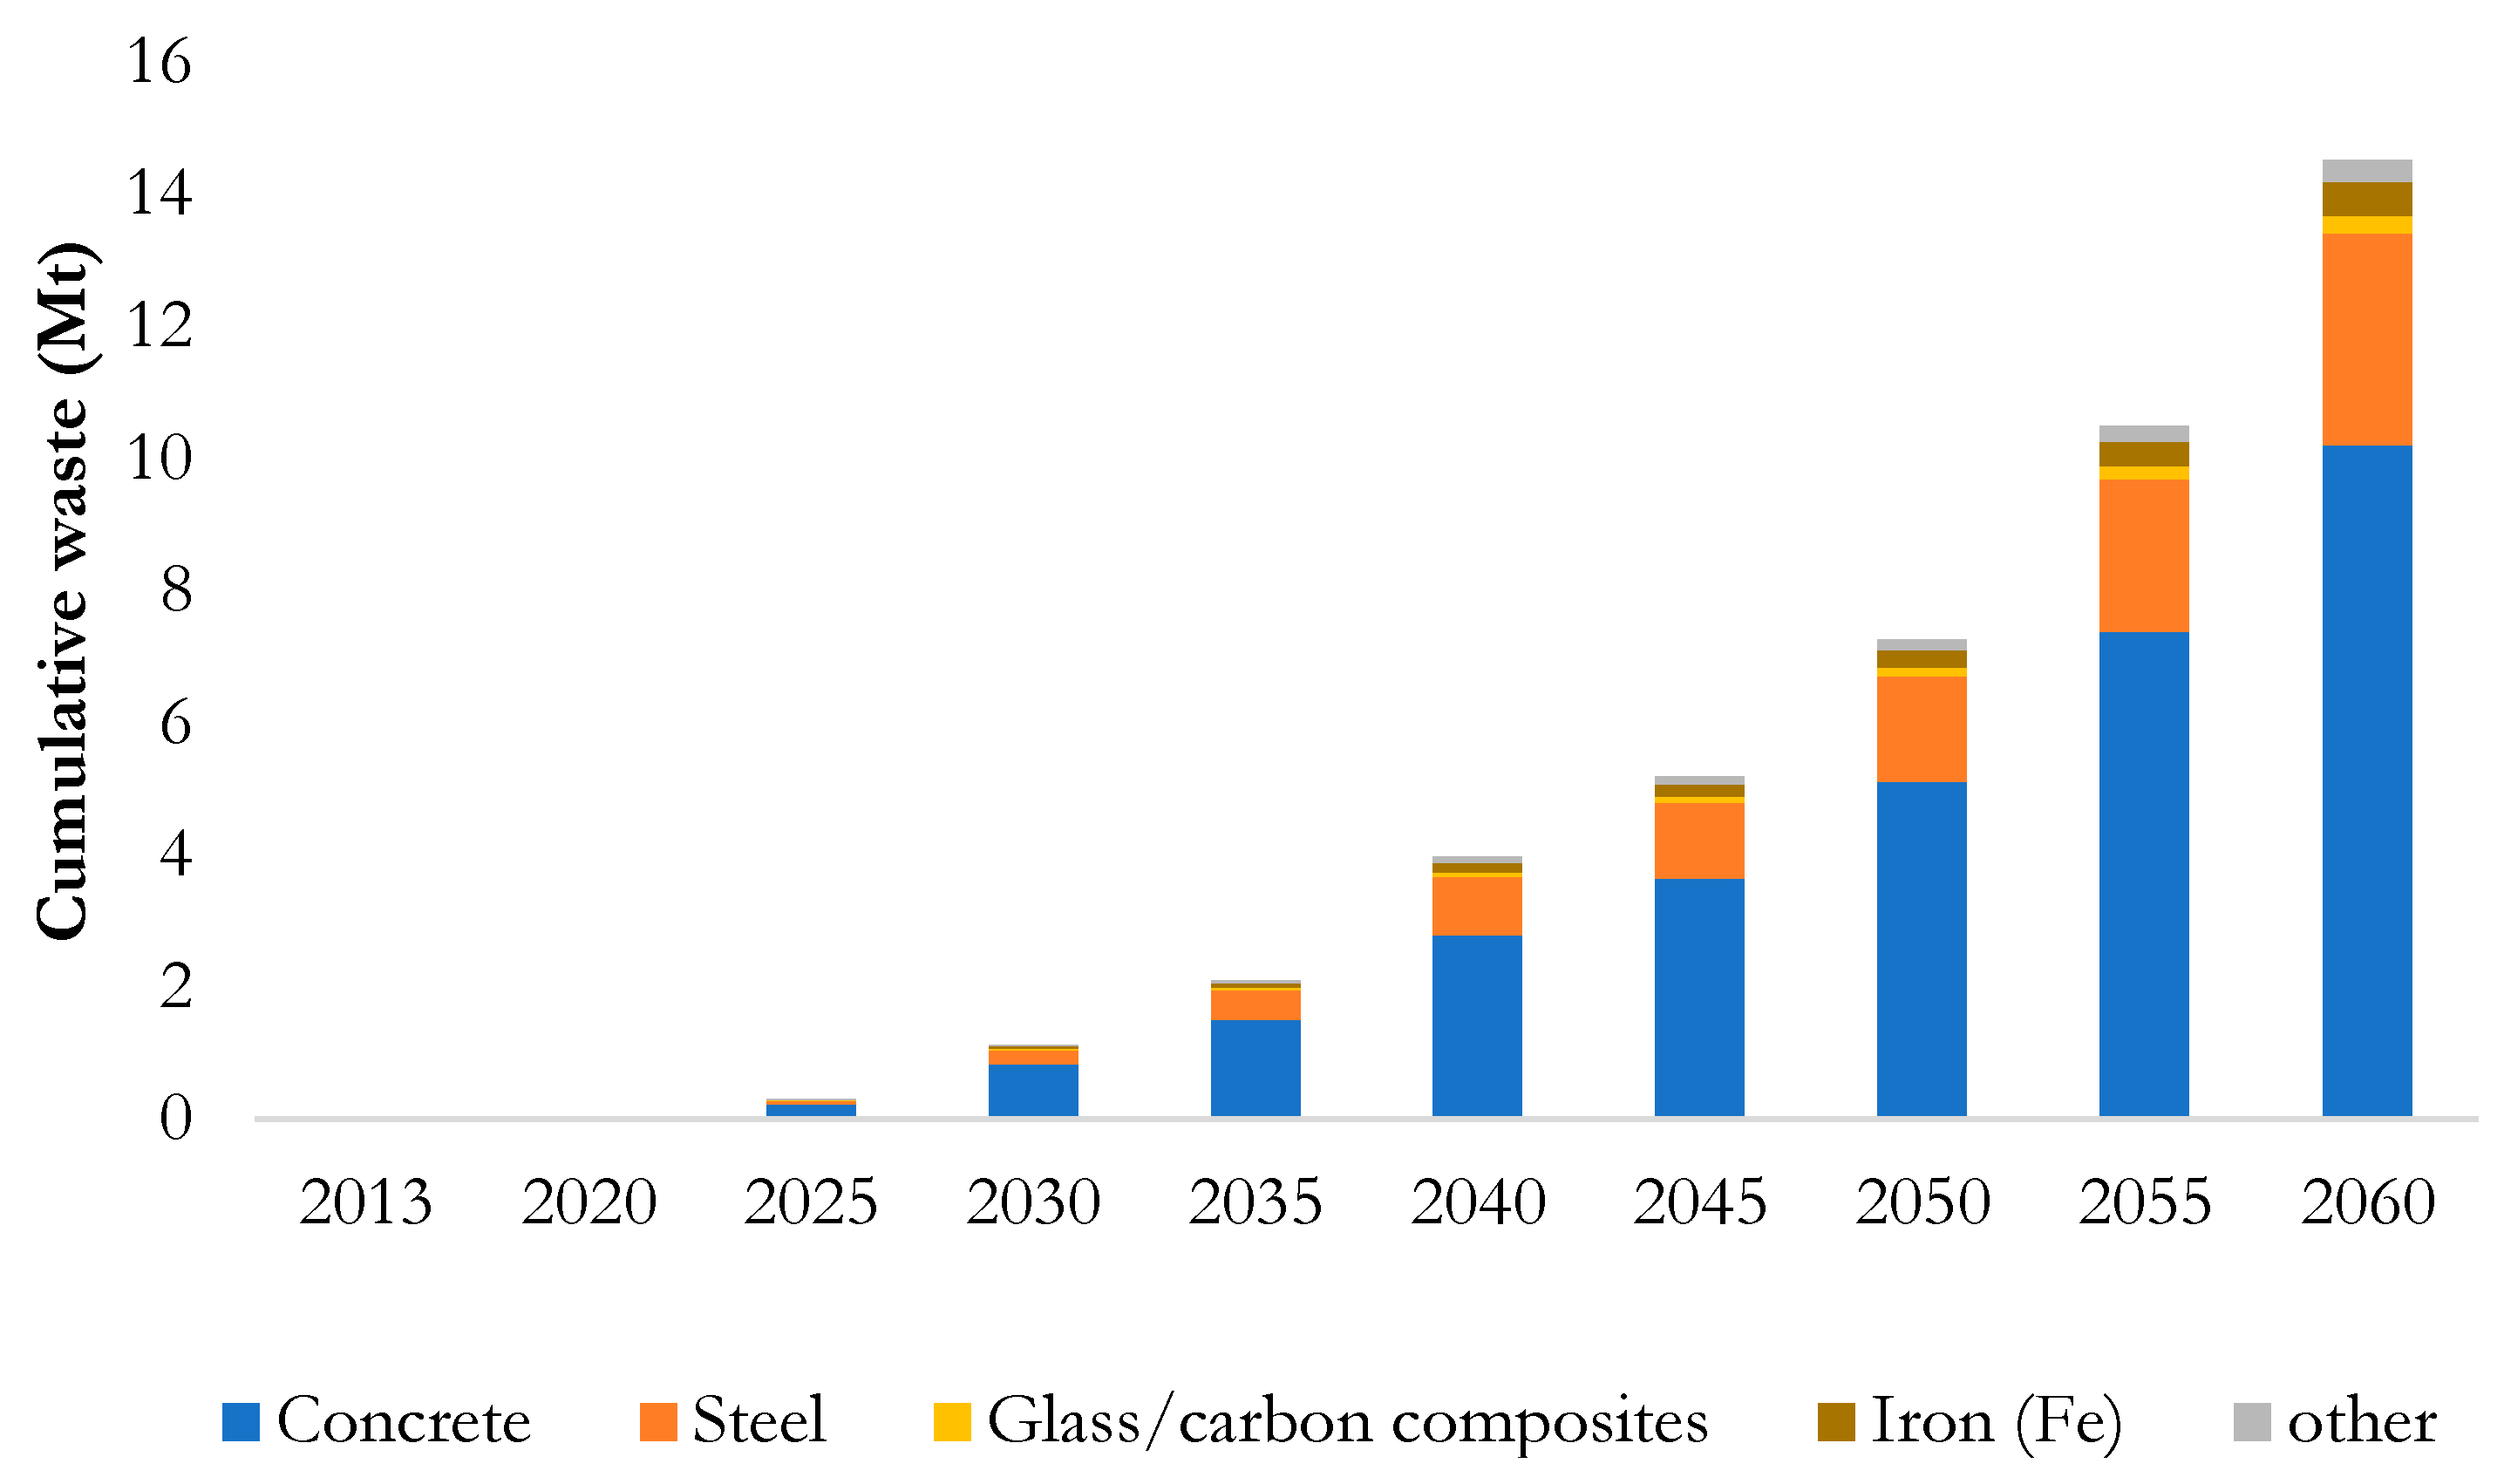
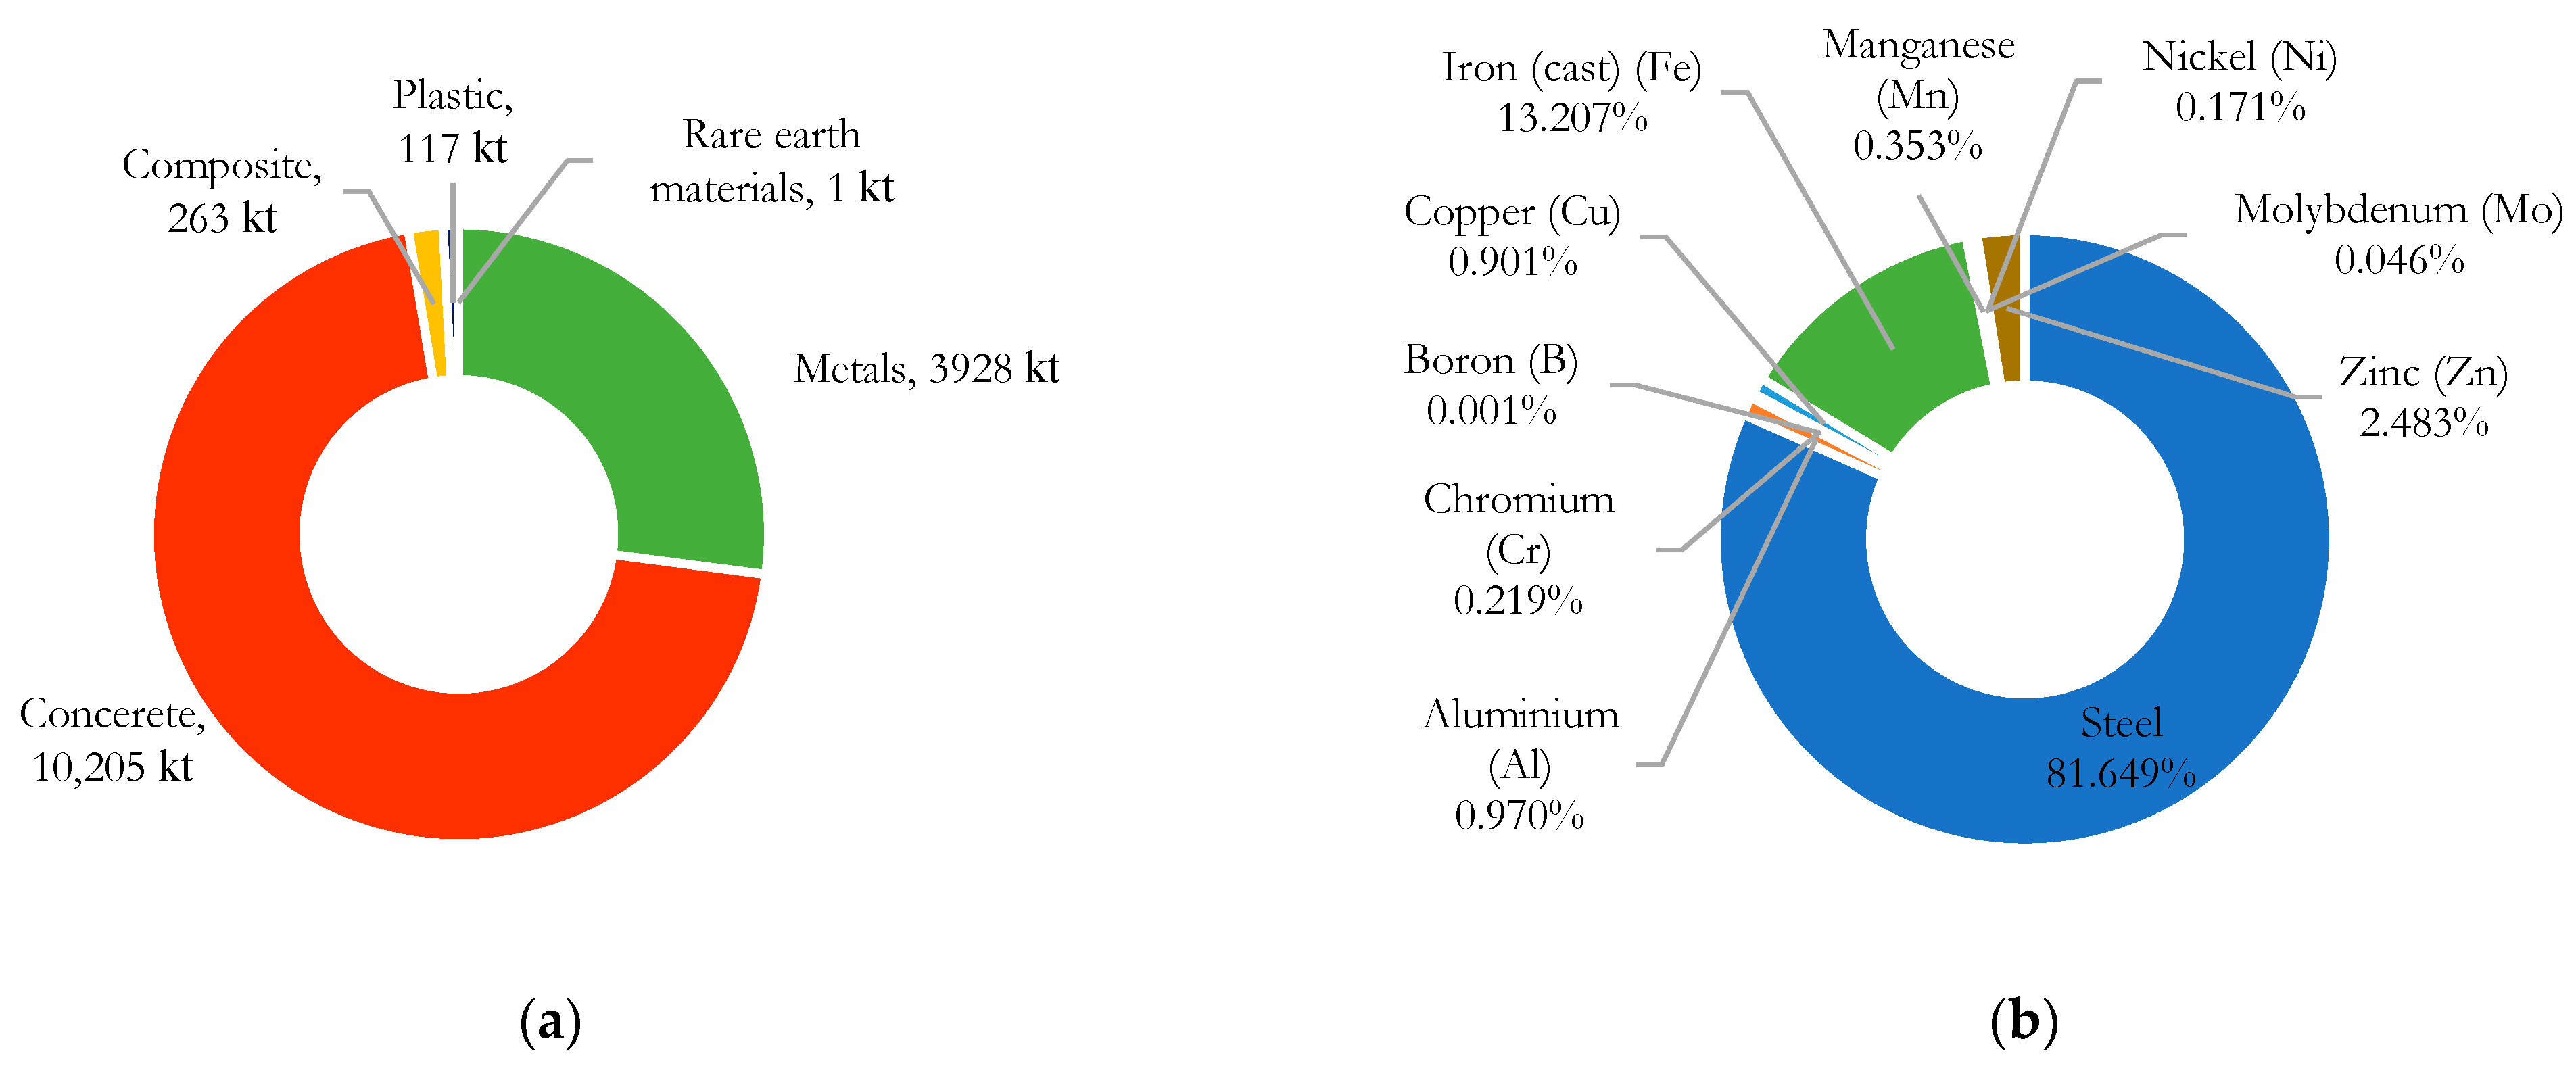
3.5. WT Material Waste Streams and Economic Value

The waste generation projections were used to estimate the inventory of the waste materials for the duration of the analysis. The principal composition of waste materials in decommissioned WTs up to 2060 is shown in Figure 11 based on the Central scenario. Concrete contributes the largest share by mass with a cumulative 10.20 Mt by 2060, followed by steel at 3.21 Mt, with a much lower growth rate from about 2020. Iron and composites (CF/GF) are other important parts of WT waste flow, representing 518.78 kt and 262.93 kt, respectively. The other materials have a smaller quantity which can be seen more clearly in Figure 12.
The cumulative volume of these materials by 2060 includes 38.11 kt of aluminum, 35.41 kt of copper, 117.33 kt of plastic, 97.52 kt of zinc, 13.88 kt of manganese, 6.71 kt of nickel, and 1279.96 tonnes of rare earth elements (including dysprosium (Dy), neodymium (Nd), praseodymium (Pr), terbium (Tb)). Even though the volume of rare earth elements is the lowest compared to the other materials, they have the highest value; for example, according to [40], the value of one kilogram of iron, steel, aluminum, zinc, nickel, and Neodymium (Nd as a rare earth metal) is USD 0.1357, USD 0.64, USD 2.514, USD 3.5815, USD 25.581, and USD 179.12 in June 2022, respectively. In other words, the value of REEs used in the Australian wind farms until 2060 could be worth USD 229 million, representing one-third of the value of iron estimated at USD 700 million and almost ten times more than the value of aluminum at USD 24 million. The authors note that this simple comparison is based on the value of the refined metals and does not factor in the costs associated with collection and recycling that are expected to vary for the different metals. Nonetheless, this highlights the need for recycling solutions that can recover the broad range of metals including low-volume and high-value metals as well as the lower-value and high-volume metals.
By categorizing all materials in WT waste into five broad categories, it is observed that there will be 10,205 kt of concrete, 3928 kt of metals, 263 kt of composites, 117 kt of plastics, and 1 kt of rare earth materials in 2060 (Figure 13a). Furthermore, valuable details on metal variety are presented in Figure 13b. The results indicate that steel has the highest share among all metal waste in the EoL WT stream, over 81%, followed by iron at just over 13% (Figure 13b).
For a better understanding of the economic value of this amount of waste, the total price of all waste from the wind energy industry until 2060 is shown in Figure 14.
The most valuable materials, in terms of price, are steel, glass/carbon composites, and rare earth elements, while rare earth materials and composites do not constitute a large part of the chart in Figure 13. This confirms the significance of the EoL management of these materials.

3.6. Repowering

Repowering refers to the process of renovating wind turbines, which can include installing newer, more powerful and efficient models while keeping the cables and transmission lines (full repowering) or replacing the turbine while keeping the existing tower, foundation, and cables (partial repowering) [41]. This can be done because these parts of the wind farms can be utilized for more than 20–25 years [42]. The ultimate choice relies on the wind farm owner’s assessment of which option is both economically advantageous and environmentally superior among the available alternatives [43]. If the first option is chosen, the entire wind turbine undergoes dismantling and disposal. In contrast, opting for the second choice allows for the reuse of the tower and foundation for an additional twenty years, extending their lifespan and reducing the need for new materials and construction. This subject, which can have an impact on the waste generated by decommissioned wind turbines, has been investigated in this study. According to the calculations (Figure 15), reusing the foundation and tower (partial repowering) can considerably reduce concrete and steel waste streams by around 72% and 60%, respectively, until 2060. Although, these structures go to disposal in the end, the decommissioning date will be significantly delayed.

4. Discussion

An increase in waste material from discarded WTs is anticipated. Specifically, a gradual increase in annual WT waste material growth is expected from 2028 and onwards because of the accelerated deployment of WTs in Australia over the last decade. Based on our findings, it is projected that approximately 470,000 tonnes of waste will be generated annually after 2030 to Australia’s existing waste streams due to decommissioned wind turbines (Figure 11 and Figure 12). The good news is that these waste materials are not immediately hazardous, which outlines the possibility of short-term sorting without significant issues until the capacity and volume of waste meet the requirements of sustainable and economically profitable recycling industries. On the other hand, Australia used to export a significant amount of its waste to China for recycling purposes. However, this changed when China implemented a ban on the import of certain types of solid waste in 2018. This ban disrupted the waste export patterns, leading to challenges in finding alternative destinations and managing recyclable materials domestically in Australia [44]. Also, according to the National Waste Policy Action Plan 2019, setting targets to enhance recycling rates up to 80% on average for all waste flows necessitates more attention to domestic recycling [45]. A holistic strategy is vital to ensure the future sustainable management of these growing waste flows in line with circular economy objectives.
To gain insight into the existing capacities and strategies for diverse waste sources, this section provides an overview of waste management practices concerning discarded WT materials in Australia. Concrete is the major material segment of EoL WTs by mass that needs to be addressed properly. Although some countries like Japan are pioneers in recycling discarded concrete and using it in secondary markets, in Australia, only about half of the concrete scrap is recycled [46]. Metals are also the second major and valuable segment of the WT waste stream that requires a suitable treatment strategy for sustainable management. In Australia, most of the metal waste (about 90%) is recycled and then combined with the origin metal in related industries to produce new products [47]. The core components of WT, such as the hub, nacelle, tower, and generator, are made from metals like aluminum, copper, and steel. More than 80% of the steel scrap belongs to wind turbine towers and foundations and is easy to recycle compared to the steel embedded in the nacelle and rotor [39]. According to [48], about 97% of structural steel waste and 83% of other steel scraps are recycled in Australia. In contrast, over 95% of aluminum scrap is exported overseas for recycling [49]. In addition, about 70% of all discarded copper and 40 percent of zinc scrap are currently recycled in Australia [50]. Although metal recycling is mature and well developed in Australia, the recycling capacity, transport, and other important factors for processing the materials available from EoL WTs will need to be considered. Plastics in the EoL wind turbine represent a minor portion (1%) of the waste stream but still need to be managed responsibly as they are very bulky and durable in the environment. Furthermore, exporting unsorted and unprocessed plastic waste has been banned in Australia since 2021 [51]. Therefore, recycling plastics and reusing them in packaging, construction, and automotive industries [52] is a potential solution, as most of those used in WTs are some kind of thermoplastic [53]. Finally, rare earth elements and composites are two challenging materials. Reusing composites in buildings [54,55], solar collectors [56], electrical transmission towers [57], and civic infrastructures [58] and employing innovative recycling methods including thermal recycling, solvolysis, and mechanical recycling [59,60,61,62] to produce carbon or glass fibers are some of the potential options for composite waste management. However, all of these proposed pathways are quite niche and not well established specifically in Australia. Currently, the most possible way of recycling composites in Australia is mechanical recycling; however, the output has less value than that of other recycling procedures like thermal recycling [63]. Recovered glass or carbon fibers produced in mechanical recycling can be used as supplementary cementitious materials. They can be used in concrete alongside cement to enhance their properties or reduce environmental impact [64]. Australian researchers are dedicated to advancing end-of-life disposal techniques for composites, potentially revolutionizing their future management. In a recent study, Wei and Hadigheh [53], at the University of Sydney, innovated an improved hybrid thermo-chemical recycling method that maintains up to 90% of the composite strength of the original composite. Therefore, fostering collaboration and knowledge sharing will help to develop innovative solutions for sustainable waste treatment and circular economy practices.
Although the amount of currently existing EoL wind turbine blade waste is small, the wind turbine waste volumes in the future will be significant that will allow economies of scale to be exploited. Effective policies and regulations will be important to support the development of recycling systems for EoL wind turbine blades. REEs are also low in volume; however, the potential economic value is high. Currently the recovery of REEs is challenging because they are not easily separated from a complex mixture of other elements [7]. Currently, electronic waste in Australia, including REEs, goes to landfilling, meaning there are no benefits from these expensive and high-supply-risk materials [65,66].
While there has been considerable effort to accurately forecast waste, there are some concerns. The first one is potential shifts in weight standards due to future advancements in wind turbine technology. In projecting the materials embedded in wind turbines to be installed between 2022 and 2041, the authors have utilized the average material usage from the most modern wind turbines in the past three years. The aim was to focus on the most advanced wind turbine technology available to mitigate uncertainties regarding future advancements. However, it is important to acknowledge that there are inherent uncertainties beyond our control. The second one is the change in wind energy deployment scenarios over time as government policies and strategies are developing. It is important to note that our work encompasses a projection that considers multiple scenarios and potential changes in national energy markets and policies. This approach allows us to provide a comprehensive understanding of potential futures, even in light of uncertainties.
Briefly, Australia will face a considerable growth of EoL wind turbines in the coming decades. It is vital to implement an approach to ensure the sustainable management of this waste stream, avoid adverse impacts, and exploit a potential resource recovery opportunity. This study is a critical step toward this aim by providing an in-depth evaluation of the current and future waste stream of wind turbines in Australia over the next four decades.

5. Conclusions

With the wind power market growing rapidly, this study aimed to evaluate and predict the amount of end-of-life wind turbine waste flows generated from 2013 to 2060, utilizing an MFA approach and considering the different types of turbine generator technologies to evaluate the resource recovery potential. Understanding the waste flows can aid governments and industries in planning for and managing future WT waste.
The results revealed that the cumulative WT waste stream by 2060 varies between 12 Mt and 37 Mt based on different WT deployment scenarios. This is a large waste inventory for Australia which urges the development of a holistic strategy to avoid adverse environmental impacts and capture resource recovery opportunities. Further analysis of waste material streams indicates that concrete, steel, and composites make up the bulk of waste materials, with rare earth elements holding significant value despite their lower volume. The potential value of rare earth elements in the wind turbine waste stream highlights the economic importance of recycling solutions. Repowering options present opportunities for reducing concrete and steel waste streams, emphasizing the importance of considering environmental and economic factors in the wind turbine life cycle management. For a better view of the current potential of WT waste management in Australia, the authors discussed disposal options and regulations nationally for these materials.
There are a variety of waste materials that can be utilized in different secondary markets. At a very high level, this would support the country in various aspects, such as lowering the country’s overall environmental impacts, creating new job opportunities, supporting the economy, and reducing the demand for imported embedded WT materials. Policymakers and scholars will find this study informative for the holistic development of sustainable WT resource recovery directives and waste management strategies.
After determining the quantity of WT waste in Australia, the next stages of this study will involve examining how to manage this waste through recycling solutions and potential environmental impacts. Additionally, the authors aim to develop a reverse logistics mathematical model designed for the collecting and recycling infrastructures specific to the Australian wind energy sector.

Author Contributions

Conceptualization, Z.A.; methodology, Z.A.; software, Z.A.; formal analysis, Z.A.; writing—original draft preparation, Z.A.; writing—review and editing, Z.A., K.K. and N.F.; visualization, Z.A.; supervision, K.K. and N.F. All authors have read and agreed to the published version of the manuscript.

Funding

This research was funded by Australian Government Research Training Program Stipend (RTP scholarship) at University of Technology Sydney.

Data Availability Statement

The data are available in the manuscript.

Conflicts of Interest

The authors declare no conflicts of interest.

Abbreviations

AEMOAustralian Energy Market Operator
DDDirect drive
DERDistributed energy resource
DFIGDouble-fed induction generator
EESGElectrically excited synchronous generator
EoLEnd of Life
GBGearbox
GISGeographical Information System
GWGigawatts
HTSHigh-temperature superconductor
IRENAInternational Renewable Energy Agency
ktKilo tonnes
MFAMaterial flow analysis
MtMillion tonnes
PMSGPermanent magnet synchronous generator
REEsRare earth elements
SCIGSquirrel cage induction generator
VREVariable renewable energy
WPSsWaste processing systems
WRIGWound rotor induction generator
WTWind turbine

References

  1. Psomopoulos, C.S.; Kalkanis, K.; Kaminaris, S.; Ioannidis, G.C.; Pachos, P. A review of the potential for the recovery of wind turbine blade waste materials. Recycling 2019, 4, 7. [Google Scholar] [CrossRef]
  2. The Wind Power. Wind Farms Databases. Available online: https://www.thewindpower.net/store_windfarms_view_all_en.php (accessed on 17 May 2021).
  3. IRENA. Future of Wind: Deployment, Investment, Technology, Grid Integration and Socio-Economic Aspects (A Global Energy Transformation Paper); International Renewable Energy Agency: Abu Dhabi, United Arab Emirates, 2019. [Google Scholar]
  4. Khalid, M.Y.; Arif, Z.U.; Hossain, M.; Umer, R. Recycling of wind turbine blades through modern recycling technologies: A road to zero waste. Renew. Energy Focus 2023, 44, 373–389. [Google Scholar] [CrossRef]
  5. Council, C.E. Wind. Available online: https://www.cleanenergycouncil.org.au/resources/technologies/wind (accessed on 1 February 2023).
  6. Hao, S.; Kuah, A.T.H.; Rudd, C.D.; Wong, K.H.; Lai, N.Y.G.; Mao, J.; Liu, X. A circular economy approach to green energy: Wind turbine, waste, and material recovery. Sci. Total Environ. 2020, 702, 135054. [Google Scholar] [CrossRef]
  7. Yang, Y.; Walton, A.; Sheridan, R.; Güth, K.; Gauß, R.; Gutfleisch, O.; Buchert, M.; Steenari, B.M.; Van Gerven, T.; Jones, P.T.; et al. REE Recovery from End-of-Life NdFeB Permanent Magnet Scrap: A Critical Review. J. Sustain. Metall. 2017, 3, 122–149. [Google Scholar] [CrossRef]
  8. Giorgini, L.; Benelli, T.; Brancolini, G.; Mazzocchetti, L. Recycling of carbon fiber reinforced composite waste to close their life cycle in a cradle-to-cradle approach. Curr. Opin. Green Sustain. Chem. 2020, 26, 100368. [Google Scholar] [CrossRef]
  9. Rani, M.; Choudhary, P.; Krishnan, V.; Zafar, S. A review on recycling and reuse methods for carbon fiber/glass fiber composites waste from wind turbine blades. Compos. Part B Eng. 2021, 215, 108768. [Google Scholar] [CrossRef]
  10. Dorigato, A. Recycling of thermosetting composites for wind blade application. Adv. Ind. Eng. Polym. Res. 2021, 4, 116–132. [Google Scholar] [CrossRef]
  11. Liu, P.; Barlow, C.Y. Wind turbine blade waste in 2050. Waste Manag. 2017, 62, 229–240. [Google Scholar] [CrossRef] [PubMed]
  12. Lefeuvre, A.; Garnier, S.; Jacquemin, L.; Pillain, B.; Sonnemann, G. Anticipating in-use stocks of carbon fibre reinforced polymers and related waste generated by the wind power sector until 2050. Resour. Conserv. Recycl. 2019, 141, 30–39. [Google Scholar] [CrossRef]
  13. Ratner, S.; Gomonov, K.; Revinova, S.; Lazanyuk, I. Eco-design of energy production systems: The problem of renewable energy capacity recycling. Appl. Sci. 2020, 10, 4339. [Google Scholar] [CrossRef]
  14. Jensen, J.P. Evaluating the environmental impacts of recycling wind turbines. Wind Energy 2019, 22, 316–326. [Google Scholar] [CrossRef]
  15. Topham, E.; McMillan, D.; Bradley, S.; Hart, E. Recycling offshore wind farms at decommissioning stage. Energy Policy 2019, 129, 698–709. [Google Scholar] [CrossRef]
  16. Adedipe, T.; Shafiee, M. An economic assessment framework for decommissioning of offshore wind farms using a cost breakdown structure. Int. J. Life Cycle Assess. 2021, 26, 344–370. [Google Scholar] [CrossRef]
  17. Andersen, N.; Eriksson, O.; Hillman, K.; Wallhagen, M. Wind turbines’ end-of-life: Quantification and characterisation of future waste materials on a national level. Energies 2016, 9, 999. [Google Scholar] [CrossRef]
  18. Tazi, N.; Kim, J.; Bouzidi, Y.; Chatelet, E.; Liu, G. Waste and material flow analysis in the end-of-life wind energy system. Resour. Conserv. Recycl. 2019, 145, 199–207. [Google Scholar] [CrossRef]
  19. Tota-Maharaj, K.; McMahon, A. Resource and waste quantification scenarios for wind turbine decommissioning in the United Kingdom. Waste Dispos. Sustain. Energy 2020, 3, 117–144. [Google Scholar] [CrossRef]
  20. Lichtenegger, G.; Rentizelas, A.A.; Trivyza, N.; Siegl, S. Offshore and onshore wind turbine blade waste material forecast at a regional level in Europe until 2050. Waste Manag. 2020, 106, 120–131. [Google Scholar] [CrossRef]
  21. Chen, Y.; Cai, G.; Zheng, L.; Zhang, Y.; Qi, X.; Ke, S.; Gao, L.; Bai, R.; Liu, G. Modeling waste generation and end-of-life management of wind power development in Guangdong, China until 2050. Resour. Conserv. Recycl. 2021, 169, 105533. [Google Scholar] [CrossRef]
  22. Heng, H.; Meng, F.; McKechnie, J. Wind turbine blade wastes and the environmental impacts in Canada. Waste Manag. 2021, 133, 59–70. [Google Scholar] [CrossRef]
  23. Cooperman, A.; Eberle, A.; Lantz, E. Wind turbine blade material in the United States: Quantities, costs, and end-of-life options. Resour. Conserv. Recycl. 2021, 168, 105439. [Google Scholar] [CrossRef]
  24. Delaney, E.L.; McKinley, J.M.; Megarry, W.; Graham, C.; Leahy, P.G.; Bank, L.C.; Gentry, R. An integrated geospatial approach for repurposing wind turbine blades. Resour. Conserv. Recycl. 2021, 170, 105601. [Google Scholar] [CrossRef]
  25. Tremeac, B.; Meunier, F. Life cycle analysis of 4.5 MW and 250 W wind turbines. Renew. Sustain. Energy Rev. 2009, 13, 2104–2110. [Google Scholar] [CrossRef]
  26. Vorrath, S. World’s First “Fully Recyclable” Wind Turbine Blades Roll Off Production Line. Available online: https://reneweconomy.com.au/worlds-first-fully-recyclable-wind-turbine-blades-roll-off-production-line/ (accessed on 1 March 2023).
  27. Rahimizadeh, A.; Kalman, J.; Fayazbakhsh, K.; Lessard, L. Mechanical and thermal study of 3D printing composite filaments from wind turbine waste. Polym. Compos. 2021, 45, 2305–2316. [Google Scholar] [CrossRef]
  28. Rahimizadeh, A.; Tahir, M.; Fayazbakhsh, K.; Lessard, L. Tensile properties and interfacial shear strength of recycled fibers from wind turbine waste. Compos. Part A Appl. Sci. Manuf. 2020, 131, 105786. [Google Scholar] [CrossRef]
  29. Arias, F.; Bank, L. Assessment of Present/Future Decommissioned Wind Blade Fiber-Reinforced Composite Material in the United States. 2016. Available online: https://www.researchgate.net/profile/Lawrence-Bank/publication/338430512_Assessment_of_PresentFuture_Decommissioned_Wind_Blade_Fiber-Reinforced_Composite_Material_in_the_United_States/links/5e148256299bf10bc396e246/Assessment-of-Present-Future-Decommissioned-Wind-Blade-Fiber-Reinforced-Composite-Material-in-the-United-States.pdf (accessed on 1 February 2023).
  30. Gennitsaris, S.; Sagani, A.; Sofianopoulou, S.; Dedoussis, V. Integrated LCA and DEA approach for circular economy-driven performance evaluation of wind turbine end-of-life treatment options. Appl. Energy 2023, 339, 120951. [Google Scholar] [CrossRef]
  31. Diez-Cañamero, B.; Mendoza, J.M.F. Circular economy performance and carbon footprint of wind turbine blade waste management alternatives. Waste Manag. 2023, 164, 94–105. [Google Scholar] [CrossRef] [PubMed]
  32. Martinez-Marquez, D.; Florin, N.; Hall, W.; Majewski, P.; Wang, H.; Stewart, R.A. State-of-the-art review of product stewardship strategies for large composite wind turbine blades. Resour. Conserv. Recycl. Adv. 2022, 15, 200109. [Google Scholar] [CrossRef]
  33. Australian Government. Electricity Generation. Available online: https://www.energy.gov.au/data/electricity-generation#:~:text=Renewables%20contributed%2032%25%20of%20total,and%20households%20in%202021%2D22 (accessed on 1 February 2023).
  34. Clean-Energy-Council. Best Practice Guidelines for Implementation of Wind Energy Projects in Australia; Australian Government: Melbourne, Australia, 2018. [Google Scholar]
  35. Mahmoudi, S.; Huda, N.; Behnia, M. Photovoltaic waste assessment: Forecasting and screening of emerging waste in Australia. Resour. Conserv. Recycl. 2019, 146, 192–205. [Google Scholar] [CrossRef]
  36. Salim, H.K.; Stewart, R.A.; Sahin, O.; Dudley, M. Systems approach to end-of-life management of residential photovoltaic panels and battery energy storage system in Australia. Renew. Sustain. Energy Rev. 2020, 134, 110176. [Google Scholar] [CrossRef]
  37. Carrara, S.; Alves Dias, P.; Plazzotta, B.; Pavel, C. Raw Materials Demand for Wind and Solar PV Technologies in the Transition towards a Decarbonised Energy System; Publication Office of the European Union: Luxembourg, 2020. [Google Scholar]
  38. Australian Energy Market Operator (AEMO). 2020 Integrated System Plan; Australian Energy Market Operator: Melbourne, Australia, 2020. [Google Scholar]
  39. Vestas. Life Cycle Assessment of Electricity Produced from Onshore Sited Wind Power Plants Based on Vestas V82-1.65 MW Turbines; Vestas: Aarhus, Denmark, 2006; pp. 1–77. [Google Scholar]
  40. Daily Metal Prices. Available online: https://www.dailymetalprice.com/ (accessed on 1 June 2022).
  41. Luengo, M.M.; Kolios, A. Failure mode identification and end of life scenarios of offshore wind turbines: A review. Energies 2015, 8, 8339–8354. [Google Scholar] [CrossRef]
  42. Kasner, R. The environmental efficiency of materials used in the lifecycle of a wind farm. Sustain. Mater. Technol. 2022, 34, e00512. [Google Scholar] [CrossRef]
  43. Beauson, J.; Laurent, A.; Rudolph, D.P.; Pagh Jensen, J. The complex end-of-life of wind turbine blades: A review of the European context. Renew. Sustain. Energy Rev. 2022, 155, 111847. [Google Scholar] [CrossRef]
  44. Tomaras, J. Waste Management and Recycling; Parliament of Australia: Canberra, Australia, 2020. Available online: https://www.aph.gov.au/About_Parliament/Parliamentary_Departments/Parliamentary_Library/pubs/rp/BudgetReview202021/WasteManagementRecycling (accessed on 30 November 2023).
  45. Australian Government. National Waste Policy Action Plan. Department of Climate Change, Energy, the Environment and Water, Australia; 2019. Available online: https://www.dcceew.gov.au/environment/protection/waste/publications/national-waste-policy-action-plan#daff-page-main (accessed on 30 November 2023).
  46. Tam, V.W.Y. Comparing the implementation of concrete recycling in the Australian and Japanese construction industries. J. Clean. Prod. 2009, 17, 688–702. [Google Scholar] [CrossRef]
  47. Pickin, J.; Randell, P.; Trinh, J.; Grant, B. National Waste Report 2018; Department of the Environment and Energy; Blue Environment Pty Ltd.: Docklands, Australia, 2018. [Google Scholar]
  48. ACT Government. Steel Recycling. Transport Canberra and City Services, Australia; 2018. Available online: https://www.cityservices.act.gov.au/recyclopaedia (accessed on 30 November 2023).
  49. Australian Alumimium Council. Scrap Aluminium Recycling in Australia. 2021. Available online: https://aluminium.org.au/wp-content/uploads/2021/07/210708-AAC-Recycling-Summary-Approved.pdf (accessed on 30 November 2023).
  50. van Beers, D.; Kapur, A.; Graedel, T.E. Copper and zinc recycling in Australia: Potential quantities and policy options. J. Clean. Prod. 2007, 15, 862–877. [Google Scholar] [CrossRef]
  51. DAWE. National Plastics Plan 2021; DAWE: Canberra, Australia, 2021. [Google Scholar]
  52. Locock, K. The Recycled Plastics Market: Global Analysis and Trends; CSIRO: Canberra, Australia, 2017. [Google Scholar]
  53. Garrett, P.; Ronde, K. Life Cycle Assessment of Electricity Production from a V90-2.0 MW Gridstreamer Wind Plant; Vestas Wind Systems: Randers, Denmark, 2011. [Google Scholar]
  54. Gentry, R.; Bank, L.; Chen, J.F.; Arias, F.; Al-Haddad, T. Adaptive reuse of FRP composite wind turbine blades for civil infrastructure construction. In Proceedings of the 9th International Conference on Fibre-Reinforced Polymer (FRP) Composites in Civil Engineering, CICE 2018, Paris, France, 17–19 July 2018; pp. 692–698. [Google Scholar]
  55. Gentry, T.R.; Al-Haddad, T.; Bank, L.C.; Arias, F.R.; Nagle, A.; Leahy, P. Structural Analysis of a Roof Extracted from a Wind Turbine Blade. J. Archit. Eng. 2020, 26, 04020040. [Google Scholar] [CrossRef]
  56. Goodman, J.H. Architectonic reuse of wind turbine blades. In Proceedings of the 39th ASES National Solar Conference 2010, SOLAR 2010, Phoenix, AZ, USA, 17–22 May 2010; pp. 1324–1333. [Google Scholar]
  57. Alshannaq, A.; Scott, D.; Bank, L.; Bermek, M.; Gentry, R. Structural re-use of de-commissioned wind turbine blades in civil engineering applications. In Proceedings of the Proceedings of the American Society for Composites—34th Technical Conference, ASC 2019, Atlanta, GA, USA, 23–25 September 2019. [Google Scholar]
  58. André, A.; Kullberg, J.; Nygren, D.; Mattsson, C.; Nedev, G.; Haghani, R. Re-use of wind turbine blade for construction and infrastructure applications. In IOP Conference Series: Materials Science and Engineering, Proceedings of the 41st Risø International Symposium on Materials Science: “Materials and Design for Next Generation Wind Turbine Blades”, Roskilde, Denmark, 7–10 September 2020; IOP Publishing: Bristol, UK, 2020. [Google Scholar]
  59. Cheng, G.; Yang, S.; Wang, X.; Guo, Z.; Cai, M. Study on the Recycling of Waste Wind Turbine Blades. J. Eng. Res. 2023, 11, 13–17. [Google Scholar] [CrossRef]
  60. Mamanpush, S.H.; Li, H.; Englund, K.; Tabatabaei, A.T. Recycled wind turbine blades as a feedstock for second generation composites. Waste Manag. 2018, 76, 708–714. [Google Scholar] [CrossRef]
  61. Yazdanbakhsh, A.; Bank, L.C.; Rieder, K.-A.; Tian, Y.; Chen, C. Concrete with discrete slender elements from mechanically recycled wind turbine blades. Resour. Conserv. Recycl. 2018, 128, 11–21. [Google Scholar] [CrossRef]
  62. Oliveira, P.S.; Antunes, M.L.P.; da Cruz, N.C.; Rangel, E.C.; de Azevedo, A.R.G.; Durrant, S.F. Use of waste collected from wind turbine blade production as an eco-friendly ingredient in mortars for civil construction. J. Clean. Prod. 2020, 274, 122948. [Google Scholar] [CrossRef]
  63. Clean Energy Council. Winding Up Decommissioning, Recycling and Resource Recovery of Australian Wind Turbines; Clean Energy Council’s Wind Recycling Working Group: Perth, Australia, 2023; Available online: https://assets.cleanenergycouncil.org.au/documents/Wind-turbine-recycling-report-2023.pdf (accessed on 1 February 2023).
  64. VDZ. Decarbonisation Pathways for the Australian Cement and Concrete Sector; Cement Industry Federation: Forrest, Australia, 2022. [Google Scholar]
  65. Palle Paul Mejame, M.; King, D.; Banhalmi-zakar, Z.; He, Y. Circular economy: A sustainable management strategy for rare earth elements consumption in Australia. Curr. Res. Environ. Sustain. 2022, 4, 100157. [Google Scholar] [CrossRef]
  66. Islam, M.T.; Huda, N. Reshaping WEEE management in Australia: An investigation on the untapped WEEE products. J. Clean. Prod. 2020, 250, 119496. [Google Scholar] [CrossRef]
Figure 1. Flowchart of the research framework of this study.
Energies 17 00914 g001
Figure 2. Decarbonization and decentralization over five transition scenarios prepared by [38].
Energies 17 00914 g002
Figure 3. Annual and cumulative WT deployment in Australia by 2022.
Energies 17 00914 g003
Figure 4. Nationwide distribution of WT deployment in the states and territories of Australia as of 2022.
Energies 17 00914 g004
Figure 5. Historical and projected cumulative WT capacity in Australia based on forecasting scenarios.
Energies 17 00914 g005
Figure 6. Technology-wise distribution of installed wind turbines in Australia in kW.
Energies 17 00914 g006
Figure 7. The cumulative market share of deployed WT power capacity in Australia based on the utilized technologies.
Energies 17 00914 g007
Figure 8. Cumulative waste flow based on the three fixed lifetime scenarios (15, 20, 25 years).
Energies 17 00914 g008
Figure 9. WT waste generation based on various WT technologies between 2013 and 2041.
Energies 17 00914 g009
Figure 10. Total waste based on the installed wind turbines in Australia and projection of future WT waste flow in a million tonnes based on AEMO forecasting scenarios.
Energies 17 00914 g010
Figure 11. The cumulative waste generation for concrete, steel, composites, and iron out of EoL WTs in Australia until 2060.
Energies 17 00914 g011
Figure 12. The cumulative waste generation for other materials out of EoL WTs in Australia until 2060.
Energies 17 00914 g012
Figure 13. (a) Classification of the mass share of materials contained in the WT waste until 2060 and (b) mass share of the metals in the WT waste until 2060.
Energies 17 00914 g013
Figure 14. The total price (USD 1 million) for different materials out of EoL WTs in Australia until 2060.
Energies 17 00914 g014
Figure 15. The impact of partial repowering on the waste produced by decommissioned wind turbines up to 2060.
Energies 17 00914 g015
Table 1. Summary of the critical analysis of the previous review articles.
Author/YearJournalGeographical AreaResearch Focus
Andersen et al., 2016 [17]EnergiesSwedenWind turbine waste estimation until 2034 by MFA
Liu and Barlow, 2017 [11]Waste ManagementWorldwideWind turbine blade waste estimation until 2050
Tazi et al., 2019 [18]Resources, Conservation & RecyclingFrenchWaste estimation of installed wind turbines until 2020 considering maintenance activities and waste
Lefeuvre, A., 2019 [12]Resources, Conservation and RecyclingWorldwideWind turbine blade waste estimation until 2050
Tota-Maharaj and McMahon, 2020 [19]Waste Disposal & Sustainable EnergyUKWind turbine waste estimation until 2039 by MFA
Lichtenegger et al., 2020 [20]Waste ManagementEuropeWind turbine blade waste estimation until 2050 based on the regional growth rate
Chen et al., 2021 [21]Resources, Conservation and RecyclingChinaWind turbine waste estimation until 2050
Heng et al., 2021 [22]Waste ManagementCanadaWind turbine blade waste estimation until 2050
Cooperman et al., 2021 [23]Resources, Conservation & RecyclingUSAWind turbine blade waste estimation until 2050
Delaney et al., 2021 [24]Resources, Conservation & RecyclingIrelandWind turbine blade waste estimation until 2040 coupled with an integrated Geographical Information System (GIS) model
Table 2. The first ten rows of the Australian wind farms database (data extracted from [2,3] and WT official websites).
NameAreaPower (MW)Number of
Turbines
Hub Height (m)Turbine ManufacturerCommissioning YearWind Turbine ModelWind Turbine Power (kW)Blade Diameter (m)Wind Turbine Technology
Ten Mile LagoonWestern Australia2.0259-Vestas1993Vestas V27/22522527GB-WRIG
DenhamWestern Australia0.462-Enercon1997Enercon230-DD-EESG
Thursday IslandQueensland0.452--1997-225-
DenhamWestern Australia0.231-Enercon1998Enercon230-DD-EESG
Huxley HillTasmania0.753-Nordex1998Nordex N29/25025029GB-SCIG
CrookwellNew South Wales4.8845Vestas1998Vestas V44/60060044GB-WRIG
Windy HillQueensland122046Enercon2000Enercon E44/60060044DD-EESG
Portland Wind FarmVictoria18.21450Bonus2001Bonus B62/1300130062GB-SCIG
AlbanyWestern Australia21.61265Enercon2001Enercon E66/1800180066DD-EESG
Disclaimer/Publisher’s Note: The statements, opinions and data contained in all publications are solely those of the individual author(s) and contributor(s) and not of MDPI and/or the editor(s). MDPI and/or the editor(s) disclaim responsibility for any injury to people or property resulting from any ideas, methods, instructions or products referred to in the content.

