Article

A Contactless Coupled Pendulum and Piezoelectric Wave Energy Harvester: Model and Experiment

1
School of Marine Engineering Equipment, Zhejiang Ocean University, Zhoushan 316004, China
2
The Lyell Centre for Earth and Marine Science and Technology, Institute for Infrastructure and Environment, Heriot-Watt University, Edinburgh EH14 4AS, UK
3
College of Mechanical and Vehicle Engineering, Taiyuan University of Technology, Taiyuan 030024, China
4
Maxwell Institute for Mathematical Sciences, Department of Mathematics, Heriot-Watt University, Edinburgh EH14 4AS, UK
5
Institute for Sustainable Built Environment, School of Energy, Geoscience, Infrastructure and Society, Heriot-Watt University, Edinburgh EH14 4AS, UK
*
Author to whom correspondence should be addressed.
Energies 2024, 17(4), 876; https://doi.org/10.3390/en17040876
Submission received: 10 December 2023 / Revised: 14 January 2024 / Accepted: 6 February 2024 / Published: 14 February 2024
(This article belongs to the Section A3: Wind, Wave and Tidal Energy)

Abstract

:
Wireless monitoring systems for the marine environment are important for rapidly growing subsea developments. The power supply of wireless sensor nodes within the monitoring systems, however, is a major challenge. This study proposes a novel piezoelectric wave energy converter (pWEC) device to power the wireless sensing nodes. Unlike previous studies, the proposed device utilizes contactless pWEC technology in which a spring pendulum provides a two-stage frequency amplification of 3.8 times for low-frequency wave environments. The pWEC device consists of a floating body, inner pendulum, spring pendulum, magnets and piezoelectric sheets. In order to harvest the energy from relatively low frequency ocean waves, the pWEC device is designed to have an enhanced energy-capturing frequency. The effects of internal pendulum mass, spring pendulum weight, pendulum length and spring stiffness on wave energy absorption are investigated using theoretical and numerical analysis combined with laboratory experiments. The slider that drives the motion of the piezoelectric sheet vibrates at up to 3.8 times the wave frequency. To test the piezoelectric generators in the laboratory environment, a mechanical structure is set up to simulate the motion of the external floating body and the internal wave energy converter under the action of waves. When the four piezoelectric plates are arranged horizontally, the average output power per plate is increased by 2.4 times, and a single piezoelectric plate can generate an average of 10 mW of power. The proposed piezoelectric wave energy converter device has the potential to provide long-term energy supply for small ocean monitoring platforms at remote locations with reasonable wave energy resources.

1. Introduction

With increasing human exploration in the ocean environment, wireless network monitoring technology is in greater demand for the marine platform monitoring of marine ecological environments, the measurement of temperature, seawater salinity, and other oceanographic and meteorological properties, and tsunami and typhoon warning [1,2,3,4,5]. A variety of wireless sensors are deployed inside small multi-parameter ocean monitoring buoys, which have the advantages of low energy consumption and real-time data transmission suitable for a complex marine environment [6,7,8].
Batteries are the main power supply of current wireless sensor nodes [9]. However, ocean buoys are far from land and batteries typically have a short lifespan, so that batteries have to be replaced at regular intervals and the labour and cost are often not feasible in practical engineering applications. In addition, the large number of discarded chemical batteries pollute the natural environment [10,11]. Therefore, there is an urgent need to use clean energy sources such as solar, wind and ocean waves instead of chemical batteries as the power supply for wireless sensor networks. Among these renewable energy sources, ocean waves possess the highest energy density of ~2–3 kWm−2. In addition, ocean wave energy has the advantage of an uninterrupted and continuous supply of energy over other renewable energy sources [12,13,14,15,16].
Due to limited marine space available for wave energy farms in coastal regions, it is difficult to establish large-scale wave power generation facilities there. In the deep ocean, offshore wave energy reserves are huge and more stable, but the maintenance cost of the wave energy devices is high [17]. Therefore, one of the main challenges for the large-scale commercial deployment of wave power devices is their high economic cost and long payback period [18,19].
Piezoelectric power harvesters convert strain energy into electrical energy directly [20], and therefore have a higher energy conversion efficiency than traditional mechanical and hydraulic energy converters. Piezoelectric materials also have good corrosion and electromagnetic interference resistance, low heat generation and are easy to process and fabricate. Therefore, wave piezoelectric power generation has become a popular technique to recharge power for small- and micro-powered devices at seas [21]. However, the frequency (below 1 Hz) of ocean waves is much lower than the energy harvesting frequency band of piezoelectric transducers. To harvest energy, piezoelectric transducers require vibrations with higher magnitudes and frequencies than those in ocean waves [22]. Therefore, vibration-frequency-increasing piezoelectric wave energy converters (pWECs) have become a popular topic recently [23,24]. A comprehensive review of the state-of-the-art research on pWECs can be found in [25,26]. Mechanical contacts and magnetic impacts are commonly used vibration-frequency-increasing conversion techniques for piezoelectric cantilever beams.
Extrusion and collision are the two mechanical contact methods for pWECs. Viet et al. (2018) designed a harvester that comprises four magnetic bar-mass-spring-lever-piezoelectric arrays. The harvester is able to transform the low-frequency ocean wave motion into higher excitation frequency motions within the device and amplify the force of the piezoelectric transducer for a higher power [27]. Wu et al. (2018) attached piezoelectric material to the surface of small clamps, and connected several small clamps in series into a spring-like structure. During the swinging process, the piezoelectric clamps were constantly stretched and deformed to generate electric energy. Meanwhile, the device makes use of the internal resonance of the spring pendulum to enhance the frequency response [28]. Okada et al. (2012) and Vinolo et al. (2013) connected metal balls with wires and rods, respectively, inside a floating body. When the floating body rolled under wave actions, the balls constantly collided with the piezoelectric plate to produce electric energy. Their results show that the vibration frequency of the piezoelectric vibrator was five times higher than the incident wave frequency [29,30]. Murray and Rastegar (2009) developed a two-stage electrical energy generator based on the piezoelectric mechanism, which converts the low-frequency unstable external force into the high-frequency stable vibration required for power output by touching the piezoelectric oscillator with a metal paddle [31]. These piezoelectric energy harvesters are all placed inside a floating body to generate electricity by converting the horizontal rocking motion of the floating body, and therefore the lifespan of the piezoelectric sheet may be shortened by sustained crushing and collisions.
Wickenheiser et al. (2010) attached a permanent magnet to the tip of a vibrating cantilevered beam where several ferromagnetic structures are installed to create a sequence of wells of attraction. These ferromagnetic structures remain stationary while the base moves [32]. Thus, this design is well-suited for harvesting energy from the relative motion of two structures moving past each other. This method has been widely studied in recent years. Han et al. (2011) proposed a rotating piezoelectric energy harvester using the magnetic force generated by permanent magnets to produce power. This device can collect wave energy at low-frequencies and can be tuned to different frequencies [33]. Xie et al. (2014) developed a piezoelectric buoy energy harvester made of a composite structure, including vibrator, slider and buoy, to extract energy from ocean waves [34]. Magnetic impact wave energy convertors use non-contact force to capture energy, which can extend the service life of piezoelectric materials. This method typically harvests wave energy through the relative displacement of the upper and lower floating bodies, so confinement is more difficult to guarantee, and the connection among components is complex and the energy loss is larger. So, recent studies have mainly focused on parameter optimizations and energy efficiency of non-contact pWEC [35,36,37,38,39,40,41].
In this paper, a pWEC with a built-in coupled pendulum is proposed to supply power to wireless sensor nodes of marine monitoring systems. The device combines the advantages of built-in pendulum and dual floating wave energy absorption mechanisms. The compactness of the power generation device and the long service life of the piezoelectric plate ensure the reliability of the device. Therefore, the device can be deployed in the open seas for a prolonged period of time. At the same time, the low energy production cost is conducive to its application to large-scale monitoring networks. Furthermore, the single pendulum motion of the internal pendulum activates the slider in the spring pendulum system to produce vibration. The internal resonance of the spring pendulum system amplifies the response frequency, and then the permanent magnet block array on the slide repeatedly impacts the piezoelectric cantilever beam to produce higher frequency oscillations. The present device can overcome the low power generation efficiency of piezoelectric cantilever beams under relatively low-frequency wave action.

2. Methodology

2.1. Structural Design of the Device and Principle of Operation

In this paper, a novel wave energy converter (WEC) is proposed, as shown in Figure 1. The energy transfer process of the device consists of three stages. At the first stage, the external spherical floating body is displaced by the oscillating wave force FH in the horizontal direction. Under the action of inertia, the inner pendulum is displaced to a certain initial swing angle. At this stage, wave motion determines the swing state of the inner pendulum. The wave kinetic energy is converted into the mechanical energy of the inner pendulum.
At the second stage, the time-varying mechanical energy of the inner pendulum is converted into the more stable mechanical energy of the spring pendulum block because the spring can effectively store the mechanical energy. After coupling with the inner pendulum, the spring pendulum block can still vibrate stably for a period of time even if there is a large change in the displacement of the inner pendulum. At the third stage, the mechanical energy in the spring pendulum block is transformed into electrical energy. The spring pendulum block will vibrate up and down along the pendulum that swings back and forth and periodically generate electricity by continuously impacting the piezoelectric sheet with a magnet at the end through permanent magnetism to generate the vibration of the piezoelectric sheet. Figure 2 shows the working mechanism of the device.
Piezoelectric materials are sensitive to temperature variations, so temperature will affect the piezoelectric properties and therefore the performance of the present system. The piezoelectric ceramic PZT5 used here performs normally as expected at a working temperature between −20 °C and 50 °C, and the temperature in Zhoushan sea area is between 3 °C and 28 °C. The present piezoelectric system is not suitable for working at a temperature higher than 50 °C.

2.2. WEC Operation

In order to achieve effective power generation, two core issues need to be addressed. The first is the selection of the geometry of the external spherical floating body to achieve maximum motion or resonance under the wave action. The second issue is to increase the oscillation frequency of the internal coupled pendulum+ spring system to maximize the electrical energy output through the piezoelectric sheets. It is challenging to optimize the energy output performance of the system. Fortunately, the response of spherical floating bodies to wave action has been studied widely. Therefore, this paper focuses on the design optimization, simulation, and laboratory tests of the internal power generation and the mechanical system within the floating sphere.

2.3. Governing Equations

The device consists of a moving external floating sphere under the wave action and a swinging spring pendulum inside the sphere under the action of inertia, and a piezoelectric sheet that produces electricity under the impact of the spring pendulum oscillator block.
The wave force acting on a floating body consists of horizontal and vertical components. The former is much larger than the latter in relatively shallow water depths where the horizontal wave motion is dominant. In order to investigate the mechanism and parameter optimization of the proposed pWEC, for simplicity of analysis, we assume a periodic horizontal wave force as shown in Equation (1), and its frequency is close to the frequency of the intended study site of Zhoushan sea area.
F H = D h cos ω t
where FH is the oscillatory horizontal wave force, Dh is the amplitude, and ω is the angular frequency of the force.

2.3.1. Inner pendulum

In Figure 3, B represents the damping at the pendulum axis, MR represents the mass of the inner pendulum, ml represents the mass of the smooth linear guide rod, l is the pendulum length, θ represents pendulum angles and h is the height difference under different pendulum angles.
Under the action of inertia, the single pendulum system inside the spherical floating body will undergo a reciprocating motion if it is displaced to an initial swing angle. Figure 3 provides a schematic diagram of the inner pendulum, and its dynamic equation can be written as
I d 2 θ d t 2 + B d θ d t + M R g l + m l g l 2 sin θ = 0
where I represents the total moment of inertia given by
I = I 0 + M R l 2 + 1 3 m l l 2
where I0 represents the moment of inertia at the pendulum axis.
Here, let x1, y1 be as follows,
x 1 = m l M R , y 1 = I 0 M R l 2
Then,
I = 1 + x 1 3 + y 1 M R l 2
When neglecting the damping of the pendulum axis, that is x1, y1 = 0. The dynamic equation of a single pendulum can be written as
d 2 θ d t 2 + g l sin θ = 0
Under the assumption of a small angle, sin θ θ , its resonant angular frequency is
ω b 1 = g l
When the swing amplitude is large, the initial falling angle of the pendulum ball is θ0 and when the drop is h, it falls to the angle θ, as shown in Figure 3. In this process, a simple oscillation satisfies
h = l cos θ l cos θ 0 M R g h = M R ( l θ ˙ ) 2 2
d θ d t = 2 g l cos θ cos θ 0
The angular frequency of a large amplitude pendulum is approximately given by
ω b 2 = ω b 1 1 1 + 1 4 π sin 2 θ 0 2 + 3 16 π sin 4 θ 0 2 +
It can be seen that the angular frequency of a simple pendulum at small amplitudes is only related to the length of the pendulum and has nothing to do with mass and other factors. When the swing amplitude increases, the angular frequency of a simple pendulum no longer remains constant, but is related to the amplitude.
Based on the above, the expression of the natural angular frequency of the inner pendulum is:
ω g i = ω b i 1 1 + x / 3 + y i = 1 , 2
When the inertial pendulum is subjected to external force F H (see Equation (1)), the governing equation for the inner pendulum is given by
I d 2 θ d t 2 + B d θ d t + M R g l + m l g l 2 sin θ = D h cos ω t
which may be rewritten as
d 2 θ d t 2 + b d θ d t + ω g 1 2 sin θ = D h cos ω t I
where b = B/I. Considering the linear approximation of Equation (13), that is sin θ θ , its linear solution is
θ = θ 0 cos ( ω t + ε ) , θ 0 = D h ω g 1 2 ω 2 2 + b 2 ω 2
The amplitude of the frequency response function of the pendulum described in (2) is
| W ( j ω ) | = 1 ω g 1 2 ω 2 2 + b 2 ω 2
where ωg1 represents the natural frequency of the inner pendulum. The closer the natural frequency is to the external excitation frequency, the greater the oscillation amplitude of the inertial pendulum. Therefore, the natural frequency of the pendulum system is an important design consideration to achieve large swing angle θ and, therefore, high energy conversion efficiency.

2.3.2. Spring Pendulum

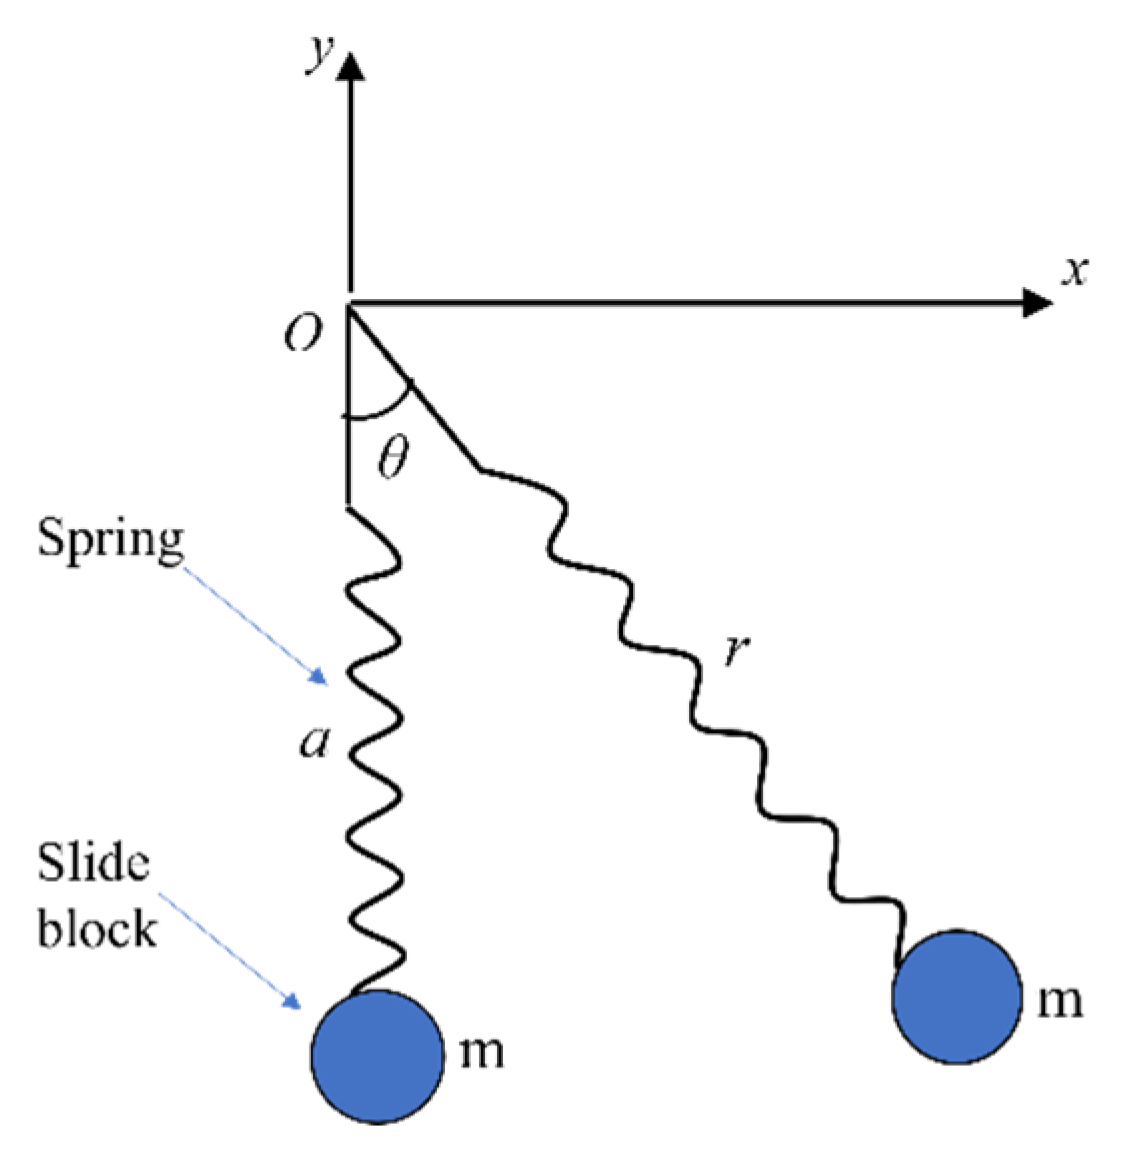
Figure 4 shows the sketch of the spring pendulum system. With the swing of the inner pendulum, the spring pendulum will continue to swing and expand. Assuming that the initial length of the spring is a, r is the length of the spring after deformation, ω k is the natural frequency of the spring, and m is the mass of the slide block, the displacement of the slide block at the end of the spring is given by its coordinates (x, y). The sketch of the spring pendulum is shown in Figure 4. To simplify the problem, the plane polar coordinate system is adopted:
y = r cos θ x = r sin θ
The kinetic energy of the system is given by
T = 1 2 m r ˙ 2 + r 2 θ ˙
The potential energy is given by
V = 1 2 ω k ( r a ) 2 m g r cos θ
Following Miles and Zou (1993) [23], the Lagrange for the present system is given by
L = T V = 1 2 m r ˙ 2 + r 2 θ ˙ 1 2 k ( r a ) 2 + m g r cos θ
Substituting (8) into the Lagrange equation yields
d d t L r ˙ L r = F H d d t L θ ˙ L θ = 0
The governing equation of the motion of slide block is given by
m r θ ˙ 2 k r a + m g cos θ = m r ¨ m r 2 θ ¨ + 2 m r ˙ r θ ˙ + m g r sin θ = 0

3. Model Results

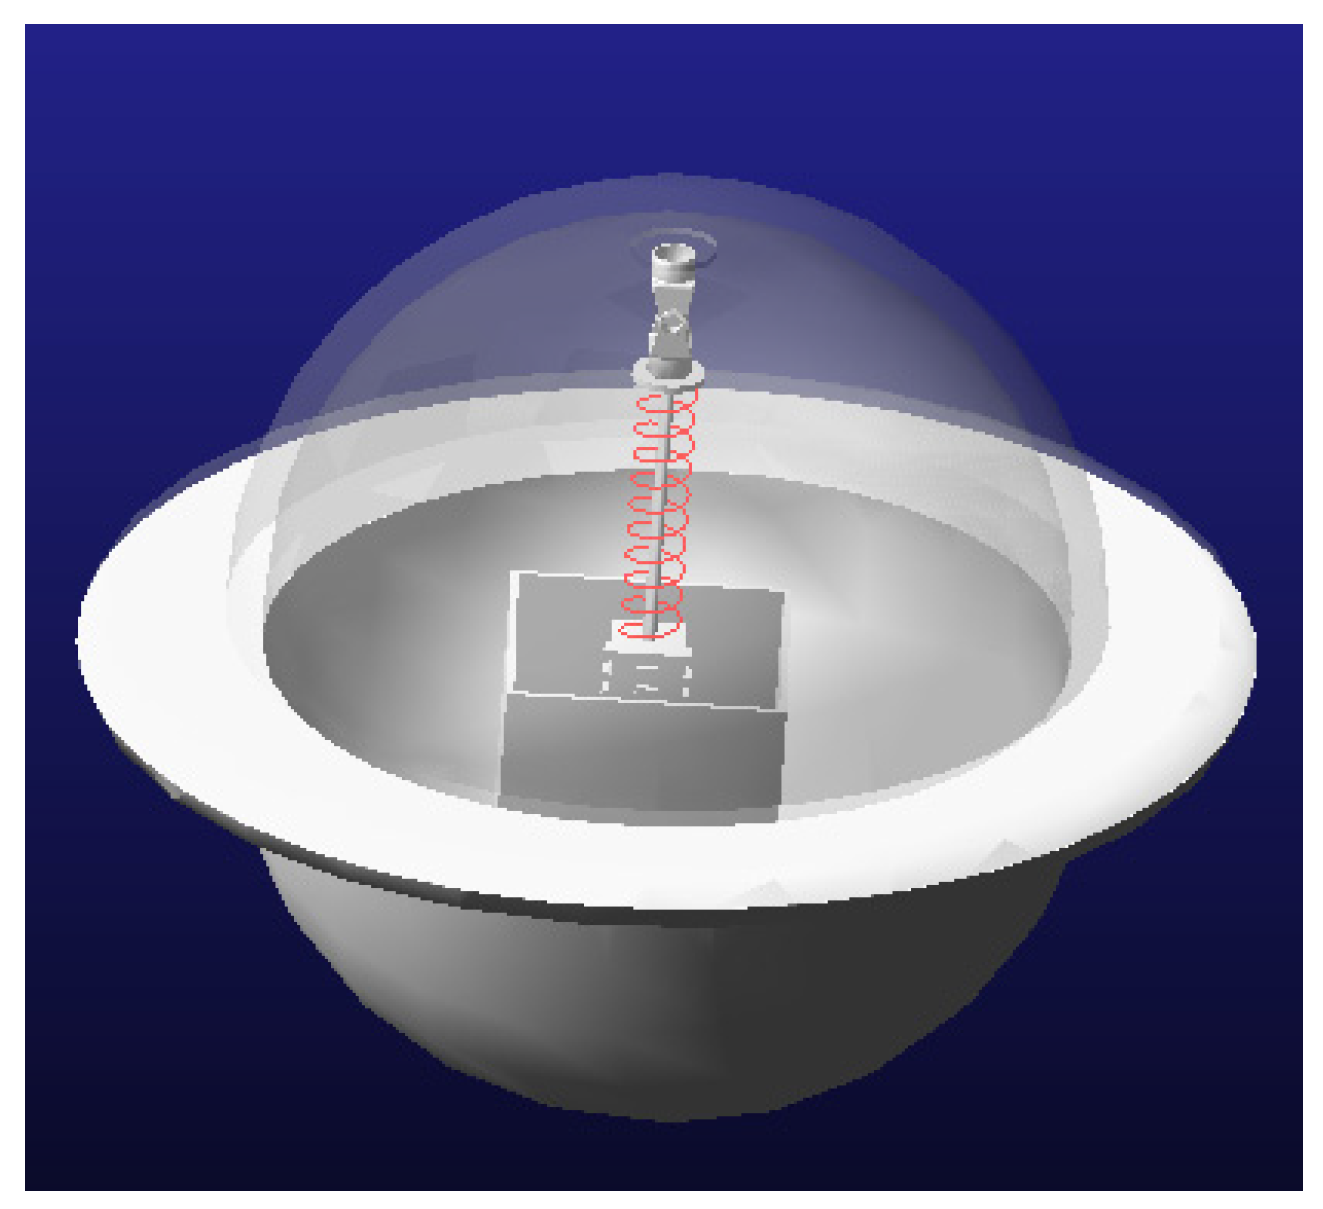
The stiffness, vibrator mass and initial length of the spring are the key parameters that affect the motion response of the spring pendulum system. Following Miles and Zou (1993) [23], the ADAMS method is used to solve the governing Equation (21) numerically to identify the optimum design parameters for energy conversion efficiency and understand the coupled dynamics of the pendulum system. Table 1 shows the dimensions of the main components of the system. Figure 5 is a schematic diagram of the pendulum system, and Figure 6 is the WEC modelling diagram.
According to the wave data in the sea area near the Zhoushan Islands, the technical design parameters of the floating body are as follows: the radius of the body is R = 60 cm, the average wave period is T = 2 s, the effective wave height is H = 1.1 m, and the water depth is h = 15 m. According to the description of the relationship between wave force and floating body by Garrison and Rao (1970) [42], the horizontal diffraction coefficient of the floating body is 1.07. Then, we can obtain the wave force on the floating body, as shown in Figure 6, and the maximum wave force is 1467 N, as shown in Figure 7.
The period of the motion of the floating body is approximately the same as the wave; however, the inner pendulum swinging in response to forcing is not purely sinusoidal due to the coupling of the inner pendulum and the spring pendulum. The response of the whole coupled pendulum system is determined by the swing angle and natural frequency of the inner and spring pendulum. Since the slide block mass at the end of the spring pendulum keeps moving up and down along the linear bearing, the centre of mass of the coupled pendulum system keeps changing, which affects the dynamics of the coupled pendulum system, so that the dynamics of the inner pendulum motion are not purely sinusoidal.

3.1. Effect of Inner Pendulum Parameters on WEC Efficiency

There are two main parameters, length and mass, which affect the swing efficiency of the inner pendulum. In order to investigate the influence of these inner pendulum parameters on the dynamical response of the pendulum under external excitations such as wave motion, simulations were performed using ADAMS (2020) simulation software to obtain the variation in the swing amplitude of the inner pendulum for a range of pendulum weights and lengths.
Here, in order to simplify the analysis of the coupled pendulum system, the slide block mass m = 0.6 kg and spring stiffness k = 40 N/m are fixed, initially.
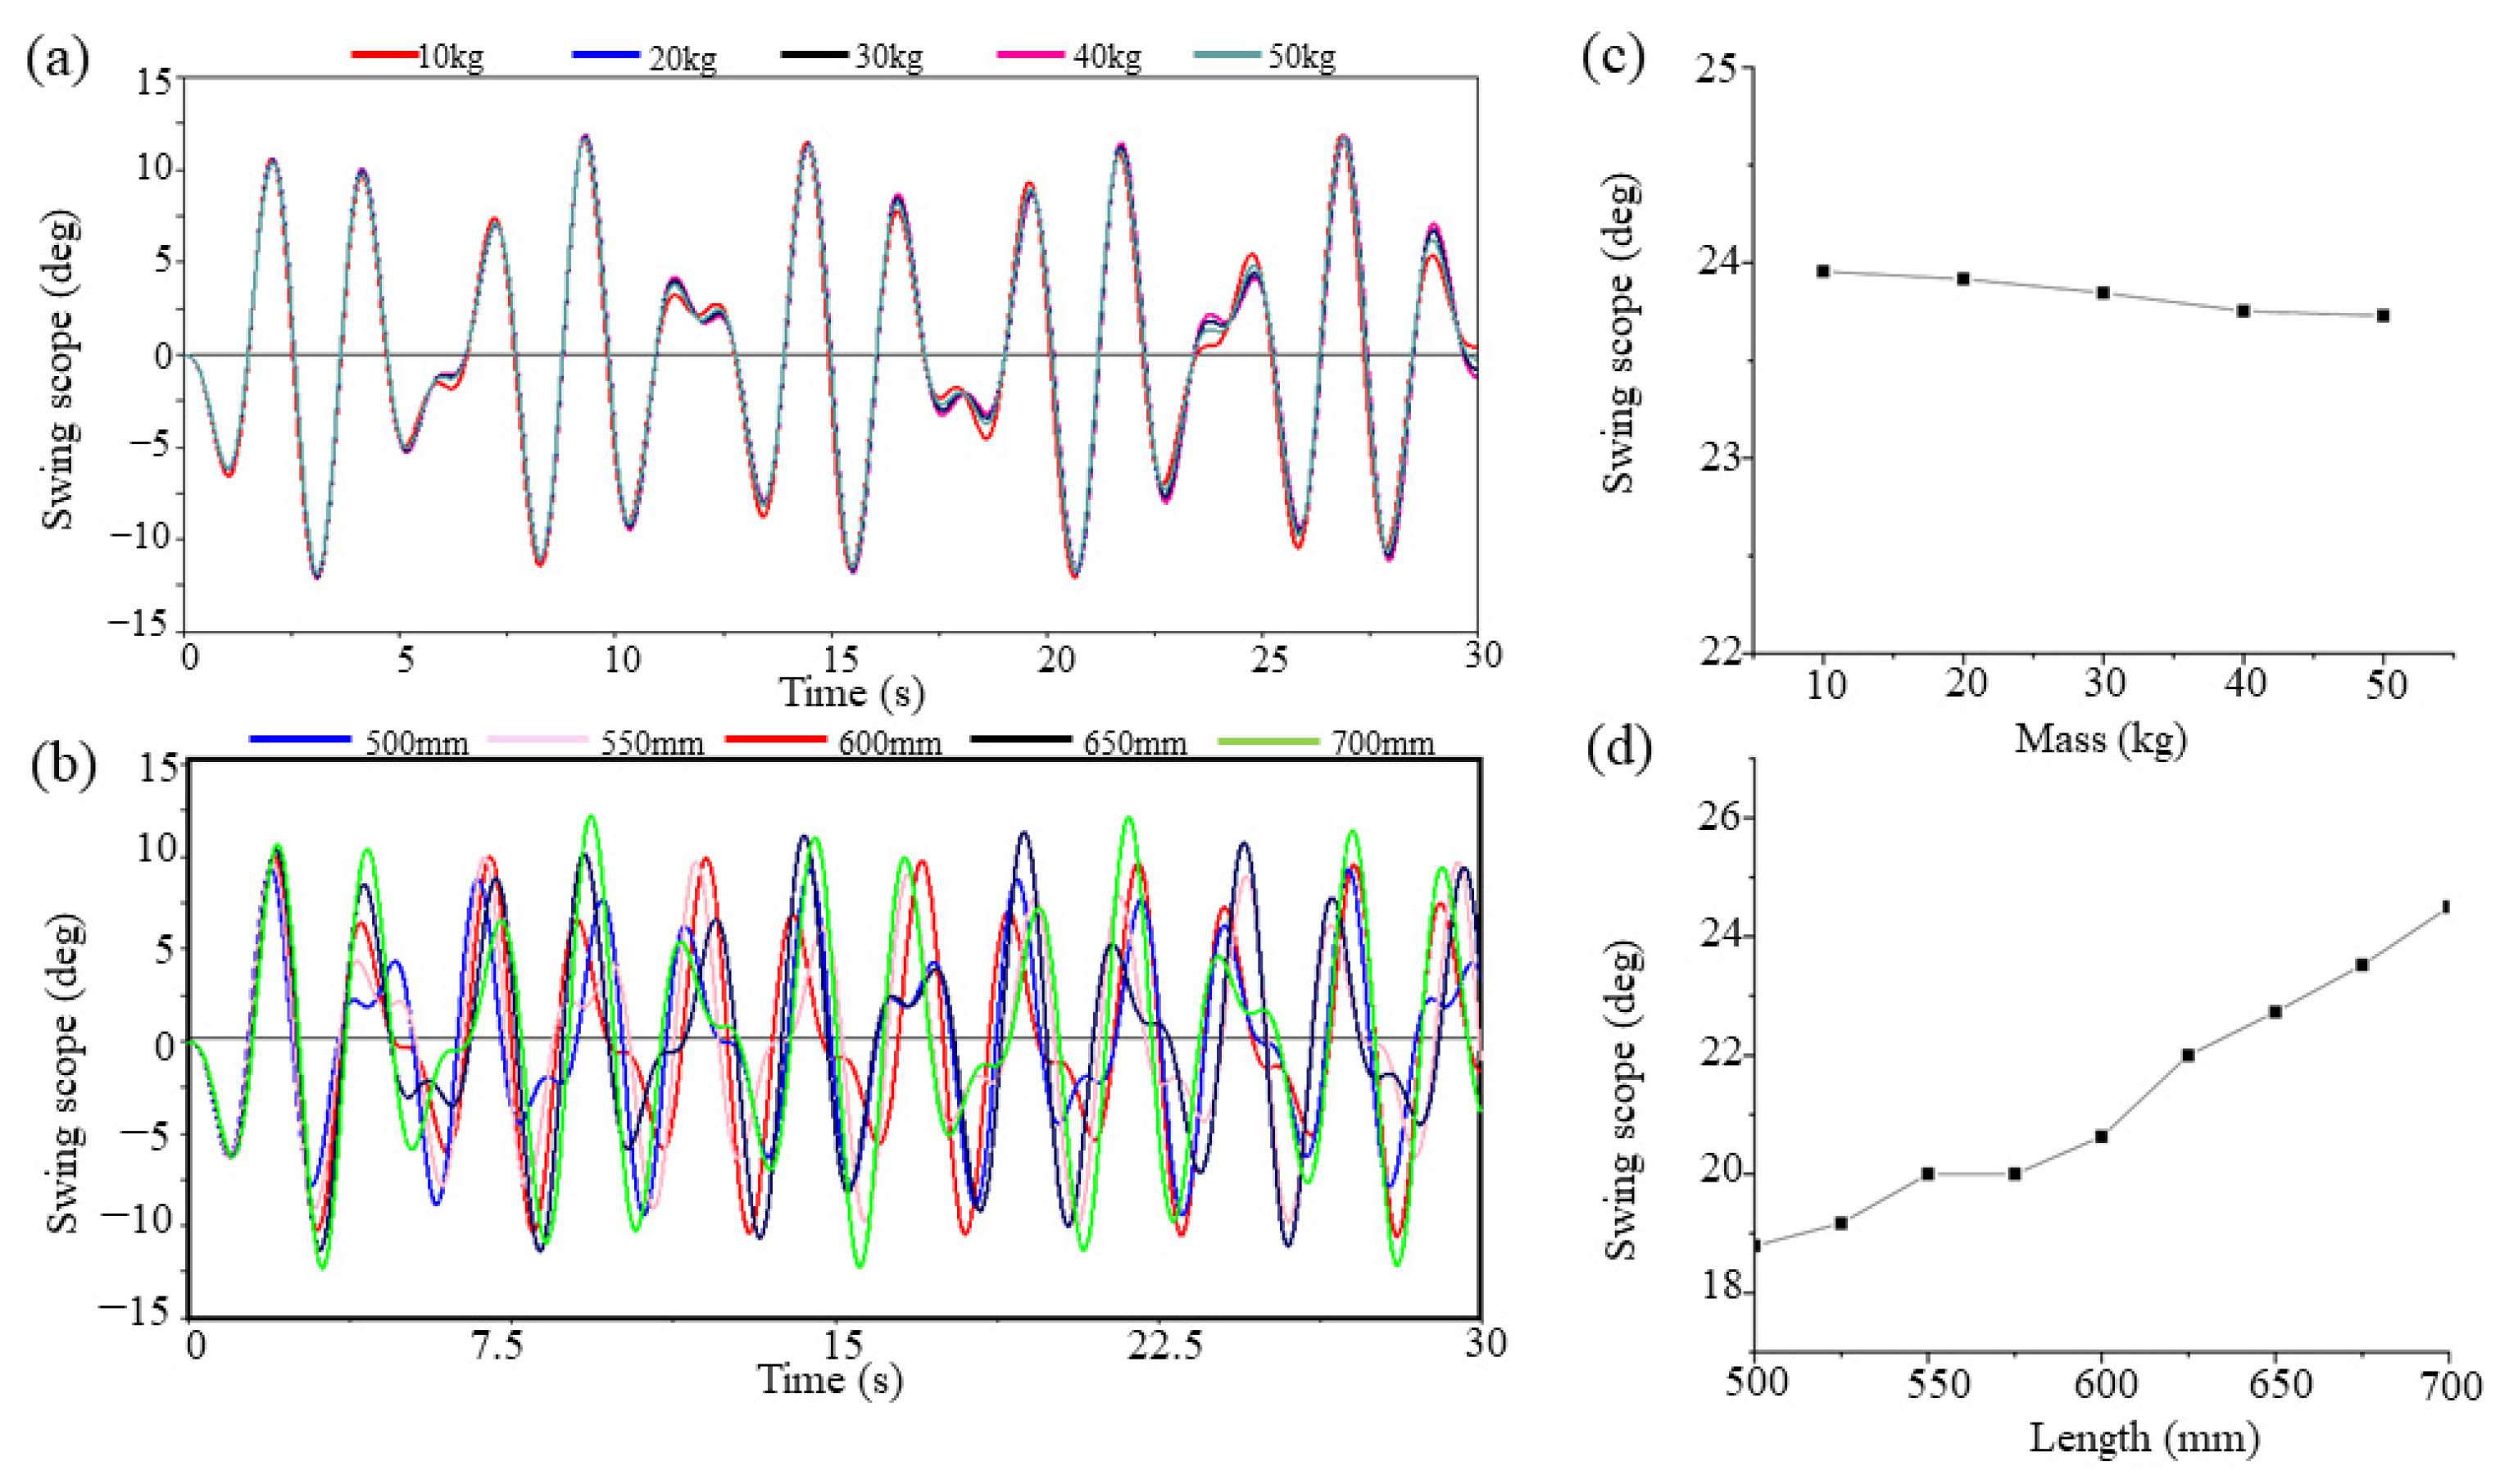
Firstly, the pendulum length parameter is set at l = 600 mm. Then, the inner pendulum mass is varied from 10 kg to 50 kg in increments of 10 kg. Secondly, the inner pendulum mass is set at 30 kg. Then, nine simulations are conducted with a pendulum length ranging from 500 mm to 700 mm in increments of 25 mm.
As shown in Figure 8a,c, the intrinsic angular frequency of the inner pendulum remains almost the same after the pendulum weight increases from 10 kg to 50 kg, and the amplitude of the pendulum is slightly reduced. As shown in Figure 8b,d, with the increase in the pendulum length, the pendulum amplitude increases. The intrinsic angular frequency of the inner pendulum is slightly different due to the moving up and down of the slide block of the spring pendulum.
In Figure 9a, the energy-capturing efficiency increased with increasing pendulum weight because the increased pendulum weight reduced the motion amplitude response of the inner pendulum under the wave action, which could accelerate the absorption of wave energy by the device. As shown in Figure 9b, as the pendulum length increased, the absorption of wave energy by the device first increased and then decreased, and then increased again. The kinetic energy was reduced partly due to the irregular motion of the coupled pendulum. The change in the initial length of the pendulum affects the natural frequency of the pendulum. At the same time, the inner pendulum was coupled with the spring pendulum, so that the motions of these two pendulums influenced each other. When the pendulum length was 600 mm, the frequencies of the wave action, the inner pendulum and the spring pendulum were not compatible with each other, resulting in decreased swing speed and energy absorption, as shown in Figure 9b. Therefore, we should not choose a pendulum length of around 600 mm to avoid low energy conversion efficiency.

3.2. Effect of the Spring Pendulum on Wave Energy Absorption

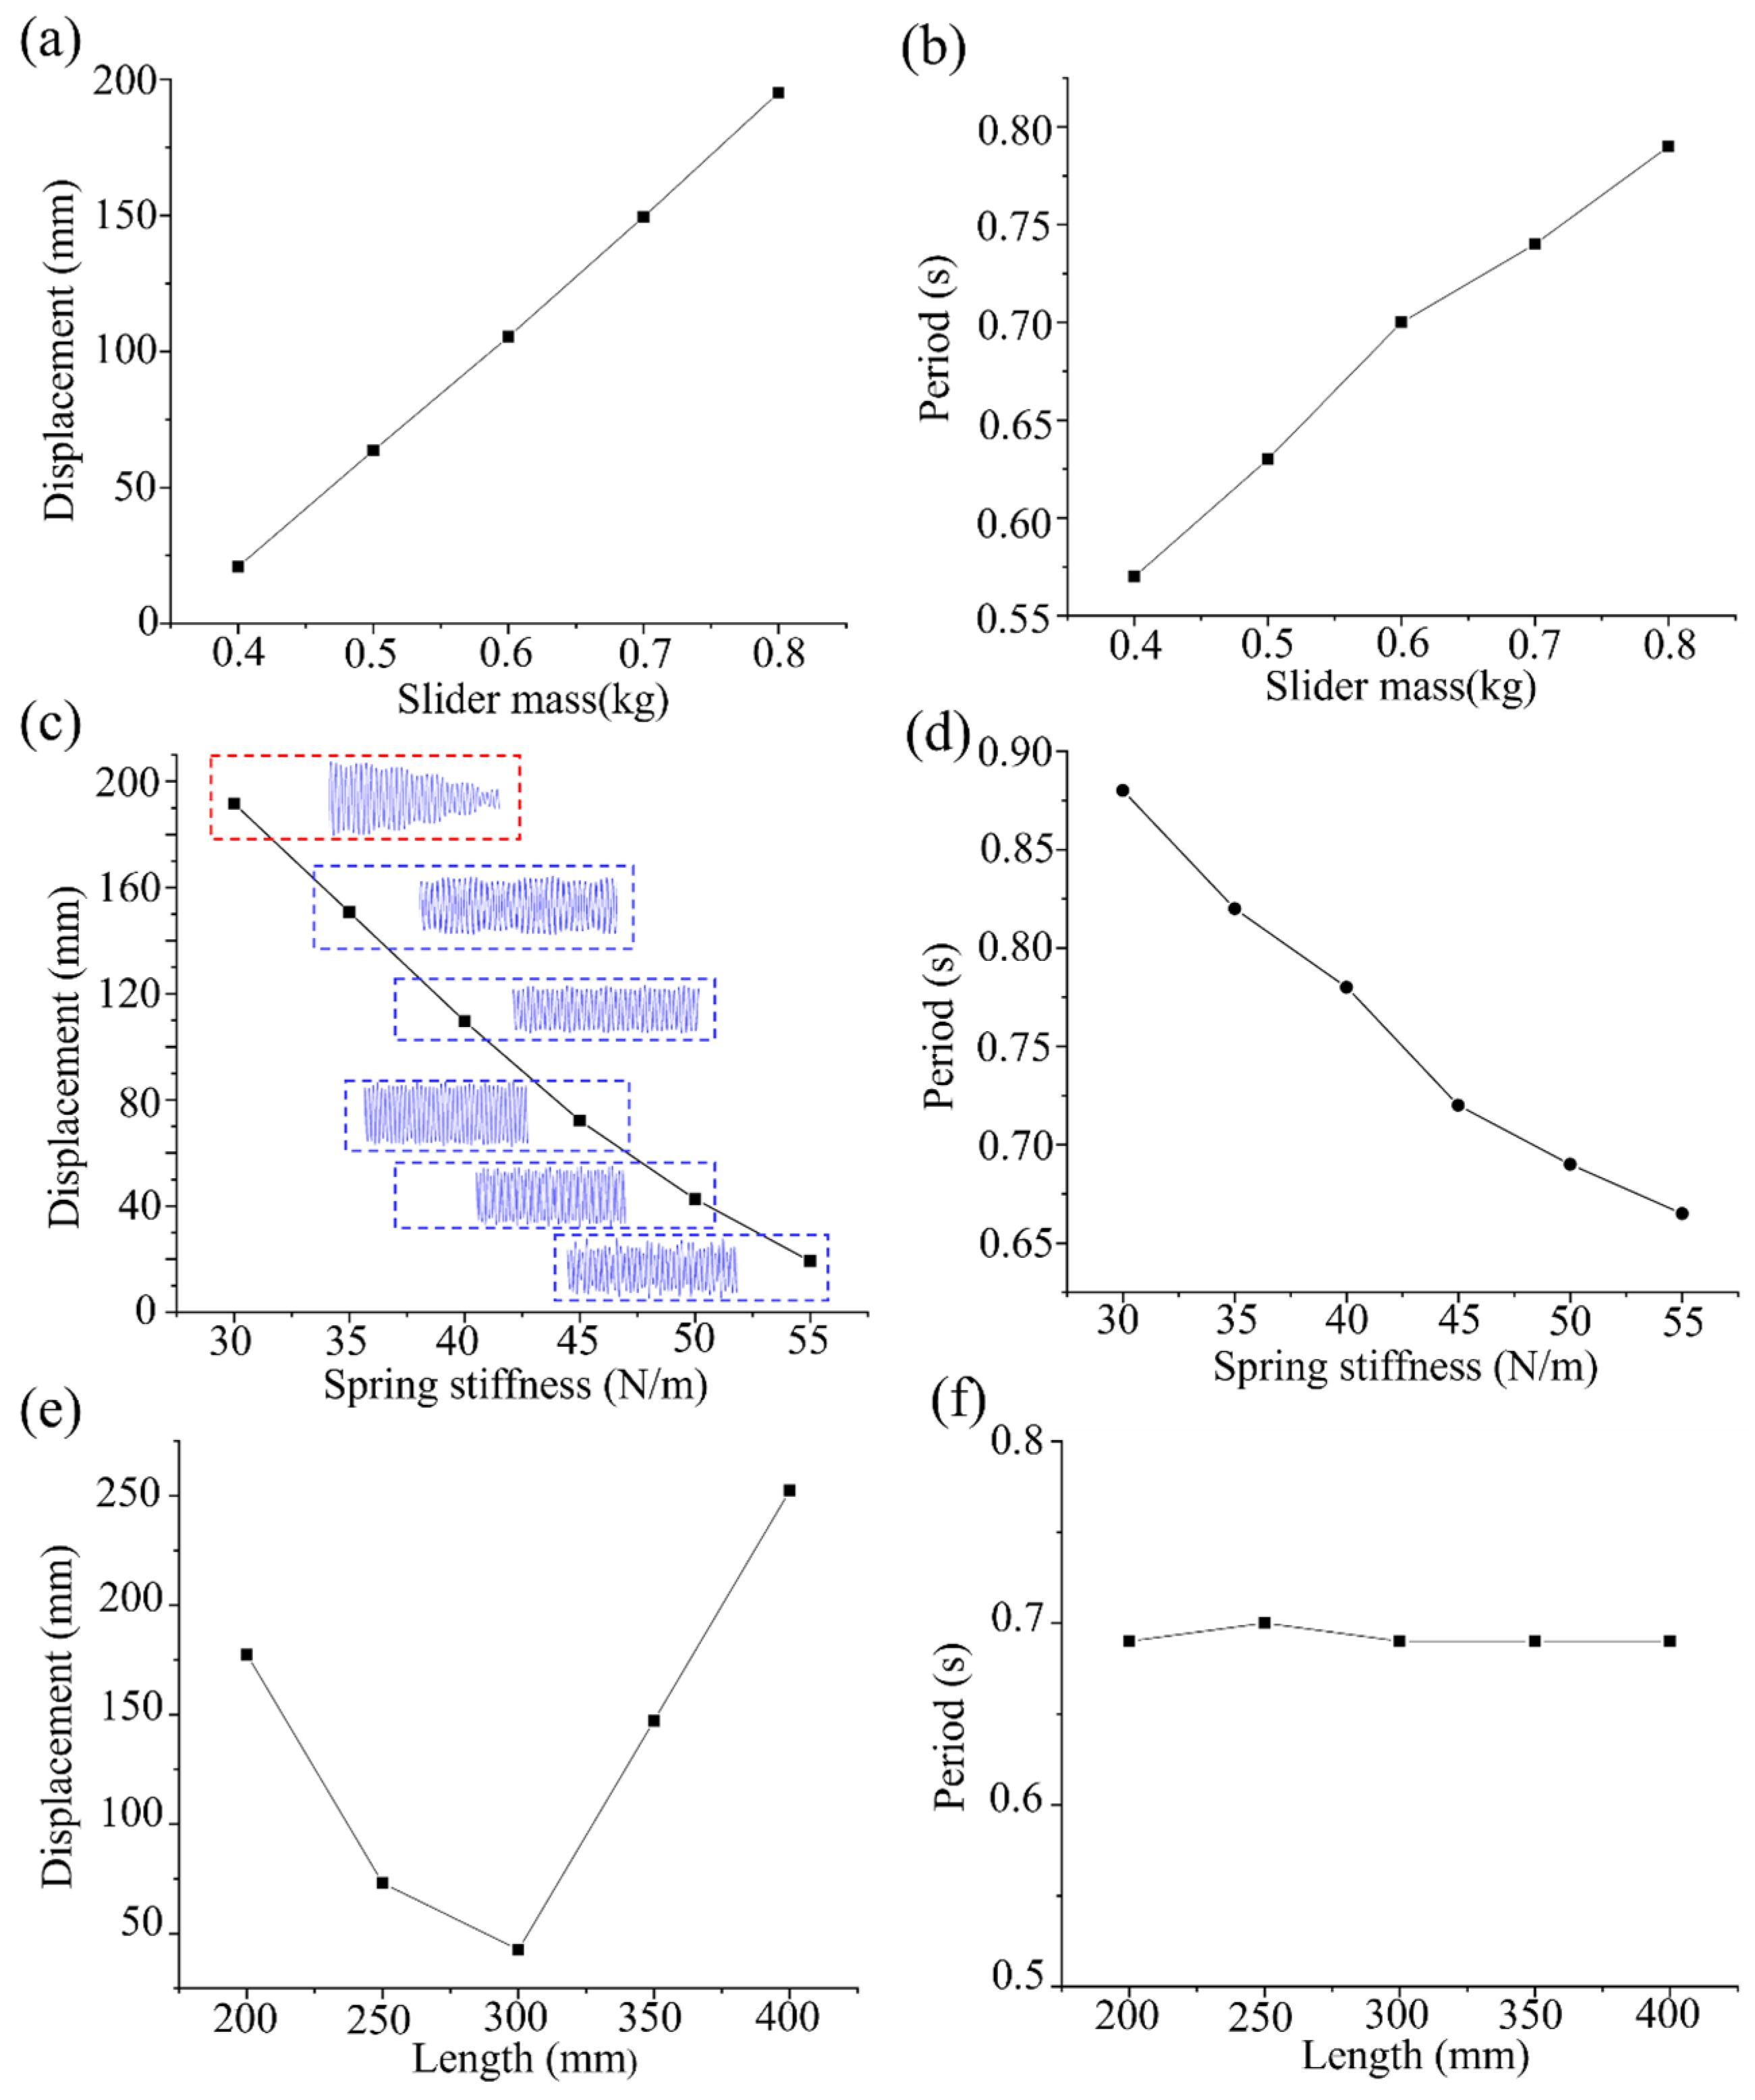
The effects of the slide block (or slider) mass, spring stiffness and spring original length on the spring pendulum system were calculated, and the model results are shown in Figure 10. As the slider mass increases, the maximum displacement of the slider increases (Figure 10a) and the period of motion also increases (Figure 10b), i.e., the spring vibration frequency decreases.
Under the action of wave force, the maximum displacement of the slider and the vibration period decreased with increasing spring stiffness, k. The vibration frequency increased to 3.8 times of the wave frequency (Figure 10c,d) at k = 55 N/m. This also verifies that the energy capturing frequency may be increased considerably through the resonance characteristics of the spring pendulum. It is worth noting that when the spring stiffness is reduced to k = 30 N/m, the slider displacement is different from the other five groups of simulation runs, and the vibration volume gradually decreases with time, which is caused by the collision of the slider of the spring pendulum with the mass of the inner pendulum.
Linear systems inevitably have a range of resonant frequencies and a limited bandwidth and behave efficiently at optimal frequencies and amplitudes, but lose responsiveness at other frequencies and amplitudes. However, nonlinear pendulum systems have a broader responsive bandwidth to random external forcing, which makes the device more versatile [43].
As shown in Figure 10e,f, as the initial spring length increases, the maximum slider displacement decreases first to a minimum value at spring length L0 = 300 mm and then increases, and the slider vibration period remains essentially unchanged. In Figure 10e, the variation of the slider displacement is non-monotonic and has a minimum due to the frequency of the wave action, the inner pendulum and the spring pendulum not being compatible with each other, which causes the swing speed and therefore the energy absorption to drop, as discussed earlier in Figure 9b. In order to improve the energy conversion efficiency, we should avoid choosing a spring length of around 300 mm.
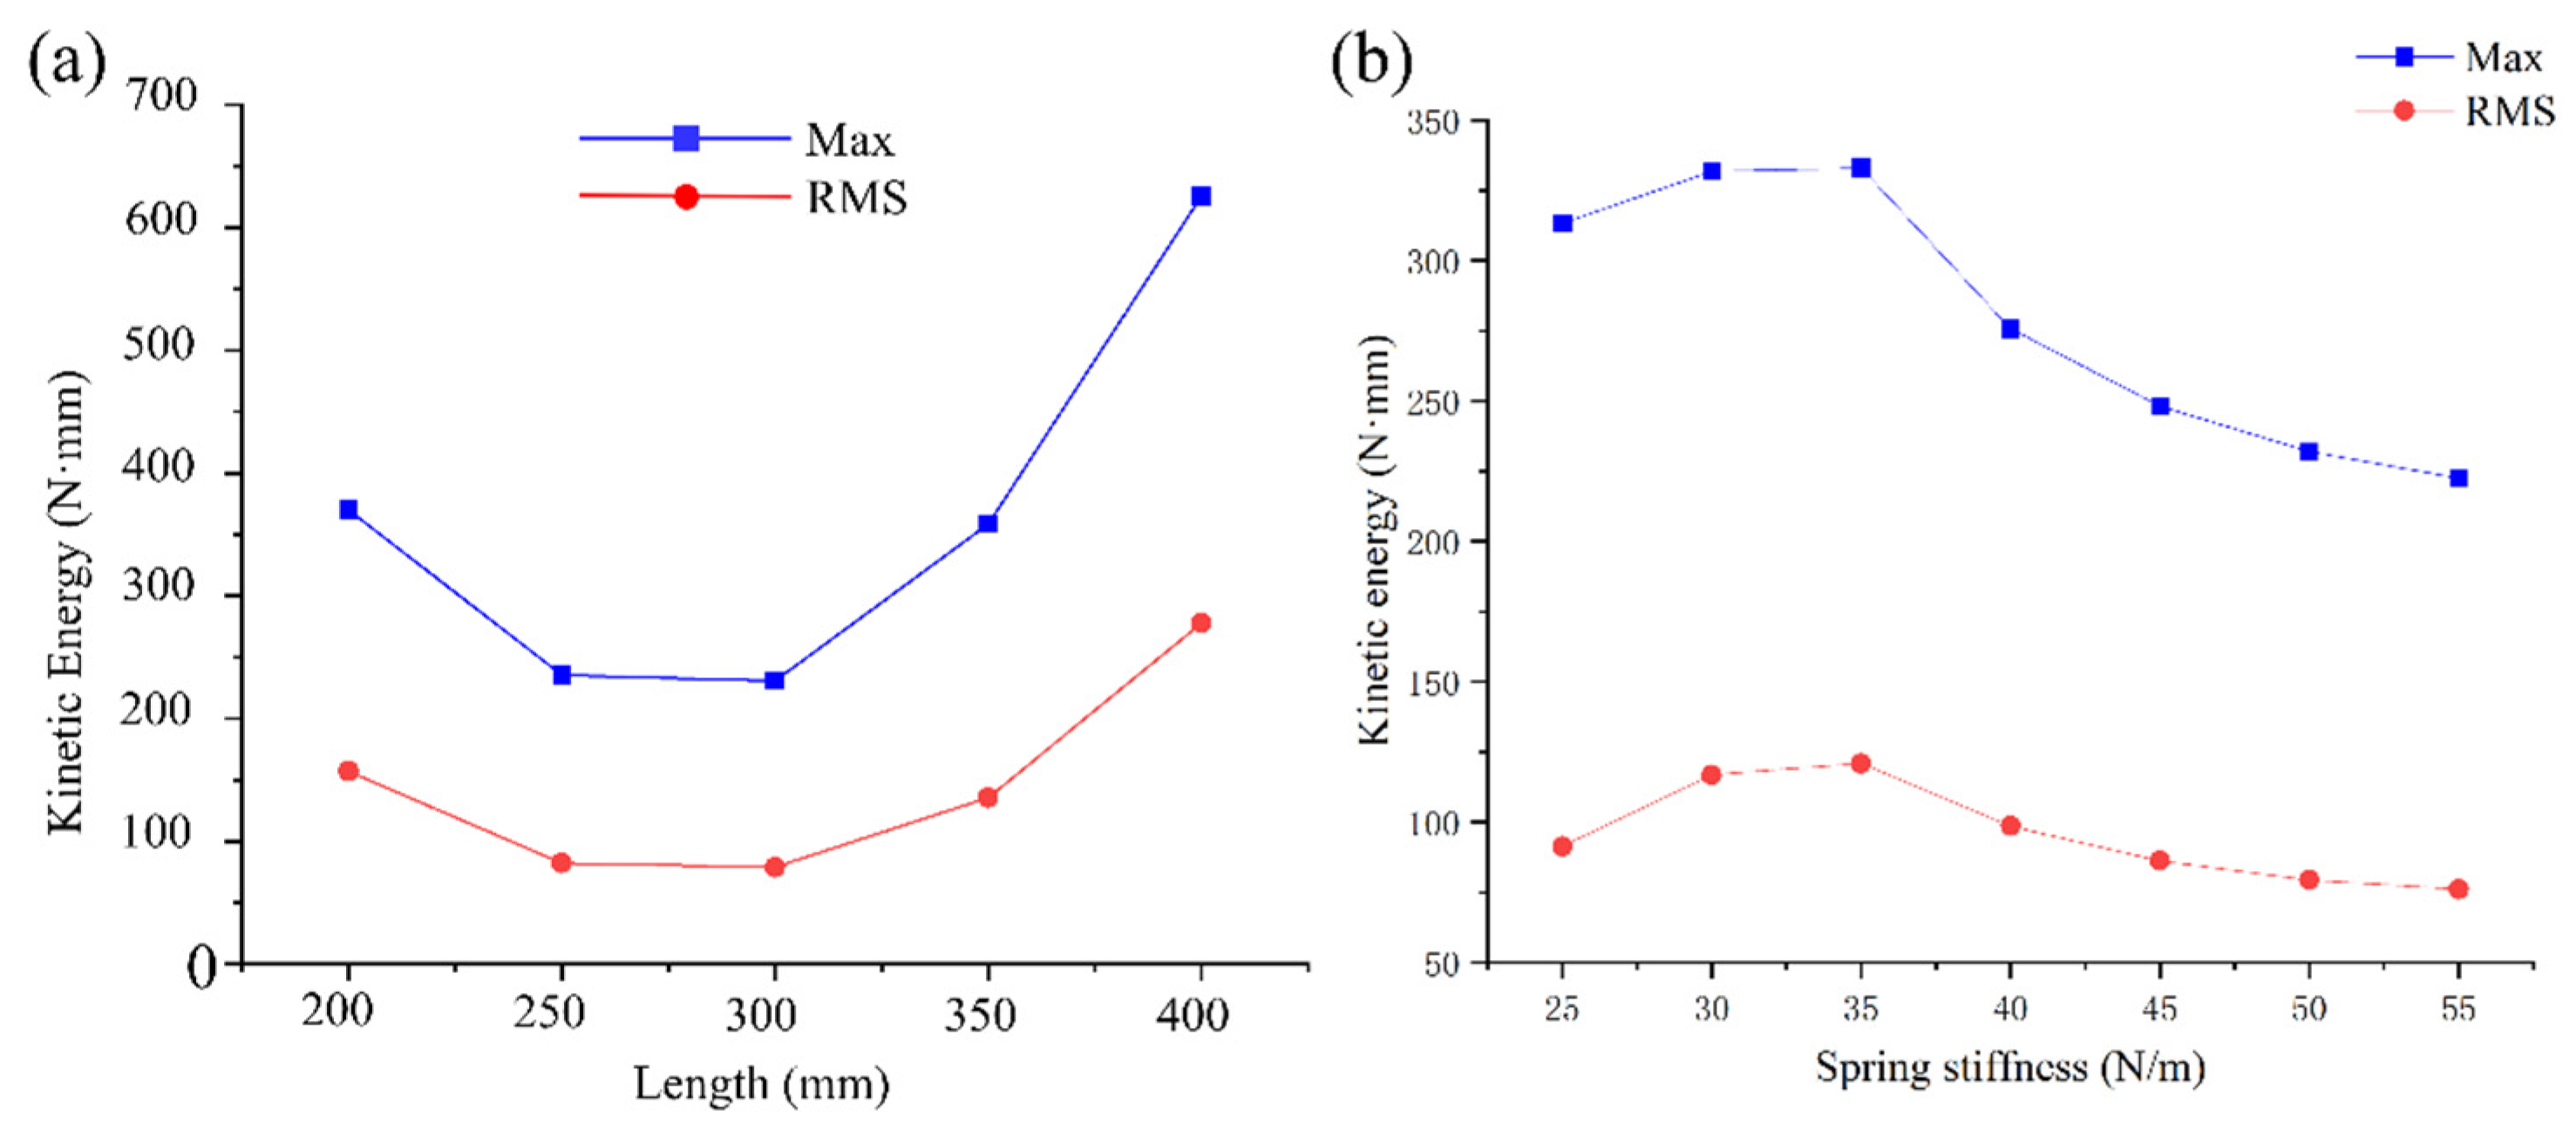
As shown in Figure 11a, the energy absorbed by the slider decreases at first and then increases with increasing initial spring length, with a minimum value of 93.1 N·mm at a spring length of 300 mm. As the spring stiffness k increases, the kinetic energy of the slider tends to increase and then decrease, as shown in Figure 11b, with the maximum value of 331.26 N·mm at k = 35 N/m. To achieve the highest energy conversion efficiency, a combination of spring length and stiffness is needed.

3.3. Further Discussion of Model Results

In order to increase the efficiency of piezoelectric power generation, higher slider vibration frequency and displacement are required. As can be seen from the previous simulation results, when the spring stiffness of 55 is selected, the slider vibration frequency is 3.8 times of the input wave frequency. When the subsequent magnet block hits the piezoelectric sheet, it will also bring a certain increase in frequency. Therefore, the system can achieve frequency amplifications. In addition, the effect of the slider displacement on the power generation of piezoelectric sheets is also very important. The foregoing analysis shows that the amplitude can be increased by appropriately reducing the stiffness of the slider. Therefore, the frequency and displacement increase of the slider are contradictory with each other, and this issue needs to be considered comprehensively.
In order to further analyse the motion displacement of the spring pendulum slider, we can introduce the ratio of the spring vibration frequency to the inner pendulum swing frequency to relate to the displacement of the slider, i.e.,
ω s ω i = k / m g / l
where ω s is the natural frequency of the spring, ω i is the natural frequency of the inner pendulum, k is the spring stiffness coefficient, m is the slider mass, g is the gravitational acceleration and l is the length of inner pendulum.
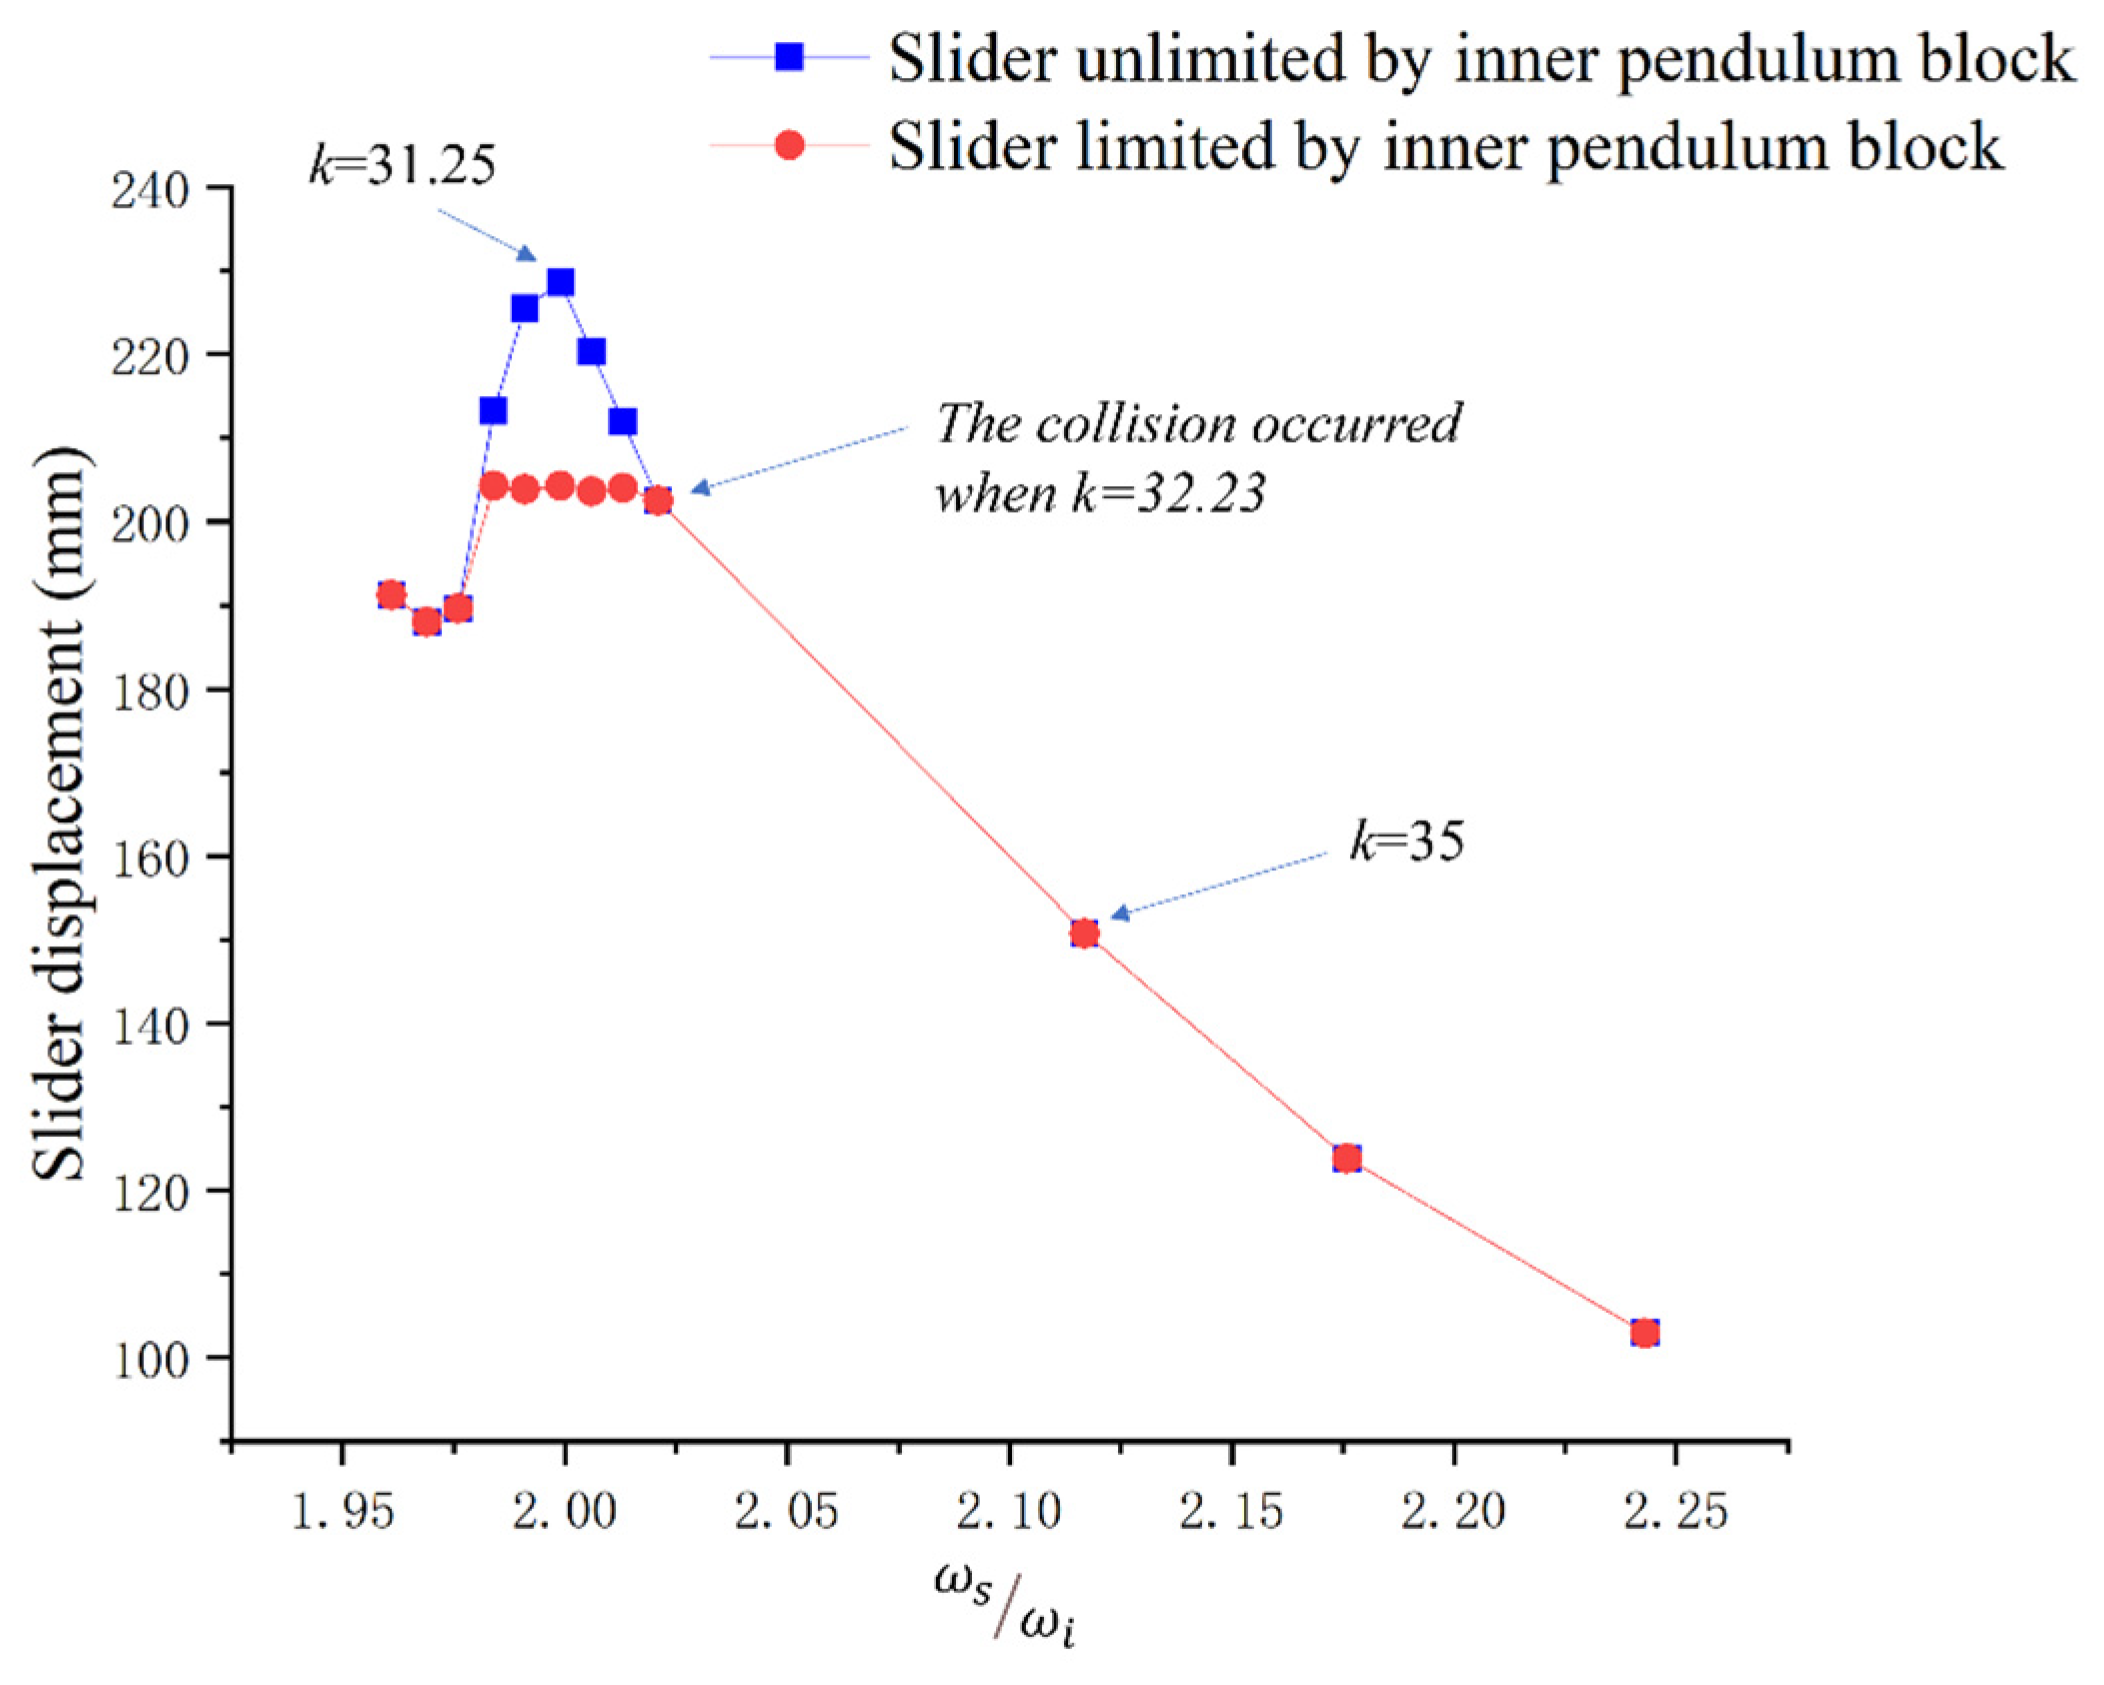
The vibration displacement diagram of the slider is shown in Figure 12. Two scenarios may occur, where one is that the slider is unlimited by an inner pendulum block, and the other is that the slider is limited by an inner pendulum mass. Shown in Figure 12 is the collision between the slider and the inner pendulum block when the spring stiffness is less than 32.23 N/m. If the slider is unlimited by the inner pendulum block, the slider displacement curve will peak at k = 31.25 N/m, where the spring pendulum attains an internal resonance. At this time, the ratio of the vibration frequency of the slider to the swing frequency of the inner pendulum is about 2, which is exactly the condition for the resonance of the spring pendulum [44]. In order to avoid collisions and the need for the selection of standard products for springs, the spring stiffness k = 35 N/m is finally selected.
In summary, according to the simulation results of the inner pendulum, as the position of the centroid of the inner pendulum moves down, the pendulum length increases, and the conversion of the wave energy first increases, then decreases, and then increases. When the inner pendulum length and mass are too large, the pendulum and the buoy will collide. So, the final selection of the inner pendulum mass was 20 kg and the length was 550 mm. From the simulation results of the spring pendulum and the energy absorption of the slider, the slider movement period and conversion efficiency of wave energy decreased with increasing spring stiffness and the spring length. However, the displacement of the slider increased with increasing spring length and slider mass, which would affect the service life of the spring. Considering the influence of the slider’s mass on its movement cycle, a slider mass of 0.6 kg, a spring length of 400 mm and a spring stiffness of 35 N/m were chosen as the optimum design parameters of the spring pendulum system.

4. Power Conversion Effectiveness

Through the ADAMS simulations, the optimal parameters for the coupled pendulum system were determined. At the same time, the relative motion of the spring pendulum slider is the most important excitation for the piezoelectric sheet to generate electricity and was also calculated and analysed. Therefore, an experimental system was designed to simulate the movement of this slider and analyse the power generation performance of the piezoelectric sheet. In order to verify the electromechanical coupling performance, a slider-crank mechanism was used to simulate the slider motion as the excitation source, and the power generation by the piezoelectric sheet was tested indirectly in the laboratory. Finally, the optimization of the array layout of excitation magnet and piezoelectric cantilever beam was studied.

4.1. Experiment Set-Up

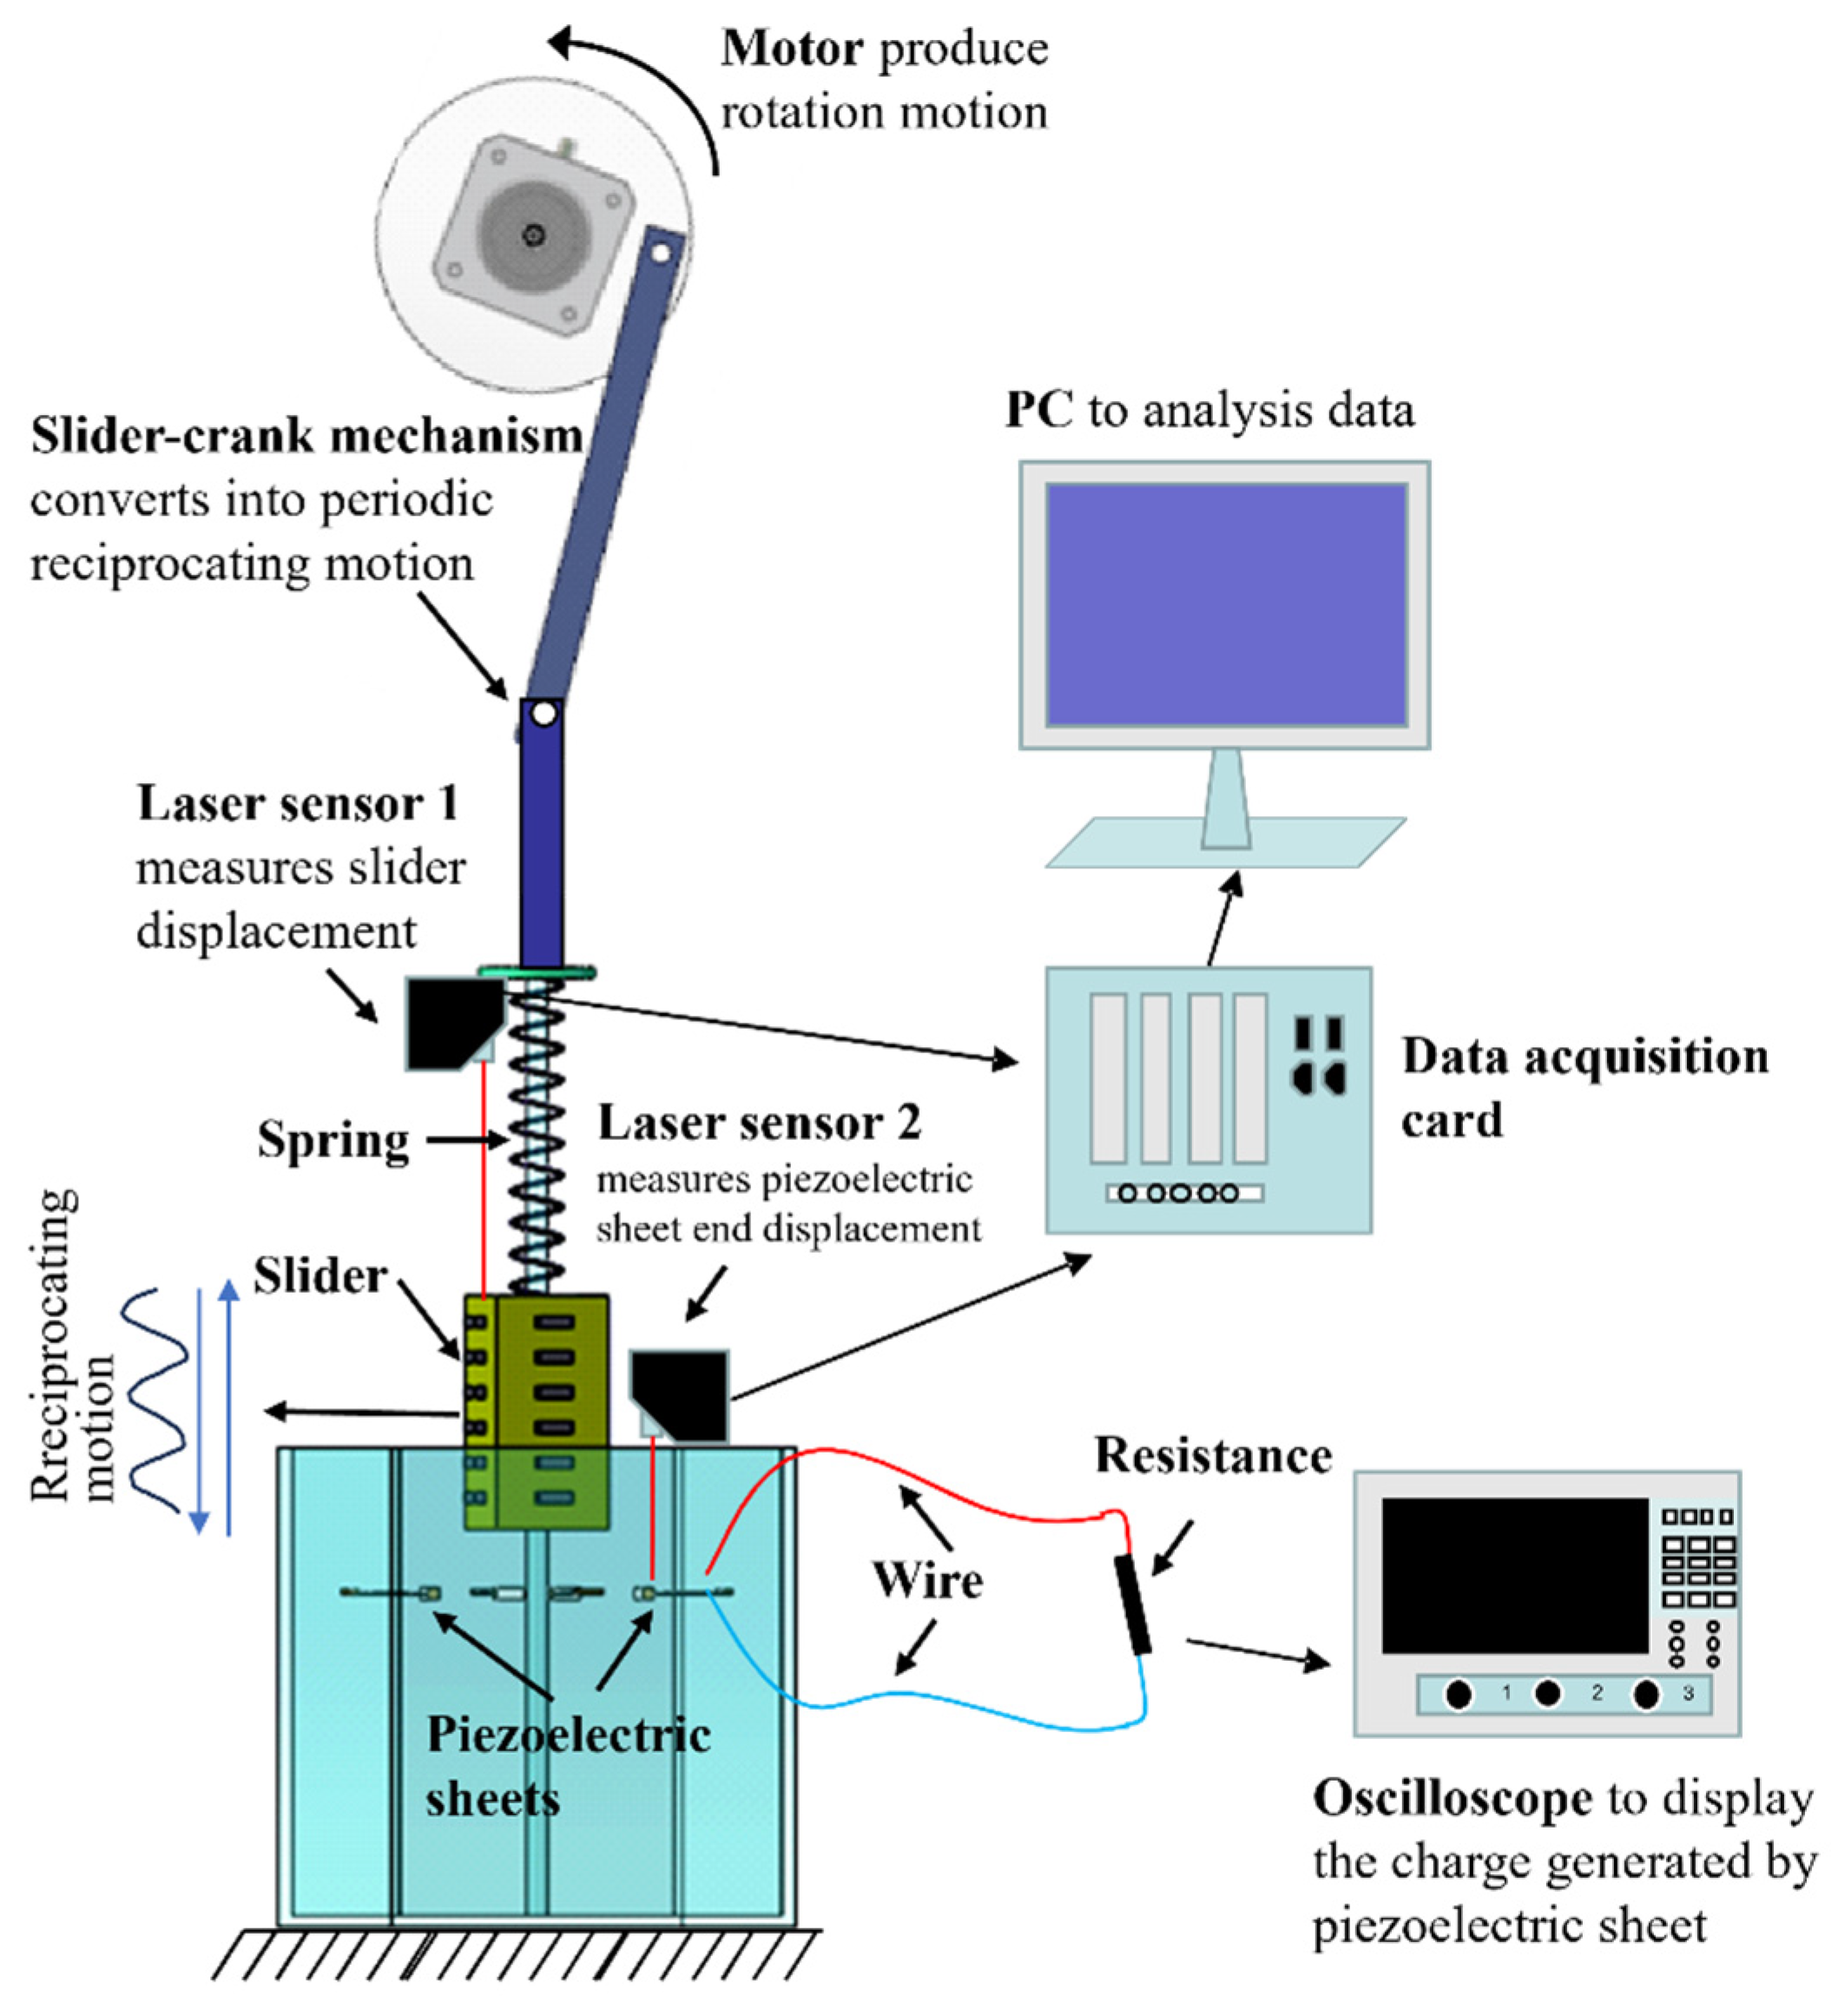
As shown in Figure 13, the mechanical structure device through a counter-centre slider-crank mechanism is used to simulate the motion load of the spring slider. According to the simulation results of slider motion (see Figure 10c), it can be seen that the displacement of the slider is close to a sinusoidal motion. When the crank rotates at a constant speed in the counter-centre slider-crank mechanism, the motion curve of the slider is also a sinusoidal curve (see Figure 13). So, the spring slider can periodically excite the piezoelectric cantilever beam and produce stable electric energy. The U.S. Navy simulated and tested the performance of wave power generation buoys through this method in 2010. The material parameters of the biocrystal piezoelectric sheet with magnets on the end used in the experiment are shown in Table 2. Based on the results of the above optimization, a slider mass of 0.6 kg, an initial spring length of 400 mm and a spring stiffness of 35 N/m were selected. The distance between the magnet on the slider and that on the piezoelectric sheet is 15 mm, and the distance between magnet arrays on the slider is 30 mm. The positive and negative probes of the oscilloscope are connected to the two ends of the resistor (optimal load of 100 kΩ) to measure the instantaneous voltage across the resistor, and the vibration displacement of the slider is measured using a laser displacement sensor 1 (HG-C1200, Panasonic, Shenzhen, China) and the displacement response of the end of the cantilever beam is measured by using the laser displacement sensor 2 (HG-C1030, Panasonic, Shenzhen, China). The two sensors are connected to a data acquisition card, and the collected data are transferred in real time to a displacement acquisition system on a PC, developed using LabVIEW (2016) software.
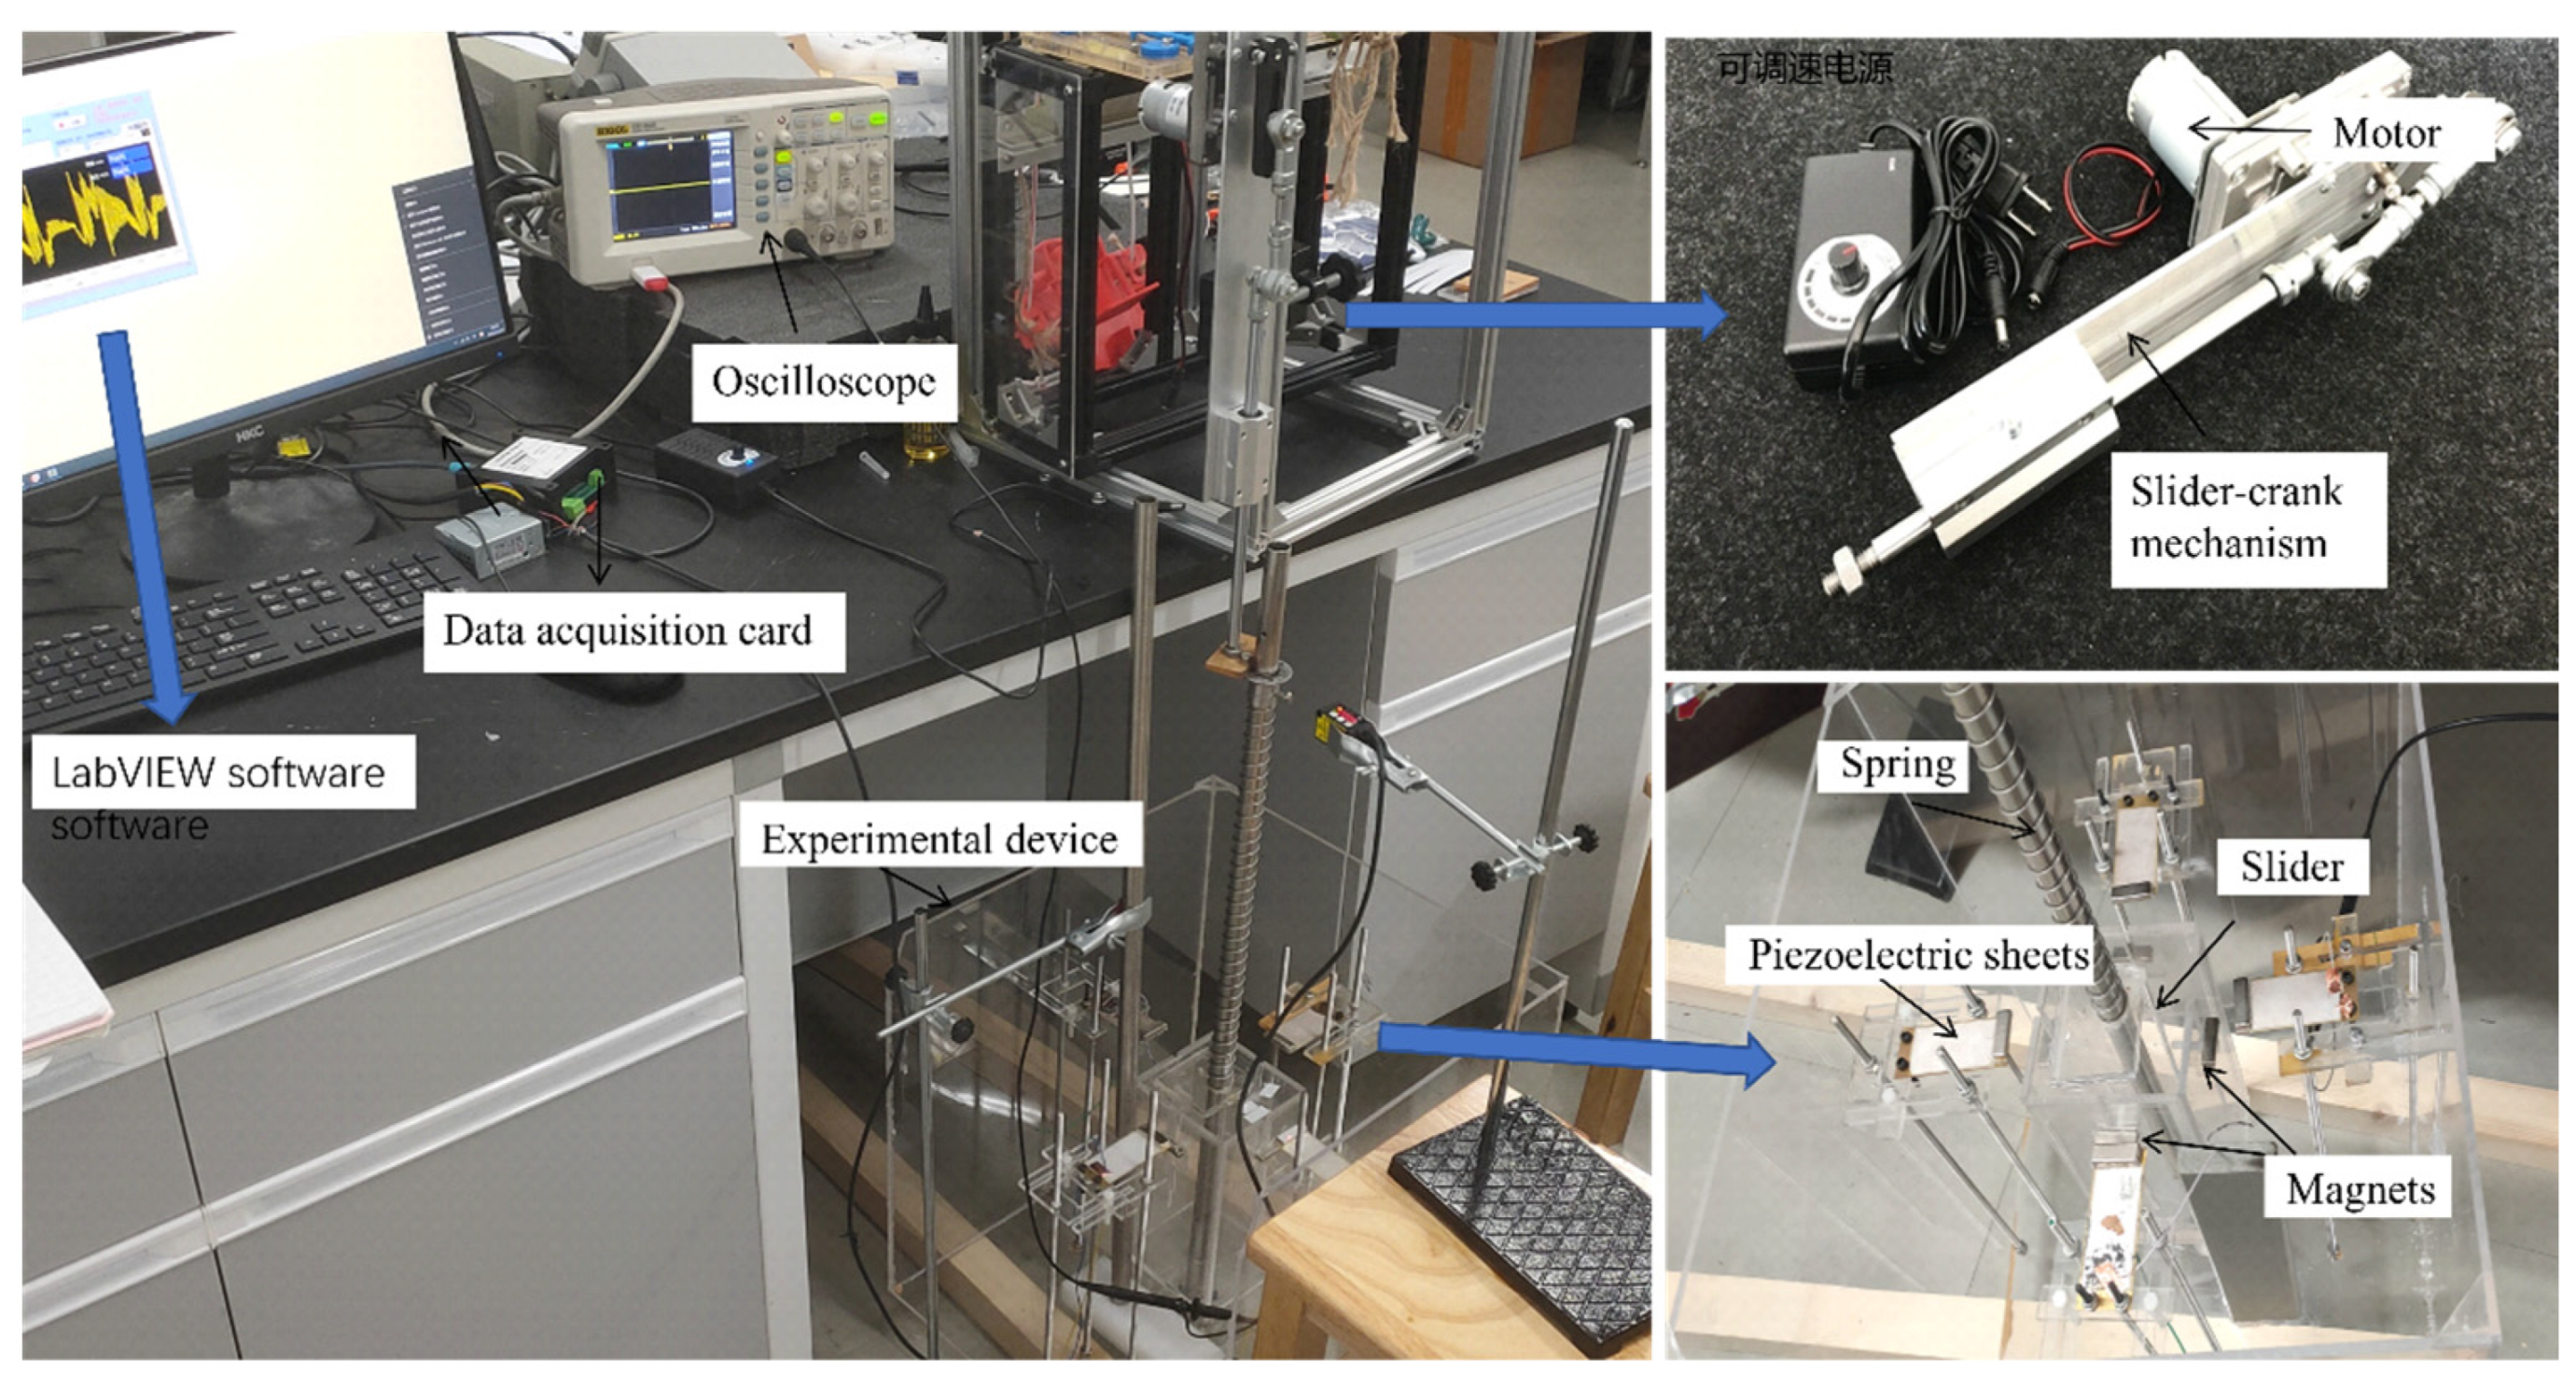
The slider-crank mechanism is composed of a DC motor, an adjustable speed power supply and a reciprocating mechanism (spring and slider). By changing the input voltage, the motor speeds can fluctuate between 5 and 100 rpm. By adjusting the position between the slider-crank mechanism and the motor, the reciprocating stroke can be freely adjusted from 30 mm to 150 mm. At the same time, the greater the stroke of the reciprocating mechanism, the smaller the thrust. The thrust range is about 2 kg to 15 kg. Conductive strips were used to paste on the upper and lower surfaces of the piezoelectric sheet to lead out two wires from the rubber strip. And the resistor between the two wires was used to measure the instantaneous voltage. Laser displacement sensor 1 was used to measure the vibration displacement curve of the slider through an oscilloscope measurement, and laser displacement sensor 2 was used to measure the displacement response of the cantilever beam end. Figure 14 shows images of the experimental platform and equipment.

4.2. Experimental Results

4.2.1. Single Piezoelectric Sheet–Single Magnet Excitation

The spring stiffness used in the experiment was about 35 N/m. According to the simulation data, in order to prevent the slider from colliding with the bottom, (1) excitation stroke s = 35 mm and reciprocating motion frequency f = 0.667 Hz and (2) excitation stroke s = 60 mm and reciprocating motion frequency f = 0.5 Hz were randomly selected for the single magnet excitation experiment, as shown in Figure 15a,b. Figure 15c records the excitation, slider motion and piezoelectric sheet end motion response, which more visually demonstrates the increased frequency behaviour of the system. The initial excitation of the slider crank mechanism is 35 mm, and after adding the spring, the displacement of the slider increases to 39 mm so that the slider has greater kinetic energy to impact the speed of the piezoelectric cantilever beam. In addition, the slider stays at the highest position for a longer time, during which time the two magnets generate an instantaneous tangential magnetic force interaction on the piezoelectric cantilever, so that the piezoelectric plate has more time to attenuate high-frequency oscillations to produce electric energy, thereby improving the power generation efficiency. Different resistance values have an impact on power output. In the experiment, resistors with different resistance values are connected to the surface of piezoelectric plate, and the output power amplitude is calculated according to Ohm’s law based on the recorded voltage amplitude at both ends of the external resistance. When the resistance value is 100 kΩ, the measured output power attains its maximum value. Figure 15d,e show the effect of magnets’ separation distance d and slider mass on the average power of the piezoelectric generator under the two experimental conditions. As shown in Figure 15d, the increase in slider mass has less effect on the average power of the piezoelectric generator, but the average power of the piezoelectric generation keeps increasing as the magnets’ separation distance d decreases. This is due to the increase in magnetic force, which subjects the piezoelectric sheet to a larger impact and oscillation amplitude. However, when the positive magnet pair distance is too small, the piezoelectric sheet is subject to more damage, so it is especially important to choose the proper positive distance between a pair of magnets.

4.2.2. Single Piezoelectric Sheet–Dual Magnets Excitation

The excitation set-up is shown in Figure 16a,b using dual magnet arrays that are D = 3 cm apart for a single piezoelectric sheet with a stroke s = 90 mm and a reciprocating motion frequency f = 0.5 Hz. The experimental results (Figure 16c) show that the average power generated by the dual magnet array is 1.6 times that by the single magnet. According to the conversion characteristics between the single and dual magnet setups, the displacement and voltage of the vibration remain effectively unchanged. In Figure 16c, it can be seen that the piezoelectric cantilever beam bends due to the magnetic impact of two magnets within a time period of 2.5 s (one reciprocal motion cycle). Therefore, the average power output and the vibration frequency of the piezoelectric sheet both increase after the double magnet array shocks the piezoelectric sheet.

4.2.3. Single Piezoelectric Sheet in Horizontal Array–Single Magnet Excitation

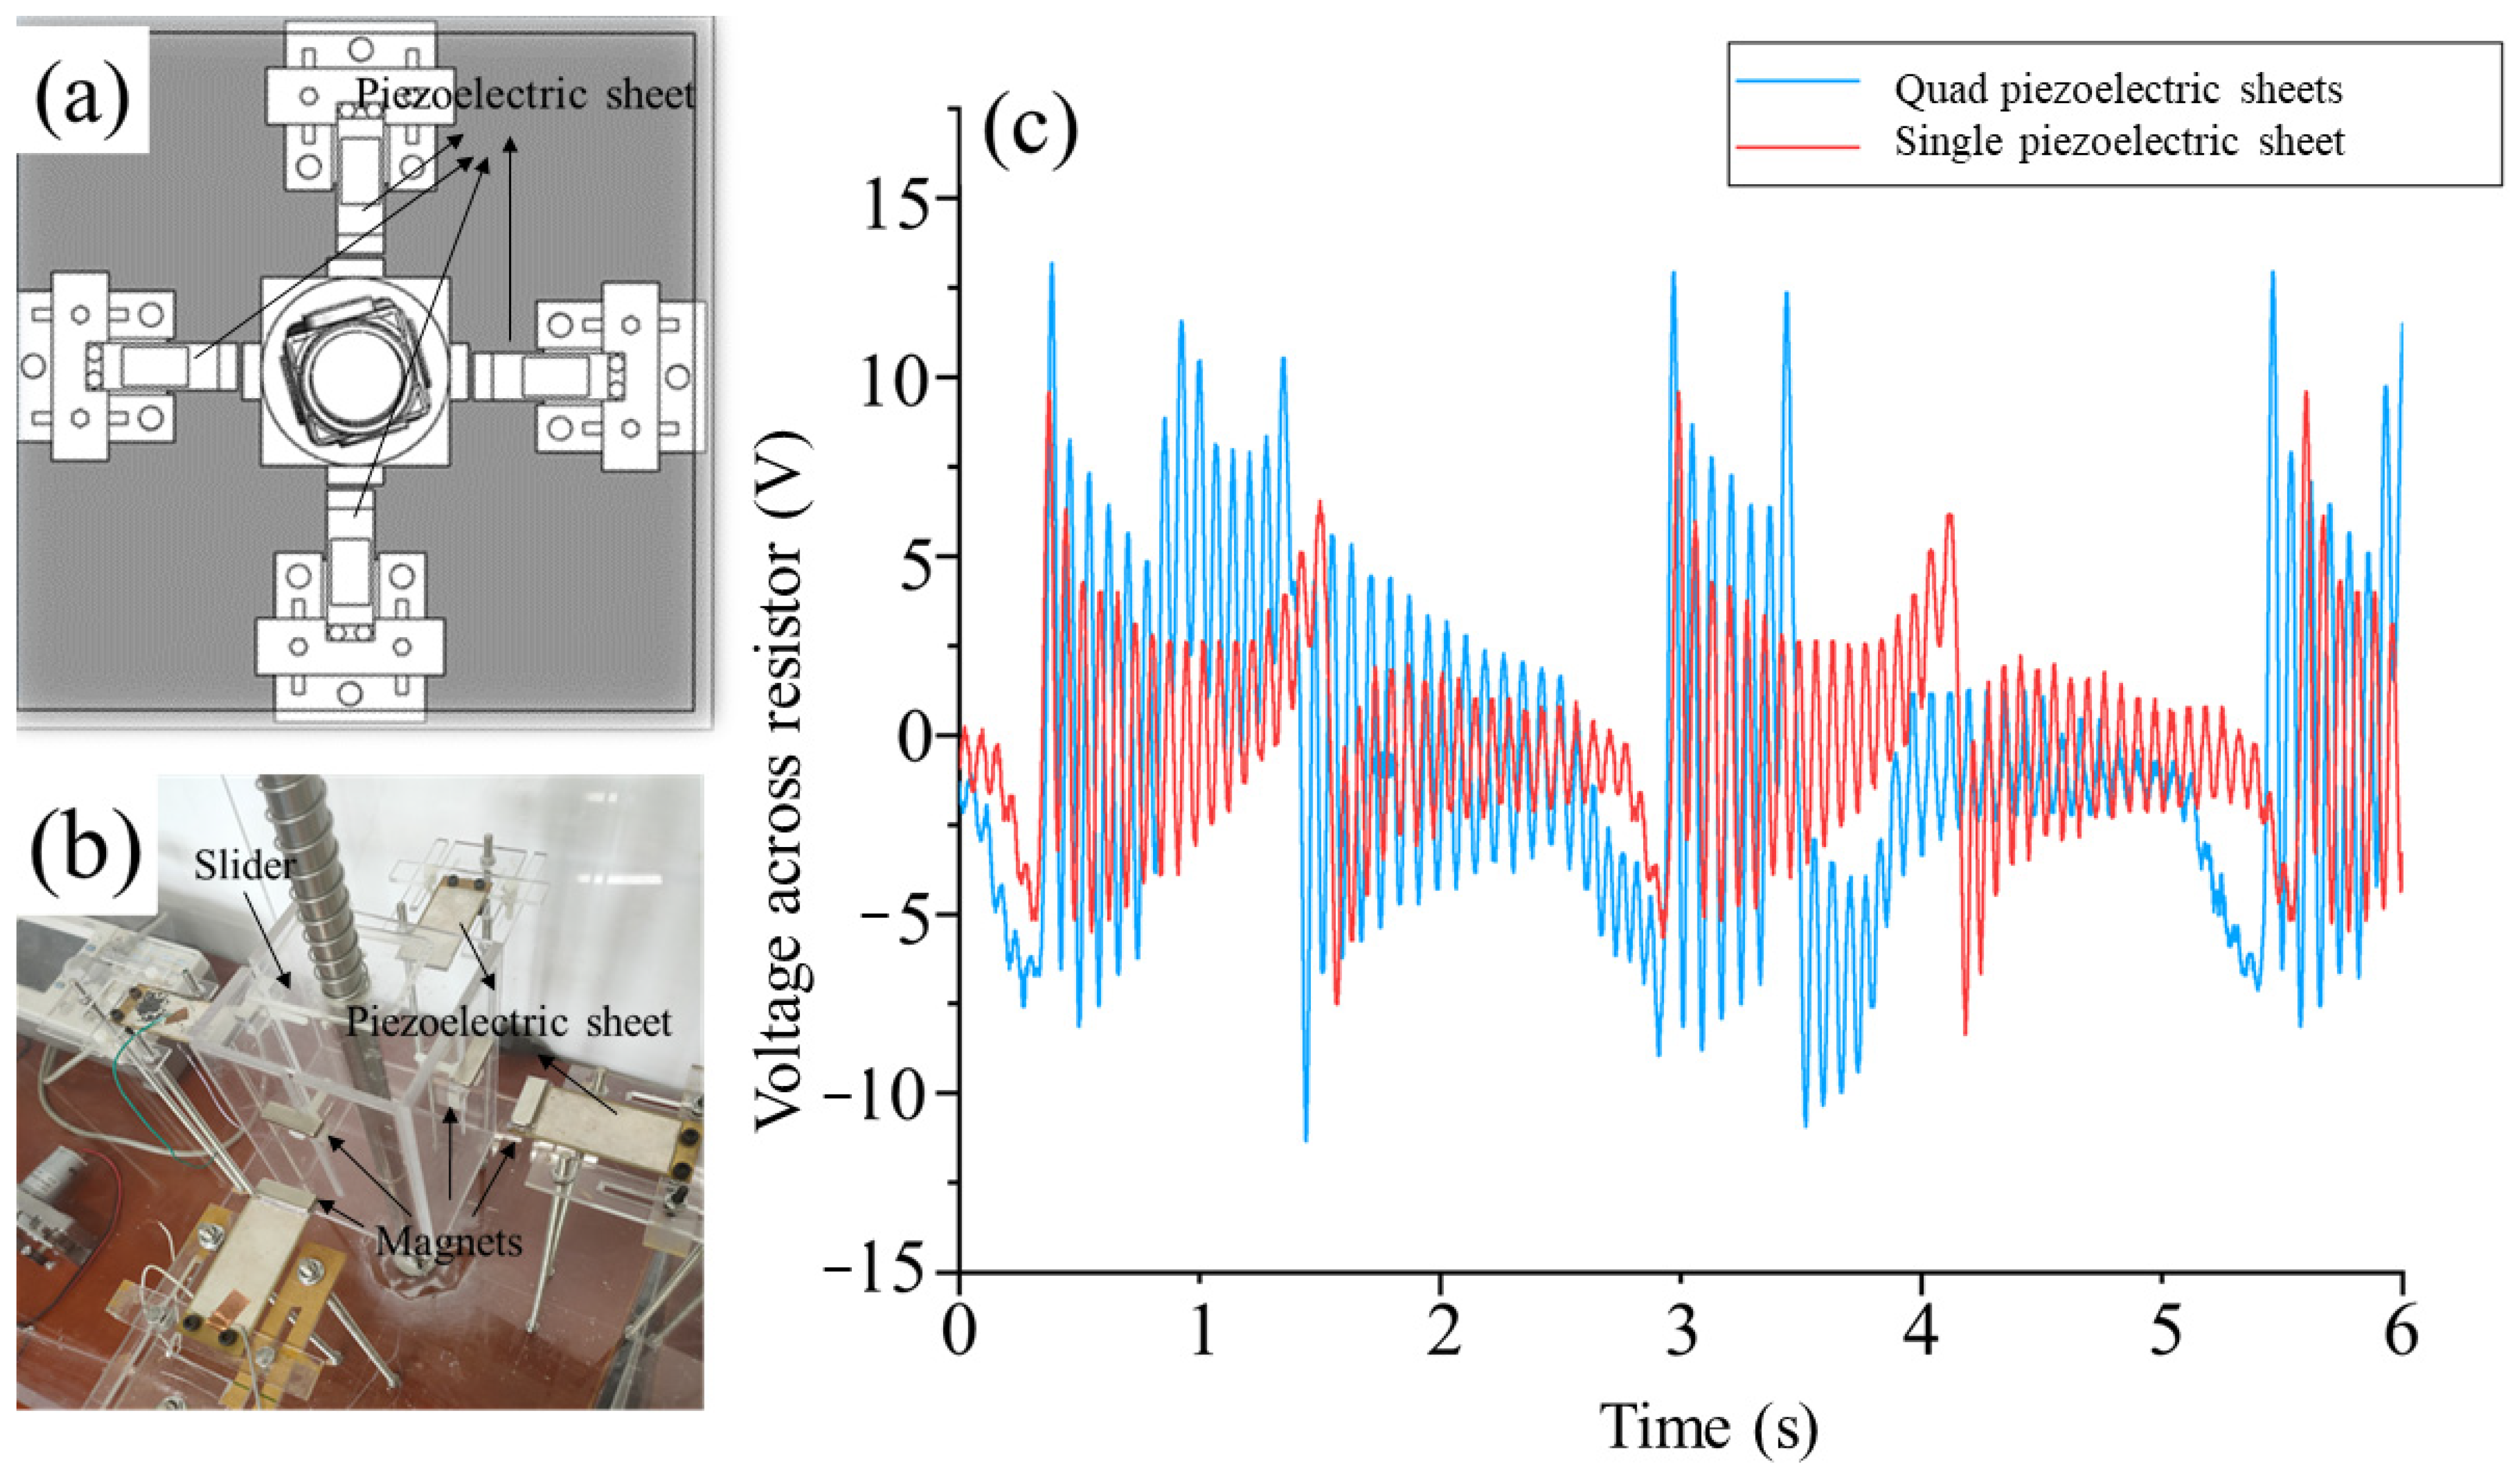
Four groups of single piezoelectric sheet–single magnet horizontal arrays, each 90 degrees apart, are shown in Figure 17a,b for excitation with stroke s = 90 mm and reciprocating motion frequency f = 0.5 Hz. The experimental results (Figure 17c) show that the response voltage of each piezoelectric sheet in four horizontal arrays is larger than that of a single piezoelectric cantilever beam, and the corresponding average power output per sheet/plate is increased by 2.4 times to 10 mW, as shown in Table 3. It should be noted that although there are four piezoelectric sheets, we only collected the voltage of one of the four piezoelectric sheets. This is due to the fact that the mass slider moves in the vertical direction with four times the repulsive force of that of a single piezoelectric cantilever beam, which enables the mass slider to be ejected further. The spring is stretched further, and the elastic potential energy is increased, leading to increasing kinetic energy of the slider and a greater impact on the piezoelectric cantilever beam. The benefit of the piezoelectric cantilever beam array is that the horizontal components of the four sets of repulsive forces generated by the two opposing magnets cancel each other out, which reduces the friction between the spring linear bearings and therefore energy loss.

5. Conclusions

It is challenging for small marine monitoring equipment to operate for a long time under low-frequency and harsh ocean wave environments. This paper proposes a novel contactless coupled pendulum–piezoelectric wave energy harvester. The proposed system consists of a floating body, an inner pendulum, spring pendulum, magnets and piezoelectric sheets and can achieve a two-stage frequency amplification of 3.8 times and therefore perform well in low-frequency wave environments. The performance of the system was verified through theory, model simulations and experiments, and the following conclusions were obtained.
(1) As the inner pendulum length increases, the wave energy absorption increases first, then decreases, and then increases again. The energy harvest efficiency of the device increases with increasing floating body mass and internal pendulum weight. With the increase in spring stiffness, the slider response frequency increases, which improves the efficiency of piezoelectric power generation in relatively low frequency wave environments. With the increase in the initial spring length, the wave energy absorption decreases first and then increases. An inner pendulum mass of 20 kg, length of 550 mm, slider mass of 0.6 kg, spring length of 400 mm, and spring stiffness of 35 N/m are the best design parameters of the spring pendulum system. In general, when the relative frequency is closer to 1.75, the modulation of the vibration displacement waveform of the slider is more obvious; that is, the modulation wave period is closer to the internal pendulum swing period.
(2) The slider mass has little effect on the average power of the piezoelectric generator. The latter, however, increases with decreasing distance between the magnet and piezoelectric sheet distance. The vibration frequency and average power output of the piezoelectric cantilever beam are increased after replacing the single magnet with the double magnet array. When the single piezoelectric sheet with single magnet is replaced by that in the horizontal dual magnet quad array, the average power output per sheet/plate is increased by 2.4 times to 10 mW, which meets the demand of the microwave energy piezoelectric power generation device. This proposed system would provide sufficient green power for ocean monitoring buoys. These buoys can be equipped with a number of wireless sensor nodes and communicate with each other through Bluetooth technology.

Author Contributions

C.Z. and D.W. conceived and designed the experiments. W.F. conducted the electrical measurements and data analysis. The paper was written by W.F. with contributions from all the co-authors. Q.Z., H.C., C.C. and X.L. supervised the research. Y.S. provided some experimental methods. All authors have read and agreed to the published version of the manuscript.

Funding

This work was financially supported by the basic scientific research fees of Zhejiang Ocean University (2019JZ00004), the Provincial First-Class Discipline Construction project supported by Young and Middle-Aged Discipline leaders of Zhejiang Province and the Science and Technology Plan Project of Dinghai District, Zhoushan City (2019C3105). Professor Qingping Zou has been supported by the Natural Environment Research Council of the UK (Grant No. NE/V006088/1) and Scottish (CRW2022_02) Governments.

Data Availability Statement

Data is contained within the article.

Conflicts of Interest

The authors declare no conflict of interest.

References

  1. Zhang, Z.G.; Qi, S.B.; Li, S.Z. Marine Observation Beacon Clustering and Recycling Technology Based on Wireless Sensor Networks. Sensors 2019, 19, 3726. [Google Scholar] [CrossRef]
  2. Ulukus, S.; Yener, A.; Erkip, E.; Simeone, O.; Zorzi, M.; Grover, P.; Huang, K.B. Energy Harvesting Wireless Communications: A Review of Recent Advances. IEEE J. Sel. Areas Commun. 2015, 33, 360–381. [Google Scholar] [CrossRef]
  3. Kuang, Y.; Sun, J.; Gan, X.J.; Gong, D.W.; Liu, Z.P.; Zha, M.M. Dynamic multi-objective cooperative coevolutionary scheduling for mobile underwater wireless sensor networks. Comput. Ind. Eng. 2021, 156, 107229. [Google Scholar] [CrossRef]
  4. Li, H.; Wu, X.P.; Zhang, Z.T.; Tan, X.; Pan, Y.J.; Dai, C.T.; Luo, D.B.; Ahmed, A.; Xu, Y.S. An extended-range wave-powered autonomous underwater vehicle applied to underwater wireless sensor networks. iScience 2022, 25, 104738. [Google Scholar] [CrossRef] [PubMed]
  5. Gavali, A.B.; Kadam, M.V.; Patil, S. Energy optimization using swarm intelligence for IoT-Authorized underwater wireless sensor networks. Microprocess. Microsyst. 2022, 93, 104597. [Google Scholar] [CrossRef]
  6. Vesecky, J.F.; Laws, K.; Petersen, S.I.; Bazeghi, C.; Wiberg, D. Prototype autonomous mini-buoy for use in a wireless networked, ocean surface sensor array. In Proceedings of the 2007 IEEE International Geoscience and Remote Sensing Symposium, Barcelona, Spain, 23–28 July 2007; pp. 4987–4990. [Google Scholar]
  7. Feng, W.; Chen, X.; Wang, C.; Shi, Y. Application research on the time–frequency analysis method in the quality detection of ultrasonic wire bonding. Int. J. Distrib. Sens. Netw. 2021, 17, 1–11. [Google Scholar] [CrossRef]
  8. Albaladejo, C.; Soto, F.; Torres, R.; Sánchez, P.; López, J.A. A low-cost sensor buoy system for monitoring shallow marine environments. Sensors 2012, 12, 9613–9634. [Google Scholar] [CrossRef]
  9. Rubes, O.; Chalupa, J.; Ksica, F.; Hadas, Z. Development and experimental validation of self-powered wireless vibration sensor node using vibration energy harvester. Mech. Syst. Signal Process. 2021, 160, 107890. [Google Scholar] [CrossRef]
  10. Luo, A.X.; Zhang, Y.L.; Dai, X.T.; Wang, Y.F.; Xu, W.H.; Lu, Y.; Wang, M.; Fan, K.Q.; Wang, F. An inertial rotary energy harvester for vibrations at ultra-low frequency with high energy conversion efficiency. Appl. Energy 2020, 279, 115762. [Google Scholar] [CrossRef]
  11. Zhou, G.-D.; Yi, T.-H. Recent Developments on Wireless Sensor Networks Technology for Bridge Health Monitoring. Math. Probl. Eng. 2013, 2013, 947867. [Google Scholar] [CrossRef]
  12. Zhang, Y.; Zou, Q.P.; Greaves, D. Air-water two-phase flow modelling of hydrodynamic performance of an oscillating water column device. Renew. Energy 2012, 41, 159–170. [Google Scholar] [CrossRef]
  13. Wang, R.Q.; Ning, D.Z.; Zou, Q. Wave loads on a land-based dual-chamber Oscillating Water Column wave energy device. Coast. Eng. 2020, 160, 103744. [Google Scholar] [CrossRef]
  14. Monk, K.; Zou, Q.; Conley, D. An approximate solution for the wave energy shadow in the lee of an array of overtopping type wave energy converters. Coast. Eng. 2013, 73, 115–132. [Google Scholar] [CrossRef]
  15. Wu, N.; Wang, Q.; Xie, X.D. Ocean wave energy harvesting with a piezoelectric coupled buoy structure. Appl. Ocean Res. 2015, 50, 110–118. [Google Scholar] [CrossRef]
  16. Safaei, M.; Sodano, H.A.; Anton, S.R. A review of energy harvesting using piezoelectric materials: State-of-the-art a decade later (2008–2018). Smart Mater. Struct. 2019, 28, 113001. [Google Scholar] [CrossRef]
  17. Talaat, M.; Elkholy, M.H.; Farahat, M.A. Operating reserve investigation for the integration of wave, solar and wind energies. Energy 2020, 197, 117207. [Google Scholar] [CrossRef]
  18. Nabavi, S.F.; Farshidianfar, A.; Afsharfard, A.; Khodaparast, H.H. An ocean wave-based piezoelectric energy harvesting system using breaking wave force. Int. J. Mech. Sci. 2019, 151, 498–507. [Google Scholar] [CrossRef]
  19. Chen, X.; Gao, L.X.; Chen, J.F.; Lu, S.; Zhou, H.; Wang, T.T.; Wang, A.B.; Zhang, Z.F.; Guo, S.F.; Mu, X.J.; et al. A chaotic pendulum triboelectric-electromagnetic hybridized nanogenerator for wave energy scavenging and self-powered wireless sensing system. Nano Energy 2020, 69, 104440. [Google Scholar] [CrossRef]
  20. Qi, N.J.; Dai, K.R.; Wang, X.F.; You, Z. Full paper Optimization for piezoelectric energy harvesters with self-coupled structure: A double kill in bandwidth and power. Nano Energy 2022, 102, 107602. [Google Scholar] [CrossRef]
  21. Kiran, M.R.; Farrok, O.; Abdullah-Al-Mamun, M.; Islam, M.R.; Xu, W. Progress in Piezoelectric Material Based Oceanic Wave Energy Conversion Technology. IEEE Access 2020, 8, 146428–146449. [Google Scholar] [CrossRef]
  22. Lin, Z.; Zhang, Y.L. Dynamics of a mechanical frequency up-converted device for wave energy harvesting. J. Sound Vib. 2016, 367, 170–184. [Google Scholar] [CrossRef]
  23. Miles, J.W.; Zou, Q.P. Parametric Excitation of a Detuned Spherical Pendulum. J. Sound Vib. 1993, 164, 237–250. [Google Scholar] [CrossRef]
  24. Kumar, R.; Gupta, S.; Ali, S.F. Energy harvesting from chaos in base excited double pendulum. Mech. Syst. Signal Process. 2019, 124, 49–64. [Google Scholar] [CrossRef]
  25. Covaci, C.; Gontean, A. Piezoelectric Energy Harvesting Solutions: A Review. Sensors 2020, 20, 3512. [Google Scholar] [CrossRef] [PubMed]
  26. Ghazanfarian, J.; Mohammadi, M.M.; Uchino, K. Piezoelectric Energy Harvesting: A Systematic Review of Reviews. Actuators 2021, 10, 312. [Google Scholar] [CrossRef]
  27. Viet, N.V.; Wang, Q. Ocean wave energy pitching harvester with a frequency tuning capability. Energy 2018, 162, 603–617. [Google Scholar] [CrossRef]
  28. Wu, Y.P.; Qiu, J.H.; Zhou, S.P.; Ji, H.L.; Chen, Y.; Li, S. A piezoelectric spring pendulum oscillator used for multi-directional and ultra-low frequency vibration energy harvesting. Appl. Energy 2018, 231, 600–614. [Google Scholar] [CrossRef]
  29. Okada, N.; Yabe, S.; Fujimoto, H.; Murai, M. Experiments on floating wave-power generation using piezoelectric elements and pendulums in the water tank. In Proceedings of the OCEANS 2012-YEOSU, Yeosu, Republic of Korea, 21–24 May 2012; pp. 1–8. [Google Scholar]
  30. Viñolo, C.; Toma, D.; Mànuel, A.; del Rio, J. An ocean kinetic energy converter for low-power applications using piezoelectric disk elements. Eur. Phys. J. Spec. Top. 2013, 222, 1685–1698. [Google Scholar] [CrossRef]
  31. Murray, R.; Rastegar, J. Novel two-stage piezoelectric-based ocean wave energy harvesters for moored or unmoored buoys. In Active and Passive Smart Structures and Integrated Systems 2009; SPIE: St Bellingham, WA, USA, 2009. [Google Scholar]
  32. Wickenheiser, A.M.; Garcia, E. Broadband vibration-based energy harvesting improvement through frequency up-conversion by magnetic excitation. Smart Mater. Struct. 2010, 19, 065020. [Google Scholar] [CrossRef]
  33. Han, B.; Chu, J.; Xiong, Y.; Fei, Y. Modeling and simulation of the novel wave energy piezoelectric generator. In Proceedings of the 2011 International Conference on Electrical and Control Engineering, Yichang, China, 16–18 September 2011; pp. 1621–1624. [Google Scholar]
  34. Xie, X.D.; Wang, Q.; Wu, N. Potential of a piezoelectric energy harvester from sea waves. J. Sound Vib. 2014, 333, 1421–1429. [Google Scholar] [CrossRef]
  35. Chen, S.E.; Yang, R.Y.; Qiu, Z.H.; Wu, C.C. A Piezoelectric Wave Energy Harvester Using Plucking-Driven and Frequency Up-Conversion Mechanism. Energies 2021, 14, 8441. [Google Scholar] [CrossRef]
  36. Cai, W.Z.; Roussinova, V.; Stoilov, V. Piezoelectric wave energy harvester. Renew. Energy 2022, 196, 973–982. [Google Scholar] [CrossRef]
  37. Vipin, V.; Trivedi, K.; Koley, S. Performance of a submerged piezoelectric wave energy converter device floating over an undulated seabed. Energy Rep. 2022, 8, 182–188. [Google Scholar]
  38. Vipin, V.; Koley, S. Mathematical modeling of a submerged piezoelectric wave energy converter device installed over an undulated seabed. Renew. Energy 2022, 200, 1382–1392. [Google Scholar]
  39. Heidari, M.; Sherbaf, G.R. Theoretical study of a new piezoelectric nonlinear energy harvester from ocean waves. J. Braz. Soc. Mech. Sci. Eng. 2022, 44, 589. [Google Scholar] [CrossRef]
  40. Shi, G.; Tong, D.K.; Xia, Y.S.; Jia, S.Y.; Chang, J.; Li, Q.; Wang, X.D.; Xia, H.K.; Ye, Y.D. A piezoelectric vibration energy harvester for multi-directional and ultra-low frequency waves with magnetic coupling driven by rotating balls. Appl. Energy 2022, 310, 118511. [Google Scholar] [CrossRef]
  41. Boccalero, G.; Chesne, S.; Mignot, E.; Riviere, N.; Jean-Mistral, C. Experimental investigations of a new concept of wave energy converter hybridizing piezoelectric and dielectric elastomer generators. Smart Mater. Struct. 2022, 31, 015006. [Google Scholar] [CrossRef]
  42. Garrison, C.J.; Rao, V.S.; Snider, R.H. Wave Interaction with Large Submerged Objects. In Proceedings of the Offshore Technology Conference, Houston, TX, USA, 22–24 April 1970. [Google Scholar]
  43. Del Balzo, D.R. Drag body design in support of wave energy harvesting. In Proceedings of the OCEANS 2010 MTS/IEEE SEATTLE, Seattle, WA, USA, 20–23 September 2010. [Google Scholar]
  44. Li, Y.; Ni, Z. Numerical study of the energy variation of spring pendulum vibration. J. Fuyang Norm. Univ. (Nat. Sci. Ed.) 2009, 26, 45–48. (In Chinese) [Google Scholar]
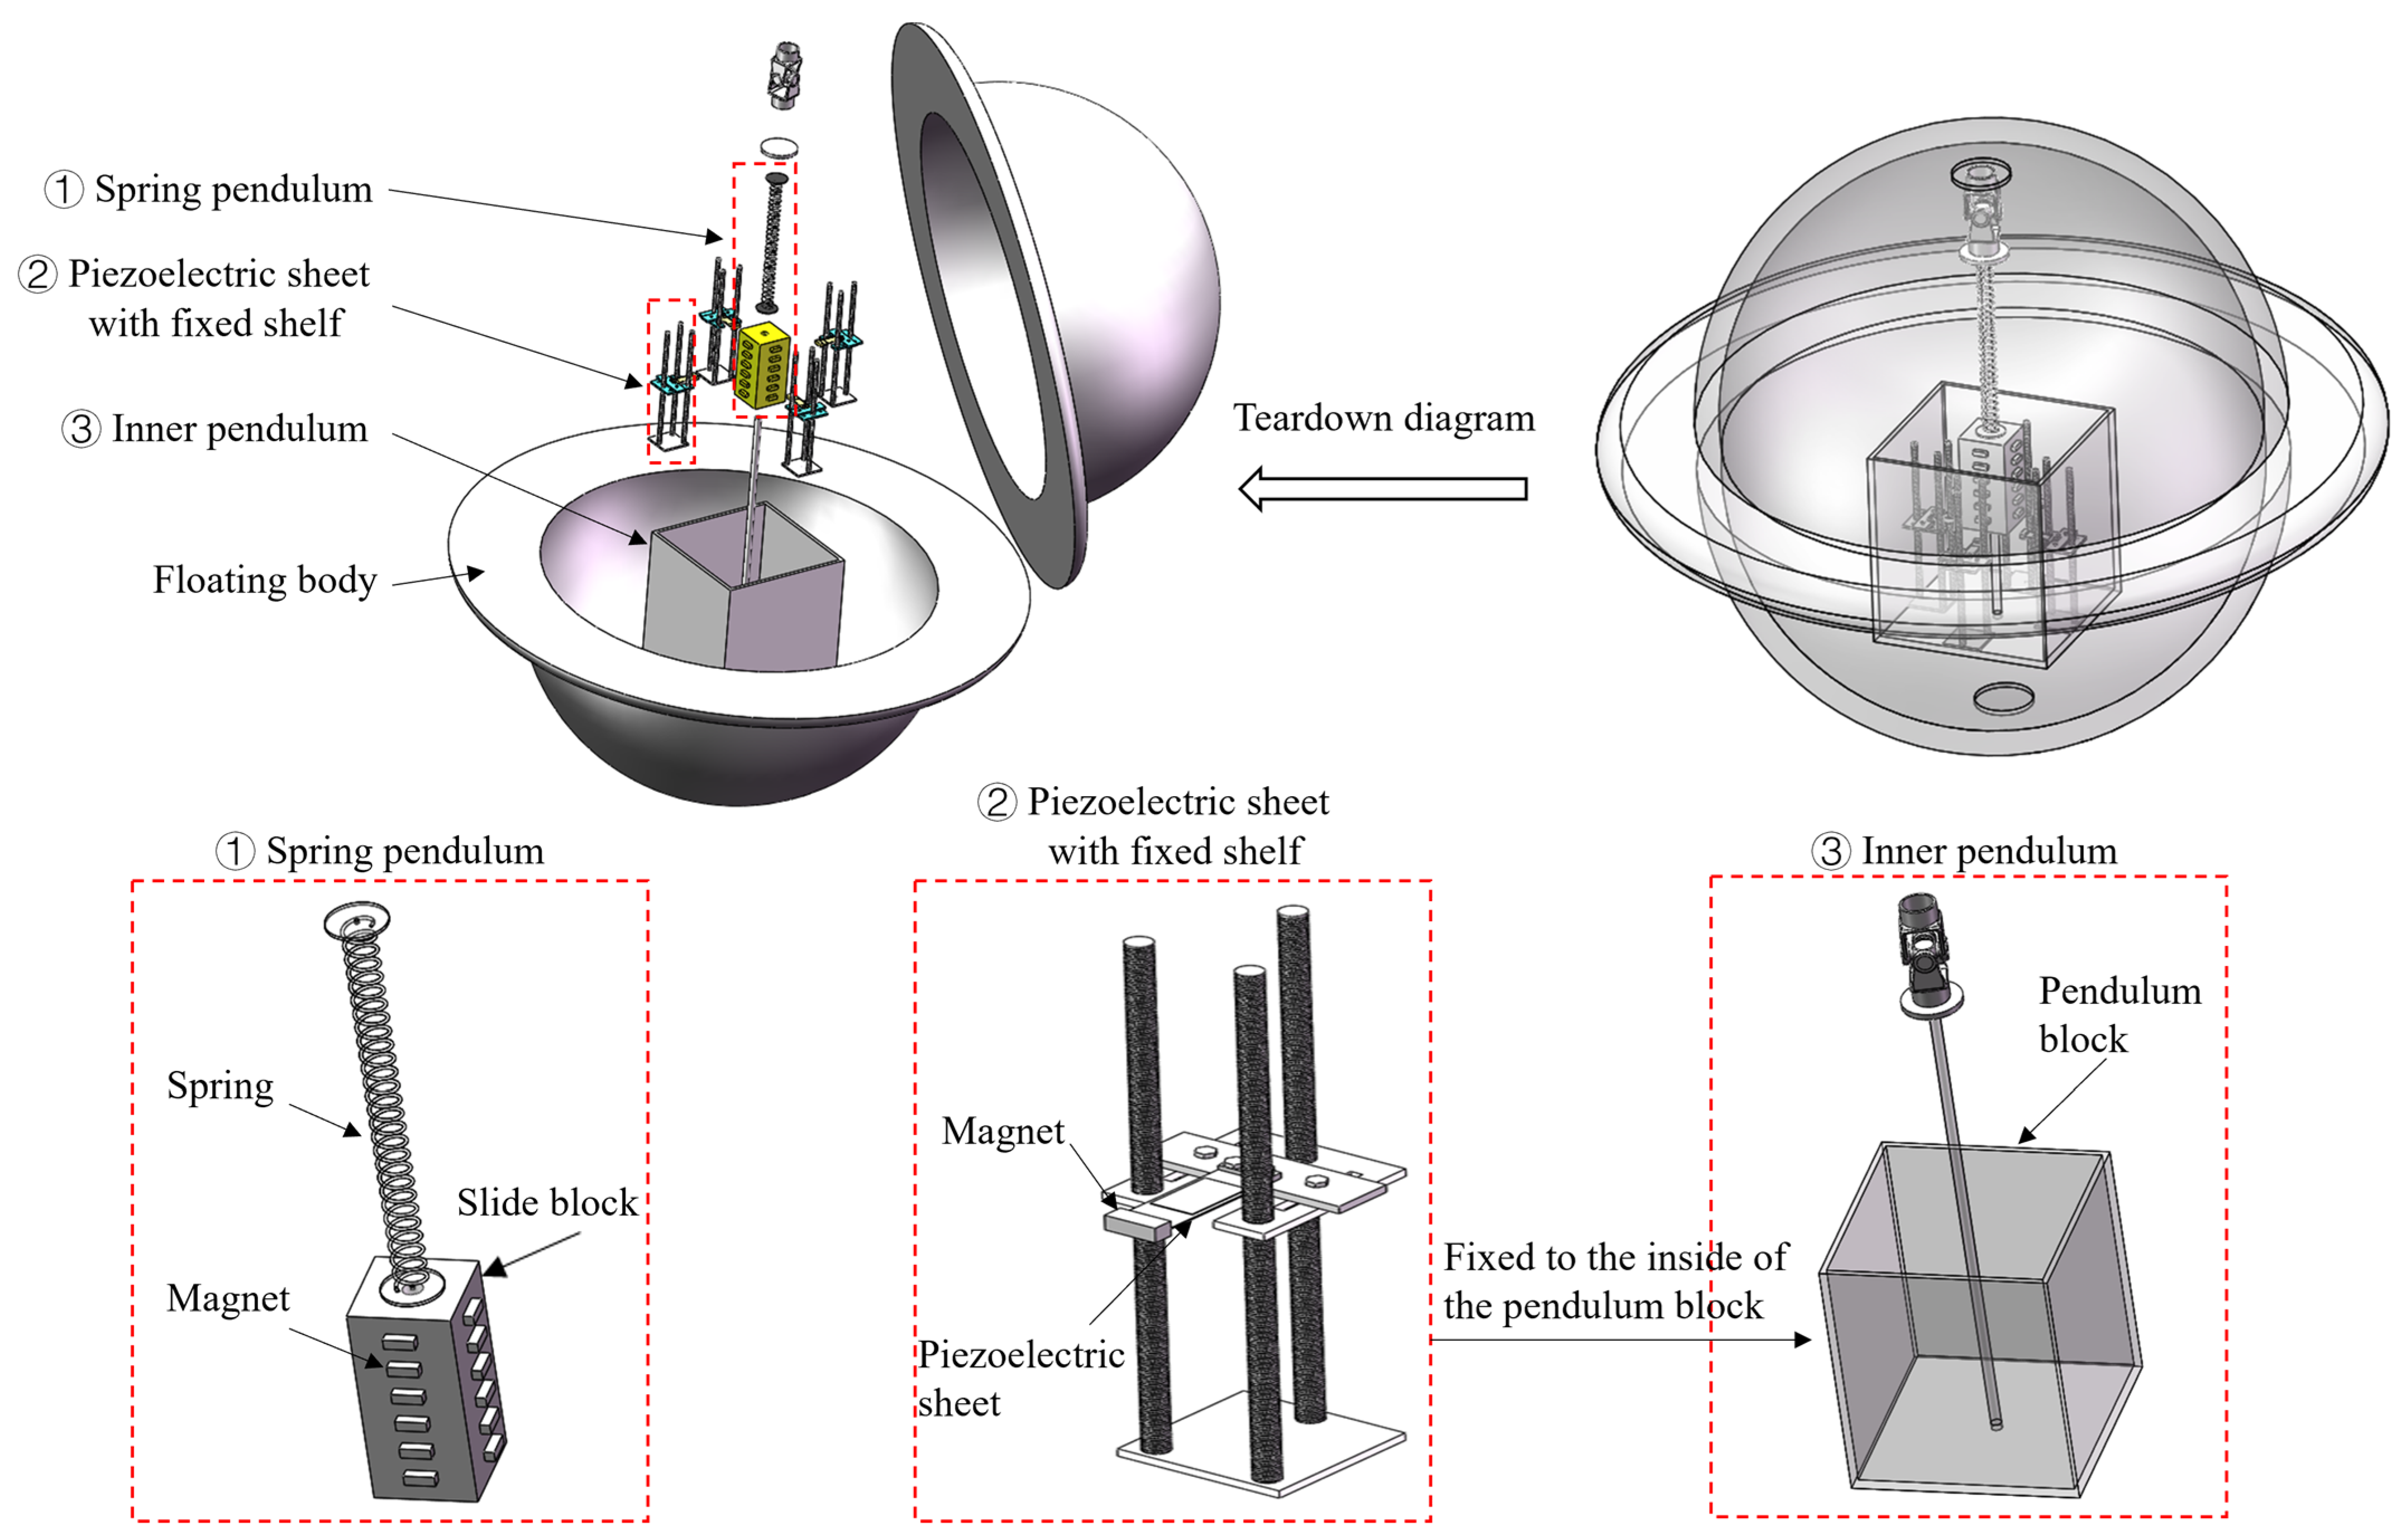
Figure 1. The overall structural design of the wave energy generation device.
Energies 17 00876 g001
Figure 2. The working principle of the contactless coupled pendulum and piezoelectric wave energy harvester device.
Energies 17 00876 g002
Figure 3. Sketch of the inner pendulum system.
Energies 17 00876 g003
Figure 4. Sketch of the spring pendulum system.
Energies 17 00876 g004
Figure 5. Sketch of the coupled pendulum model.
Energies 17 00876 g005
Figure 6. Wave energy device model diagram.
Energies 17 00876 g006
Figure 7. Horizontal wave force on floating body vs. time.
Energies 17 00876 g007
Figure 8. Time evolution of the swing scope of the inner pendulum under various inner pendulum (a) masses MR and (b) lengths l. Variation in the maximum swing scope of the inner pendulum with inner pendulum (c) masses MR and (d) lengths l.
Energies 17 00876 g008
Figure 9. Kinetic energy of the inner pendulum as a function of (a) mass MR and (b) initial length l of the inner pendulum.
Energies 17 00876 g009
Figure 10. Simulation results of the spring pendulum for the inner pendulum mass MR = 20 kg and length l = 550 mm. (a) Maximum displacement of the slider vs. mass. (b) Period of slider motion vs. mass. (c) Maximum displacement of the slider vs. spring stiffness. (d) Period of slider motion vs. spring stiffness. (e) Maximum displacement of the slider vs. original spring length. (f) Period of slider motion vs. initial spring length.
Energies 17 00876 g010
Figure 11. Simulation results of energy absorption by the slider: (a) Kinetic energy of the slider vs. original spring length l, (b) kinetic energy of slider vs. original spring stiffness k.
Energies 17 00876 g011
Figure 12. Slider displacement unlimited (blue) and limited (red) by inner pendulum block, where ω s is the natural frequency of the spring, and ω i is the natural frequency of the inner pendulum. The collision between slider and inner pendulum block occurs when the spring stiffness k is less than 32.23 N/m.
Energies 17 00876 g012
Figure 13. Sketch of the piezoelectric generator experimental set-up.
Energies 17 00876 g013
Figure 14. Piezoelectric generator experimental platform.
Energies 17 00876 g014
Figure 15. Experimental results of the single magnet-single piezoelectric plates model. (a) Sketch of single magnet excitation. (b) Displacement response of excitation, slider and terminal of piezoelectric plate under excitation stroke s = 35 mm and reciprocating motion frequency f = 0.667 Hz. (c) The displacement of motivation, slider response and the piezoelectric terminal response. Effect of magnet frontal distance and slider mass on the average power for (d) excitation stroke s = 35 mm and reciprocating motion frequency f = 0.667 Hz. (e) Excitation stroke s = 60 mm and reciprocating motion frequency f = 0.5 Hz.
Energies 17 00876 g015
Figure 16. Experimental results of the single piezoelectric plate–dual magnet array energy harvester. (a) Sketch of single piezoelectric sheet–dual magnets excitation. (b) Experimental device of single piezoelectric sheet–dual magnets excitation. (c) Comparison of the voltage response across the resistor under single and dual magnet excitation piezoelectric plate (stroke s = 90 mm, reciprocating motion frequency f = 0.5 Hz).
Energies 17 00876 g016
Figure 17. Experimental results of four piezoelectric plates in horizontal array mode. (a) Sketch of four piezoelectric sheets with single magnet excitation. (b) Experimental device of single magnet excitation. (c) Comparison of displacement voltage response of the end of the single piezoelectric sheet in the horizontal quad and single array for stroke s = 90 mm, reciprocating motion frequency f = 0.5 Hz.
Energies 17 00876 g017
Table 1. Dimensions of the main components of the coupled pendulum system.
ComponentsDimensions (cm)
Inner pendulum blockLength × width × height: 40 × 38 × 38, thickness: 0.5
Smooth linear guide barRadius: 0.9, length: 80
Slide blockLength × width × height: 20 × 10 × 10
SpringLength: 30, pitch: 0.5, diameter: 3
Floating bodyRadius: 60, thickness: 5
Note: The mass of the inner pendulum block MR and the slider m vary, so the size is not marked in the table (MR:10–50 kg, m: 0.4–0.8 kg).
Table 2. Material parameters of the piezoelectric cantilever beam.
ParameterValueUnit
Young’s modulus of substrate 112GPa
Piezoelectric Young’s modulus 56GPa
Substrate density 8780kg/m3
Piezoelectric density 7500kg/m3
Magnet size (L × W × h)30 × 10 × 5mm
Piezoelectric biocrystal beam (L × W × h)80 × 33 × 0.6mm
Piezoelectric coefficient d31186 × 10−12C/N
Relative dielectric constant3130
Magnet typeN35
Table 3. The average power output of each piezoelectric sheet under various excitation modes, where d is the distance between the piezoelectric sheet-magnet and slider-magnet, D is the distance among dual magnets and Pt is the average output power of each single piezoelectric sheet.
DistanceExcitation MethodPt/mW
d = 15 mmSingle magnet—single piezoelectric sheet4.117
d = 15 mm, D = 30 mmDual magnets—single piezoelectric sheet6.674
d = 15 mmSingle magnet—quad piezoelectric sheets10.015
Disclaimer/Publisher’s Note: The statements, opinions and data contained in all publications are solely those of the individual author(s) and contributor(s) and not of MDPI and/or the editor(s). MDPI and/or the editor(s) disclaim responsibility for any injury to people or property resulting from any ideas, methods, instructions or products referred to in the content.