Article

Effect of Nickel Nanocatalyst Loading on Supercritical Water Gasification of Coconut Shell

by
Marcela M. Marcelino
1,
Gary A. Leeke
2,
Guozhan Jiang
2,
Jude A. Onwudili
3,*,
Carine T. Alves
1,4,5,
Ana Luiza F. de Sousa
6,
Delano M. de Santana
1,5,
Felipe A. Torres
1,5,7,
Silvio A. B. Vieira de Melo
1,5 and
Ednildo A. Torres
1,5
1
Programa de Engenharia Industrial, Escola Politécnica, Universidade Federal da Bahia, Rua Prof. Aristides Novis, 2, 6° Andar, Federação, Salvador 40210-630, Brazil
2
School of Chemical Engineering, University of Birmingham, Birmingham B15 2TT, UK
3
Energy & Bioproducts Research Institute, School of Infrastructure & Sustainable Engineering, Aston University, Birmingham B4 7ET, UK
4
Departamento de Engenharia de Energia, Centro de Ciência e Tecnologia em Energia e Sustentabilidade, Universidade Federal do Recôncavo da Bahia (UFRB), Feira de Santana 44085-132, Brazil
5
Centro Interdisciplinar em Energia e Ambiente (CIENAM), Campus Universitário Federação/Ondina, Universidade Federal da Bahia (UFBA), Salvador 40170-115, Brazil
6
Departamento de Engenharia Química, Escola Politécnica, Universidade Federal da Bahia, Rua Prof. Aristides Novis, 2, 6° Andar, Federação, Salvador 40210-630, Brazil
7
Departamento de Sistemas Mecânicos, Centro de Ciências Exatas e Tecnológicas, Universidade Federal do Recôncavo da Bahia, Cruz das Almas 44380-000, Brazil
*
Author to whom correspondence should be addressed.
Energies 2024, 17(4), 872; https://doi.org/10.3390/en17040872
Submission received: 25 January 2024 / Revised: 7 February 2024 / Accepted: 9 February 2024 / Published: 13 February 2024
(This article belongs to the Section I3: Energy Chemistry)

Abstract

:
Impregnation of metal catalysts into biomass before thermochemical conversion may provide benefits of increased selective reactivity to obtain desirable products. In this work, coconut shells impregnated with increasing loadings of nickel were successfully prepared using a room-temperature impregnation method using a nickel salt solution at 1 and 2 molar (M) concentrations. The physicochemical characterization of the 2 M impregnated sample revealed the presence of 5.6 wt% of nickel with a particle size of 13.5 nm. The nickel-impregnated samples’ supercritical water gasification (SCWG) was conducted with biomass loading ranging from 20 wt% to 30 wt%, at temperatures between 400 °C and 500 °C, and residence times from 20 to 60 min. Higher nickel loading, higher temperatures and longer reaction times promoted the production of H2 and CO2 up to 15 and 79 mol%. Higher nickel loading also led to an increased Hydrogen Gasification Efficiency value of up to 133%. The analysis of hydrochars suggested that increasing nickel loading enhanced the reduction in nickel ions to the Ni0 nanoparticles, leading to higher H2. Additionally, the chemical composition of the liquid product showed the significant ability of nickel to promote lignin decomposition into phenol, facilitating the phenol hydrogenation reaction and subsequent gas production.

1. Introduction

The literature has widely discussed the impact of burning fossil fuels on climate change [1]. According to Saleem [2], around 21.3 billion tonnes of carbon dioxide (CO2) and other gases are produced from fossil energy sources annually. It is possible to eliminate up to 50% of CO2 emissions to minimise the impacts of global warming and climate change. Using sustainable solid biomass as a carbon source can contribute significantly to this effort. Considerable volumes of solid biomass are generated from various urban, agricultural and industrial activities worldwide and can be used as feedstock for energy and chemical production.
Coconut is a perennial crop and according to Brazilian Institute of Geography and Statistics data [3] in 2021, 1,638,573 million tonnes of coconut fruits were produced in Brazil. Coconut shells account for 60% of the mass of the coconut fruit, so a substantial amount of this biomass is generated annually. Therefore, utilising coconut shells as a biomass resource for energy production is increasingly important for both waste management and producing renewable fuels. The high availability, affordable cost, minimal ash content, substantial lignin content and elevated calorific value are highlighted as important properties of coconut shell biomass [4].
Energy can be produced from coconut shells through thermochemical conversion methods like pyrolysis [5,6,7], conventional gasification [8,9,10], combustion [11,12] and hydrothermal (hot-compressed water) processing [13,14,15]. Among the hydrothermal methods, supercritical water gasification (SCWG) can convert both liquid and solid carbonaceous materials into hydrogen fuel gas. The SCWG process is performed at 375 °C–700 °C and pressures higher than 22.1 MPa. Above its critical point, water exists as a homogeneous gas-liquid phase and acts as a non-polar solvent. Consequently, water exhibits complete miscibility with many organics and gas constituents, establishing a unified reaction environment within the reactor [16]. These provide the advantages of fast reaction and mass transfer rates during organic chemical reactions.
The operational conditions, such as biomass loading, temperature, residence time and the presence of a catalyst, greatly influence the efficiency of SCWG. These aspects have been reported in a few studies on the SCWG of coconut shell biomass [15,17,18], where the authors emphasised the positive impact of using homogeneous catalysts on SCWG products. However, it has been shown that metal-based heterogeneous catalysts, such as nickel, are more advantageous due to their high selectivity towards specific gas products and ease of recyclability and reusability. Furthermore, nickel catalysts can catalyse C–C bond breaking and promote the water–gas shift reaction, increasing carbon gasification and hydrogen yield [19].
Some authors have conducted studies demonstrating how the nickel concentration influences gas production from SCWG of biomass in the presence of different supports for the nickel catalyst, such as Al2O3 and MgO [20,21,22]. Gong et al. [20] and Lu et al. [22] showed that increasing the nickel concentration up to 16 wt% enhanced the gas yield obtained from the SCWG process. Kang [21] studied the effect of varying nickel loading on gas characteristics from 2.5 wt% to 20 wt%. The authors concluded that the best results were achieved at 10 wt% of catalyst concentration. Despite the positive effects, using nickel-based catalysts presents certain restrictions, some of which are due to the support materials and others due to the metal catalyst itself. For instance, during SCWG, the catalyst supports may suffer from hydrothermal instability, phase transformation, and undesirable metal–support interactions [23,24]. In addition, the metal itself can be affected by activity loss by poisoning, susceptibility to sintering and carbon deposition [19,25,26].
Recent publications have focused on using the wet impregnation of biomass with nickel nanocatalysts as an option to reduce the consequences introduced by classic support catalysts. This method could improve catalytic activity and stability, SCWG efficiency and the quality of the gas product [13,23,24,27]. The impregnation of nickel catalysts into two different biomasses (pinewood and wheat straw) for subcritical and supercritical water gasification was reported ed by Nanda et al. [27]. The generated gases and hydrochars illustrated that the gasification of biomasses impregnated with nickel resulted in higher total gas and hydrogen yields, indicating enhanced carbon gasification efficiency compared to the non-catalytic process. The presence of nickel in the hydrochar spectra, proving catalyst retention, was also detected. A similar study was conducted by Kumar and Reddy [23], where sugarcane bagasse and mosambi peels were impregnated with nickel salts. The samples were gasified at subcritical and supercritical conditions and the gas, liquid and solid products were analysed. The authors reported improvements in H2 and overall gas yields. The hydrochar characterization showed that increasing the temperature transformed Ni2+ into metallic nickel nanoparticles (Ni0). The active degradation of intermediates to generate gaseous compounds was also confirmed by the total organic carbon analysis of liquid products. In other research by Kumar and Reddy [24], the impregnation of different metals, such as nickel, ruthenium and iron, into banana pseudo-stem biomass was evaluated. The gas and hydrochar samples were studied and the researchers concluded that the maximum H2 content and carbon gasification efficiency were achieved for the nickel-impregnated sample. They also observed the transition from Ni2+ to metallic nickel nanoparticles (Ni0), through hydrochar analysis.
From the above publications, it is clear that the influence of nickel nanocatalyst loading for impregnated biomass has not been explored, as all of the studies considered the impregnation of biomass for only 1 M nickel nitrate hexahydrate [Ni(NO3)2·6H2O] solution [13,23,24,27]. In this paper, we impregnated coconut shell biomass with 1 M and 2 M nickel salt solutions to investigate the impacts of increasing nickel loadings on SCWG efficiencies, as well as on product yields and compositions. A Response Surface Model approach using a three-level and three-factor Box–Behnken design was employed to investigate the combined effects of the process variables on the gas yield of the SCWG of the coconut shells. The results of the detailed characterisation of the solid and liquid products obtained from SCWG of control and impregnated samples were used to establish an understanding of the influence of nickel impregnation loading on biomass SCWG.

2. Materials and Methods

2.1. Sample Preparation

The Bahia Orchidarium, Camaçari, Bahia, Brazil, kindly provided brown coconut shell biomass for this study. The coconut shell samples were crushed and sieved to achieve a particle size ranging from 45 to 90 µm [13].
The impregnation process was carried out at a pH of 5.80, ensuring a high dispersion of nickel cation species within the coconut shell matrix and achieving optimized metal loading. Impregnated samples were prepared by mixing 50 g of coconut shell biomass with 500 mL of an aqueous solution containing nickel salts. The aqueous solution was designed using Nickel (II) nitrate hexahydrate [Ni (NO3)2·6H2O, 99.99% of purity] at concentrations of 1 M and 2 M of nickel. The mixture was stirred using a magnetic stirrer (Scilogex SCI280, Rock Hill, NC, USA) at 300 rpm for 3 days at room temperature. Afterwards, the biomass samples were filtered under a vacuum, washed with deionized water and dried. Control samples were also prepared by mixing 50 g of coconut shell biomass with 500 mL of deionized water [13].
In order to assess the physicochemical properties of the biomass and predict its behaviour during thermochemical conversion by the SCWG process, the 2 M impregnated sample was characterized.

2.2. Biomass Properties

The characteristics of 2 M impregnated samples were determined through ultimate analysis, TG/DTG (thermogravimetric/derivate thermogravimetry), SEM-EDX (scanning electron microscopy–energy-dispersive X-ray spectroscopy: JEOL JSM-6060LV, Low Vacuum SEM, Welwyn Garden City, Hertfordshire, UK) and X-ray diffraction (XRD: Bruker AXS GmBH, Karlsruhe, Germany).
The ultimate analysis of the samples was carried out using a Flash 2000 Elemental Analyzer CHNS analyser (ThermoFisher Scientific, Cambridge, UK). The weight percent of oxygen was calculated by the difference as
O = 100 ( C + H + N + S + N i )
TG/DTG analysis of the samples was performed in a thermogravimetric analyser (Model-EXSTAR 6000, TG/DTA6300, Chiba, Japan). Approximately 10 mg of the sample was heated from 50 to 900 °C at a heating rate of 10 °C/min in a nitrogen (N2) atmosphere (flow rate of 100 mL/min).
The morphology and composition of the samples were determined by a scanning electron microscope (JEOL JSM-6060LV, Low Vacuum SEM, Hertfordshire, UK), coupled with an energy-dispersive X-ray analyser EDX spectroscope (Oxford Instruments, (Abingdon, UK) INCA X-ACT, Model–51-ADD0058).
X-ray diffraction analysis (XRD) used a Bruker D8 Advance diffractometer, (Bruker AXS GmBH, Karlsruhe, Germany), using Cu Kα1,2 radiation. The samples were top-loaded into PMMA specimen holders and the diffractograms were collected in the Bragg–Brentano geometry with a step scan of 0.02° (1 s per step). Peaks on the diffractograms were determined.

2.3. Supercritical Water Gasification Experiments

The RSM approach using a Box–Behnken design was employed to investigate the combined effects of various process variables (A—Temperature, B—Residence Time and C—Biomass Loading) on the gas yield generated by the SCWG of biomass samples under a pressure range of 23 to 28 MPa. The concentrations of gaseous products were considered as response variables. Design Expert Software (version 7.0, Stat-Ease Inc., Minneapolis, MN, USA) was used to design the experimental runs.
According to Equation (2), where k is the number of factors and c p is the number of central points, 15 experiments (N) were carried out for each sample, and three replicates of the central point were performed to assess the experimental error [28].
N = 2 k k 1 + c p
The process variables and the coded and actual values used for designing the experiments are displayed in Table 1.
The experiments were performed in a 10 mL stainless-steel (SS 316) tube batch reactor constructed with Swagelok (Warrington, UK) parts following the assembly procedure described in our previous study [13].
Initially, the reactor was filled with predefined amounts of water and biomass according to steam tables to ensure that, once the reactor attains the desired temperature (from 400 to 500 °C), the system can achieve the intended pressure (23–28 MPa). To achieve this objective, the reacting mixture was considered to have an equivalent density to that of pure water. Finally, the experimental system was purged with N2 to remove any air. Figure 1a depicts the diagram of the reactor and heating process [13].
The furnace (Elite Thermal Systems Limited, Market Harborough, UK) was preheated to the reaction temperature, which was measured by a K-type thermocouple (UK) connected to the computer (Dell, BR). Once supercritical conditions were achieved, the feed sample was retained for a predefined residence time to allow the sample to degrade into fuel gases. After the reaction, the reactor was cooled to an ambient temperature (20 °C) by quenching in water. The pressure was lowered to ambient levels by opening the outlet valve, facilitating the separation of products in a gas-liquid separator comprising calcium chloride dihydrate and glass wool. Consequently, moisture in the product gas was captured, and the dry gas was collected in an inert foil gas sampling bag for gas chromatography analysis [13].
Following gas sampling, the reactor was opened to collect the liquid residuals, subsequently transferred to a glass container and weighed. The moisture content in the gas product was calculated by the difference in weight of the gas–liquid separator, which was measured before and after each experimental run. This value was integrated into the quantification of liquid products. The residual solid in the reactor was eliminated by multiple washes with acetone. Employing a vacuum system, the acetone–solid mixture was filtered, and the solid content was determined by the difference in weights of filter papers [13]. The configuration for product collection is presented in Figure 1b.

2.4. Performance and Products Analysis

The molar fractions of each component in the gas product, Gasification Efficiency (GE), Carbon Gasification Efficiency (CGE) and Hydrogen Gasification Efficiency (HGE), were obtained using Equations (3)–(6), respectively [29,30,31]:
M o l a r   f r a c t i o n   X i % = n u m b e r   o f   m o l e s   o f   e a c h   g a s   c o m p o n e n t t h e   t o t a l   n u m b e r   o f   m o l e s   o f   g a s   p r o d u c e d × 100
G E % = m a s s   o f   g a s e o u s   p r o d u c t s   ( g ) m a s s   o f   b i o m a s s   ( g ) × 100
C G E % = t h e   t o t a l   m a s s   o f   e l e m e n t   c a r b o n   i n   t h e   g a s e o u s   p r o d u c t   ( g ) t h e   t o t a l   m a s s   o f   e l e m e n t   c a r b o n   i n   b i o m a s s × 100
H G E % = t h e   t o t a l   m a s s   o f   h y d r o g e n   i n   t h e   g a s e o u s   p r o d u c t   ( g ) t h e   t o t a l   m a s s   o f   e l e m e n t   h y d r o g e n   i n   b i o m a s s × 100  
A gas chromatograph system (GC-2014 Shimadzu, Milton Keynes, UK) with a packed column (ShimCarbon ST, 200 m in length by 0.35 mm in inner diameter) and a detector based on thermal conductivity (TCD) was used to analyse the composition of the gaseous product. For each analysis, 1 mL of the gas sample was injected into the GC using a gas-tight syringe. The column’s injection temperature was 45 °C with an equilibration time of 1.5 min. The total analysis time was 12 min [13].
The liquid products collected after SCWG of control and impregnated biomass samples were analysed by Gas Chromatography–Mass Spectrometry (GC–MS). The liquid product from a gasification experiment was extracted using dichloromethane with a volume ratio of 4:1 from the aqueous phase. Then 0.2 mL was transferred to a 1.5 mL sample vial and diluted to 1 mL using acetone. The GC-MS analysis was conducted on a ThermoFisher ISQ7610 quadrupole mass spectrometer, (Cambridge, UK), coupled with a ThermoFisher Trace 1600 chromatograph (Cambridge, UK) equipped with an AI1310 autosampler and an NIST mass spectral database. The RestekTM Rtx 35 ms capillary column (30 m × 0.25 mm i.d. × 50 µm) was used for the separation of the products, and helium was used as the carrier gas with a constant column flow rate of 1 mL/min.
The solid products of control and impregnated samples originating from SCWG were characterized by SEM-EDX, (scanning electron microscopy–energy-dispersive X-ray spectroscopy: JEOL JSM-6060LV, Low Vacuum SEM, Welwyn Garden City, Hertfordshire, UK) and XRD (X-ray diffraction: Bruker AXS GmBH, Karlsruhe, Germany) analysis.

3. Results and Discussion

3.1. Biomass Properties

3.1.1. Ultimate Analysis

The results of the ultimate analysis of the biomass samples are shown in Table 2. The results are presented on a dry and ash-free basis wt%.
According to what is reported in the literature, there was no significant distinction between the results of the proximate analysis of the control and impregnated samples [23,24]. As shown in Table 2, the unimpregnated control sample presented low ash and moisture contents of 2.9 and 3.2%, respectively, and high amounts of volatile matter (77.5%) and fixed carbon (19.6%) [13]. These findings suggest that coconut shell is a viable source of combustible material for energy generation.
For the ultimate analysis, increased nitrogen and oxygen and decreased hydrogen compounds with an increased nickel concentration were observed. These results corroborate the effects of the highest nickel content on the increased integration of hydrated or hydroxylated species of metal salts. However, the most pronounced change occurred in carbon content, which decreased from 49 wt% to 37.9 wt% due to the high nickel content that enhanced the dissolution of water-soluble extractives into the metal salt aqueous solution [13,27].

3.1.2. TGA/DTG/DTA (Thermogravimetric/Derivative/Differential Thermogravimetric Analysis)

As depicted in Figure 2a, the decomposition of the coconut shell samples can be divided into three distinct stages: stage (I) (up to 125 °C), which corresponds to the moisture loss and decomposition of some volatile compounds; stage (II) is attributed to the devolatilization process (between 125 and 366 °C), during which maximum weight losses were observed; and stage (III) (>366 °C), in which slow degradation related to the char/tar formation is observed.
The main differences observed for the TGA curves of the coconut shell samples in Figure 2a are presumably due to the reduction in the amount of the lignocellulosic compounds in the impregnated samples [13]. The impregnation of the coconut shell with nickel at pH (5.8) for 72 h possibly enhanced the decomposition of the biomass structure [32]. An intersection between the TGA curves of control and impregnated samples at approximately 350 °C is evident. At this temperature, the synthesis of nickel nanoparticles occurred, promoting the decomposition of biomass and reducing the production of char [24]. The 1 M impregnated coconut shell samples’ degradation resulted in the highest weight loss of 84.0% and the lowest char content of 15%, whereas lower weight losses of 78.6% and 79.4% were observed for control and 2 M impregnated samples, respectively [13]. As presented by Nanda et al. [27], this could be attributed to the increased catalytic activity of nickel in the thermal degradation of 1 M impregnated biomass, accelerating the overall reaction rate at higher temperatures and subsequently reducing the quantity of char produced. Researchers have also reported that a high nickel concentration does not favour metal dispersion [21]. The pyrolytic activity of nickel catalysing the thermal degradation of biomass is therefore decreased, influencing decomposition reaction rates and the devolatilization process, which contributed to reducing the weight loss and increasing the char yield.
The DTG curve presented in Figure 2b shows the presence of three defined peaks for all samples. The first peak occurs between 50 and 130 °C, representing the weight loss due to moisture. The peaks between 200 and 318 °C and 318 and 380 °C indicate the decomposition of hemicellulose and cellulose, respectively. Lignin was predicted to degrade above 380 °C and exhibit a tendency to continue over a more extensive temperature range [13]. The peak height analysis showed that the 2 M impregnated sample displayed reduced mass loss between 50 and 380 °C, attributed to water loss and the decomposition of Ni(OH)2 to NiO and H2O [33]. Additionally, the improved influence of nickel on char and tar degradation from 600 °C was inferred for the 1 M impregnated sample [13].
The differential thermogram in Figure 2c shows the three main peaks for the samples. Peaks 1 and 3 at circa 270 and 310 °C are exothermic and represent hemicellulose and lignin decomposition [13]. The endothermic peak at approximately 350 °C (peak 2) is related to cellulose decomposition. Additional peaks at 450 °C (peak 4) were observed for impregnated samples, which can be attributed to the reduction in the Nin+ species to metallic Ni, commonly taking place between 400 and 500 °C [13]. For this reason, authors have recommended this temperature range for catalytic supercritical water gasification experiments [26,27,34,35]. Comparing the DTG and DTA curves of the 2 M impregnated sample with those for the control and 1 M impregnated samples, it was possible to infer that increasing the catalyst concentration had a positive effect on the pyrolysis of cellulose, hemicellulose and lignin by reducing the decomposition temperature for each constituent.

3.1.3. SEM-EDX (Scanning Electron Microscopy-Energy Dispersive X-ray Spectroscopy)

The SEM-EDX spectra for the control and impregnated samples are presented in Figure 3.
The EDX spectra of the control sample displayed the occurrence of carbon (58.4 wt%), oxygen (39.7 wt%) and alkali metal aggregates such as Si (0.9 wt%), Ca (0.5 wt%) and K (0.3 wt%). The EDX spectra of the 1 M impregnated sample gave 58.9 wt% of carbon and 38.2 wt% of oxygen [13]. Similar to the ultimate results, the EDX spectra for 2 M impregnated samples exhibited lower carbon (47.1 wt%) and higher oxygen contents (45.8 wt%), due to the enhanced catalyst concentration. Nevertheless, it is noticeable that the carbon content is significantly higher than that determined by the ultimate analysis, likely attributed to the non-detection of nitrogen, sulphur and hydrogen composition through EDX analysis.
The SEM images shown in Figure 3 show the presence of aggregates of nickel particles deposited on the biomass surface of both impregnated samples. The rugged and heterogeneous appearance of the impregnated samples suggests the incorporation of NiO nanoparticles within the biomass, affirming the amorphous character of the samples [13,23].
A distinctive nickel peak was identified at 0.88 keV in both impregnated samples, aligning with findings from prior studies on nickel biomass impregnation [13,23,27]. The concentration of nickel of 5.6 wt% was obtained by impregnating the coconut shell sample with a 2 M nickel solution. Richardson et al. [26] and Marcelino et al. [13] reported 2.0 wt% and 1.6 wt% of nickel in 1 M impregnated woody and coconut shell biomass, respectively. Although the nickel concentration in the impregnation solution is almost three times as high, the nickel content in the biomass is influenced by its characteristics. The fibrous composition of coconut shells leads to a lower metal loading, potentially impacting the catalytic performance during thermochemical conversion [13].

3.1.4. XRD (X-ray Diffraction)

The XRD pattern of control and impregnated samples is exhibited in Figure 4.
From the XRD analysis of the control coconut shell sample, peaks at 16.3°, 26.3° and 34.5° were observed corresponding to amorphous cellulose and 21.8° for crystalline cellulose [13]. For the 1 M impregnated coconut shell sample, peaks at 15.6°, 26.3° and 34.4°, were observed corresponding to amorphous cellulose, and 21.9° for crystalline cellulose [13]. These results demonstrate the high incorporation of nickel by the reduction and shift events in the amorphous and crystalline regions, respectively [23,26].
The presence of nickel nanoparticles in the 2 M impregnated sample is related to the peaks identified at 12.2°, 39.2°, 49.9° and 59.6°, which represent the Ni+2/+3 state. The first peak is associated with the hydrated form and the three peaks indicate the oxide form [23,26]. For the 1 M impregnated sample, peaks at 10.9° corresponding to Ni(OH)2 and 39.2° and 49.8° for NiO nanoparticles are detected [13,23,26]. By comparing 1 M and 2 M diffraction patterns, it can be observed that the rise in nickel concentration led to a reduction in peak intensity, which means that the detection of nickel became lower [21]. An additional peak at 59.6° for the 2 M nickel-impregnated sample was found for NiO [23,26].
Using the XRD data, the diameter of the nickel nanoparticles’ crystallite size (L) was calculated using Scherrer’s equation. The presence of dispersed nickel particles at the nanoscale (<100 nm) is indicated by the calculated average crystallite size of the metal nanoparticles (7.2 nm) in the 1 M and (13.5 nm) 2 M impregnated samples [13,36]. Previous studies have documented the formation of nickel nanoparticles distributed within biomass matrices, ranging from 7 to 80 nm [13,23,24,26]. The authors reported an increase in crystal size with an increment in nickel concentration, as well as a higher crystallite size with a lower dispersion and metallic surface area, which can influence the catalytic activity in the SCWG process [21].

3.2. The Influence of Process Variables on the SCWG Products and Performance

The influence of variables on product yields and their characteristics and process efficiencies were investigated and presented below.

3.2.1. Product Yields

The product yields from the SCWG of the fresh and impregnated coconut shells are presented in Table 3.
The findings in Table 3 demonstrate that, under identical biomass loading and residence times, elevating the temperature from 400 to 500 °C resulted in increased gas yields and reductions in solid and liquid content for both the control and impregnated samples. The same trend was observed when the residence time values increased from 20 to 60 min. For the feed concentration, it was noticed that an increase from 20 to 30 wt% led to reductions in liquid and gas yields, while solid production was favoured.
The results of this work are consistent with the findings from the literature [13,29,37,38]. The authors have explained that higher temperatures and residence times promote hydrothermal reactions associated with gas production, including secondary reactions that break down high molecular weight species into gases [27]. Researchers also described that higher feed concentrations make the interaction of biomass and supercritical water difficult, leading to the formation of complex components that are not easily gasified. Such conditions inhibit important reactions such as solvolysis and hydrolysis, reducing liquid yield and increasing solid content [39,40].
In comparison with the results reported by Marcelino et al. [13], for control and 1 M impregnated coconut shell samples, it was noticed that increasing the nickel catalyst concentration (2 M impregnated sample) led to decreases in liquid and solid yields and increases in gas content for all the experimental runs. The lowest solid and liquid yields, of 9 and 43 wt%, respectively, and the highest gas content (48 wt%) were obtained for SCWG of 2 M impregnated sample at 450 °C, for 40 min and with 25 wt% of biomass loading. Considering the same experimental conditions, high solid and liquid contents were obtained, of 12.5 and 66.1 wt%, respectively, and a low gas yield of 21.2 wt%, for SCWG of the control sample [13]. These results confirm the positive influence of increased nickel loading on the SCWG process.
The ability of the nickel catalyst to degrade complex intermediates such as tar components into gas has been reported in the literature by Kumar and Reddy [23] and Borges et al. [29]. Other studies have also investigated the effect of nickel metal loading on the SCWG of biomass in the presence of different supports [20,21,22]. Gong et al. [20] and Lu et al. [22] demonstrated that increasing the nickel metal loading to the maximum of 16 wt% enhanced the gas yields obtained from the SCWG of sewage sludge and wheat stalk, respectively. According to the authors, this enhancement was due to high metal activity sites, which accelerated the gasification rate, resulting in more gaseous products. Similarly, Kang [21] conducted experiments by varying nickel loading from 2.5 wt% to 20 wt%, concluding that the best results were achieved at 10 wt% of catalyst concentration. The authors observed that 2.5 wt% nickel loading did not positively influence gas yield because of the absence of active sites. On the other hand, when a higher nickel loading (20 wt%) was employed, a poor nickel dispersion was noticed, which reduced the catalytic activity. It can be inferred that the increase in the unsupported dispersed nickel loading performed in this study, from 1.6 wt% to 5.6 wt%, produced favourable effects on the SCWG process, enhancing gas yield by up to 48 wt%.
Three replications of the central point, represented by 25 wt% biomass loading, 450 °C and 40 min, were conducted to evaluate the experimental error. The results showed that the solid, liquid and gas yields were 10.5 ± 1.25 (wt%), 48.5 ± 7.09 (wt%) and 40.5 ± 8.03 (wt%), respectively. The largest error of 8.03 wt% is considered acceptable, as experimental errors are inevitable and challenging to control, leading to some losses in mass balance.

3.2.2. Gas Composition and Process Efficiency

The influence of nickel impregnation on the SCWG process was evaluated by conducting detailed analyses of gas products from a select number of experiments, and the results obtained for the response variables are shown in Table 4.
The data presented in Table 4 show that during SCWG of 2 M coconut shell samples, CO2 was the main gas component reaching 79.5 mol% at 400 °C, 40 min and 30 wt% of biomass loading. The comparison of CO2 yields in the same SCWG conditions for control and 1 M impregnated samples revealed that CO2 yields increased with the higher nickel concentration. A similar trend was observed for H2 production. For example, at 500 °C, 20 min and 25 wt% biomass loading, a maximum H2 content of 15.2 mol% was achieved, whereas for the control and 1 M impregnated samples, 9.5 and 13 mol% were obtained [13]. Kang [21] reported increases in CO2 yields with enhanced nickel loading supported on Al2O3, from 5 wt% to 20 wt%. Likewise, Lu et al. [22] observed increments in CO2 and H2 concentrations when nickel loading supported on MgO was increased from 4 wt% to 16 wt%. The increase in gas yields with increasing Ni loading corresponded to lower char and liquid yields. These findings suggested that the high nickel content contributed to the enhancement of the water gas reaction rate, thereby enhancing CO2 and H2 production. It was likely that Ni redox catalysis was responsible for the reaction of supercritical water with carbon (from char and tar compounds) as represented by Equation (7).
N i O + C + H 2 O N i + C O 2 + H 2
The presence of Ni could be responsible for methane reforming (Equations (8) and (9)) to produce more hydrogen and CO/CO2 as observed in the gas products for increased NiO loading.
C H 4 + H 2 O C O 2 + 4 H 2
C H 4 + H 2 O C O + 3 H 2
Characterisation of the char products showed the presence of Ni0 as the main Ni species after the reaction, indicating that the initial redox Ni2+ Ni0 catalysis occurred. This makes methane reforming plausible, and metallic Ni has been reported to catalyse this reaction [24,29].
The results obtained for CH4 and CO content in most of the runs for the 2 M impregnated sample demonstrated that 5.6 wt% nickel content gave low constituent yields. The maximum CH4 content (38.9 mol%) was achieved under the conditions shown in run 3 (500 °C, 60 min and 25 wt% biomass loading). However, during SCWG of the control and 1 M impregnated samples under the same conditions, 43.2 and 42.6 mol% of CH4 were produced [13]. Similarly, the maximum content of CO decreased from 8.7 mol% (obtained from SCWG of the 1 M impregnated sample) to 2.3 mol% in run 2 due to the increase in nickel loading. However, comparing the results with those obtained for SCWG of the control samples, enhancements in CO production were observed. Nickel acts an an important hydrogenation catalyst, which contributes to the primary decomposition of CO and H2 [27]. On the other hand, Borges et al. [29] reported that the reduction in CO yield with increased nickel loading could be attributed to the competition for CO for methanation and hydrogen production through the water–gas shift reaction.
Azadi et al. [41] and Kang [21] reported a decrease in CH4 formation with an increase in nickel loading supported by Al2O3 from 5 wt% to 20 wt%. According to the authors, this results from the high sensitivity of the methanation reaction to the high nickel loading and crystalline size. The decreased nickel dispersion affects the interaction with the support and the catalyst’s activity in methanation reactions.

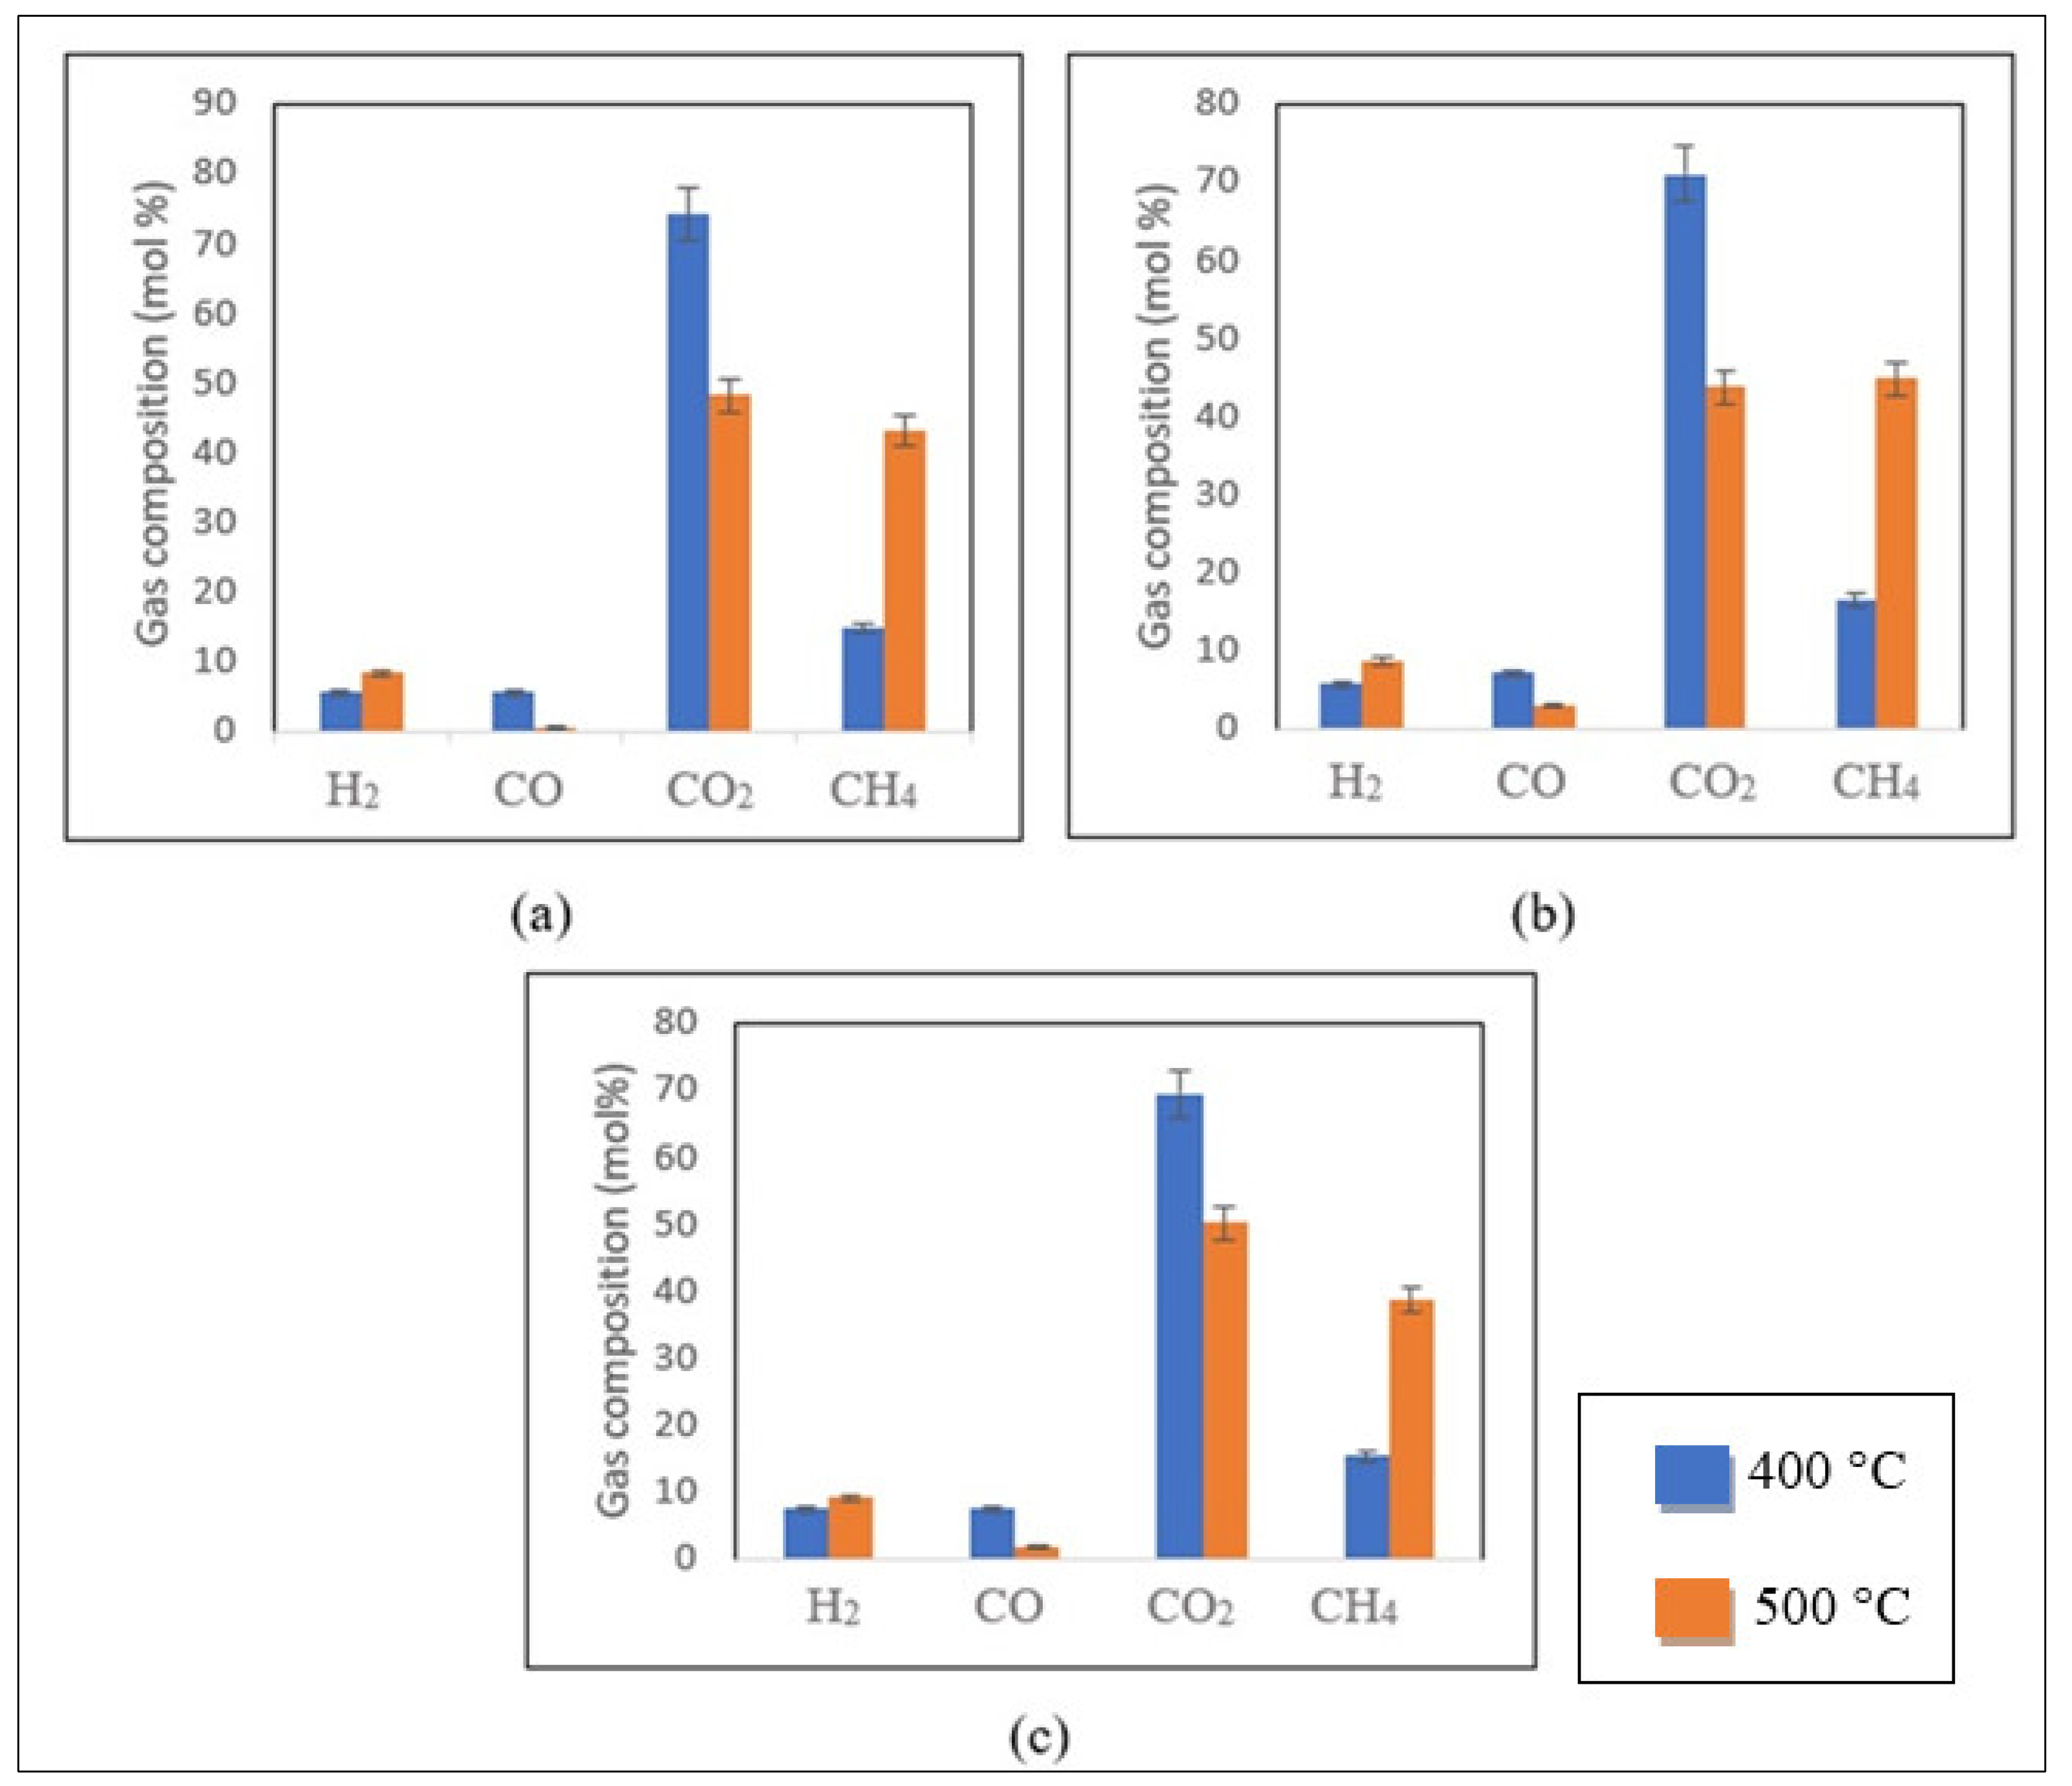
Influence of Temperature

Temperature is recognized as the most crucial variable in determining gas composition and SCWG efficiency [13]. For a fixed residence time of 40 min and 20% biomass loading, the impact of temperature on the gasification process of control, 1 M and 2 M impregnated samples is presented in Figure 5a–c.
The increase in process temperature led to higher yields of H2 and CH4 in SCWG of the control and 1 M impregnated coconut shell samples, as depicted in Figure 5a,b [13]. The same was observed in Figure 5c, which represents the SCWG of the 2 M impregnated sample. Adversely, the production of CO and CO2 decreased with the temperature increase for all samples.
The methanation of CO2 and CO and water–gas shift reactions are enhanced with temperature contributing to the rise in H2 and CH4 yields in the product gas [42]. Steam-reforming endothermic reactions associated with H2 production are favoured by higher reaction temperatures [43]. Despite methanation being an exothermic process, the temperature range employed in this study did not significantly affect this reaction [13].
The gasification reaction rates with increased nickel loading are less dependent on the process temperature. Consequently, reduced increments in H2 and CH4 yields were detected. For example, for the 2 M impregnated sample at 40 min and 20% biomass loading, an increase of 150 and 21% in CH4 and H2 yields was observed with the temperature elevation from 400 to 500 °C. Under the same conditions, higher percentages of CH4 and H2 contents were observed for the control and 1 M impregnated samples [13].
The impact of temperature on GE, CGE and HGE values obtained from SCWG of control, 1 M and 2 M impregnated samples was also analysed. The results obtained from the SCWG of samples at 20 wt% biomass loading and 40 min residence time are exhibited in Table 5.
The GE, CGE and HGE values increased with the temperature for all samples due to an increased reaction rate [44]. The results are in agreement with those described in the literature [45,46], where the increase in the HGE value with the increase in temperature is due to the high hydrogen and methane yields in the gas at 500 °C. The highest GE, CGE and HGE values of 46, 53 and 83% were detected for the 2 M impregnated sample at 500 °C.
The most significant increases in GE, CGE and HGE values were found for the SCWG control sample, suggesting a higher sensitivity of the SCWG reactions to temperature in the absence of a catalyst.

Influence of Biomass Loading

Figure 6a–c present the effect of biomass loading on the gas composition.
According to Figure 6, the production of CO2 increased with the feed concentration for control and impregnated samples. However, the molar concentrations of the other gases (H2, CO and CH4) were reduced under the same conditions. For instance, for the 2 M impregnated sample, an increase from 50.3 to 65.4 mol% in the CO2 yield was observed. In contrast, the H2, CH4 and CO yields declined from 10.8 to 6.3 mol%, 33.5 to 24.8 mol% and 5.3 to 3.5 mol%, respectively (Figure 6c).
Compared with the results obtained for the control (Figure 6a) and 1 M impregnated samples (Figure 6b), a comparable tendency was noticed for the CO2, H2 and CO yields [13]. Generally, water–gas shift and steam reforming reactions are less favourable at high biomass concentrations, leading to the decreased formation of H2 and CO2 [37]. In the steam-reforming reaction, a significant amount of water is preferable to react with hydrocarbons and produce H2 and CO as end products [47,48]. However, these reactions can be accelerated in the presence of nickel nanocatalysts, leading to higher CO2 production [13]. It can be assumed that higher nickel loading produces a greater increase in CO2 yield. Compared to the 1 M impregnated sample results, the enhancement in H2 yield with increased nickel loading was insufficient to promote H2 production at the higher feed concentration. The decrease in CO yield resulted from the combined effect of high biomass loading and nickel content.
When analysing the results obtained for CH4 content from the 1 M impregnated sample (Figure 6b), a different profile was noticed [13]. At 450 °C and 60 min, a modest increase in CH4 content (from 38.4 to 40.9 mol%) was detected with the increment in biomass concentration. However, in identical temperature conditions and when decreasing the residence time to 20 min, CH4 increased from 21.9 to 25.8 mol% for the 2 M impregnated sample. This study demonstrated that increasing nickel loading leads to a decline in CH4 formation, as shown in Figure 6c, as a result of the increased sensitivity of the methanation reaction to both high nickel loading and nickel crystalline size.
Increasing biomass loading from 20 to 30 wt% for the control and impregnated samples at 450 °C and 60 min decreased GE, CGE and HGE values (Table 6). It has been reported that increasing biomass loading reduces heat and mass transfer between char and water, so the steam-reforming and gas shift reactions are restricted, reducing gasification efficiencies [30,40,49]. However, the most significant reduction was noticed for the HGE value. This may be due to the decrease in H2 and CH4 content with the increased biomass loading. The most considerable reduction of 56% was found for the HGE value obtained for the 2 M impregnated sample. It is possible to assume that the higher influence of the nickel concentration and biomass loading on the HGE value is due to the considerable reduction in H2 and CH4 production.

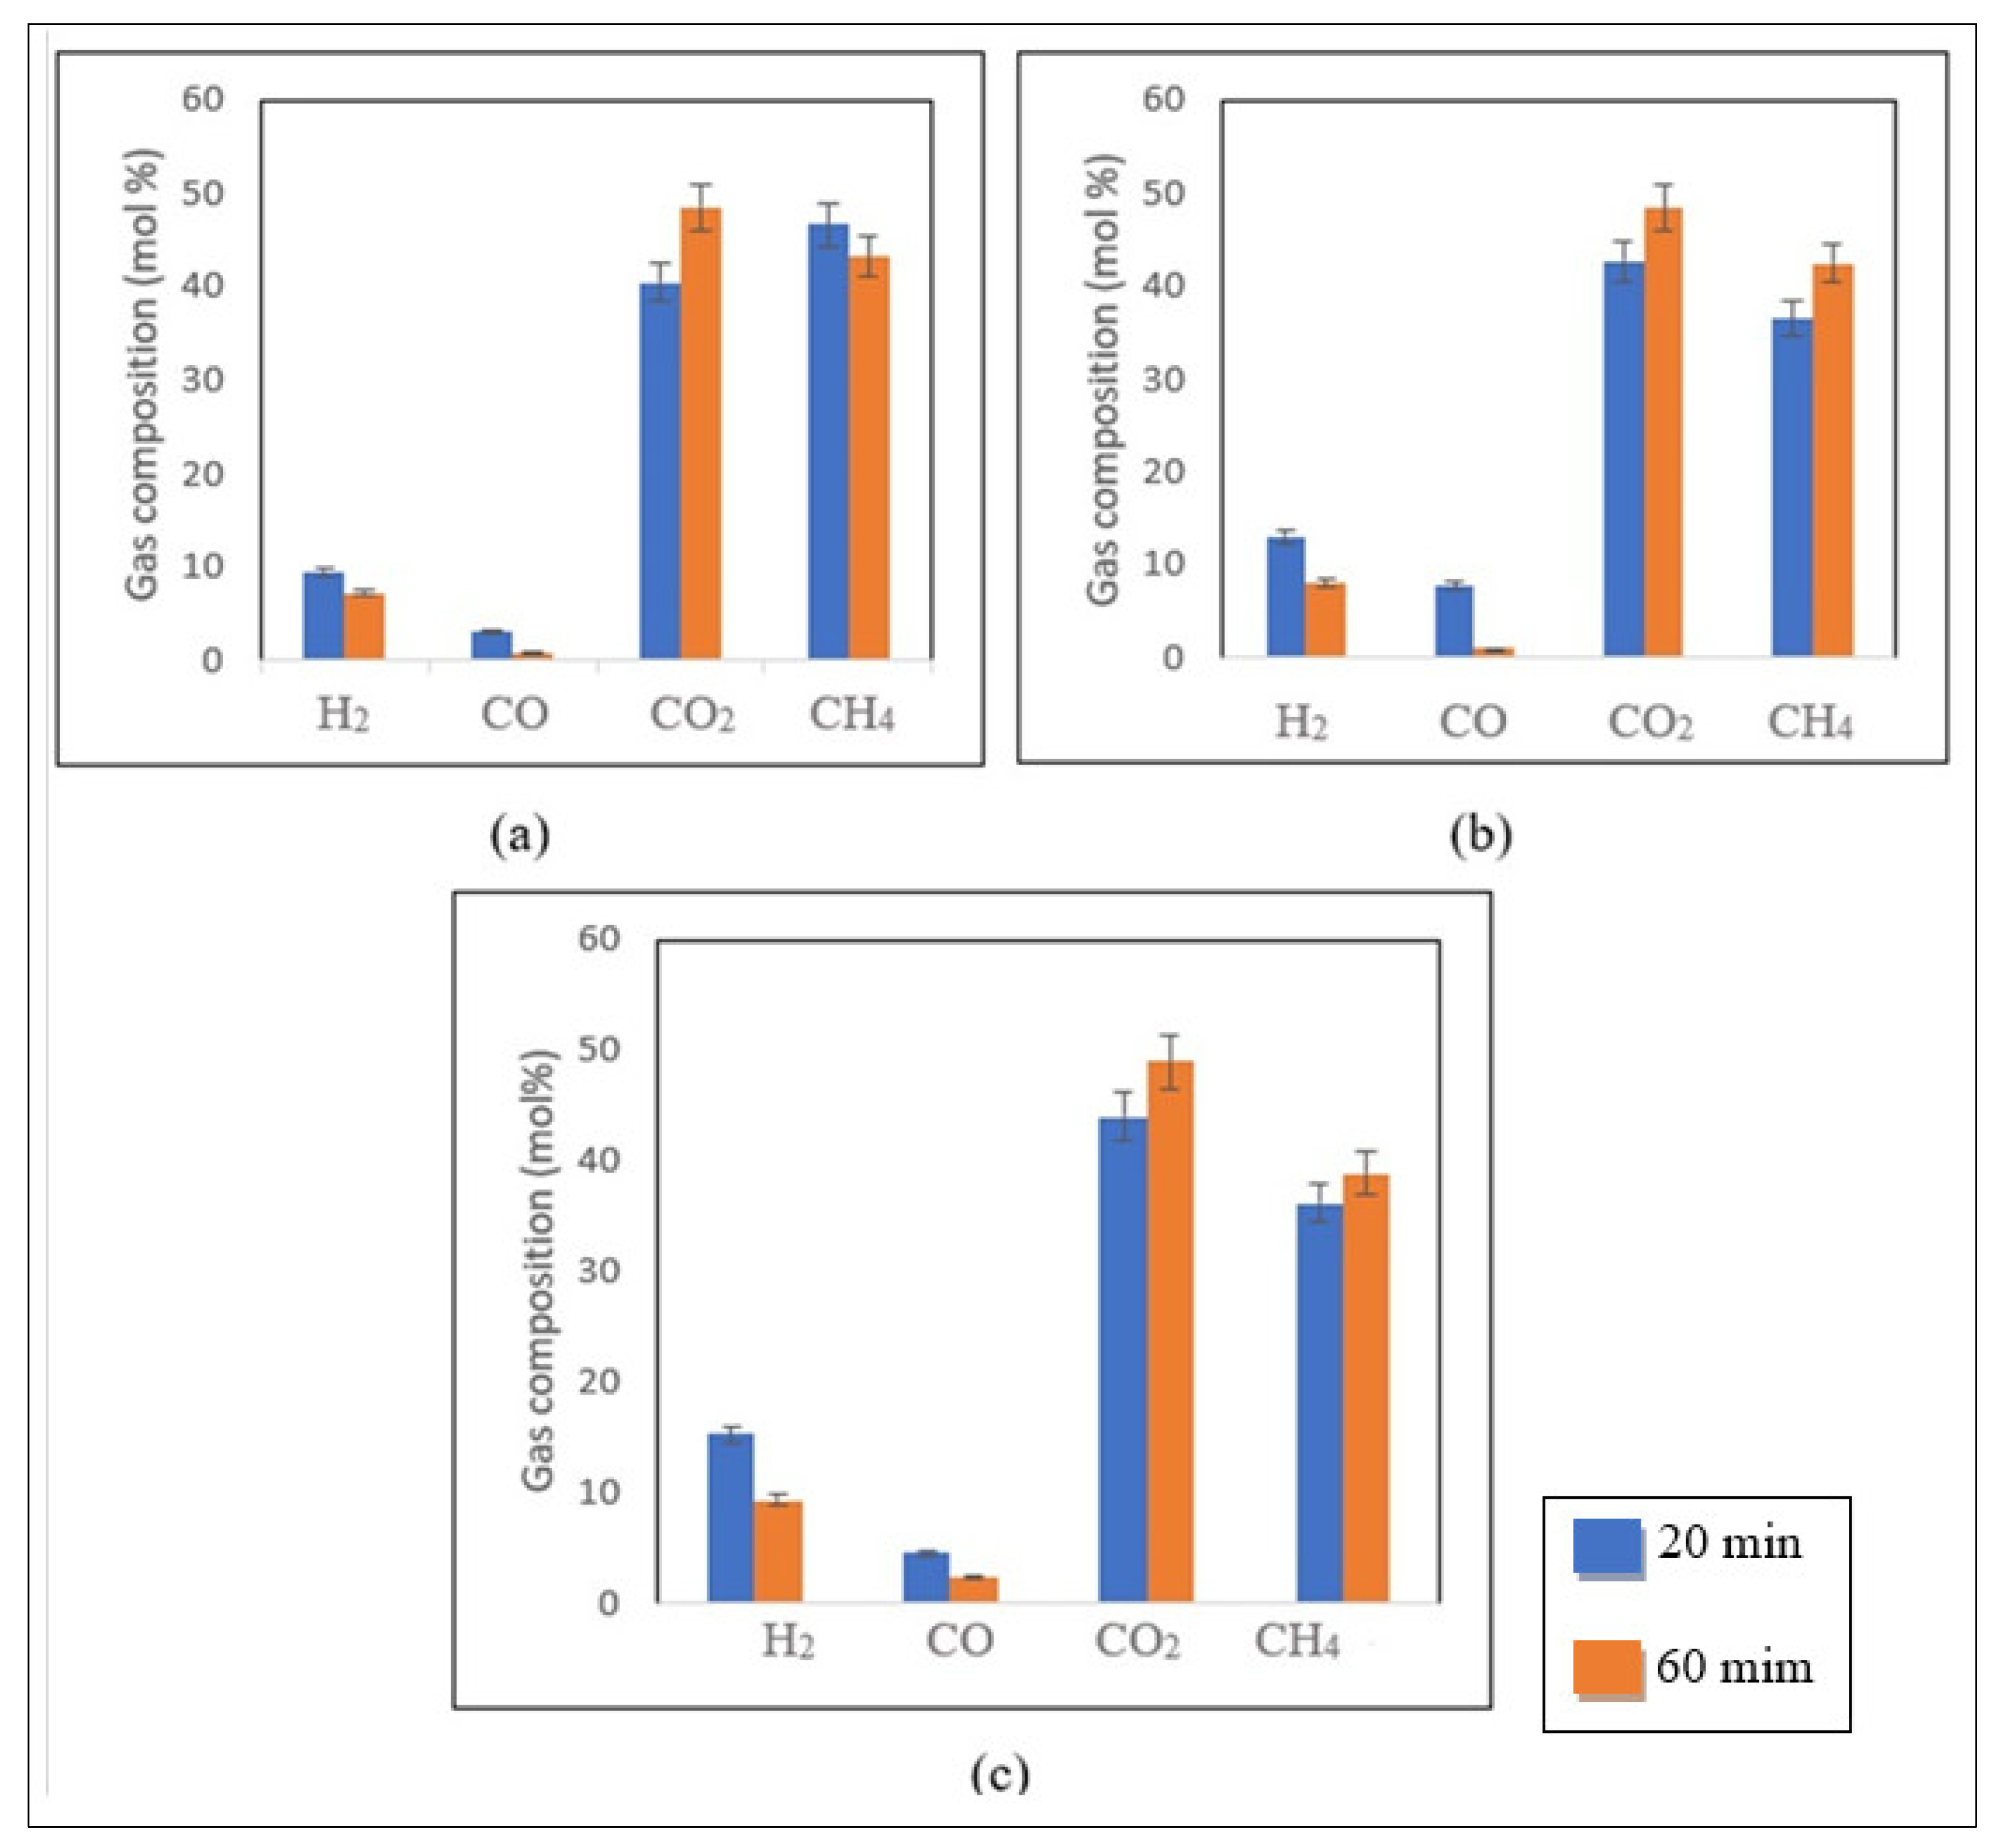
Influence of Residence Time

The impact of residence time on the response variables is seen in Figure 7a–c for 20 to 60 min residence times for a fixed biomass loading of 25 wt% at 500 °C.
As shown in Figure 7b,c, the production of CO2 and CH4 was favoured with the enhancement in residence time from 20 to 60 min for the 1 M and 2 M impregnated samples. At 25 wt% biomass loading, the CO2 and CH4 yields increased slightly from 44.1 to 49.5 mol% and 36.2 to 38.9 mol%, respectively, for longer residence times (Figure 7c). Conversely, the H2 and CO yields were reduced from 15.2 to 9.2 mol% and 4.5 to 2.5 mol%, respectively, with an increase in residence time.
A similar trend was observed for the 1 M impregnated sample (Figure 7b). In these conditions, the H2 and CO yields reduced from 13 to 8 mol% and 7.7 to 1.02 mol% when the reaction time increased from 20 to 60 min, respectively. Meanwhile, the production of CO2 and CH4 increased from 42.8 to 48.4 mol% and 36.7 to 42.6 mol%, respectively [13]. A similar result was observed for the SCWG of the control sample in similar experimental conditions (Figure 7a). However, a reduction in CH4 content from 46.8 to 43.2 mol%, was observed [13]. It can be concluded that the methanation reaction rate related to the CO consumption and CH4 formation is more favoured in the presence of the catalyst at low loading and high residence time.
The literature reports similar results [13,50]. Water–gas shift and methanation reactions are favoured at longer residence times, leading to the improved formation of CO2 and CH4, respectively. Studies also show that relatively low temperatures (<500 °C) and long residence times do not favour H2 production. Under longer reaction times, hydrogenation and methanation reactions involving CO and H2 consumption are favoured, resulting in reduced H2 and CO yields [29,51].
The impact of changing the residence time from 20 to 60 min during the SCWG of the control, 1 M and 2 M impregnated samples at 500 °C and 25 wt% on GE, CGE and HGE values is presented in Table 7.
The higher reaction time (60 min) gives higher GE and CGE values for all samples. This observation agrees with Samiee-Zafarghand et al. [48], who indicated that an enhanced CGE value with increasing residence time indicates increased gas production in supercritical water conditions. Moreover, greater reaction times are essential for cracking reactions that generate gases [51]. Nevertheless, it can be seen that the HGE values declined with an increase in time to 60 min due to the promotion of hydrogenation and methanation reactions resulting in a decrease in the yields of H2 and CO and the HGE value [38]. The highest HGE value of 133% can be related to the high production of H2 at lower residence times (20 min). Moreover, hydrogen from water is used during the reactions, leading to HGE values larger than 100%.
Considering the impact of the nickel loading and residence time on gasification efficiencies, the highest percentage of change was found for the HGE value (reduced to 38.2%) obtained for the 2 M impregnated sample at 60 min residence time. Increasing nickel loading and residence time promotes hydrogenation and methanation reactions, leading to a significant reduction.

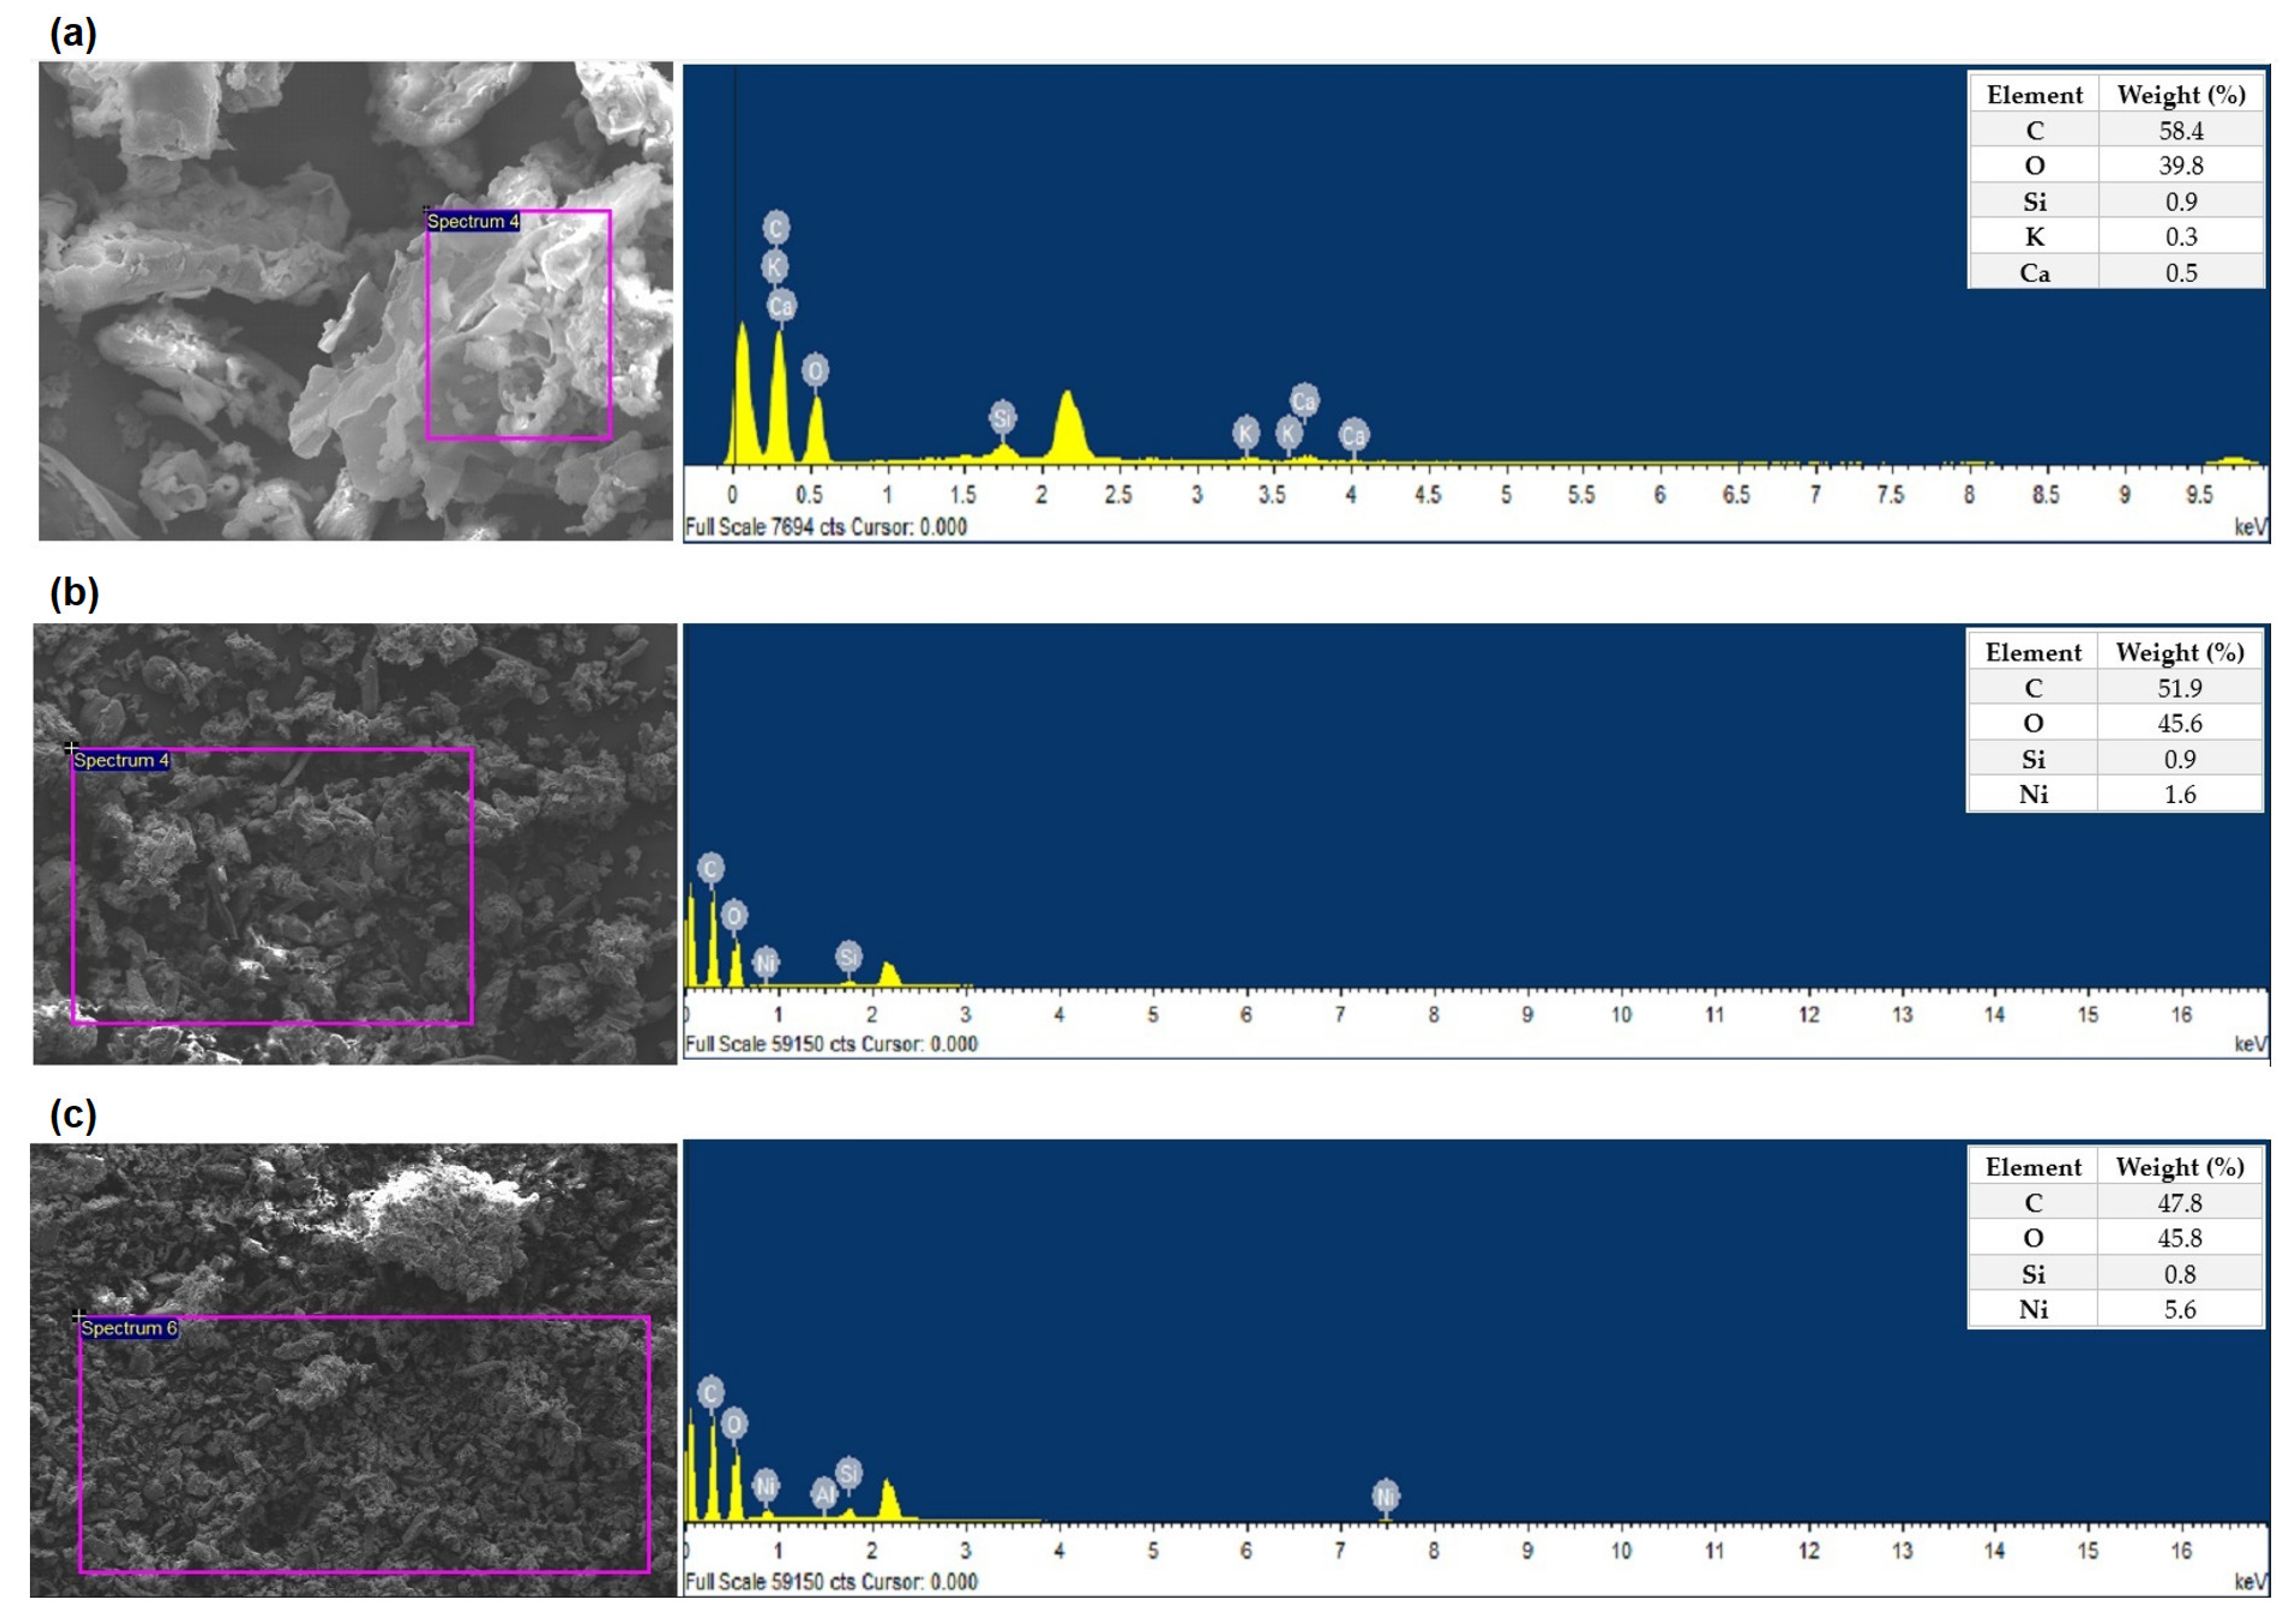
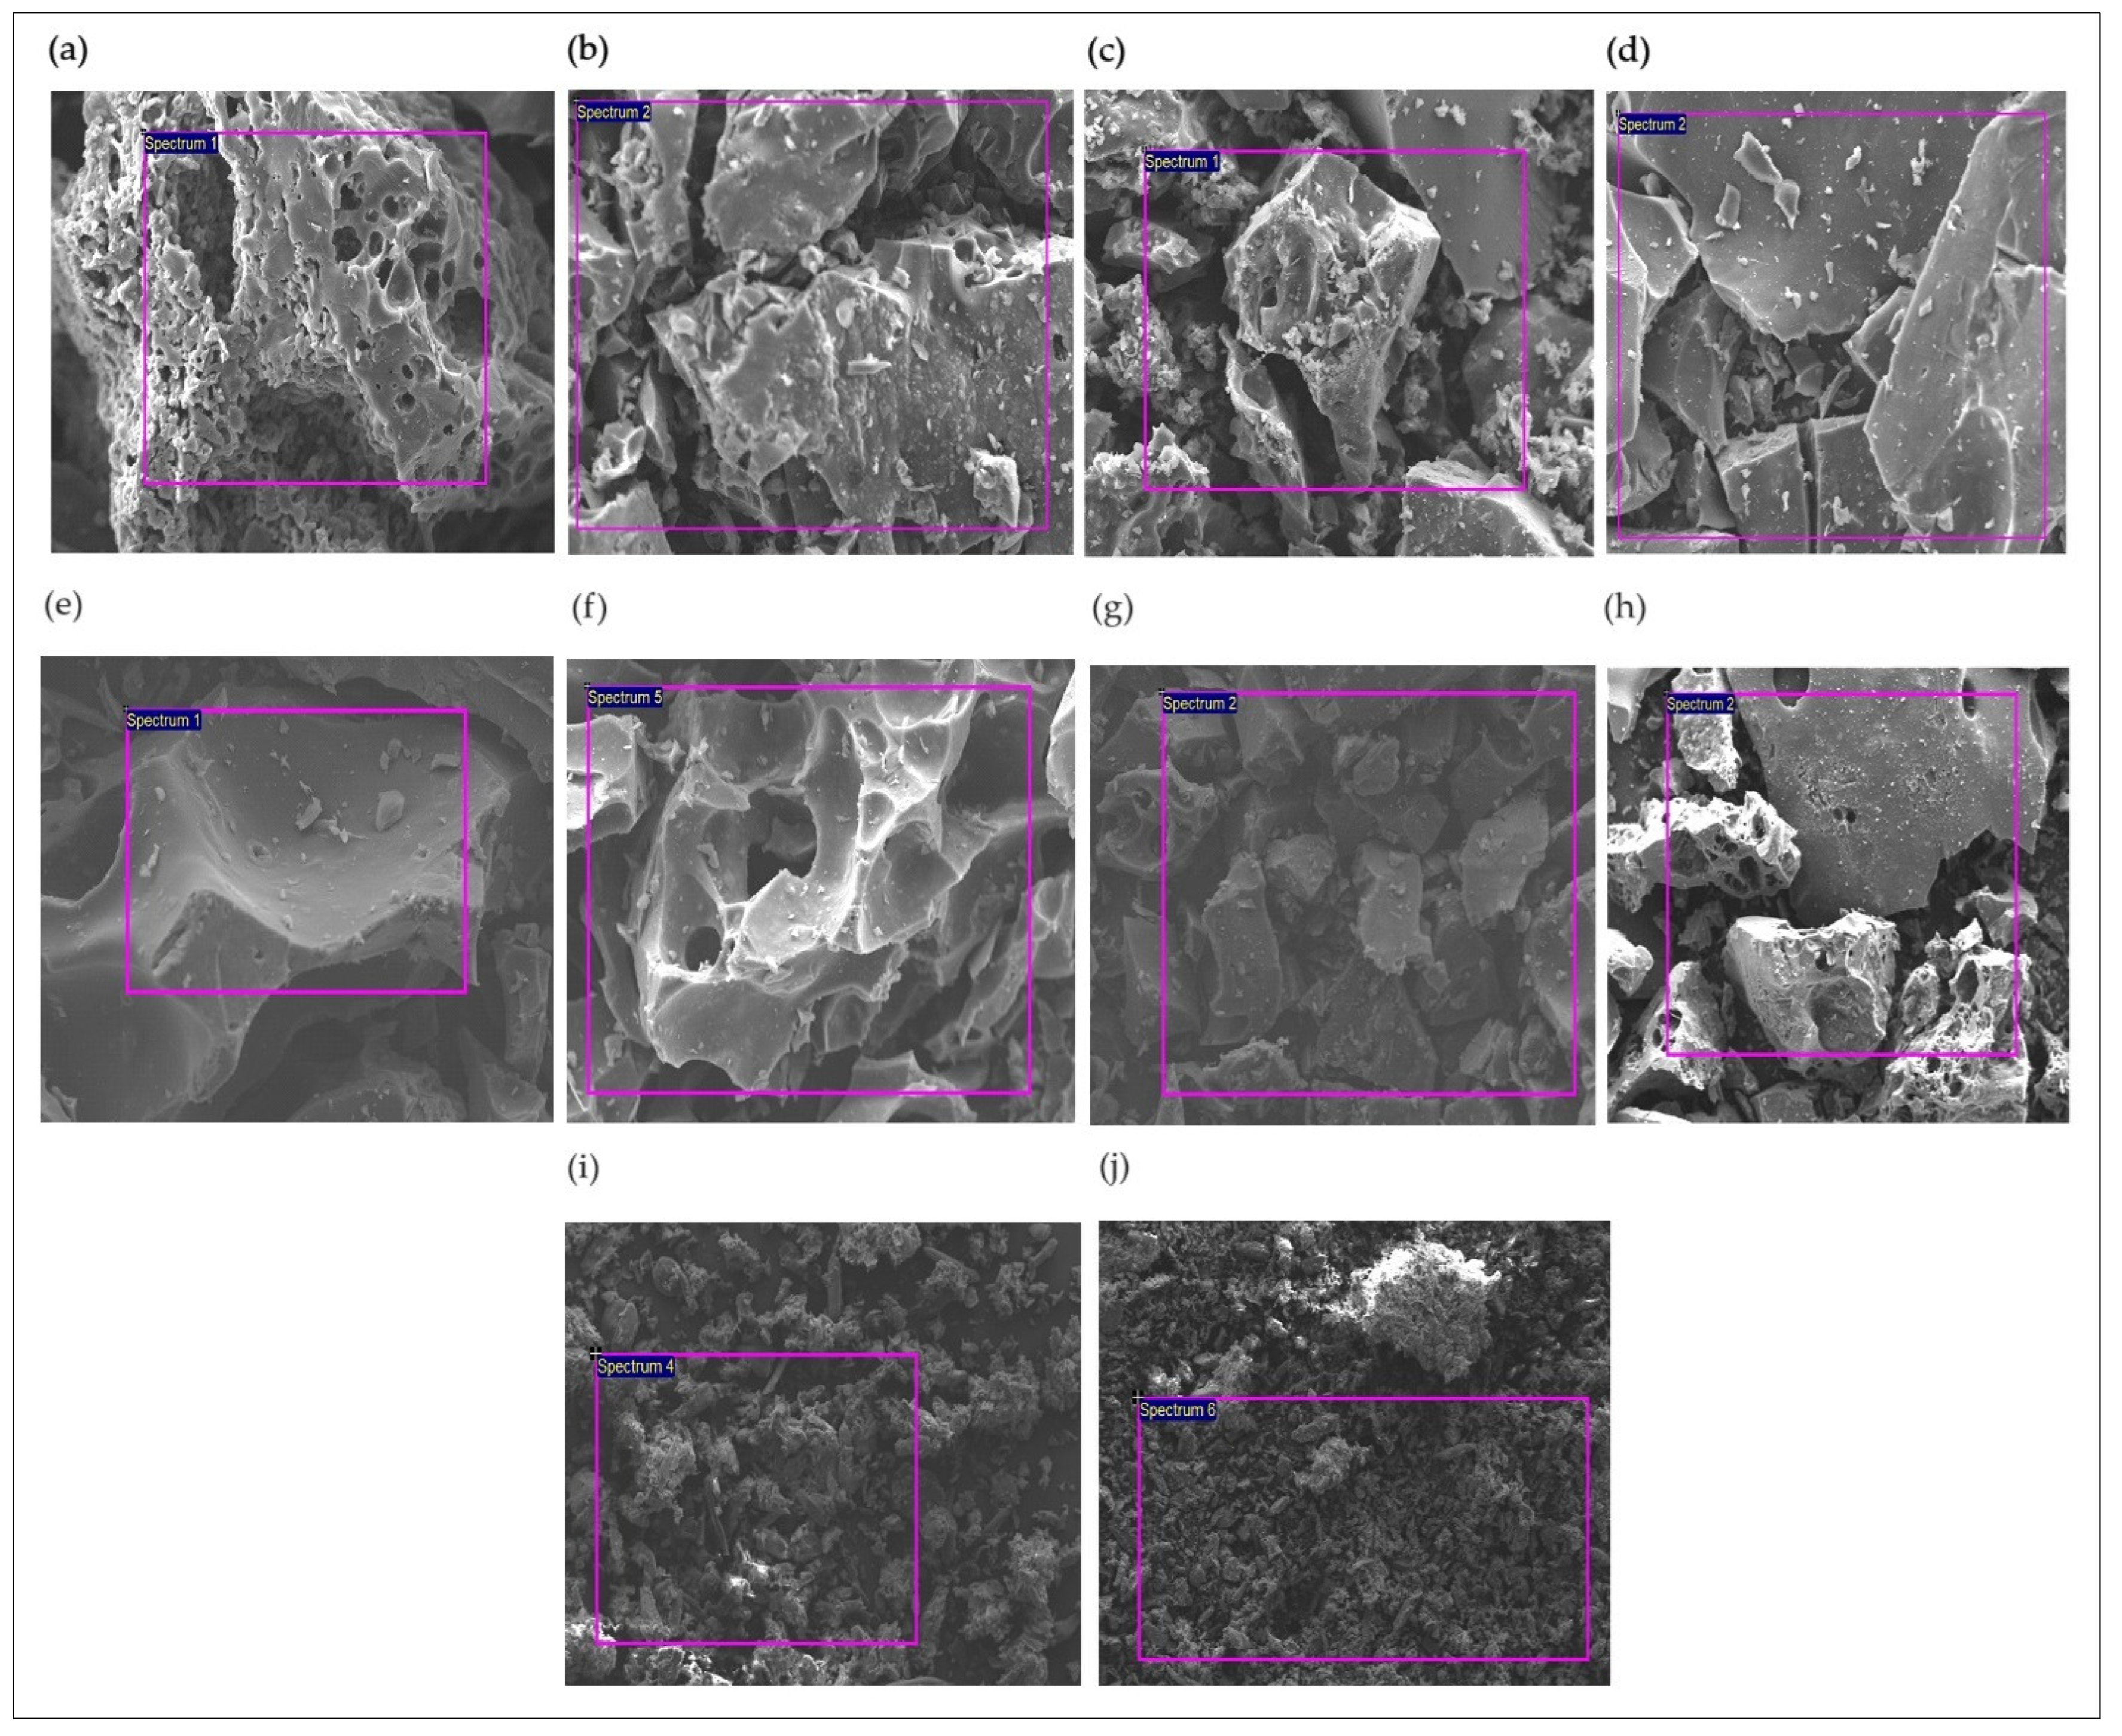
3.2.3. Solid Characterization

The solid content obtained from SCWG of the impregnated biomass samples at 400 and 500 °C with 20 and 60 min residence times for 25 wt% biomass loading was characterised using SEM-EDX and XRD analysis to assess the impact of nickel concentration and process parameters on the catalyst retention and hydrochar morphology.
The hydrochars (Figure 8a–h) showed more porous and fragmented surfaces than those observed for the biomass-impregnated samples before SCWG (Figure 8i,j). Furthermore, the hydrochar produced from the SCWG of the 2 M impregnated samples (Figure 8a–d) showed a greater appearance of pore structure and fractures.
The hydrochars produced from SCWG at 500 °C for 1 M (Figure 8g,h) and 2 M (Figure 8c,d) impregnated samples demonstrated a more fissured structure. The same morphological structure profile appeared with an increment in residence time. These results indicate both conditions promote efficient biomass conversion, compromising the structural conformation to the hydrochar [40,47]. Previous studies have also reported the enlargement of pore structure under these experimental conditions, leading to an improvement in the degree of gasification and further gasification reactions, such as free radical reactions. These reactions promote the gradual loss of the oxygenated groups in the hydrochar, causing the disintegration of its surface, as observed in the results obtained from EDX analysis of hydrochars shown in Table 8 [15,40]. The oxygen content in hydrochars decreases with higher temperatures and longer residence times. Conversely, an elevated nickel loading increases the oxygen concentration due to the higher presence of oxygen in 2 M-impregnated biomass.
Ni was found in all hydrochar samples indicating that Ni was retained from the original precursors [27]. The greatest nickel loading (22.6 wt%) was identified for the hydrochar formed from the SCWG of the 2 M impregnated sample at 500 °C and 60 min. Increased gasification of the solid feedstock would reduce the amount of char product and lead to the enrichment of Ni in the solid residues [23]. The authors investigated the effect of pyrolysis temperature (from 300 °C to 700 °C) and biomass nickel loading (from 0.1 to 1.0 M) on the nickel concentration in hydrochars with the highest level of nickel (9.9 wt%) found in hydrochars produced from 1.0 M impregnated wood at 700 °C.
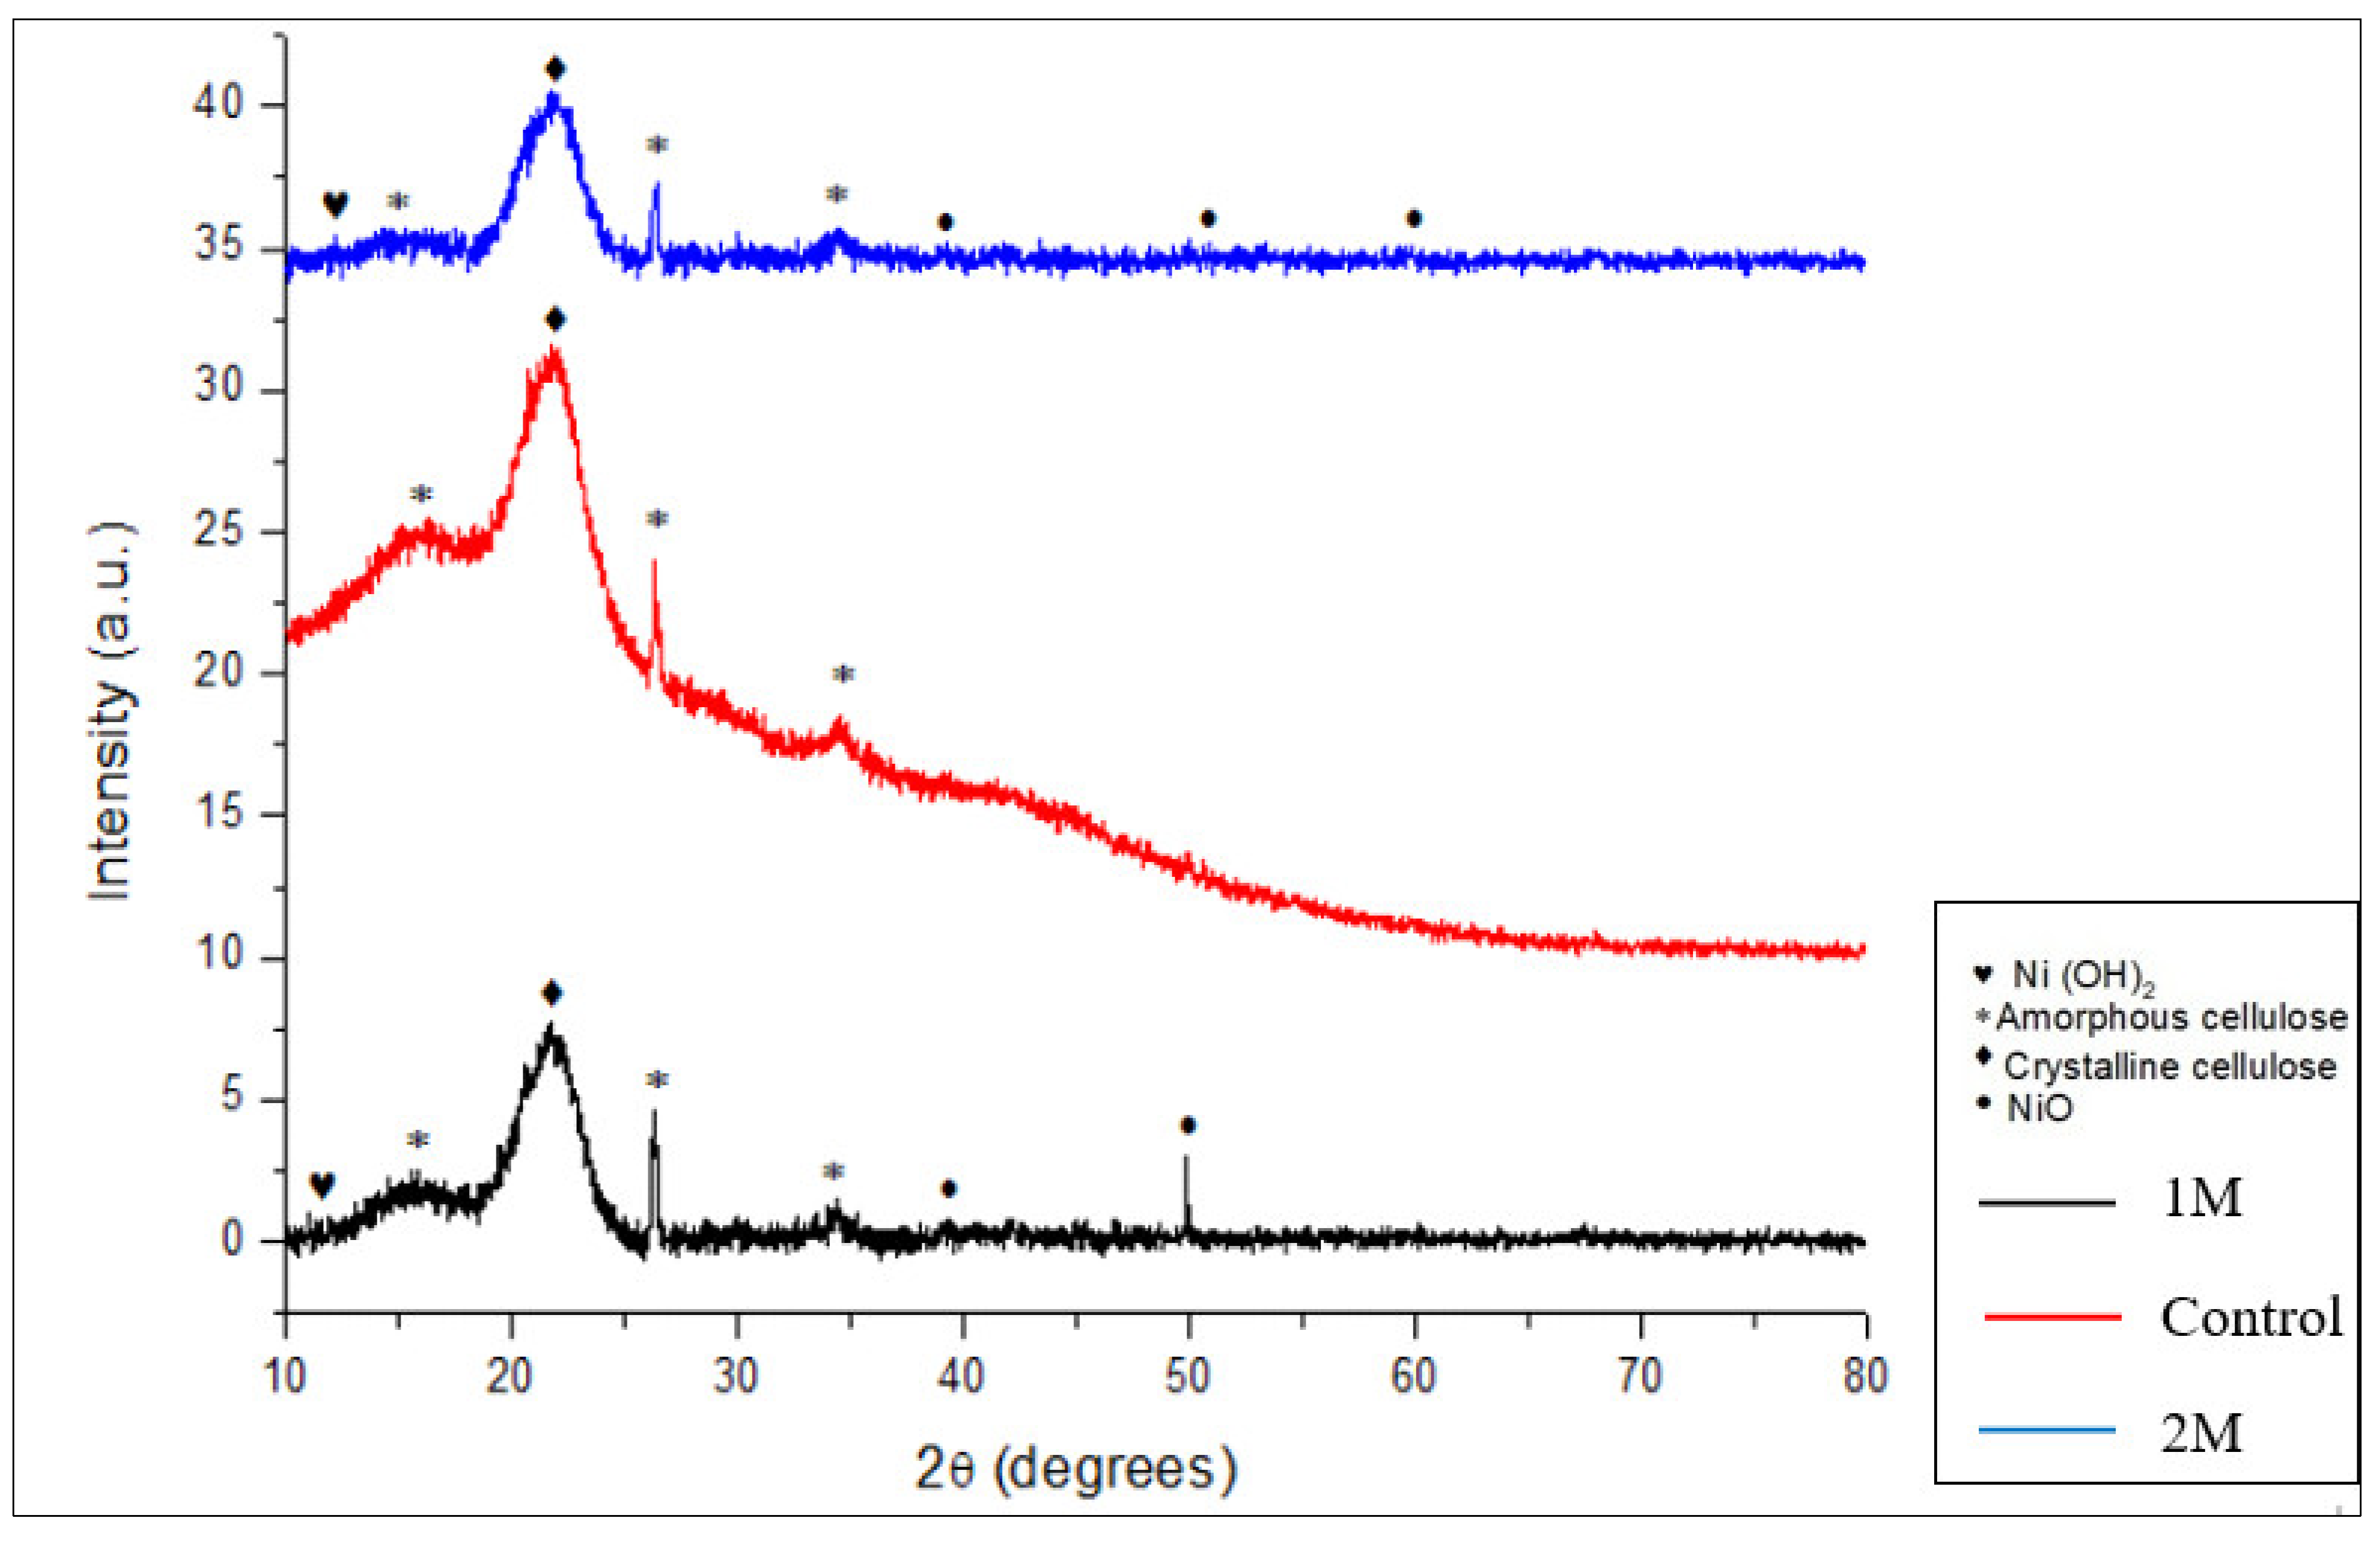
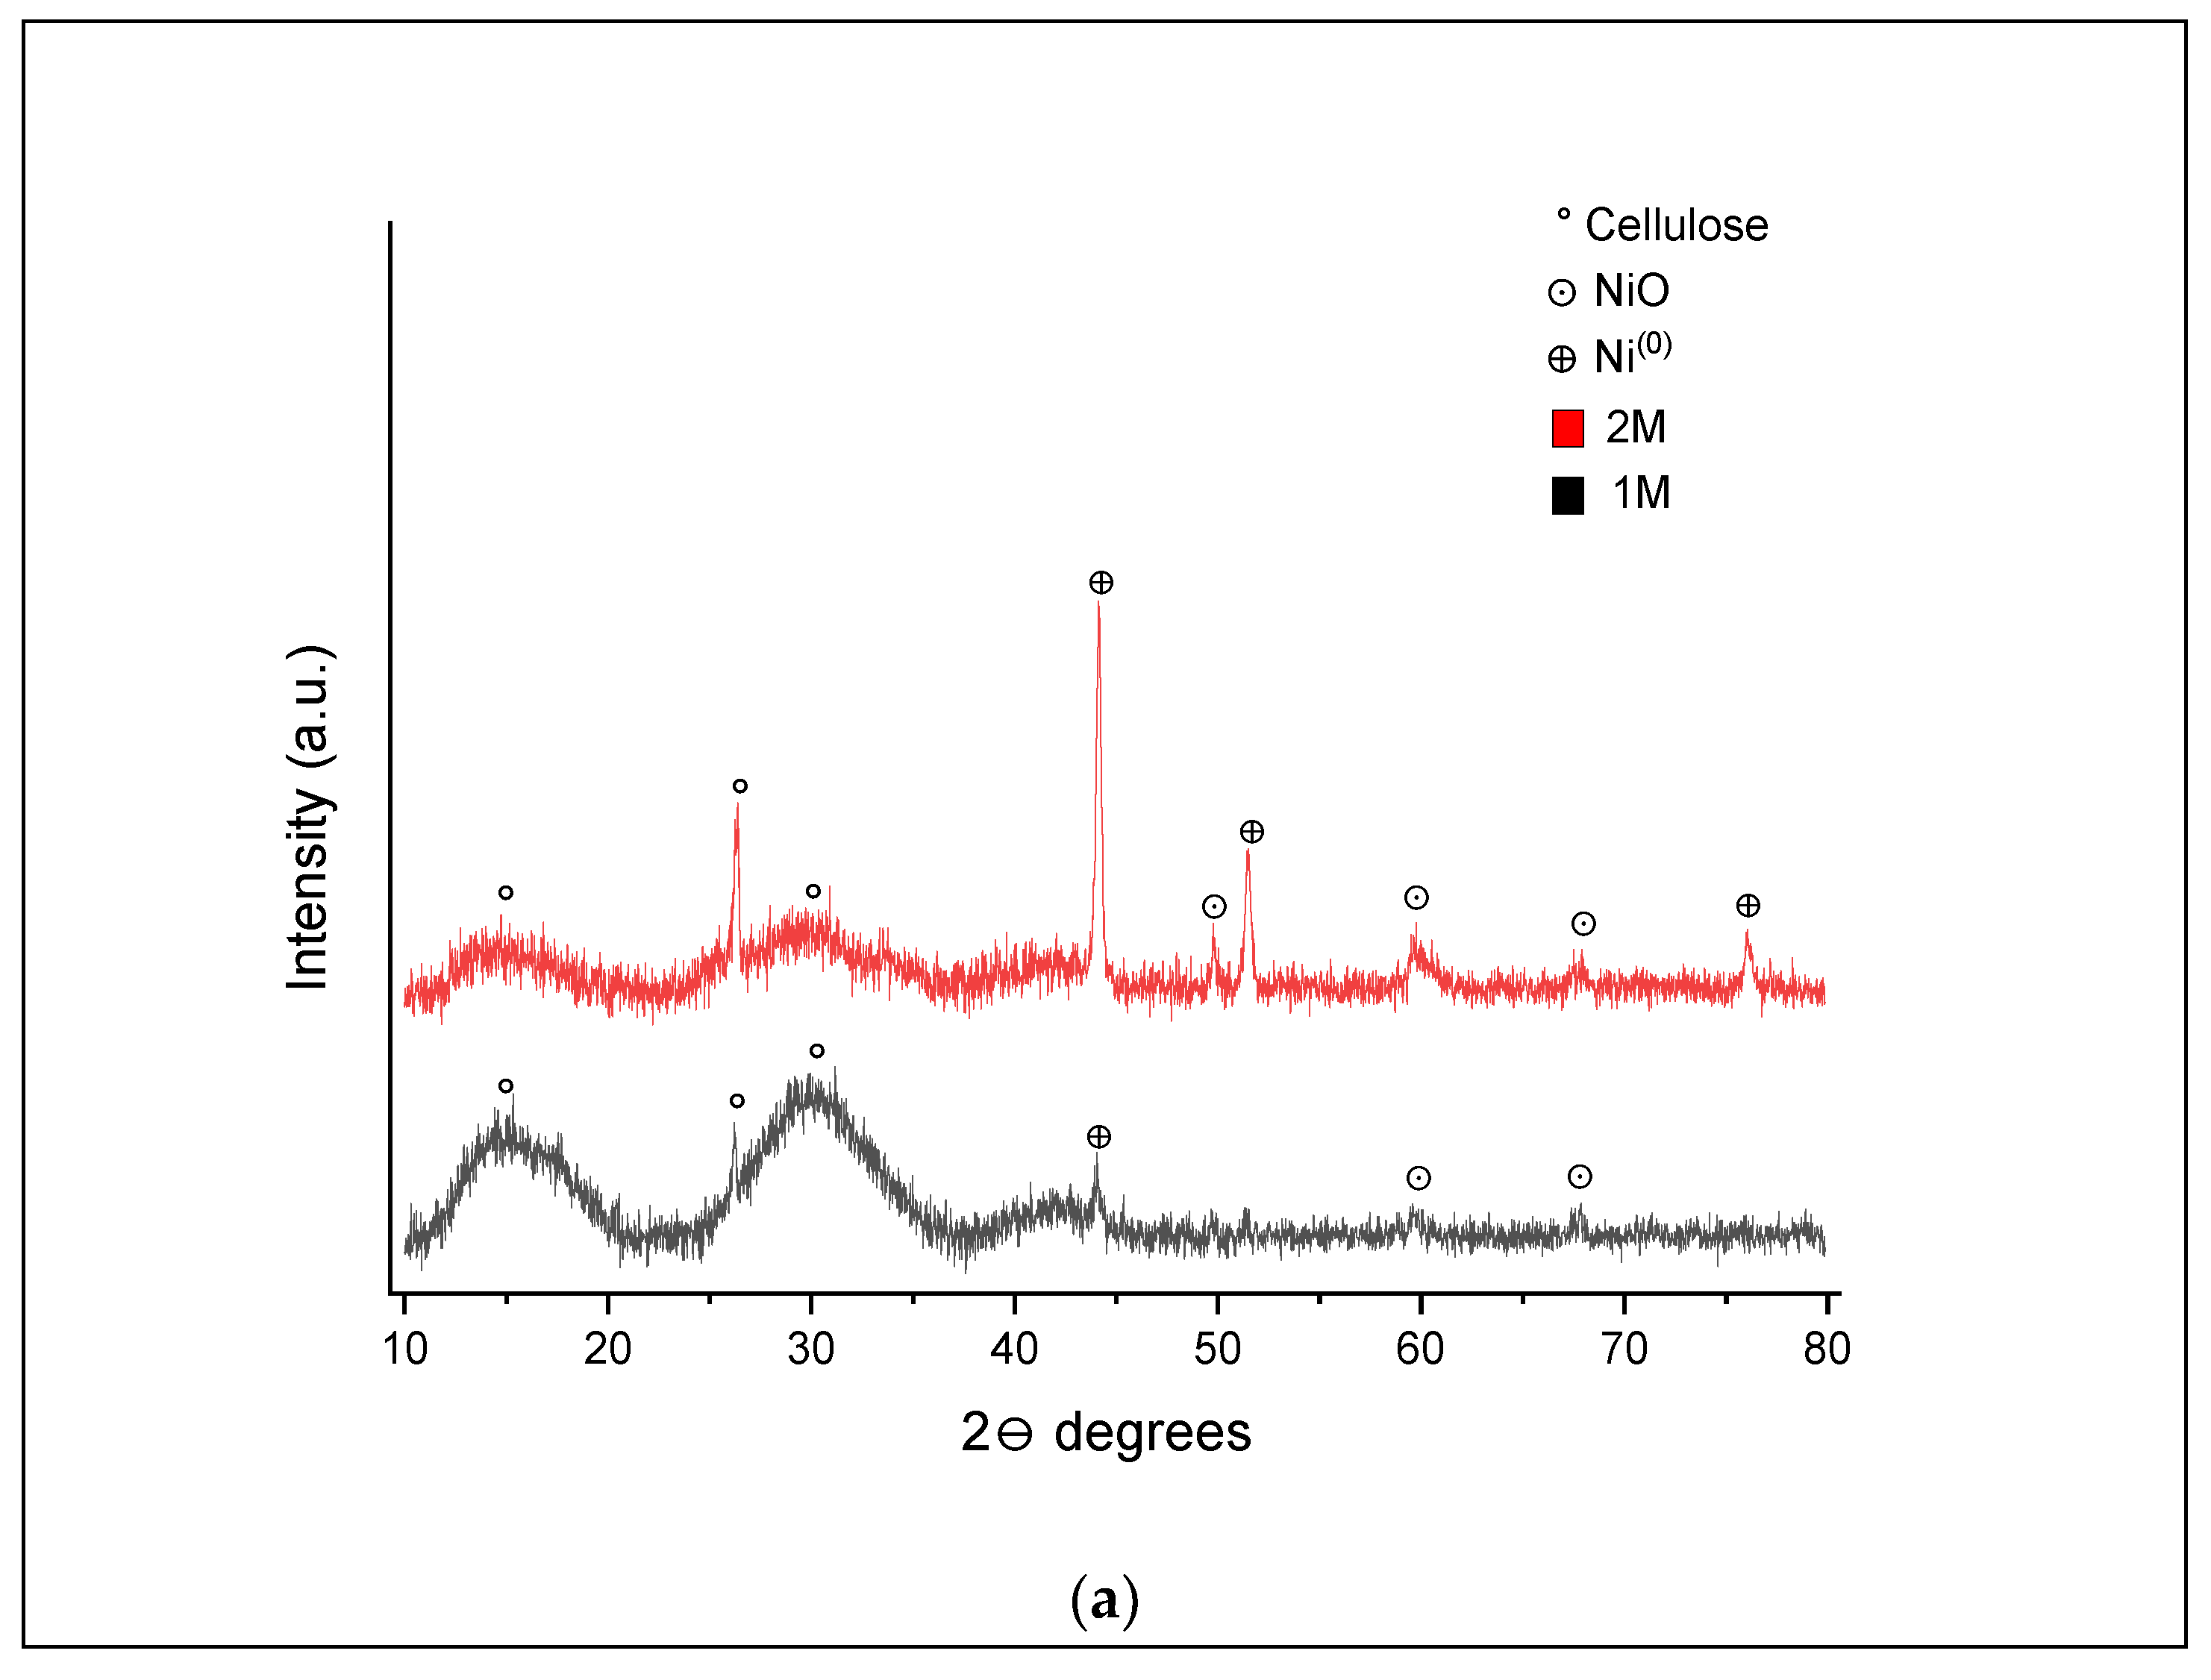
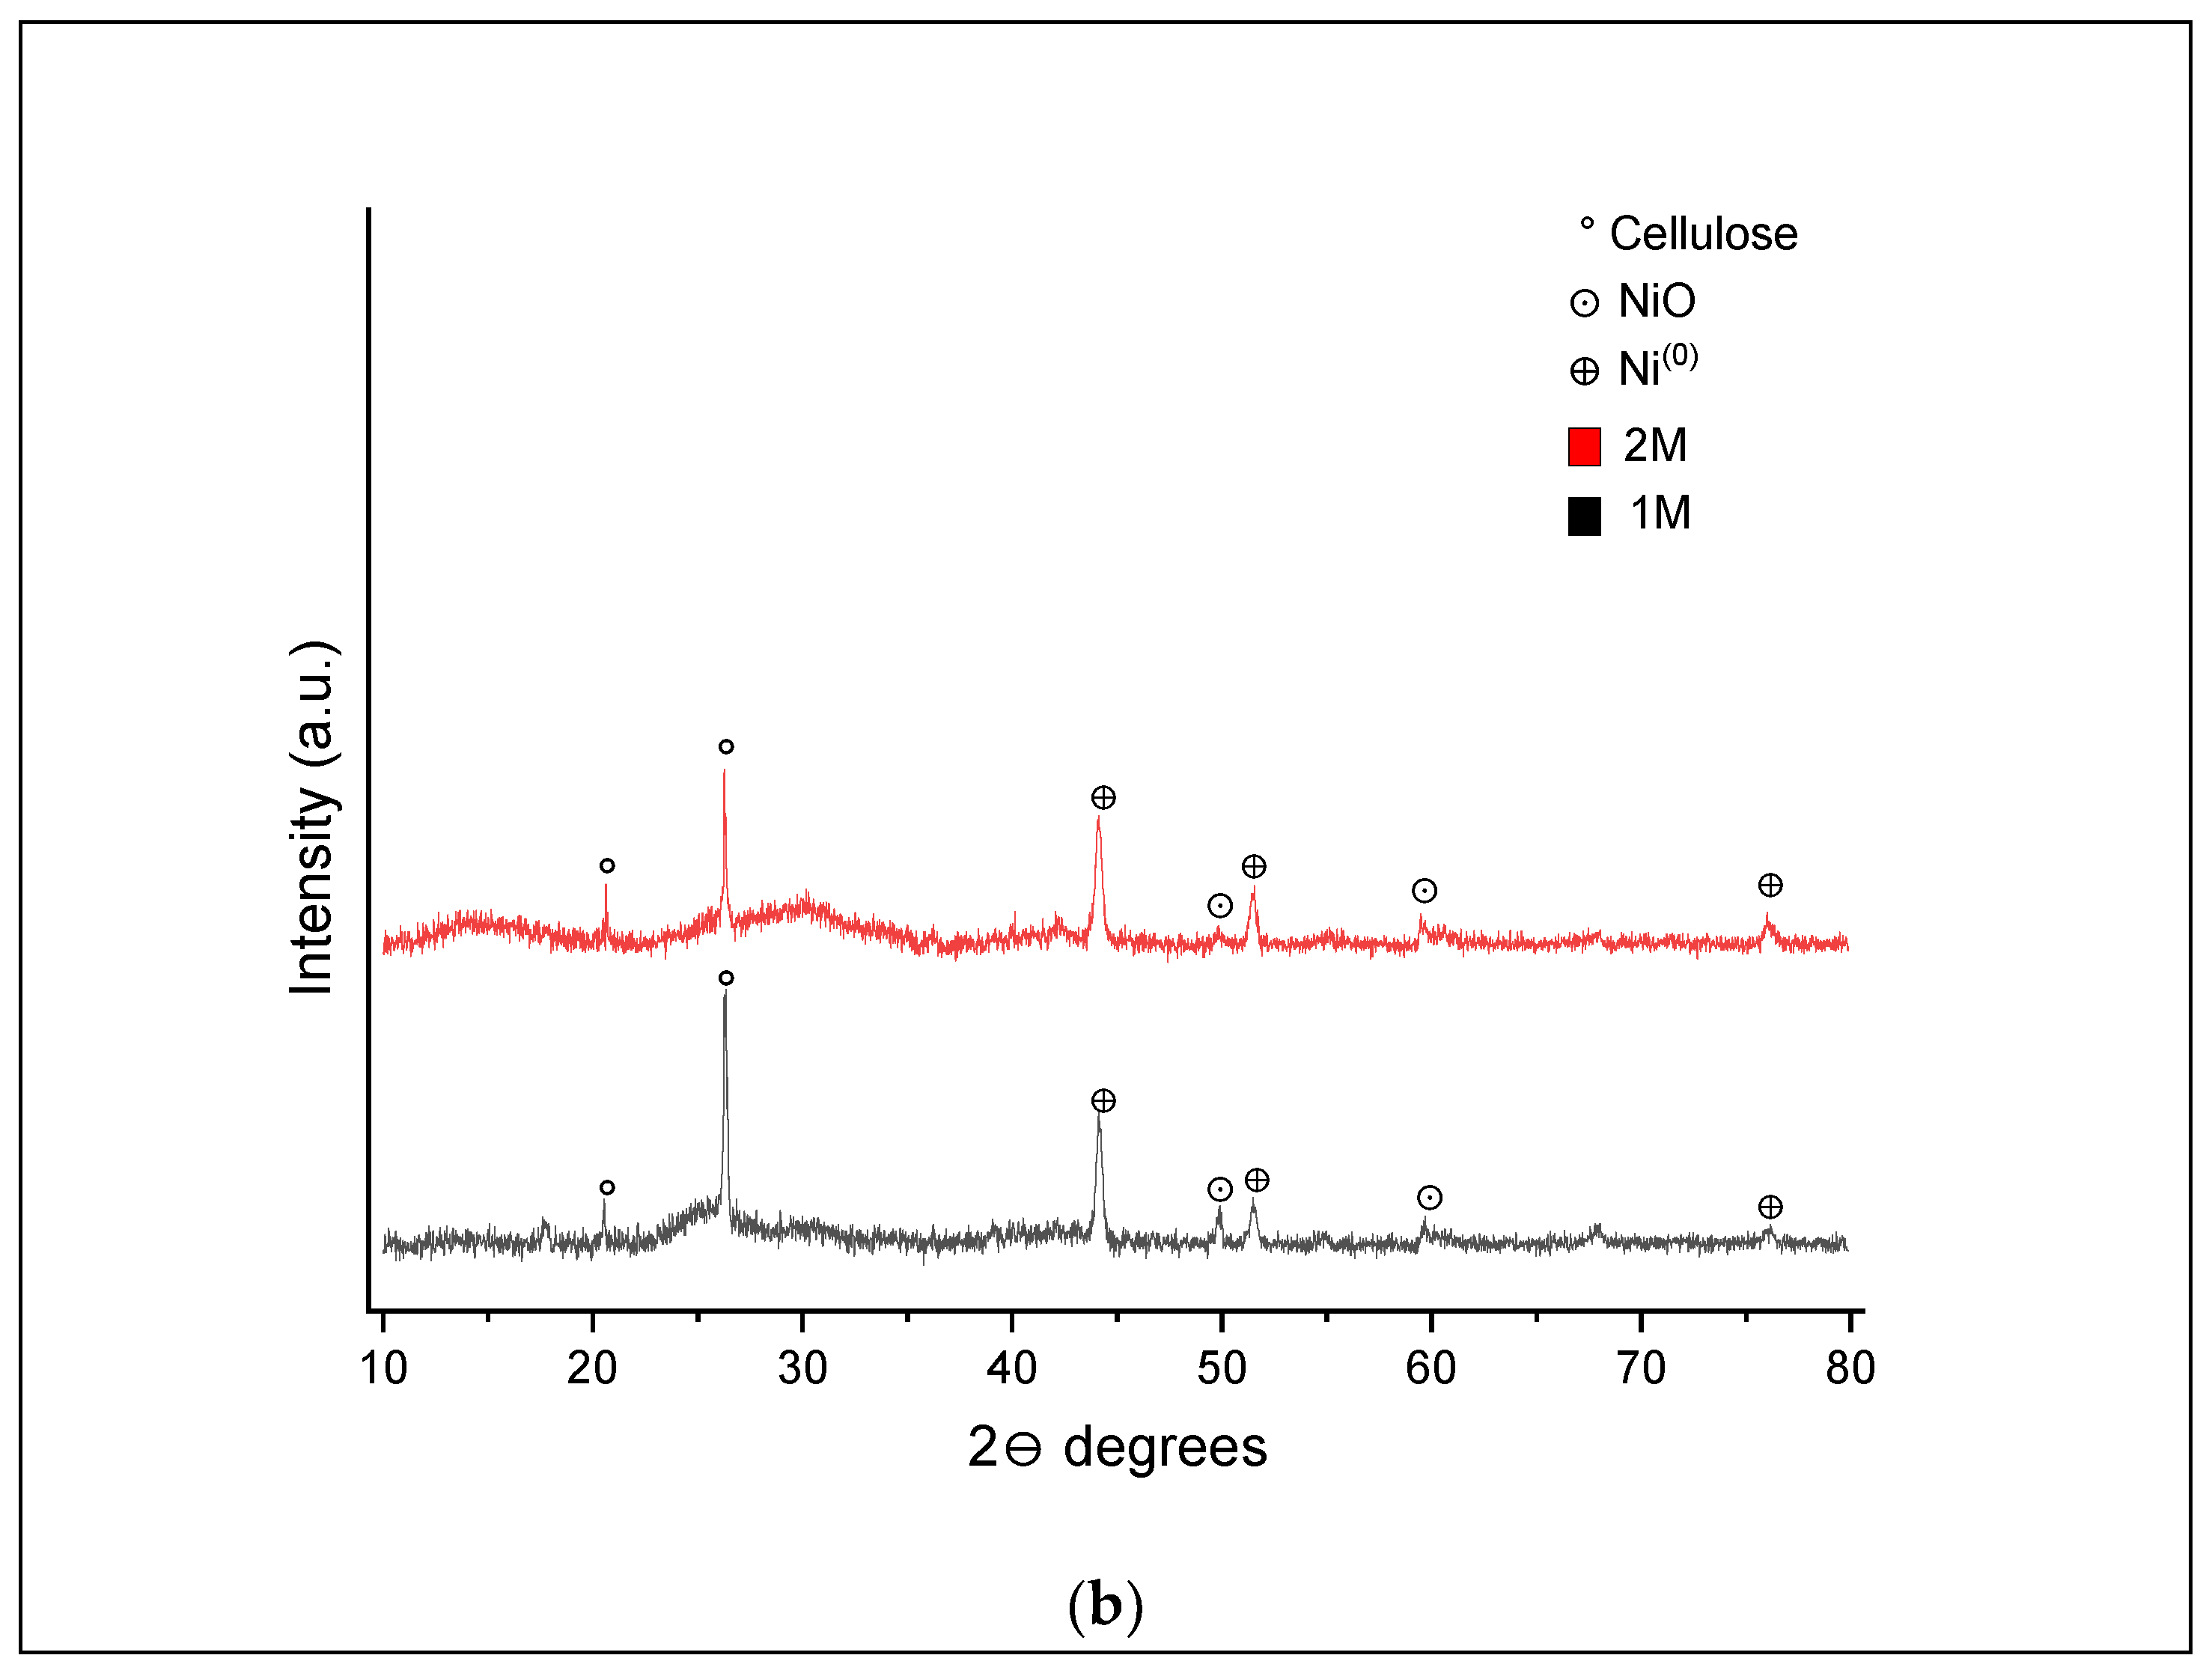
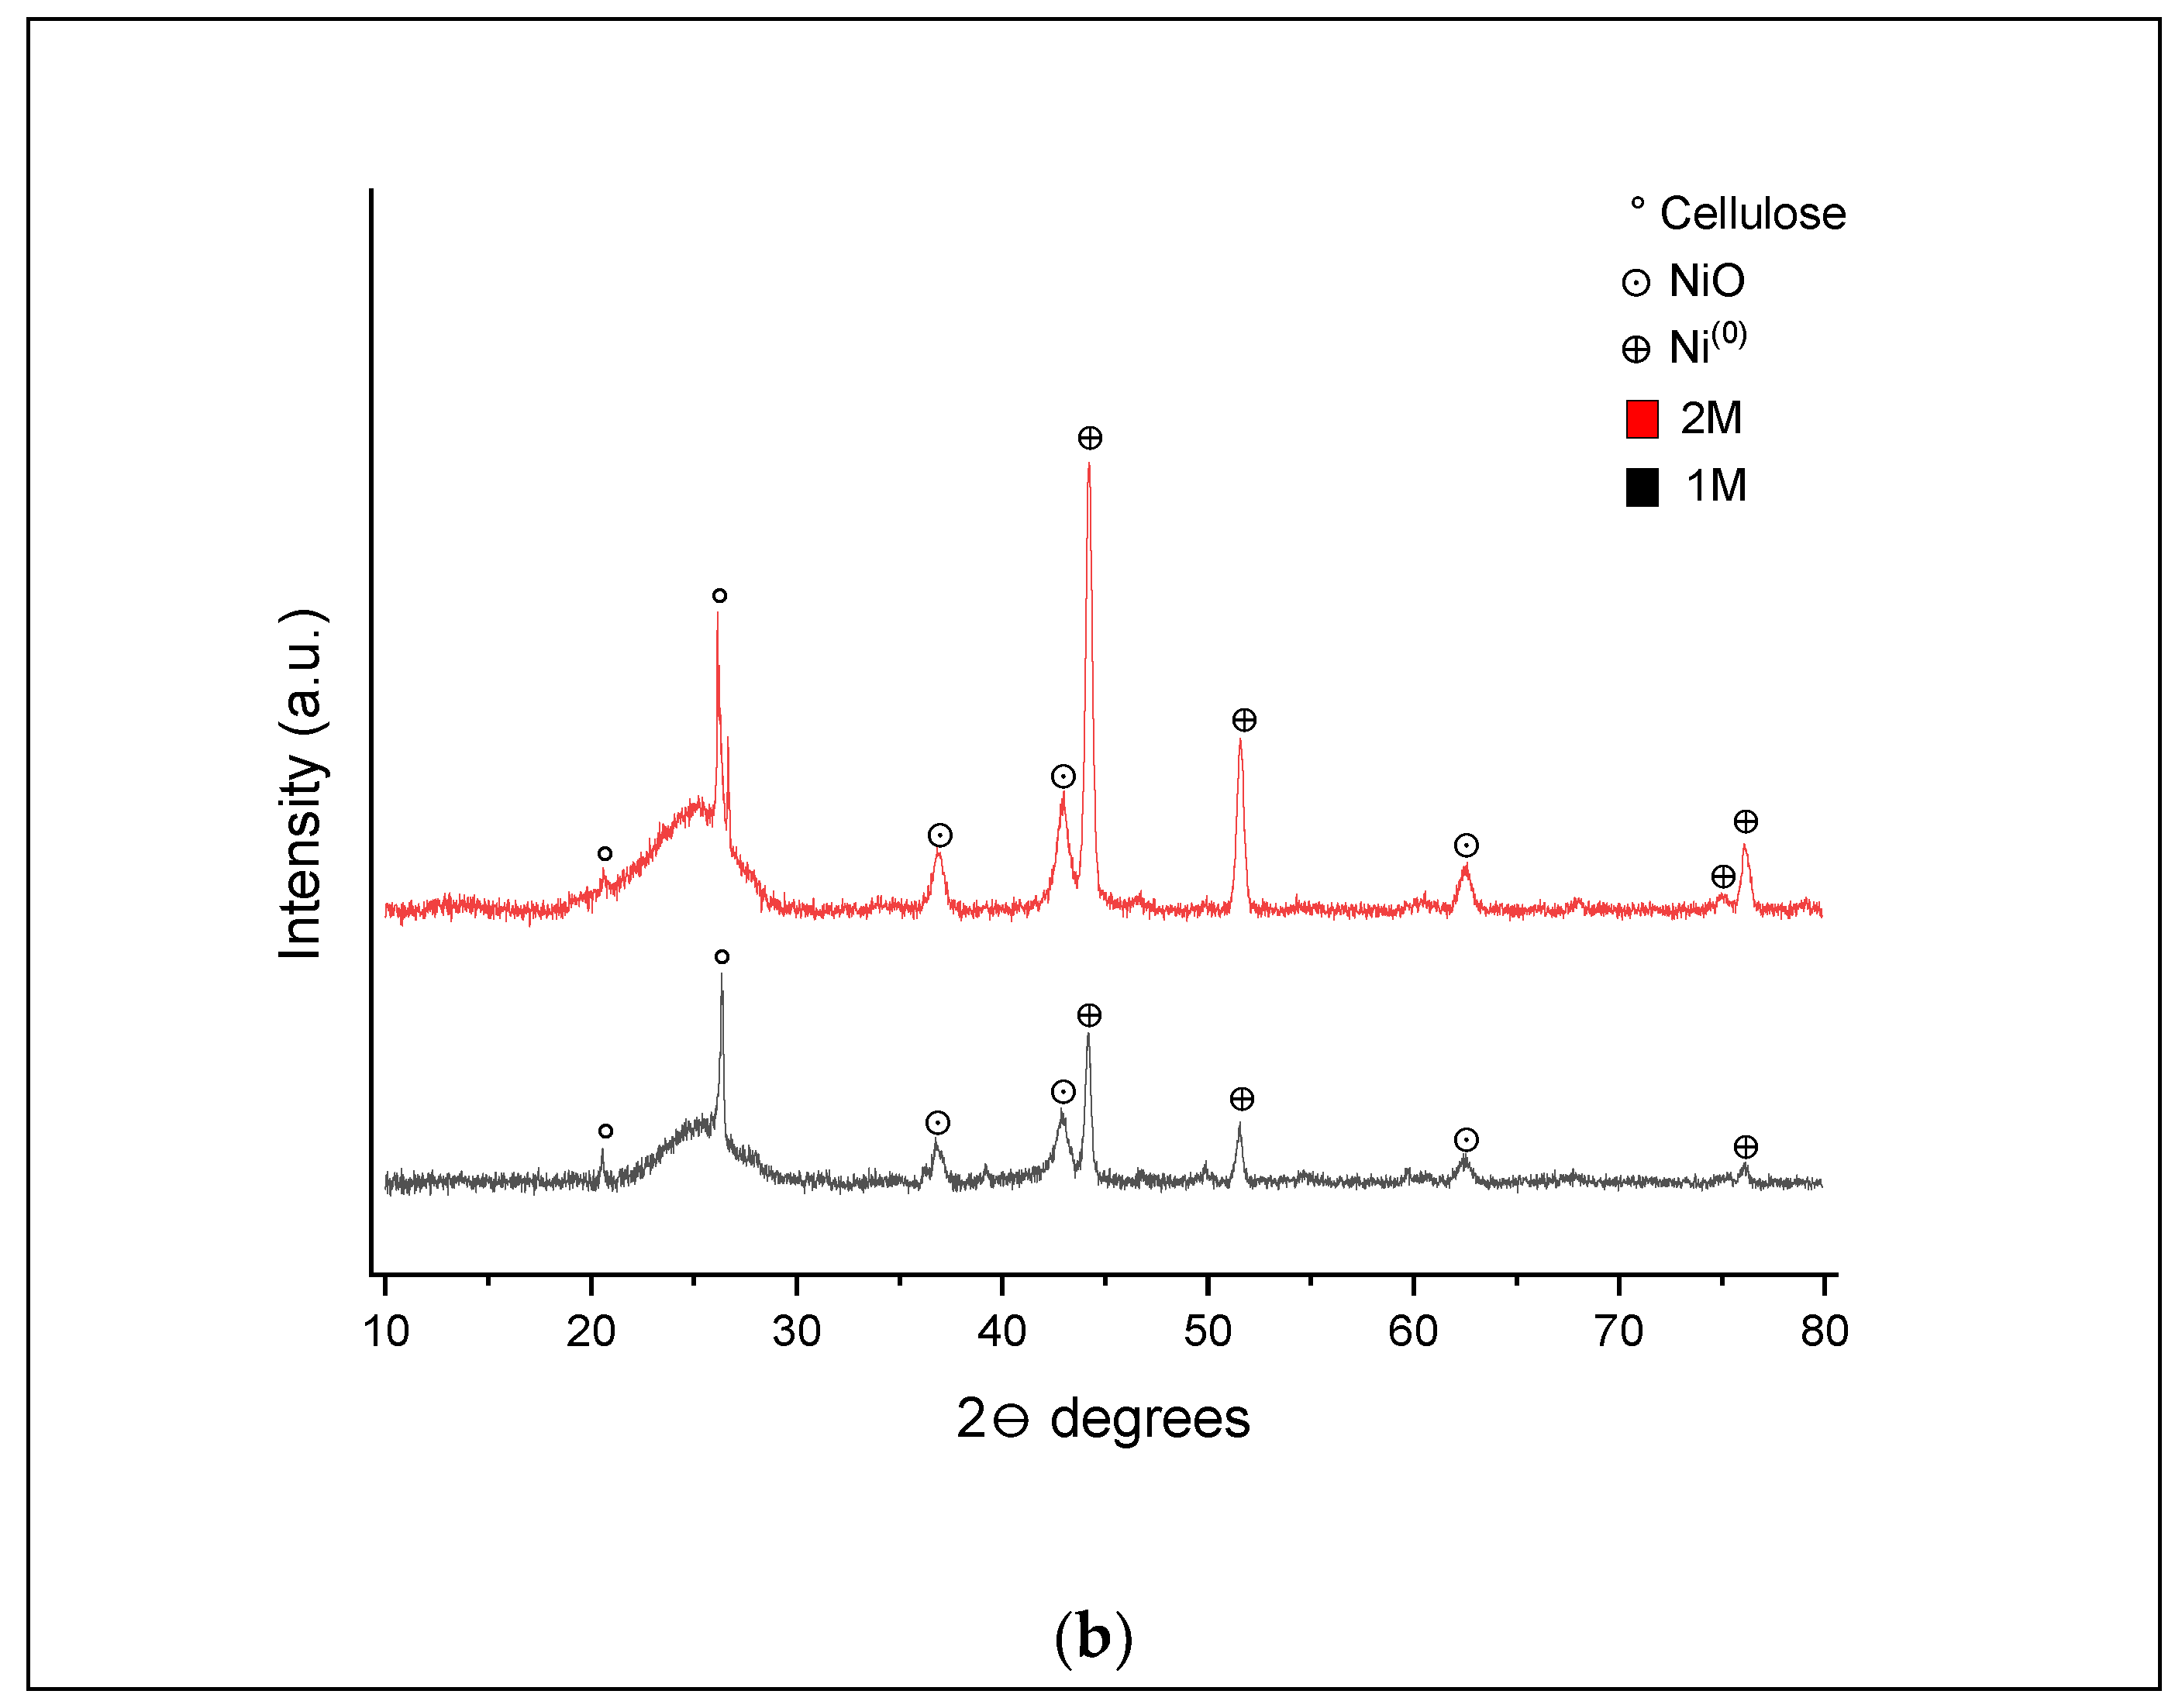
XRD analysis of the hydrochar samples obtained from SCWG of 1 and 2 M impregnated samples at 400 and 500 °C was also conducted, and the patterns are shown in Figure 9 and Figure 10, respectively.
In the XRD pattern shown in Figure 9a, three peaks are highlighted, which relate to some cellulose residue (15.3°, 26.2° and 30.0°) in both samples after SCWG [47]. In the 1 M impregnated sample, peaks were detected at 59.7°and 67.5°, indicating the occurrence of nickel nanoparticles in oxide form (NiO) and one peak at 44°, characterizing the presence of nickel nanoparticles in the Ni0 form. In the 2 M impregnated samples, three additional peaks were found at 49.7° (NiO), 51.5° and 76° (Ni0). From these results, it can be inferred that the transition of nickel from Nin+ to Ni0 and from Ni(OH)2 to NiO was intensified with increased nickel loading at the process conditions. Kumar and Reddy [24] described that hydroxides of nickel are initially dehydrated to NiO, which then interacts with char or the produced gases and is reduced to nanoactive forms (Ni0).
For the 400 °C and 60 min (Figure 9b) conditions, the absence of peaks at 15.3° and 30° is attributed to the loss of cellulose, and 67.5° to the presence of NiO for the 1 M and 2 M samples. Additional peaks at 49.8° (NiO), 51.5° and 76° (Ni0) in the XRD pattern were produced for the 1 M impregnated sample. It is possible to assume that increasing the residence time causes the degradation of cellulose and a further reduction from the NiO phase to the pure Ni0 form [23].
Many peaks can be seen for the XRD pattern presented in Figure 10a for hydrochars produced at 500 °C and 20 min, especially for the 2 M impregnated biomass sample. The additional peaks include the presence of nanoparticles for NiO (36.8°, 43° and 62.5°) and Ni0 (74.8°).
In comparison to the results for the 1 M impregnated sample in Figure 9a, the absence of peaks associated with cellulose (15.3°, 30.0°) and the presence of peaks for NiO (59.7°and 67.5°) was evident; however, additional peaks were seen at 51.5° and 76°, indicating the presence of Ni0. For the 2 M impregnated sample, additional peaks at 36.8°, 43°and 62.5° associated with NiO forms can be seen.
As shown in Figure 10b, the XRD pattern for both hydrochar samples at 500 °C and 60 min presented a similar profile to those for 20 min. Peaks at 20.5° and 26.3° were attributed to residual cellulose, while peaks at 36.8°, 43° and 62.5° were due to the presence of NiO and peaks at 44.2°, 51.6°, 75° and 76° characterized the Ni0 form. When compared to the XRD patterns in Figure 9b for hydrochar formed at 400 °C and 60 min, further peaks at 36.8, 43° and 62.5° were observed, indicating the presence of NiO, and a peak at 75° for Ni0.
These findings confirm that the higher the temperature, the higher the reduction from NiO to Ni0 forms. It can also be inferred that increasing nickel loading enhanced the transition of nickel stages. It has been reported that the conversion of nickel forms to Ni0 nanocrystallites is desirable in the SCWG process since it is a catalytic active phase for in situ H2 production, promoting the additional degradation of biomass, leading to the high tar and char conversion into gas [23,26].

3.2.4. Liquid Analysis

The water-insoluble phase of the liquid effluent produced from SCWG of control and impregnated samples (1 M and 2 M) at 25 wt% feed loading, 400 and 500 °C and 20 and 60 min residence times was collected and analysed to determine the main components using GC-MS analysis. The results are presented in Table 9, Table 10 and Table 11. The percentages associated with each constituent were determined by dividing its specific chromatographic peak area by the total peak area of all identified components [52]. The compounds were identified using computer matching and an NIST (National Institute of Standards and Technology) spectral library.
Onwudili and Williams [53] categorized oil components into aliphatic, alkylbenzenes, phenols and polycyclic aromatic hydrocarbons (PAHs). According to the results presented, the primary products identified in the liquid output from the SCWG of the samples can be classified into ketones, phenol, alcohols, organic acids, furans, aldehydes, aromatics and other compounds (a relative area of <1% of the total integrated area [38]).
As shown in Table 9, phenolic compounds were largely seen at high temperatures and residence times. According to the literature, the dealkylation and hydrolysis of lignin molecules promote the cleavage of C–C bonds, facilitating the production of phenol and its derivatives in the hydrothermal process. Additionally, the existence of inorganic species in the biomass, such as alkali and alkaline earth elements, enhances the formation of phenolic compounds to a greater extent [54].
The presence of furan derivative compounds (benzofuran 2.3-dihydro-2-methyl) at 500 °C is likely a consequence of the degradation of C–C bonds in the cellulose and hemicellulose molecules [54]. It can also be seen that the total content of ketones decreased as the temperature and residence time increased. Yu et al. [55] reported a similar result and found that the decomposition of ketones in the liquid into gas contributes to increased CGE.
The presence of the nickel catalyst significantly altered the chemical composition of the liquid products. In comparison to the liquid composition presented in Table 9, the absence of furan derivative compounds (benzofuran,2,3,dihydro-2-methyl) is evident in Table 10, which is likely due to their conversion to compounds with lower molecular weight, such as 2-cyclopenten-1-one, 2.3-dimethyl in the presence of a nickel catalyst. Borges et al. [29] observed a similar finding.
It was also observed that N-heterocyclic compounds, specifically 3-aminoisoxazole and N-(2-furymethyl)methanesulfonamide, were present in a small amount (<3.0%) in the liquid product from the SCWG of 1 M impregnated sample at 400 °C. However, with increasing temperature, the formation of these compounds was not observed. According to Babaei et al. [54], a decrease in N-heterocyclic compound formation in the presence of a nickel catalyst is expected. The active catalyst induces the interaction of radicals with each other, formatting gaseous products and subsequently inhibiting the generation of N compounds.
Analysing the composition of the liquid product obtained from the SCWG of the 2 M impregnated sample (Table 11) shows the presence of 2-cyclopenten-1-one,2-methyl. According to Yu et al. [55], the presence of this compound can be derived from the partial hydrogenation of phenol. Zhang et al. [56] also explained that the hydrogenation of phenol is a crucial step in the SCWG pathways as it results in saturated compounds that can be more readily decomposed into gaseous compounds.
Similar to Zhang et al. [56], cyclohexanol,2,3-dimethyl, which is produced as a hydrogenated intermediate product from the catalytic SCWG of phenol, was also identified. The absence of these compounds at 500 °C indicates that catalyst action promoted their conversion.
Furfural, a principal product of carbohydrate decomposition, was found in the liquid product from the catalytic SCWG (Table 10 and Table 11). However, its content decreased significantly with the increase in nickel loading. Increased nickel loading favoured the conversion of carbohydrates through reactions like decarboxylation, hydroxylation, tautomerism and cyclization [57]. Moreover, the liquid produced by the 2 M impregnated sample at 500 °C and 60 min exhibited a discrete spectrum of substances, indicating that the majority of previously formed components were converted into gases due to the effective action of the nickel catalyst under these conditions.

4. Conclusions

Nickel was successfully impregnated into coconut shell with a loading of 5.6 wt%. The average crystal size of metal nanoparticles of 13.5 nm was calculated for a 2 M impregnated sample.
Generally, increasing nickel loading positively affects SCWG efficiencies and gas production. Decreases in liquid and solid yields occurred with the increment in nickel. Simultaneously, gas production was enhanced, affirming the nickel catalyst’s capability to break down complex intermediates into gaseous compounds. The higher nickel content also contributed to the promotion of the water–gas shift reaction, enhancing CO2 and H2 production. However, the formation of CO and CH4 compounds was not favoured due to the competition of CO for methanation and hydrogen production, as well as the high sensitivity of the methanation reaction to the higher nickel loading and nickel crystallite size. The highest CGE (56%) and HGE (133%) values were obtained for SCWG of the 2 M impregnated sample at 500 °C, 60 min and 25 wt% biomass loading and at 500 °C, 20 min and 25 wt% of biomass loading, respectively.
The effect of increasing nickel content on the solid and liquid product characteristics was also investigated. Nickel peaks were found in all hydrochar samples produced by the SCWG of impregnated samples, indicating the retention of the metal. The highest nickel loading (22.6 wt%) was detected in the hydrochar formed from the SCWG of 2 M impregnated sample at 500 °C and 60 min. The increase in nickel loading enhanced the transition of nickel phases to the Ni0 nanoparticles, contributing to H2 production and higher tar and char conversion into gas. The ability of the nickel catalysts to decompose lignin led to an increase in phenol and phenol-containing compounds in the liquid product analysis. High gas yield with increased nickel loading was also observed due to the ability of nickel to promote phenol hydrogenation reactions. Furthermore, a discrete spectrum of substances was produced at high nickel loading, temperature and residence time, confirming the action of the nickel catalyst in degrading the organic compounds.
These results will advance the knowledge and applicability of supercritical water gasification as a suitable biomass conversion method. Product yields and compositions are essential to further develop the understanding of this thermochemical conversion route by exploring the effects of other metallic nanoparticulate catalysts, different biomass sources and process conditions on SCWG efficiency.

Author Contributions

Conceptualisation, M.M.M., G.A.L., G.J., C.T.A., S.A.B.V.d.M. and E.A.T.; methodology, M.M.M., G.A.L., G.J., J.A.O. and C.T.A.; writing—original draft preparation, M.M.M., G.A.L., G.J., D.M.d.S. and A.L.F.d.S.; writing—review and editing, M.M.M., G.A.L., J.A.O., C.T.A., S.A.B.V.d.M., E.A.T., D.M.d.S. and F.A.T.; supervision, G.A.L., G.J., J.A.O., C.T.A., E.A.T. and S.A.B.V.d.M. All authors have read and agreed to the published version of the manuscript.

Funding

This study was partly financially supported by Coordenação de Aperfeiçoamento de Pessoal de Nível Superior, Finance Code 001 (CAPES, Brazil) and Fundação de Amparo à Pesquisa do Estado da Bahia (FAPESB, Brazil), INCITERE Project, PIE008/22. The Aston University-Brazil Collaboration was supported by Research England Additional QR and RCIF Allocations 2022-23.

Data Availability Statement

The authors confirm that the data supporting the findings of this study are available within the article.

Acknowledgments

We gratefully acknowledge the School of Chemical Engineering at the University of Birmingham and the Energy and Bioproducts Research Institute (EBRI) at Aston University for assistance with experiments. The authors would like to show great gratitude to the CAPES (Coordenação de Aperfeiçoamento de Pessoal de Nível Superior), FAPESB (Fundação de Amparo à Pesquisa do Estado da Bahia), Supercritical Fluids, Fuel Cell and Hydrogen Research laboratories at the University of Birmingham, as well as their colleagues who provided the opportunity to finish the project.

Conflicts of Interest

The authors declare no conflicts of interest. The funders had no role in the design of the study; in the collection, analyses, or interpretation of data; in the writing of the manuscript; or in the decision to publish the results.

Nomenclature

Acronyms
MMolar Concentration
SCWGSupercritical Water Gasification
CGECarbon Gasification Efficiency
HGEHydrogen Gasification Efficiency
GEGasification Efficiency
PAHPolycyclic Aromatic Hydrocarbons
TGThermogravimetric
DTGDerivate Thermogravimetry
DTADifferential Thermogravimetric Analysis
SEM-EDXScanning Electron Microscopy–Energy Dispersive X-ray Spectroscopy
XRDX-ray Diffraction
TCDThermal Conductivity
GCGas Chromatograph
GC-MSGas Chromatography-Mass Spectrometry
NISTNational Institute of Standards and Technology

References

  1. IRENA. World Energy Transitions Outlook 2022: 1.5 °C Pathway; International Renewable Energy Agency: Abu Dhabi, United Arab Emirates, 2022. [Google Scholar]
  2. Saleem, M. Possibility of utilizing agriculture biomass as a renewable and sustainable future energy source. Heliyon 2022, 8, e08905. [Google Scholar] [CrossRef]
  3. Sidra, I. Sistema IBGE de Recuperação Automática. Available online: https://sidra.ibge.gov.br/home/pms/brasil (accessed on 10 March 2021).
  4. Azeta, O.; Ayeni, A.O.; Agboola, O.; Elehinafe, F.B. A review on the sustainable energy generation from the pyrolysis of coconut biomass. Sci. Afr. 2021, 13, e00909. [Google Scholar] [CrossRef]
  5. Ahmad, R.K.; Sulaiman, S.A.; Yusup, S.; Dol, S.S.; Inayat, M.; Umar, H.A. Exploring the potential of coconut shell biomass for charcoal production. Ain Shams Eng. J. 2021, 13, 101499. [Google Scholar] [CrossRef]
  6. Castilla-Caballero, D.; Barraza-Burgos, J.; Gunasekaran, S.; Roa-Espinosa, A.; Colina-Márquez, J.; Machuca-Martínez, F.; Hernández-Ramírez, A.; Vázquez-Rodríguez, S. Experimental data on the production and characterization of biochars derived from coconut-shell wastes obtained from the Colombian Pacific Coast at low temperature pyrolysis. Data Brief 2020, 28, 104855. [Google Scholar] [CrossRef] [PubMed]
  7. Sarkar, J.K.; Wang, Q. Different pyrolysis process conditions of South Asian waste coconut shell and characterization of gas, bio-char, and bio-oil. Energies 2020, 13, 1970. [Google Scholar] [CrossRef]
  8. Inayat, M.; Sulaiman, S.A.; Kurnia, J.C. Catalytic co-gasification of coconut shells and oil palm fronds blends in the presence of cement, dolomite, and limestone: Parametric optimization via Box Behnken Design. J. Energy Inst. 2019, 92, 871–882. [Google Scholar] [CrossRef]
  9. Menon, S.D.; Sampath, K.; Kaarthik, S.S. Feasibility studies of coconut shells biomass for downdraft gasification. Mater. Today Proc. 2021, 44, 3133–3137. [Google Scholar] [CrossRef]
  10. Yahaya, A.Z.; Somalu, M.R.; Muchtar, A.; Sulaiman, S.A.; Daud, W.R.W. Effect of particle size and temperature on gasification performance of coconut and palm kernel shells in downdraft fixed-bed reactor. Energy 2019, 175, 931–940. [Google Scholar] [CrossRef]
  11. Akolgo, G.A.; Awafo, E.A.; Essandoh, E.O.; Owusu, P.A.; Uba, F.; Adu-Poku, K.A. Assessment of the potential of charred briquettes of sawdust, rice and coconut husks: Using water boiling and user acceptability tests. Sci. Afr. 2021, 12, e00789. [Google Scholar] [CrossRef]
  12. Simanjuntak, J.; Daryanto, E.; Tambunan, B.; Eswanto, E. Technical Parameters Study of Coconut Shell Combustion as Heat Source by Using Fixed-bed Type Incinerator. In Proceedings of the 4th International Conference on Innovation in Education, Science and Culture, ICIESC 2022, Medan, Indonesia, 11 October 2022. [Google Scholar]
  13. Marcelino, M.M.; Leeke, G.A.; Jiang, G.; Onwudili, J.A.; Alves, C.T.; Santana, D.M.d.; Torres, F.A.; Torres, E.A.; Vieira de Melo, S.A. Supercritical Water Gasification of Coconut Shell Impregnated with a Nickel Nanocatalyst: Box–Behnken Design and Process Evaluation. Energies 2023, 16, 3563. [Google Scholar] [CrossRef]
  14. Muharja, M.; Junianti, F.; Ranggina, D.; Nurtono, T.; Widjaja, A. An integrated green process: Subcritical water, enzymatic hydrolysis, and fermentation, for biohydrogen production from coconut husk. Bioresour. Technol. 2018, 249, 268–275. [Google Scholar] [CrossRef]
  15. Nanda, S.; Isen, J.; Dalai, A.K.; Kozinski, J.A. Gasification of fruit wastes and agro-food residues in supercritical water. Energy Convers. Manag. 2016, 110, 296–306. [Google Scholar] [CrossRef]
  16. Hu, Y.; Gong, M.; Xing, X.; Wang, H.; Zeng, Y.; Xu, C.C. Supercritical water gasification of biomass model compounds: A review. Renew. Sustain. Energy Rev. 2020, 118, 109529. [Google Scholar] [CrossRef]
  17. Wang, C.; Jin, H. Development of a Partitioning Kinetic Model of Biomass Gasification in Supercritical Water with a Fluidized Bed Reactor. Ind. Eng. Chem. Res. 2022, 61, 10058–10068. [Google Scholar] [CrossRef]
  18. Wang, C.; Li, L.; Shi, J.; Jin, H. Biochar production by coconut shell gasification in supercritical water and evolution of its porous structure. J. Anal. Appl. Pyrolysis 2021, 156, 105151. [Google Scholar] [CrossRef]
  19. Lee, C.S.; Conradie, A.V.; Lester, E. Review of supercritical water gasification with lignocellulosic real biomass as the feedstocks: Process parameters, biomass composition, catalyst development, reactor design and its challenges. Chem. Eng. J. 2021, 415, 128837. [Google Scholar] [CrossRef]
  20. Gong, M.; Zhu, W.; Zhang, H.; Ma, Q.; Su, Y.; Fan, Y. Influence of NaOH and Ni catalysts on hydrogen production from the supercritical water gasification of dewatered sewage sludge. Int. J. Hydrogen Energy 2014, 39, 19947–19954. [Google Scholar] [CrossRef]
  21. Kang, K. Hydrogen Production from Supercritical Water Gasification of Lignin, Cellulose, and Other Biomass Residues. Ph.D. Thesis, University of Saskatchewan, Saskatoon, SK, Canada, 2016. [Google Scholar]
  22. Lu, Y.; Jin, H.; Zhang, R. Evaluation of stability and catalytic activity of Ni catalysts for hydrogen production by biomass gasification in supercritical water. Carbon Resour. Convers. 2019, 2, 95–101. [Google Scholar] [CrossRef]
  23. Kumar, A.; Reddy, S.N. In situ sub-and supercritical water gasification of nano-nickel (Ni2+) impregnated biomass for H2 production. Ind. Eng. Chem. Res. 2019, 58, 4780–4793. [Google Scholar] [CrossRef]
  24. Kumar, A.; Reddy, S.N. Subcritical and supercritical water in-situ gasification of metal (Ni/Ru/Fe) impregnated banana pseudo-stem for hydrogen rich fuel gas mixture. Int. J. Hydrogen Energy 2020, 45, 18348–18362. [Google Scholar] [CrossRef]
  25. Azadi, P.; Farnood, R. Review of heterogeneous catalysts for sub-and supercritical water gasification of biomass and wastes. Int. J. Hydrogen Energy 2011, 36, 9529–9541. [Google Scholar] [CrossRef]
  26. Richardson, Y.; Blin, J.; Volle, G.; Motuzas, J.; Julbe, A. In situ generation of Ni metal nanoparticles as catalyst for H2-rich syngas production from biomass gasification. Appl. Catal. A Gen. 2010, 382, 220–230. [Google Scholar] [CrossRef]
  27. Nanda, S.; Reddy, S.N.; Dalai, A.K.; Kozinski, J.A. Subcritical and supercritical water gasification of lignocellulosic biomass impregnated with nickel nanocatalyst for hydrogen production. Int. J. Hydrogen Energy 2016, 41, 4907–4921. [Google Scholar] [CrossRef]
  28. Bezerra, M.A.; Santelli, R.E.; Oliveira, E.P.; Villar, L.S.; Escaleira, L.A. Response surface methodology (RSM) as a tool for optimization in analytical chemistry. Talanta 2008, 76, 965–977. [Google Scholar] [CrossRef]
  29. Borges, A.; Onwudili, J.; Andrade, H.; Alves, C.; Ingram, A.; De Melo, S.V.; Torres, E. Catalytic supercritical water gasification of eucalyptus wood chips in a batch reactor. Fuel 2019, 255, 115804. [Google Scholar] [CrossRef]
  30. Cao, W.; Guo, L.; Yan, X.; Zhang, D.; Yao, X. Assessment of sugarcane bagasse gasification in supercritical water for hydrogen production. Int. J. Hydrogen Energy 2018, 43, 13711–13719. [Google Scholar] [CrossRef]
  31. Louw, J. Supercritical Water Gasification of Wood-Related Products: A Thermodynamic and Experimental Study. Ph.D. Thesis, Stellenbosch University, Stellenbosch, South Africa, 2016. [Google Scholar]
  32. Said, M.; Cassayre, L.; Dirion, J.-L.; Joulia, X.; Nzihou, A. Effect of nickel impregnation on wood gasification mechanism. Waste Biomass Valorization 2017, 8, 2843–2852. [Google Scholar] [CrossRef]
  33. Singha, R.K.; Yadav, A.; Agrawal, A.; Shukla, A.; Adak, S.; Sasaki, T.; Bal, R. Synthesis of highly coke resistant Ni nanoparticles supported MgO/ZnO catalyst for reforming of methane with carbon dioxide. Appl. Catal. B Environ. 2016, 191, 165–178. [Google Scholar] [CrossRef]
  34. Devi, T.G.; Kannan, M. X-ray diffraction (XRD) studies on the chemical states of some metal species in cellulosic chars and the Ellingham diagrams. Energy Fuels 2007, 21, 596–601. [Google Scholar] [CrossRef]
  35. Koltypin, Y.; Fernandez, A.; Rojas, T.C.; Campora, J.; Palma, P.; Prozorov, R.; Gedanken, A. Encapsulation of nickel nanoparticles in carbon obtained by the sonochemical decomposition of Ni(C8H12)2. Chem. Mater. 1999, 11, 1331–1335. [Google Scholar] [CrossRef]
  36. Saleh, T.A. Polymer Hybrid Materials and Nanocomposites: Fundamentals and Applications; William Andrew: Norwich, NY, USA, 2021. [Google Scholar]
  37. Nanda, S.; Reddy, S.N.; Vo, D.V.N.; Sahoo, B.N.; Kozinski, J.A. Catalytic gasification of wheat straw in hot compressed (subcritical and supercritical) water for hydrogen production. Energy Sci. Eng. 2018, 6, 448–459. [Google Scholar] [CrossRef]
  38. Okolie, J.A. Supercritical Water Gasification of Lignocellulosic Biomass Materials for Hydrogen Production. Ph.D. Thesis, University of Saskatchewan, Saskatoon, SK, Canada, 2021. [Google Scholar]
  39. Orooji, Y.; Ghanbari, M.; Amiri, O.; Salavati-Niasari, M. Facile fabrication of silver iodide/graphitic carbon nitride nanocomposites by notable photo-catalytic performance through sunlight and antimicrobial activity. J. Hazard. Mater. 2020, 389, 122079. [Google Scholar] [CrossRef] [PubMed]
  40. Wang, C.; Jin, H.; Feng, H.; Wei, W.; Cao, C.; Cao, W. Study on gasification mechanism of biomass waste in supercritical water based on product distribution. Int. J. Hydrogen Energy 2020, 45, 28051–28061. [Google Scholar] [CrossRef]
  41. Azadi, P.; Afif, E.; Azadi, F.; Farnood, R. Screening of nickel catalysts for selective hydrogen production using supercritical water gasification of glucose. Green Chem. 2012, 14, 1766–1777. [Google Scholar] [CrossRef]
  42. Yildirir, E.; Ballice, L. Supercritical water gasification of wet sludge from biological treatment of textile and leather industrial wastewater. J. Supercrit. Fluids 2019, 146, 100–106. [Google Scholar] [CrossRef]
  43. Su, H.; Kanchanatip, E.; Wang, D.; Zhang, H.; Mubeen, I.; Huang, Z.; Yan, M. Catalytic gasification of food waste in supercritical water over La promoted Ni/Al2O3 catalysts for enhancing H2 production. Int. J. Hydrogen Energy 2020, 45, 553–564. [Google Scholar] [CrossRef]
  44. Amrullah, A.; Matsumura, Y. Supercritical water gasification of sewage sludge in continuous reactor. Bioresour. Technol. 2018, 249, 276–283. [Google Scholar] [CrossRef]
  45. Basu, P. Biomass Gasification and Pyrolysis: Practical Design and Theory; Academic Press: Cambridge, MA, USA, 2010. [Google Scholar]
  46. Demirel, E.; Erkey, C.; Ayas, N. Supercritical water gasification of fruit pulp for hydrogen production: Effect of reaction parameters. J. Supercrit. Fluids 2021, 177, 105329. [Google Scholar] [CrossRef]
  47. Nanda, S.; Gong, M.; Hunter, H.N.; Dalai, A.K.; Gökalp, I.; Kozinski, J.A. An assessment of pinecone gasification in subcritical, near-critical and supercritical water. Fuel Process. Technol. 2017, 168, 84–96. [Google Scholar] [CrossRef]
  48. Samiee-Zafarghandi, R.; Karimi-Sabet, J.; Abdoli, M.A.; Karbassi, A. Supercritical water gasification of microalga Chlorella PTCC 6010 for hydrogen production: Box-Behnken optimization and evaluating catalytic effect of MnO2/SiO2 and NiO/SiO2. Renew. Energy 2018, 126, 189–201. [Google Scholar] [CrossRef]
  49. Chen, J.; Fan, Y.; Zhao, X.; Jiaqiang, E.; Xu, W.; Zhang, F.; Liao, G.; Leng, E.; Liu, S. Experimental investigation on gasification characteristic of food waste using supercritical water for combustible gas production: Exploring the way to complete gasification. Fuel 2020, 263, 116735. [Google Scholar] [CrossRef]
  50. Pairojpiriyakul, T.; Croiset, E.; Kiatkittipong, K.; Kiatkittipong, W.; Arpornwichanop, A.; Assabumrungrat, S. Catalytic reforming of glycerol in supercritical water with nickel-based catalysts. Int. J. Hydrogen Energy 2014, 39, 14739–14750. [Google Scholar] [CrossRef]
  51. Nanda, S.; Reddy, S.N.; Hunter, H.N.; Vo, D.-V.N.; Kozinski, J.A.; Gökalp, I. Catalytic subcritical and supercritical water gasification as a resource recovery approach from waste tires for hydrogen-rich syngas production. J. Supercrit. Fluids 2019, 154, 104627. [Google Scholar] [CrossRef]
  52. Sun, M.; Ma, X.-X.; Yao, Q.-X.; Wang, R.-C.; Ma, Y.-X.; Feng, G.; Shang, J.-X.; Xu, L.; Yang, Y.-H. GC-MS and TG-FTIR study of petroleum ether extract and residue from low temperature coal tar. Energy Fuels 2011, 25, 1140–1145. [Google Scholar] [CrossRef]
  53. Onwudili, J.A.; Williams, P.T. Catalytic conversion of bio-oil in supercritical water: Influence of RuO2/γ-Al2O3 catalysts on gasification efficiencies and bio-methane production. Appl. Catal. B Environ. 2016, 180, 559–568. [Google Scholar] [CrossRef]
  54. Babaei, K.; Bozorg, A.; Tavasoli, A. Hydrogen-rich gas production through supercritical water gasification of chicken manure over activated carbon/ceria-based nickel catalysts. J. Anal. Appl. Pyrolysis 2021, 159, 105318. [Google Scholar] [CrossRef]
  55. Yu, J.; Chen, Q.; Guan, Q.; Li, B.; Ning, P.; Gu, J.; Lu, X. Characterization of the liquid intermediates from gasification of lignite in supercritical water: Insights into the gasification process for hydrogen production. Int. J. Hydrogen Energy 2016, 41, 17309–17322. [Google Scholar] [CrossRef]
  56. Zhang, J.; Dasgupta, A.; Chen, Z.; Xu, D.; Savage, P.E.; Guo, Y. Supercritical water gasification of phenol over Ni-Ru bimetallic catalysts. Water Res. 2019, 152, 12–20. [Google Scholar] [CrossRef]
  57. Gökkaya, D.S.; Sert, M.; Sağlam, M.; Yüksel, M.; Ballice, L. Hydrothermal gasification of the isolated hemicellulose and sawdust of the white poplar (Populus alba L.). J. Supercrit. Fluids 2020, 162, 104846. [Google Scholar] [CrossRef]
Figure 1. (a) Illustration of the SCWG process and (b) product collection [13].
Energies 17 00872 g001
Figure 2. TGA (a), DTG (b) and DTA (c) of control [13], 1 M [13] and 2 M impregnated coconut shell samples.
Energies 17 00872 g002
Figure 3. SEM-EDX spectra of (a) control, (b) 1 M [13] and (c) 2 M Ni-impregnated coconut shell samples.
Energies 17 00872 g003
Figure 4. XRD pattern of control [13], 1 M [13] and 2 M impregnated coconut shell samples.
Energies 17 00872 g004
Figure 5. Effect of temperature on gas composition, considering SCWG of control (a) [13], 1 M (b) [13] and 2 M (c) impregnated coconut shell samples at 40 min and 20 wt% biomass loading.
Energies 17 00872 g005
Figure 6. Effect of biomass loading on gas composition for SCWG of control (a) [13], 1 M (b) [13] and 2 M (c) impregnated coconut shell samples at 450 °C and residence time of 60 min.
Energies 17 00872 g006
Figure 7. Impact of residence time (20 and 60 min) on gas composition considering SCWG of (a) control [13], (b) 1 M [13] and (c) 2 M impregnated coconut shell samples at 500 °C and 25 wt% biomass loading.
Energies 17 00872 g007
Figure 8. SEM images (magnification from 200 to 600 µm): Hydrochars produced after SCWG process of 2 M impregnated sample at 400 °C for 20 min (a) and 60 min (b) and 500 °C for 20 min (c) and 60 min (d); Hydrochars produced after SCWG process of 1 M impregnated sample at 400 °C for 20 min (e) and 60 min (f) and 500 °C for 20 min (g) and 60 min (h); 1 M impregnated sample prior to SCWG (i); 2 M impregnated sample prior to SCWG (j).
Energies 17 00872 g008
Figure 9. XRD patterns of hydrochars generated at 400 °C and (a) 20 min and (b) 60 min.
Energies 17 00872 g009aEnergies 17 00872 g009b
Figure 10. XRD patterns of hydrochars produced at 500 °C for (a) 20 min and (b) 60 min.
Energies 17 00872 g010aEnergies 17 00872 g010b
Table 1. Variables used in Box-Behnken design.
Coded ValuesA–Temperature (°C)B–Residence Time (min)C–Biomass Loading (wt%)
−14002020
04504025
15006030
Table 2. Ultimate * and proximate compositions of the biomass samples.
ParameterControl (wt%)1 M (wt%)2 M (wt%)
C49.045.737.9
H6.25.55.1
N0.30.82.6
O41.643.545.9
Sndndnd
Moisture3.2--
Ash2.9--
Volatile Matter77.5--
Fixed Carbon19.6--
References [13][13]This work
* On dry-ash-free (daf) basis; nd = Non-detected.
Table 3. Product yields obtained from SCWG of 2 M impregnated coconut shell samples.
Variables 2 M Impregnated Sample
Run A—Temperature (°C)B—Residence Time (min)C—Biomass Loading (% wt)Solid (wt%)Liquid (wt%)Gas (wt%)
140060258.050.841.2
2500403012.742.345.0
350060258.944.846.3
450040209.144.846.1
5450402511.556.532.0
6450203012.254.033.8
745060208.545.346.2
8400403012.848.938.3
945020208.855.235.9
10450603011.743.345.0
11500202512.942.344.7
12400202512.257.130.6
13400402011.544.244.3
14450402510.947.741.4
1545040259.142.948.0
Table 4. Gas composition from SCWG of control and impregnated coconut shell samples.
Response Variables (mol%)
Control [13]1 M [13]2 M
Run A—Temperature (°C)B—Residence Time (min)C—Biomass Loading (%wt)H2COCO2CH4H2COCO2CH4H2COCO2CH4
250040305.80.338.555.55.88.748.636.97.72.354.535.5
350060257.30.948.743.28.01.048.442.69.22.449.538.9
450040208.30.548.343.08.63.043.744.89.12.050.338.6
1150020259.53.240.746.813.07.742.836.715.24.544.136.2
1340040305.55.574.114.94.57.171.816.56.05.679.58.9
Table 5. Impact of temperature on GE, CGE and HGE values.
Control 1 M2 M
T (°C)CGE (%)HGE (%)GE (%)CGE (%)HGE (%)GE (%)CGE (%)HGE (%)GE (%)
400182426314241396544
500395642456944538346
Table 6. Impact of biomass loading on GE, CGE and HGE values.
Control 1 M2 M
Biomass Loading (wt%)CGE (%)HGE (%)GE (%)CGE (%)HGE (%)GE (%)CGE (%)HGE (%)GE (%)
20324240446145369846
30302338433043455545
Table 7. Effect of residence time on GE, CGE and HGE values.
Control 1 M2 M
Time (min)CGE (%)HGE (%)GE (%)CGE (%)HGE (%)GE (%)CGE (%)HGE (%)GE (%)
2033513440102434813344
60374740436343538446
Table 8. EDX analysis of hydrochar obtained after SCWG.
Hydrochar SampleTemperature (°C)Time (min)Ni (wt%)O (wt%)
1 M400202.915.77
603.112.98
500205.813.8
606.110.5
2 M 400207.919
607.616.3
500205.212
6022.67.1
Table 9. Chemical composition of organic liquid product obtained from SCWG of control coconut shell sample.
SampleTemperature (°C)Residence Time (min)Retention Time (min)CompoundFormulaPeak Area (%)
Control400209.372-pentanone, 3-methyleneC6H10O46.6
14.66PhenolC6H6O3.1
17.41Phenol, 2-methoxyC7H8O237.4
232.4-dimethoxyphenolC8H10O312.8
6015.22.4-dimethylfuranC6H8O23.9
16.34Phenol, 2-methylC7H8O35.5
16.84Phenol, 3-methylC7H8O40.6
5002014.64PhenolC6H6O62.5
16.32Phenol, 2-methylC7H8O17.3
21.51Benzofuran, 2,3,dihydro-2-methylC9H10O20.2
6014.57PhenolC6H6O60.5
16.28Phenol, 2-methylC7H8O17.4
16.76Phenol, 3-methylC7H8O22.0
Table 10. Chemical composition of organic liquid product obtained from SCWG of 1 M nickel-impregnated coconut shell sample.
SampleTemperature (°C)Residence Time (min)Retention Time (min)CompoundFormulaPeak Area (%)
1 M4002011.653-aminoisoxazoleC3H4N2O3.0
12.65Heptanoic acid.6-oxo-C7H12O34.4
13.08FurfuralC5H4O23.9
16.07PhenolC6H6O79.8
16.73N-(2-furymethyl) methanesulfonamideC11H13NO4S2.7
18.062-cyclopenten-1-one, 2,3-dimethylC7H10O6.2
604.44Acetic acidC2H4O264.4
16.08PhenolC6H6O35.6
5002013.07FurfuralC5H4O25.9
16.04PhenolC6H6O94.1
6013.07FurfuralC5H4O268.9
16.04PhenolC6H6O31.1
Table 11. Chemical composition of the organic liquid product obtained from SCWG of 2 M nickel-impregnated coconut shell sample.
SampleTemperature (°C)Residence Time (min)Retention Time (min)CompoundFormulaPeak Area (%)
2 M4002013.07FurfuralC5H4O25.7
14.882-cyclopenten-1-one, 2-methylC6H8O2.2
16.04PhenolC6H6O89.9
16.90Cyclohexanol, 2,3-dimethylC8H16O2.1
6016.02PhenolC6H6O66.9
17.78Phenol,2-methyl-C7H8O15.5
18.25p-cresolC7H8O13.9
18.93Phenol,2-methoxyC7H8O22.1
20.533Phenol,3,5-dimethyl-methylcarbamateC10H13NO21.4
500204.832-butanoneC4H8O5.2
7.342-pentanoneC5H10O1.1
7.962-propanone, 1-hydroxy-acetoinC3H6O21.5
8.96acetoinC4H8O21.5
13.07furfuralC5H4O21.0
16.04PhenolC6H6O83
19.78Phenol,2,4-dimethylC8H10O5.2
20.55Phenol,2,4-dimethylC8H10O1.5
6013.05FurfuralC5H4O25.3
16.03PhenolC6H6O72.5
17.64Benzyl alcoholC7H8O11.3
17.79Phenol, 2-methylC7H8O10.7
Disclaimer/Publisher’s Note: The statements, opinions and data contained in all publications are solely those of the individual author(s) and contributor(s) and not of MDPI and/or the editor(s). MDPI and/or the editor(s) disclaim responsibility for any injury to people or property resulting from any ideas, methods, instructions or products referred to in the content.

