1. Introduction
On the way to develop high-energy batteries, high-nickel layered-structure material is widely applied as a cathode for Li-ion cells [
1,
2,
3]. However, its relative unstable structure raises concerns on safety issues [
4,
5,
6,
7]. Compared to conventional layered-structure cathodes, including LiNi
1−x−yCo
xMn
yO
2 (NCM) and LiNi
1−x−yCo
xAl
yO
2 (NCA), LiNi
1−x−y−zCo
xMn
yAl
zO
2 (NCMA) shows more benefits for (a) low cost—Al was selected to partially substitute expensive Co element while maintain the material’s high specific capacity; (b) extra cycling stability—NCM volume contraction/expansion during the H2 ↔ H3 phase transition is slightly reduced by Al doping; and (c) enhanced thermal stability—NCMA is structurally stable due to the synergetic effect of Al and Mn ions stabilizing the layered structure and delaying the thermally induced phase transitions [
2,
8]. However, there is still optimization room to further improve safety and reduce cost after applying NCMA as a cell cathode.
Blending high-Ni cathode with other stable cathode active material is one of the most adaptable solutions to reduce cell cost and the risk of thermal runaway [
9,
10,
11,
12,
13,
14]. Among all potential material candidates, LiMn
xFe
1−xPO
4 (LMFP) is the analogue of market mainstream LiFePO
4 (LFP); therefore, it has similar advantages of LFP, including low cost, good cycling stability, and stable structure. By replacing part of the redox couple from Fe(III)/Fe(II) to Mn(III)/Mn(II), LMFP shows similar specific capacity but much higher working potential; therefore, LMFP has higher energy density compared to LFP. LMFP shows benefits of improving cell safety and reducing material cost [
15,
16,
17]; higher working potential of LMFP compared to LFP makes it a more suitable candidate to blend with a high-nickel cathode. However, the drawbacks of LMFP are similar with LFP as well, which has lower energy density (with a typical capacity value of 145 mAh g
−1) and lower Li-ion diffusion coefficient caused by the 1D diffusion structure [
18,
19,
20,
21,
22].
The strategy of blending LMFP with NCMA demands an optimized way to balance requirements of mileage, safety, fast charging ability, and low cost. To develop an optimized blending recipe, it is important to understand functions of NCMA and LMFP in blending materials. It is generally expected that higher LMFP content results in higher safety, lower cost but lower rate performance, and lower energy density. However, the interaction between NCMA and LMFP within the electrode is still unclear, which will possibly drive the blending result to drift from expectation. In this work, to better understand the electrochemical interaction between NCMA and LMFP in a blended cathode, we fabricated 5 Ah pouch cells with various NCMA/LMFP blending ratios. Based on cell performance evaluation, material property characterization, and electrochemical simulation, we found that, during charge/discharge in the blended electrode, LMFP plays its role intermittently, while NCMA takes load continuously. This unique phenomenon helps to boost rate performance, especially discharge rate performance. Moreover, based on the simulation result, the intrinsic way to enhance charge rate performance is to improve the Li-ion diffusion coefficient of LMFP, which could involve lower particle size or introducing dopant into LMFP bulk.
2. Materials and Methods
2.1. Material Information
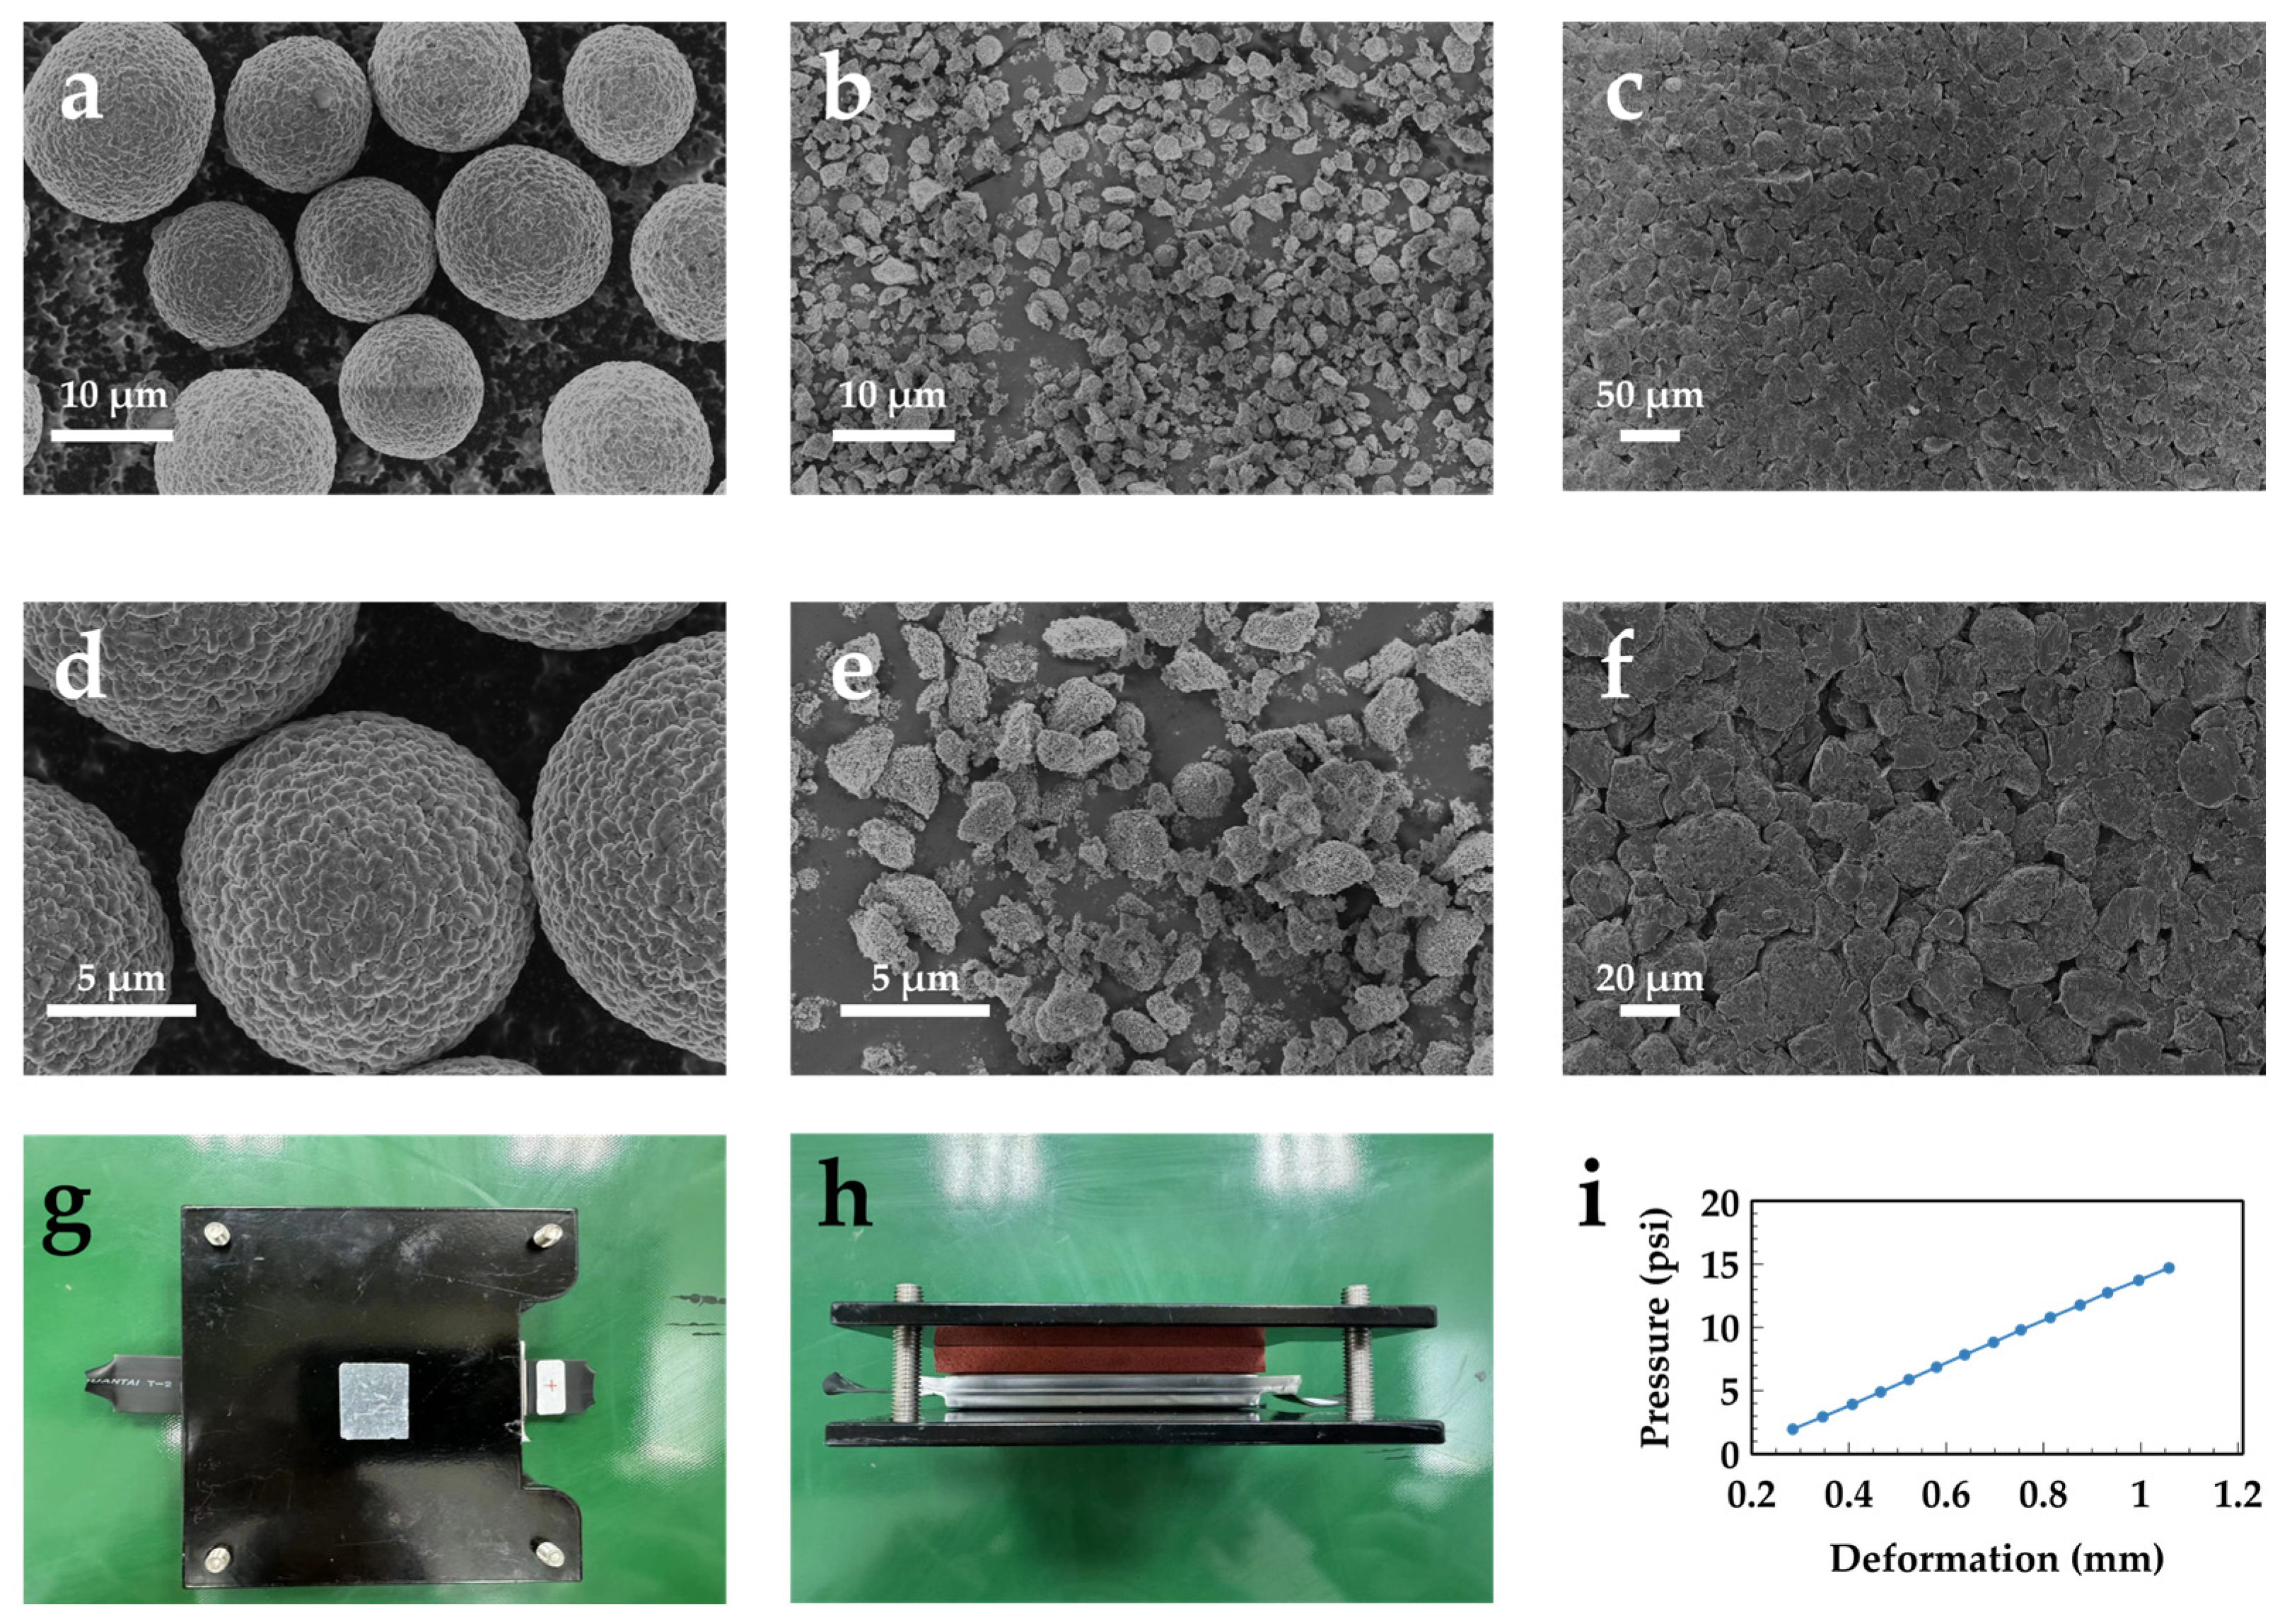
All electrode materials were purchased as commercialized powders. For NCMA, the molar ratio of Ni, Co, Mn, and Al is 91:5:3:1. Its typical particle size is 12 μm. In LMFP, the molar ratio of Mn and Fe is 70:30. Its typical particle size is 2 μm. The anode used artificial graphite, with a typical particle size of 20 μm.
2.2. Cell Fabrication
Pouch cells of 5 Ah were fabricated to value different blending recipes. The cell size is 108 mm × 34 mm × 9 mm in length, width, and thickness. For all four cell designs, the anode is 5.5 mAh cm−2 loading graphite, with an active material weight ratio of 95.2%, conducting filler ratio of 0.6%, and CMC/SBR binder ratio of 4.2%.
For the cathode, four recipes with loading of 5 mAh cm−2 were fabricated; the weight ratios of NCMA and LMFP are NCMA (G1), NCMA/LMFP = 9:1 (G2), NCMA/LMFP = 8:2 (G3), and NCMA/LMFP = 7:3 (G4), respectively. In the cathode for all four cell designs, the active material weight ratio is 95%, with 3% conducting filler and 2% PVDF binder, respectively.
The electrolyte of tested cells is 1.2 M LiPF6 in ethylene carbonate and ethylene methyl carbonate (3:7 in volume ratio) solution with 2% vinylene carbonate in weight ratio.
Half coin cell assembling adopted the same electrodes as pouch cells, with Li metal as the counter-electrode. For LMFP half coin cell, the electrode loading is 5 mAh cm−2, with 95% active material, 3% conducting filler, and 2% PVDF binder in weight ratio.
2.3. Testing Protocol
All pouch cell testing is performed under constant pressure of 9 psi. A fixture is applied to maintain such pressure with soft foam to ensure pressure uniformity, as shown in
Figure 1g,h. The applied pressure was adjusted by foam’s pressure vs. deformation calibration curve, as shown in
Figure 1i.
Formation: cell formation is processed at room temperature by charging the cell to 100% SOC in C/20 constant current (CC), followed by a C/100 cut-off constant voltage (CV) charge.
Cycling testing: cycling testing is processed at room temperature. The voltage window of cycling is 3.0–4.2 V; in the charge process, it adopts a CC-CV protocol with CC current of C/3 and CV cut-off current of C/20; in the discharge process, the CC current is C/3 without a CV step. After 100 cycles of charge/discharge, a reference performance test (RPT) is performed, with the same charge/discharge process as the cycling test but a CV charging cut-off current of C/100.
Rate performance testing: rate performance test is separated into two parts. In discharge rate testing, the cell’s CC-CV charging rate is always C/3 with C/20 cut-off but discharged at different C-rates (C/10, C/5, C/3, C/2, 1C, and 2C). In charge rate testing, the cell is always CC discharged in C/3 and CC-CV charged at various C-rates (C/10, C/5, C/3, C/2, 1C, 2C, and 3C) with the same CV cut-off current of C/20. Only capacity in the CC part is adopted for comparison in this work.
Representative potential testing: representative potential testing is performed by half coin cell with active material containing electrode and Li metal counter-electrode. After the formation protocol, the cells are charged/discharged in C/64 for 3 cycles. The average between charge/discharge voltage profiles in the third cycle is calculated and adopted as representative of open-circuit voltage.
Self-discharge testing: after formation, pouch cells are charged to 100% SOC in C/10 and rested for 7 days. Voltage is recorded during charge and rest steps.
Impedance: to obtain exchange current and Li-ion diffusion coefficient, the impedance spectra of each material are collected by half coin cells, with an active material electrode and Li metal counter electrode. The cells are first fully charged and then discharged every 10% SOC to test electrochemical impedance spectra. The frequency range is from 0.01 Hz to 1 MHz, with an amplitude of 10 mV using Solartron 1470E (Solartron Metrology Limited, Leicester, UK) electrochemical workstation.
2.4. Physical Characterization
X-ray diffraction (XRD) is characterized by Bruker D8 advance diffractometer by Cu Kα radiation (Bruker Corporation, Billerica, MA, USA). 2θ range is 10–90° with a data collection rate of 0.01° s−1. Materials’ morphology is collected by scanning electron microscopy (SEM, MERLIN Compact, ZEISS, Oberkochen, Germany).
2.5. Simulation
A 1D Doyle–Fuller–Newman (DFN) model was built to investigate the electrochemical processes during the pouch cell’s charge/discharge. Controlling equations have been summarized in
Table A1 [
23,
24,
25] and parameters for simulation in
Table A2. Material data fed into the model were collected from the coin cell or physical characterization mentioned above; cell design parameters were based on the fabricated 5 Ah pouch cells. Simulation is performed in COMSOL multiphysics.
3. Results
Four types of 5 Ah pouch cells were fabricated to evaluate the electrochemical performance of NCMA and NMCA/LMFP blending designs. In these cells, the anode design is the same and the active material is graphite; the cathode design involves NCMA and NCMA blending chemistries, which are NCMA, NCMA/LMFP (90:10), NCMA/LMFP (80:20), and NCMA/LMFP (70:30) in weight ratio, respectively. The particle sizes of NCMA, LMFP, and graphite materials are 12 μm, 2 μm, and 20 μm, respectively, as shown in
Figure 1a–f. Cells with four cathode recipes were labelled as G1, G2, G3, and G4 with increasing LMFP content. A constant pressure of 9 psi is applied to all electrochemical performance testing with fixture illustrated in
Figure 1g,h.
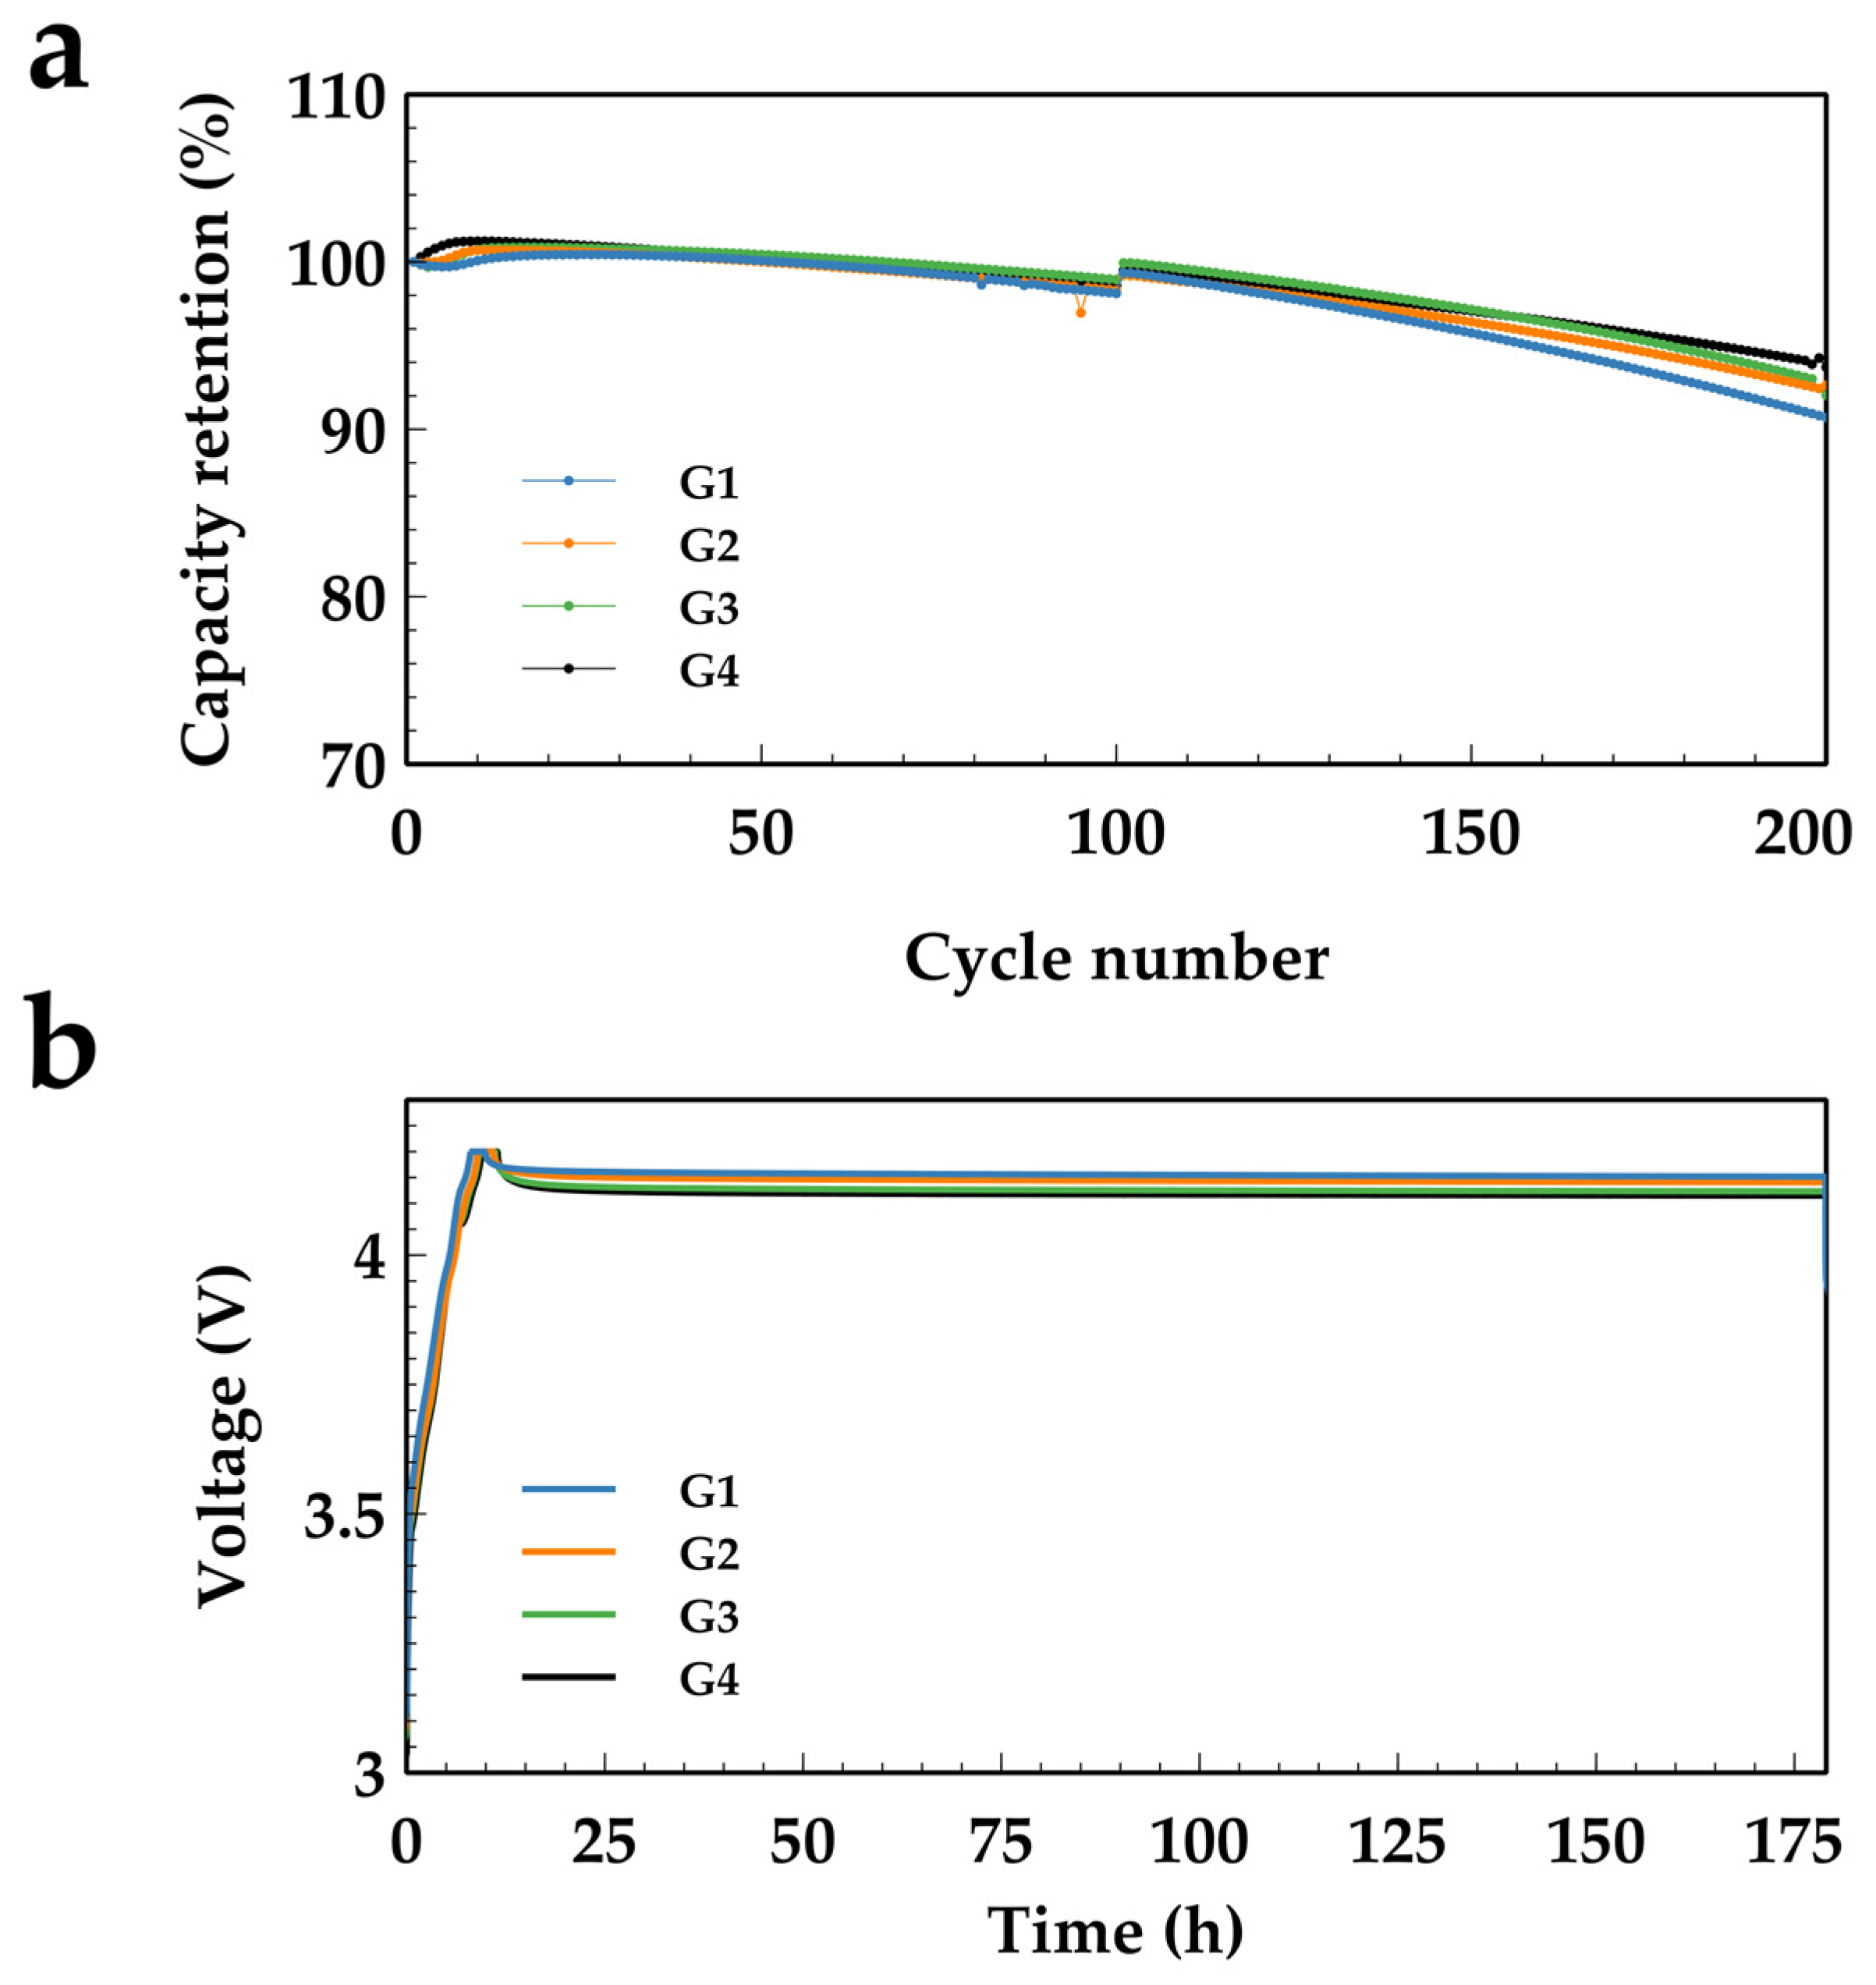
Electrochemical performance of these cells was first tested, and their cycling stability is shown in
Figure 2a. The cycling stability was the average value based on three parallel cells’ testing results. For all cells, their capacity increased slightly after the 100th cycle. This is due to the RPT test after 100 cycles involving a lower cut-off current in the CV charge step, and more Li-ions were de-intercalated from cathode and became cyclable in this stage, leading the capacity to raise from the 100th to 101st cycle. In 200 cycles, all cell batches show similar capacity retention, with a slight variation in retention G4 > G3 > G2 > G1. The result shows that, by blending LMFP into NCMA material, cycling stability is not obviously affected. Self-discharge of the pouch cell was evaluated as well. G1–G4 pouch cells were first charged to 100% SOC and then rested for 7 days while recording their terminal voltage. As displayed by
Figure 2b, after a slight voltage drop in the initial stage due to a fade of diffusion polarization, voltage of all pouch cells remains stable in 7 days’ rest, indicating self-discharge is negligible to cells in this work.
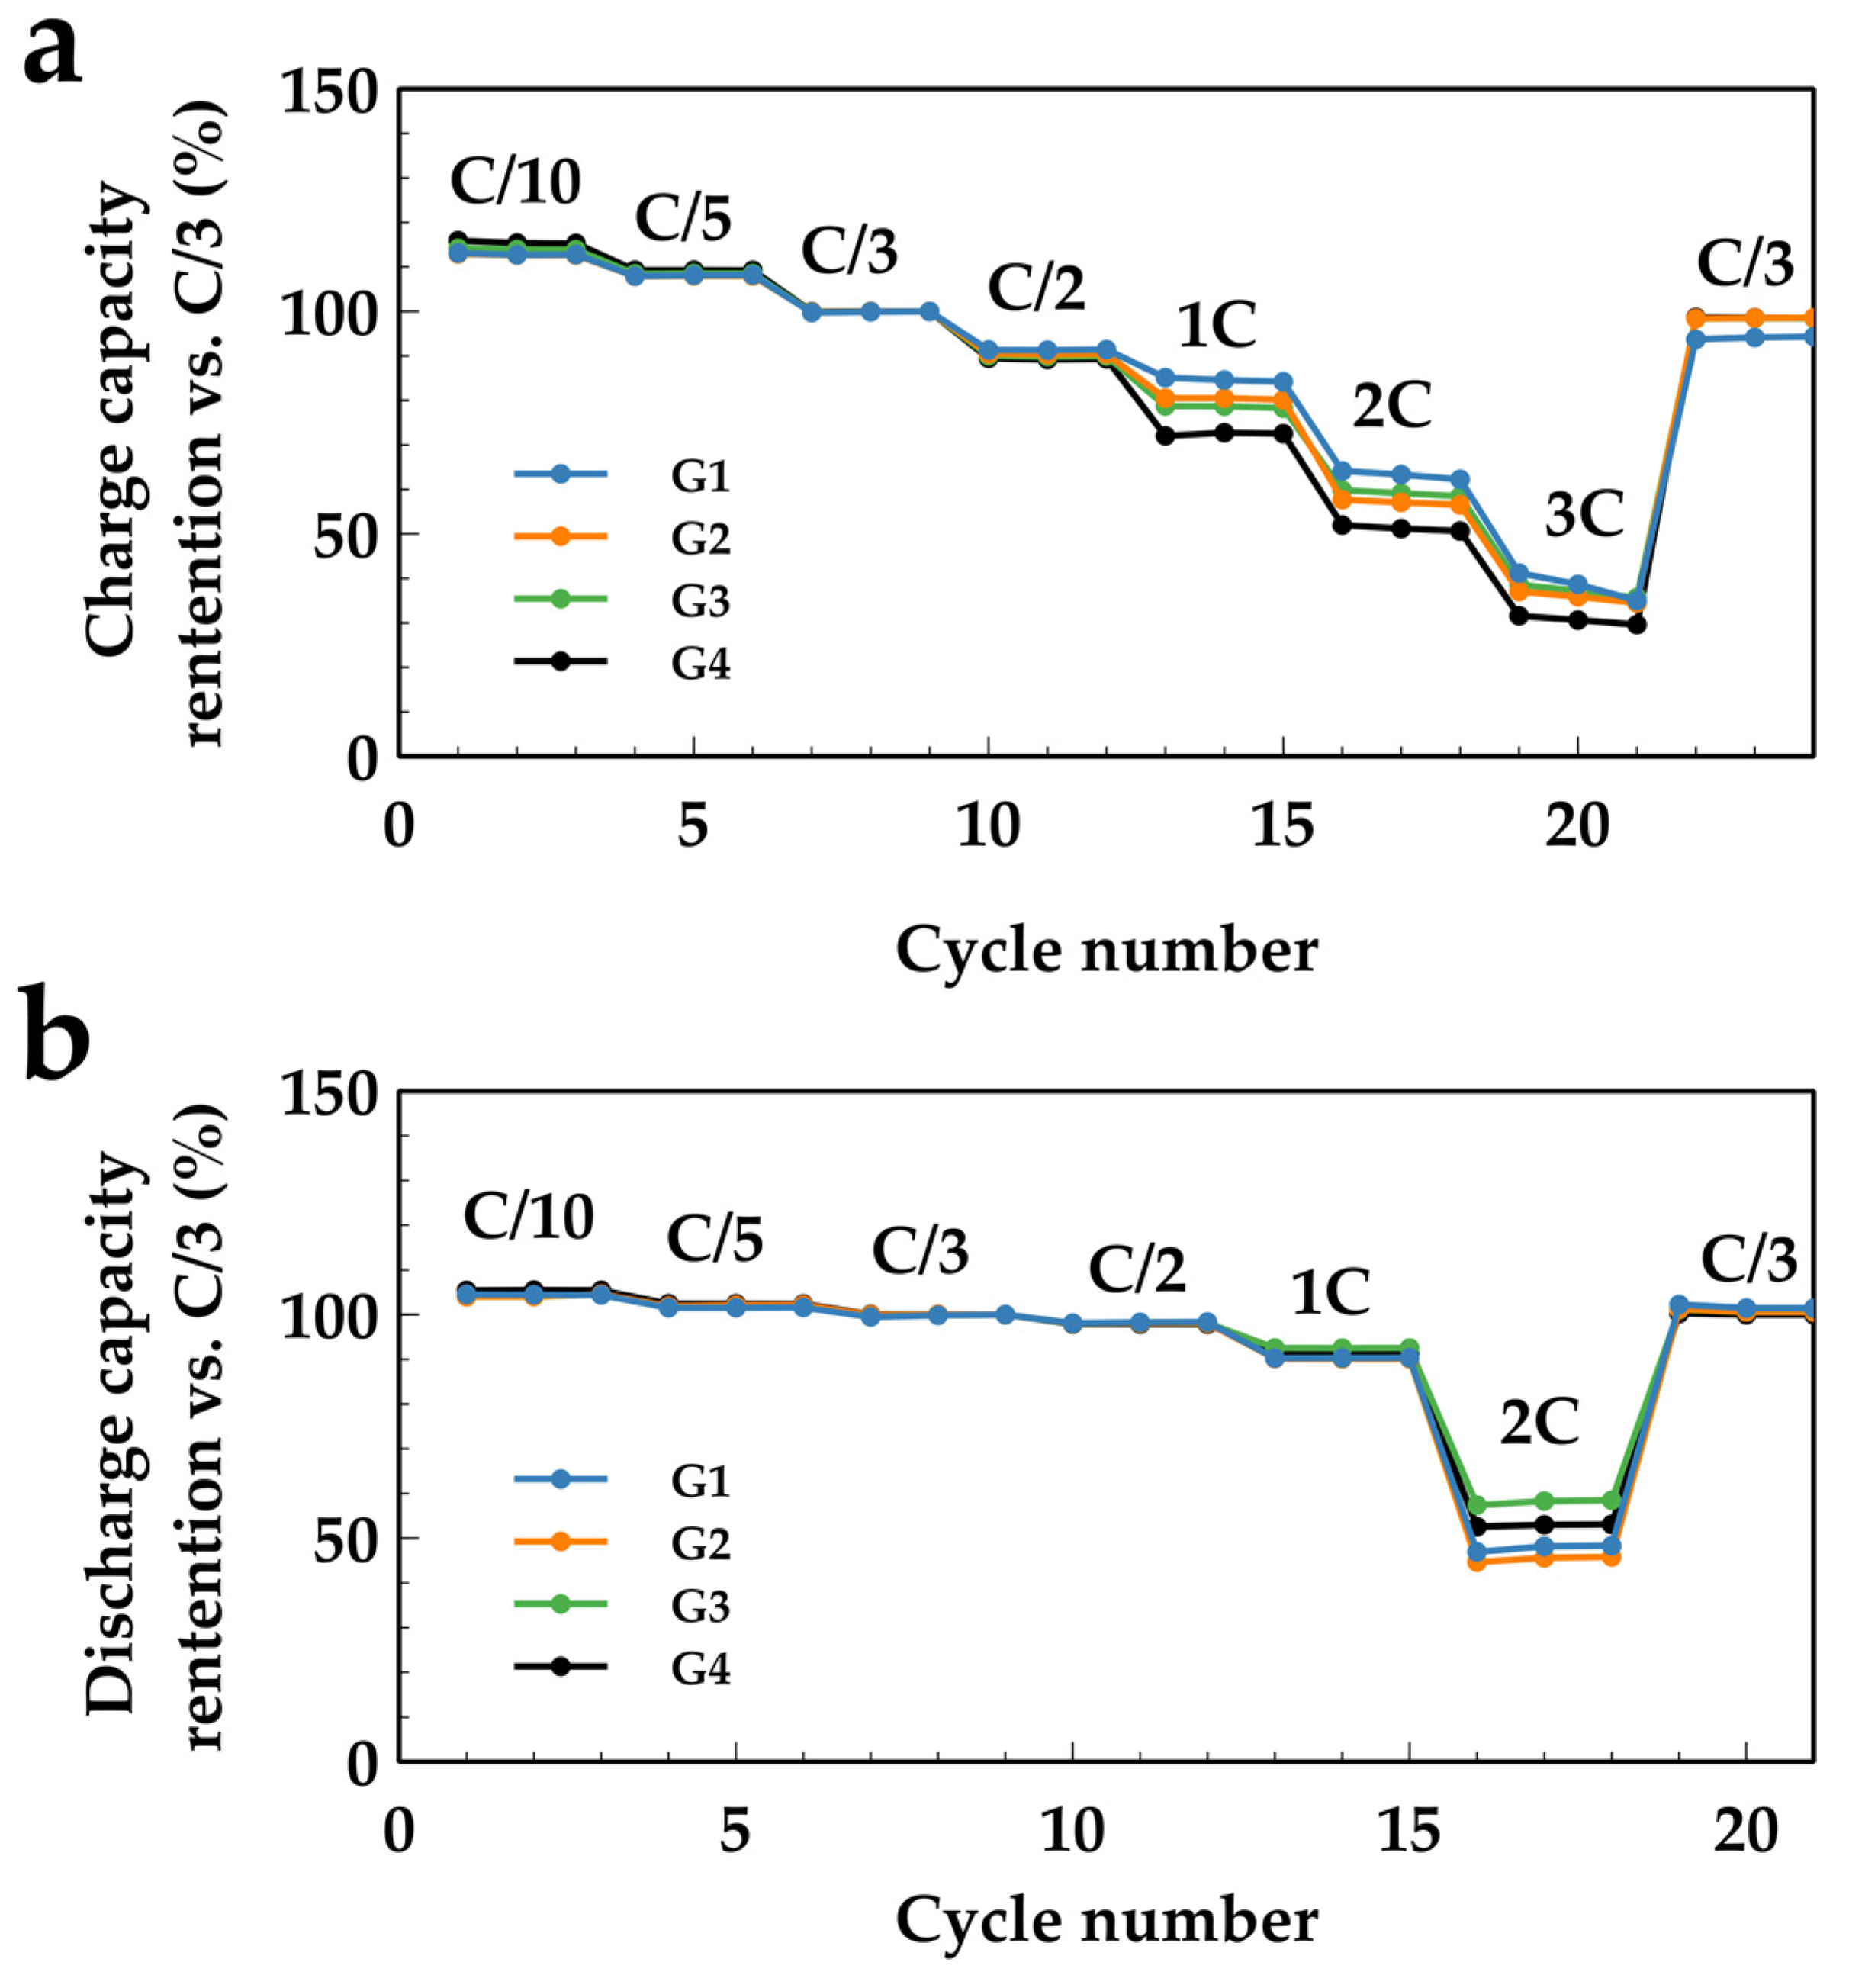
Rate performance of four cell designs was tested and results are shown in
Figure 3. Capacities in various C-rates were normalized into percentages referring to nominal capacity in C/3 to make a distinct comparison. As generally expected, due to poor electronic conductivity and sluggish Li-ion diffusion, blending LMFP material to NCMA electrode will reduce the rate performance of the cell in some content. This confirmed such estimates in charge rate evaluation. When charging C-rate went higher than C/2, the capacity in constant current charging differentiated and ranked as G1 > G2 ≈ G3 > G4. However, in discharge rate, especially under high discharge C-rate, rate performance ranking changed to G3 > G4 > G1 ≈ G2. Based on such observations, it is not appropriate to directly estimate the performance by simply overlaying the performance of NCMA and LMFP in a NCMA/LMFP blending chemistry system. Beyond this, there must be interactions between these two materials. Since this interaction affects the discharge/charge rate ability, this interaction should be kinetic-related.
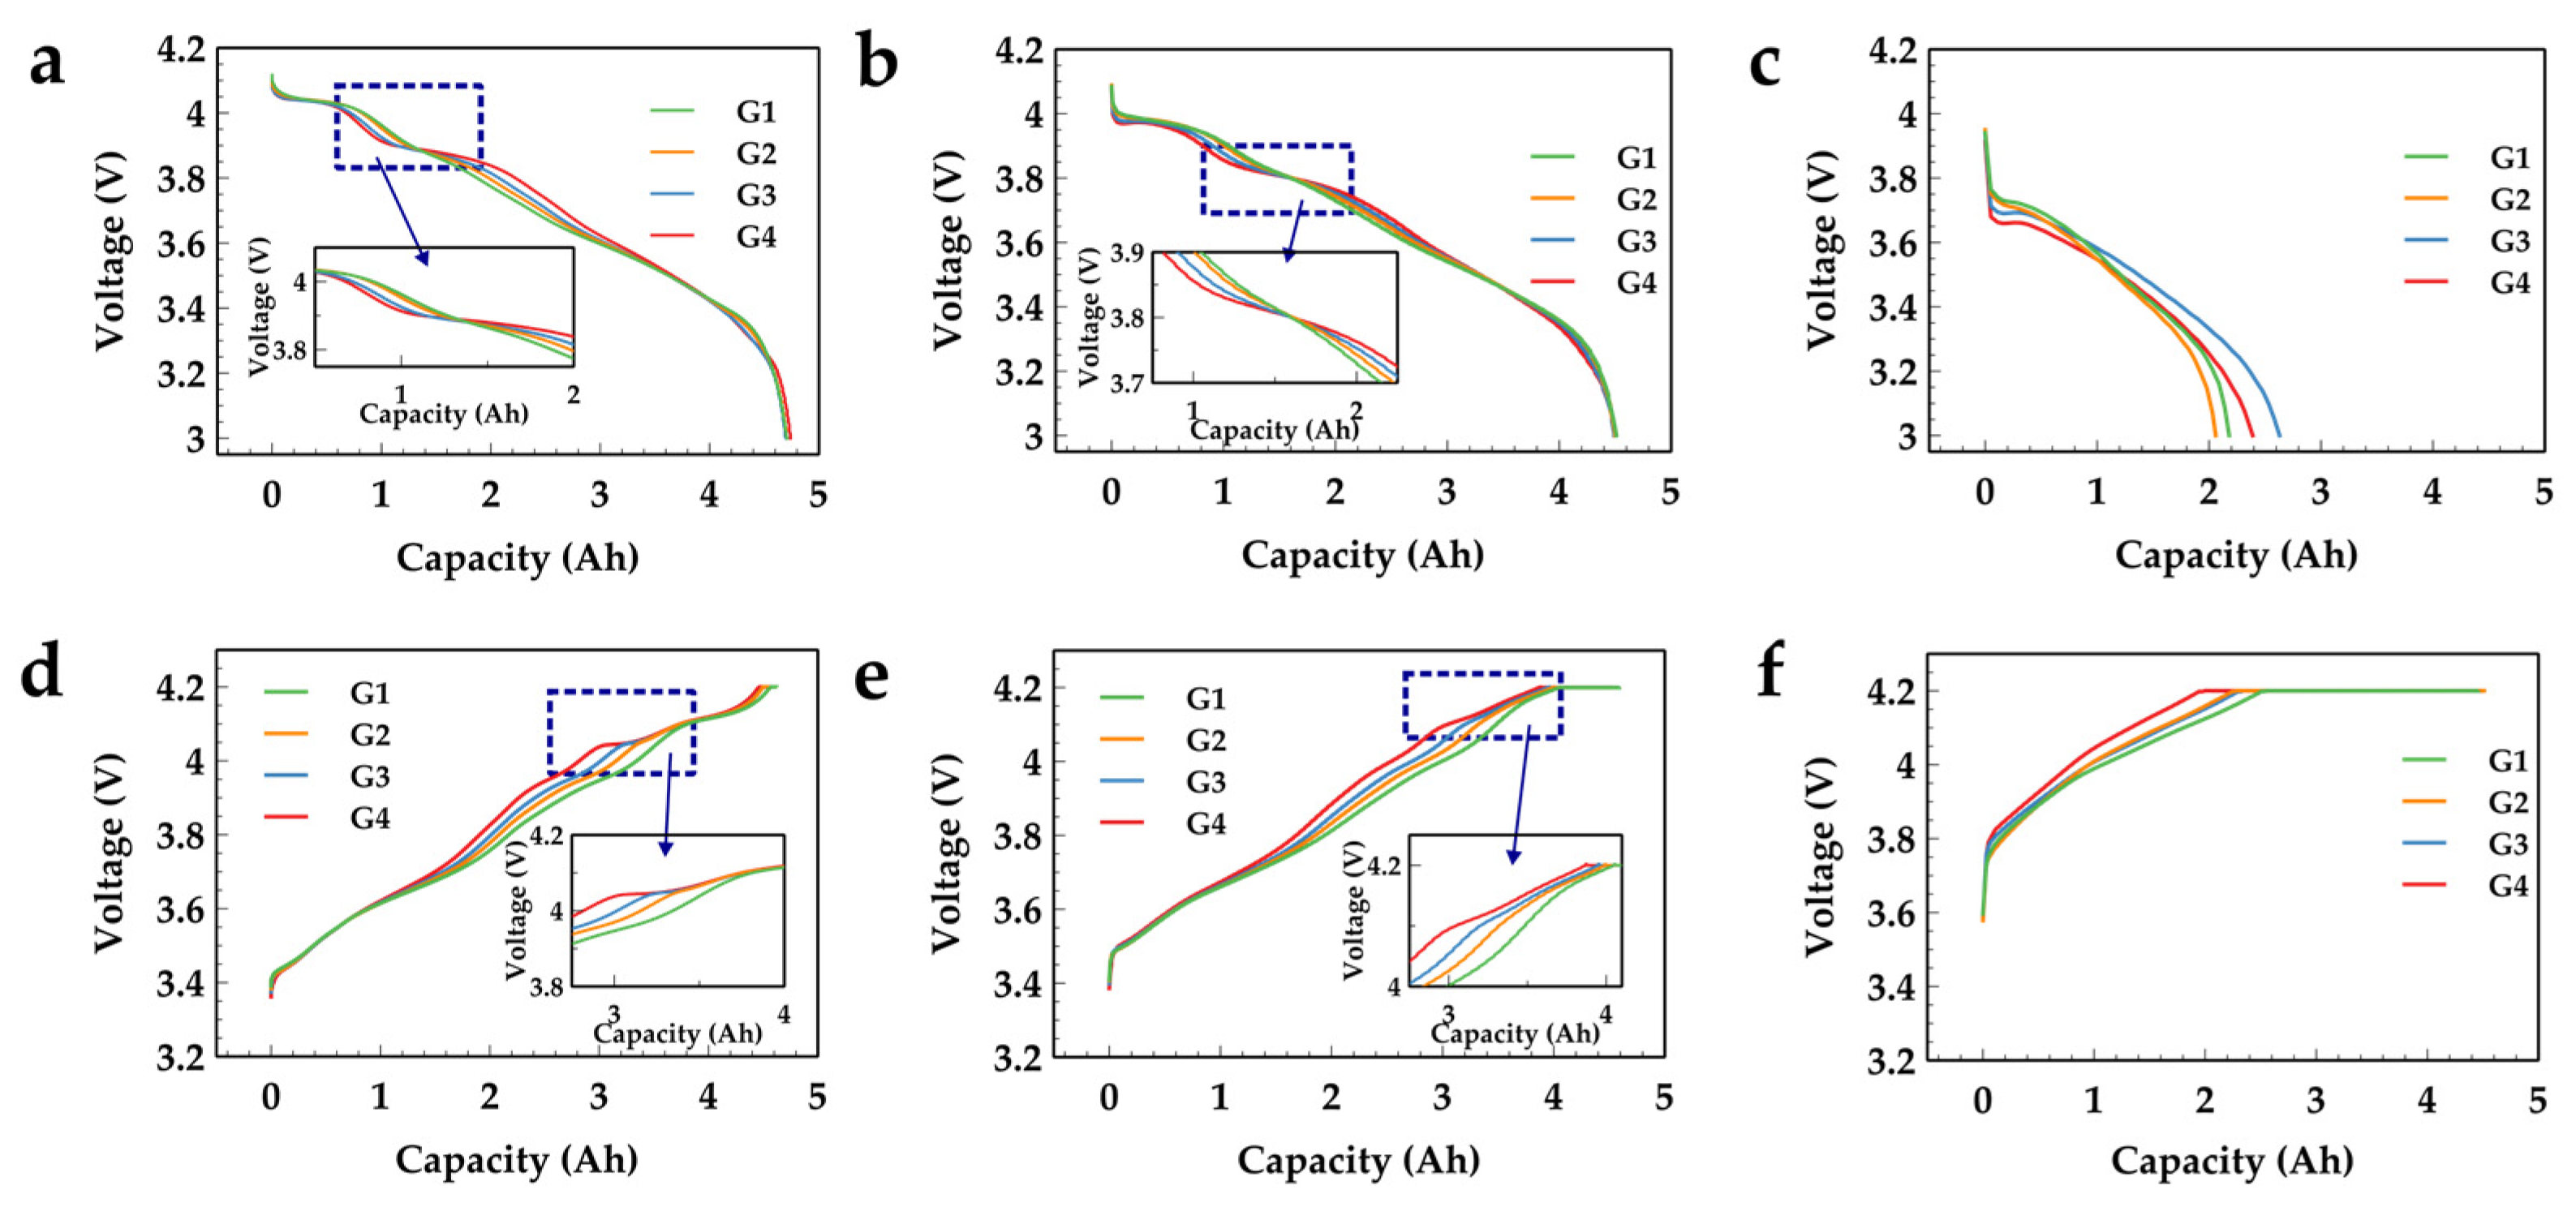
Figure 4 shows representative charge and discharge voltage profiles in different C-rates. C-rates of C/10, C/3, and 2C were plotted to reflect polarization in low, medium, and high current density, respectively. As LMFP content increased from G1 to G4, there was a longer voltage plateau appearing at ~3.90 V and ~3.80 V in C/10 and C/3 discharge profiles, respectively (
Figure 4a,b). This plateau can be also seen at ~4.05 V and ~4.15 V in C/10 and C/3 charge profiles, respectively (
Figure 4d,e). However, because this voltage plateau is too close to the charge cut-off voltage (4.2 V), it disappeared completely in higher C-rate (2C) charging voltage profiles (
Figure 4f). Combining results in
Figure 3 and
Figure 4c,f, it could be found that the discharge capacity rank of G1–G4 cells was different from the charge. Cell G1 with only an NCMA cathode had a better performance rank in charge than discharge. This is due to the high polarization in high C-rate pushing the voltage plateau of LMFP higher than cut-off voltage in the charge process, leading to loss of capacity belonging to LMFP in G2–G4 cells.
Clues to explain this C-rate performance rank variation between charge and discharge can be found in representative voltage vs. SOC curves of NCMA and LMFP materials. In
Figure 5a–c, half-coin cells with NCMA, LMFP, and graphite were tested in C/64; the obtained voltage profiles involved a very low polarization; thus, they could be treated as representative of open-circuit voltage. Generally, polarizations push cells’ voltage to deviate from equilibrium state, leading to a higher voltage in the charge process and lower voltage in the discharge process. As shown in
Figure 5a, the representative voltage profile of NCMA is a roughly sloped curve from 3.3 to 4.2 V, leaving similar room for charge/discharge polarizations before voltage is pushed to hit cut-off voltages. Therefore, polarizations give roughly equal drawback to NCMA material’s charge and discharge process. However, LMFP showed a quite different voltage curve from NCMA. It has two flat voltage plateaus: a shorter one refers to redox of Fe(III)/Fe(II) centered around 3.5 V and a longer one refers to redox of Mn(III)/Mn(II) centered around 4.0 V (
Figure 5b). The length ratio of these two plateaus is according to the atomic ratio of Fe and Mn. In this case, Fe/Mn ratio is 3:7; thus, the Mn redox plateau in high potential is much longer than the Fe redox plateau. It is worth noticing that Mn(III)/Mn(II)redox plateau is very close to the upper cut-off voltage, as shown in
Figure 5d. Thereby, in the charge process, there is not much room to handle polarizations caused by voltage rise before the voltage of LMFP hits the upper limitation. This leads to intensive capacity loss belonging to the Mn(III)/Mn(II)redox plateau. In turn, during the discharge process, because Mn(III)/Mn(II)redox plateau is overall high in a cyclable voltage window, there is large room to handle polarizations causing voltage drop. Thus, in the discharge/charge process, the cell can bear more polarization than charge before hitting the bottom cut-off voltage. This assumption was evidenced by comparing discharge/charge performance of LMFP-based half-coin cell. As shown in
Figure 5e, it is obvious that, for LMFP material, its discharge rate performance is much better than charge rate performance. It is worth noting that the difference between charge and discharge capacity in the LMFP + Li coin cell is bigger than that of LMFP/NCMA + Gr pouch cell; the reason for such a difference in electrode and cell level will be discussed in the following section.
4. Discussion
According to classic electrochemical theory, polarizations of Li-ion batteries consist of three types: (1) ohmic polarization caused by internal resistance, including separator, current collector, and electrodes; (2) electrochemical polarization caused by Li ion migration crossing material/electrolyte interface in the lithiation and de-lithiation process; and (3) concentration polarization caused by Li ion diffusion, which is mainly caused by Li concentration gradient in electrodes and within cathode/anode material particles. As discussed above, overpotential is the key reason leading to rate difference between G1 and G4 cells. Therefore, it is crucial to understand the root cause leading to overpotential to identify key factors requiring further improvement. Doyle–Fuller–Newman (DFN) model-based P2D simulation is adopted to dig out information not able to be observed by experiment. To ensure accuracy of the simulation, key parameters of materials, including NCMA, LMFP, and graphite, were carefully collected by experiments, including materials’ OCV, charge transfer resistance and diffusion coefficient. Since both NCMA and LMFP material are obtained by doping from originate structure, not “standard” structure, X-ray diffraction pattern and refinement were performed to identify their crystal parameters. Those material data are summarized and shown in
Figure 5a–c,
Figure 6, and
Figure 7.
With the above-mentioned inputting data, a 1D electrochemical model based on cell design of a 5 Ah pouch cell was built. To verify the correctness of the built model, terminal voltage of G1–G4 cells under C/3 constant current discharge was calculated; the comparison of simulation results of three parallelly tested cells’ data is shown in
Figure 8. The simulation result showed good fitness to experimental data and, in most SOC ranges, the variation was controlled below 0.01 V. The good voltage fitness in the cell rest stage after discharge further proved the accuracy, especially in particle diffusion. This provided strong evidence that the built model accurately reflected cells’ testing and, therefore, was able to provide reliable information for further simulation-based analysis.
To better understand polarization distribution within cell components, we tracked the voltage distribution in three main cell components, cathode, anode, and separator, and calculated normalized voltage loss according to the following equations:
where
i represents cell components: cathode, anode, and separator,
Vloss is the voltage drop in examined components, and
Vnormalized is the normalized voltage drop. To calculate the voltage drop of every component, we first obtained four average voltages in various cell positions by simulation, which were
V1: voltage in anode side close to current collector,
V2: voltage in anode side close to separator,
V3: voltage in cathode side close to separator, and
V4: voltage in cathode side close to current collector; thereby, the voltage loss of each component was:
Figure 9 and
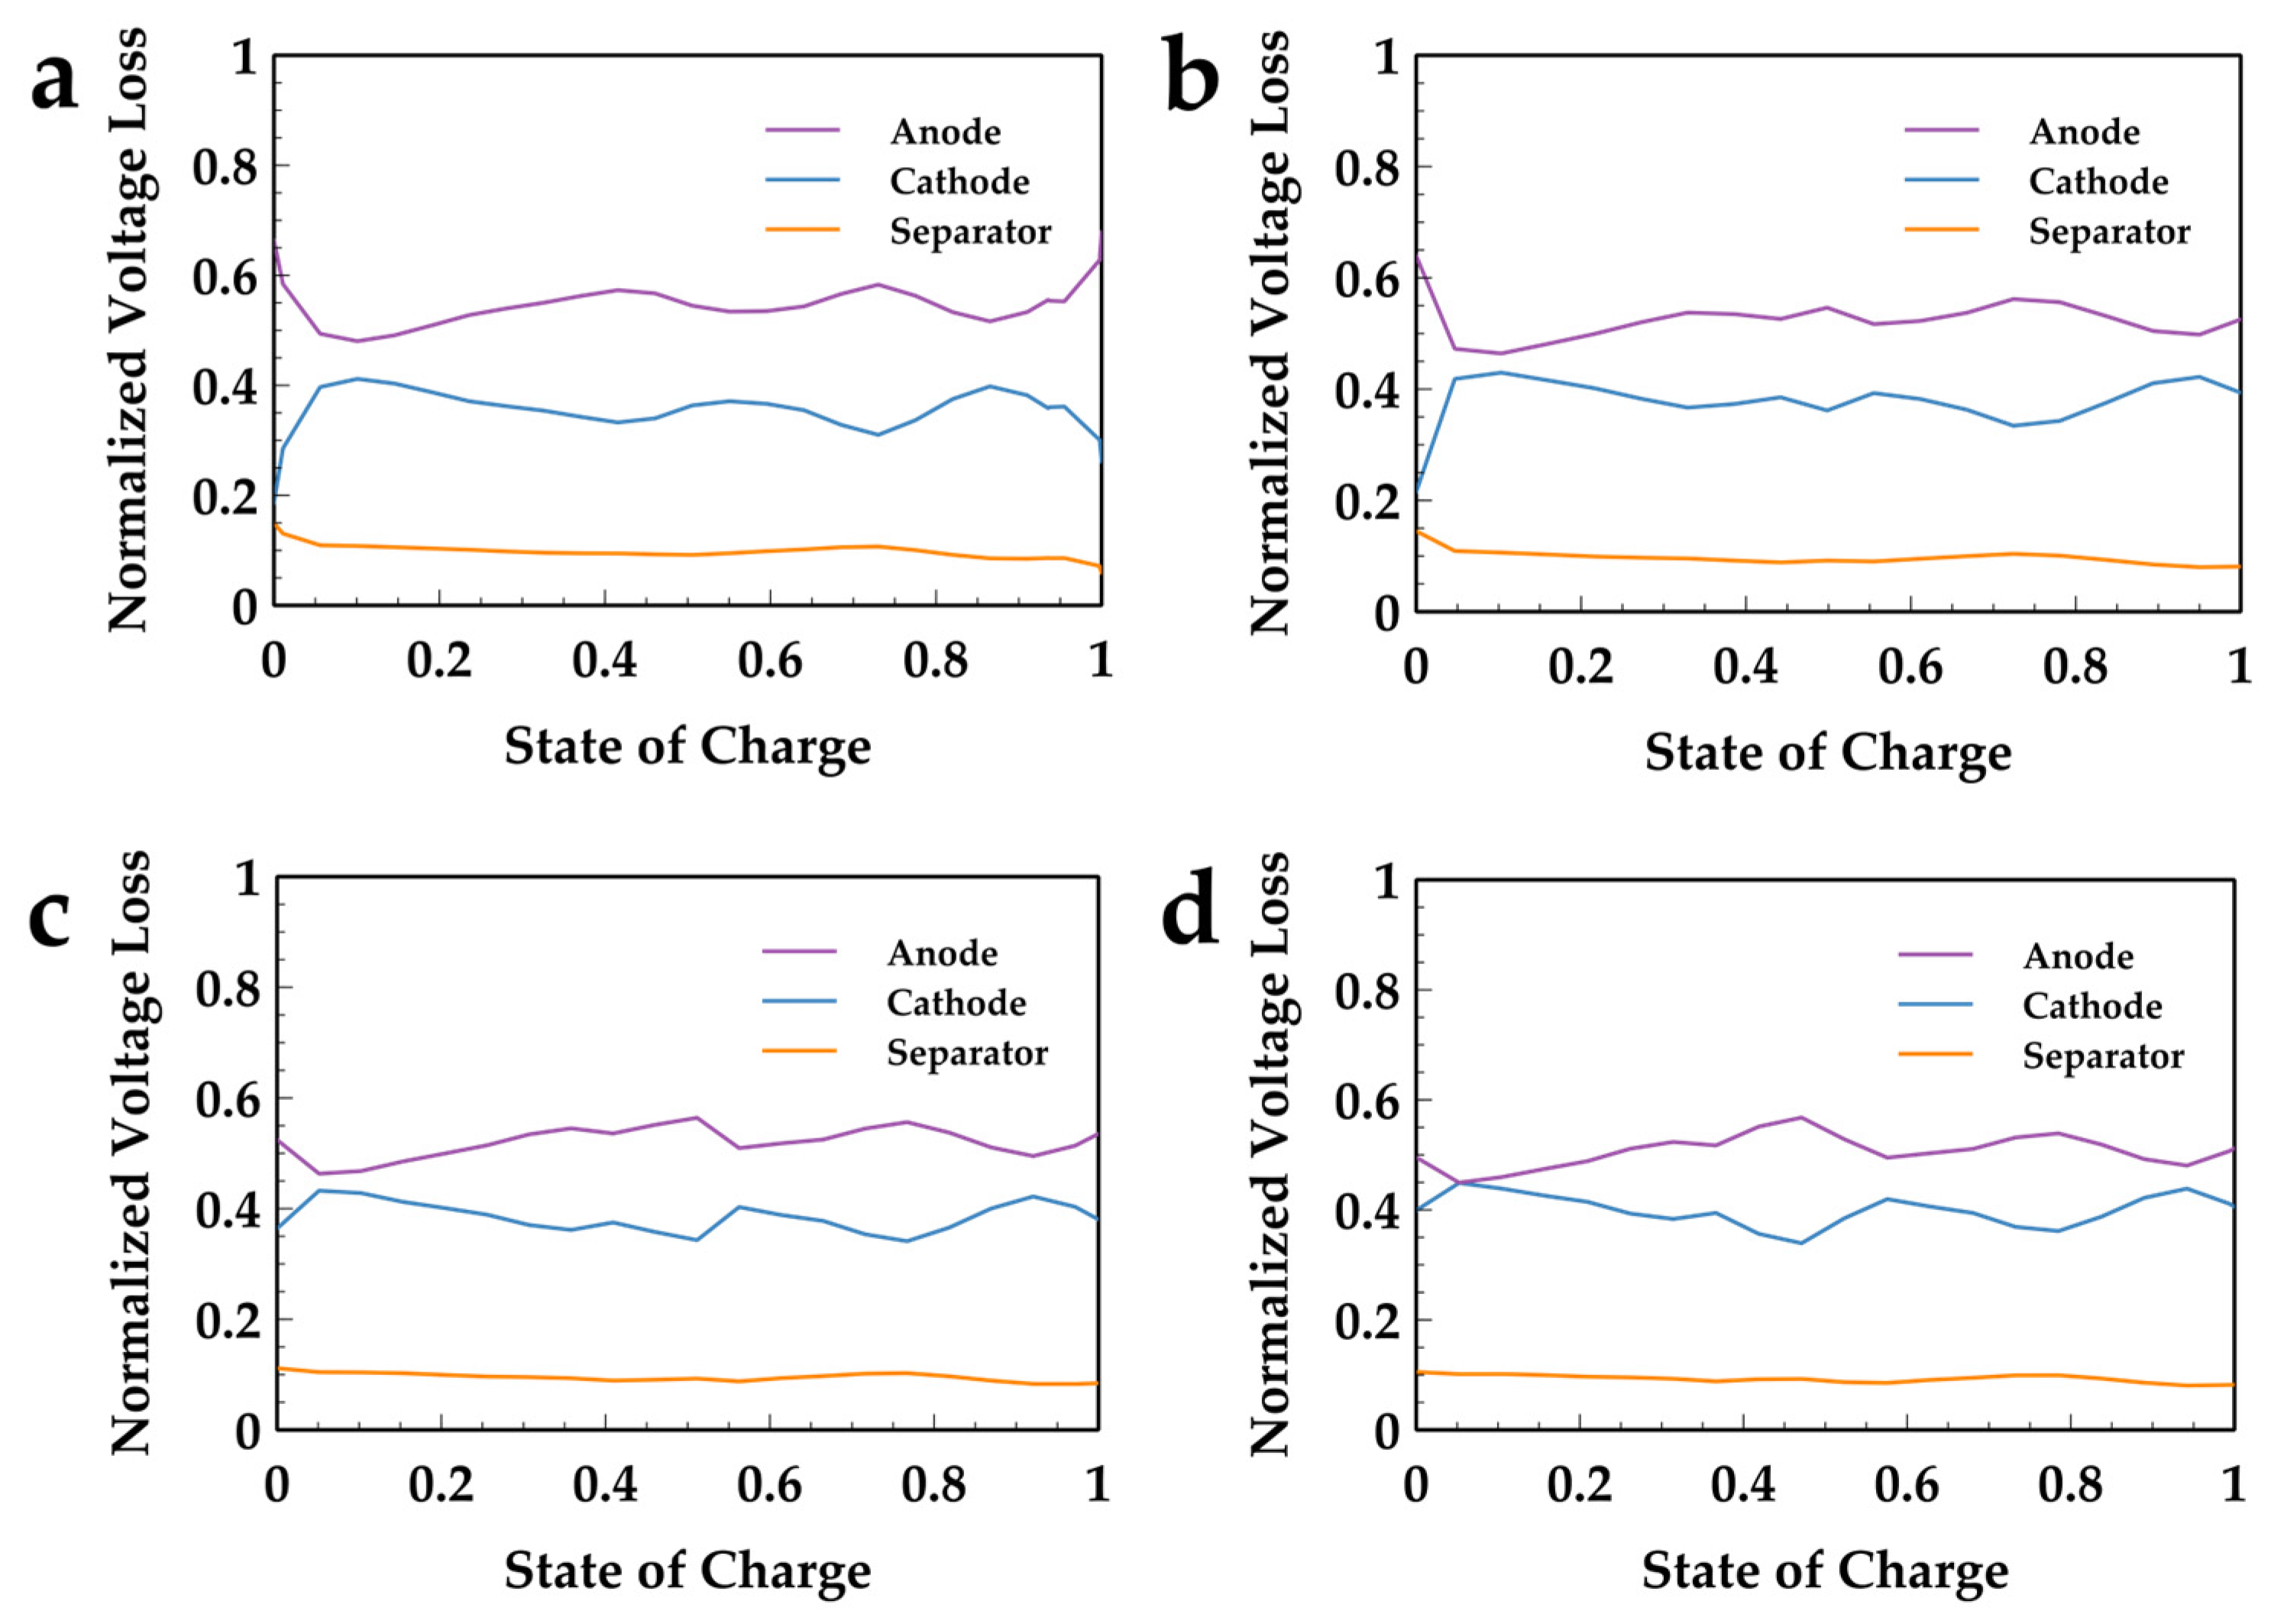
Figure 10 show the voltage loss contribution of cell components, including the cathode, anode, and separator. They reflected the affection of ohmic and electrochemical polarization and were valued based on normalized voltage loss. In the charge process, it represented how much voltage deviated positively from OCV and, in the discharge process, it was the value negatively deviating from OCV. The voltage loss contribution of all parts kept relatively stable in the whole charge/discharge process. For each component, voltage loss contribution in the charge and discharge process is roughly the same.
In detail, voltage loss contributed by Li ion crossing through the separator remained ~10% of the total value. The cathode’s contribution increased with higher LMFP content in the electrode but, in all batches G1–G4, voltage loss contribution from the cathode was always lower than that from the anode. This means that, to improve the rate capability of the chemistry system NCMA/LMFP + Gr, ameliorating kinetics in the anode side is equal or more important, especially considering the application of fast charge raises the risk of Li plating in the anode side. It is worth noting that, with the increase in LMFP content, contribution from the cathode side kept approaching that from the anode side. For G4 cell with 30% of LMFP blended, voltage loss resulting from the cathode was very close to the anode in the charging process, which strongly implied that, in a system with higher blending of LMFP above 30%, even more attention should be paid to the current stage in kinetics amelioration in the cathode side.
Besides ohmic and electrochemical polarization, diffusion-caused polarization is also important. Compared to the former two, diffusion polarization is more complicated because it is time-dependent. In this work, the diffusion bottleneck is Li-ion diffusion in the solid-state phase within active material particles. The sluggish diffusion property leads to a concentration gradient along the particle radius. For example, in the charging process, because Li ions diffuse from cathode particle bulk to electrolyte, Li ion concentration in the particle surface is lower than in the center; therefore, SOC in the particle surface is different from SOC in the particle center. It is obvious that higher diffusion polarization leads to bigger Li ion concentration difference between the center and surface and a bigger gap in SOC value between particle’s surface and bulk. In this work, we introduced an index, which was the difference between a particle’s surface SOC and average SOC, to represent the content of diffusion polarization. G3 (cathode NCMA/LMFP = 8:2) cell was investigated in this part because it shows the largest rate capability difference in charge and discharge processes. To distinguish the difference between the cathode and anode, in this part, we defined the cathode in fully lithiation status and anode in fully de-lithiation status as an SOC value of 1. The analysis started from the discharge process as shown in
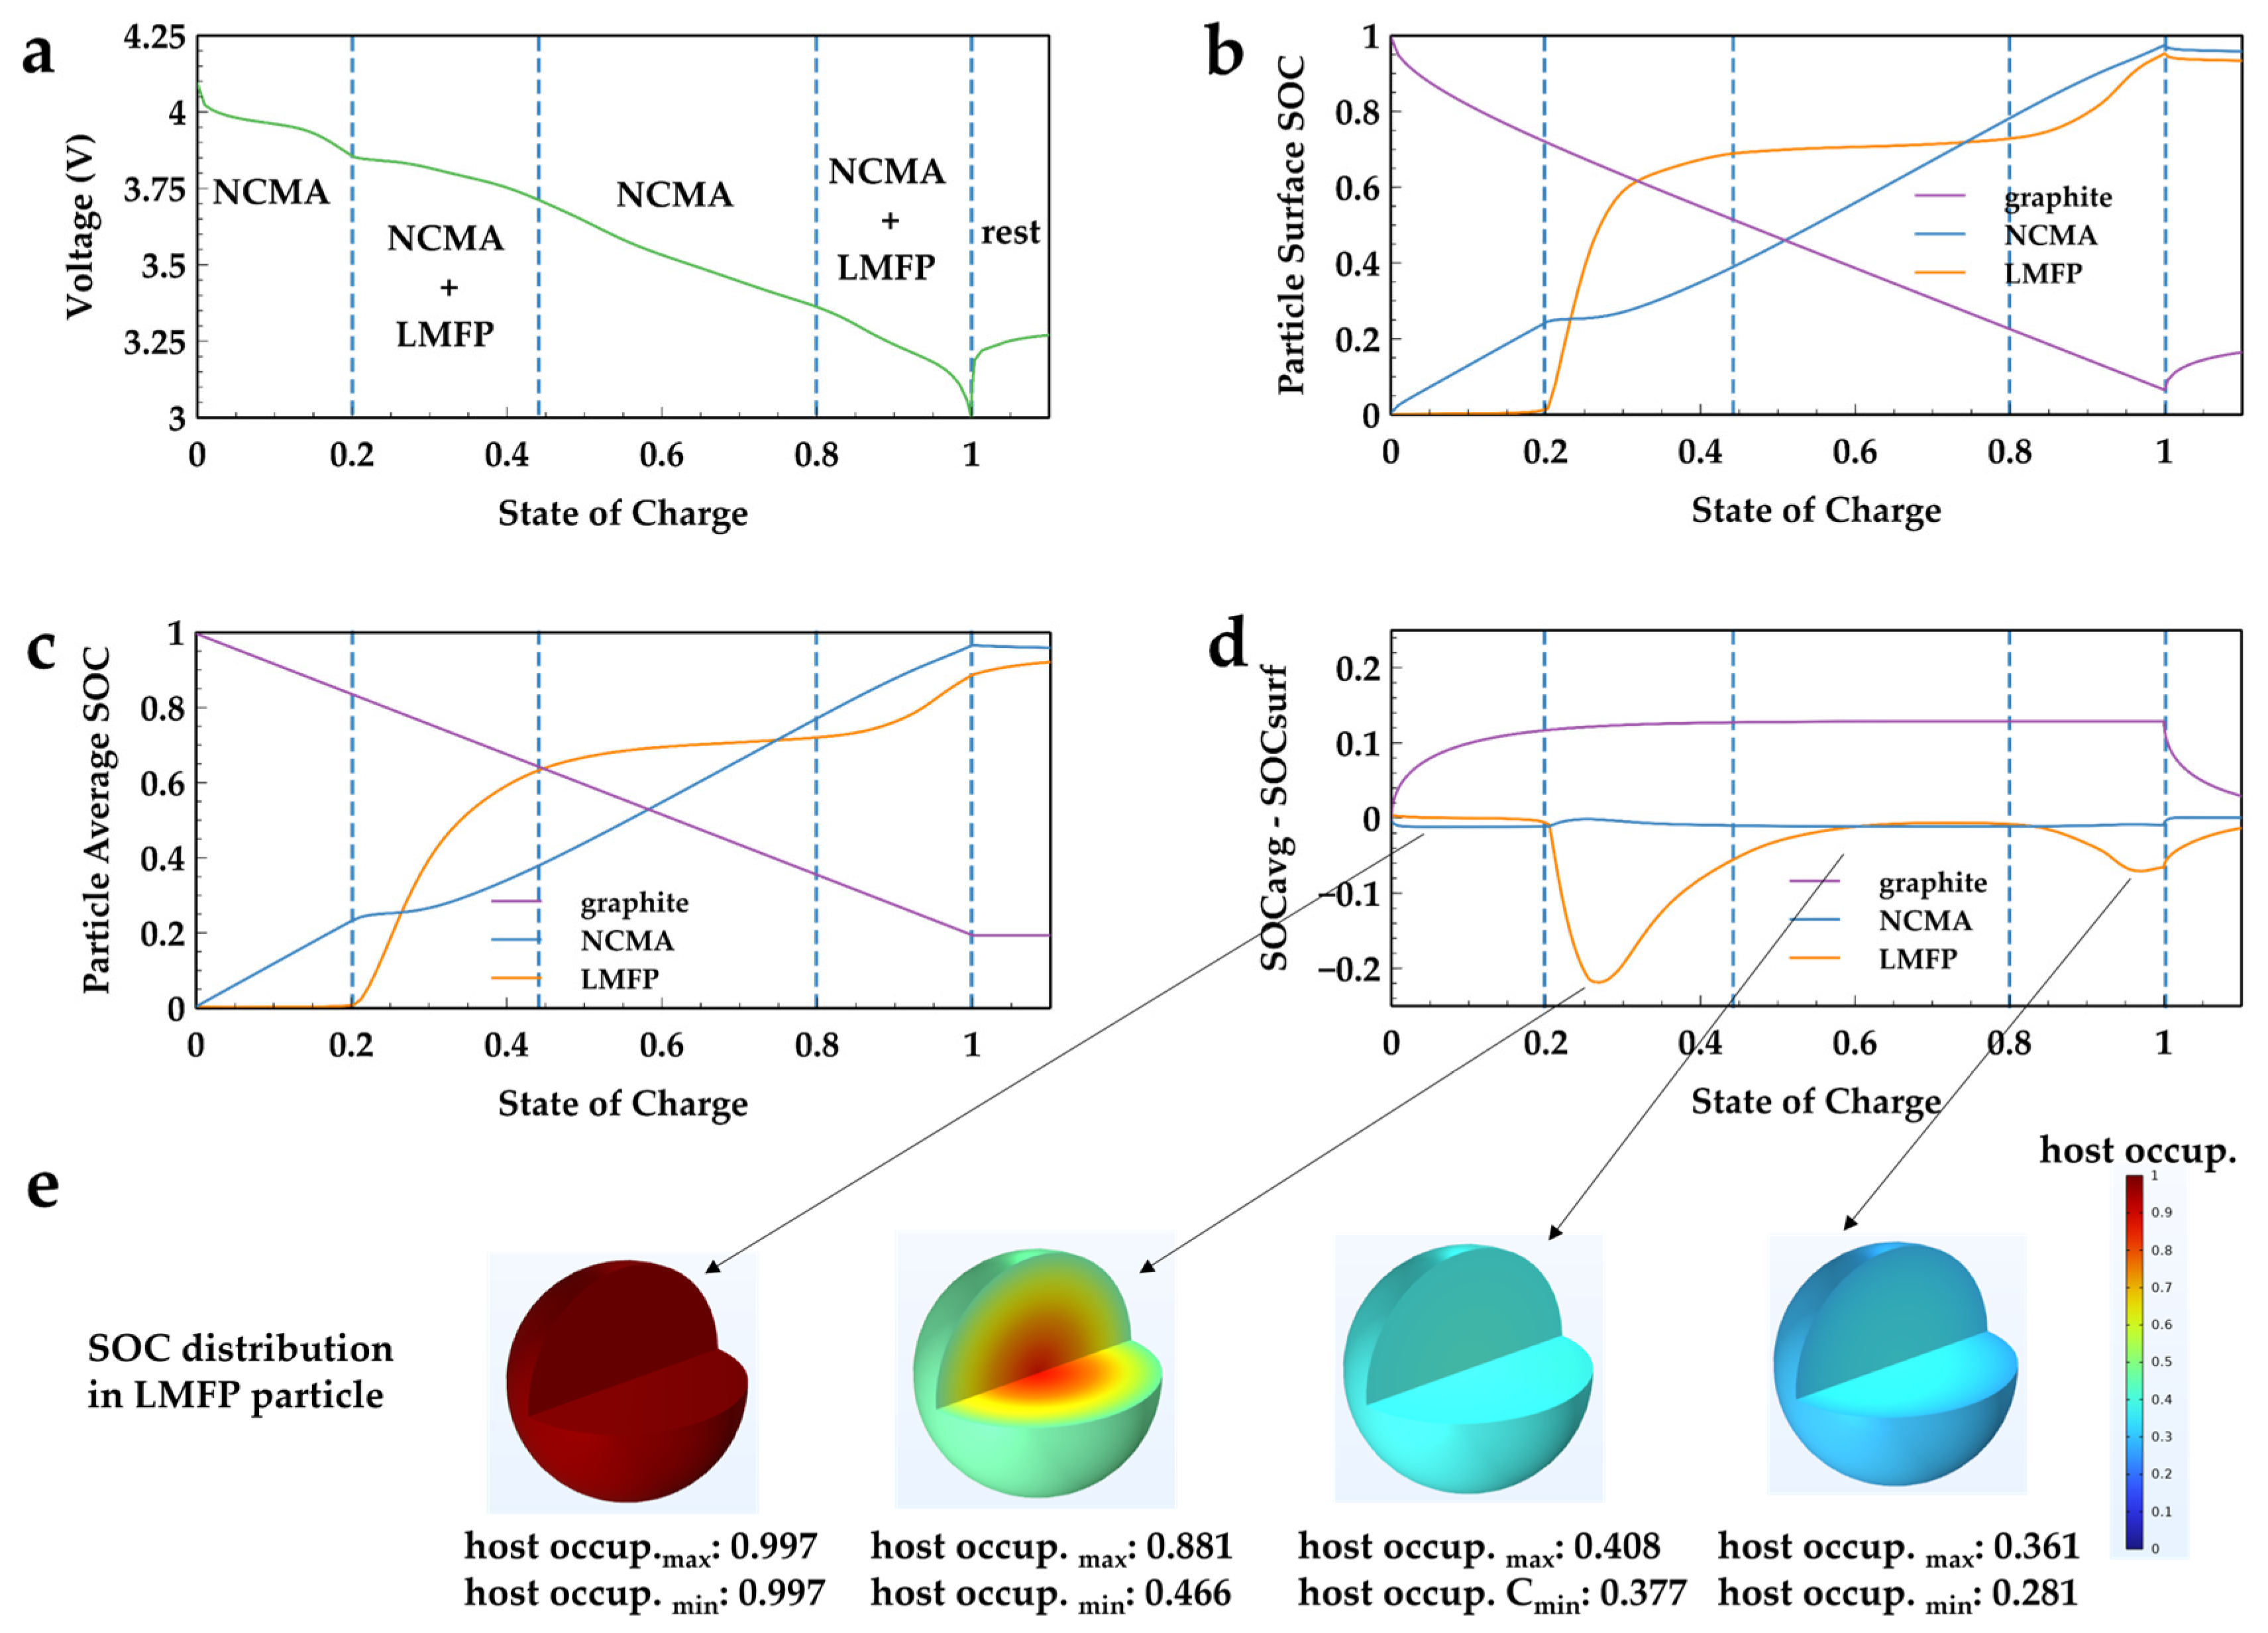
Figure 11. In
Figure 11a, the voltage profile of G3 was different from G1, with barely NCMA as cathode, for it had two relatively flat regions corresponding to SOC range 0.2–0.45 and 0.85–1, where LMFP contributed more capacity in these regions than the rest. This is more obvious in active materials’ average SOC change profile in
Figure 11c. LMFP’s SOC did not increase when the discharge process started; it began to rise after the full cell’s SOC reached 0.2 and stopped at around 0.45 full cell’s SOC. LMFP’s SOC remained stable in the afterwards region until the full cell’s SOC reached 0.85, followed by a continues raise until the end of discharge. According to the voltage profile in
Figure 11a and LMFP’s OCV profile in
Figure 5b, it is easy to identify that the first discharge stage of LMFP corresponded to Mn redox and the second was due to Fe redox. In contrast, NCMA material experienced a continuous discharge in the whole discharge process, but its SOC change was not always as linear as graphite because LMFP joined discharge intermittently. Another interesting phenomenon was, at the end of discharge in
Figure 11c, tracking the average SOC of graphite, it stopped changing and remained as a flat line because there was no more Li ion going out from the graphite particles. However, the average SOC of NCMA and LMFP kept changing as NCMA dropped a little bit when LMFP rose, which means that there is Li-ion exchange between NCMA and LMFP particles; NCMA gave parts of its Li ion to LMFP due to their voltage variation.
Therefore, the total discharge part was separated into four stages, according to LMFP SOC change, as stage I and III: NCMA discharging and stage II and IV: NCMA + LMFP discharging. The diffusion polarization in these four stages was valued by the difference between the active material particles’ surface SOC and average SOC in
Figure 11d. In stage I, SOC difference in LMFP kept near to 0 as the value in NCMA and graphite increased, indicating that Li-ion intercalation and de-intercalation mainly happened between NCMA and graphite, respectively. In stage II, it was observed that SOC difference in LMFP sharply increased in the beginning while the value in NCMA dropped a little bit, meaning that LMFP joined to discharge. SOC difference in LMFP then slowly decreased back to 0 in later stage II and stage III, meaning that LMFP removed its load and experienced a “rest” period, as usually observed at the end of discharge. In the final stage, SOC difference in LMFP increased again until the end of discharge, representing its second part of discharge. The SOC difference of the LMFP particle is also plotted in the sphere section in
Figure 11e to show the gradient from particle center to surface. Two interesting items worth noting are that (1) SOC difference in LMFP was dramatically larger than that in NCMA, meaning Li-ion diffusion in LMFP was much slower than NCMA; this can be verified by the tested diffusion coefficient shown in
Figure 6d,e; (2) the SOC difference in LMFP in stage IV was much lower than stage II, which is because diffusion polarization is time-dependent in a constant current process and it increased with time. In this work, the formula of LMFP adopted was LiFe
0.3Mn
0.7PO
4; therefore, capacity according to Mn redox was above twice that of Fe redox and the longer discharging time led to higher diffusion polarization. Namely, in the discharge process, we observed the interaction between NCMA and LMFP; LMFP discharged intermittently and ended with a relatively small diffusion polarization. This benefits improving discharging rate, compared to a continuous discharging process.
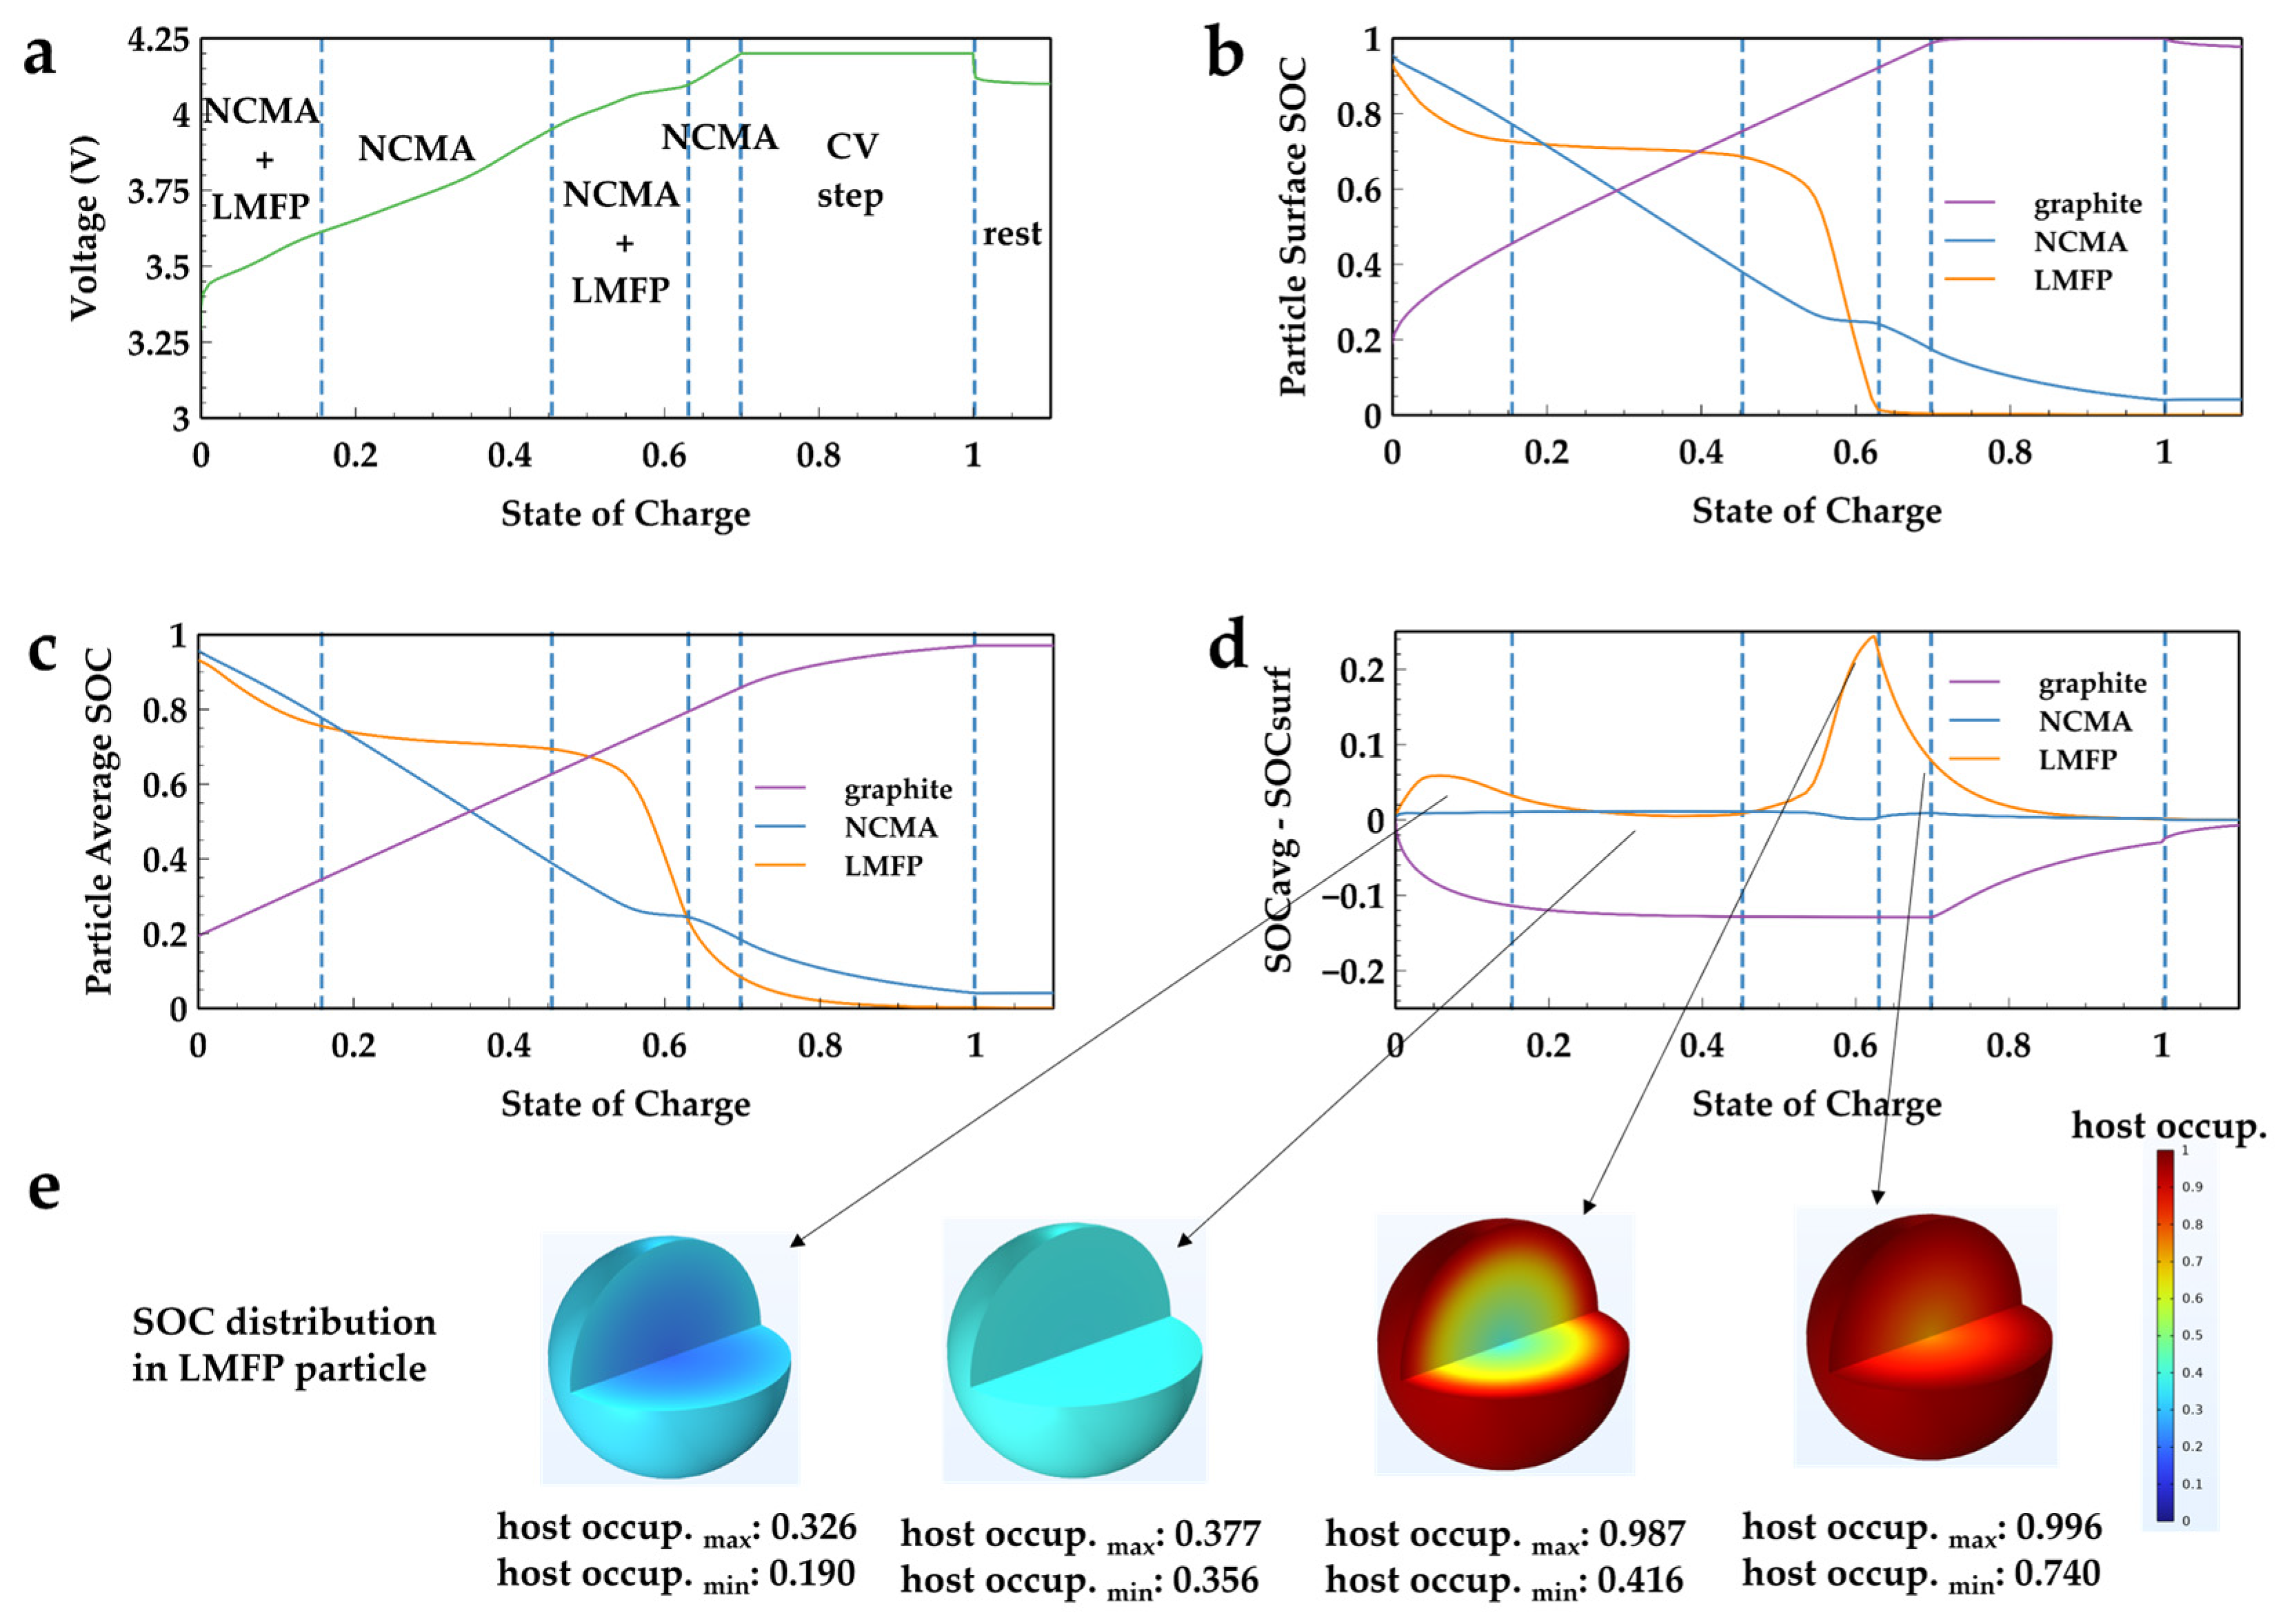
The same analysis was taken on the charging process. Similarly, the charge process could be separated into four stages in a constant current charge stage, followed by constant voltage charge stage. LMFP was charged intermittently in stage I and stage III. Differing from the discharge situation, the high polarization part happened in the third stage of the charge process, leaving not enough time for SOC rebalance before the cell’s voltage hit the cut-off value. Comparing
Figure 11d and
Figure 12d, in stage IV, LMFP ended with higher diffusion polarization in the charge than discharge process. This variation could be bigger in high charging/discharging C-rate. Moreover, diffusion polarization in the graphite side was big as well. Therefore, to improve the rate performance of the chemistry system NCMA/LMFP + Gr, improving Li-ion diffusion coefficient in graphite and LMFP material is the most effective way. A potential method for improving Li-ion diffusion in LMFP could be introducing material with smaller particle size and bulk doping.


