Article

Channel-to-Rib Width Ratio Optimization for the Electrical Performance Enhancement in PEMFC Based on Accurate Strain-Stress Simulation

Guangdong Provincial Key Laboratory on Functional Soft Condensed Matter, School of Materials and Energy, Guangdong University of Technology, Guangzhou 510006, China
*
Author to whom correspondence should be addressed.
Energies 2024, 17(3), 762; https://doi.org/10.3390/en17030762
Submission received: 6 January 2024 / Revised: 26 January 2024 / Accepted: 3 February 2024 / Published: 5 February 2024
(This article belongs to the Section D2: Electrochem: Batteries, Fuel Cells, Capacitors)

Abstract

:
Although a large channel-to-rib width ratio (CRWR) of the bipolar plate (BP) leads to a large electrical performance of PEMFC, an excessive CRWR leads to excessive pressure and destroys the gas diffusion layer (GDL), thus reducing the electrical performance of PEMFC. Revealing the relationship between the CRWR and GDL is of urgent necessity for improving the electrical performance of PEMFC. In this study, a three-dimensional model of PEMFC incorporating the compressed neo-Hookean theory is developed to accurately depict the stress-strain relationship. Compared with the traditional model incorporating the linear-elastic theory, the current density deviation of the proposed model is decreased from 9.81% to 2.55%. The correlation among CRWR of BP, stress, strain, and elastic modulus of GDL is fitted. The average stress deviation of the correlation from the simulated data is 3.41%. Based on the correlation, when the compressive strength of GDL is 2.5 MPa, the peak permissible CRWR is achieved at 2.91, indicating the peak value of CRWR without damaging the GDL structure. A power density enhancement of 29.04% compared to the conventional case is achieved. The strategies of this study can be used to guide the design of the channel of bipolar plates and enhance the power density of PEMFC.

1. Introduction

Proton Exchange Membrane Fuel Cell (PEMFC) has garnered significant attention as a promising green energy device, attracting extensive research efforts [1,2]. The commercial viability of PEMFCs depends on their electrical performance, stability, and durability. Improving the power density of fuel cells has an important driving effect on their application [3,4]. Figure 1a gives a schematic illustrating the components of PEMFC. Among these components, the bipolar plate (BP) is a focal point for many researchers because the structural design of BP has a significant impact on the electrical performance of PEMFC [1]. The BP is composed of the gas channel (GC) and the rib. The coupling effect between the BP and the gas diffusion layer (GDL) has a significant impact on the heat and mass transfer behavior of fuel cells. During the assembly process of PEMFC, a compressive force is applied to ensure the sealing of the structure. As known, the GDL is the thickest porous layer in the membrane electrode assembly (MEA) and possesses the lowest elastic modulus within the MEA [5]. Consequently, the GDL is susceptible to deformation and damage under high compressive forces. This deformation can cause the GDL under the GC to intrude into the GC, thereby altering the heat and mass transfer characteristics within the PEMFC [6]. As one of the essential components, the GDL plays the role of draining water out of the catalyst layer (CL) and providing enough gas pathways. The large-scale commercialization of PEMFCs requires higher power and current densities; however, at high operating current densities, the massive accumulation of liquid water in the GDL will lead to flooding and impede gas diffusion, resulting in rapid degradation of cell performance [7]. Accordingly, improving GDL’s water management ability is imperative for pursuing better cell output. The output performance of PEMFC is significantly affected by the heat and mass transfer behaviors of GDL. Thus, investigating the relationship between the GC and the output performance of PEMFCs under GDL deformation holds great importance.
The channel-to-rib width ratio (CRWR, the channel width divided by rib width) is usually used to describe the relation between the GC and rib [8]. Researchers have focused on improving the electrical performance of PEMFCs by optimizing CRWR. Acar et al. [9] investigated the temperature distribution in a fuel cell under five CRWRs (0.33, 0.6, 1, 1.66, and 3). They found that the highest temperature distribution uniformity was achieved at CRWR = 3, leading to a high heat stability of the fuel cell. Pan et al. [10] found that the optimal electrical performance and oxygen utilization rate were achieved at CRWR = 2.4 among five CRWRs (0.8, 1.2, 1.6, 2, and 2.4). Qiu et al. [11] found that the best electrical performance was achieved at CRWR = 3 among seven CRWRs (0.09, 0.14, 0.33, 0.6, 1, 1.67, and 3). Zeng et al. [12] optimized the CRWR to maximize the power density. They found that the power density of the fuel cell in the optimized case (CRWR = 1.45) was 8.09% higher than that in the conventional case of CRWR = 1. These researchers investigated the CRWR from the perspective of fuel cell electrical performance, heat, and mass transfer characteristics. Large CRWR implies better heat and mass transfer characteristics and higher electrical performance. However, large CRWR signifies large GDL stress, and excessive CRWR may destroy the structure of GDL. This brings the necessity of investigating the stress behavior exerted on the GDL.
The material properties of GDL play a crucial role in the assembly of BP and GDL. In the deformation of GDL, the elastic modulus, strain, and stress of GDL are the key parameters. The elastic modulus of GDL is related to the type of GDL. The strain of GDL is represented by compression ratio (CR). The CR serves as an indicator of sealing performance since different component materials and types of GDL have different stress-strain properties [13,14]. A large CR of GDL indicates a better sealing performance of PEMFC. The stress of GDL is proportional to the elastic modulus and strain of GDL. Moreover, the stress of GDL is inversely proportional to compressive area. The compressive area of GDL is dependent on CRWR. When the CRWR increases, the compressive area of GDL decreases. When the stress of GDL is larger than the compressive strength of GDL, the GDL breaks. Simon et al. [14] and Mason et al. [15] found that most of Toray’s GDLs experienced structural collapse under compressive stresses of 2.5 MPa by experiment. Excessive compressive stress causes GDL fibers to break, leading to structural damage to the GDL. These broken fibers may puncture PEM, allowing hydrogen to cross and form a short circuit. Excessive compressive stress causes irreversible structural damage to GDL, which affects its porosity, thickness, electrical resistance, and gas permeability [16]. Niblett et al. [17] found that a broken GDL attenuates the mass transfer properties within the PEMFC, leading to an increase in concentration polarization. The electrical performance of PEMFC is reduced when the GDL is broken. Yu et al. [18] measured the power density of PEMFC and provided scanning electron microscope images of GDL when the GDL is broken/unbroken. They found that the peak power density of broken GDL was 33.33% lower than that of unbroken GDL. Moreover, Kang et al. [19] found that the peak power density of broken GDL was 30.43% lower than that of unbroken GDL in their experiment study. Therefore, it is necessary to capture the broken conditions of the GDL exactly for cell performance analysis, which requires an accurate mechanical relationship between GDL and BP.
To accurately describe the mechanical relationship between GDL and BP structures, many researchers have developed mathematical models to investigate the structure and electrical performance of PEMFC. The traditional approach is to use the linear-elastic theory to describe the stress-strain relationship between the GDL and the BP [5] and then combine it with the electrochemical, heat, and mass transfer models of the PEMFC for simulation and analysis. The porosity, conductivity, and gas diffusion coefficient of GDL are determined by the CR of GDL, which significantly impacts the heat and mass transfer behavior of PEMFC [20]. Zhou et al. [21] used a linear-elastic model to simulate the performance of the PEMFC of GDL at different stresses and found that the polarization curves for the case of a stress of 1 MPa were closest to the experimental data. The average current density deviation of their model from an experiment was 8%. In 2021, Zhang et al. [5] proposed a linear-elastic model to analyze the relationship between the CR of the GDL and the electrical performance of the PEMFC, and the polarization curves of their simulations deviated from the experimental data by 7.8%. Chen et al. [20] used a linear-elastic model to investigate the effect of GDL on heat and mass transfer behavior under different CRs and stress conditions. The polarization curves of their simulations deviated from the experimental data by 6%, but they ignored the concentration loss in the polarization curve, resulting in limited applicability. Other researchers have described the deformation of GDL based on linear-elastic theory, and the average current density deviations of their simulation from experimental data were 9.3% [22] and 7.3% [23], respectively. Therefore, using the linear-elastic theory to describe the deformation of GDL leads to a significant current density deviation of simulation from the experiment.
However, Zhang et al. [24], Meng et al. [25], and Yan et al. [26] revealed through mechanical experiments that GDL is a nonlinear-elastic material. The nonlinear deformation of GDL is a complex phenomenon, including carbon fiber slip, fracture, and elastic-plastic deformation [27]. The nonlinear-elastic theory is more accurate for describing the stress and strain of GDL than the traditional linear-elastic theory. Xiao et al. [28] proposed an improved nonlinear-elastic model applicable to carbon paper GDL and verified it experimentally. They found that the average stress deviation of mechanical simulation from the experiment at a GDL porosity of 0.75 was reduced from >35% to 15%, using nonlinear-elastic theory. In 2023, Afrasiab et al. [29] proposed a correction factor for describing the nonlinear deformation of GDL based on the Timoshenko beam theory in the macroscopic case and showed that the average stress deviation of the simulation from the experiment was 10%. However, they focused on the mechanical properties of the ex-situ GDL (without PEMFC assembly), which is different from the in-situ GDL (with PEMFC assembly). Besides, some researchers coupled the nonlinear-elastic theory with the PEMFC model to investigate the effect of the stress-strain of GDL on the performance of PEMFC. Li et al. [30] applied a nonlinear-elastic theory in the in-plane direction and through-plane direction of GDL and found that the average current density deviation of the simulation from the experiment was 6.5%. Yan et al. [26] investigated the deformation of GDL using a nonlinear-elastic theory and found that the average current density deviation of the simulation from the experiment was extremely small. However, they did not consider the impact of stresses on the GDL. The maximum compressive stresses of the GDL in their experiments were 5.0 MPa [30] and 3.5 MPa [26], which may damage the GDL structure [31].
Despite the impressive research on the elastic theory of GDL deformation, a comprehensive investigation of the CRWR of BP, elastic modulus, strain, and stress of GDL is necessary for improving the electrical performance of PEMFC. In this study, a three-dimensional PEMFC model incorporating nonlinear-elastic theory is proposed and validated. It can be used to calculate the GDL mechanical parameters and the corresponding fuel cell electrical performance for different CRWR cases. The mechanical, electrochemical, heat, and mass transfer behaviors of the PEMFC during the assembly process are solved using COMSOL Multiphysics. Stress-strain analysis is used to reveal the correlation among CRWR of BP, stress of GDL, strain of GDL, and elastic modulus of GDL. Based on the correlation, specific GC shapes are established to analyze the quantitative relationship among electrical performance, heat, and mass transfer behaviors inside PEMFC.

2. Methods

In this study, a three-dimensional, steady-state, and non-isothermal PEMFC model is developed. The PEMFC model consists of several parts. Section 2.1 describes the mechanical model of GDL. Compared with Hooke’s law in the traditional model, the mechanical behavior of the GDL is modeled based on the compressed neo-Hookean theory [32]. Section 2.2 involves the electrochemistry and charge conduction within the PEMFC. The Nernst equation and Butler-Volmer equation are employed to represent the electrochemical reactions and charge transport processes [33]. Section 2.3 describes the flow, heat transfer, and mass transfer phenomena in the PEMFC. This is accomplished through the utilization of the Navier-Stokes equation, Brinkman equation, Newton’s law of cooling, and Fourier’s law of heat conduction [34].
This study is based on the following assumptions:
  • The strain of components is ignored except for GDL;
  • All gases follow the ideal gas equation;
  • All water is in the vapor state;
  • The compressive force of PEMFC is perpendicular to the BP;
  • All flowing states are laminar;
  • All structures of PEMFC are integral.

2.1. Mechanical Model of GDL

To describe the deformation process of GDL, the linear-elastic and nonlinear-elastic model of GDL is established in this section. Figure 2 gives the schematic diagram of rectangular GC (CRWR = 1) and trapezoidal GC (CRWR > 1). Due to space limitations, only the anodic side of the PEMFC is shown in Figure 2. In Figure 2, a is the groove width of GC. c is the height of GC. b is the top width of GC. d is the rib width of GC. In rectangular GC, a = b = c = 1 mm. In trapezoidal GC, the area of GC is 1 mm2 [35]. The height of rectangular and trapezoidal GC is equal. The GDL region deformed when compressive force was applied. The GDL under the rib is compressed, and the GDL under the GC is uncompressed. Therefore, the GC is invaded by the GDL deformation. The invasion in GC from GDL changes the distribution of heat and mass transfer of GC. To facilitate comparison between different cross-sectional shapes of GCs, the cross-sectional areas of the GCs are designed to be equal. In this study, the cross-sectional area of GC is 1 mm2, including the area that is invaded, and the height of cross-sectional GC is 1 mm [5,36].
As a traditional approach, the linear-elastic theory is used to describe the stress-strain of GDL. In this study, Hooke’s law, as the linear-elastic theory, is described by Equation (1), where δ is the stress, Y is Young’s modulus, and St is the strain. The force balance for GDL is formulated by Equation (2), where fv is the force in the vertical direction.
δ = Y · S t  
0 = · δ + f v  
Notably, some researchers pointed out that GDL is a nonlinear-elastic material [24]. In many nonlinear-elastic theories, neo-Hookean theory is adopted to describe the stress-strain behavior of GDL in the PEMFC assembly [32]. The neo-Hookean theory is introduced in this study to develop the model.
The material properties of the PEMFC component are shown in Table 1 [21,33,35]. The conservation of volume force is described by Equation (3). P is the first Piola–Kirchhoff stress, which is determined by Equation (4). Fv is the volume force vector. The superscript T means matrix transposition. F is the deformation gradient tensor, which is determined by Equation (5), where I is the unit matrix, and u is the displacement. S is the second Piola–Kirchhoff stress, which is described by Equation (6), where Sinel is the inelastic stress tensor, and Ws is the strain energy density.
0 = · P T + F v  
P = F · S    
F = I + u    
S = S i n e l + W s ϵ    
In the neo-Hookean theory, the Cauchy stress is determined by Equation (7). The elastic volume ratio is described by Equation (8). The elastic Green-Lagrange strain is determined by Equation (9). Table 2 gives the geometric dimensions of PEMFC components [34]. The dimensions of PEMFC components selected in this study are based on the experiment [34], which is used to validate the model proposed in this study. In addition, as a case study, keeping the consistency with an experiment is a reasonable approach [37,38,39].
σ = J 1 P F T    
J = det F    
ϵ = 1 2 F T F I    
In addition, analogical reasoning is a logical approach in the development of the ontological theory of GDL. The study and analysis of GDL usually start from its structural composition, which is a porous structure consisting of many longer fibers piled up and sintered. In 2023, Afrasiab et al. [29] proposed a modification factor for describing the nonlinear deformation of GDL based on the Timoshenko beam theory for the macroscopic case. From the analogical reasoning point of view, the fibers of GDL are like some beams; therefore, they used the Timoshenko beam theory in the macroscopic case to describe the deformation between the individual fibers of GDL. The average stress deviation of their simulation from mechanical experiments is about 7%. In 2021, Meng et al. [25] used the micro-mechanical theory of fiber to describe the stress-strain of GDL, and they started from the deformation of a single-bent fiber to establish an intrinsic model. From the analogy point of view, the long-bent fiber is closer to the real structure of GDL. As a result, the minimum average stress deviation of the results of the ontological model from the experiments is 5.30%.
The GDL is a porous structure sintered by the stacking of many layers of fine fibers, and if it is simply a stacking of fibers, then the structure can be analogized to the Timusingo beam theory or the micro-mechanical theory of fiber. However, the fibers of GDL are tightly connected, not only compressing each other but also pulling each other. In 2021, some scholars described the deformation damage of GDL based on the uncompressed neo-Hookean theory [40]. However, they did not explain why they chose this theory. The neo-Hookean theory is modeled based on long-chain polymers of rubber materials. Since rubber is an incompressible material, the uncompressed neo-Hookean strain energy equation is shown in Equation (10). Since GDL is made of many fibers that are stacked and sintered, this is very similar to the relationship between the long chains that make up rubber, but the difference is that GDL is compressible while rubber is incompressible. In order to extend the applicability of the neo-Hookean theory, in 2003, Attard [41] proposed the compressed neo-Hookean theory with the strain energy equation as in Equation (11). Notably, based on the principle of analogy, this study envisions that the compressed neo-Hookean theory can be used to describe the strain of GDL. Jel is the elastic volumetric deformation [41]. Lamé parameters μ and λ are determined by Equation (12) and Equation (13), respectively. I1 is the first invariant of the elastic right Cauchy–Green deformation tensor. Compared to the uncompressed neo-Hookean theory, the compressed neo-Hookean theory incorporates two deformation terms in the strain energy formulation of the original uncompressed neo-Hookean theory [41]. In addition, the traditional elastic strain energy is determined by Equation (14).
W s = 1 2 μ I 1 3
W s = 1 2 μ I 1 3 μ ln J e l + 1 2 λ ln J e l 2    
μ = Y 2 1 + ν p
λ = ν p Y 1 + ν p 1 2 ν p
W s = 1 2 δ · S t
To analyze the electrochemistry, heat, and mass transfer behavior of PEMFC, the models of charge conduction, electrochemistry, flow, heat, and mass transfer are established in the rest section of Methods.

2.2. Electrochemistry and Charge Conduction of PEMFC

To establish the model of electrochemistry and charge conduction of PEMFC, the Nernst equation, Bulter-Volmer equation, and Ohm’s law are adopted in this section. The electrochemical reaction of PEMFC is described by Equation (15).
H 2 g + 1 2 O 2 g H 2 O l  
The reversible potential of the electrochemistry is described by the Nernst equation as formulated by Equation (16), where R is the ideal gas constant, T is the operating temperature of PEMFC, pH2 is the partial pressure of hydrogen, pO2 is the partial pressure of oxygen. pref is the reference pressure, which is 1 atm. Eeq,ref(T) is the balance potential at reference temperature, which is determined by Equation (17).
E e q = E e q , r e f T R T n F F C · ln p H 2 p r e f p O 2 p r e f 0.5    
E e q , r e f T = Δ G n F F C    
The electrochemical reaction in PEMFC can split into two semi-reactions, namely, the hydrogen oxidation reaction (HOR) in the Anodic catalyst layer (ACL) and the oxygen reduction reaction (ORR) in the Cathodic catalyst layer (CCL). Both of the semi-reactions are determined by the Bulter-Volmer equation as formulated by Equation (18).
i a n i c a t h = i 0 , a n · exp α a F F C η R T exp α c F F C η R T   ,   for   HOR i 0 , c a t h · exp α a F F C η R T exp α c F F C η R T   ,   for   ORR    
The anode/cathode current density is determined by Equation (19), where vi is the stoichiometric coefficient of the reacting species of index i. The anode/cathode reference exchange current density is io,ref,an = 100 A m−2, io,ref,cath = 1 × 10⁻⁴ A m−2. η is the activation loss, which is determined by Equation (20). The ΔΦ is the Galvanic potential of the electrons and protons, which is equal to the difference between the electron potential and the proton potential. Φ0 is the reversible potential difference, which is determined by Equation (21). The ΔS is the total reaction entropy, which is equal to the sum of ΔSHOR and ΔSORR.
i 0 , a n i 0 ,   c a t h = i 0 , r e f , a n · p H 2 p r e f α c ν i η a n · p O 2 p r e f α a ν i η a n ,   for   anode i 0 , r e f , c a t h · p H 2 p r e f α c ν i η c a t h · p O 2 p r e f α a ν i η c a t h ,   for   cathode    
η a n η c a t h = Δ ϕ Δ ϕ 0 Δ ϕ 0 Δ ϕ    
Δ ϕ 0 , H O R Δ ϕ 0 , O R R = T Δ S H O R 2 F F C R T 2 F F C ln p H 2 p r e f Δ H T Δ S O R R 2 F F C + R T 4 F F C ln p O 2 p r e f    
Lampine and Fomino [42] proposed that ΔSHOR = 0.104 J mol−1 K−1 and ΔSORR = −163.3 J mol−1 K−1. The enthalpy change of water is ΔH = −285.83 kg mol−1 under 25 °C and 1 bar [43].
In addition, the partial pressure of hydrogen is described by Equation (22). The partial pressure of steam is described by Equation (23). The saturated vapor pressure of water is described by Antonie equation as formulated by Equation (24) with a temperature scope of 50–100 °C [36].
p H 2 = 1 p H 2 O p a n p a n    
p H 2 O = R H · p s a t T    
p s a t T = exp 23.1963 3816.44   K T 46.13   K    
There are two types of charge conduction: proton conduction and electron conduction. Proton conduction involves the ionomer area (catalyst-coated membrane, CCM), while electron conduction involves all components except PEM. The charge conduction is described by Ohm’s law. Ohm’s law for electrons is determined by Equation (25), where σe is the electronic conductivity. Ohm’s law for proton is determined by Equation (26), where σp is the protonic conductivity.
· σ e   ϕ e = S e = i a n ,     In   ACL   i c a t h ,     In   CCL    
· σ p   ϕ p = S p = i a n ,     In   ACL i c a t h ,     In   CCL    
As for PEM in this study, the physical data of PEM is from Nafion, EW 1100 [44,45,46]. The specific surface area of the anode activity is determined by Equation (27) [44]. mpt = 0.3 mg cm−2 [34]. As = 11 m2 g−1 [46]. The platinum loading of the CCL is three times that of the ACL.
a a n = m P t A s L c l 1 ϵ c l    

2.3. Flow, Heat, and Mass Transfer of PEMFC

The flow of coolant water in the cooling channel is described by the Navier-Stokes equation as formulated by Equation (28). The viscous stress tensor is determined by Equation (29). β is described by Equation (30), where cF is the Forchheimer parameter.
0 = · p c · I + K μ · κ 1 + β · ρ · u f + Q m ϵ p 2 · u f + F v    
K = μ ϵ p u f + u f T 2 3 · μ ϵ p · u f · I    
β = c F κ    
The hydrogen, oxygen, and water transfer behavior in a porous medium is determined by the Brinkman equation as formulated by Equation (31). The heat transfer between fluid and solid is determined by Equation (32) [47]. The heat conduction of PEMFC is described by Fourier’s law of heat conduction Equation (33).
· ρ · u f = Q m    
ρ · C p · T t + u f · T + · q c o n d = τ : u f + Q    
q c o n d = k · T    
In addition, the thermal conductivity of compressed GDL is determined by Equation (34), where kuncomp,GDL is the thermal conductivity of uncompressed GDL. The porosity of compressed GDL is determined by Equation (35), where εGDL is the porosity of uncompressed GDL [5]. The gas permeability of compressed GDL is determined by the Carmen-Kozeny equation as formulated by Equation (36), where Dr = 7 × 10⁻⁶ and Ck = 6.
k c o m p , G D L = 2 k u n c o m p , G D L 1 ϵ c o m p , G D L 2 + ϵ c o m p , G D L    
ϵ c o m p , G D L = ϵ G D L C R 1 C R    
κ c o m p = D r 2 × ϵ c o m p , G D L 3 16 × C k 1 ϵ c o m p , G D L 2    
The coolant medium is pure water. The operating parameters are shown in Table 3 [5,35,46].

3. Results

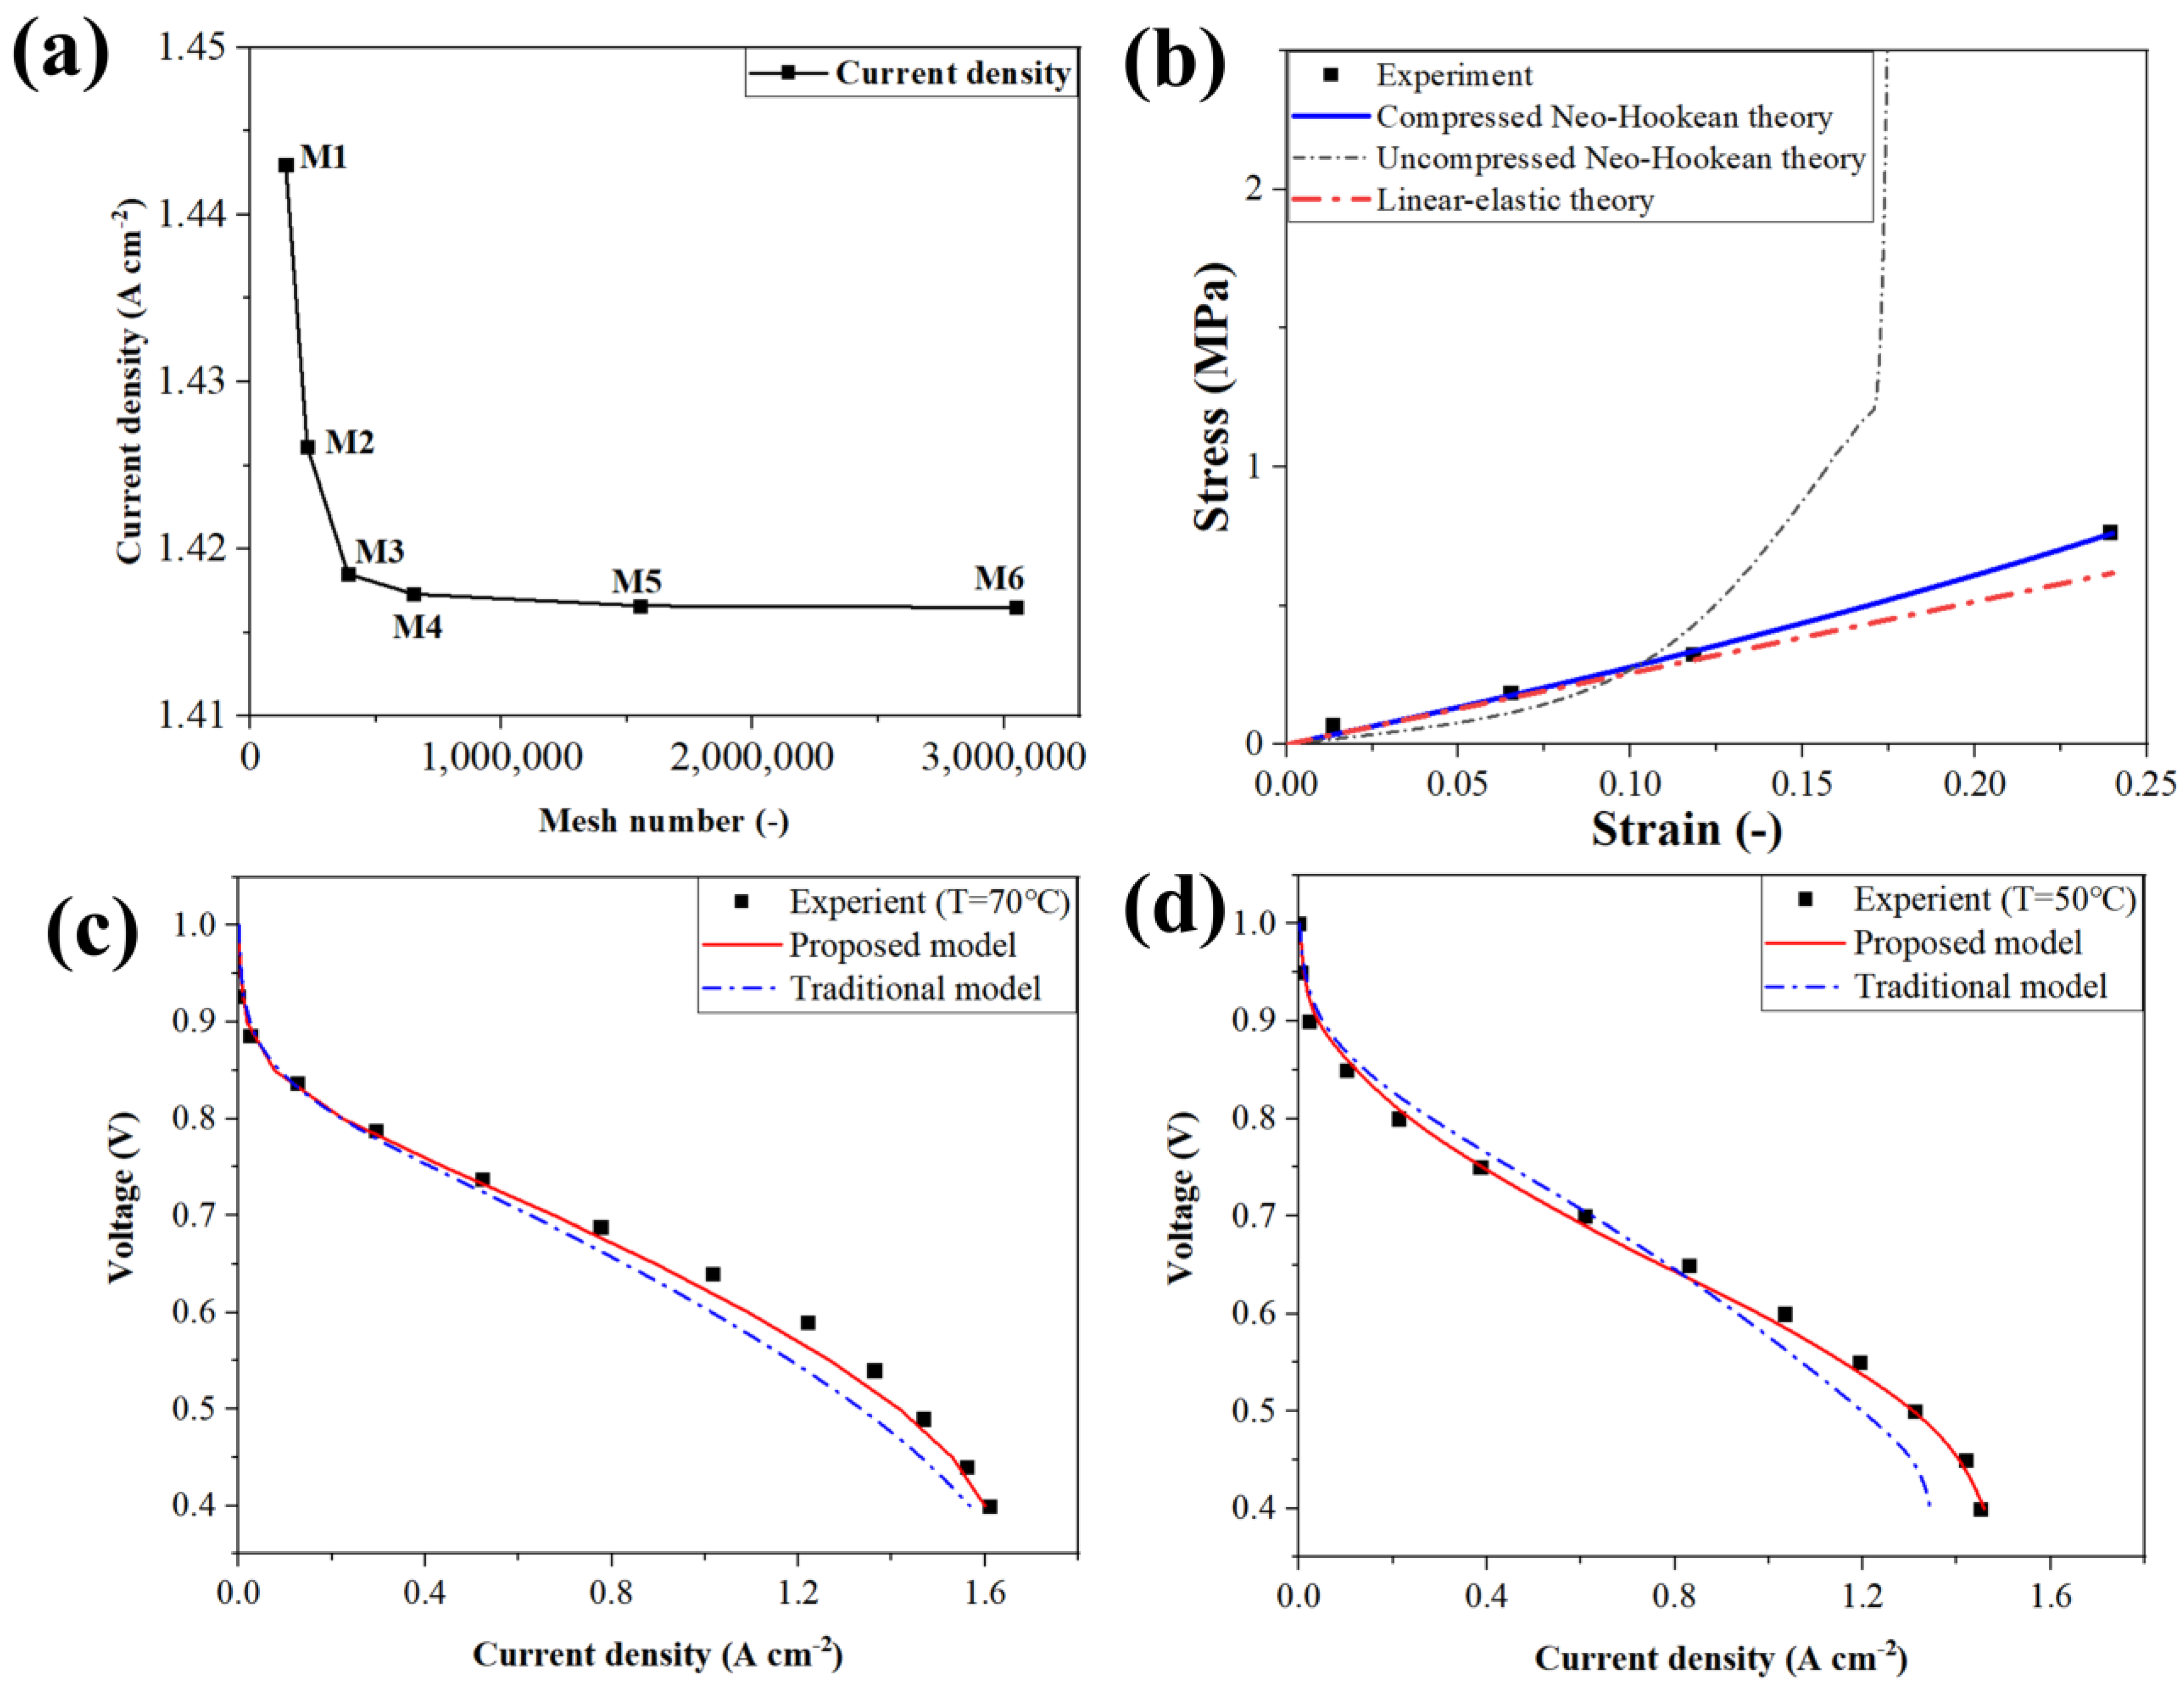
3.1. Mesh Independence and Model Validation

To simulate the mechanical, electrical, heat transfer, and mass transfer behaviors of PEMFC, the present models are built and solved by COMSOL Multiphysics 6.0. Half of PEMFC is calculated because the PEMFC structure is symmetric. The prefixes A and C mean the Anode and Cathode side, respectively. To minimize the impact of the meshing schemes on the accuracy of the calculation results, six meshing schemes of the PEMFC are proposed, as shown in Figure 1b,c. The current density and power density of these six schemes are calculated and compared at a voltage of 0.5 V. The operating parameters are shown in Table 3. Figure 3a gives the results of the mesh schemes. The relative error of current density between scheme M3 and scheme M4 is lower than 0.05%. The relative error of current density between scheme M4 and scheme M5 is lower than 0.01%. The simulated result of using scheme M4 has little impact on the calculated accuracy. Therefore, scheme M4 with 651,463 elements is adopted for the subsequent simulations.
To compare the stress of GDL using different mechanical theories, Figure 3b presents the comparisons of simulation results among the compressed neo-Hookean theory, uncompressed neo-Hookean theory, linear-elastic theory, and previous experiments [29,48]. The average stress deviations from the experiment for the simulation based on the compressed neo-Hookean theory and the simulation based on linear-elastic theory are 1.38% and 14.26%, respectively. In Figure 3b, the average stress deviation of uncompressed neo-Hookean theory from the experiment is 35.24% at a strain less than 0.12. However, the average stress deviation of the uncompressed neo-Hookean theory from the experiment is huge (>200%) when the strain of GDL is greater than 0.12. Then, compared with the uncompressed neo-Hookean theory and the linear-elastic theory, the compressed neo-Hookean theory is more accurate for describing the stress-strain of GDL.
To validate the PEMFC models, Figure 3c,d demonstrate the comparisons of simulation results among the proposed PEMFC model, the traditional PEMFC model, and previous experiments conducted at different operating temperatures [34]. In Figure 3c, the average current density deviation of simulation using the nonlinear-elastic approach (proposed model) from the experiment is 2.55%. The average current density deviation of simulation using the linear-elastic approach (traditional model) from the experiment is 9.81%. In Figure 3d, the deviation from the experiment for the simulation using the proposed model and the simulation using the traditional model is 3.42% and 10.87%, respectively. These findings prove that the proposed model in this study is more accurate than the traditional model.

3.2. Comparison of Structural, Heat, and Mass Transfer Parameters with and without GDL Degradation

The GDL structure in the models is assumed to be unbreakable. To prove the significance of the structural integrity of GDL to PEMFC’s electrical performance, the structural, heat, and mass transfer parameters from simulation and experiment are compared. Porosity, thermal conductivity, and gas permeability are selected to evaluate the structural, heat transfer, and mass transfer behaviors of GDL, respectively. Previous data is selected to assess the deviation of the model from the experiment after the GDL collapse. Radhakrishnan and Haridoss [16] compared the porosity of GDL (from TGP-H-120 [48]) under a compressive force of 1.7 MPa and 3.4 MPa by experiment. They found that the GDL is unbroken under 1.7 MPa compressive force (CR of GDL is 13%), and the GDL is broken under 3.4 MPa compressive force (CR of GDL is 23%). Then, the experiment data of TGP-H-120 [17,49] is used to validate the significance of the structural integrity of GDL in this study. The effective porosity and thickness of uncompressed GDL are 0.73 and 0.37 mm, respectively [16]. Table 4 gives the simulation results. When the GDL structure is broken, the porosity, thermal conductivity, and gas permeability are drastically changed. Therefore, the PEMFC model is not suitable for situations where GDL is broken.

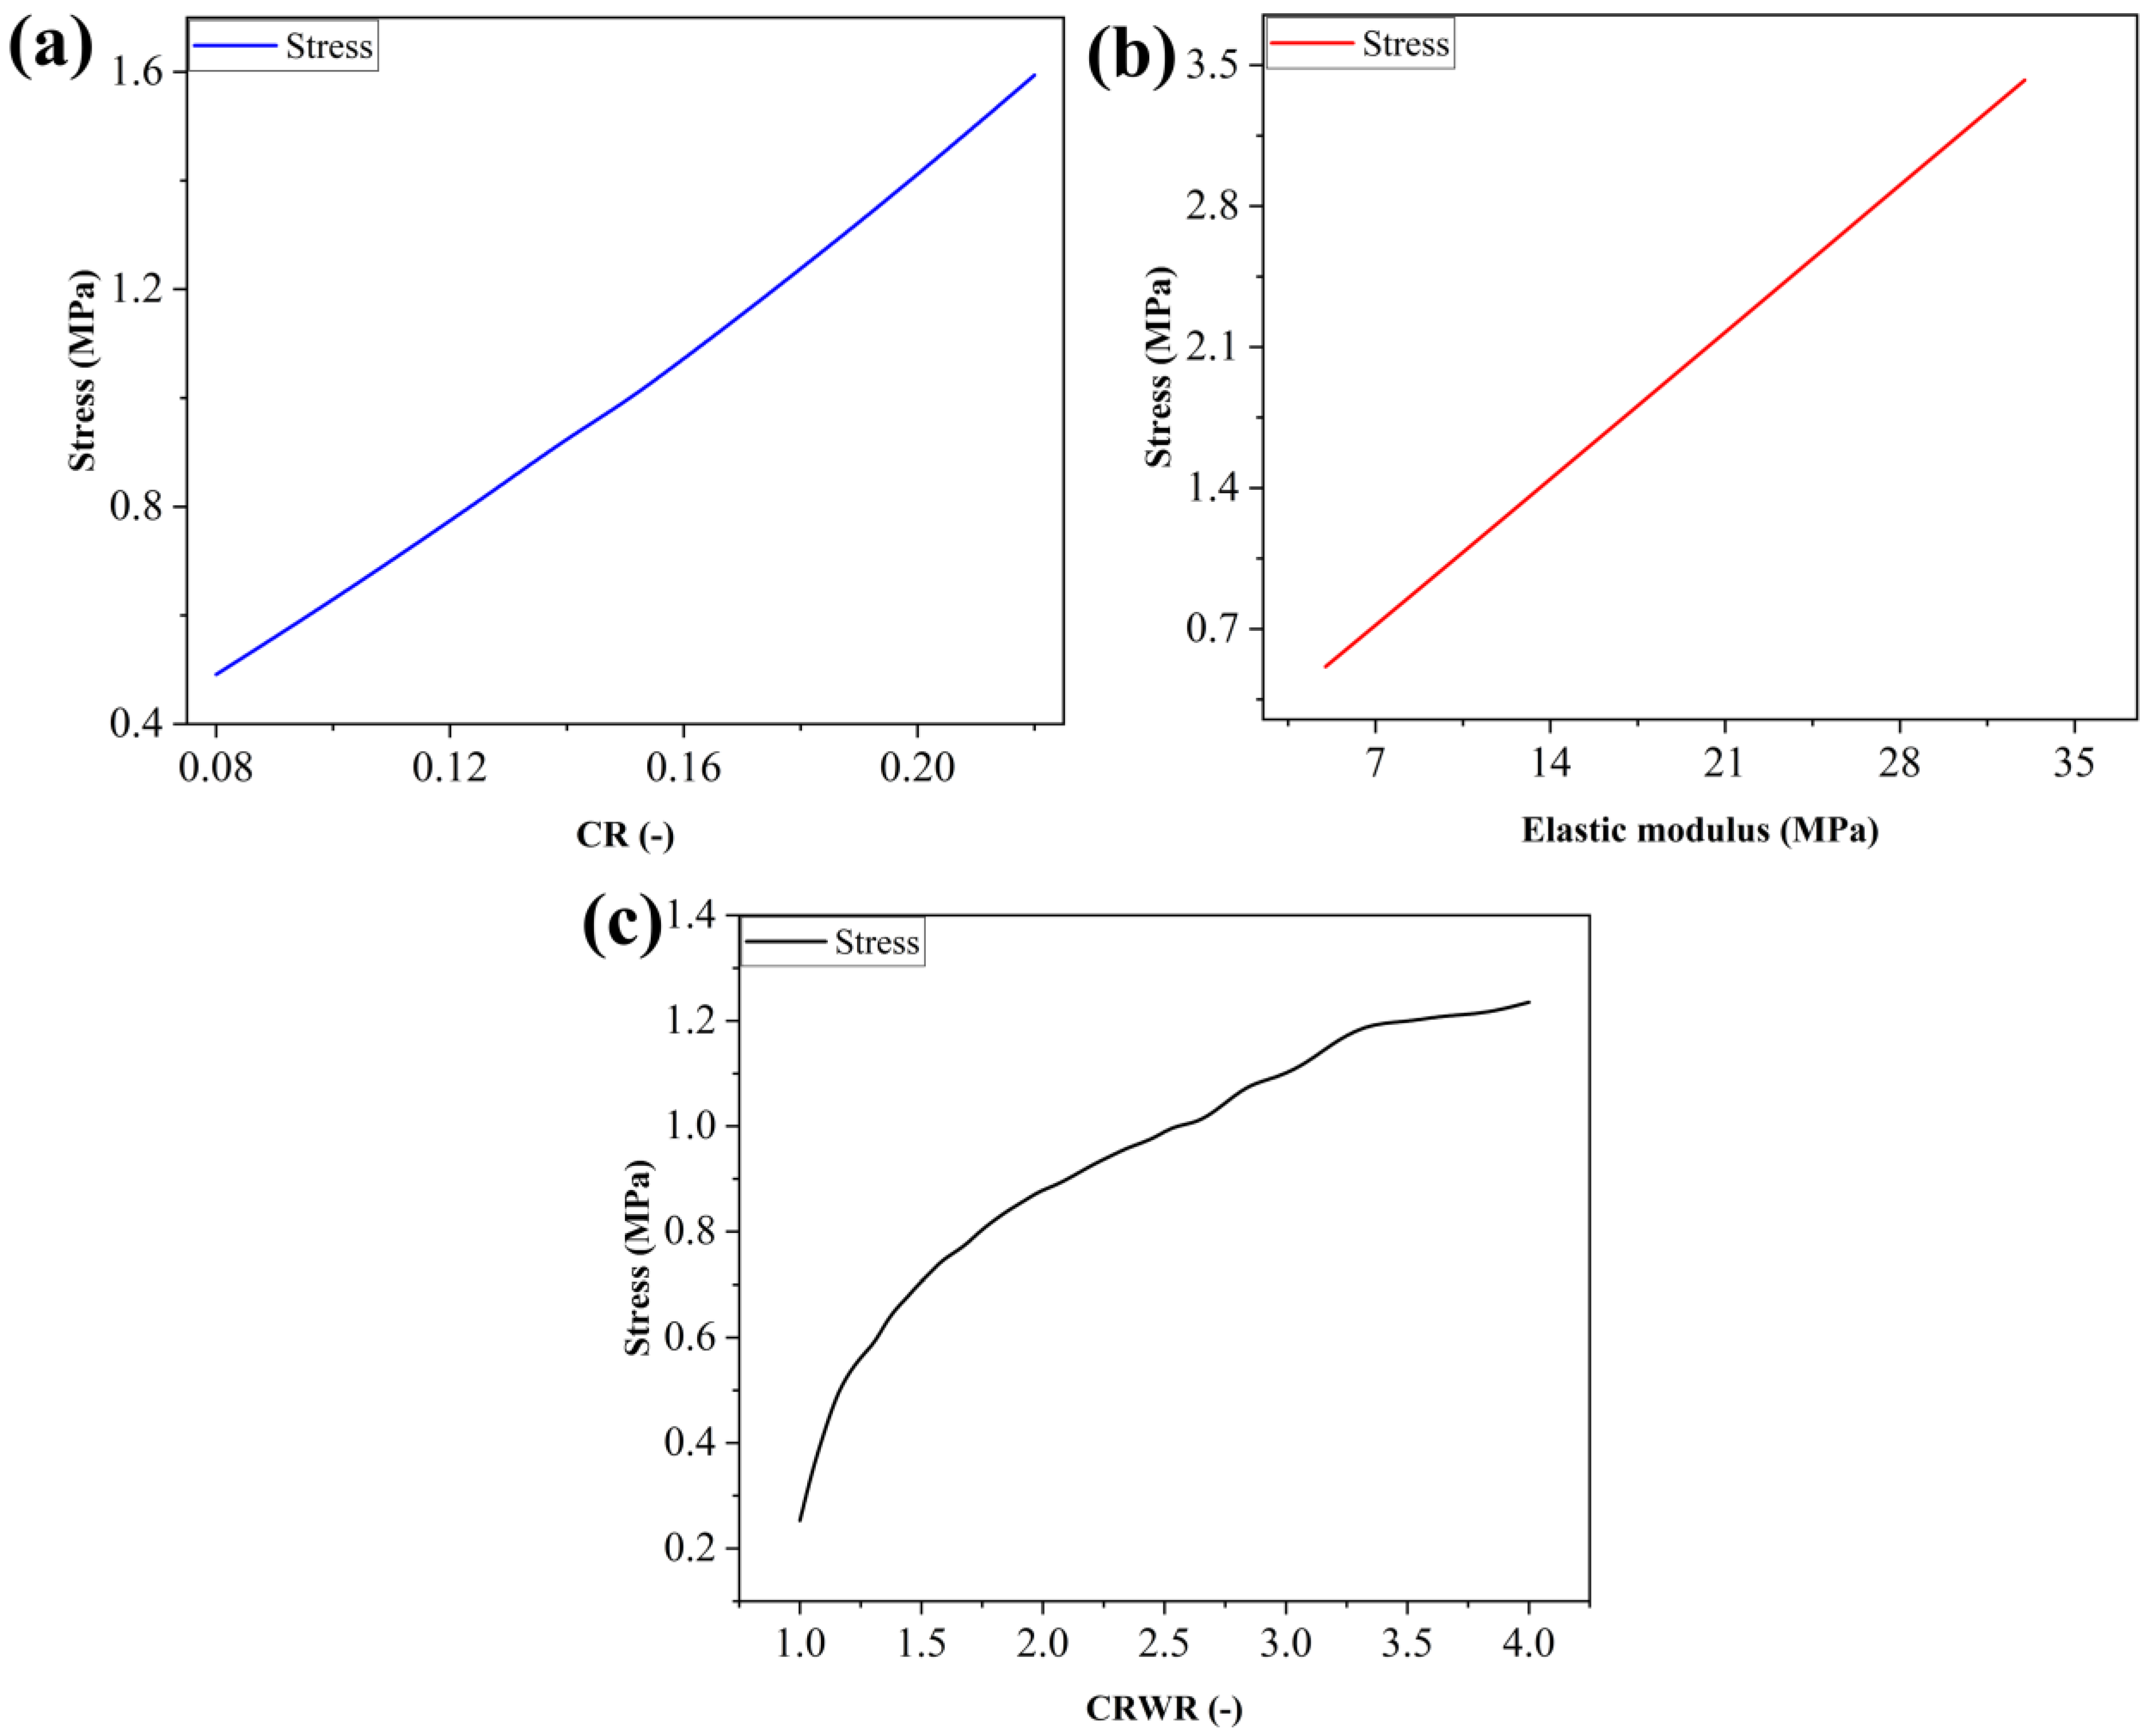
3.3. Relationship among Average Stress, CR, Elastic Modulus, and CRWR

To analyze the relationship among CRWR of BP, CR of GDL, average stress of GDL, and elastic modulus of GDL, full combination simulations are performed. The ranges of CR from 0.08 to 0.22 in step of 0.01 [45,49]. The ranges of CRWR from 1 to 4 in step of 0.1 [8]. The ranges of elastic modulus from 5 to 33 in step 8 [34]. The dependent variable is the average stress of GDL. The total of 4920 points is calculated based on the compressed neo-Hookean theory.
Figure 4 shows the relationship among stress, CR, elastic modulus, and CRWR. Firstly, stress is proportional to the square of CR (Figure 4a). Secondly, elastic modulus and stress show a linear relationship (Figure 4b). Thirdly, stress is proportional to the fourth power of CRWR (Figure 4c). Therefore, the regression model is described by Equation (37), where an (n = 1, 2, 3, 4, 5, 6, 7, 8) is the coefficient term.
δ = a 1 · C R 2 + a 2 · C R + a 3 · Y + a 4 · C R W R 4 + a 5 · C R W R 3 + a 6 · C R W R 2 + a 7 · C R W R + a 8  
In addition, the regression model is imported to Matlab 2020a to obtain the correlation among the CRWR of BP, stress, CR, and elastic modulus of GDL. The correlation is shown in Equation (38). The applicable range is shown in Equation (39).
δ = 19.0842 · C R 2 + 9.4408 · C R + 0.1022 · Y 0.1583 · C R W R 4 + 1.6767 · C R W R 3 6.5187 · C R W R 2 + 11.5147 · C R W R 9.5907  
0.08 C R 0.22 5   M P a Y 33   M P a 1 C R W R 4  
To validate this regression equation, 350 sets of CR, elastic modulus, and CRWR combination data are randomly selected for calculation in this study. The average stress deviation of the regression equation from the simulated data is 3.41%. Therefore, the correlation among the CRWR of BP, stress, CR, and elastic modulus of GDL is acceptable.

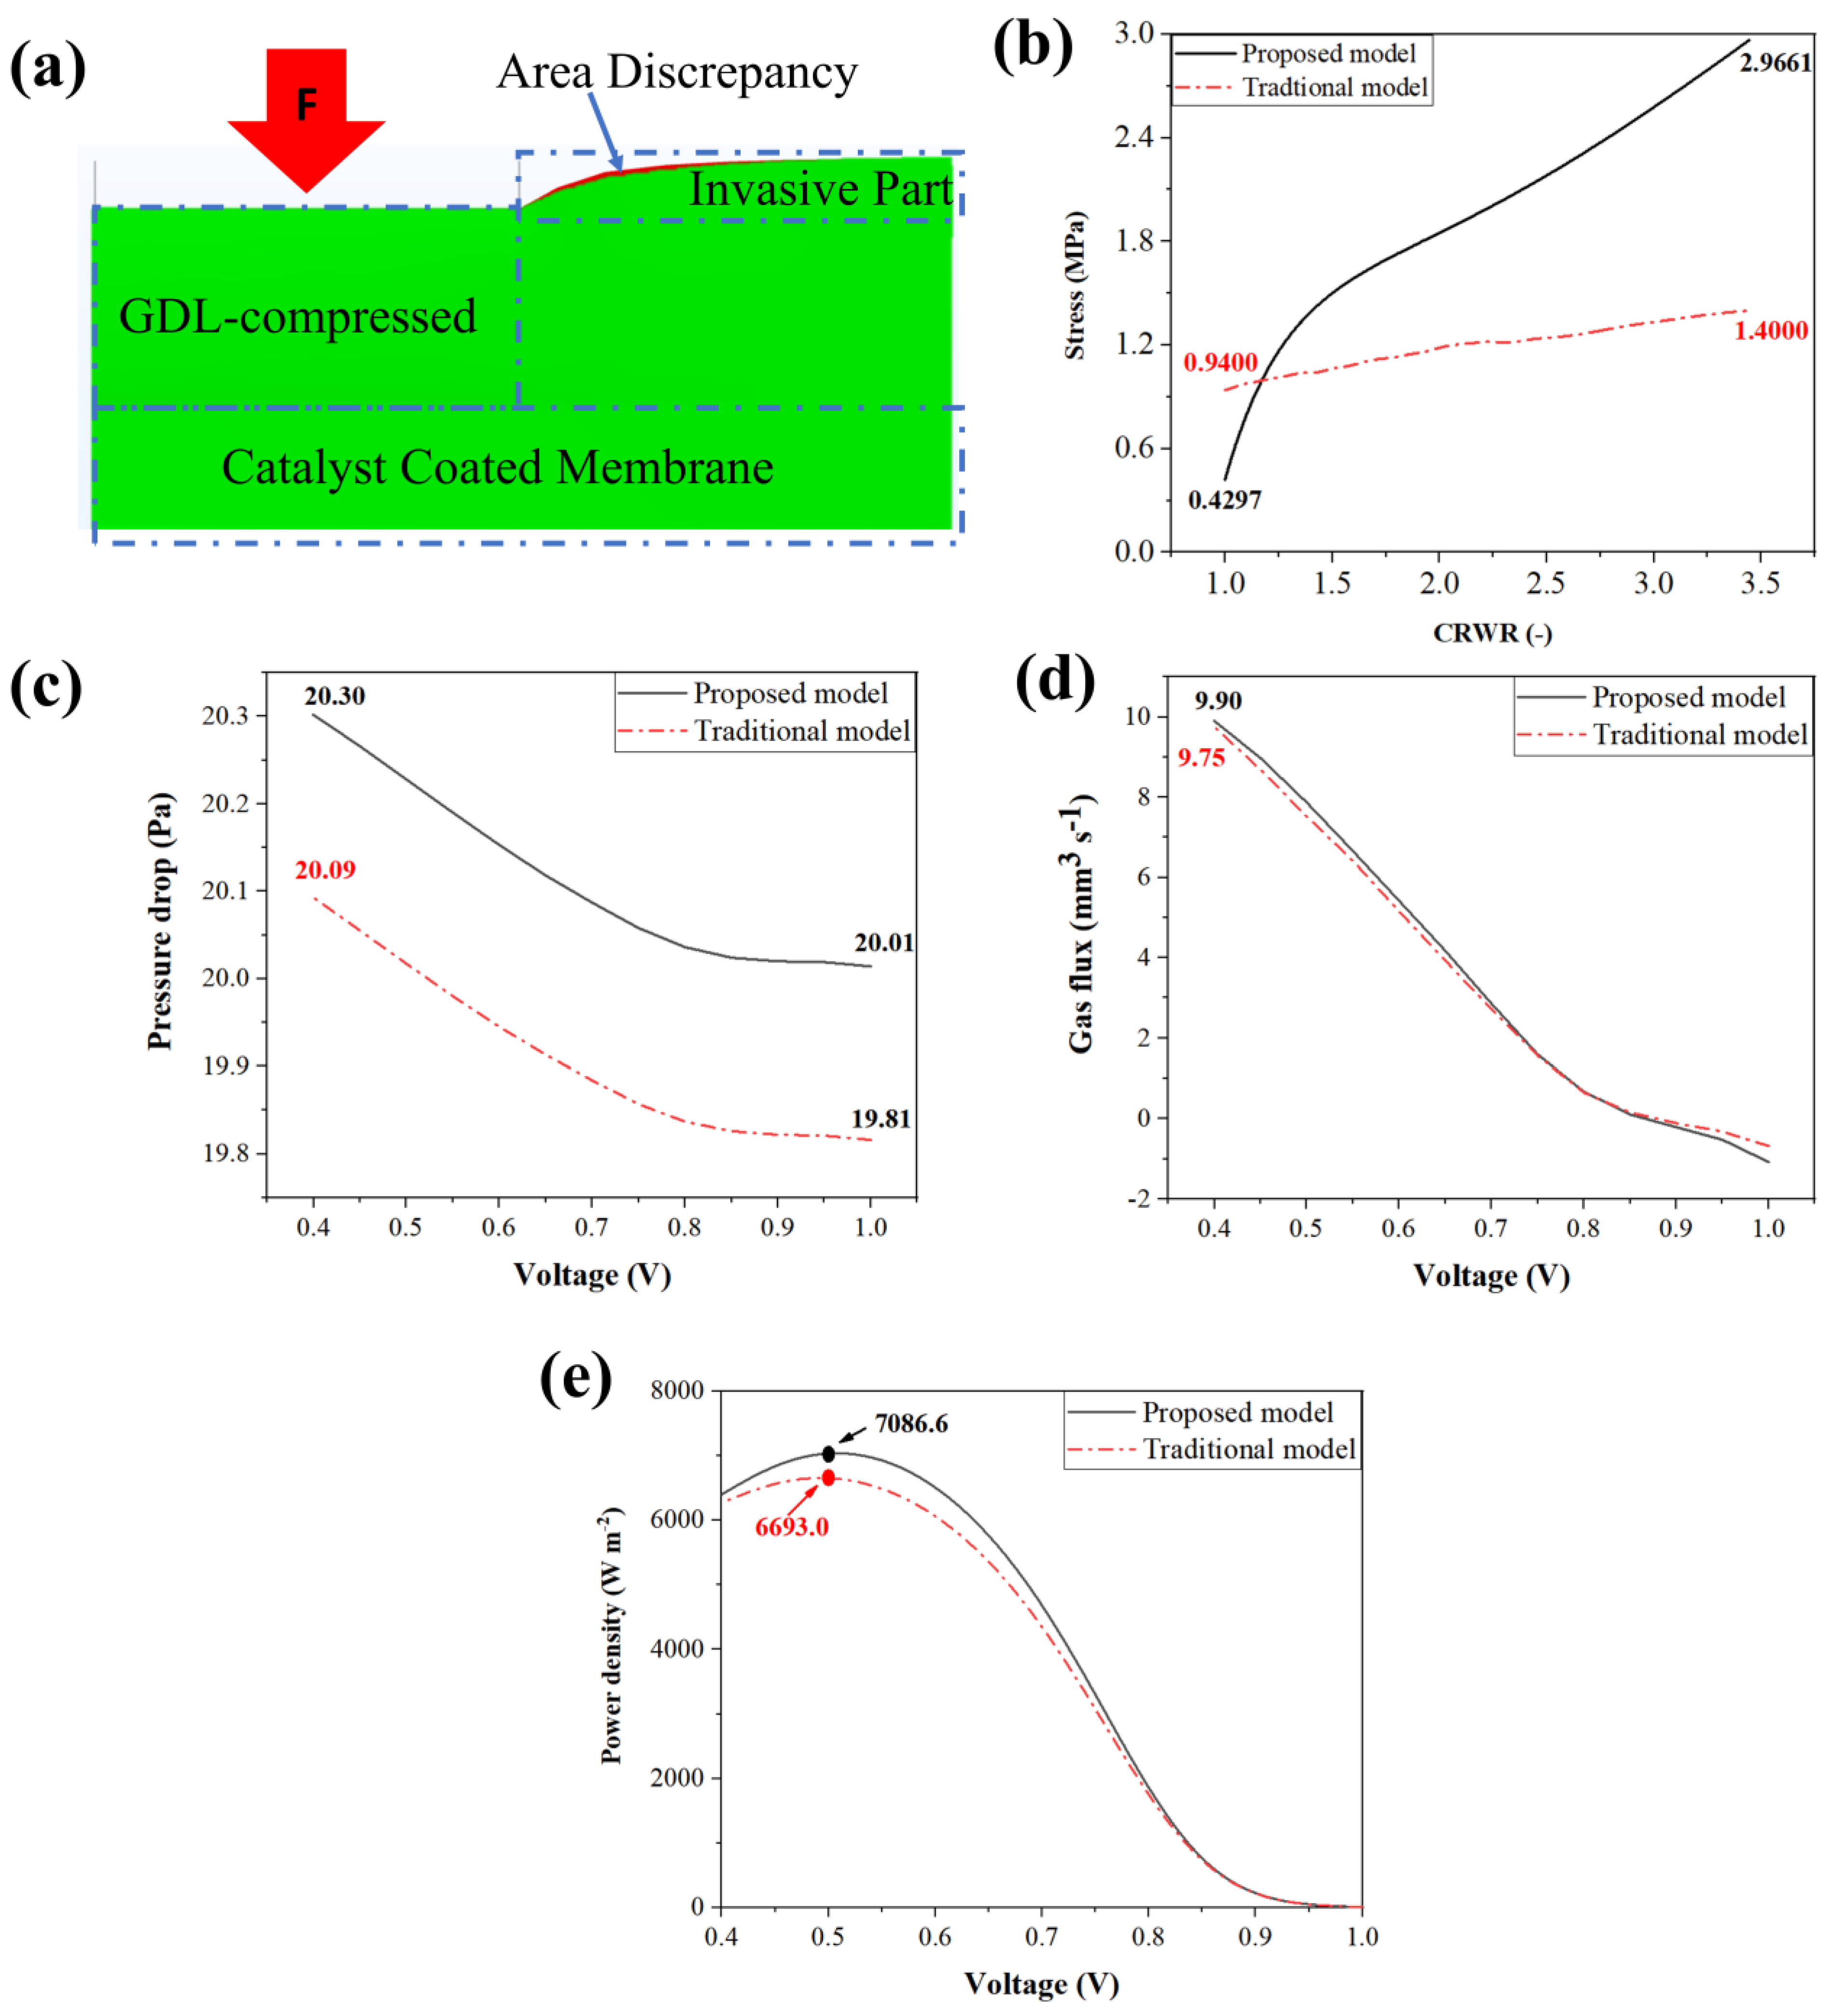
3.4. Comparison of Proposed and Traditional Model with Stress, Gas Flux, Gas Pressure Drop, and Power Density

To compare the specific impact on PEMFC properties between the proposed model and the traditional model, the cross-sectional area of the proposed and traditional model is focused on the elastic theory. The stress-strain relationship is investigated to assess the realistic stress of GDL. The gas pressure drop and flux on the cathodic side are examined to assess the impact of different elastic models on mass transfer. Additionally, the output performance of the PEMFC models is compared in this study to evaluate their reliability.
Firstly, Figure 5a gives the geometric deformation of the cross-section of MEA. In Figure 5a, the cross-section geometric of the anodic MEA of the proposed model is overlapped with that of the traditional model. The green zone in Figure 5a is the same area as the proposed and traditional models. The red zone in Figure 5a represents the prominent part of the proposed model compared to the traditional model. According to the calculation, the invasive area of the GDL into the GC of the proposed model is 9.09% higher than that of the traditional model. According to Equations (10) and (11), the strain energy density of the proposed model at CRWR = 1 is 22.56% higher than the traditional model, indicating that the deformation volume of the proposed model is smaller than that of the traditional model. Therefore, the intrusion area of the proposed model is higher than that of the traditional model. This indicates a larger contact area in the proposed model, suggesting a higher mass transfer behavior in the GDLs. As the mass transfer performance improves, the reactant gas supply improves. Therefore, the electrical performance of PEMFC improves.
To exclude the influence of other factors, the modulus and CR of GDL are 14 MPa and 0.2, respectively [14,47]. The compressive strength of specific GDL is 2.5 MPa [14]. Figure 5b illustrates the relationship between the CRWR and the average stress of GDL. The unbroken GDL means the stress of GDL is less than the compressive strength of GDL. Therefore, the peak CRWR of 2.91 is obtained by the correlation of Equation (38) when the compressive strength of GDL is 2.5 MPa. Moreover, the stress of GDL under the rib, calculated based on the traditional model, is represented by the red line in Figure 5b. It is evident that the stress of GDL in the assembly of PEMFC, based on the linear-elastic theory, is significantly underestimated (by over 90% when CRWR = 2.91). This underestimation results in excessive stress being applied to the GDL during assembly. Therefore, the refined simulation employs the compressed neo-Hookean theory to account for these factors accurately.
In order to verify the analysis, the gas pressure drop of GC, net gas flux of GDL, and power density of the proposed model and traditional model are compared. Table 3 gives the operating parameters. Figure 5c gives the gas pressure drops on the cathodic side. In high current density conditions (U = 0.4 V), the gas pressure drop of the proposed model is 1.05% higher than that of the traditional model, indicating a higher flow resistance in the proposed model. Furthermore, Figure 5d gives the inlet gas flux in the interface between the CGDL and CGC. When the voltage is between 0.8 and 1.0 V, the net inflow is negative. There are two possible reasons for this. Firstly, the cathodic electrode reaction is slower than that of the anodic, leading to a main species transfer progress from the anodic side to the cathodic side. Secondly, the steam volume in CCL is higher than the liquid water volume, especially at low current densities. In Figure 5d, the inlet gas flux in the CGDL/CGC interface of the proposed model is 1.54% higher than that of the traditional model, indicating a higher reaction consumption in the proposed model. Additionally, the peak power density of the proposed model is 5.88% higher than that of the traditional model (Figure 5e).
In a word, compared with traditional linear-elastic theory, the compressed neo-Hookean theory is more reliable and accurate in predicting the stress and strain of GDL. Based on the accurate stress-strain of GDL, the gas pressure drop, gas flux, and power density of PEMFC are predicted more realistically. Therefore, it can be concluded that the proposed model is more reliable than the traditional model.

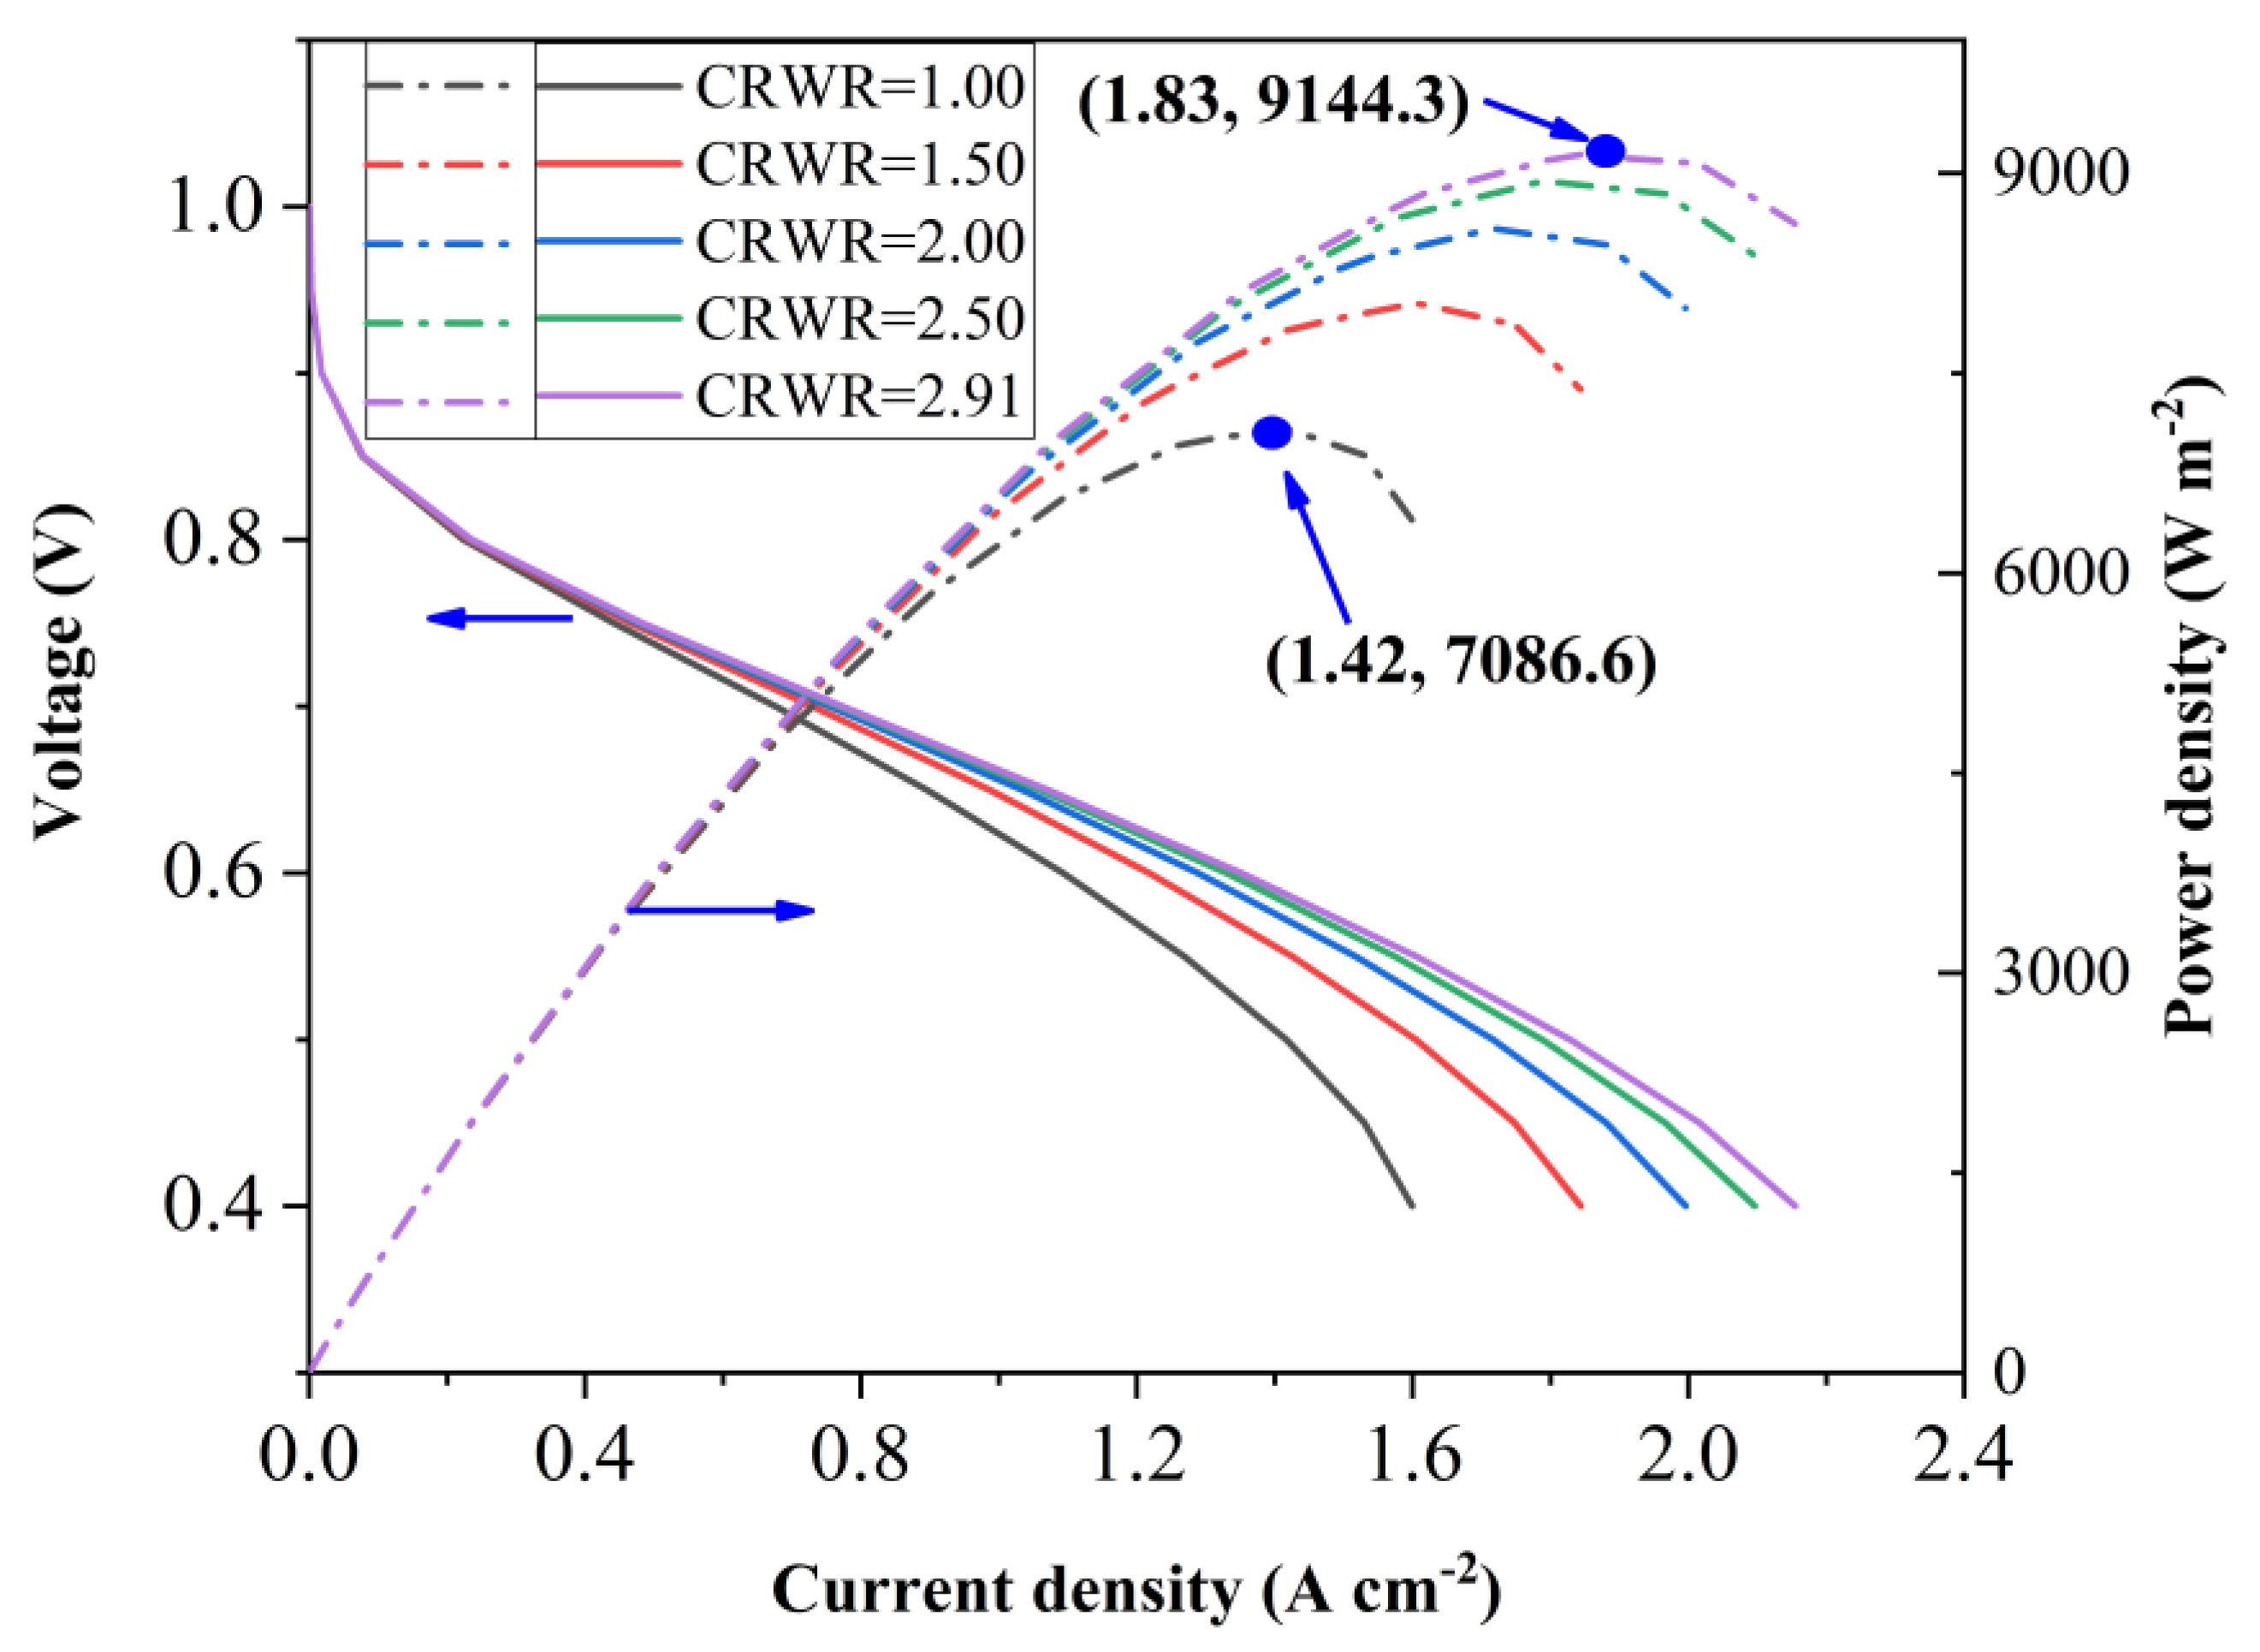
3.5. Polarization Curve and Power Density of PEMFC

In this section, the relationship between CRWRs and the electrical performance of PEMFC is investigated. The CRWR of 1, 1.5, 2, 2.5, and 2.91 are chosen to reveal the relationship among CRWR of BP, polarization curves, and power density of PEMFC. The operating parameters are shown in Table 3. Figure 6 gives the polarization curve and power density in the cases of CRWR = 1, 1.5, 2, 2.5, and 2.91. The power density of PEMFC demonstrates an increase with the increase in CRWR. The CRWR = 1 is a conventional design of gas channel, and the CRWR = 2.91 is the peak CRWR design in this study; then, comparing the designs of these two schemes helps to explain the relationship between different CRWRs and heat and mass transfer behavior. CRWRs of 1.00 and 2.91 were selected to investigate the relationship among CRWR, polarization curves, heat, and mass transfer within the PEMFC. These specific CRWRs correspond to rectangular (Figure 2a) and trapezoidal (Figure 2b) cross-sectional shapes of the GC.
Figure 6 exhibits the polarization curve and power density for CRWR of 1 and 2.91. It is observed that the electrical performance of the PEMFC of CRWR = 2.91 is higher than that of CRWR = 1. During normal fuel cell operation, the voltage range primarily consists of ohmic loss. The voltage loss range is determined by the slope of voltage [50]. In activation loss, the slope change of voltage is very drastic. In ohmic loss, the slope of the voltage remains almost unchanged. In concentration loss, the slope of the voltage changes dramatically again. Therefore, in this study, the ohmic loss voltage is 0.8–0.5 V. The peak power density in the case of CRWR = 2.91 and CRWR = 1 is 9144.3 W m−2 and 7086.6 W m−2, respectively. That is, the peak power density in the case of CRWR = 2.91 is 29.04% higher than that of CRWR = 1. Furthermore, at an output voltage of 0.5 V, the current density for CRWR = 2.91 and CRWR = 1 is recorded as 1.83 A cm−2 and 1.42 A cm−2, respectively. Thus, the case of CRWR = 2.91 enhances the available current density of the fuel cell when compared to the case of CRWR = 1.

3.6. Distribution of Hydrogen, Oxygen, and Steam in GDM

To quantitatively investigate gas distribution in GDM, the mass transfer behaviors of CRWR = 2.91 and CRWR = 1 are analyzed. In particular, the analysis focuses on the distribution of species measured by mole fraction at the GDL/BP interface and GDL/CL interface. The mole fraction is a useful metric for studying species distribution in PEMFC and has a direct impact on the fuel cell performance. Furthermore, to illustrate the performance of the PEMFC under different operating conditions, three output voltages (0.8 V, 0.6 V, and 0.4 V) are selected as representatives of low current density (LCD), medium current density (MCD), and high current density (HCD), respectively.

3.6.1. Hydrogen Distribution in GDL

Figure 7 gives the mole fraction distribution of hydrogen in the anodic gas diffusion medium (AGDM). Due to the limited space, the distributions at U = 0.4 V are shown in Figure 7a–d. Comparing the CRWR of 2.91 and 1, it can be observed that the decline magnitude of hydrogen at the AGDL/ABP interface is higher for CRWR = 2.91 (0.3118) than CRWR = 1 (0.2254). This discrepancy can be attributed to the transfer rate of hydrogen within GDL, which directly influences the electrochemical reaction rate. Specifically, CRWR = 2.91 exhibits a greater contact area between the GDL and GC compared to CRWR = 1. As a result, the hydrogen transfer rate of CRWR = 2.91 surpasses that of CRWR = 1. Furthermore, the difference in the mole fraction of hydrogen in the AGDL under the GC is higher than that in the AGDL under the rib. This indicates that the compression of the GDL enhances the performance of hydrogen transfer.
The average mole fraction of hydrogen at the AGDL/ABP and AGDL/ACL interfaces is presented in Table 5. It can be observed that the difference in average mole fraction at the GDL/BP interface between the two CRWRs is small, being less than 6.16%. Additionally, the difference in mole fraction at the AGDL/ACL interface between the inlet and outlet is summarized in Table 5. The mole fraction gradient of hydrogen in CRWR = 2.91 is higher than that in CRWR = 1 for MCD and HCD. Indeed, the difference in mole fraction between the inlet and outlet represents the consumption of hydrogen. In LCD, both CRWRs exhibit low consumption of hydrogen, indicating that the electrochemical rates are nearly equal under that condition. However, in MCD and HCD, the consumption of hydrogen in CRWR = 2.91 is 44.15% (U = 0.4 V) and 17.75% (U = 0.6 V) higher than that in CRWR = 1. This suggests that at higher current densities, CRWR = 2.91 has a more pronounced facilitating effect on the reaction rate. Thus, the case of CRWR = 2.91 improves fuel cell performance by enhancing the reaction rate in high and medium current density scenarios.
Figure 7e,f illustrate the mole fraction of hydrogen at Line1 and Line2 of the AGDL/ABP interface. Line 1 is the centerline of AGDL/ABP under the GC, and Line 2 is the centerline AGDL/ABP under the rib. These lines represent the typical trends of gas distribution under the rib and GC, respectively, and the most extreme values occur on these two lines. Therefore, selecting these two lines can facilitate comparison. It can be observed that as the channel length increases, the mole fraction of hydrogen decreases. The slope of CRWR = 2.91 is higher than that of CRWR = 1, indicating that the consumption of hydrogen is higher in CRWR = 2.91. Additionally, in Figure 7e,f, the difference between Line1 and Line2 is small, being less than 0.85%. This suggests that although the GDL beneath the rib is not directly in contact with the hydrogen in the GC (Gas Channel), the hydrogen still diffuses efficiently in the in-plane direction within the GDL. Therefore, as long as the porous structure of the compressed GDL remains intact, hydrogen diffusion in the compressed GDL remains effective. However, if the GDL structure is compromised due to excessive compressive force, the hydrogen diffusion performance in the compressed GDL will be reduced because the broken GDL leads to a huge decrease in mass transfer behavior, which is shown in Table 4.

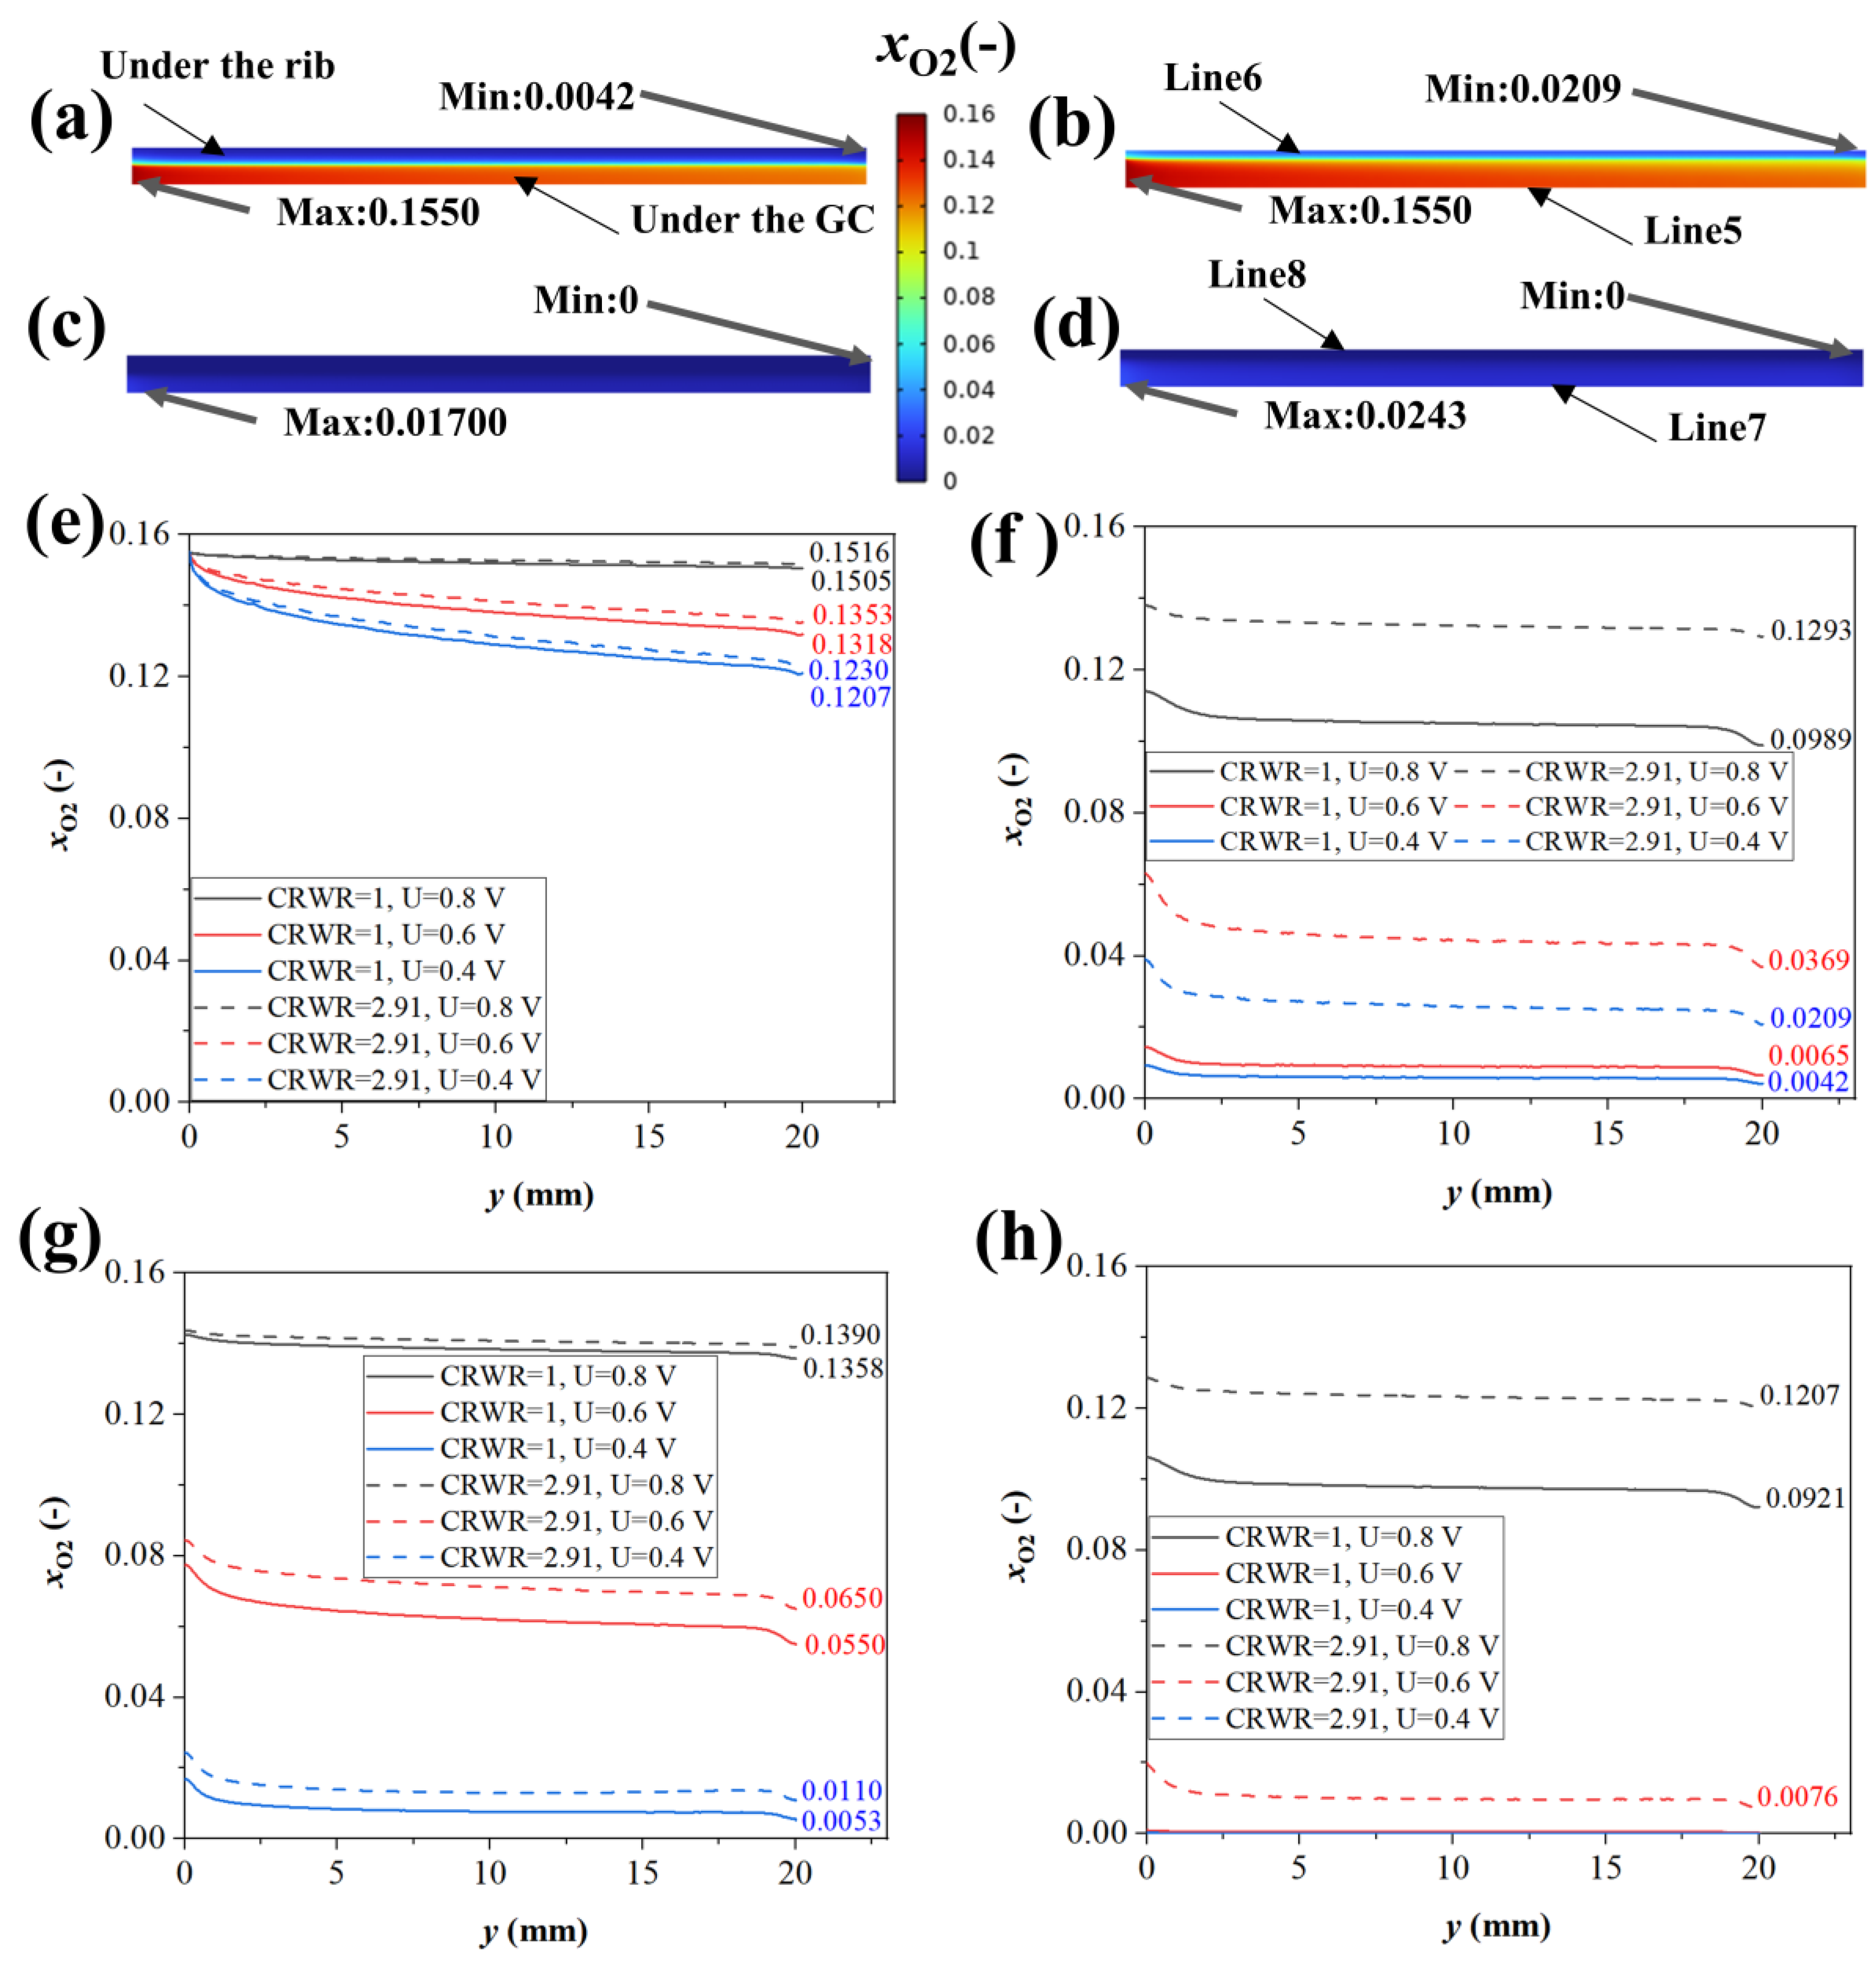
3.6.2. Oxygen Distribution in GDL

Figure 8 gives the mole fraction of oxygen in CGDM. It can be observed that as the current density increases, the mole fraction of oxygen decreases. Table 5 gives the difference in mole fraction between the inlet and outlet. As the current density increases, the difference in mole fraction between the inlet and outlet increases. This can be attributed to the fact that the distance from the GC beneath the rib in CRWR = 2.91 is shorter compared to CRWR = 1. Furthermore, in Figure 8a,b, the mole fraction of oxygen under the rib in CRWR = 2.91 is higher than that in CRWR = 1. This is because the distance from the center of the rib to the GC in CRWR = 2.91 is shorter than that in CRWR = 1. Therefore, the oxygen diffusion performance of CRWR = 2.91 is higher than that of CRWR = 1. Besides, the average mole fraction of oxygen in the CGDL/CBP interface is provided in Table 5, indicating that the average mole fraction of oxygen in CRWR = 2.91 is higher than that in CRWR = 1. Therefore, the flow into the GDL in the case of CRWR = 2.91 is higher than that of CRWR = 1.
The average mole fraction of oxygen in the CGDL/CCL interface is presented in Table 5. The average mole fraction of oxygen at the CGDL/CCL interface exhibits similar behavior to the CGDL/CBP case. In the CGDL/CCL interface, the average mole fraction of oxygen in CRWR = 2.91 is 11.39% (U = 0.8 V), 69.35% (U = 0.6 V), and 146.88% (U = 0.4 V) higher than that in CRWR = 1. As a result, the oxygen transfer performance is superior for CRWR = 2.91 when compared to CRWR = 1. Additionally, Figure 8c,d demonstrate that the mole fraction of oxygen beneath the rib is lower than that under the GC. This contrast with the behavior calculated for hydrogen can be attributed to the fact that oxygen is more affected by this change than hydrogen when GDL compression leads to reduced porosity.
Figure 8e–h display the mole fraction of oxygen in the CGDM. It is observed that the mole fraction of oxygen in CRWR = 2.91, which is higher than that in CRWR = 1, both beneath the GC and the rib. Specifically, for CRWR = 2.91, the mole fraction of oxygen under the GC is higher compared to CRWR = 1, and the difference is even more significant beneath the rib (>30% when U = 0.8 V). This difference in mole fraction between CRWR = 2.91 and CRWR = 1 is greater for oxygen than for hydrogen. This suggests that the transfer performance of oxygen is significantly influenced by the CRWR of BP. Consequently, the average mole fraction of oxygen in GDL beneath the rib is higher in the case of a smaller CRWR compared to a larger CRWR. Furthermore, when U = 0.4 V, the mole fraction of oxygen beneath the GC is sufficient (mole fraction > 0.1). However, the mole fraction of oxygen under the rib is insufficient (mole fraction is near to zero) when U = 0.4 V. This indicates that the electrochemical reaction under the rib is in a state of lack of oxygen in HCD. Then, PEMFC performance under the rib is decreased. Therefore, the CRWR should decrease as much as possible in the case of the porous structure integrity of the GDL in order to improve the gas transfer performance.

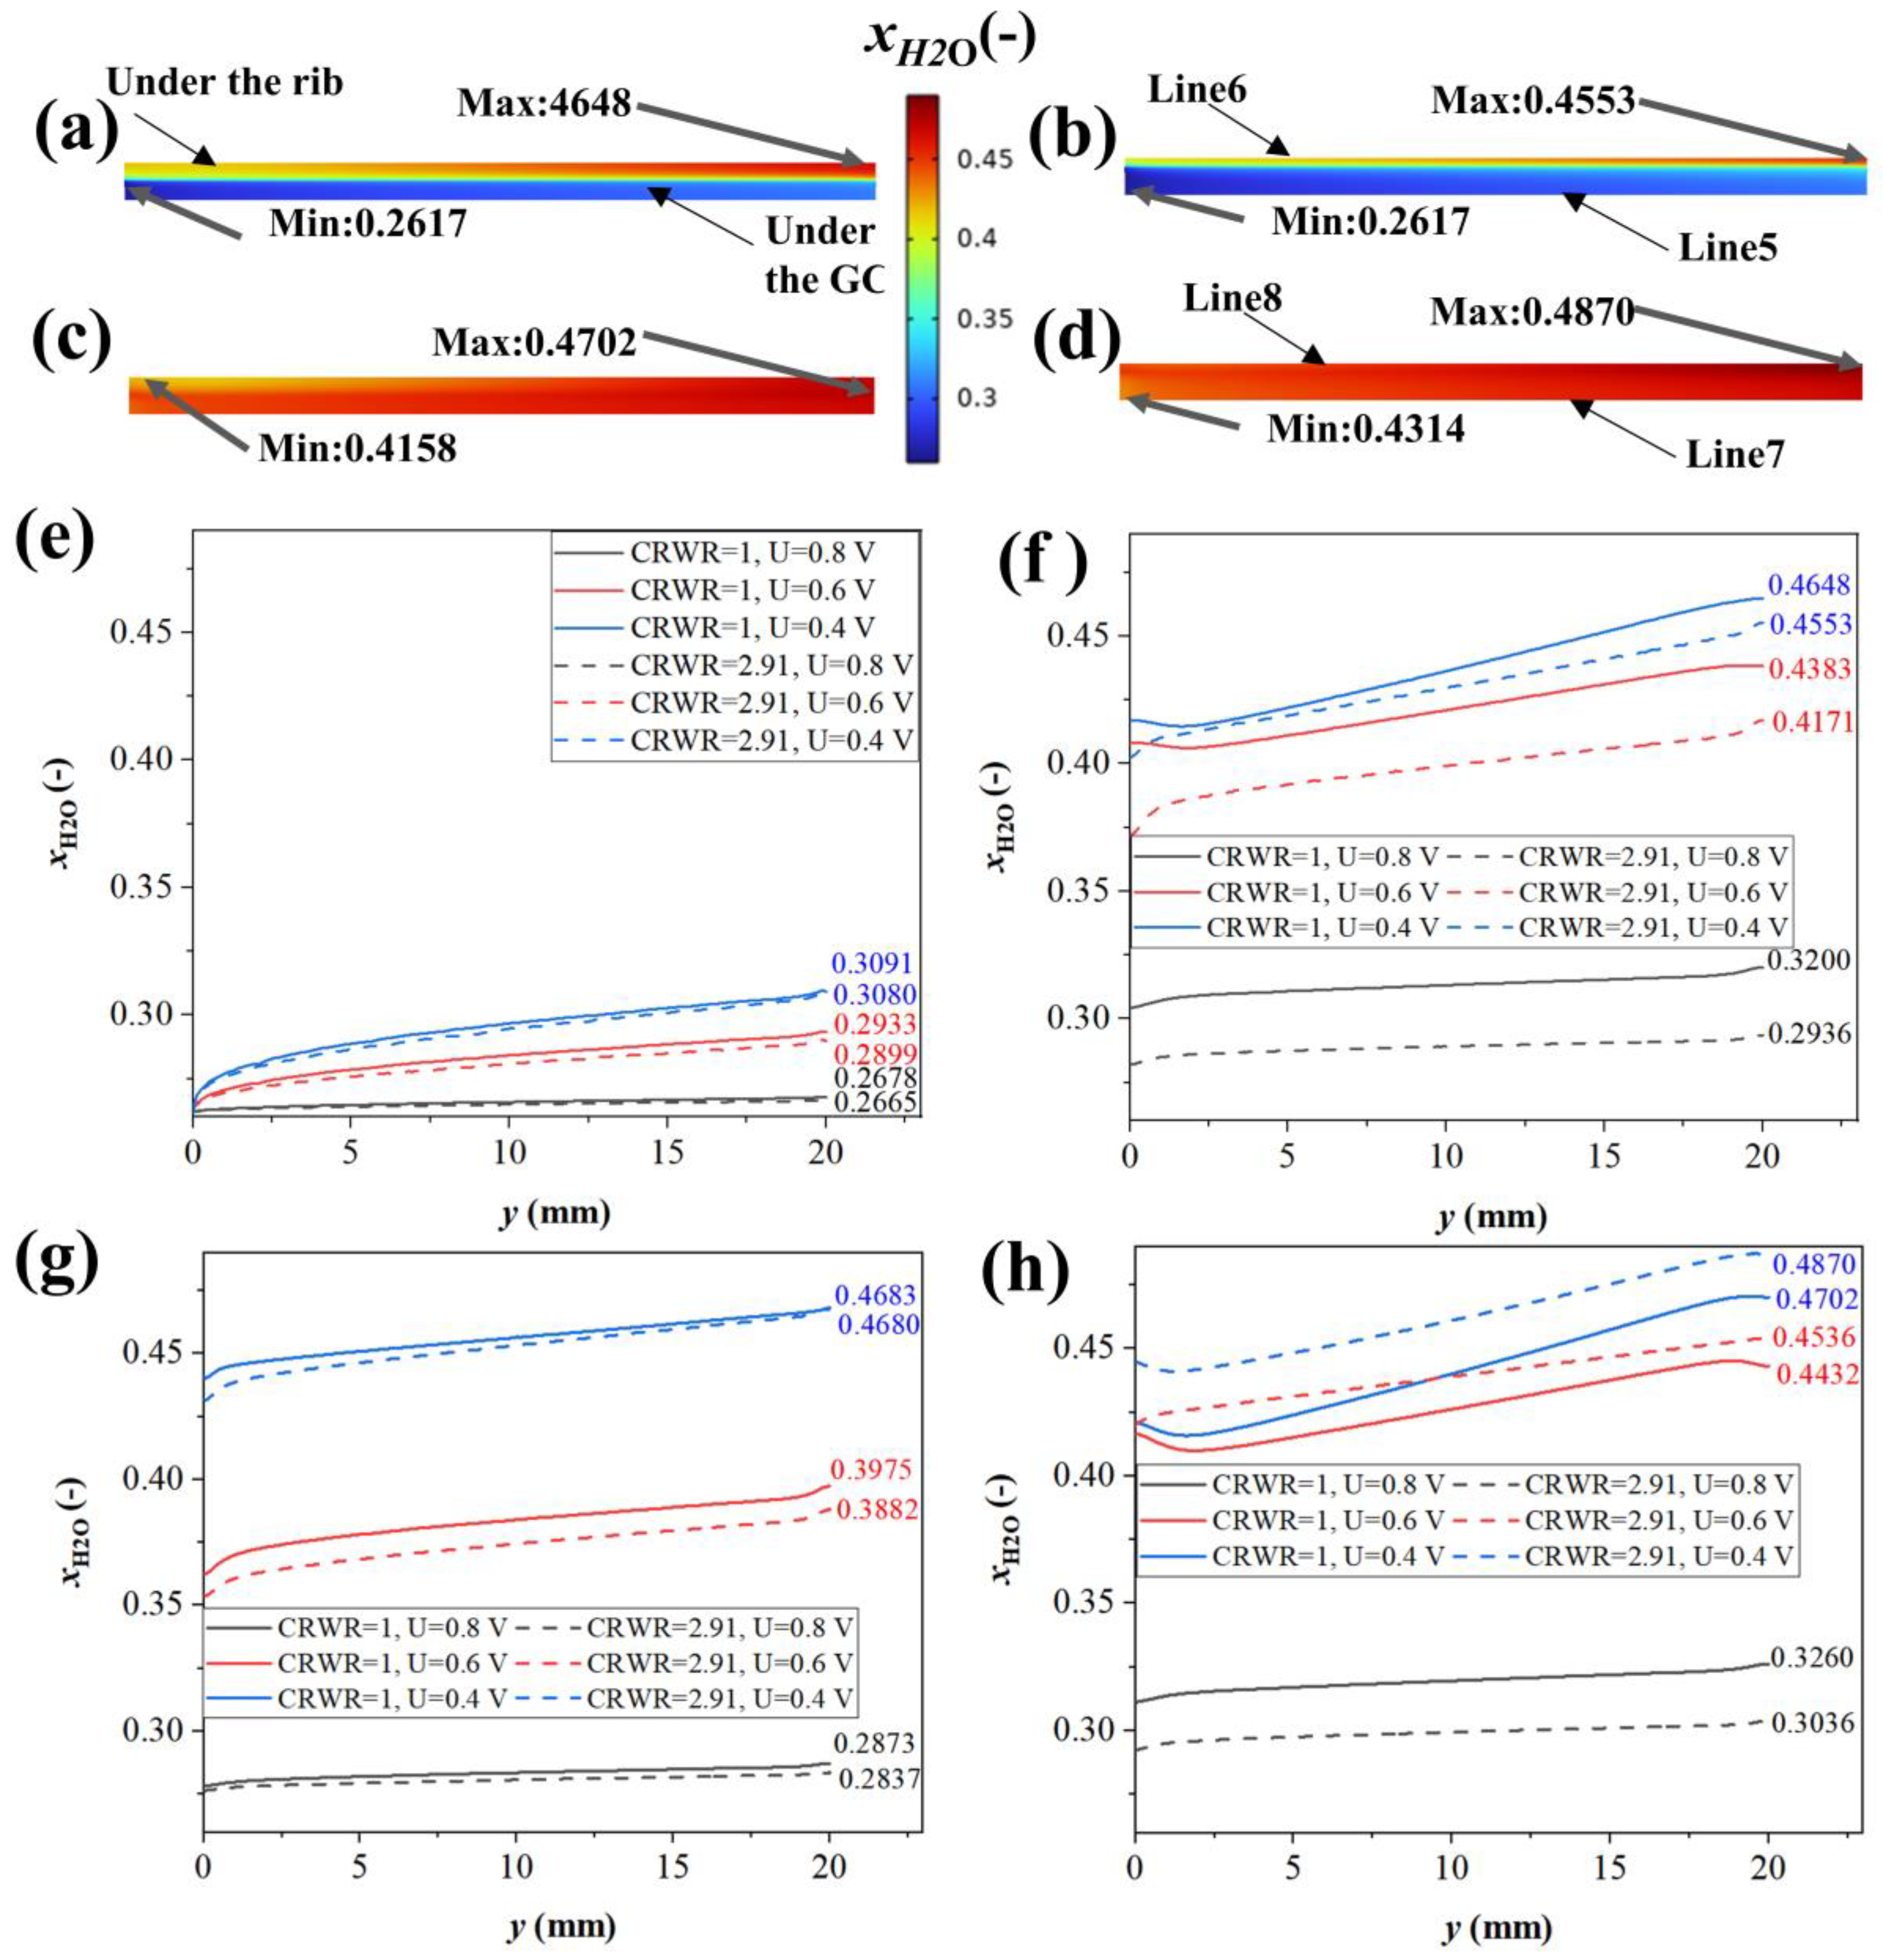
3.6.3. Steam Distribution in GDL

Figure 9 illustrates the mole fraction of steam in the CGDM. Unlike oxygen and hydrogen, steam is predominantly produced through electrochemical reactions in the CCL, making it the focus of this study. In Figure 9a,b, it can be observed that the mole fraction of steam at the CGDL/CBP interface beneath the rib is higher than that under the GC. This difference can be attributed to the decrease in porosity of the GDL due to compression under the rib. As a result, as the porosity decreases, transfer resistance increases, indicating that the permeability of steam in the compressed GDL is lower compared to the uncompressed GDL. Furthermore, Table 5 presents the average mole fraction of steam at the CGDL/CBP interface. The average mole fraction of steam at the CGDL/CBP interface for CRWR = 2.91 is 10.58% (U = 0.8 V), 9.18% (U = 0.6 V), and 7.78% (U = 0.4 V) lower than that for CRWR = 1. This discrepancy is attributed to the higher contact area between the GDL and gas in the case of CRWR = 2.91 compared to CRWR = 1, resulting in improved transfer performance of steam for CRWR = 2.91. Moreover, as the current density increases, the difference in the mole fraction of steam at the CGDL/CBP interface between the CRWR = 1 and 2.91 decreases. This is because the mass transfer limitations emerge at the high current density regions (U = 0.4 V).
In Figure 9c,d, the average mole fraction of steam in the CGDL/CCL interface is presented in Table 5. For the case with a CRWR of 2.91, the average mole fraction of steam at the CGDL/CCL interface is 4.19% (U = 0.8 V) and 3.66% (U = 0.6 V) lower compared to the case with a CRWR of 1. The average mole fraction of steam in the CGDL/CCL interface in the case of CRWR = 2.91 and CRWR = 1 is less different when U = 0.4 V (<1.28%). Therefore, the transfer performance of steam in the case of CRWR = 2.91 is higher than that of CRWR = 1 under MCD (U = 0.6 V) and LCD (U = 0.8 V).
Figure 9e–h present the mole fraction of steam in specific regions. Figure 9e,f illustrate the data in the CGDL/CBP interface. It can be observed that when CRWR is 2.91, the mole fraction of steam is lower compared to CRWR = 1. This is attributed to the contact area between GDL and reactant gas in the case of CRWR = 2.91 is higher than CRWR = 1. Consequently, the steam transfer performance at CRWR = 2.91 is higher than at CRWR = 1. Moreover, the mole fraction of steam beneath the rib is lower than that below the GC in the CGDL/CCL interface. This disparity suggests that the steam transfer in the CGDL/CCL interface is influenced by the CRWR, which is distinct from the distribution of hydrogen. Figure 9g,h demonstrate the data at the CGDL/CCL interface. When compared with the CGDL/CBP interface, the mole fraction below the rib exhibits slight differences in comparison to the mole fraction below the GC. This indicates that the GDL efficiently diffuses uneven gas to achieve a uniform plane. Furthermore, the mole fraction of steam at CRWR = 2.91 is higher than at CRWR = 1 (Figure 9h). The porosity of the compressed GDL in both GC shapes is similar due to the equal CR. Consequently, the gas permeability in the compressed GDL for both GC shapes is also equal. The primary difference lies in the CRWR, where a large CRWR leads to improved steam transfer performance. In Figure 9f,h, within the inlet region (y = 0–2 mm), the mole fraction of steam decreases as y increases due to uneven reactions beneath the rib and GC.

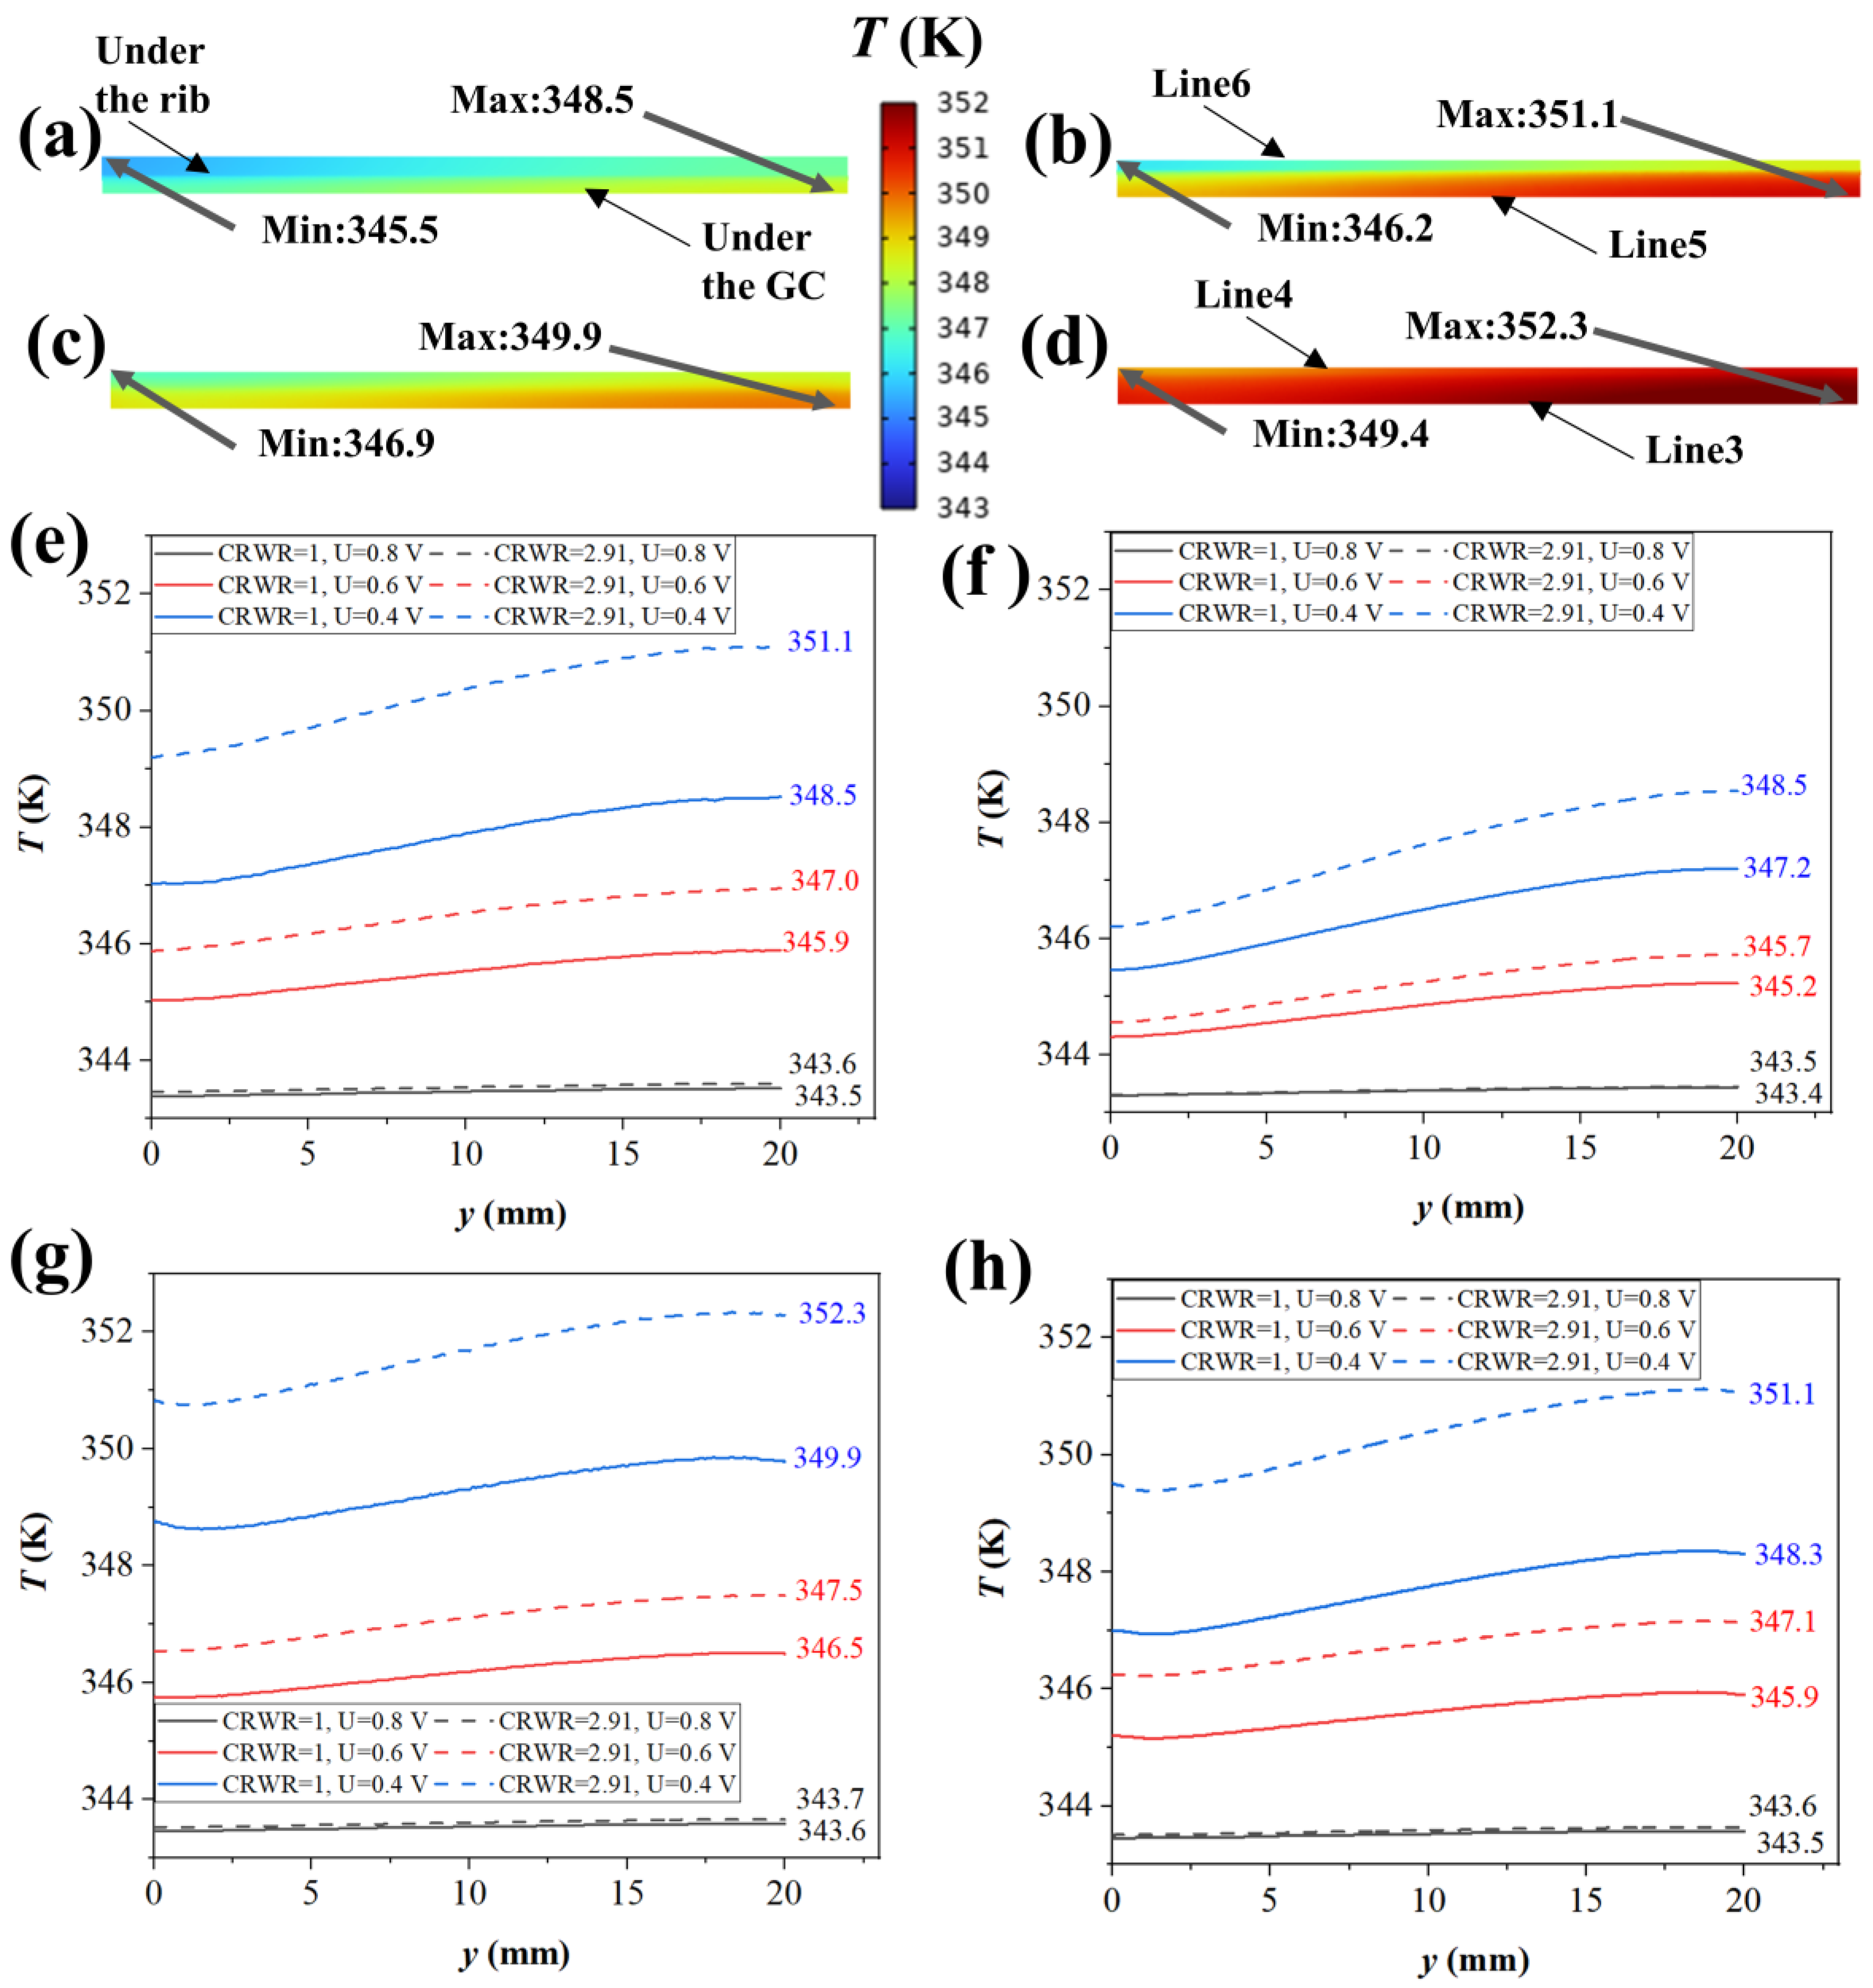
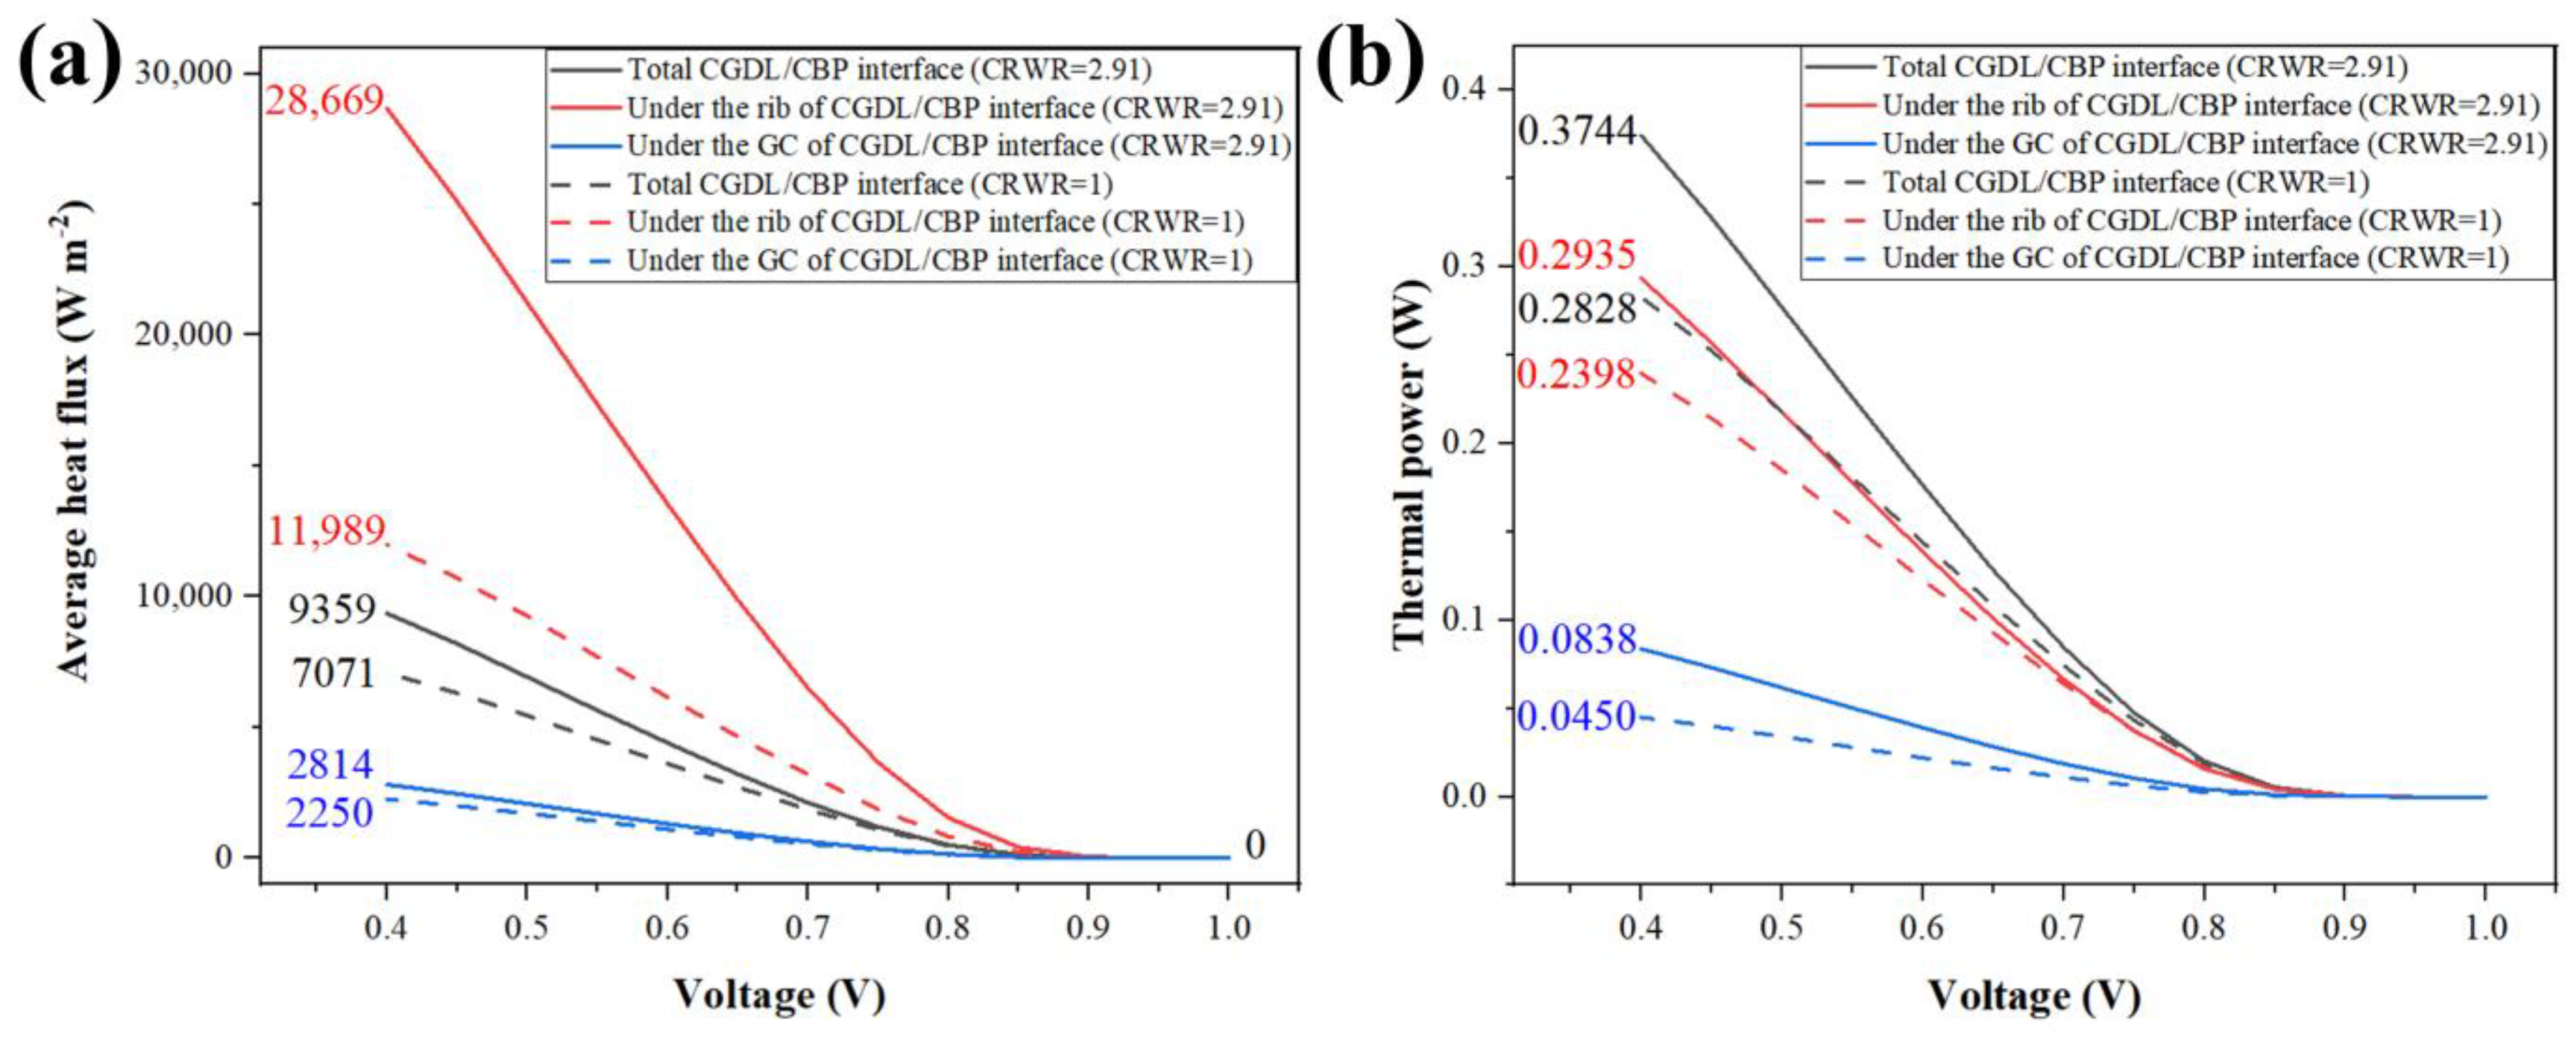
3.7. Distribution of Temperature and Heat Flux in GDM

Temperature significantly influences the operational efficiency and longevity of fuel cells, particularly in the context of proton exchange membrane fuel cells (PEMFCs). The recommended operational temperature range for PEMFCs is typically between 60 °C and 80 °C [1]. On the one hand, operating temperatures above 80 °C may trigger thermal runaway, leading to PEM degradation. The loss of the -SO3H groups will lead to a reduction in proton conductivity and irreversible chemical degradation in the perfluorosulfonic acid membrane such as Nafion. Then, high temperature exacerbates the possibility of performance degradation and reduced PEMFC lifespan. On the other hand, operating temperatures below 60 °C lead to a decrease in the reaction rate.
Figure 10 gives the temperature distribution of GDM. In Figure 10a,b, the CGDL/CBP interface experiences a temperature difference of 3.06 K (CRWR = 1, U = 0.4 V) and 4.89 K (CRWR = 2.91, U = 0.4 V), respectively. The difference in temperature between the inlet and outlet in the CGDL/CBP interface of CRWR = 2.91 is higher than that of CRWR = 1. This indicates that heat production in the case of CRWR = 2.91 is higher than that of CRWR = 1 under the same output voltage. In Figure 10a–d, the peak temperature is reached in the outlet under the GC. The peak difference temperature between the CGDL/CBP interface and the CCL/PEM interface is 1.4 K (CRWR = 1) and 1.2 K (CRWR = 2.91). Remarkably, as shown in Figure 10e–h, the temperature increases with ascending y-values. It is noteworthy that the temperature underneath the rib structure is lower than that in the GC region. This is attributed to the fact that the heat conduction performance in PEMFC is higher than that of heat convection performance. Moreover, the average temperature in the CGDL/BP interface is shown in Table 5. That is, the average temperature in the CGDL/BP interface in the case of CRWR = 2.91 is 0.85 K (U = 0.6 V) and 2.12 K (U = 0.4 V), higher than that of CRWR = 1, respectively. There are two different possible reasons. First, heat production in the case of CRWR = 2.91 is higher than that of CRWR = 1 due to the reaction rate in the case of CRWR = 2.91 being higher than that of CRWR = 1. Second, the heat transfer performance in the case of CRWR = 1 is higher than that of CRWR = 2.91.
To determine the exact reason, the average heat flux in the sub-rib, sub-GC, and whole of the CGDL/BP interface is calculated. Figure 11 gives the average heat flux and thermal power in the specific interfaces. In Figure 11a, the average heat flux of the case of CRWR = 2.91 is higher than that of CRWR = 1. When U = 0.4 V, the average heat flux in the sub-rib of the CGDL/BP interface for CRWR = 2.91 is 139.13% higher than that of CRWR = 1. This is attributed to the fact that the pathway of sub-rib in the case of CRWR = 2.91 is lower than that of CRWR = 1. In the sub-GC of the CGDL/CBP interface, the average heat flux for CRWR = 2.91 is 25.07% higher (U = 0.4 V) than that of CRWR = 1. This can be attributed to a larger contact area between the GDL and gas for CRWR = 2.91, resulting in a higher reaction rate under the GC compared to CRWR = 1. Considering the entire CGDL/CBP interface, the average heat flux for CRWR = 2.91 is 87.45% higher (U = 0.4 V), 120.40% higher (U = 0.6 V), and 139.38% higher (U = 0.8 V) than that of CRWR = 1, respectively. This indicates a higher reaction rate and heat production in the case of CRWR = 2.91 compared to CRWR = 1 under the same output voltage. Therefore, the electrical performance is higher for CRWR = 2.91.
Furthermore, the thermal power through the rib is significantly higher than that through the GC. The heat conduction in the rib is approximately 3.5–5.3 times higher than the heat convection in the GC, depending on the conditions (Figure 11b). This indicates that heat conduction in the rib is more important than heat convection in the GC. As the CRWR increases, the thermal power of the heat conduction in the rib increases. Ensuring the integrity of the porous structure of GDL benefits by improving the stability of heat dissipation performance. Therefore, the integrity of the porous structure of GDL should be ensured while reducing the CRWR of BP.

4. Conclusions

A three-dimensional model of PEMFC, incorporating the compressed neo-Hookean theory of GDL, was proposed and compared with a traditional model incorporating the linear-elastic theory of GDL. The previous experimental data was used to validate the models. The correlation among the CRWR of BP, stress, CR, and elastic modulus of GDL was obtained. The peak CRWR of BP was obtained based on the correlation. A comparison was made between the peak CRWR and conventional CRWR cases, revealing differences in species distribution, temperature distribution, and electrical performance of the PEMFC. The main conclusions were as follows:
  • The average stress deviation from the experiment for the simulation based on the compressed neo-Hookean theory and the simulation based on linear-elastic theory was 1.38% and 14.26%, respectively. The compressed neo-Hookean theory was more accurate than the linear-elastic theory for describing the GDL deformation. The current density deviation from the experiment for the simulation based on the proposed model and the traditional model was 2.55% and 9.81%, respectively. The proposed model (incorporating the compressed neo-Hookean theory) was more accurate than the traditional model (incorporating the linear-elastic theory).
  • The correlation among the CRWR of BP, stress, CR, and elastic modulus of GDL was obtained. The average stress deviation of the regression equation from the simulated data was 3.41%. Based on the correlation, the peak CRWR of 2.91 was found at the compressive strength of 2.5 MPa. The peak power density of CRWR = 2.91 was 29.04% higher than that of CRWR = 1.
  • The mole fraction of hydrogen and steam between the region under the rib and GC was slightly different (<0.85% for hydrogen, <1.28% for steam). However, the average mole fraction of oxygen in the CGDL/CCL interface for CRWR = 2.91 was 11.39% higher than that for CRWR = 1. The CRWR design had a significant impact on the mass transfer behavior of oxygen. Moreover, the thermal power through the rib was significantly higher than that through the GC (>3.5 times). As the CRWR increases, the importance of heat conduction in the rib becomes more pronounced.

Author Contributions

Conceptualization, X.L.; methodology, X.C. and X.L.; software, X.C.; validation, X.C., C.W., Y.L., J.C., Z.Y., J.H. and X.L.; formal analysis, X.C., C.W. and X.L.; investigation, X.C.; resources, X.C. and X.L.; data curation, X.C.; writing—original draft preparation, X.C. and X.L.; writing—review and editing, X.C., Z.Y., Y.C. and X.L.; visualization, Y.C. and X.L.; supervision, Y.C.; project administration, X.L.; funding acquisition, X.L. All authors have read and agreed to the published version of the manuscript.

Funding

This research was funded by Science and Technology Planning Project of Guangdong Province, grant number 2021A0505030065.

Data Availability Statement

The data presented in this study are available on request from the corresponding author. The data are not publicly available due to privacy.

Conflicts of Interest

The authors declare no conflicts of interest.

Abbreviations

The following abbreviations, variables and subscripts are used in this manuscript:
CRWRchannel-to-rib width ratio
GDLgas diffusion layer
BPbipolar plate
PEMFCproton exchange membrane fuel cell
GCgas channel
MEAmembrane electrode assembly
CRcompression ratio
HORhydrogen oxidation reaction
ACLanodic catalyst layer
ORRoxygen reduction reaction
CCLcathodic catalyst layer
CCMcatalyst-coated membrane
SymbolsMeaning (units)
PFirst Piola–Kirchhoff stress (Pa)
δStress (Pa)
FDeformation gradient tensor (/)
FvVolume force vector (N m−3)
IUnit matrix (/)
uDisplacement field (m)
StStrain (/)
fvForce in the vertical direction (N)
SSecond Piola–Kirchhoff stress (Pa)
SinelInelastic stress tensor (Pa)
WsStrain energy density (J m−3)
σCauchy stress (Pa)
JElastic volume ratio (/)
εElastic Green-Lagrange strain (/)
JelElastic volumetric deformation (/)
μLamé parameters (Pa)
λLamé parameters (Pa)
vpPoisson ratio (/)
YYoung’s modulus (Pa)
I1First invariant of the elastic right Cauchy–Green deformation tensor (/)
EeqReversible potential (V)
RIdeal gas constant (J kg−1 K−1)
TOperating temperature of PEMFC (K)
pH2/pO2/pH2OParticle pressure of hydrogen/oxygen/steam (Pa)
prefReference gas pressure (Pa)
ian/icathAnode/cathode electrochemical reaction rate (A m−3)
i0,an/i0,cathAnode/cathode exchange current density (A m−2)
aan/acathAnode/cathode active specific surface region (m−1)
ηActivation overpotential (V)
Φe/ΦpElectric potential of the electron/proton phase (V)
nCharge number in electrochemical reactions (/)
αa/αcAnode/cathode transfer coefficient (/)
viStoichiometric coefficient of the reacting species of index i (/)
ΔSTotal reaction entropy (J mol−1 K−1)
ΔGChange in Gibbs free energy (J mol−1)
ΔΦ0Reversible potential (V)
FFCFaraday constant (C mol−1)
ΔSHORReaction entropy of HOR (J mol−1 K−1)
ΔSORRReaction entropy of ORR (J mol−1 K−1)
RHRelative humidity (%)
ΔHEnthalpy of reaction (J mol−1)
psatSaturated vapor pressure of water (Pa)
σe/σpElectronic/protonic conductivity (S m−1)
Se/SpSource term of electron/proton transport equation (A m−3)
mPtSpecific surface area of Pt (kg m−2)
AsSurface area of Pt (m2 g−1)
KViscous stress tensor (Pa)
μDynamic viscosity (kg m−1 s−1)
κPermeability of gas(m2)
ρDensity (kg m−3)
εpPorosity (/)
QmMass source per unit volume of the porous medium (kg m−3 s−1)
cFForchheimer parameter (/)
CpSpecific heat capacity at constant pressure (J kg−1 K−1)
qcondHeat flux density of heat conduction (W m−2)
pcPressure of cooling medium (Pa)
τViscous stress tensor (Pa)
ufFlow velocity (m s−1)
kThermal conductivity (W m−1 K−1)
kuncomp, GDLThermal conductivity of uncompressed GDL (W m−1 K−1)
εcomp, GDLPorosity of compressed GDL (/)
εGDLPorosity of uncompressed GDL (/)
CRcompression ratio (/)
“/” means dimension is 1.

References

  1. Jiao, K.; Xuan, J.; Du, Q.; Bao, Z.; Xie, B.; Wang, B.; Zhao, Y.; Fan, L.; Wang, H.; Hou, Z.; et al. Designing the next Generation of Proton-Exchange Membrane Fuel Cells. Nature 2021, 595, 361–369. [Google Scholar] [CrossRef]
  2. Zhang, Q.; Dong, S.; Shao, P.; Zhu, Y.; Mu, Z.; Sheng, D.; Zhang, T.; Jiang, X.; Shao, R.; Ren, Z.; et al. Covalent Organic Framework–Based Porous Ionomers for High-Performance Fuel Cells. Science 2022, 378, 181–186. [Google Scholar] [CrossRef]
  3. Lim, K.H.; Lee, A.S.; Atanasov, V.; Kerres, J.; Park, E.J.; Adhikari, S.; Maurya, S.; Manriquez, L.D.; Jung, J.; Fujimoto, C.; et al. Protonated Phosphonic Acid Electrodes for High Power Heavy-Duty Vehicle Fuel Cells. Nat. Energy 2022, 7, 248–259. [Google Scholar] [CrossRef]
  4. Cullen, D.A.; Neyerlin, K.C.; Ahluwalia, R.K.; Mukundan, R.; More, K.L.; Borup, R.L.; Weber, A.Z.; Myers, D.J.; Kusoglu, A. New Roads and Challenges for Fuel Cells in Heavy-Duty Transportation. Nat. Energy 2021, 6, 462–474. [Google Scholar] [CrossRef]
  5. Zhang, H.; Rahman, M.A.; Mojica, F.; Sui, P.; Chuang, P.A. A Comprehensive Two-Phase Proton Exchange Membrane Fuel Cell Model Coupled with Anisotropic Properties and Mechanical Deformation of the Gas Diffusion Layer. Electrochim. Acta 2021, 382, 138273. [Google Scholar] [CrossRef]
  6. Pan, Y.; Wang, H.; Brandon, N.P. Gas Diffusion Layer Degradation in Proton Exchange Membrane Fuel Cells: Mechanisms, Characterization Techniques and Modelling Approaches. J. Power Sources 2021, 513, 230560. [Google Scholar] [CrossRef]
  7. Yan, S.; Yang, M.; Sun, C.; Xu, S. Liquid Water Characteristics in the Compressed Gradient Porosity Gas Diffusion Layer of Proton Exchange Membrane Fuel Cells Using the Lattice Boltzmann Method. Energies 2023, 16, 6010. [Google Scholar] [CrossRef]
  8. Xia, L.; Xu, Q.; He, Q.; Ni, M.; Seng, M. Numerical Study of High Temperature Proton Exchange Membrane Fuel Cell (HT-PEMFC) with a Focus on Rib Design. Int. J. Hydrogen Energy 2021, 46, 21098–21111. [Google Scholar] [CrossRef]
  9. Acar, M.C. Channel to Rib Width Ratio Effect on Thermal Performance of Cooling Plate in Polymer Electrolyte Membrane Fuel Cell. Fuel Cells 2022, 22, 154–168. [Google Scholar] [CrossRef]
  10. Pan, W.; Chen, X.; Wang, F.; Dai, G. Mass Transfer Enhancement of PEM Fuel Cells with Optimized Flow Channel Dimensions. Int. J. Hydrogen Energy 2021, 46, 29541–29555. [Google Scholar] [CrossRef]
  11. Qiu, D.; Peng, L.; Tang, J.; Lai, X. Numerical Analysis of Air-Cooled Proton Exchange Membrane Fuel Cells with Various Cathode Flow Channels. Energy 2020, 198, 117334. [Google Scholar] [CrossRef]
  12. Zeng, X.; Ge, Y.; Shen, J.; Zeng, L.; Liu, Z.; Liu, W. The Optimization of Channels for a Proton Exchange Membrane Fuel Cell Applying Genetic Algorithm. Int. J. Heat Mass Transf. 2017, 105, 81–89. [Google Scholar] [CrossRef]
  13. Zhang, J.; Hu, Y. Sealing Performance and Mechanical Behavior of PEMFCs Sealing System Based on Thermodynamic Coupling. Int. J. Hydrogen Energy 2020, 45, 23480–23489. [Google Scholar] [CrossRef]
  14. Simon, C.; Hasché, F.; Gasteiger, H.A. Influence of the Gas Diffusion Layer Compression on the Oxygen Transport in PEM Fuel Cells at High Water Saturation Levels. J. Electrochem. Soc. 2017, 164, F591–F599. [Google Scholar] [CrossRef]
  15. Mason, T.J.; Millichamp, J.; Neville, T.P.; El-kharouf, A.; Pollet, B.G.; Brett, D.J.L. Effect of Clamping Pressure on Ohmic Resistance and Compression of Gas Diffusion Layers for Polymer Electrolyte Fuel Cells. J. Power Sources 2012, 219, 52–59. [Google Scholar] [CrossRef]
  16. Radhakrishnan, V.; Haridoss, P. Effect of Cyclic Compression on Structure and Properties of a Gas Diffusion Layer Used in PEM Fuel Cells. Int. J. Hydrogen Energy 2010, 35, 11107–11118. [Google Scholar] [CrossRef]
  17. Niblett, D.; Guo, Z.; Holmes, S.; Niasar, V.; Prosser, R. Utilization of 3D Printed Carbon Gas Diffusion Layers in Polymer Electrolyte Membrane Fuel Cells. Int. J. Hydrog. Energy 2022, 47, 23393–23410. [Google Scholar] [CrossRef]
  18. Yu, J.; Jiang, Z.; Hou, M.; Liang, D.; Xiao, Y.; Dou, M.; Shao, Z.; Yi, B. Analysis of the Behavior and Degradation in Proton Exchange Membrane Fuel Cells with a Dead-Ended Anode. J. Power Sources 2014, 246, 90–94. [Google Scholar] [CrossRef]
  19. Kang, M.; Sim, J.; Min, K. Analysis of Surface and Interior Degradation of Gas Diffusion Layer with Accelerated Stress Tests for Polymer Electrolyte Membrane Fuel Cell. Int. J. Hydrogen Energy 2022, 47, 29467–29480. [Google Scholar] [CrossRef]
  20. Chen, G.; Xu, Q.; Xuan, J.; Liu, J.; Fu, Q.; Shi, W.; Su, H.; Xing, L. Numerical Study of Inhomogeneous Deformation of Gas Diffusion Layers on Proton Exchange Membrane Fuel Cells Performance. J. Energy Storage 2021, 44, 103486. [Google Scholar] [CrossRef]
  21. Zhou, Y.; Jiao, K.; Du, Q.; Yin, Y.; Li, X. Gas Diffusion Layer Deformation and Its Effect on the Transport Characteristics and Performance of Proton Exchange Membrane Fuel Cell. Int. J. Hydrogen Energy 2013, 38, 12891–12903. [Google Scholar] [CrossRef]
  22. Bao, Z.; Li, Y.; Zhou, X.; Gao, F.; Du, Q.; Jiao, K. Transport Properties of Gas Diffusion Layer of Proton Exchange Membrane Fuel Cells: Effects of Compression. Int. J. Heat Mass Transf. 2021, 178, 121608. [Google Scholar] [CrossRef]
  23. Zhou, X.; Niu, Z.; Bao, Z.; Wang, J.; Liu, Z.; Yin, Y.; Du, Q.; Jiao, K. Two-Phase Flow in Compressed Gas Diffusion Layer: Finite Element and Volume of Fluid Modeling. J. Power Sources 2019, 437, 226933. [Google Scholar] [CrossRef]
  24. Zhang, Z.; He, P.; Dai, Y.-J.; Jin, P.-H.; Tao, W.-Q. Study of the Mechanical Behavior of Paper-Type GDL in PEMFC Based on Microstructure Morphology. Int. J. Hydrogen Energy 2020, 45, 29379–29394. [Google Scholar] [CrossRef]
  25. Meng, L.; Zhou, P.; Yan, Y.; Guo, D. Compression Properties of Gas Diffusion Layers and Its Constitutive Model under Cyclic Loading. Int. J. Hydrogen Energy 2021, 46, 15965–15975. [Google Scholar] [CrossRef]
  26. Yan, X.; Lin, C.; Zheng, Z.; Chen, J.; Wei, G.; Zhang, J. Effect of Clamping Pressure on Liquid-Cooled PEMFC Stack Performance Considering Inhomogeneous Gas Diffusion Layer Compression. Appl. Energy 2020, 258, 114073. [Google Scholar] [CrossRef]
  27. Sadeghi, E.; Djilali, N.; Bahrami, M. Effective Thermal Conductivity and Thermal Contact Resistance of Gas Diffusion Layers in Proton Exchange Membrane Fuel Cells. Part 1: Effect of Compressive Load. J. Power Sources 2011, 196, 246–254. [Google Scholar] [CrossRef]
  28. Xiao, Y.; Gao, Z.; Gao, F.; Zhang, T.; Zhang, W.; Li, Z.; Ma, X.; Qi, J. Improved Analytical Modeling and Mechanical Characterization of Gas Diffusion Layers under Compression Load. Energy Sci. Eng. 2020, 8, 2799–2807. [Google Scholar] [CrossRef]
  29. Afrasiab, H.; Emami Gharehhajloo, E.; Barzegari, M.M. Electrical and Mechanical Characterization of the Gas Diffusion Layer during Compression in PEM Fuel Cells. Int. J. Hydrogen Energy 2023, 48, 31996–32010. [Google Scholar] [CrossRef]
  30. Li, W.Z.; Yang, W.W.; Zhang, W.Y.; Qu, Z.G.; He, Y.L. Three-Dimensional Modeling of a PEMFC with Serpentine Flow Field Incorporating the Impacts of Electrode Inhomogeneous Compression Deformation. Int. J. Hydrogen Energy 2019, 44, 22194–22209. [Google Scholar] [CrossRef]
  31. Senthil Velan, V.; Velayutham, G.; Rajalakshmi, N.; Dhathathreyan, K.S. Influence of Compressive Stress on the Pore Structure of Carbon Cloth Based Gas Diffusion Layer Investigated by Capillary Flow Porometry. Int. J. Hydrogen Energy 2014, 39, 1752–1759. [Google Scholar] [CrossRef]
  32. García-Salaberri, P.A.; Vera, M.; Zaera, R. Nonlinear Orthotropic Model of the Inhomogeneous Assembly Compression of PEM Fuel Cell Gas Diffusion Layers. Int. J. Hydrogen Energy 2011, 36, 11856–11870. [Google Scholar] [CrossRef]
  33. Springer, T.E.; Zawodzinski, T.A.; Gottesfeld, S. Polymer Electrolyte Fuel Cell Model. J. Electrochem. Soc. 1991, 138, 2334–2342. [Google Scholar] [CrossRef]
  34. Wang, L. A Parametric Study of PEM Fuel Cell Performances. Int. J. Hydrogen Energy 2003, 28, 1263–1272. [Google Scholar] [CrossRef]
  35. Mohammedi, A.; Sahli, Y.; Moungar, H.; Benhammou, M.; Ben Moussa, H. Investigation, Analysis and Optimization of PEMFC Channel Cross-Section Shape. J. Renew. Energ. 2022, 1, 179. [Google Scholar] [CrossRef]
  36. Perry’s Chemical Engineers’ Handbook, 9th ed.; Green, D.W.; Southard, M.Z. (Eds.) 85th anniversary edition; McGraw Hill Education: New York, NY, USA, 2019; ISBN 978-0-07-183409-4. [Google Scholar]
  37. Xia, L.; Ni, M.; He, Q.; Xu, Q.; Cheng, C. Optimization of Gas Diffusion Layer in High Temperature PEMFC with the Focuses on Thickness and Porosity. Appl. Energy 2021, 300, 117357. [Google Scholar] [CrossRef]
  38. Mohammedi, A.; Sahli, Y.; Moussa, H.B. Optimization Study of the Produced Electric Power by Planar PEMFC-SCG. Renew. Energy Focus 2020, 35, 72–83. [Google Scholar] [CrossRef]
  39. Movahedi, M.; Ramiar, A.; Ranjber, A.A. 3D Numerical Investigation of Clamping Pressure Effect on the Performance of Proton Exchange Membrane Fuel Cell with Interdigitated Flow Field. Energy 2018, 142, 617–632. [Google Scholar] [CrossRef]
  40. Koorata, P.K.; Bhat, S.D. Compressive Cyclic Response of PEM Fuel Cell Gas Diffusion Media. Int. J. Hydrogen Energy 2021, 46, 5570–5579. [Google Scholar] [CrossRef]
  41. Attard, M.M. Finite Strain––Isotropic Hyperelasticity. Int. J. Solids Struct. 2003, 40, 4353–4378. [Google Scholar] [CrossRef]
  42. Lampinen, M.; Fomino, M. Analysis of Different Energy Scales in Chemical Thermodynamics and Estimation of Free Energy and Enthalpy Changes for Half Cell Reactions. J. Electrochem. Soc. 1993, 140, 3537. [Google Scholar] [CrossRef]
  43. NIST Standard Reference Database 13 NIST-JANAF Themochemical Tables. Available online: https://janaf.nist.gov/ (accessed on 14 July 2023).
  44. Wang, Y.; Liu, T.; Sun, H.; He, W.; Fan, Y.; Wang, S. Investigation of Dry Ionomer Volume Fraction in Cathode Catalyst Layer under Different Relative Humilities and Nonuniform Ionomer-Gradient Distributions for PEM Fuel Cells. Electrochim. Acta 2020, 353, 136491. [Google Scholar] [CrossRef]
  45. Chen, X.; Luo, X.; Liang, Y.; Chen, J.; He, J.; Yang, Z.; Chen, Y.; Wang, C.; Du, Y. Modeling and Performance Investigation on the Deformed Gas Diffusion Layer of PEM Fuel Cell. Int. J. Hydrogen Energy 2023, 50, 169–180. [Google Scholar] [CrossRef]
  46. Marr, C.; Li, X. Composition and Performance Modelling of Catalyst Layer in a Proton Exchange Membrane Fuel Cell. J. Power Sources 1999, 77, 0378–7753. [Google Scholar] [CrossRef]
  47. Bird, R.B.; Stewart, W.E.; Lightfoot, E.N. Transport Phenomena; Revised ed.; Wiley: New York, NY, USA, 2007; ISBN 978-0-470-11539-8. [Google Scholar]
  48. Torayca® Carbon Paper for Fuel Cells. Available online: https://toray-cfe.com/en/products/carbon-paper/ (accessed on 1 July 2023).
  49. Zenyuk, I.V.; Parkinson, D.Y.; Connolly, L.G.; Weber, A.Z. Gas-Diffusion-Layer Structural Properties under Compression via X-Ray Tomography. J. Power Sources 2016, 328, 364–376. [Google Scholar] [CrossRef]
  50. Darling, R.M. Examining Ohmic Losses in Fuel-Cell Catalyst Layers with Different Pt/C Ratios. J. Electrochem. Soc. 2020, 167, 084505. [Google Scholar] [CrossRef]
Figure 1. Components of PEMFC and the simulated meshing scheme of PEMFC. (a) Main components of PEMFC (non to scale). (b) Simulated meshing scheme of rectangular GC. The red arrows indicate the direction of fluid flow. (c) Meshing scheme of MEA.
Energies 17 00762 g001
Figure 2. Diagram of rectangular and trapezoidal GC on anodic side. (a) Rectangular GC (CRWR = 1). (b) Trapezoidal GC (CRWR > 1).
Energies 17 00762 g002
Figure 3. Mesh independence and model validation: (a) element independence test; (b) mechanical model validation; (c) PEMFC model validation at an operating temperature of 70 °C; (d) PEMFC model validation at an operating temperature of 50 °C.
Energies 17 00762 g003
Figure 4. Relationship among stress, CR, elastic modulus, and CRWR: (a) stress of GDL and CR of GDL; (b) stress of GDL and elastic modulus of GDL; (c) stress of GDL and CRWR of BP.
Energies 17 00762 g004
Figure 5. Comparison between the results from the proposed PEMFC model and traditional PEMFC model: (a) MEA geometry (anodic side); (b) stress-strain; (c) gas pressure drop in cathodic side; (d) net gas flux in CGDL/CGC interface (net inflow is +, net outflow is −); (e) power density curve.
Energies 17 00762 g005
Figure 6. Relationship between CRWRs of BP and electrical performance of PEMFC.
Energies 17 00762 g006
Figure 7. Mole fraction of hydrogen in AGDM: (a) on the AGDL/ABP interface when U = 0.4 V at CRWR = 1; (b) on the AGDL/ABP interface when U = 0.4 V at CRWR = 2.91; (c) on the AGDL/ACL interface when U = 0.4 V at CRWR = 1; (d) on the AGDL/ACL interface when U = 0.4 V at CRWR = 2.91; (e) on Line1; and (f) on Line2.
Energies 17 00762 g007
Figure 8. Mole fraction of oxygen in CGDM: (a) on the CGDL/CBP interface when U = 0.4 V at CRWR = 1; (b) on the CGDL/CBP interface when U = 0.4 V at CRWR = 2.91; (c) on the CGDL/CCL interface when U = 0.4 V at CRWR = 1; (d) on the CGDL/CCL interface when U = 0.4 V at CRWR = 2.91; (e) on Line5; (f) on Line6; (g) on Line7; and (h) on Line8.
Energies 17 00762 g008
Figure 9. Mole fraction of steam in CGDM: (a) on the CGDL/CBP interface when U = 0.4 V at CRWR = 1; (b) on the CGDL/CBP interface when U = 0.4 V at CRWR = 2.91; (c) on the CGDL/CCL interface when U = 0.4 V at CRWR = 1; (d) on the CGDL/CCL interface when U = 0.4 V at CRWR = 2.91; (e) on Line5; (f) on Line6; (g) on Line7; and (h) on Line8.
Energies 17 00762 g009
Figure 10. Temperature distribution of PEMFC: (a) on the CGDL/CBP interface when U = 0.4 V at CRWR = 1; (b) on the CGDL/CBP interface when U = 0.4 V at CRWR = 2.91; (c) on the CCL/PEM interface when U = 0.4 V at CRWR = 1; (d) on the CCL/PEM interface when U = 0.4 V at CRWR = 2.91; (e) on Line5; (f) on Line6; (g) on Line3; and (h) on Line4.
Energies 17 00762 g010
Figure 11. Performance in the specific interfaces: (a) average heat flux; (b) thermal power.
Energies 17 00762 g011
Table 1. Material properties of PEMFC component.
ParametersBPsGDLsCLsPEM
Young’s modulus (MPa)13,00014249232
Poisson ratio0.260.2560.30.253
Density (kg m−3)178040520592000
Porosity (uncompressed)/0.40.2/
“/” means no data is available.
Table 2. Dimensions of PEMFC components.
ParametersValue
Thickness of PEM (μm)108
Thickness of CL (μm)12.9
Thickness of GDL (μm)300
Thickness of BP (μm)2000
Width of GC (μm)1000
Height of GC (μm)1000
Length of PEMFC (mm)20
Width of cooling channel (μm)1000
Height of cooling channel (μm)1000
Table 3. Operating parameters.
Parameter (Units)Value
Compression ratio of GDL20%
Reference temperature (K)293.15
Anode transfer coefficient0.5
Cathode transfer coefficient3
Gas permeability of GDL under the GC (m2)1.76 × 10⁻¹¹
Gas permeability of GDL under the rib (m2)(1 − CR) × 1.76 × 10⁻¹¹
Gas permeability of CL (m2)1 × 10⁻¹³
Hydrogen flow of GC (L min−1)17.14 × 10⁻³
Oxygen flow of GC (L min−1)31.43 × 10⁻³
Thermal conductivity of BP (W m−1 K−1)55
In-plane/through-plane thermal conductivity of GDL under GC (uncompressed) (W m−1 K−1)8.55/1.71
Thermal conductivity of CL (W m−1 K−1)0.27
Thermal conductivity of PEM (W m−1 K−1)0.12
Temperature of reaction gases (K)343.15
Pressure of reaction gases (atm)3
Temperature of cooling fluid (K)343.15
Flow rate of cooling fluid (m/s)0.05
Tortuosity of GDL1.86
Gas Relative Humidity85%
Table 4. Comparison of porosity, thermal conductivity, and gas permeability when GDL is broken or unbroken.
Is GDL Broken?ExperimentSimulationDeviation
Porosity (%)
Unbroken68.8968.960.10%
Broken4.2064.941446.19%
Thermal Conductivity (W m−1 K−1)
Unbroken5.325.31−0.19%
Broken21.586.09−71.78%
Gas Permeability (m2)
Unbroken1.72 × 10−121.74 × 10−121.16%
Broken4.12 × 10−171.14 × 10−122,770,000%
Table 5. The value of parameters.
Parameter (Unit)LocationU = 0.8 VU = 0.6 VU = 0.4 V
Hydrogen distribution
Difference of mole fraction between inlet and outletAGDL/ACL of CRWR = 10.02860.13860.2059
AGDL/ACL of CRWR = 2.910.02340.16320.2968
Average mole fraction of hydrogenAGDL/ABP interface of CRWR = 10.72240.66070.6237
AGDL/ABP interface of CRWR = 2.910.72540.65390.6016
AGDL/ACL interface of CRWR = 10.72090.65350.6132
AGDL/ACL interface of CRWR = 2.910.72420.64590.5754
Oxygen distribution
Difference of mole fraction between inlet and outletCGDL/CCL of CRWR = 10.05620.14840.1508
CGDL/CCL of CRWR = 2.910.02580.11810.1341
Average mole fraction of oxygenCGDL/CBP interface of CRWR = 10.13460.08620.0781
CGDL/CBP interface of CRWR = 2.910.14800.11800.1052
CGDL/CCL interface of CRWR = 10.12200.03100.0032
CGDL/CCL interface of CRWR = 2.910.13590.5250.0079
Steam distribution
Average mole fraction of steamCGDL/CBP interface of CRWR = 10.28370.34090.3562
CGDL/CBP interface of CRWR = 2.910.25370.30960.3285
CGDL/CCL interface of CRWR = 10.29850.40960.4522
CGDL/CCL interface of CRWR = 2.910.28600.39460.4580
Temperature distribution
Average temperature (K)CGDL/CBP interface of CRWR = 1343.41345.09346.98
CGDL/CBP interface of CRWR = 2.91343.47345.94349.10
Disclaimer/Publisher’s Note: The statements, opinions and data contained in all publications are solely those of the individual author(s) and contributor(s) and not of MDPI and/or the editor(s). MDPI and/or the editor(s) disclaim responsibility for any injury to people or property resulting from any ideas, methods, instructions or products referred to in the content.

