1. Introduction
In recent years, a paradigm shift has occurred in the way electric power systems are planned and operated. The main reason for this is the expansion of low-carbon technologies for electricity generation, transmission, distribution, and consumption. Among these technologies, renewable energy sources (RES) such as photovoltaic and wind power have emerged as prominent solutions. RES applicability is encouraged using the concepts of decarbonization, digitization, and decentralization within the electrical sector. These three pillars are indispensable for promoting the energy transition required across various economic sectors [
1,
2].
According to WindEurope, a renewable energy research institution in Europe, hybrid power plants (HPPs) are facilities responsible for generating energy, consisting of more than one energy generation method connected to a grid at a connection point [
3]. In Brazil, the Energy Research Company (EPE) introduced two concepts related to types of power plants: adjacent power plants, which are characterized by having two generation sources built close to each other and sharing the same land, with separately contracted connections to the basic grid; and associated power plants, which have individual meters for each source, although sharing infrastructure connections and access to the basic grid [
4].
Unlike the previous types of power plants, HPPs have energy sources that are combined in the generation process, connecting to the grid with just one meter, and the origin of the energy is not differentiated [
4].In this way, hybrid systems have proposed source complementarity for optimizing electricity generation, as the individual exploitation of RES faces the limitations of seasonality and intermittency in production. Furthermore, when sources are considered independently, the sizing of the electrical grid requires taking into account the generation peaks of each source, leading to source oversizing and increased energy costs [
5].
In terms of financial feasibility, it is worth noting that economic factors play a crucial role when making decisions regarding the implementation of a hybrid power plant. To conduct studies, indicators are used to quantify the economic characteristics of a project, such as the levelized cost of electricity (LCOE), which is an indicator that quantifies the unit cost of electricity (kWh or MWh) over the course of a project. For hybrid power plants, this metric can be evaluated either by considering the LCOE for each partial source or by taking into account the LCOE for the entire plant [
6].
In addition to the economic analysis, studies on distributed generation systems, whether hybrid or not, should be categorized based on their connection to the electrical grid. Grid-connected systems are interconnected with the conventional electrical grid, while off-grid systems operate independently, generating energy in isolated areas. Thus, the usage of specialized software, such as HOMER Grid and HOMER Pro, is essential for assessing which type of distributed generation system is most suitable, depending on the installation location and load [
7,
8].
Hybridization aims to meet energy demands, whether in remote areas or within existing generation facilities. The integration of storage systems, for example, presents several opportunities for managing energy dispatch, especially when utilizing uncontrollable sources like solar and wind, allowing compensation during periods of higher tariffs. Furthermore, the adoption of renewable sources, such as wind and solar energy, aims to expand low-carbon energy generation, aligning with the three pillars of the abovementioned energy transition (decarbonization, decentralization, and digitalization) [
9,
10].
Thus, conducting technical-economic feasibility studies for hybrid power plants allows providing a comprehensive view, encompassing aspects of the electrical system, financial indicators, and evaluation of site-specific characteristics of the HPP. This type of study also allows a scientific approach for obtaining the best arrangement for new hybrid plants; the broad evaluation of existing plants that can be reconfigured as hybrid plants to achieve greater energy efficiency; and the discovery of new assets as a RES for the HPP.
This article aims to address a research gap concerning the analysis of scenarios involving the implementation of a hybrid power plant (HPP) composed of photovoltaic, wind, and BESS in Casa Nova, located in the state of Bahia, Brazil. The mentioned scenarios goal was to determine the ideal proportion of energy supply for Casa Nova by means of an analysis of the aforementioned technical, financial, and social aspects. The region in question experiences high levels of sunlight and favorable winds, making it conducive to the construction of such ventures.
Moreover, this article aims to present the advantages and disadvantages of constructing HPPs, considering the simulations conducted and data obtained from the existing literature [
11,
12]. To perform simulations and obtain results for the HPP feasibility study, HOMER Pro software was used, in line with various similar studies [
13,
14]. It is important to note that the methodology proposed in this work can be effectively adapted and reproduced for diverse settings, making it a valuable resource for evaluating the feasibility of similar HPP research worldwide.
Regarding the organization of this paper,
Section 2 provides the methodological framework of the study, as well as the data used for the simulations.
Section 3 presents the results obtained, while
Section 4 provides an analysis of the scenarios. Finally,
Section 5 offers the conclusions and final considerations of the paper.
2. Materials and Methods
This section describes the hybrid power plant used as a case study, as well as presenting the methodology used to define the load and the simulated scenarios.
2.1. Proposed Methodological Approach
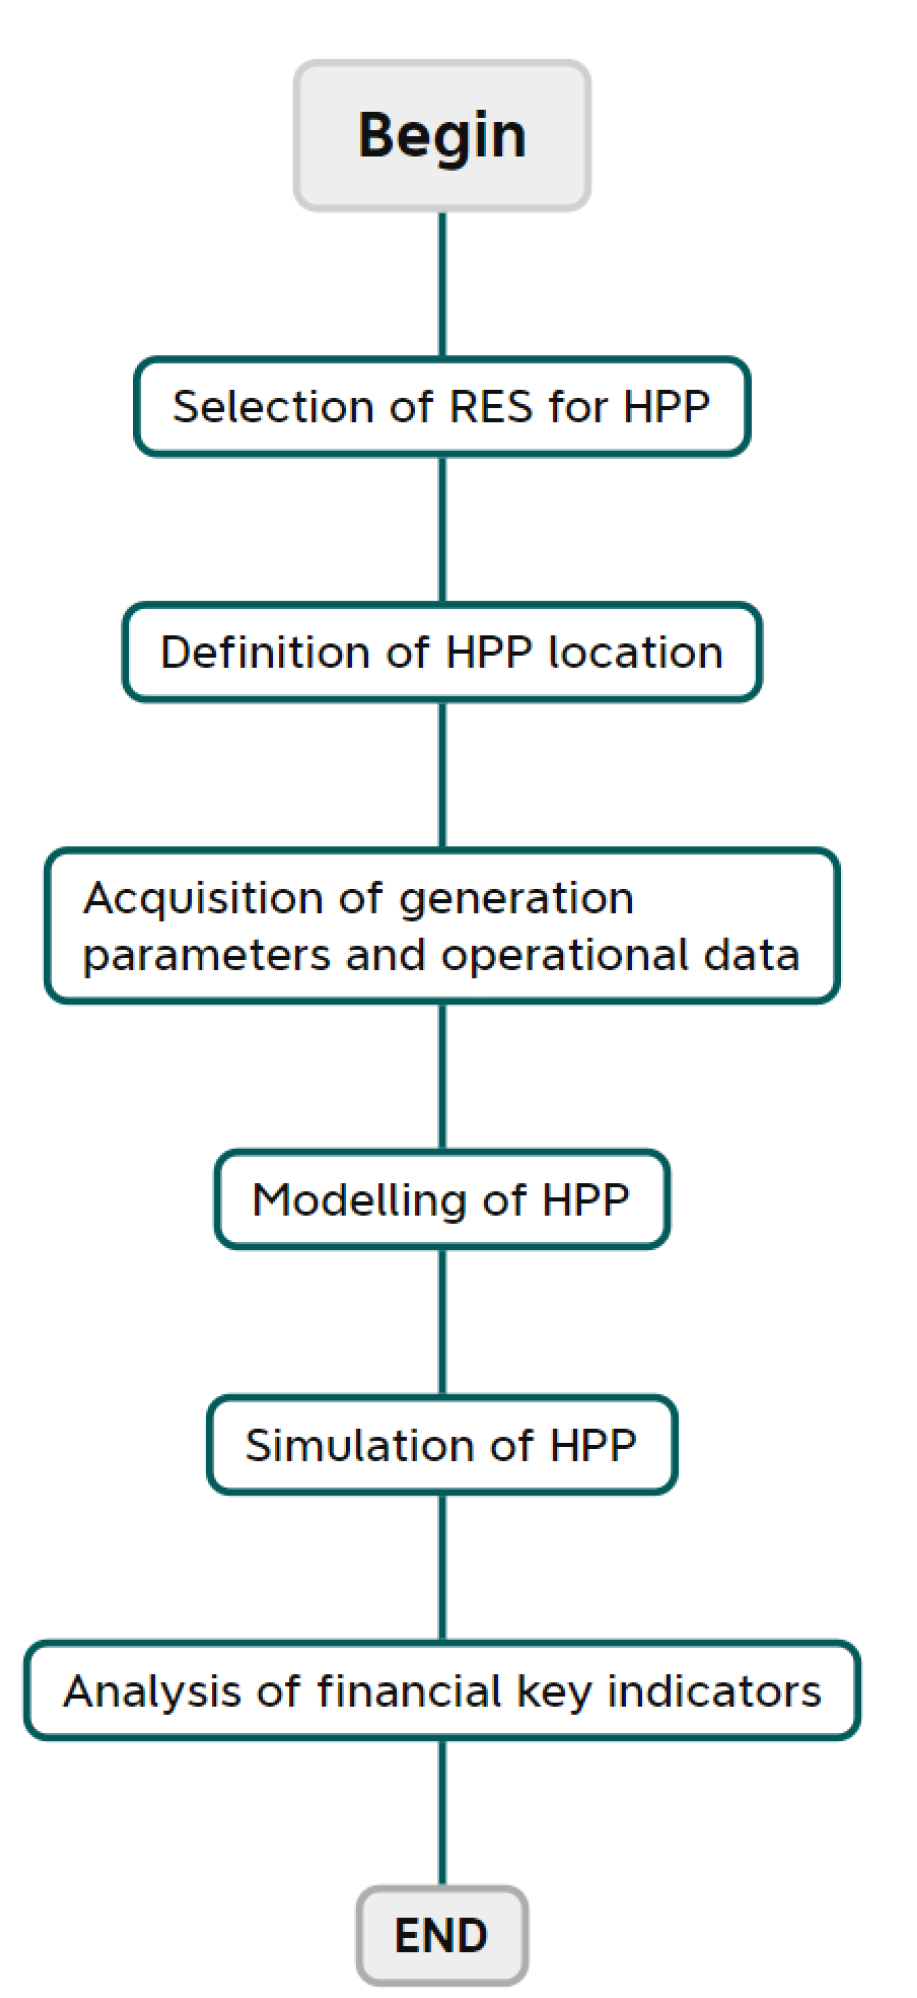
This work is organized based on six main steps, which compose the structure of the applied methodology for techno-economic assessment of the implementation of a hybrid off-grid system:
Selection of RES for HPP: The initial step involves the careful choice of renewable energy sources suited for the specific case study. Hybrid systems can encompass a range of configurations, from renewable sources to combinations involving diesel, PV, and battery storage, for example.
Definition of HPP Location: Selecting the installation site is an important step, because of the direct influence on solar potential and wind patterns, both of which are location-dependent factors.
Acquisition of Generation Parameters and Operational Data: Organizing data collection is essential for establishing the electric grid parameters, such as the load curve, wind speed, and solar generation. Data may be sourced from public databases or collected using instrumentation like anemometers and solar measurement devices.
Modelling of the HPP: To achieve simulation, first, it is necessary to model the systems that comprise the power plant by choosing equipment and defining electric and financial parameters, such as generation capacity, costs, lifetime, and behavior over time.
Simulation of HPP: Once all input parameters have been established, the simulation phase can precede. This phase involves running the HPP model in a specialized software (HOMER PRO Version 3.16.2) to generate results that offer insights into the system’s performance and feasibility.
Analysis of Financial Key Indicators: The final step involves analysis of the simulation results from a financial perspective. Key indicators, including LCOE and payback period, can be considered to assess the technological and economic feasibility of the system.
Figure 1 summarizes the methodological approach proposed in this work, highlighting each step.
2.2. Case Study
The increase in RES provides a growing opportunity to combine various resources within a single infrastructure to create hybrid power plants. Consequently, research, development, and innovation (RD&I) projects provide a chance to understand the behavior of hybrid systems.
For example, this work was motivated by a RD&I project conducted by SENAI CIMATEC, with funding by Eletrobras CHESF and identified as PD-0048-0217/2020 by the ANEEL (National Electric Energy Agency). This project aims to integrate solar and wind energy, while incorporating energy storage systems, in the city of Casa Nova, Bahia, Brazil. Projects like this one are developed to validate essential concepts associated with the technology behind Brazilian energy production through HPPs.
In this way, the content of this subsection is tailored to delve into the specific case study of Casa Nova, encompassing details ranging from the HPP characteristics to financial analysis, data utilization, computational modeling, and the simulations conducted.
2.2.1. Selection of Hybrid Power Plant Assets
The HPP under construction consists of a photovoltaic (PV) system, wind turbines (WT) and a battery energy storage system (BESS), directly connected to a load representing the city of Casa Nova, BA. In addition, it is necessary to use inverters to convert DC sources for the HPP connection, allowing the delivery of energy to the load in the AC bus.
It is worth noting that HPPs can be constructed using other types of energy resources beyond photovoltaic, wind, and BESS. They have the capability to incorporate a variety of additional sources, such as thermal energy and biomass. This allows for the development of hybrid systems that leverage existing infrastructures by integrating other sources for hybridization, or even establishing entirely new energy ecosystems [
15]. In the specific case study mentioned, the same energy sources utilized in the previously mentioned RD&I project were employed.
2.2.2. Plant Location Definition
To select the location where simulations for the HPP would be implemented, it was determined that the chosen site should have a high solar and wind incidence. Additionally, the preference for a more remote location stemmed from the objective of assessing the feasibility and performance of the hybrid power plant in areas that might have limited access to transmission lines.
Therefore, the city chosen for this case study was Casa Nova, located in the state of Bahia. Casa Nova is a county in a semi-arid region and has aproximately 71,000 habitants in a area of 10,000 km2. The city already has wind farms with its proximity for local energy generation and dispatch to the national grid.
2.2.3. Data Collection and Processing
For obtaining the generation parameters and operational data, we focus on the initial system settings and data acquisition, and then delve into the creation of the load curve for Casa Nova city, utilizing the gathered data.
In this research, the database of the Brazilian companies and regulatory bodies (e.g., ANEEL, ONS, and EPE) was used to characterize the HPP assets and load profiles. We looked for records representing the energy consumption of Casa Nova, and the most recent data cut-off was 2016, which limited the acquisition of all other data to that year.
To characterize a load, it is necessary to create a curve that represents the daily consumption profile. First, the database from ONS was consulted to obtain the data consumption per hour for the whole Brazilian electric grid. ONS provide a standardized daily load curve for the each region of the country, and in this case the Northeast region was considered [
16]. Therefore, a percentage ratio was defined between the consumption of Bahia in relation to the Northeast and the consumption of Casa Nova in relation to Bahia.
Table 1 presents the procedure for collecting information that composed the inputs for acquiring the load curve of Casa Nova and each step of the data processing.
The relationship between Bahia and the Northeast region was obtained using data from the Statistical Yearbook of Electrical Energy, provided by EPE. This book contains various data related to energy consumption, both by region and by state, considering free and captive markets. In turn, the relationship between Casa Nova and the state of Bahia was determined through the acquisition of real energy consumption registers provided by the government of the state of Bahia and recorded by the local distributor company.
This database contains the energy consumption for all cities in Bahia, segmented by consumer class (e.g., industrial, commercial, and residential). Thus, the values for Casa Nova were segmented, and the data for all cities were summed to obtain an overview of the total consumption in Bahia, considering only the captive market. Afterward, the database from ANEEL for the same year for the captive market was consulted, which contains the energy consumption for all Brazilian states, segmented by class. Then, the results were checked to compare the data from the state of Bahia provided by the two sources [
17,
18].
Table 2 illustrates both records: Bahia consumption provided by ANEEL and the state government, highlighting the data for the city of Casa Nova.
As observed through an analysis of the table, the data related to the state of Bahia for the captive market are very close, with a margin of error of 0.004%, which validated their use for the simulations. Additionally, from the Statistical Yearbook of Electrical Energy, it was found that Bahia’s and the Northeast’s total consumptions of energy in 2016, considering both captive and free market, were equal to 23,945.41 GWh and 79,501.30 GWh, respectively [
19].
In Equation (
1), it can be seen that the municipality of Casa Nova represented 0.4971% of Bahia’s load. Using the same rule, Equation (
2) shows the result of the relationship between Bahia and the Northeast region. Therefore, two successive downscaling steps for the curve obtained for the Northeast region were performed using the mathematical relationships described. The first step considered the relationship between the Northeast and Bahia, and the second step considered Casa Nova and Bahia.
2.2.4. Computational Modeling of the Hybrid Power Plant
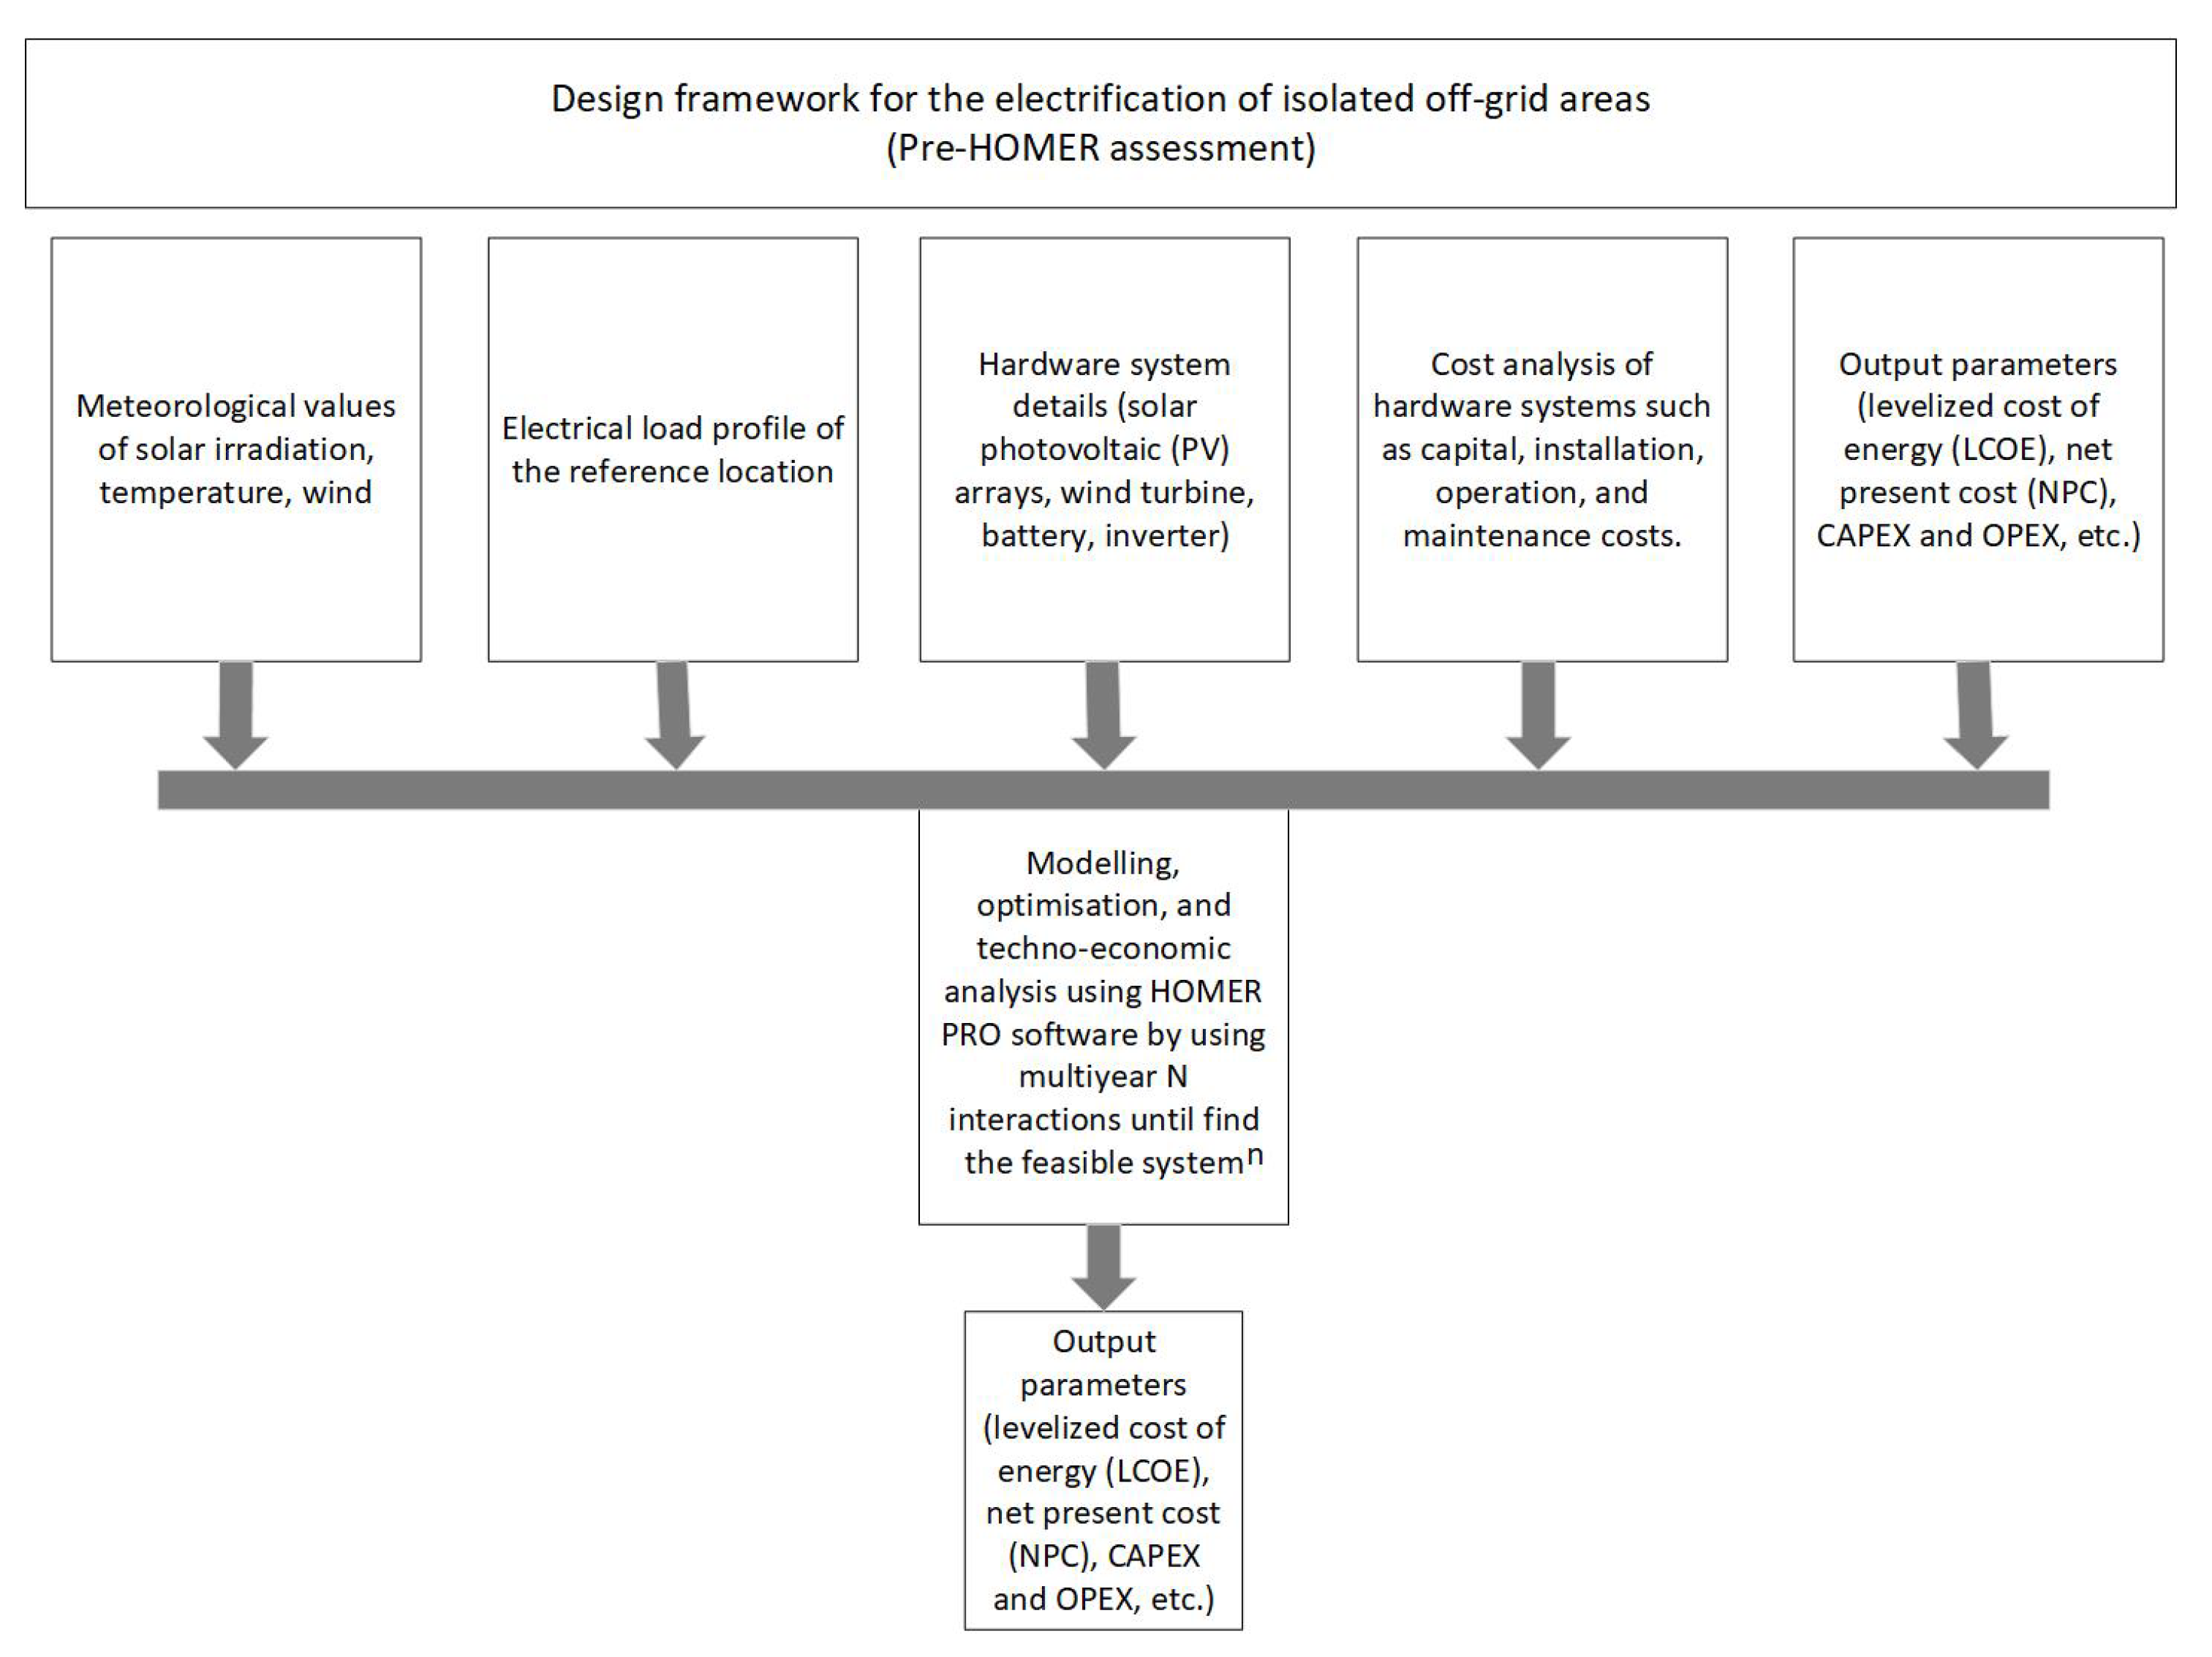
In order to describe the model of the hybrid power plant used for this simulation, it is necessary to elucidate the method employed in HOMER Pro for performing these calculations. The software operates with an optimization framework called the HOMER Optimizer that, using technical, economic, and climatic input data, identifies the optimal scenario considering financial indicators such as LCOE and NPC.
Figure 2 presents a flowchart outlining the main stages of the optimization process [
20].
It is interesting to mention that the financial indicators cited (i.e., LCOE and NPC) are referred to as intrinsic parameters, whereas there are other parameters called extrinsic. Among these, we can highlight payback, which relates to the period in which the cumulative cash flows of the difference between the current system and the base system switch from a negative value to a positive one. This relationship is quantified through a measure of time required to obtain a return on the investment made, in relation to a reference value. Moreover, for the construction of an economic feasibility study, it was necessary to consider both intrinsic and extrinsic parameters [
21]. The parameters utilized in the simulation and the implemented methods used to fulfill the R&D requirements in this case study will be described in
Section 2.2.6.
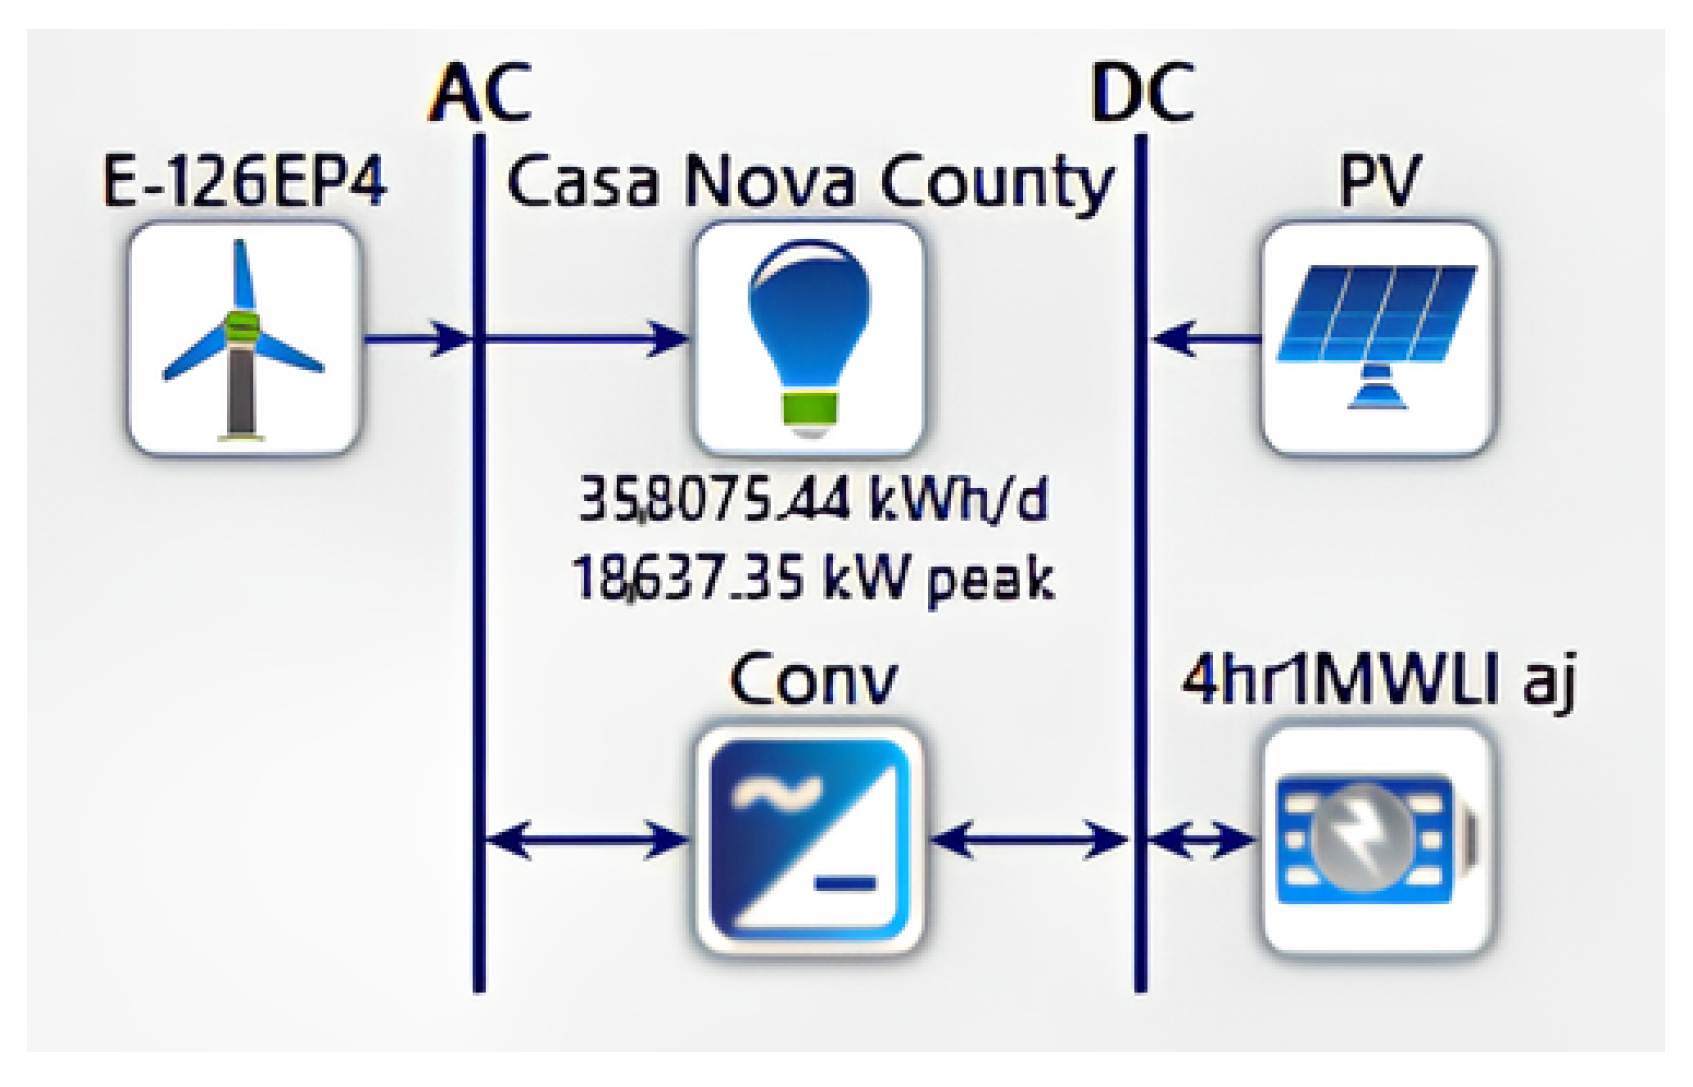
Regarding the hybrid system itself, which was implemented in HOMER Pro,
Figure 3 shows the connections between the DC and AC buses that composed the hybrid plant and served the load. Each of the HPP subsystems are highlighted, including the PV, WT, BESS, converters, and the connection with the load.
It is necessary to describe the main equipment used to calculate the financial indicators used for the simulation results.Furthermore, it was also possible to use the software’s native libraries to determine the characteristics of the equipment based on commercial models. For this simulation, real equipment data were input, based on technical information provided by the manufacturers, as detailed in
Table 3.
Additionally, solar radiance and wind speed records were incorporated. These records were obtained from publicly available NASA data considering the city of Casa Nova as a reference. This feature is native to the HOMER Pro software, and invloves inputting the latitude and longitude of the reference location [
22]. The tilt of the solar panels was also configured according to the latitude of the location, corresponding to a tilt angle of 9.14 degrees.
As for the wind system, the main associated costs incorporated into the simulation are described in
Table 4. These costs included those associated with the implementation of a wind system, considering a fixed cost for 1 kW and for a 4.2 MW wind turbine, as well as the expenses related to operation and maintenance (O&M). For both values, the reference was the estimated indicators presented by the 2021 Power Generation Costs Report from EPE. The cost for the eventual replacement of equipment was also included and was equivalent to 70% of the installation at the end of their 20-year lifetime [
23].
For the photovoltaic system, the costs are described in
Table 5. Unlike the way the wind system was implemented, the data were incorporated considering different peak power values, as presented by the reference from Canal Solar Brasil [
24]. The O&M estimate was based on the EPE’s 2021 Power Generation Costs Report, which considered the value of R
$50 per kWp. Similarly to the wind system, the replacement data corresponded to 70% of the installation cost of the photovoltaic plant [
23,
24]. The acquisition cost of the inverter considered was obtained from market research, considering a cost of R
$40,000 for a 125 kW inverter.
Table 6 presents the costs for the BESS. Similar to the other systems, this describes the main costs involved in the implementation of this system. In this case, a commercial quotation was considered with a national supplier for a 1 MW system, and the costs are broken down into equipment and installation services. The O&M value was considered to be equivalent to 1% of the total cost [
25].
For battery dispatch control, a combined dispatch control logic was used, varying between meeting the load and charging the battery bank. Regarding the inputs for the financial and economic parameters, a discount rate of 8% and an average annual inflation rate of 6.06% were adopted, based on the average of the last 10 years in Brazil [
26].
2.2.5. Hybrid Power Plant Simulation
In this case study, HOMER Pro software was used, as it is a computational simulation tool that is primarily focused on off-grid hybrid systems. This software is specialized for microgrid optimization and was chosen due to its capability for conducting feasibility studies for hybrid power plants. Despite this work being based on HOMER, the methodology is replicable and could be applied using different optimization software and tools for hybrid generation systems.
The HOMER results presented different possibilities for the design of the project, indicating which one was the optimal arrangement based on the financial results. The results obtained provided insights into the various possible scenarios, with engineering and financial data, aimed at providing greater robustness to the analyses. Furthermore, this software carries out three essential tasks using the raw data supplied by the user: simulation, optimization, and sensitivity analysis, in which various energy combinations can be modeled, including solar panel arrays, wind turbines, utility load, generators, and battery backup systems [
7]. These functionalities and the optimization flowchart are detailed further in
Section 2.2.4.
For each simulation, three possible scenarios were considered in this case study to assess the feasibility of installing an off-grid system to meet the total or partial consumption of the region. These scenarios are characterized by the variation in the percentage of the load curve defined for the city of Casa Nova, representing the different consumptions of the different energy approaches.Moreover, the scenarios highlighted features related to the costs and optimization. “Scenario 1”, where the HPP met the entire demand, was considered the most expensive. “Scenario 2”, where the plant supplied half of demand, was classified as intermediate. Meanwhile, “Scenario 3”, where the majority of the load was supplied by the grid was considered optimal.
Table 7 presents these three scenarios and the corresponding percentages of the load curve.
2.2.6. Financial Analysis
In the energy sector, the levelized cost of energy (LCOE) is a significant parameter considered when evaluating the implementation of generation systems. LCOE represents the fraction between the yearly cost of the system (including components, operation, maintenance, and replacements) and the total energy production. This economic indicator is given by Equation (
3) [
21,
27].
It is important to highlight that the financial competitiveness of energy systems can vary and become better depending on technological advancements, battery costs, incentive policies, energy tariffs, and other local factors. Therefore, feasibility and financial analyses should be updated as these factors evolve over time.
Simple payback is another financial indicator that can be calculated to analyze the time it takes for an initial investment to be recouped. In this case, the return is obtained through energy savings or revenue generation. A shorter simple payback period often indicates a more attractive investment and suggests which projects are worth pursuing, as this signifies quicker returns on capital and an increased cash flow for further sustainability initiatives. The payback period can be determined by dividing the investment costs for the project by the income generated in a year [
28], as in Equation (
4).
This is particularly valuable in the energy sector, because cost-effectiveness and quick returns play a vital role in choosing to adopt renewable and sustainable energy solutions.
3. Results
This section presents the results for the data collection, through to the simulation outputs used to conduct analyses regarding the technical and economic feasibility of installing a hybrid off-grid system for the city of Casa Nova—Bahia.
3.1. Load Curve
From the data collection and processing presented in
Section 2.2.3, it was found that the state of Bahia represented 30.12% of the Northeast’s consumption in the year 2016 [
19]. Additionally, the percentage of Casa Nova in relation to the Northeast region was approximately 0.4971%.
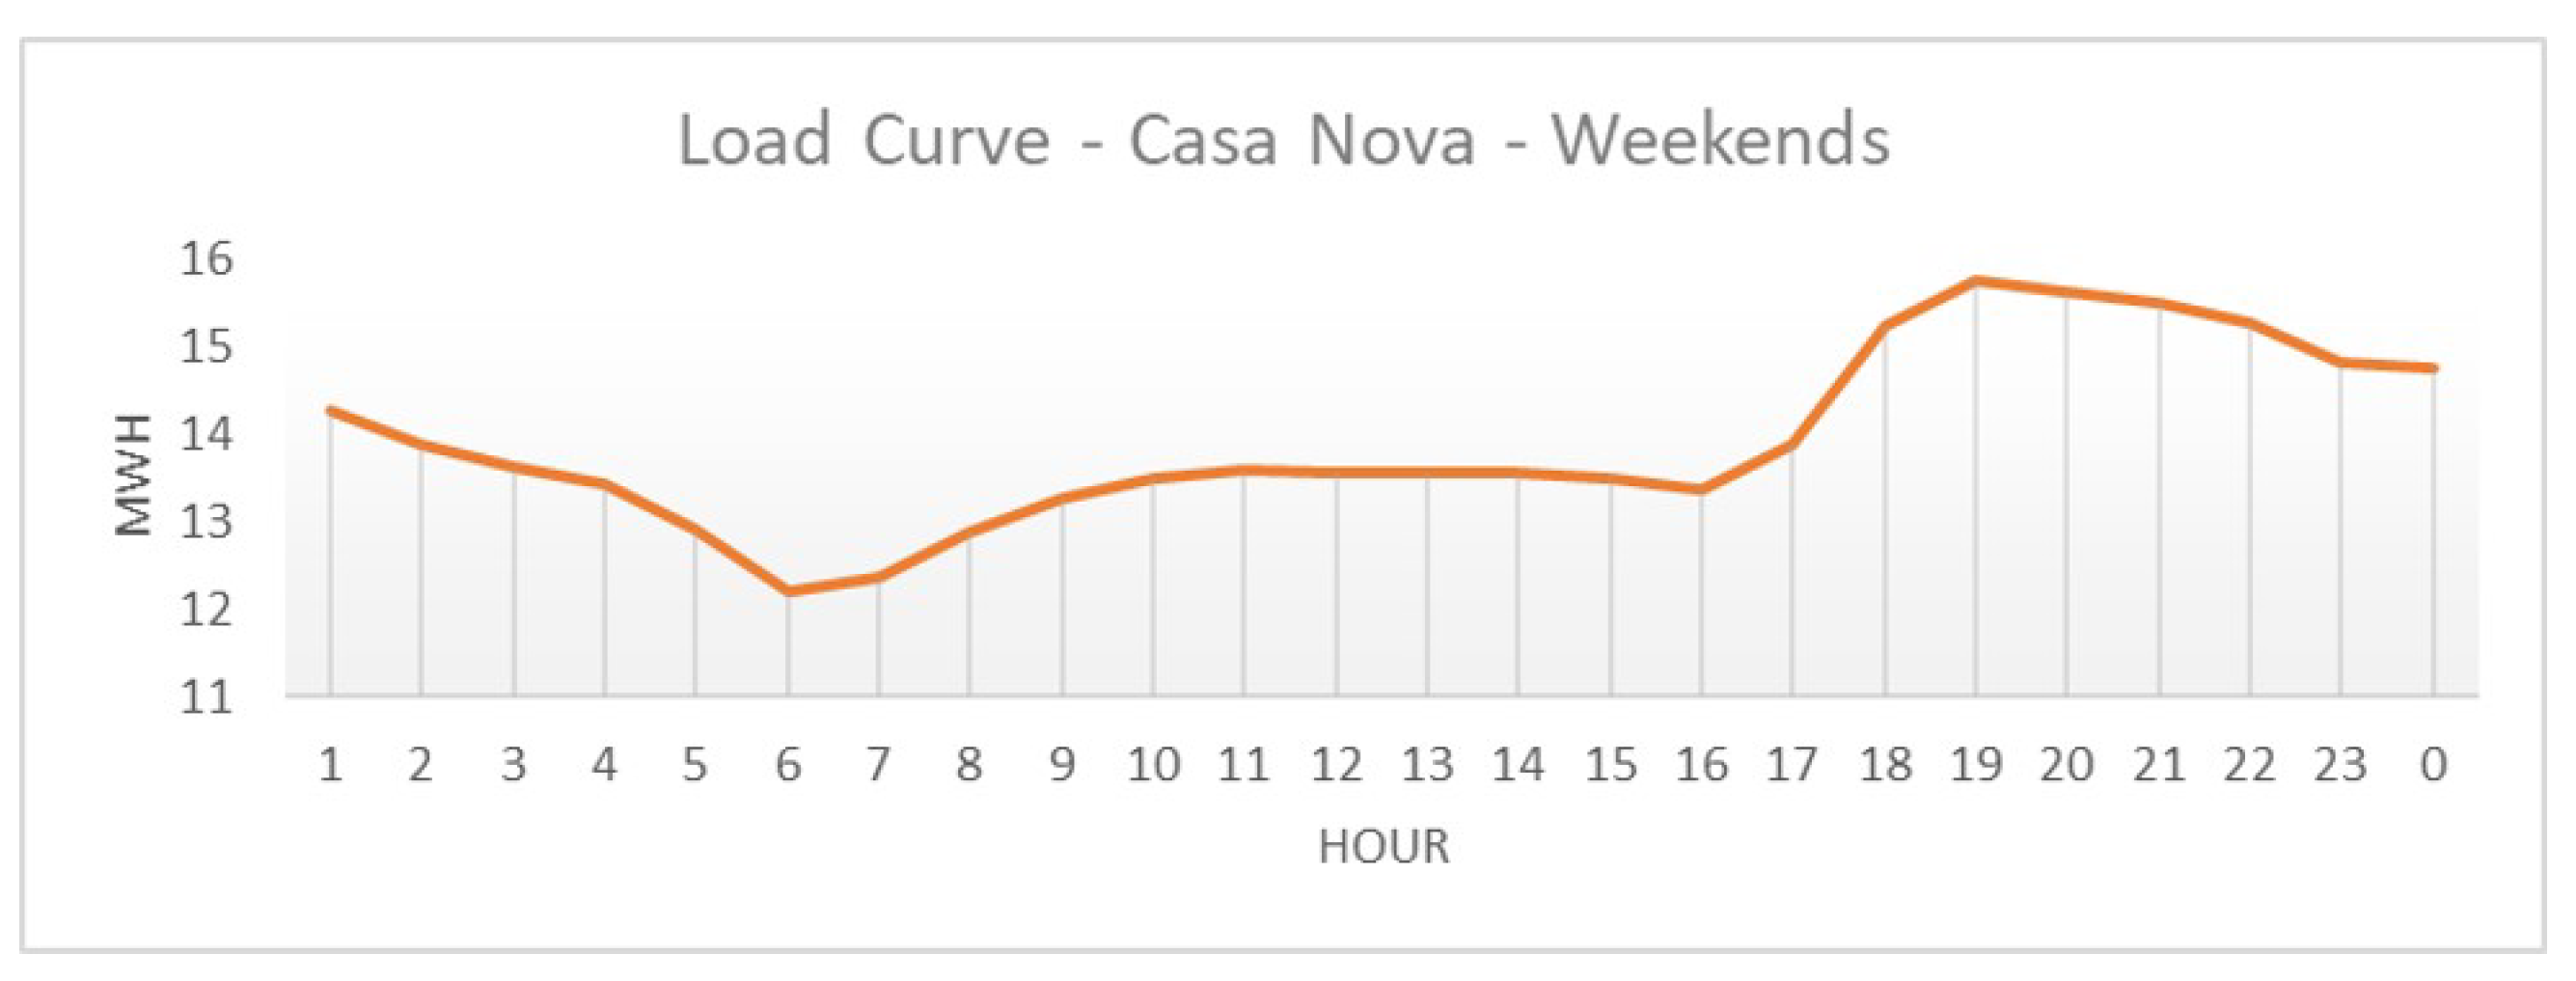
Figure 4 and
Figure 5 show the load curves obtained for Casa Nova city, considering weekdays and weekends, respectively, representing the consumption behavior of the region. In these curves, the average power consumed by the load is plotted for each hour of the day in 2016.
3.2. Plant Simulation Scenarios
According to the data that were incorporated into HOMER Pro and demonstrated in
Section 2.2.4 and
Section 2.2.5, a simulation was conducted using the software’s calculation engine, described in
Figure 2, based on the load curve percentages for each scenario, as shown in
Table 7. The main results obtained through the optimization performed by HOMER for scenarios 1, 2, and 3 are shown in
Table 8,
Table 9, and
Table 10, respectively.
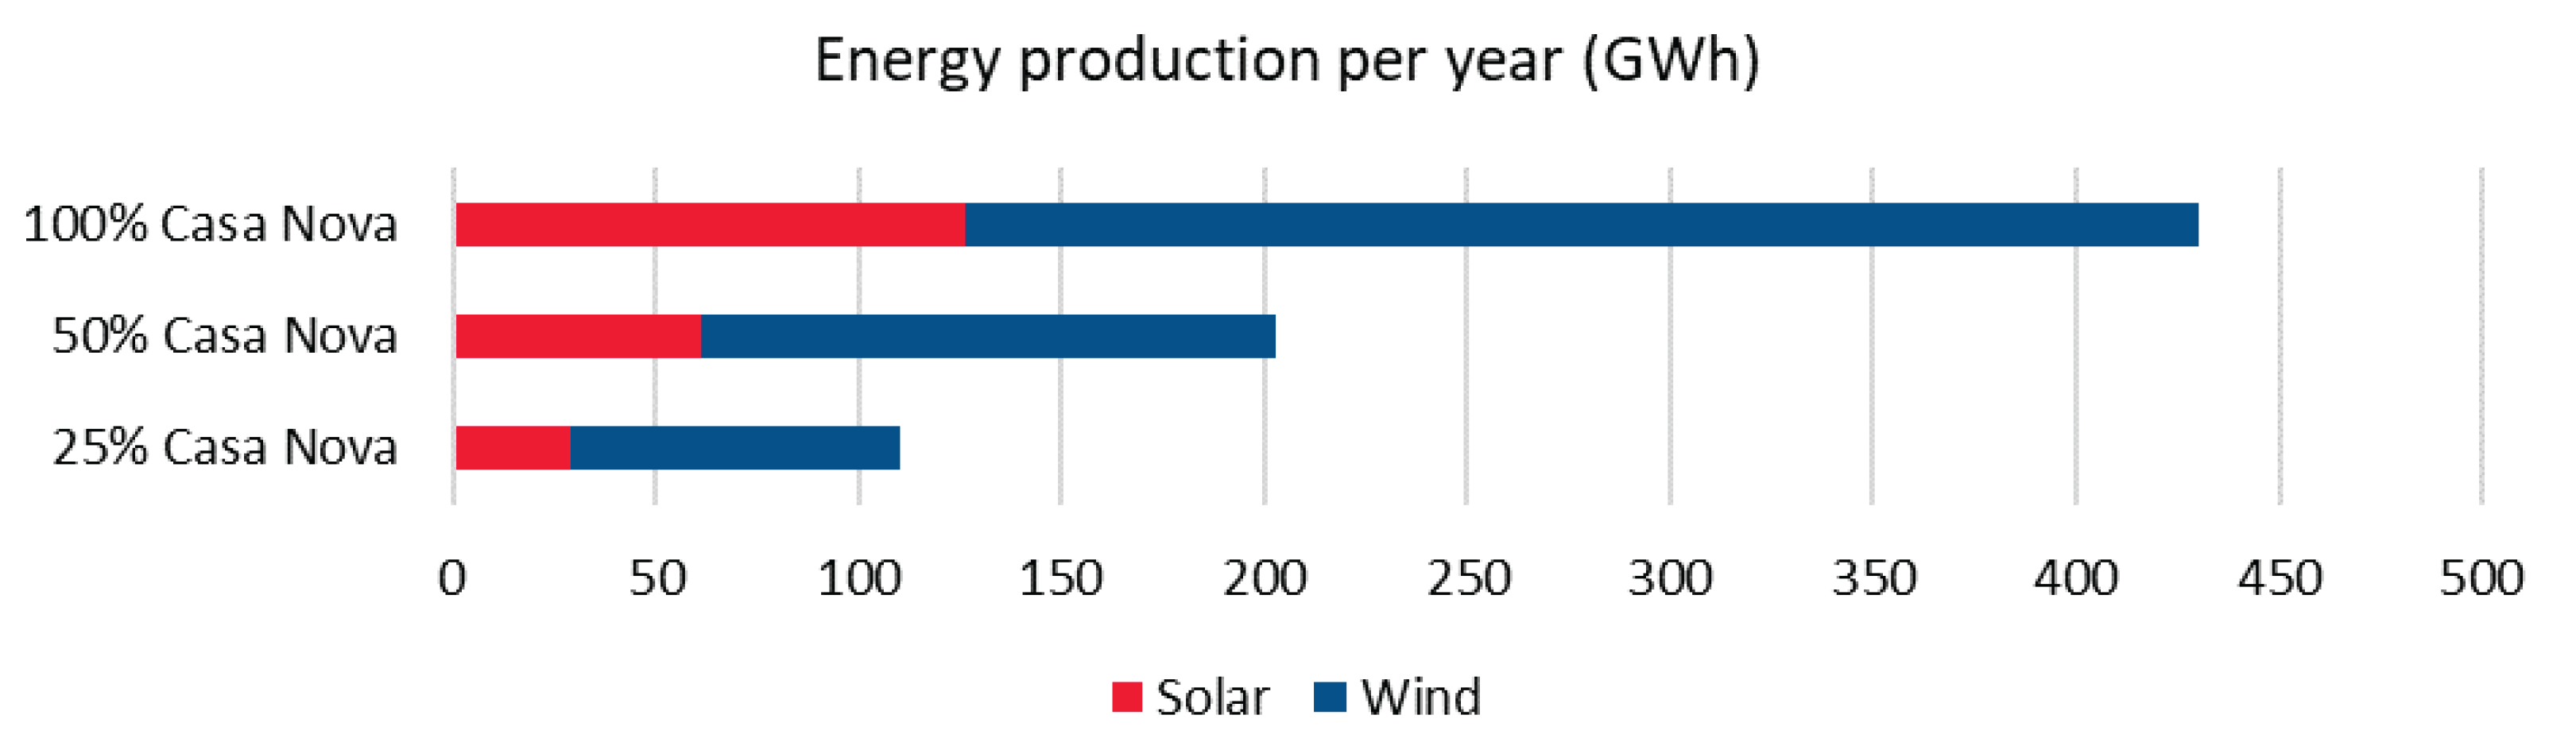
Regarding the energy production from each of the sources,
Figure 6 shows a graphical comparison of each of the three scenarios, highlighting the share of each RES used.
3.3. Financial Indicators (LCOE, Payback)
Table 11 catalogs some financial indicators such as NPC (net present cost), CAPEX (capital expenditure), and OPEX (operational expenditure) obtained in the HOMER PRO optimization.
Table 12 describes the LCOE outcomes of the simulation, based on
Section 2.2.6, separating each of them by the scenario to which they refer.
A common result in all three scenarios was that the individual LCOE for solar and wind sources was close to or within the range of the national average depicted in the EPE Power Generation Costs Report for the year 2021 [
23].
Figure 7 shows that, for a discount rate of 8%, the parameter used in the simulation, the expected LCOE per MWh (Megawatt-hour) for the solar source ranged between R
$110 and R
$170, and for the wind source, it ranged between R
$100 and R
$150. The results from the simulation showed that the individual LCOE for solar source was R
$ 150/MWh and for wind was R
$ 70/MWh.
It is important to highlight that LCOE is a parameter that can vary according to the location, technology used, and scale of the project. For total LCOE, it is clear that the addition of an energy storage system significantly increased the cost of electricity and consequently raised the total LCOE of the system to a range of R$565 to R$573 per MWh.
This observation indicates that, at least in the scenario and conditions analyzed, the integration of energy storage systems is not yet economically competitive compared to standalone solar and wind generation sources. This conclusion is relevant and highlights the importance of carefully considering costs and benefits when making decisions about the inclusion of energy storage systems in renewable energy generation projects. Thus, based on the LCOE as the reference for assessing the feasibility of the renewable generation system, it was concluded that Scenario 3 had the lowest value and the best feasibility.
Relative to the calculations for the payback period, some premises were adopted. First of all, the income generated was defined through two perspectives:
Table 13 and
Table 14 show the results for payback considering the values of the price of energy in the free market for the years of 2016 and 2022. The Northeast region was taken as a reference, where the medium price for the MWh was equal to R
$173.56 in 2016 and R
$58.5/MWh in 2022 [
29].
These findings reveal that in comparison to the data from 2016, the payback period for implementing a hybrid plant varied between 12 and 14 years, a duration significantly shorter than the operational lifetime of the plant, which was estimated at 25 years. Nevertheless, when juxtaposed with prevailing market prices in the deregulated energy sector, the feasibility of the off-grid system diminished. This decline in feasibility can be attributed to the substantial increase in energy supply within Brazil in recent years, which has led to a reduction in the market prices for renewable energy.
When considering prices from the captive market as the reference for evaluating the payback period, the results in
Table 15 and
Table 16 were acquired. As in the previous example, the Northeast region was taken as a reference, where the medium tariff for MWh was equal to R
$367.44 in 2016 and R
$603.59/MWh in 2022 [
19].
The results underscore that, when considering a captive market scenario, the establishment of a hybrid plant to cater for the energy needs of Casa Nova remains economically viable, both using data from 2016 and current values. This economic feasibility is a direct consequence of the persistent increase in tariff costs in Brazil. As a consequence, this encourages an increase in renewable energy generation projects to address the growing energy demand across different regions.
3.4. Power Load Fulfillment
For the implementation of a hybrid power plant in Brazil, various aspects need to be analyzed, including regulation, the economic feasibility of the project, and the connection to the grid. Regarding Brazilian norms and resolutions related to the topic, the ANEEL Normative Resolution (REN) No. 954 from 2021 can be cited. This resolution added to REN No. 876 from 2020, which addressed the requirements and procedures for granting wind, thermal, and photovoltaic sources, introducing the hybrid generation unit as a new category of generation. Thus, the installed capacity of each partial source in a HPP must exceed 5 MW, in accordance with what was stipulated in the previous wording of REN No. 876 [
30,
31]. In addition, the implementation of the distributed generation systems is also subject to national regulations, such as Brazilian Law No. 14.300 and ANEEL REN No. 1000, as well as the rules of the utility companies operating in the location where the power plant will be implemented [
32,
33].
As depicted in Scenario 1, considering the size of the components selected for the optimized configuration, notably those related to energy storage, it becomes evident that the financial investment would be substantial. Moreover, compared to the existing hybrid plants, this configuration necessitates unconventional and potentially impractical proportions. Consequently, these observations suggest that supplying the entire city of Casa Nova exclusively through the utilization of an off-grid system is not a feasible prospect. The grid connection becomes fundamental for effectively fulfilling the energy demand in this context.
Similarly to the previous scenario, the storage in Scenario 2 represented the most expensive cost of hybrid generation.The dimensions of the PV and wind plants were within proportions seen in other hybrid projects. However, a significant challenge arises when considering the substantial energy storage requirements, as these often clash with the conventional utilization and production parameters inherent to these systems.
From the results in Scenario 3, it can be observed that an off-grid hybrid system designed with only renewable sources has some vulnerabilities, which impact directly on its economic feasibility. Specifically, the optimization outputs from HOMER Pro revealed that the dimensions of the storage system resulted in significant costs and, in certain instances, an impractical scale. This phenomenon can be partially attributed to the fundamental characteristics of renewable sources, namely their susceptibility to environmental resource intermittence.
The absence of a constant and consistent generation pattern for solar and wind resources necessitates a greater reliance on the battery system to meet the load demands, consequently leading to substantial storage requirements and associated costs. These inherent challenges underscore the importance of carefully considering the balance between renewable energy generation and energy storage capacity when designing robust and cost-effective off-grid systems. For the case study of Casa Nova, the dimensions of the city entail that to supply energy from the grid, it is necessary to strengthen the system.
4. Discussion
Although the primary focus of this article centered on hybrid renewable energy systems, it is noteworthy that diverse configurations of hybrid generation, including non-renewable sources, can be effectively designed. Specially, wind and solar energies are considered the most promising renewable energy sources and are widely used in many countries in standalone applications or connected to a utility grid. In the case of isolated sites, where off-grid systems may prove more economically advantageous, an evaluation of factors such as location, climate dynamics, consumer needs, and load profiles becomes imperative to choose the best HRES combination.
Unfortunately, Brazil currently does not have other HPPs of similar type for comparison with this work.To make a comparative analysis, consideration of the context of Canadian off-grid hybrid power plants is pertinent, based on a study with a similar proposal and validated in the literature [
21]; in this context, where remote communities are detached from the transmission grid and rely on diesel facilities for energy supply. However, the reliance on transporting vast quantities of diesel over winter roads to ensure reliability poses significant environmental risks, including the potential for leakage and soil or groundwater contamination. Moreover, the transport of diesel introduces hazards to nearby inhabitants, especially in the event of a fire. The interruption of diesel supply also poses a risk of blackout during extreme cold weather.
In addressing these challenges, hybrid generation emerges as a socially and environmentally impactful solution. The technical feasibility of integrating diverse energy sources and a battery energy storage system (BESS) not only could enhance the community’s resilience and comfort during the harsh winters of Northern Canada but could also serve to diminish dependence on diesel, consequently mitigating greenhouse gas emissions—a critical step toward environmental sustainability.
This example of Canada illustrates the importance of energy supply and its relationship with the economic development of a nation, as well as achieving engagement of the different stakeholders. The United Nations Environment Program estimated that approximately two billion people around the world do not have appropriate grid-based electricity services, mostly in small villages in developing countries. Inadequate electricity infrastructure and accessibility in rural areas make future development difficult, encompassing both social and economic aspects of these regions. The absence of reliable power sources in rural areas has exacerbated poverty levels among populations of these countries. The implementation of sustainable development technology, guided by judicious policies, represents a validated strategy for reducing energy poverty and fostering socio-economic advancement in these underserved areas [
34,
35].
Hybridization of sources provides an alternative, not only to fill the gap in electricity supplies in remote areas, but also to improve existing generation by transforming plants from one source to hybrid with storage. When considering the use of renewable resources, some advantages and disadvantages for HRES can be listed. For example, using renewable sources represents an advantage of sustainability by not producing pollution or wastes from the sources, but also represents a dependency on natural cycles that can cause intermittency of generation. Nevertheless, there is an advantage about the low level of O&M higher costs for implementing the HPP than when considered non renewable resources. The complexity of the design procedure for hybrid plants can be cited as a disadvantage, as well as, the need of a storage system to manage peak-loads and the energy dispatch. However, fuel saving and, consequently, lower atmosphere contamination stands out as great advantages [
36]. There are potential policy implications for building a HPP not only in Casa Nova, but elsewher in the world, including renewable energy integration, energy planning, and sustainable development. Concerns regarding environmental sustainability have greater weight in the assessment of advantages versus disadvantages, reinforcing the importance of investment in projects and research regarding hybrid power generation, whether governmental or private. Effective energy management mandates substantial investment in energy storage systems.
This study has elucidated that battery energy storage systems (BESSs) presently face competitiveness challenges due to their elevated equipment costs. However, alternative avenues are actively under investigation, with researchers exploring the feasibility of integrating hybrid generation with hydrogen energy storage systems (HydESS). These HydESS are being considered as a relatively cheaper method of storing renewable energy. The working principle of a HydESS is that the energy is stored in a gaseous form and can then be converted back into electric power as required [
37].
This illustration serves as one example of how hybrid power generation can accelerate new studies and new business opportunities. These aspects encompass relations with the hydrogen economy, as well as the applicability of advanced control methods to optimize HPP performance, in order to determine the long-term viability of these assets. For industry, power requirements are vital and at a huge scale.Thus, any significant increase in price of grid power will adversely effect this sector. Due to the all-time high availability of hybrid power, the price of electricity will reduce and make it wiser to use this energy. Therefore, large-scale hybrid systems should be the main bet of industry for years to come.
Additional emerging opportunities surrounding energy generation hybridization include applications such as the use of artificial intelligence as part of the energy management system; investment in R&D to enhance the cost-effectiveness of solar PV and wind technologies; the emergence of new companies specialized in managing the O&M of hybrid power plants, thereby generating employment opportunities for local communities; and new studies on the expansion or reinforcement of the electric system to accommodate the escalating energy output from HPPs [
37,
38].
5. Conclusions
This study aimed to address a critical research gap by analyzing scenarios for the implementation of a HPP in Casa Nova, Bahia. Through simulations utilizing HOMER Pro software, this work provided valuable insights into the feasibility and requirements for implementing a hybrid off-grid system to meet the energy needs of Casa Nova, Bahia. By examining various scenarios, including supplying 100%, 50%, and 25% of the city’s energy consumption through such a system, we gained a comprehensive understanding of the associated challenges and opportunities.
Our findings underscore that providing the entire energy demand of Casa Nova city through an off-grid system may be financially prohibitive and impractical, especially when compared to existing HPPs. However, as we scale down the proportion of energy supplied to the city, the feasibility and cost-effectiveness of such a system become more favorable.
The decision to adopt an off-grid system for Casa Nova should be made judiciously, considering not only economic aspects but also the environmental and social benefits. The choice may ultimately involve a blend of renewable energy integration and grid connectivity. In light of the rapid changes in renewable energy technologies and the evolving energy landscape, continuous evaluation and adaptation of such projects are essential, to ensure a sustainable and reliable energy supply for Casa Nova.
Moreover, this research was intended to provide a comprehensive evaluation of the advantages and disadvantages of HPPs and can contribute not only to the specific context of Casa Nova but also advance the broader understanding of HPP implementation, providing valuable data and insights for future decision-making and planning of the energy infrastructure for the city or similar locations. A future study that could be conducted would be to simulate an on-grid hybrid plant considering the same load requirements but with the support of grid connection. The adaptable methodology proposed in this work not only facilitates replication in diverse arrangements but is also a valuable resource for assessing the feasibility of similar HPP projects worldwide.
Therefore, the use of hybrid energy plants should consider not only the technical approach, but also energy governance, environmental sustainability, and economic development. It is necessary to establish policies that encourage the integration of renewable sources within hybrid systems, setting clear regulations for grid connection and tariff structures, considering off-grid supply for isolated locations, incentivizing energy storage technologies, and stimulating hybrid system adoption.
Author Contributions
Conceptualization, A.T.A.B.; Methodology, A.T.A.B., L.J.M.S. and T.R.d.M.; Software, A.T.A.B.; Validation, A.T.A.B. and T.R.d.M.; Formal analysis, T.R.d.M.; Resources, A.T.A.B. and L.J.M.S.; Writing—original draft, A.T.A.B. and L.J.M.S.; Writing—review & editing, T.R.d.M.o and A.Á.B.S.; Supervision, T.R.d.M. and A.Á.B.S.; Project administration, A.Á.B.S. All authors have read and agreed to the published version of the manuscript.
Funding
This research received no external funding.
Data Availability Statement
Acknowledgments
The authors would like to express their sincere gratitude to SENAI CIMATEC, CNPq, and FAPESB for their support, which greatly contributed to the success of this project. Furthermore, the authors also thank the Research and Development Program of the Brazilian electricity sector regulated by ANEEL and Eletrobras CHESF, for their technical support in the project “PD-00048-0217: Sistema inteligente com aerogerador integrado às fontes de energia solar e storage como plataforma de desenvolvimento visando melhorias contínuas no processo de geração de energia elétrica”.
Conflicts of Interest
The authors declare no conflict of interest.
Abbreviations
The following abbreviations are used in this manuscript:
| ANEEL | National Agency of Electric Energy |
| BESS | Battery Energy Storage System |
| CAPEX | Capital Expenditure |
| EPE | Energy Research Company |
| HPP | Hybrid Power Plant |
| LCOE | Levelized Cost of Electricity |
| NPC | Net Present Cost |
| O&M | Operation and Maintenance |
| ONS | National Operator of the Electric System |
| OPEX | Operational Expenditure |
| PV | Photovoltaic |
| RES | Renewable Energy System |
| R$ | Brazilian Monetary Unit |
References
- Di Silvestre, M.L.; Salvatore, F.; Sanseverino, E.R.; Zizzo, G. How Decarbonization, Digitalization and Decentralization are changing key power infrastructures. Renew. Sustain. Energy Rev. 2018, 93, 483–498. [Google Scholar] [CrossRef]
- Rabbi, M.F.; Popp, J.; Máté, D.; Kovács, S. Energy Security and Energy Transition to Achieve Carbon Neutrality. Energies 2022, 15, 8126. [Google Scholar] [CrossRef]
- WindEurope. Renewable Hybrid Power Plants: Exploring the Benefits and Market Opportunities; Technical Report; WindEurope: Brussels, Belgium, 2019. [Google Scholar]
- de Pesquisa Energética, E. Estudos de Planejamento da Expansão da Geração—Usinas Híbridas: Uma Análise Qualitativa de Temas Regulatórios e Comerciais Relevantes ao Planejamento; Technical Report; Federal Government Ministry of Minas and Energy: Brasília, Brazil, 2018.
- Mouhadjer, S.; Neçaibia, A.; Benmedjahed, M. Hybrid photovoltaic-wind system for the electricity production in isolated sites. In Proceedings of the 2019 International Conference of Computer Science and Renewable Energies (ICCSRE), Agadir, Morocco, 22–24 July 2019; IEEE: Piscataway, NJ, USA, 2019; pp. 1–6. [Google Scholar]
- Gholaimi, H.; Nils Røstvik, H. Levelised Cost of Electricity (LCOE) of Building Integrated Photovoltaics (BIPV) in Europe, rational feed-in tariffs and subsidies. Energies 2021, 14, 2531. [Google Scholar] [CrossRef]
- Budes, F.A.B.; Ochoa, G.V.; Obregon, L.G.; Arango-Manrique, A.; Álvarez, J.R.N. Energy, economic, and environmental evaluation of a proposed solar-wind power on-grid system using HOMER Pro®: A case study in Colombia. Energies 2020, 13, 1662. [Google Scholar] [CrossRef]
- Amupolo, A.; Nambundunga, S.; Chowdhury, D.S.P.; Grün, G. Techno-economic feasibility of off-grid renewable energy electrification schemes: A case study of an informal settlement in Namibia. Energies 2022, 15, 4235. [Google Scholar] [CrossRef]
- Micangeli, A.; Del Citto, R.; Nzue Kiva, I.; Santori, S.G. Energy production analysis and optimization of mini-grid in remote areas: The case study of Habaswein, Kenya. Energies 2017, 10, 2041. [Google Scholar] [CrossRef]
- Riayatsyah, T.M.I.; Geumpana, T.A.; Rizwanul Fattah, I.M.; Indra Mahlia, T.M. Techno-economic analysis of hybrid diesel generators and renewable energy for a remote island in the indian ocean using HOMER Pro. Sustainability 2022, 14, 9846. [Google Scholar] [CrossRef]
- Bayu, E.S.; Khan, B.; Hagos, I.G.; Mahela, O.P. Feasibility analysis and development of stand-alone hybrid power generation system for remote areas: A case study of Ethiopian rural area. Wind 2022, 2, 68–86. [Google Scholar] [CrossRef]
- Amossou, I.; Tanyi, E.; Ali, A.; Agajie, T.F. Optimal Modeling and Feasibility Analysis of Grid-Interfaced Solar PV/Wind/Pumped Hydro Energy Storage Based Hybrid System. Sustainability 2023, 15, 1222. [Google Scholar] [CrossRef]
- Al-Badi, A.; Al Wahaibi, A.; Ahshan, R.; Malik, A. Techno-economic feasibility of a solar-wind-fuel cell energy system in Duqm, Oman. Energies 2022, 15, 5379. [Google Scholar] [CrossRef]
- Basheer, Y.; Waqar, A.; Qaisar, S.M.; Ahmed, T. Analyzing the Prospect of Hybrid Energy in the Cement Industry of Pakistan, Using HOMER Pro. Sustainability 2022, 14, 12440. [Google Scholar] [CrossRef]
- Rice, I.K.; Zhu, H.; Zhang, C.; Tapa, A.R. A Hybrid Photovoltaic/Diesel System for Off-Grid Applications in Lubumbashi, DR Congo: A HOMER Pro Modeling and Optimization Study. Sustainability 2023, 15, 8162. [Google Scholar] [CrossRef]
- National Operator of the Electric System. Hourly Load Curve; National Operator of the Electric System: Brasília, Brazil, 2023. [Google Scholar]
- Superintendency of Economic and Social Studies of Bahia. Electricity Consumption by Class in Bahia by Municipality (2016)—Captive Market; ANEEL: Brasília, Brazil, 2023.
- Electric Energy National Agency. Captive Market Report; ANEEL: Brasília, Brazil, 2023.
- Empresa de Pesquisa Energética. Statistical YearBook of Electricity—Baseline 2022; Technical Report; Federal Government Ministry of Minas and Energy: Brasília, Brazil, 2023.
- Rashid, F.; Hoque, M.E.; Aziz, M.; Sakib, T.N.; Islam, M.T.; Robin, R.M. Investigation of optimal hybrid energy systems using available energy sources in a rural area of Bangladesh. Energies 2021, 14, 5794. [Google Scholar] [CrossRef]
- Kaluthanthrige, R.; Rajapakse, A.D.; Lamothe, C.; Mosallat, F. Optimal sizing and performance evaluation of a hybrid renewable energy system for an off-grid power system in northern Canada. Technol. Econ. Smart Grids Sustain. Energy 2019, 4, 4. [Google Scholar] [CrossRef]
- Oulis Rousis, A.; Tzelepis, D.; Konstantelos, I.; Booth, C.; Strbac, G. Design of a hybrid AC/DC microgrid using Homer Pro: Case study on an islanded residential application. Inventions 2018, 3, 55. [Google Scholar] [CrossRef]
- Empresa de Pesquisa Energética. Power Generation Costs Report 2021; Technical Report; Federal Government Ministry of Minas and Energy: Brasília, Brazil, 2021.
- Valor Da Energia Solar: Quanto Custa Para Instalar Energia Solar? Canal Solar: Campinas, Brazil, 2023.
- Fedalto, L.F.V.; Salas, S.; de Medeiros, L. Análise Técnica e Simulação Econômica para Aplicações de Sistemas de Armazenamento de Energia com Baterias nos Sistemas Elétricos de Potência-[Not available in English]. In Proceedings of the 2020 IEEE PES Transmission & Distribution Conference and Exhibition-Latin America (T&D LA), Montevideo, Uruguay, 28 September–2 October 2020; IEEE: Piscataway, NJ, USA, 2020; pp. 1–6. [Google Scholar]
- Gomes, A.C.; Neto, C.C.; Sobrinho, D.M.; de Queiroz, D.M.B.; de Oliveira, E.E.S.; Porto, F.; Uchôa, K.M.; Batista, N.E.; Ribeiro, S.B.J.; de Carvalho, P.C.M. Estudo de viabilidade de planta híbrida eólica-fotovoltaica para compensação de consumo de energia elétrica residencial-[Not available in English]. Rev. Eng. Tecnol. 2021, 13, 13–23. [Google Scholar]
- Islam, M.R.; Akter, H.; Howlader, H.O.R.; Senjyu, T. Optimal sizing and techno-economic analysis of grid-independent hybrid energy system for sustained rural electrification in developing countries: A case study in Bangladesh. Energies 2022, 15, 6381. [Google Scholar] [CrossRef]
- Mubarok, H.; Farid, M. Hybrid power plant system analysis in seruni beach, Bantaeng district, South Sulawesi. J. Phys. Conf. Ser. 2019, 1413, 012010. [Google Scholar] [CrossRef]
- Chamber of Electric Energy Commercialization. Pricing Panel; CCEE: Brasília, Brazil, 2023. [Google Scholar]
- Electric Energy National Agency. Normative Resolution No. 876, of March 10, 2020; ANEEL: Brasília, Brazil, 2020.
- Electric Energy National Agency. Normative Resolution No. 954, of November 30, 2021; ANEEL: Brasília, Brazil, 2021.
- Electric Energy National Agency. Normative Resolution No. 1000, of December 7, 2021; ANEEL: Brasília, Brazil, 2021.
- Brasil. Law No. 14,300, of January 6, 2022; ANEEL: Brasília, Brazil, 2022.
- Olatomiwa, L.; Mekhilef, S.; Huda, A.; Ohunakin, O.S. Economic evaluation of hybrid energy systems for rural electrification in six geo-political zones of Nigeria. Renew. Energy 2015, 83, 435–446. [Google Scholar] [CrossRef]
- Borhanazad, H.; Mekhilef, S.; Saidur, R.; Boroumandjazi, G. Potential application of renewable energy for rural electrification in Malaysia. Renew. Energy 2013, 59, 210–219. [Google Scholar] [CrossRef]
- Faccio, M.; Gamberi, M.; Bortolini, M.; Nedaei, M. State-of-art review of the optimization methods to design the configuration of hybrid renewable energy systems (HRESs). Front. Energy 2018, 12, 591–622. [Google Scholar] [CrossRef]
- Arsad, A.; Hannan, M.; Al-Shetwi, A.Q.; Mansur, M.; Muttaqi, K.; Dong, Z.; Blaabjerg, F. Hydrogen energy storage integrated hybrid renewable energy systems: A review analysis for future research directions. Int. J. Hydrogen Energy 2022, 47, 17285–17312. [Google Scholar] [CrossRef]
- Nema, P.; Nema, R.; Rangnekar, S. A current and future state of art development of hybrid energy system using wind and PV-solar: A review. Renew. Sustain. Energy Rev. 2009, 13, 2096–2103. [Google Scholar] [CrossRef]
Figure 1.
Flowchart of the methodological approach for a techno-economic feasibility HPP study.
Figure 1.
Flowchart of the methodological approach for a techno-economic feasibility HPP study.
Figure 2.
HOMER Optimizer Framework—Adapted from [
20].
Figure 2.
HOMER Optimizer Framework—Adapted from [
20].
Figure 3.
Connections between the subsystems of the hybrid plant.
Figure 3.
Connections between the subsystems of the hybrid plant.
Figure 4.
Load Curve for Casa Nova on weekdays.
Figure 4.
Load Curve for Casa Nova on weekdays.
Figure 5.
Load Curve for Casa Nova on weekends.
Figure 5.
Load Curve for Casa Nova on weekends.
Figure 6.
Hybrid plant energy production per year.
Figure 6.
Hybrid plant energy production per year.
Figure 7.
Range of LCOE Values for Renewable Sources. Adapted from the EPE Power Generation Costs Report 2021 [
23].
Figure 7.
Range of LCOE Values for Renewable Sources. Adapted from the EPE Power Generation Costs Report 2021 [
23].
Table 1.
Data collection for obtaining the load curve for Casa Nova—BA.
Table 1.
Data collection for obtaining the load curve for Casa Nova—BA.
| Data Type | Data Description |
|---|
Energy consumption by class and municipality
in Bahia—last real data: year 2016 | Total consumption for all cities in Bahia and
segregated by class. From all cities, only
information related to Casa Nova’s
consumption was extracted 1 |
COELBA’s Energy Consumption by
Class—Captive Market | Bahia’s total energy consumption in 2016. The
consumption was segregated by class 2 |
| Electric Power Statistical Yearbook | Determine the relationship between Bahia’s
consumption and the Northeast region 3 |
| Load Curve—Northeast Region | Download records for each month and hour of
2016. Data treatment for obtaining the load
curve of the Northeast for each month.
Downscale the northeast curve for obtaining
Bahia’s load profile. New downscale from
Bahia to Casa Nova 4 |
Table 2.
Consumption data by class in Bahia.
Table 2.
Consumption data by class in Bahia.
| Consumption (GWh) | Bahia Records (ANEEL) 1 | Bahia Records (State Government) 2 | Casa Nova (State Government) 2 |
|---|
| Commercial | 3402.34 | 3402.15 | 4.22 |
| Industrial | 2463.36 | 2463.36 | 1.24 |
| Others | 16.33 | 16.33 | 0.03 |
| Public | 2665.72 | 2664.51 | 5.77 |
| Residential | 6872.15 | 6872.76 | 20.59 |
| Rural | 1928.10 | 1928.22 | 87.18 |
| TOTAL | 17,347.99 | 17,347.33 | 119.03 |
Table 3.
Details of the equipment used in the simulation of the hybrid plant.
Table 3.
Details of the equipment used in the simulation of the hybrid plant.
| Equipment | Manufacturer | Power (kW) |
|---|
| Solar Module | JA Solar, São Paulo — Brazil | 0.55 |
| Wind Turbine | Goldwind, Beijing — China | 4200 |
| Converter | Sungrow, Hefei — China | 125 |
Table 4.
Details of the costs associated with the wind system.
Table 4.
Details of the costs associated with the wind system.
| Wind Farm Costs | Installed Capacity Cost
(R$/kW) | Cost of a 4.2 MW Wind
Turbine |
|---|
| Installation | R$4500 | R$18,900,000 |
| O&M | R$80 | R$336,000 |
| Replacement | 70% of the installation cost | R$13,230,000 |
Table 5.
Details of the costs associated with the photovoltaic system.
Table 5.
Details of the costs associated with the photovoltaic system.
Installed Capacity
(kWp) | Total Cost (R$) | Cost without
Converter (R$) | O&M (R$) |
|---|
| 150 | R$531,000 | R$491,000 | R$7500 |
| 300 | R$1,041,000 | R$961,000 | R$15,000 |
| 500 | R$1,780,000 | R$1,620,000 | R$25,000 |
| 1000 | R$3,710,000 | R$3,390,000 | R$50,000 |
| 3000 | R$10,740,000 | R$9,780,000 | R$150,000 |
| 5000 | R$18,250,000 | R$16,650,000 | R$250,000 |
Table 6.
Details of the costs associated with the BESS (battery energy storage system).
Table 6.
Details of the costs associated with the BESS (battery energy storage system).
| BESS’s Costs | Total Cost (R$) |
|---|
| Equipment | R$4,967,903.70 |
| Installation Service | R$1,451,850.76 |
| O&M | 1% of total CAPEX |
| Replacement | Same cost of equipment |
Table 7.
Details of the simulated scenarios.
Table 7.
Details of the simulated scenarios.
| Scenarios | Percentage of Energy
Consumption—Casa
Nova | Percentage of
Available
Energy—HPP | Cost-Effectiveness |
|---|
| Scenario 1 | 100% | 0% | Most Expensive |
| Scenario 2 | 50% | 50% | Intermediary |
| Scenario 3 | 25% | 75% | Optimum |
Table 8.
Description of the main results for the Scenario 1 simulation.
Table 8.
Description of the main results for the Scenario 1 simulation.
Generation
Source | Total Power
(MW) | Storage (MWh) | Amount of
Equipment | Equipment
Power (MW) |
|---|
| PV | 75.18 | - | - | - |
| Wind | 63 | - | 15 | 4.2 |
| Storage | - | 274.06 | 65 | - |
Table 9.
Description of the main results for the Scenario 2 simulation.
Table 9.
Description of the main results for the Scenario 2 simulation.
Generation
Source | Power (MW) | Storage (MWh) | Amount of
Equipment | Equipment
Power (MW) |
|---|
| PV | 36.36 | - | - | - |
| Wind | 29.40 | - | 7 | 4.2 |
| Storage | - | 147.57 | 35 | - |
Table 10.
Description of the main results for the Scenario 3 simulation.
Table 10.
Description of the main results for the Scenario 3 simulation.
Generation
Source | Power (MW) | Storage (MWh) | Amount of
Equipment | Equipment
Power (MW) |
|---|
| PV | 17.4 | - | - | - |
| Wind | 16.8 | - | 4 | 4.2 |
| Storage | - | 67.4 | 16 | - |
Table 11.
Financial indicators values obtained for the case study of Casa Nova—BA.
Table 11.
Financial indicators values obtained for the case study of Casa Nova—BA.
| Indicators | Scenario 1 | Scenario 2 | Scenario 3 |
|---|
| NPC | R$1.48Bi | R$745M | R$367M |
| CAPEX | R$989M | R$496M | R$245 |
| OPEX | R$24.6M | R$12.5M | R$6.1M |
Table 12.
LCOE values obtained for the case study of Casa Nova—BA.
Table 12.
LCOE values obtained for the case study of Casa Nova—BA.
| Scenario | Generation Source | LCOE for Each
Source (R$/kWh) | Total LCOE for the
System (R$/kWh) |
|---|
| | PV | R$0.145 | |
| 1 | Wind | R$0.0707 | R$0.569 |
| | Storage | - | |
| | PV | R$0.145 | |
| 2 | Wind | R$0.0707 | R$0.573 |
| | Storage | - | |
| | PV | R$0.144 | |
| 3 | Wind | R$0.0707 | R$0.565 |
| | Storage | - | |
Table 13.
Payback period based on free market prices (Year 2016).
Table 13.
Payback period based on free market prices (Year 2016).
| Year (2016) | Production of
Energy
(MWh/Year) | Annual Income | Capital Cost
(Investment) | Payback Period
(Years) |
|---|
| Scenario 1 | 430,138.471 | R$74,654,833.03 | R$989M | 13.24 |
| Scenario 2 | 202,879.882 | R$35,211,832.32 | R$496M | 14.08 |
| Scenario 3 | 110,321.371 | R$19,147,377.15 | R$245M | 12.79 |
Table 14.
Payback period based on free market prices (Year 2022).
Table 14.
Payback period based on free market prices (Year 2022).
| Year (2022) | Production of
Energy
(MWh/Year) | Annual Income | Capital Cost
(Investment) | Payback Period
(Years) |
|---|
| Scenario 1 | 430,138.471 | R$25,163,100.55 | R$989M | 39.3 |
| Scenario 2 | 202,879.882 | R$11,868,473.10 | R$496M | 41.79 |
| Scenario 3 | 110,321.371 | R$6,453,800.20 | R$245M | 37.96 |
Table 15.
Payback period based on captive market tariffs (Year 2016).
Table 15.
Payback period based on captive market tariffs (Year 2016).
| Year (2016) | Production of
Energy
(MWh/Year) | Annual Income | Capital Cost
(Investment) | Payback
Period (Years) |
|---|
| Scenario 1 | 430,138.471 | R$158,050,079.78 | R$989M | 6.25 |
| Scenario 2 | 202,879.882 | R$74,546,183.84 | R$496M | 6.65 |
| Scenario 3 | 110,321.371 | R$40,536,484.56 | R$245M | 6.04 |
Table 16.
Payback period based on captive market tariffs (Year 2022).
Table 16.
Payback period based on captive market tariffs (Year 2022).
| Year (2022) | Production of
Energy
(MWh/Year) | Annual Income | Capital Cost
(Investment) | Payback
Period (Years) |
|---|
| Scenario 1 | 430,138.471 | R$259,627,279.71 | R$989M | 3.80 |
| Scenario 2 | 202,879.882 | R$122,456,267.98 | R$496M | 4.05 |
| Scenario 3 | 110,321.371 | R$66,588,876.32 | R$245M | 3.67 |
| Disclaimer/Publisher’s Note: The statements, opinions and data contained in all publications are solely those of the individual author(s) and contributor(s) and not of MDPI and/or the editor(s). MDPI and/or the editor(s) disclaim responsibility for any injury to people or property resulting from any ideas, methods, instructions or products referred to in the content. |
© 2024 by the authors. Licensee MDPI, Basel, Switzerland. This article is an open access article distributed under the terms and conditions of the Creative Commons Attribution (CC BY) license (https://creativecommons.org/licenses/by/4.0/).


 ,
, 


