
Research on Two-Stage Energy Storage Optimization Configurations of Rural Distributed Photovoltaic Clusters Considering the Local Consumption of New Energy

Abstract
1. Introduction
- The two-stage energy storage optimization configuration model for rural distributed PV clusters is established. The optimization objectives and decision variables for the first stage are to maximize the annual revenue of independent operators and the energy storage capacity and power, and the optimization objectives and decision variables for the second stage are to maximize the PV local consumption proportion and typical daily output of energy storage for each season.
- Based on the multiple operation modes of distributed PV, this paper considers different combinations with and without demand response and energy storage configurations and designs a variety of scenarios to analyze the economic benefits and PV local consumption.
- The results of this paper reveal that PV local consumption can be greatly increased by setting up energy storage for distributed PV clusters in rural areas, which is environmentally friendly. Moreover, this paper demonstrates that implementing demand response can achieve similar PV local consumption while reducing investment costs of energy storage. The research results have certain practical value and can serve as a reference for promoting distributed PV cluster energy storage systems.
2. Typical Operation Mode of Rural Distributed PV Clusters
2.1. Mode of All Power Connected to the Grid
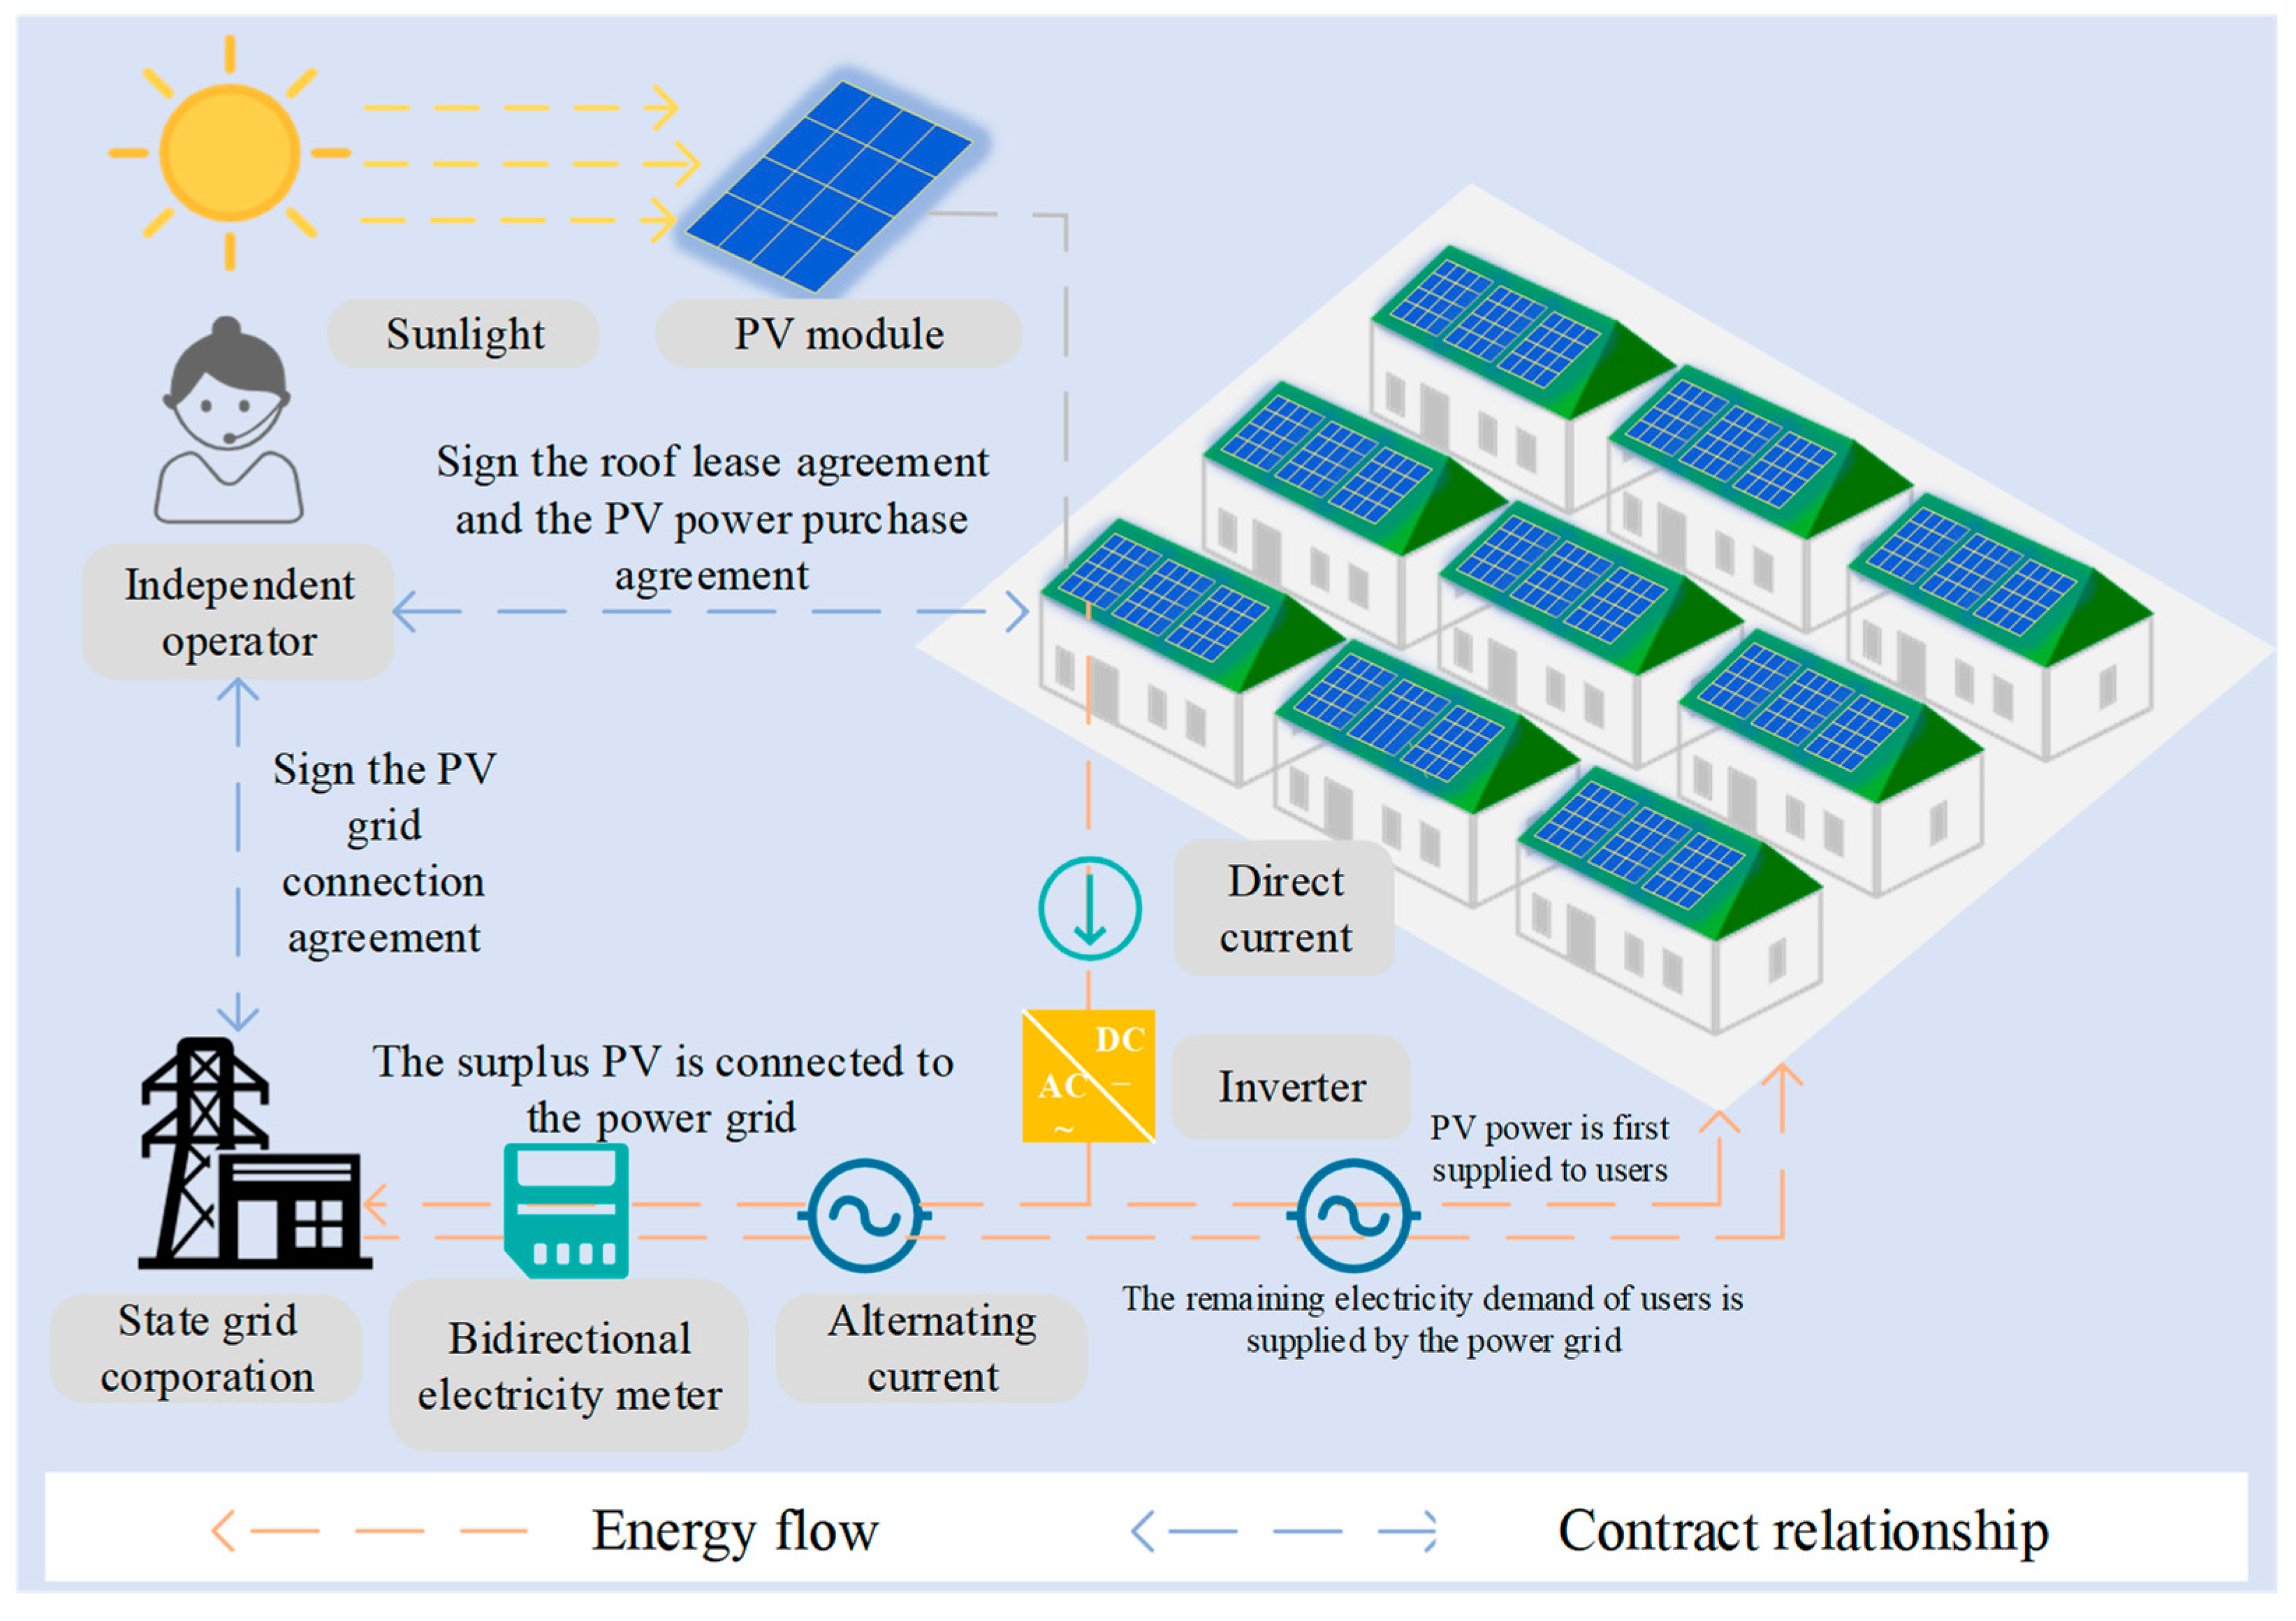
2.2. Mode of Self-Generation and Self-Consumption with Surplus Power Connected to the Grid
2.2.1. Distributed PV Cluster System
2.2.2. Distributed PV Cluster Energy Storage System
3. Method
3.1. Cost–Benefit Analysis of Independent Operators
3.1.1. Cost Analysis of Independent Operators
- Construction cost of distributed PV power generation systems
- 2.
- Operation and maintenance costs of distributed PV power generation systems
- 3.
- Construction cost of energy storage systems
- 4.
- Operation and maintenance costs of energy storage systems
- 5.
- The replacement cost of energy storage batteries and equipment
- 6.
- Roof rental cost
- 7.
- Cost of demand response management
- 8.
- Compensation cost for demand response
3.1.2. Analysis of Revenue for Independent Operators
- Grid-connected revenue
- 2.
- Subsidy income for PV systems
- 3.
- Subsidy income for energy storage systems
- 4.
- Electricity sales revenue
- 5.
- Compensation income for demand response
- 6.
- Residual value of fixed assets
3.2. Two-Stage Energy Storage Optimization Configuration Model for Distributed PV Clusters
3.2.1. Distributed PV Output Model
- PV Output model
- 2.
- Latin Hypercube Sampling
3.2.2. First Stage Capacity Planning Model
- Objective function
- 2.
- Constraint condition
3.2.3. Second Stage System Operation Model
- Objective function
- 2.
- Constraint conditions
- (1)
- Energy storage battery power constraints
- (2)
- Energy storage battery safety constraints
- (3)
- Energy storage battery charge and discharge balance constraints
- (4)
- Upper and lower limit constraints on the state of charge of energy storage batteries
- (5)
- Energy storage battery charge and discharge cycle number constraints
3.2.4. Model Solving
3.3. Economic Benefit Evaluation Indicators
3.3.1. Net Present Value
3.3.2. Internal Rate of Return
3.3.3. Dynamic Investment Payback Period
4. Results and Discussions
4.1. Typical Scene Construction
- Scenario 1: Mode of all power connected to the grid
- 2.
- Scenario 2: Mode of self-generation and self-use electricity by connecting surplus electricity to the grid
4.2. Basic Parameter Settings
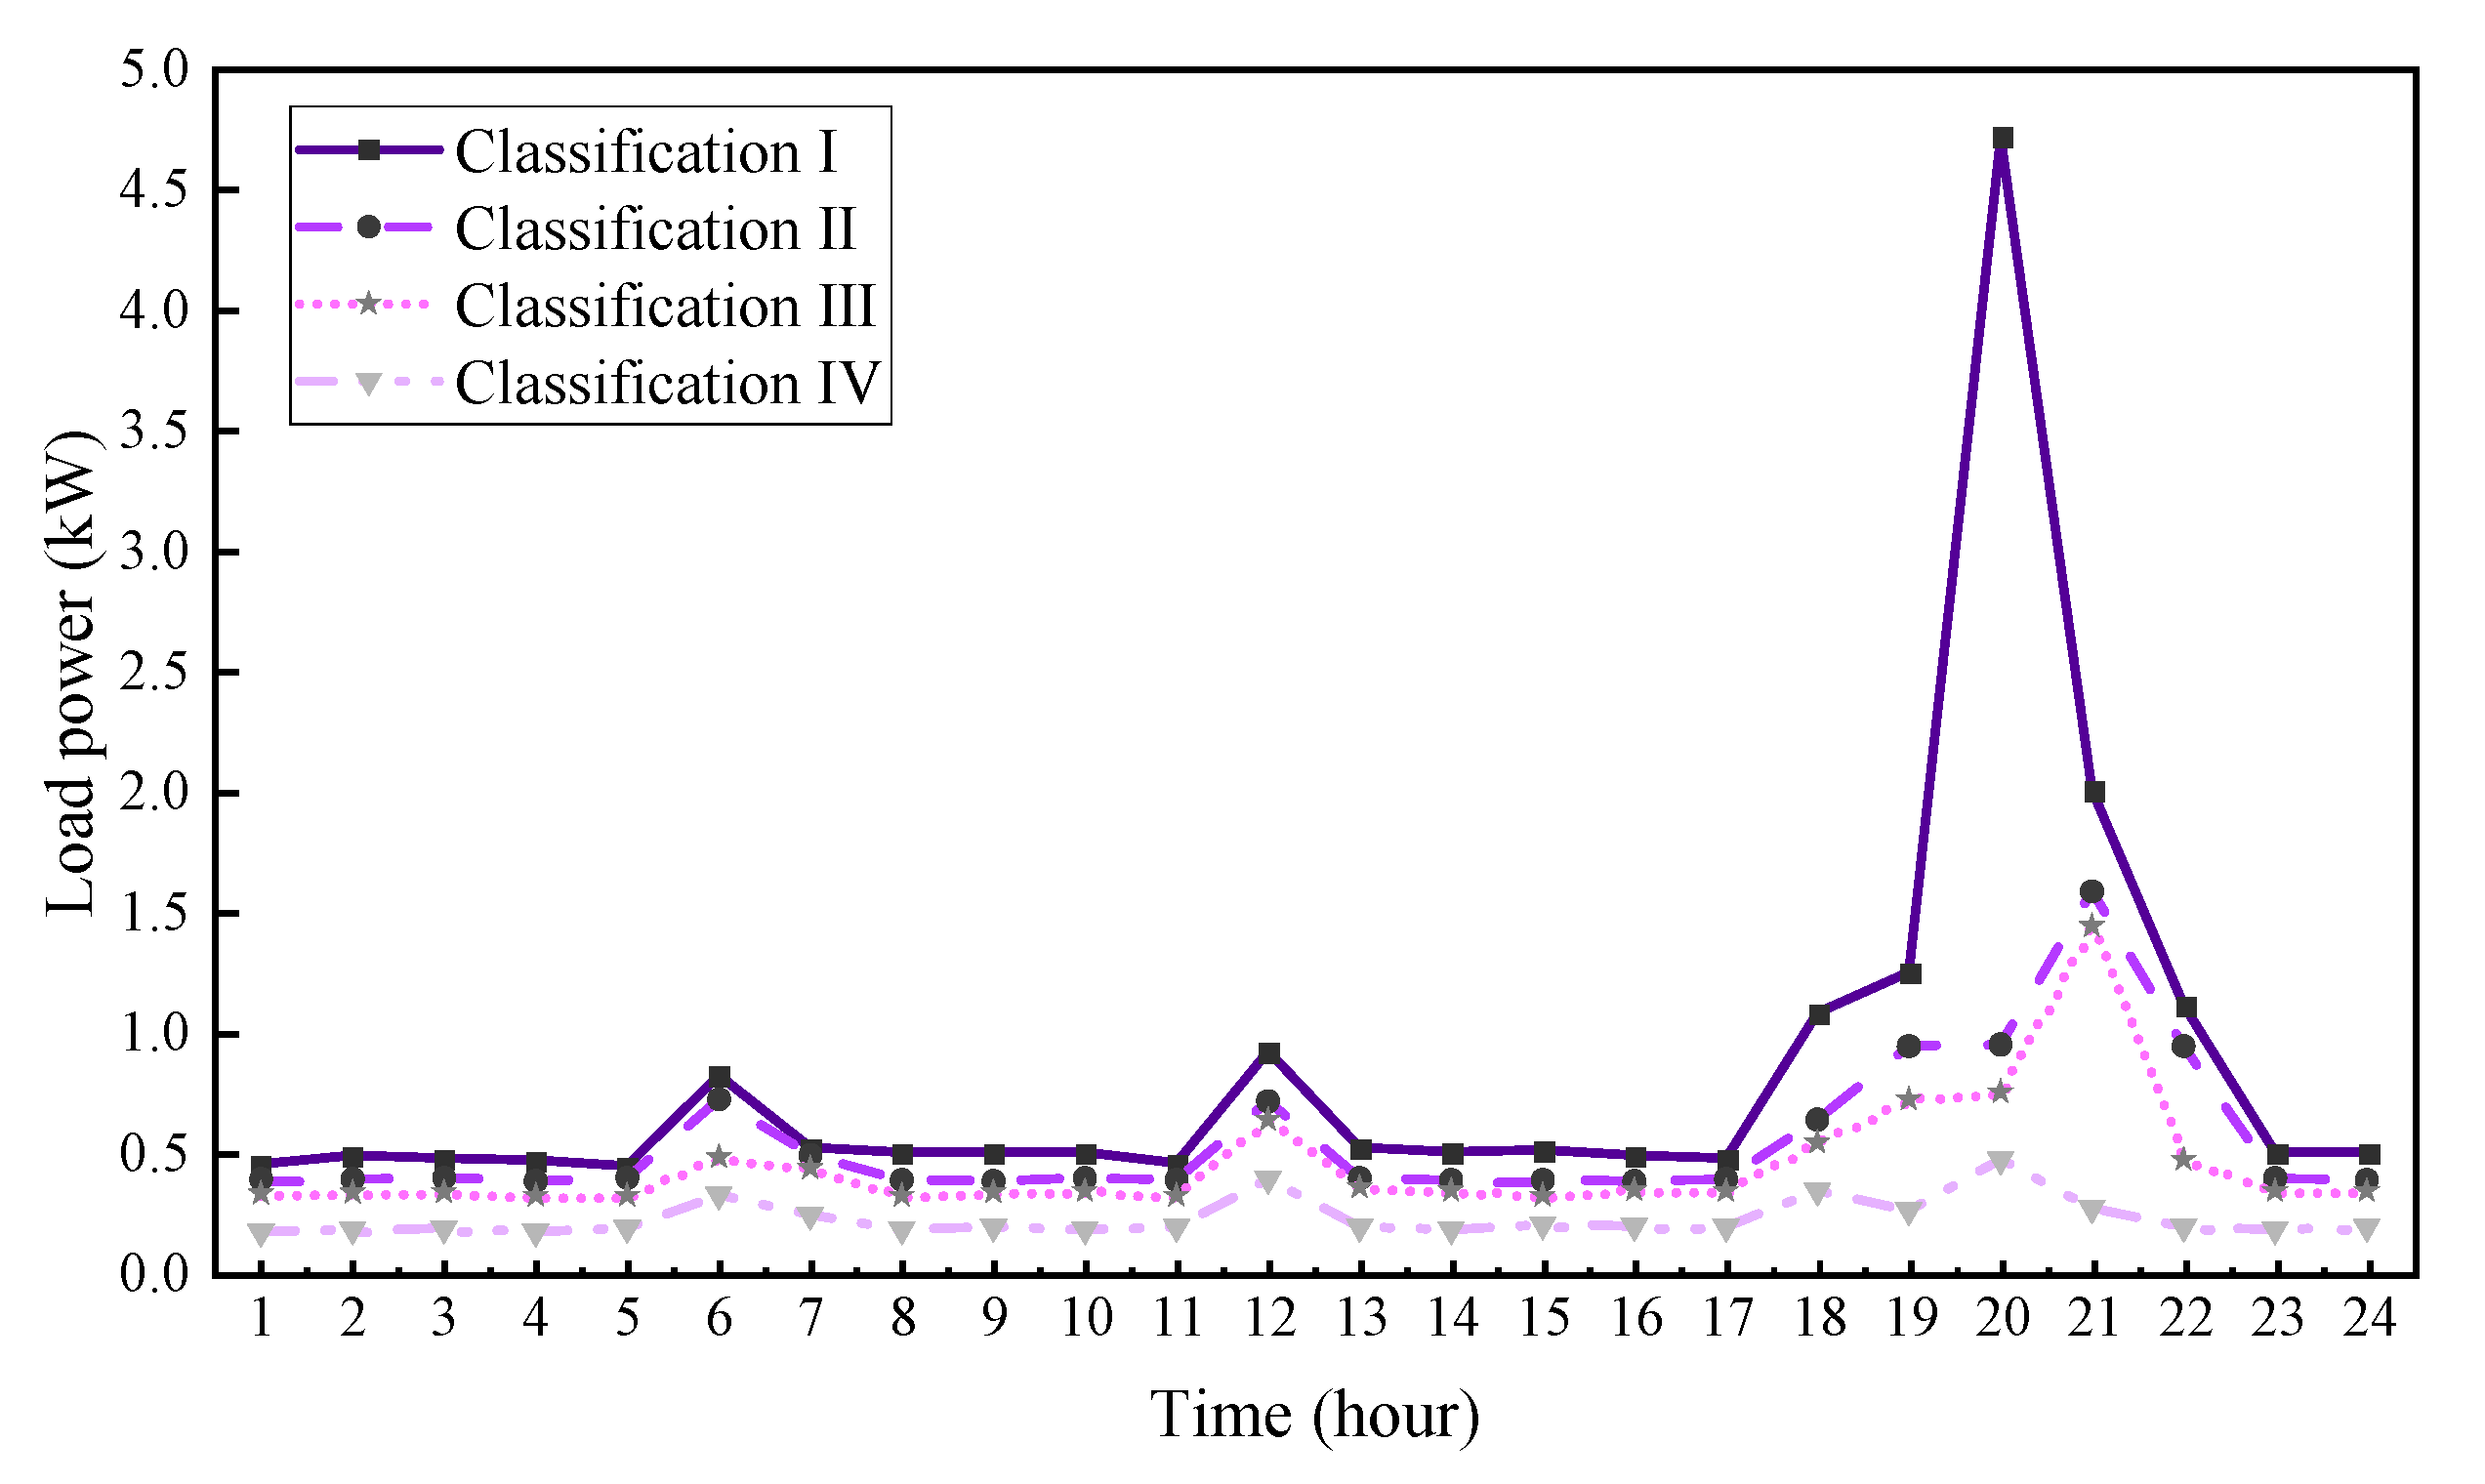
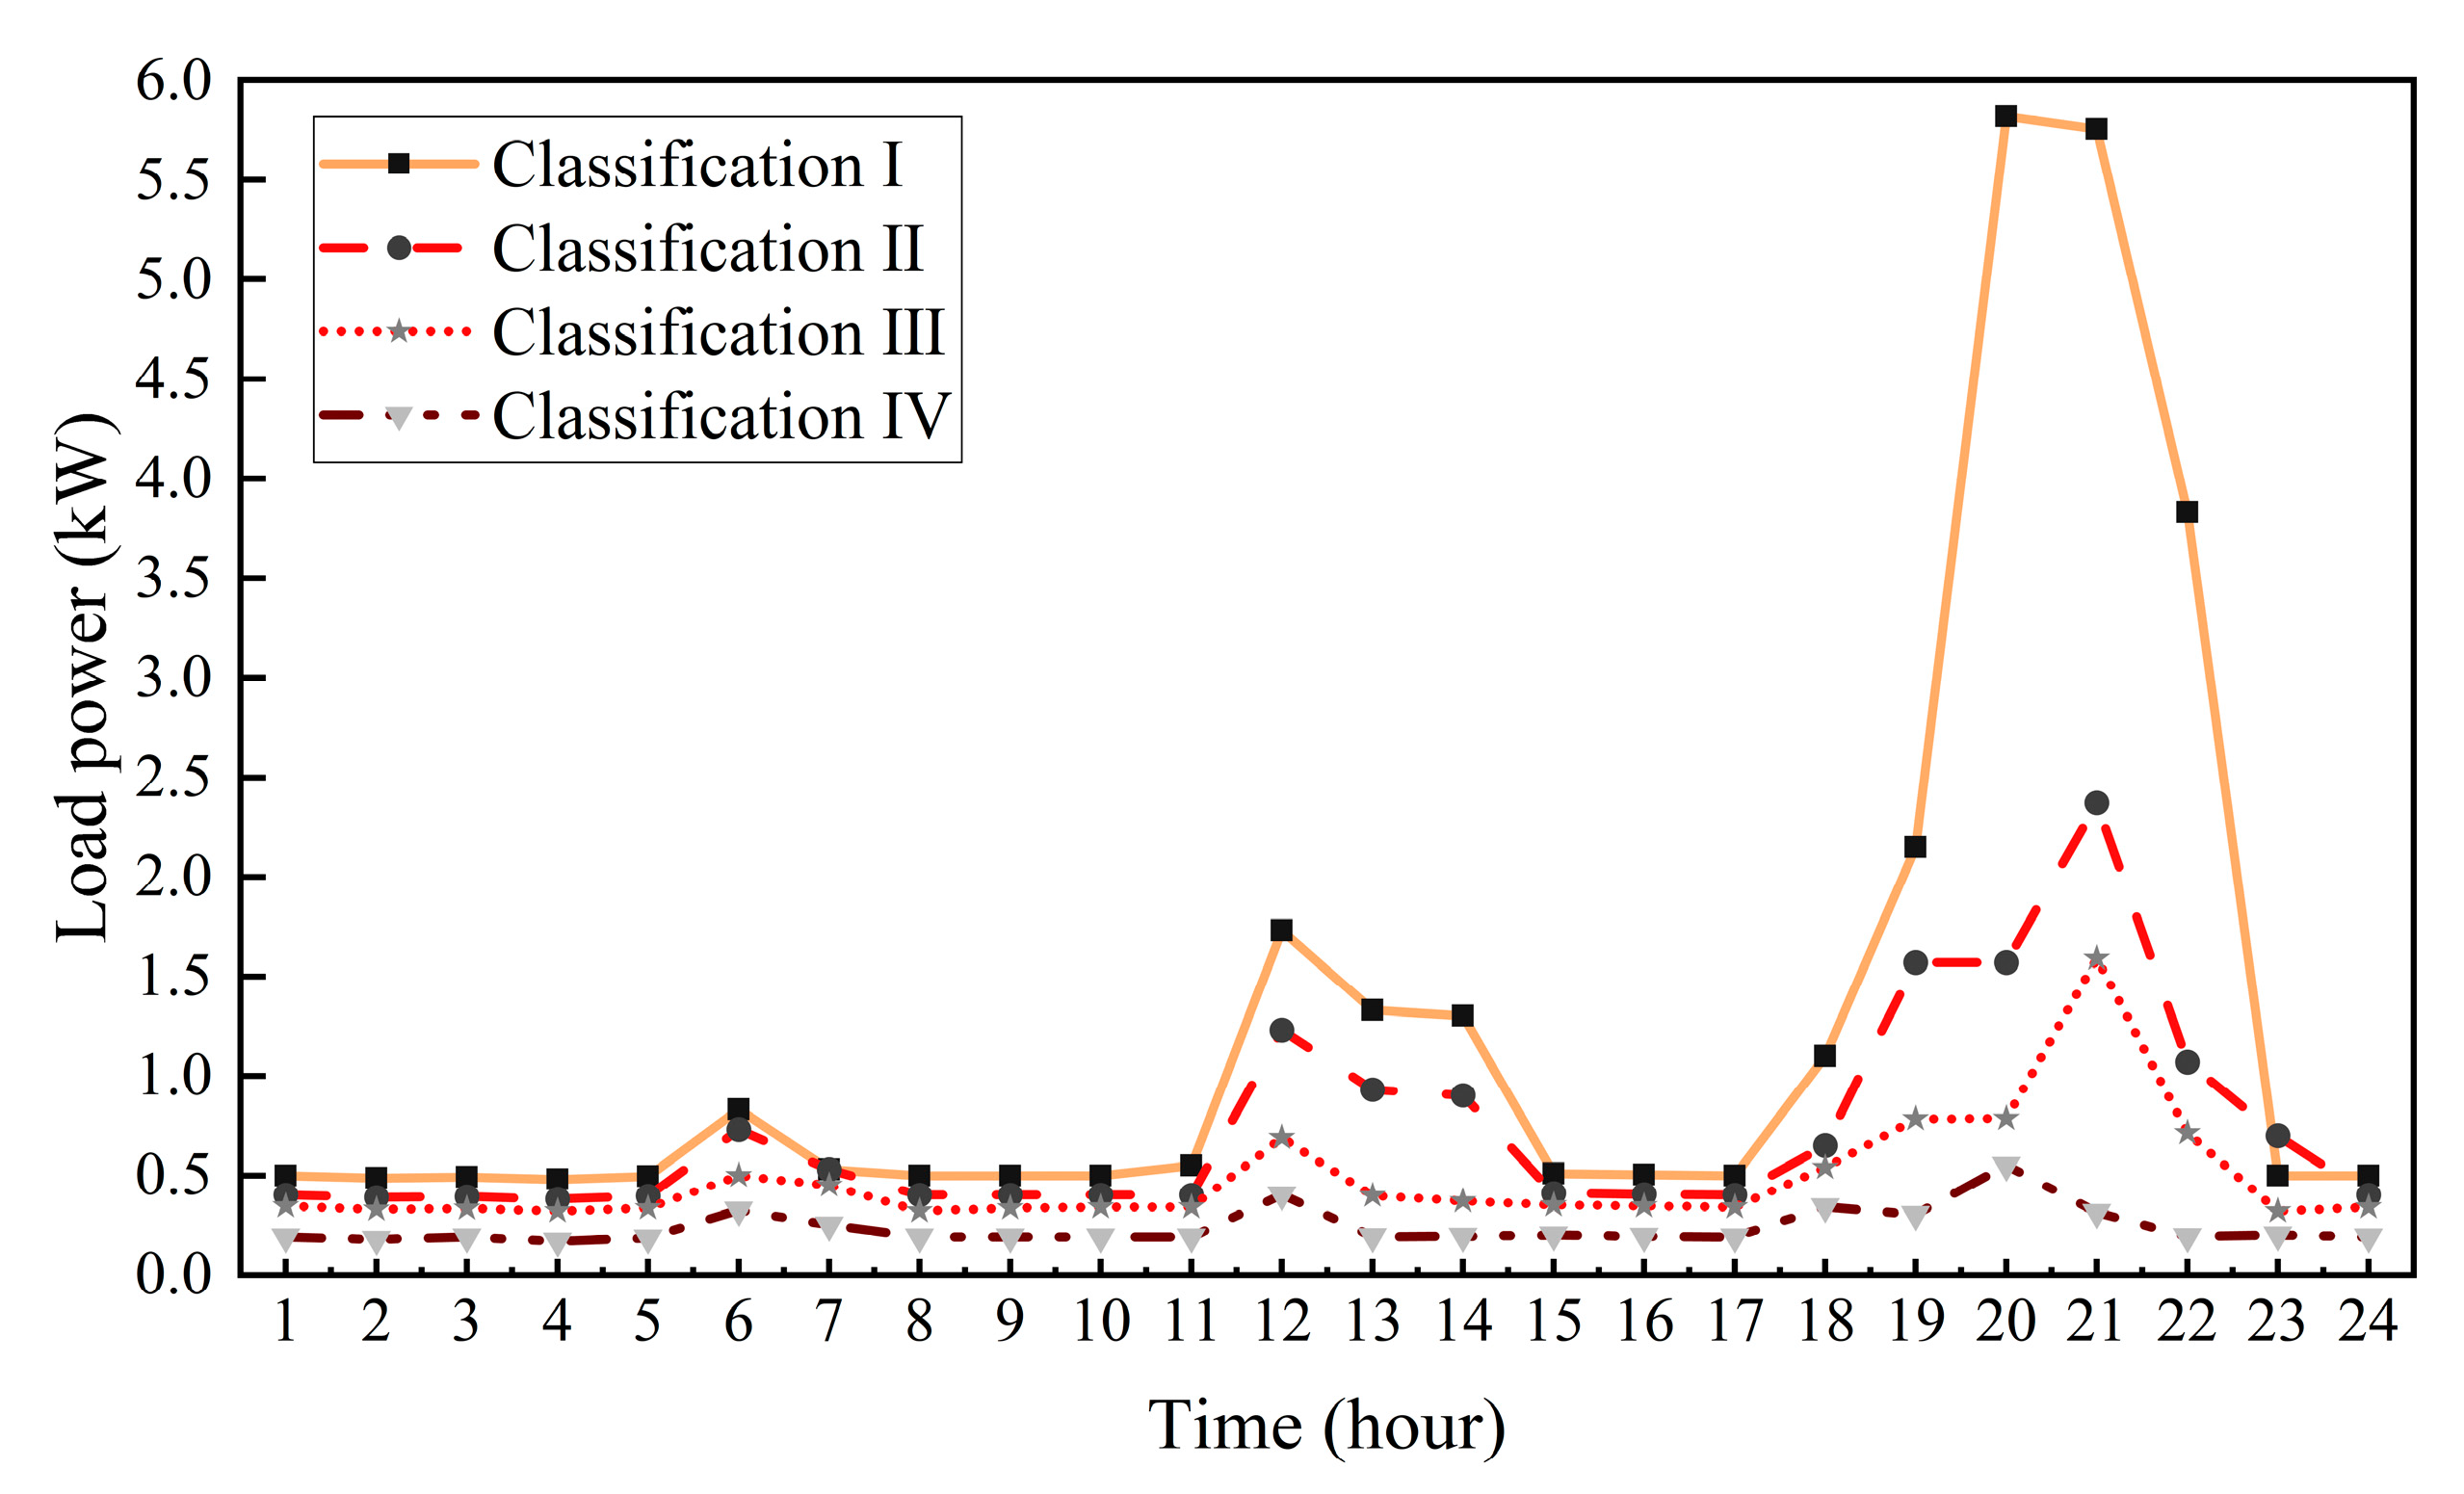
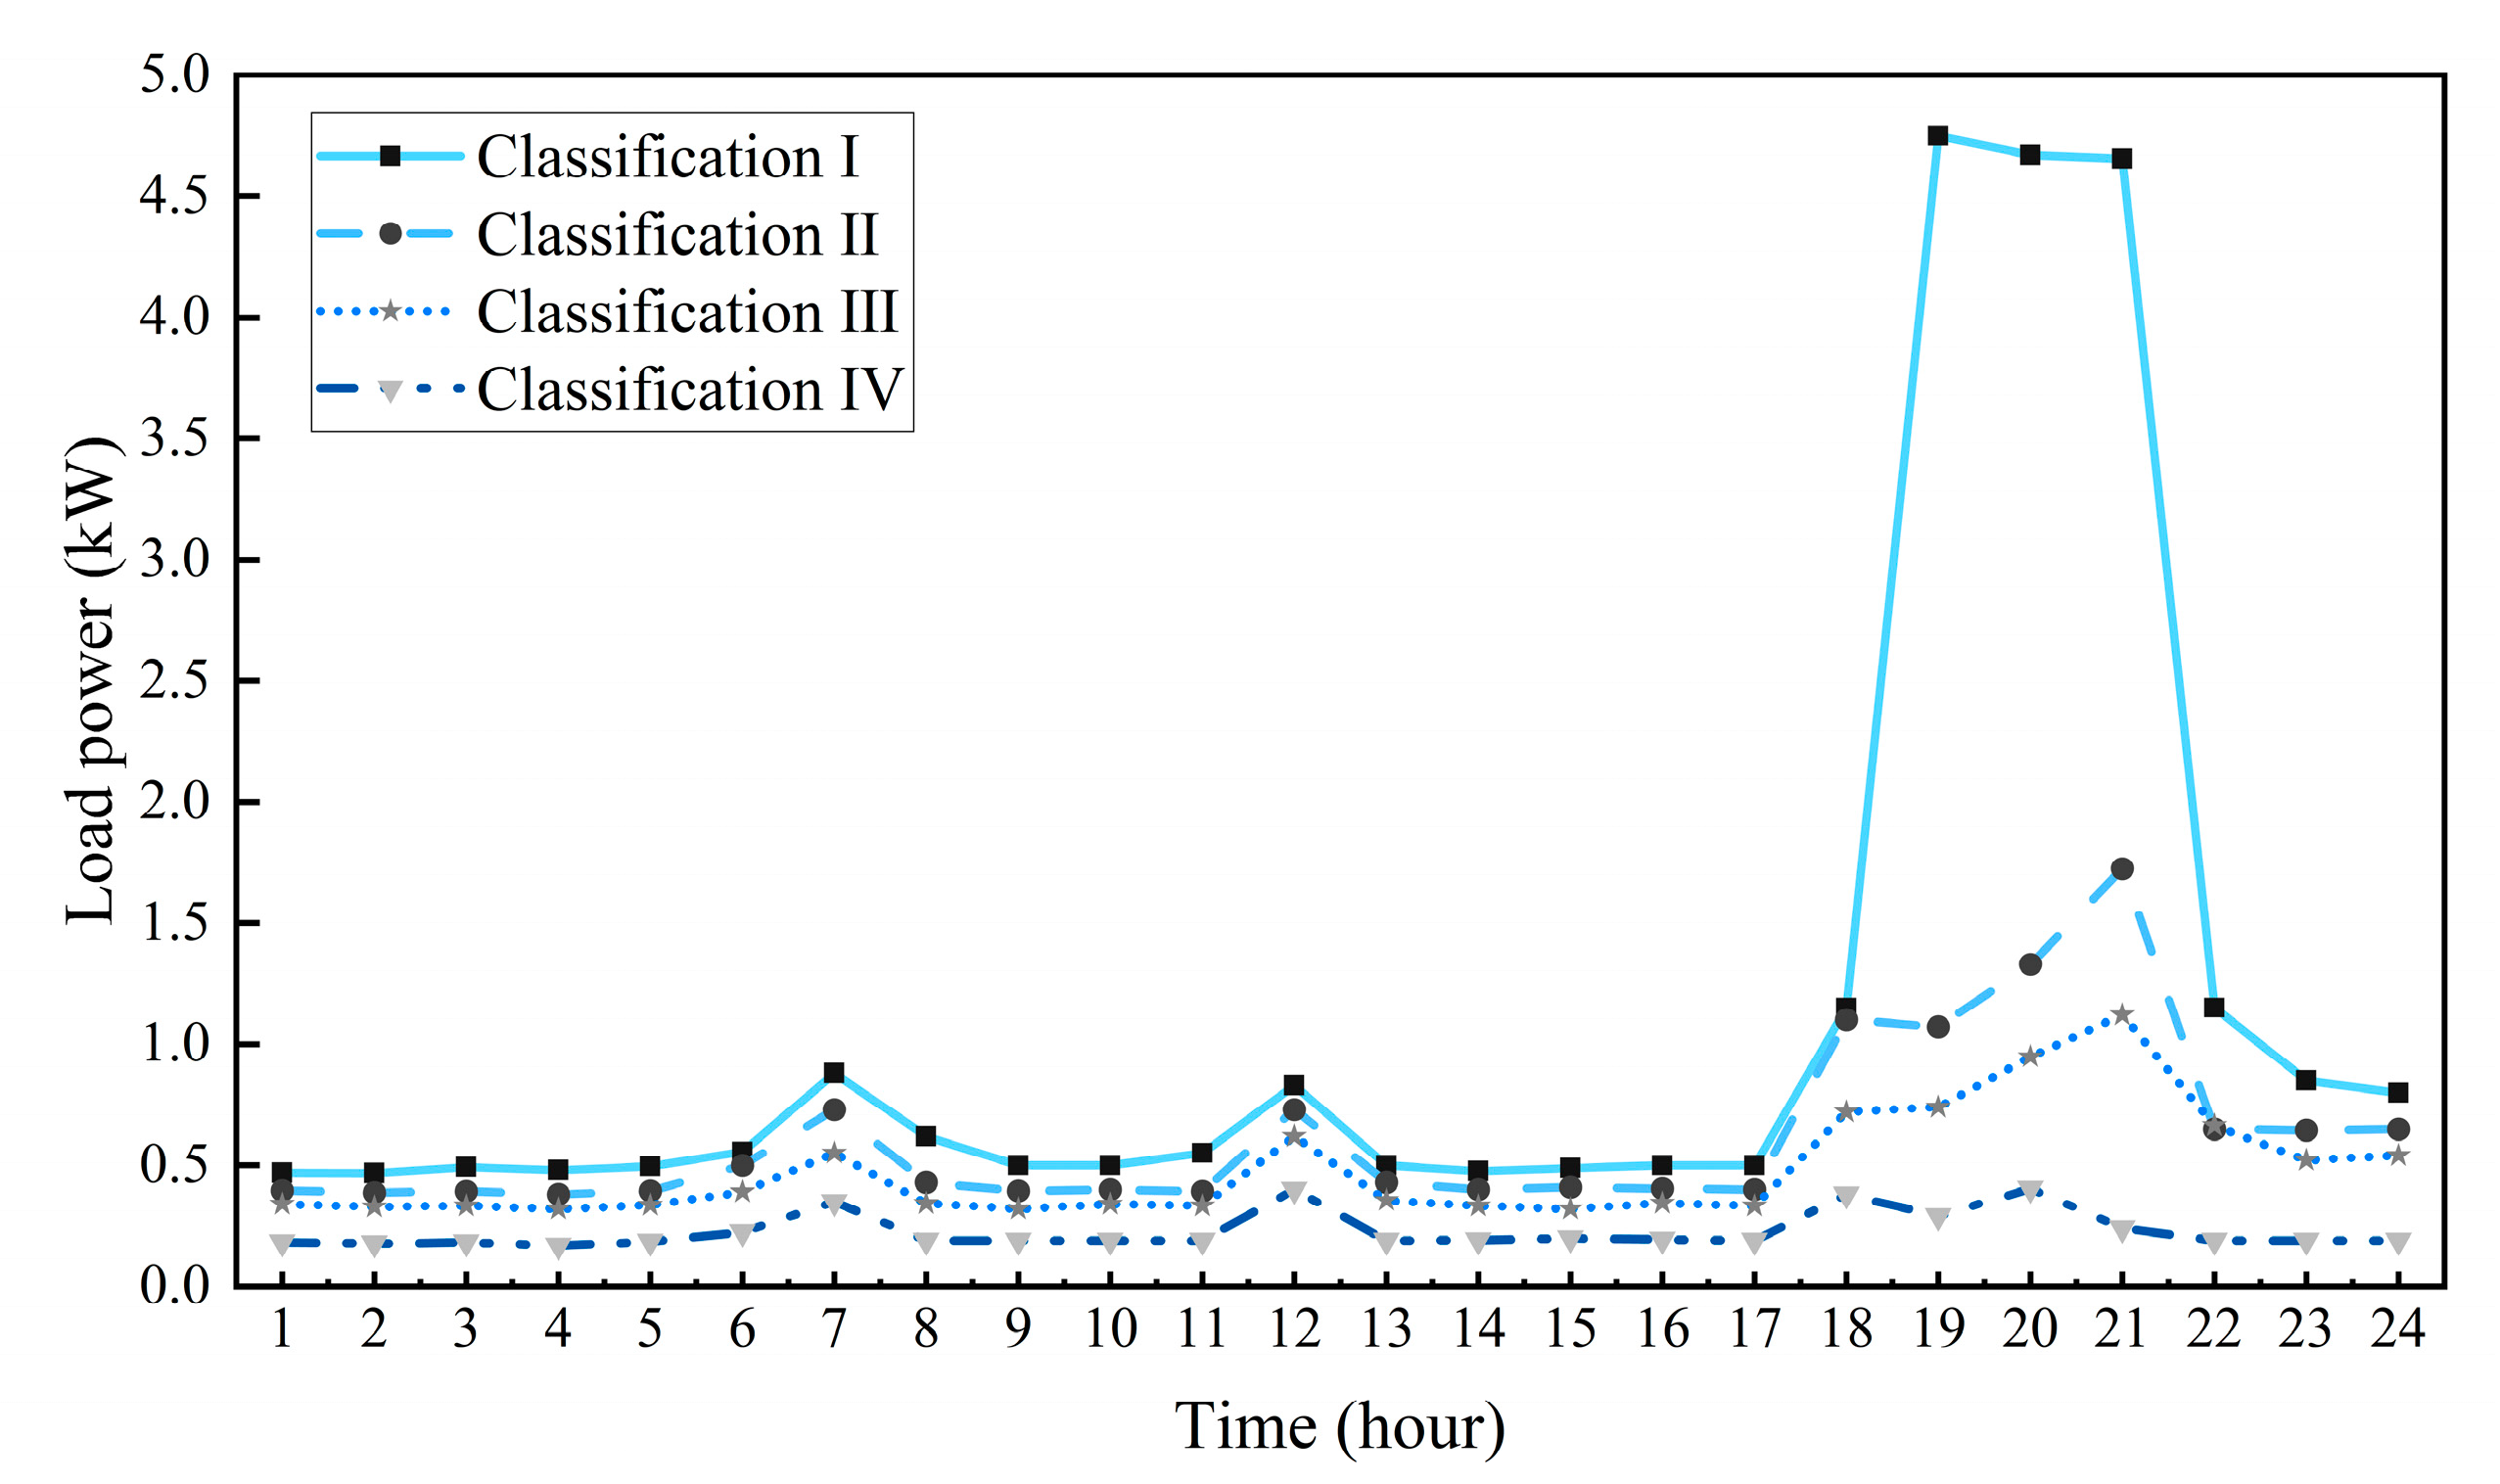
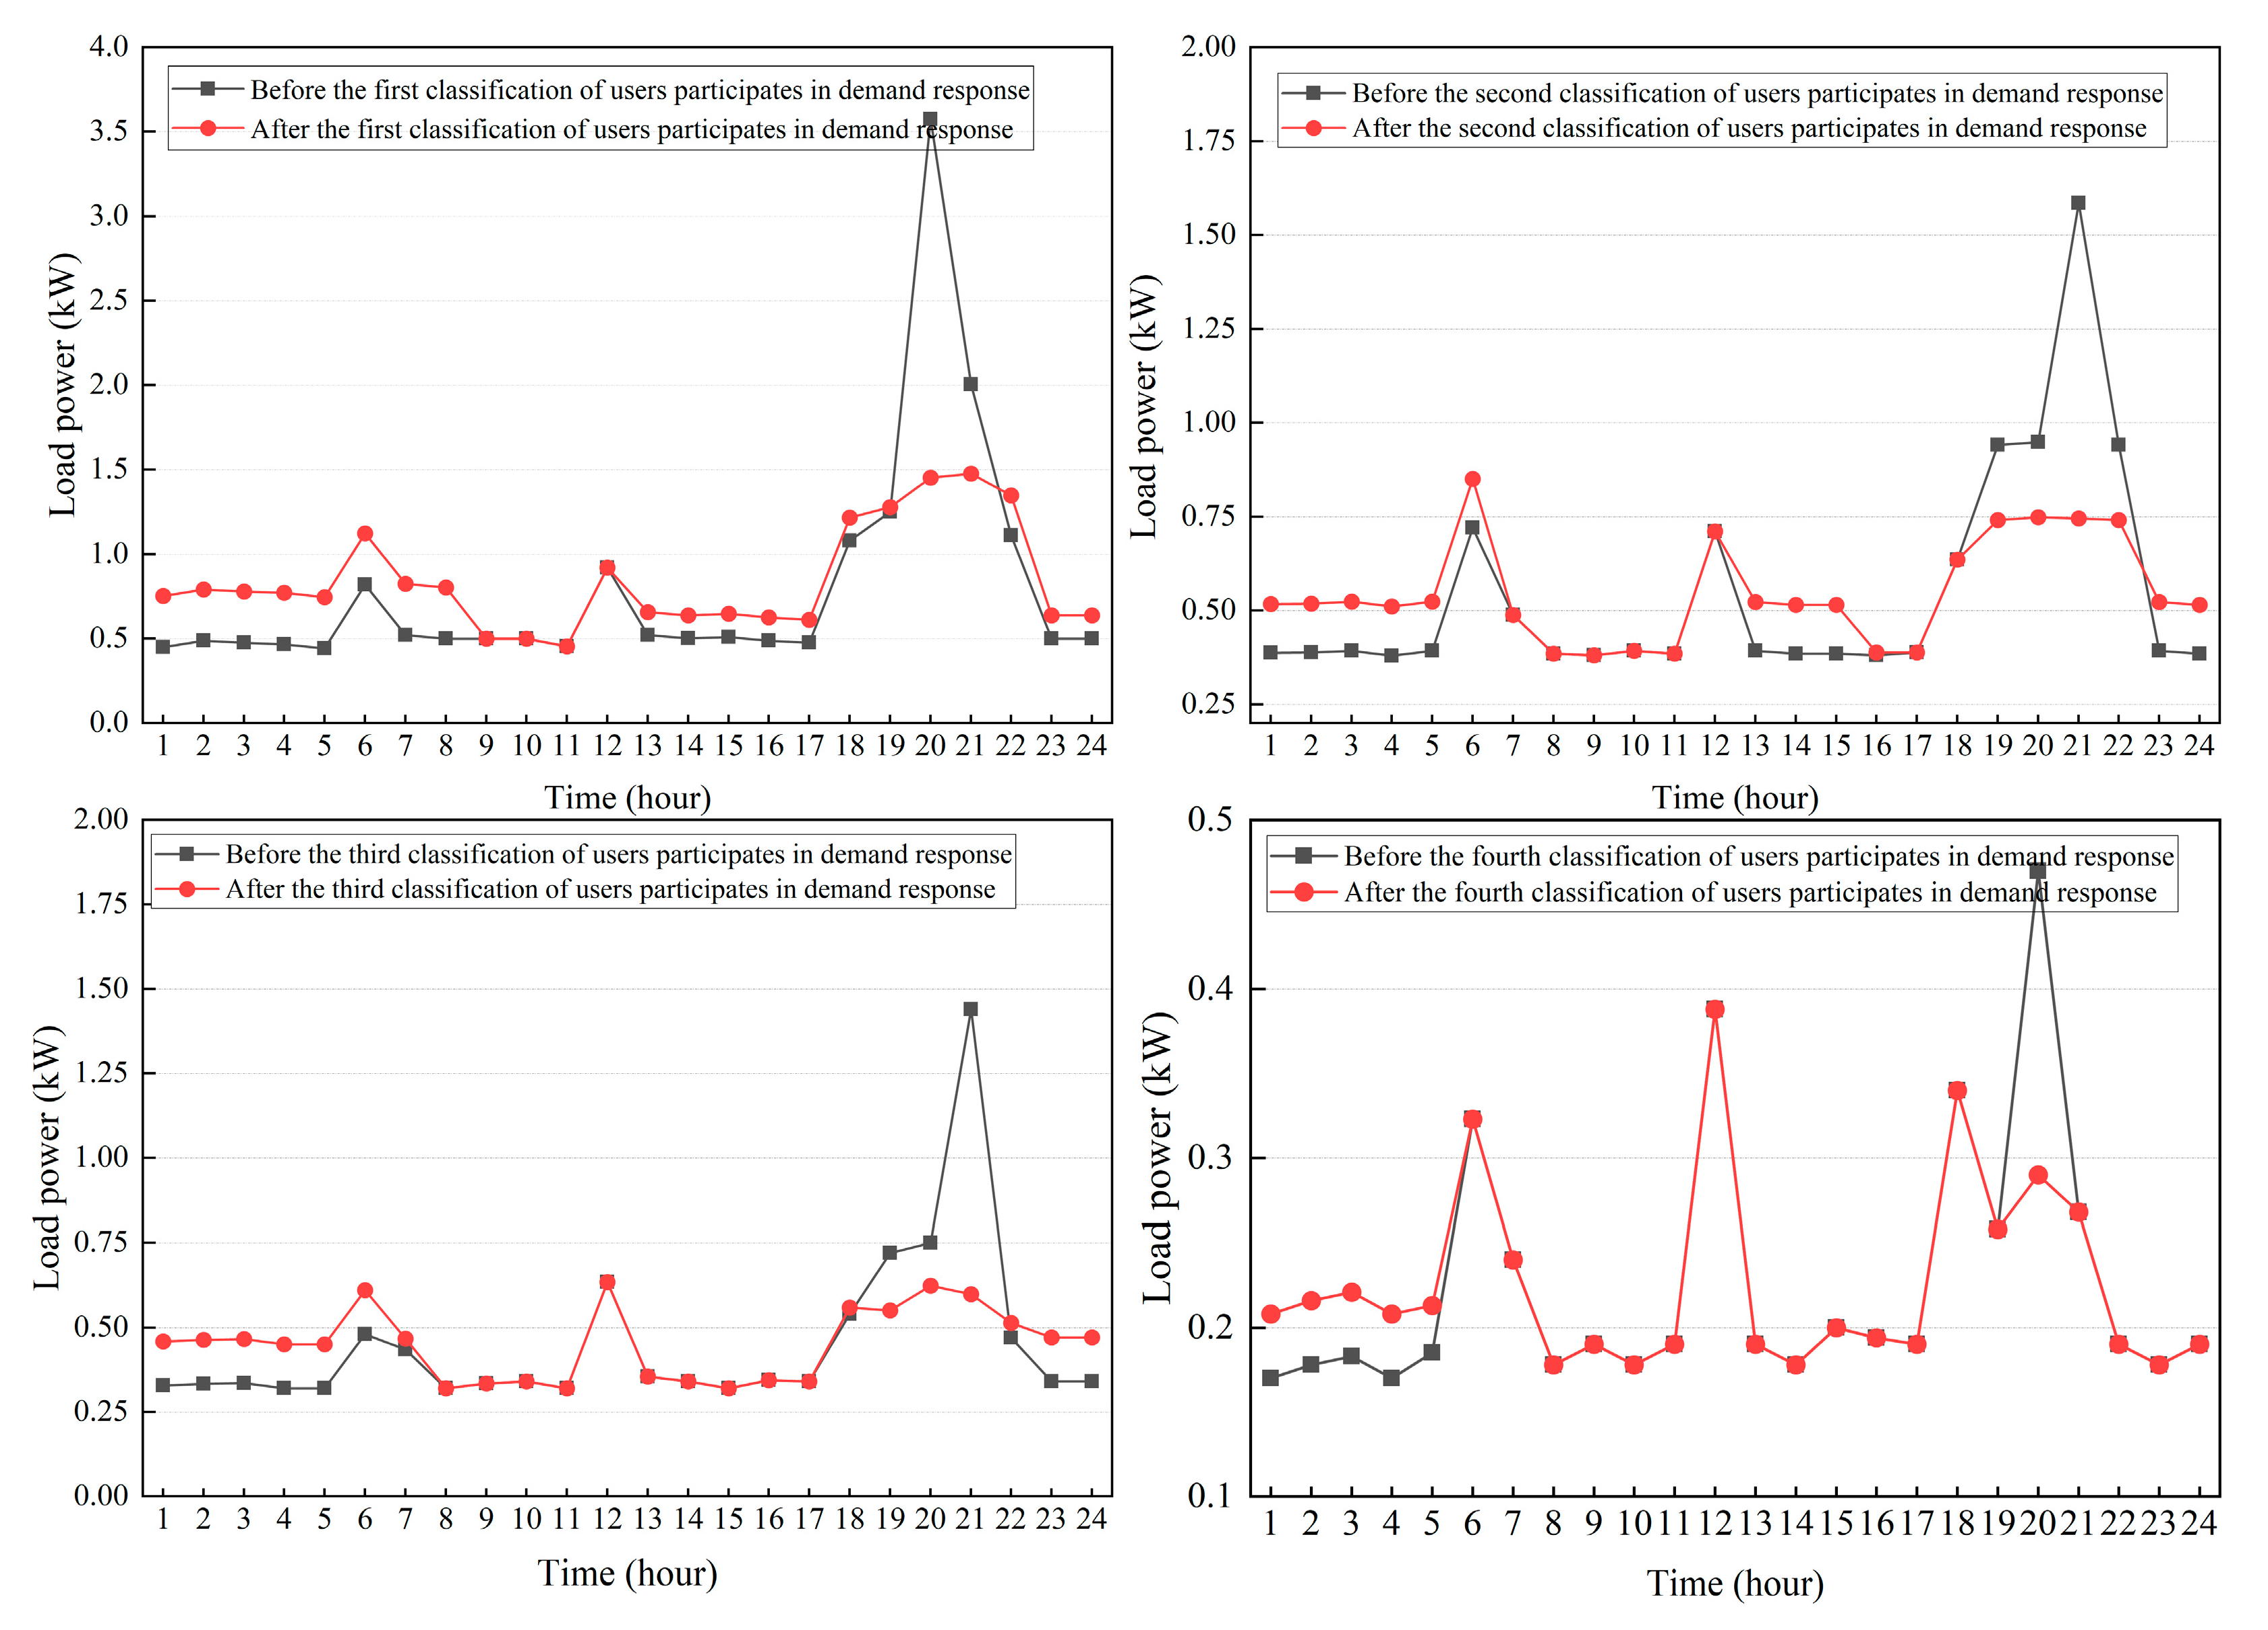
4.2.1. Simulation of the Load on Rural Residents
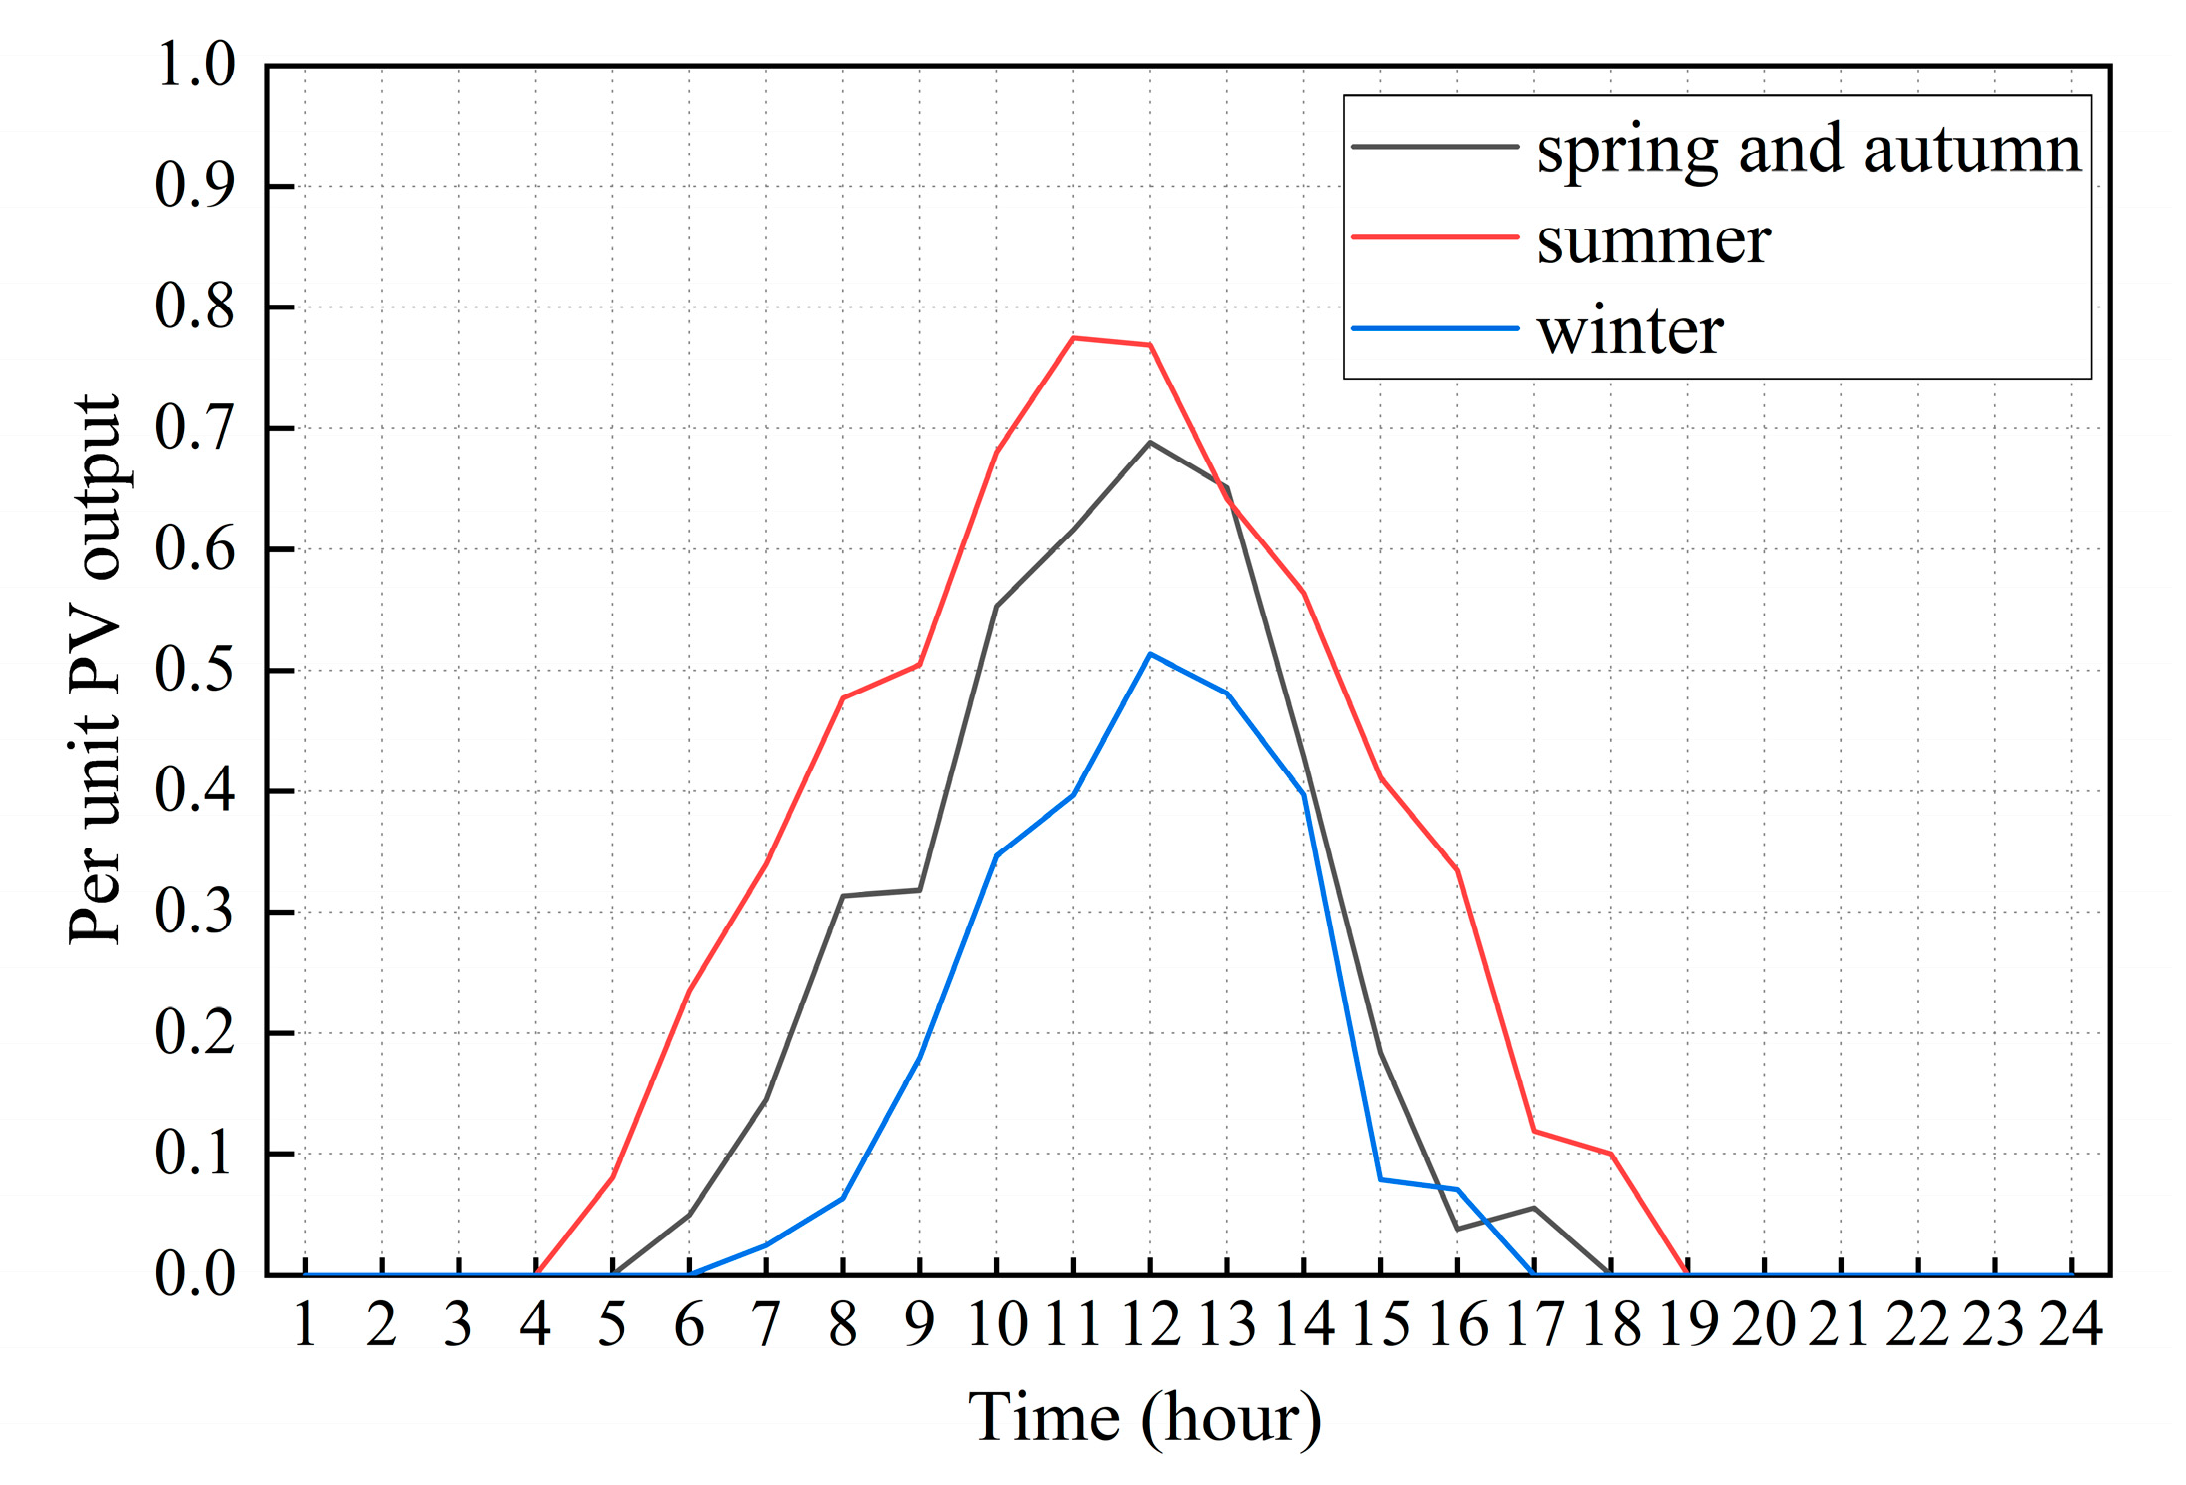
4.2.2. Simulation of Distributed PV Cluster Output Scenarios
4.2.3. Other Data
4.3. Energy Storage Optimization Configuration
4.3.1. Energy Storage Configuration Results for Scenarios Without Demand Response in the Mode of Self-Generation and Self-Consumption with Remaining Power Connected to the Grid
4.3.2. Energy Storage Configuration Results for Demand Response Scenarios in the Mode of Self-Generation and Self-Consumption with Remaining Power Connected to the Grid
4.4. Comparative Analysis of Local Consumption Capacity of New Energy
4.4.1. Analysis of Local Consumption Capacity of New Energy in Mode of All Power Connected to the Grid
4.4.2. Analysis of Local Consumption Capacity of New Energy in Mode of Self-Generation and Self-Consumption with Remaining Power Connected to the Grid
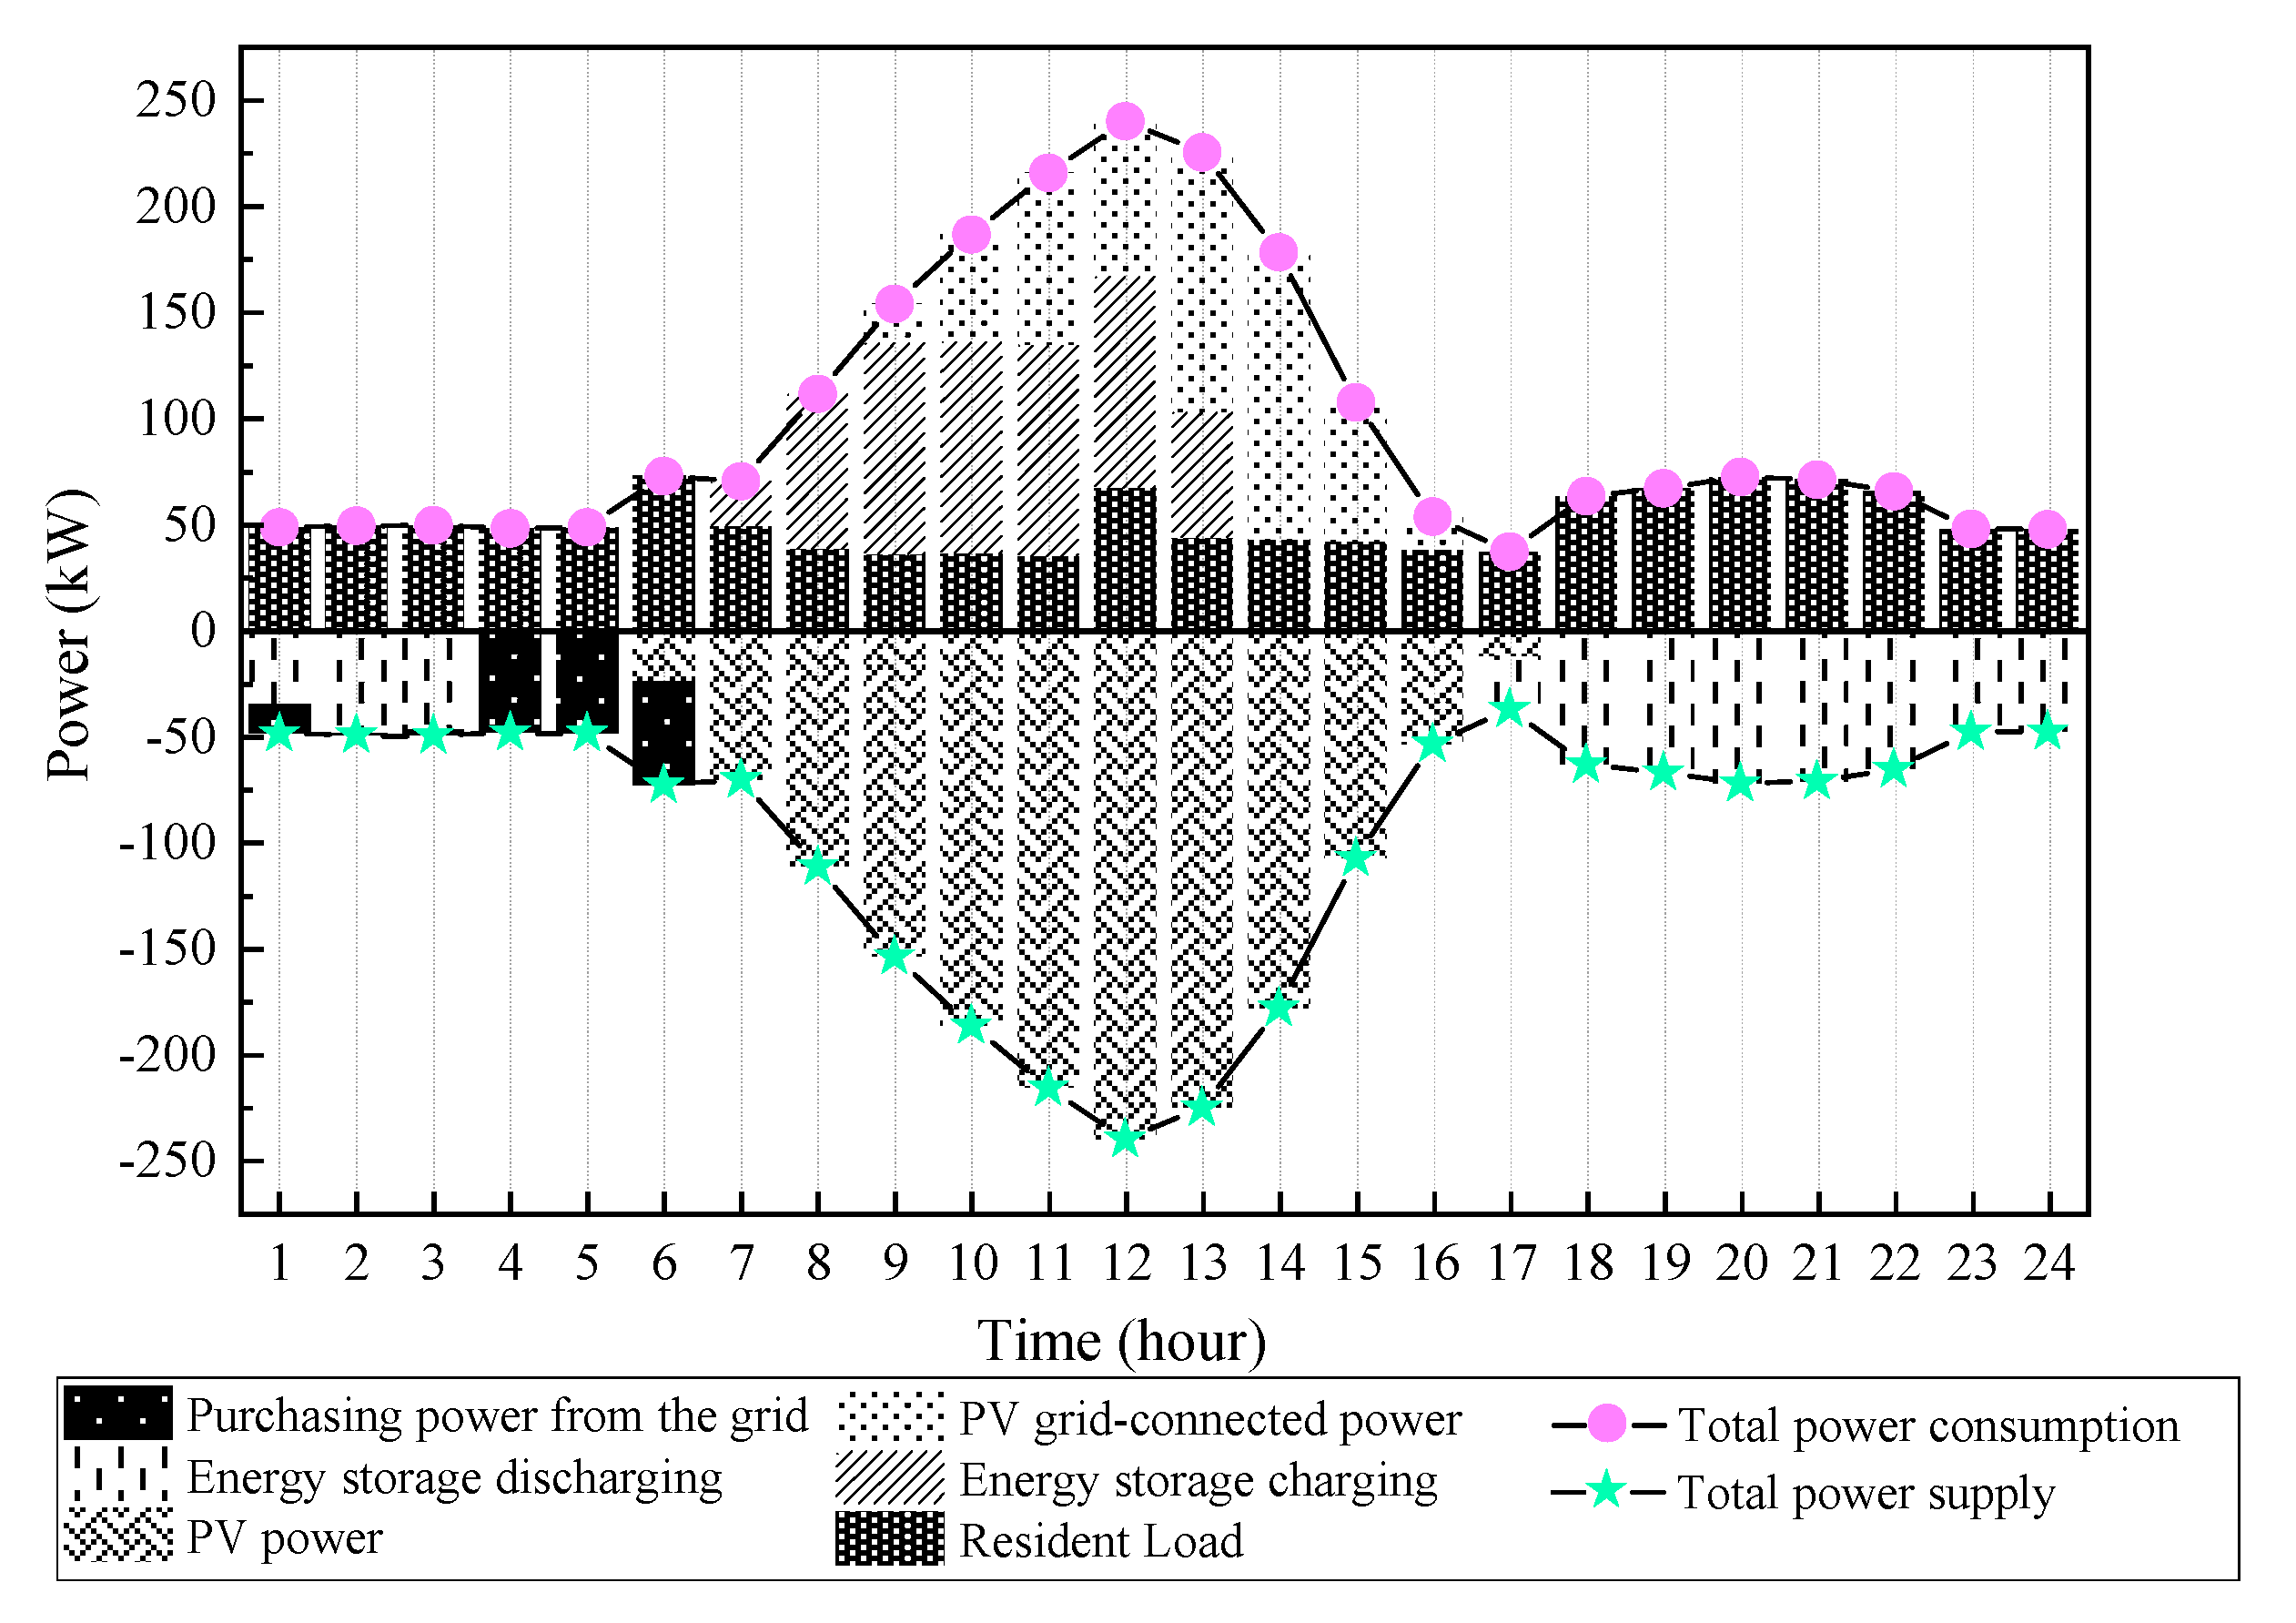
- Analysis of PV local consumption results in Scenario 2-1
- 2.
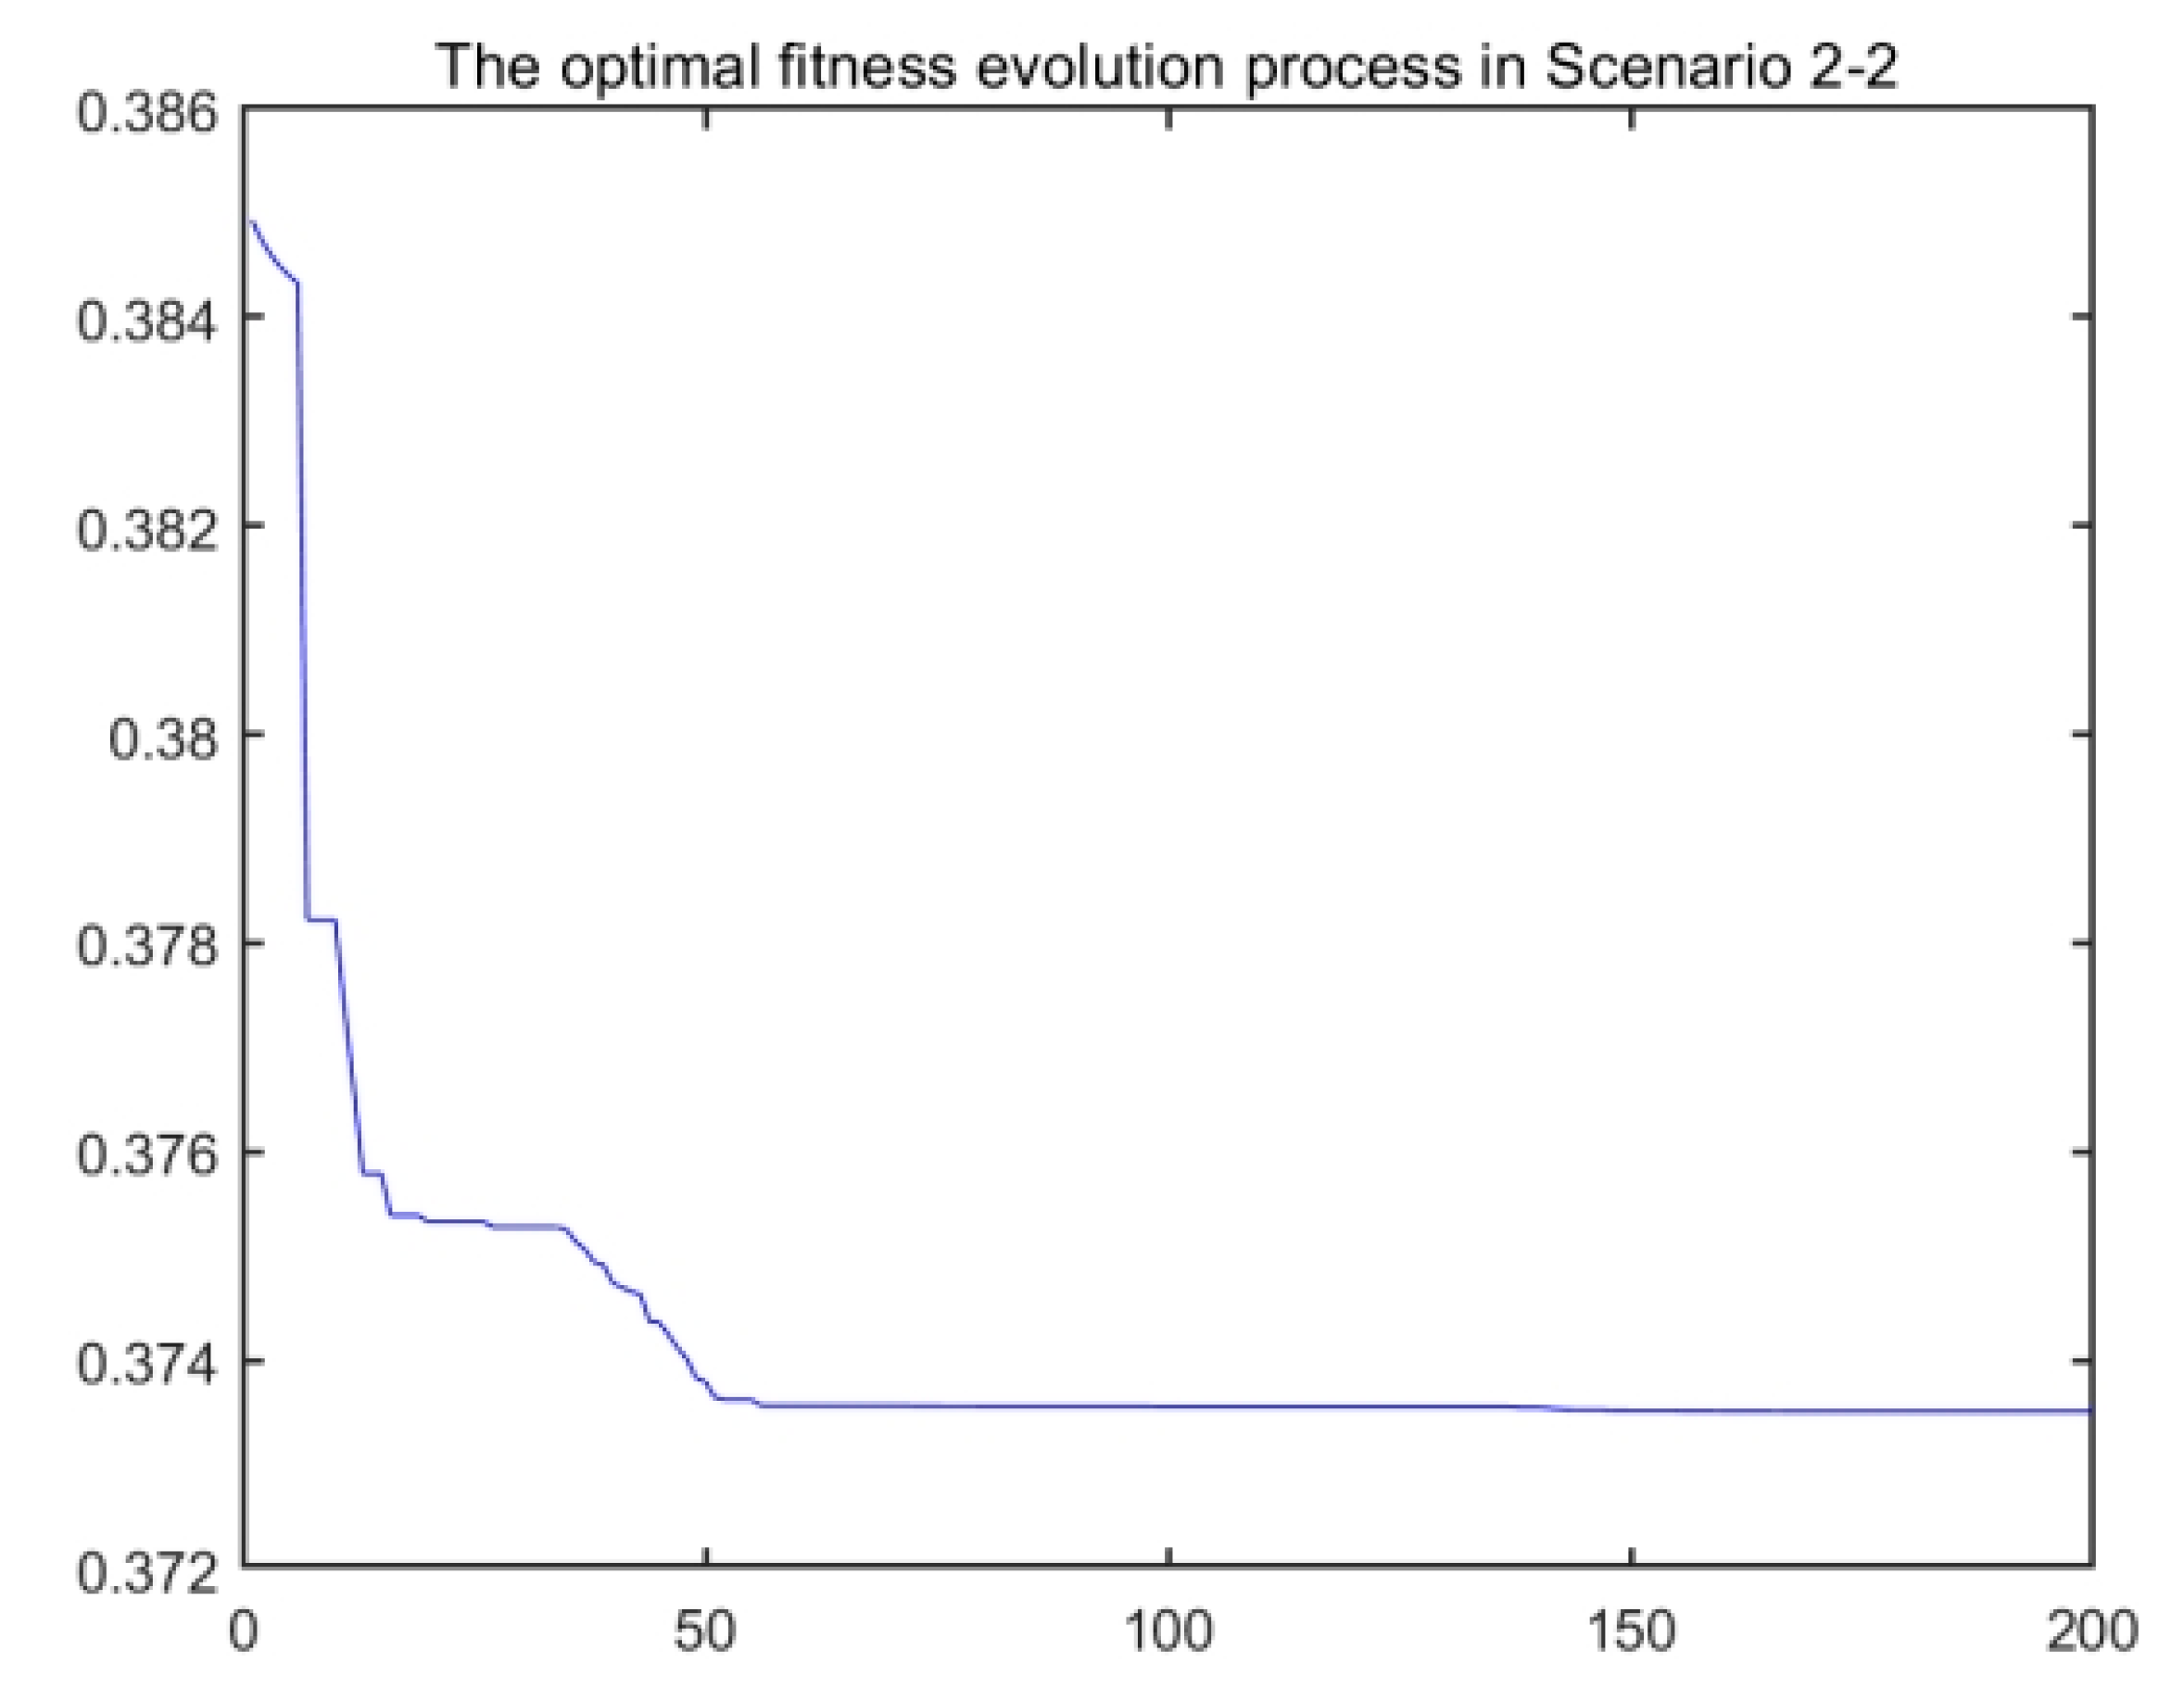
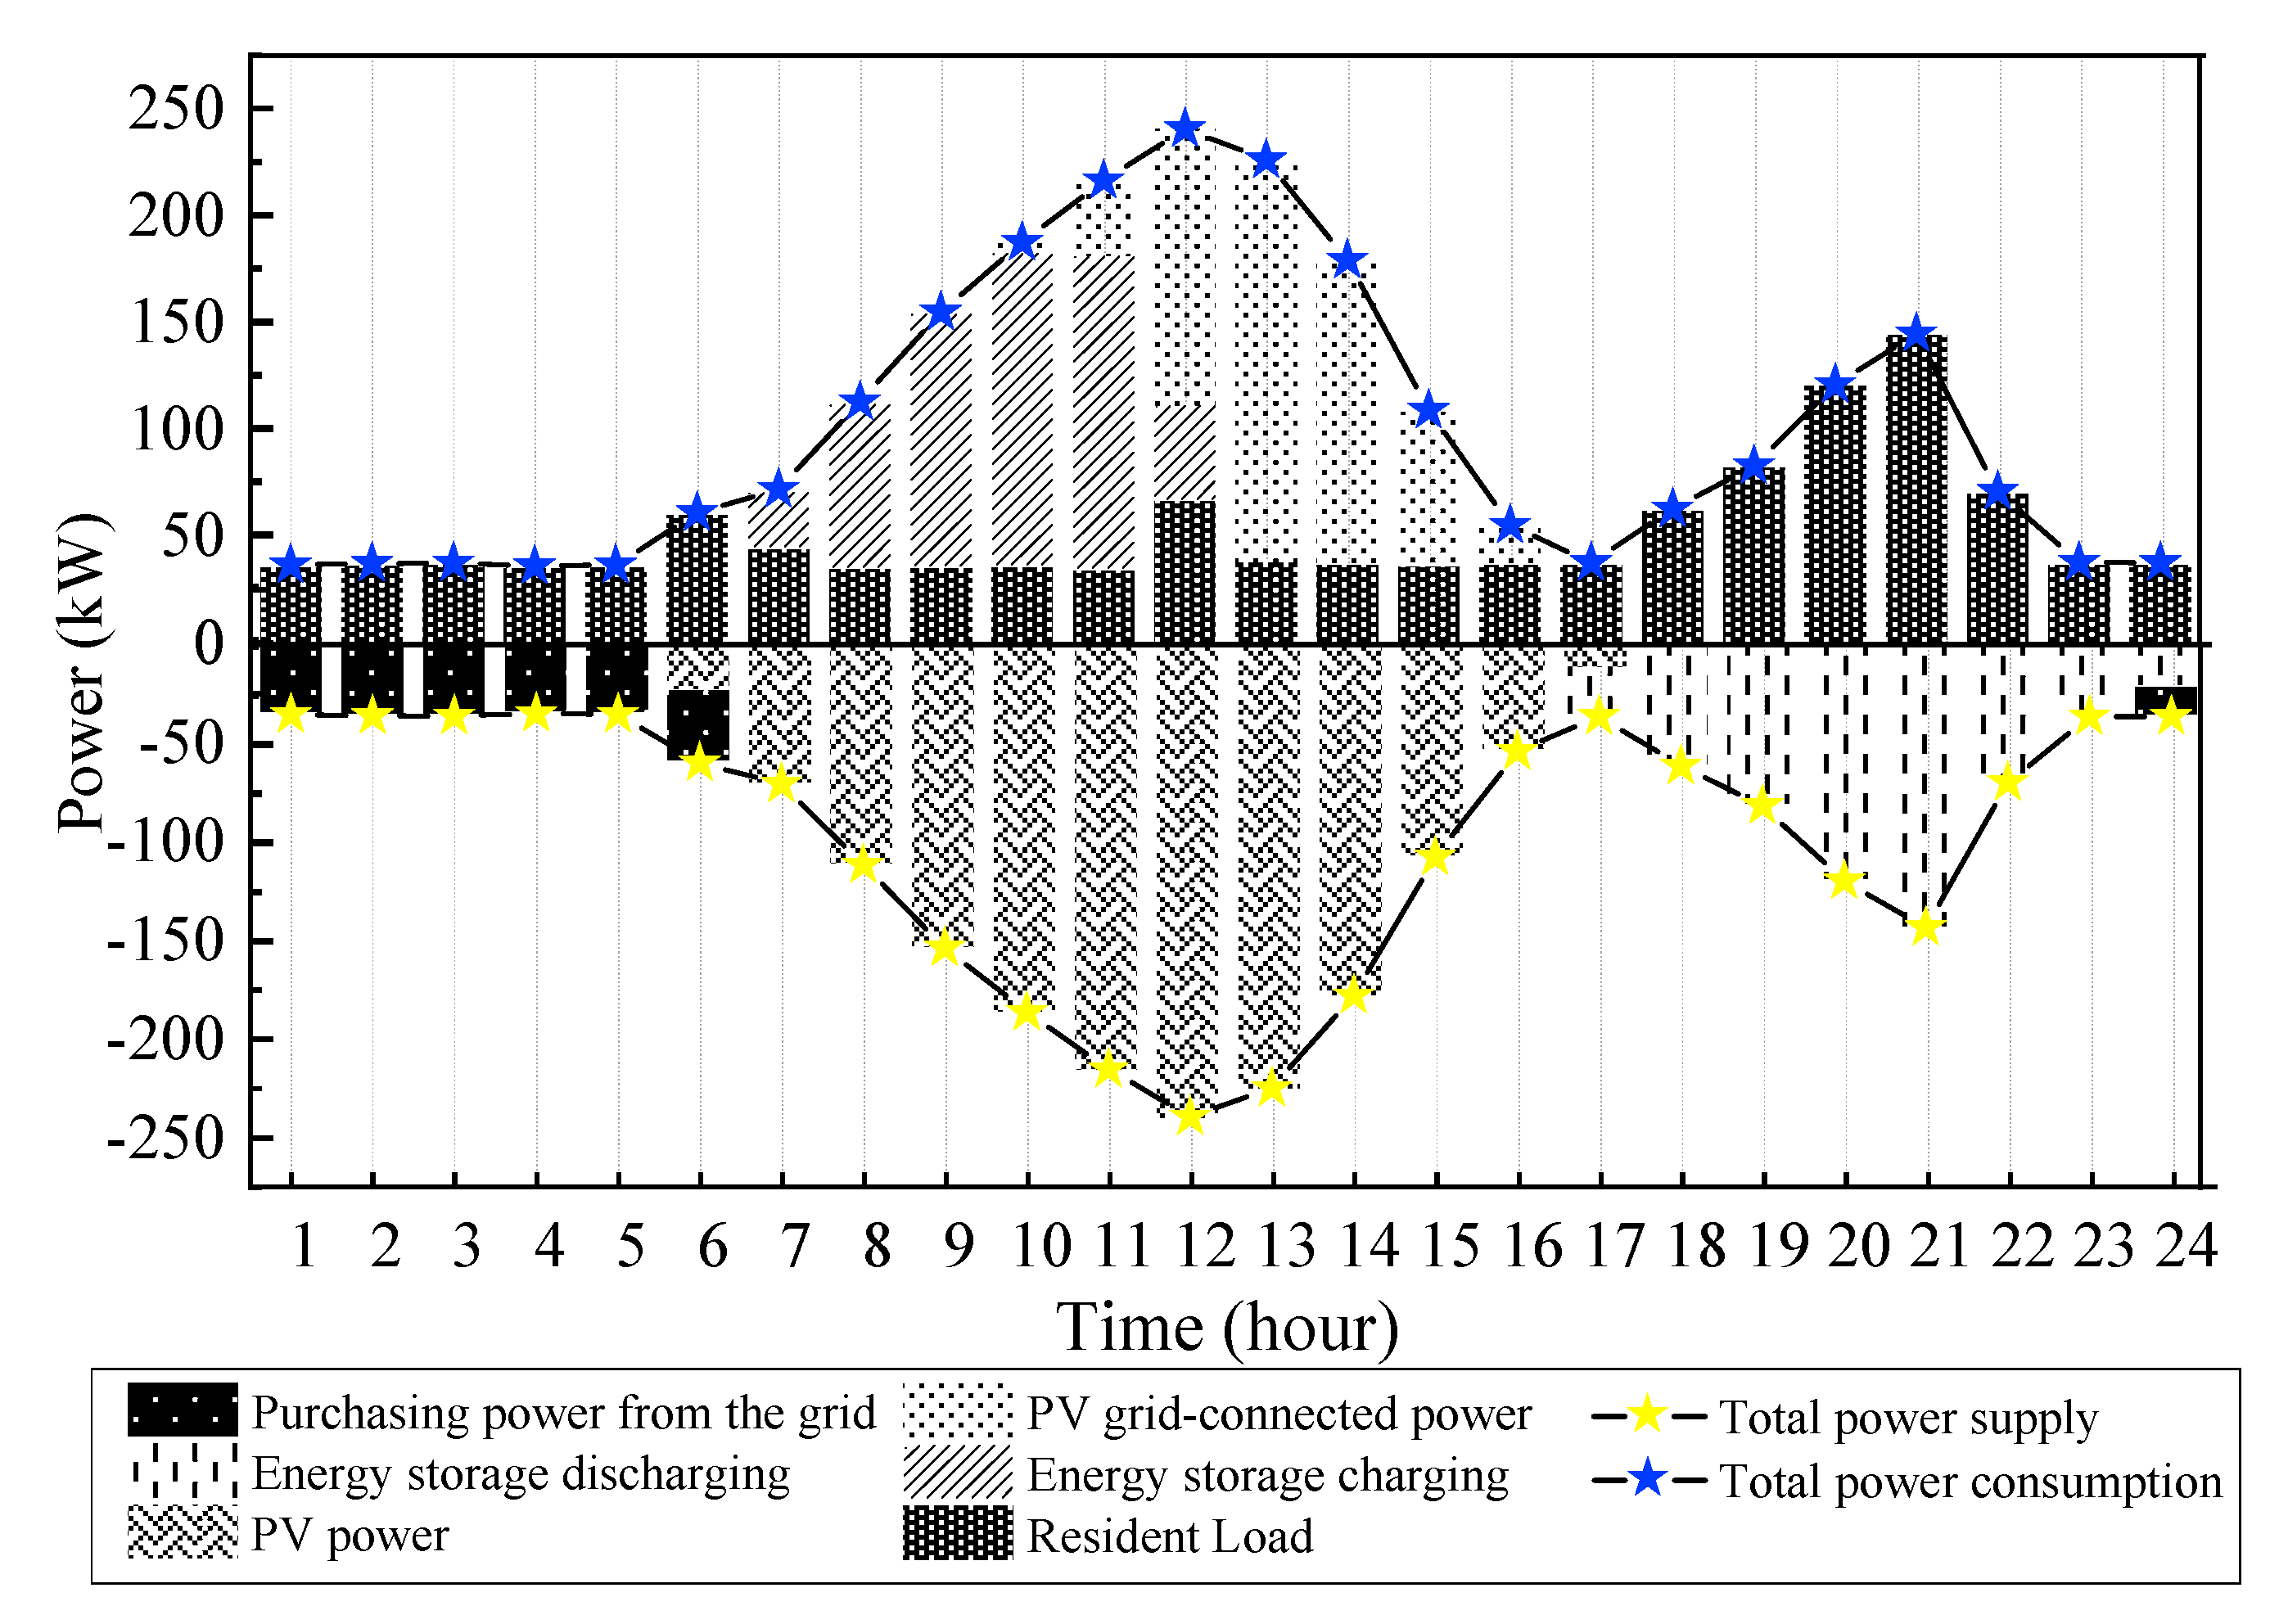
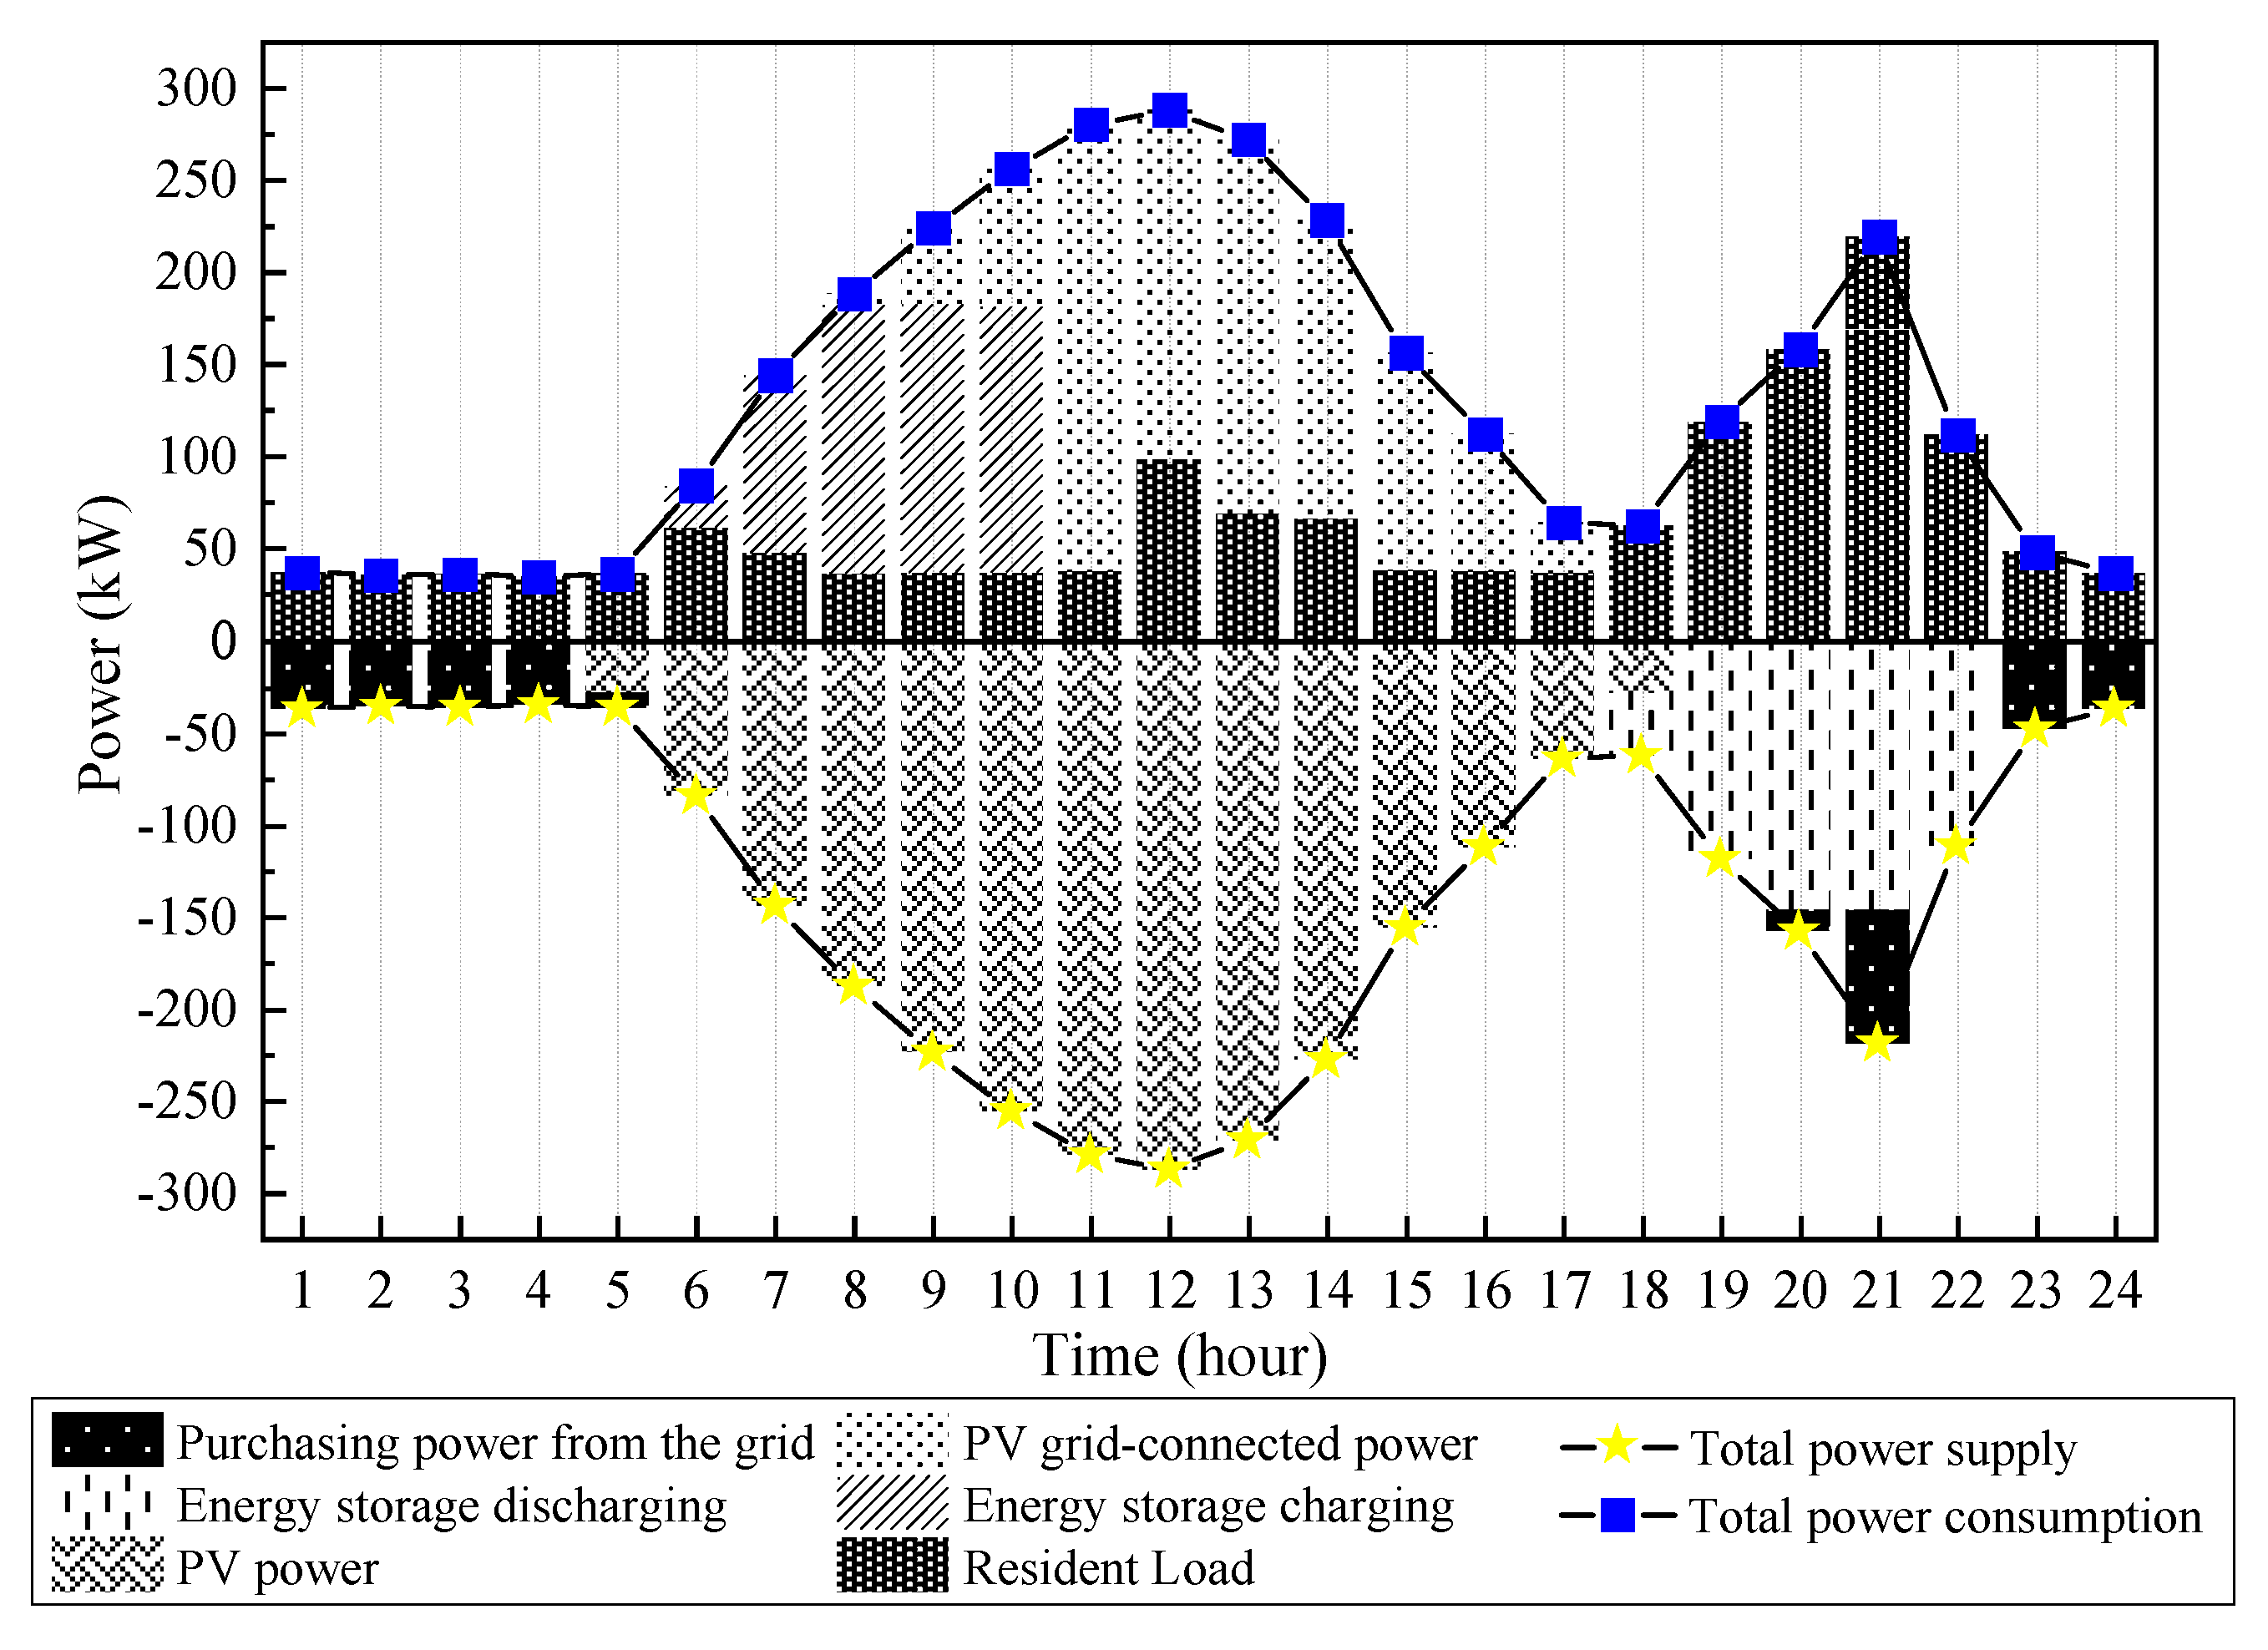
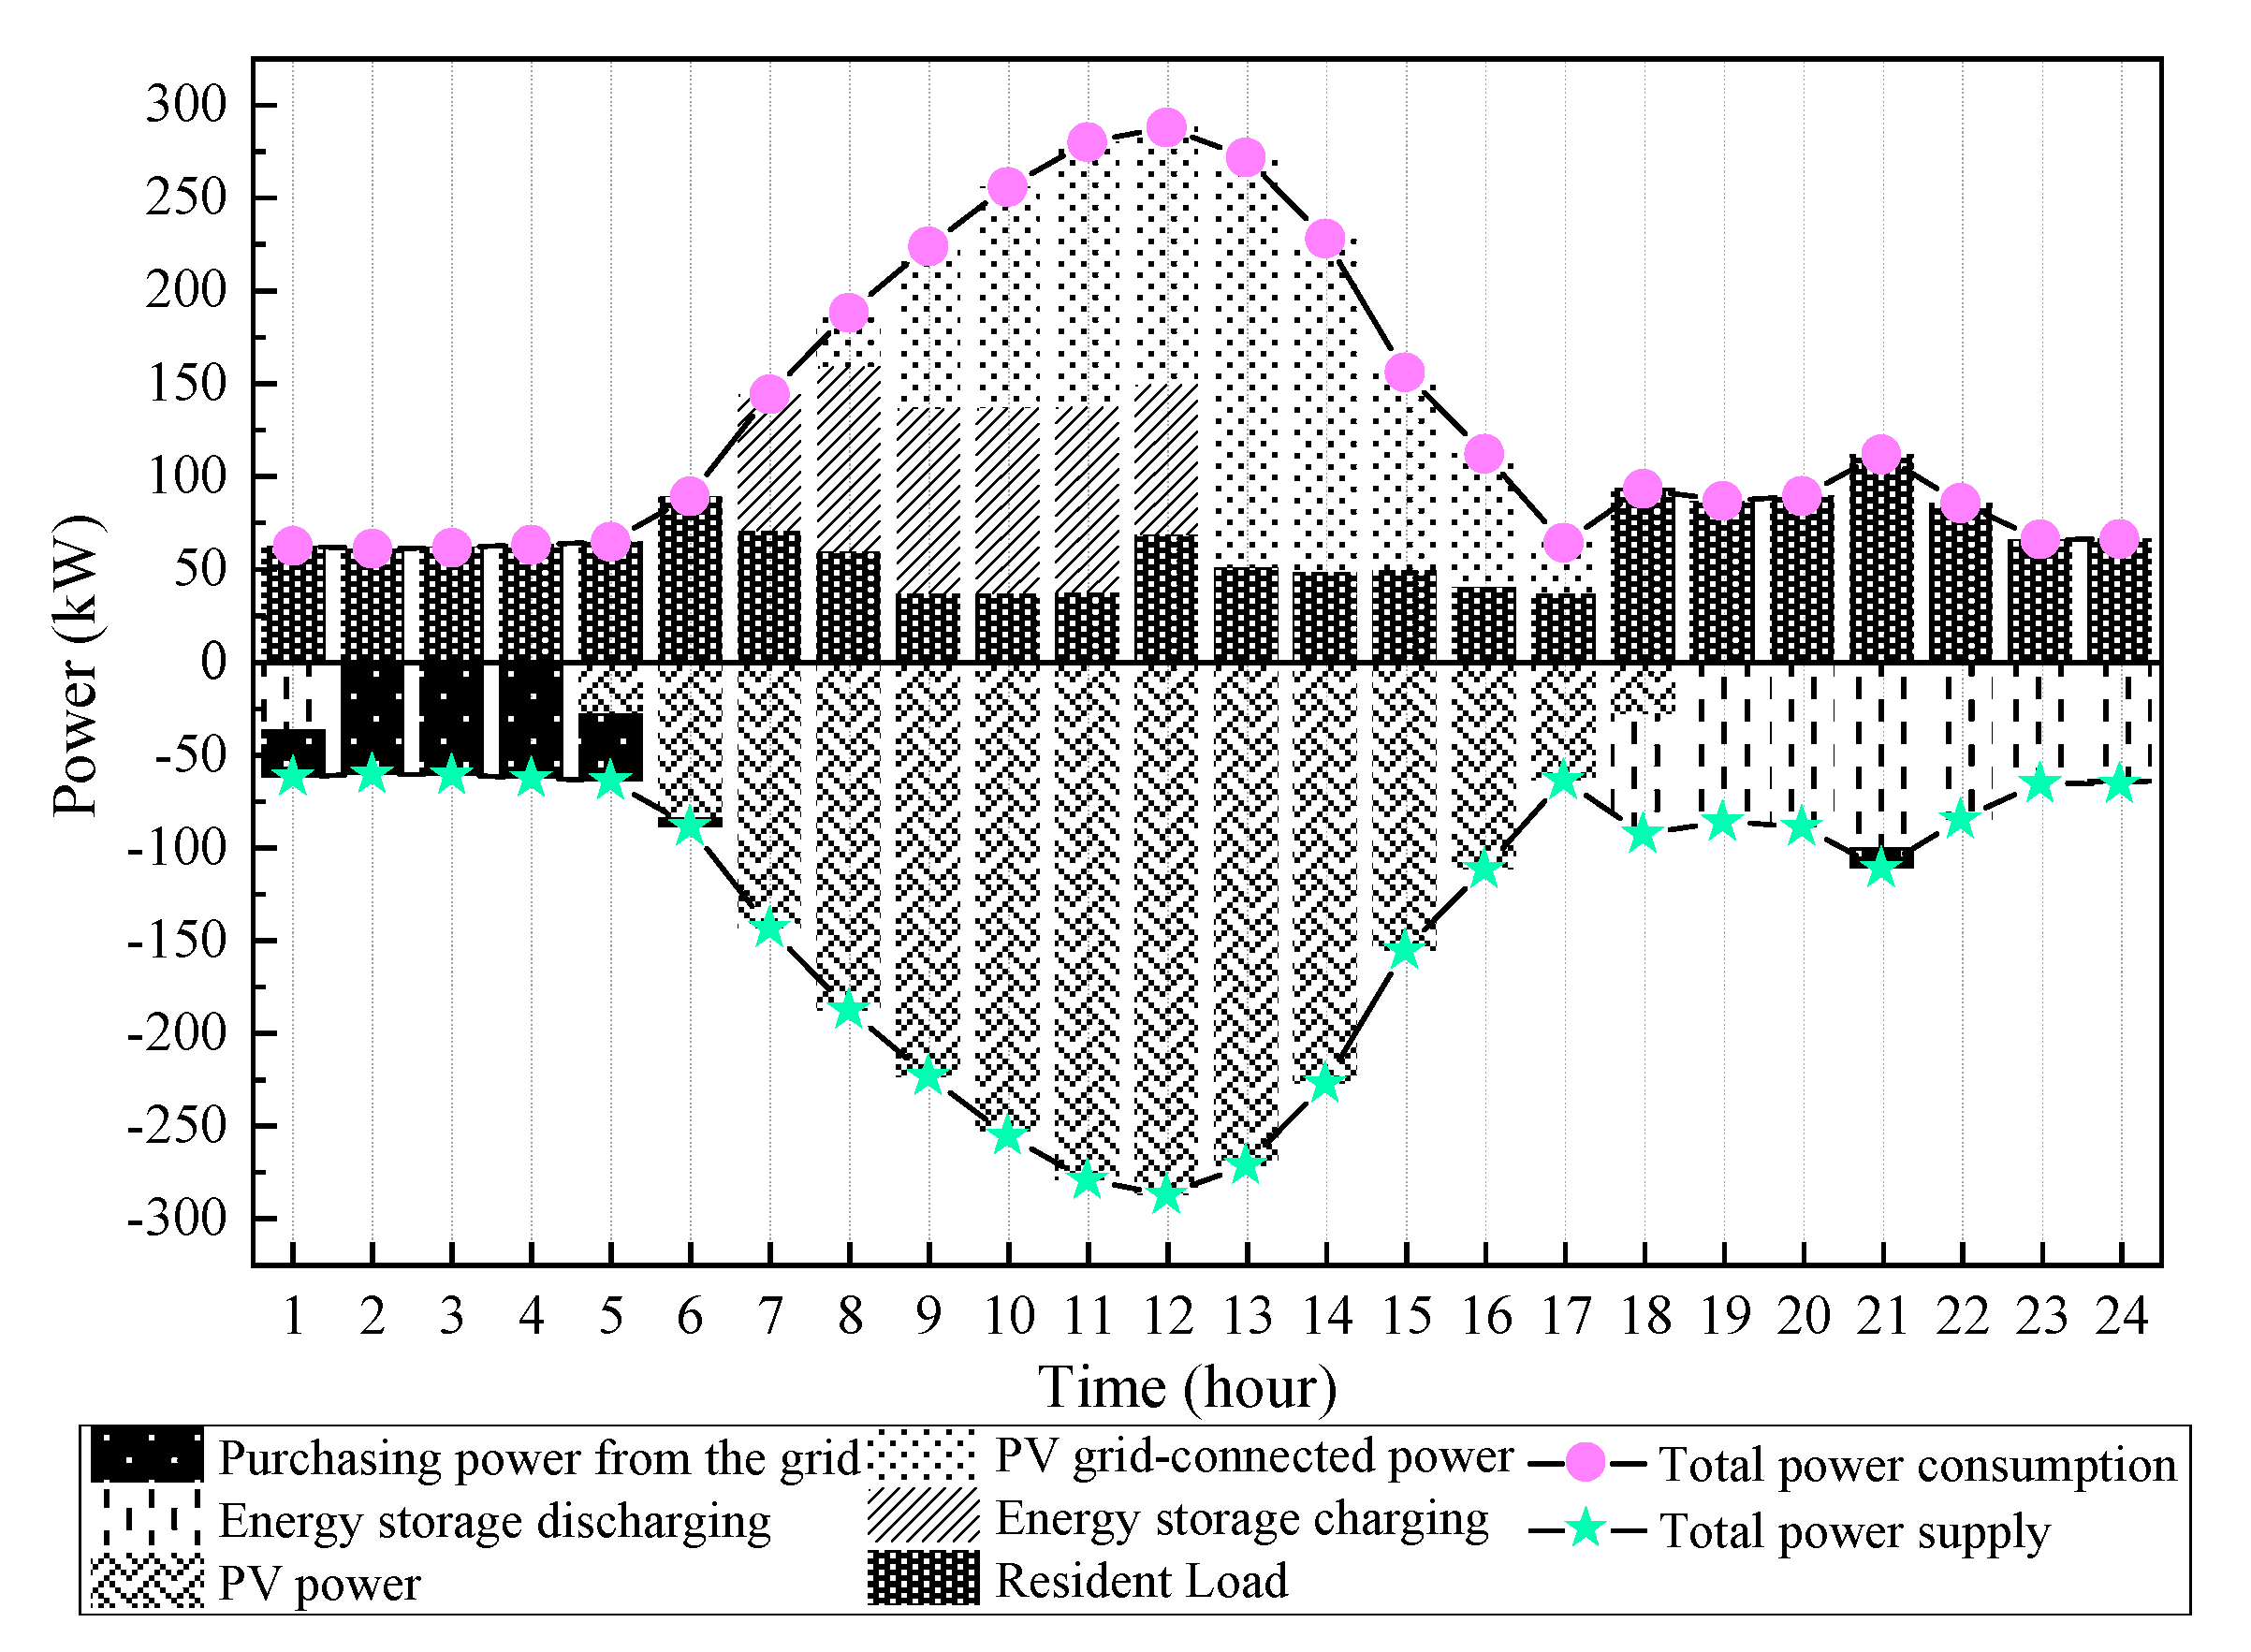
- Analysis of PV local consumption results in Scenario 2-2
- 3.
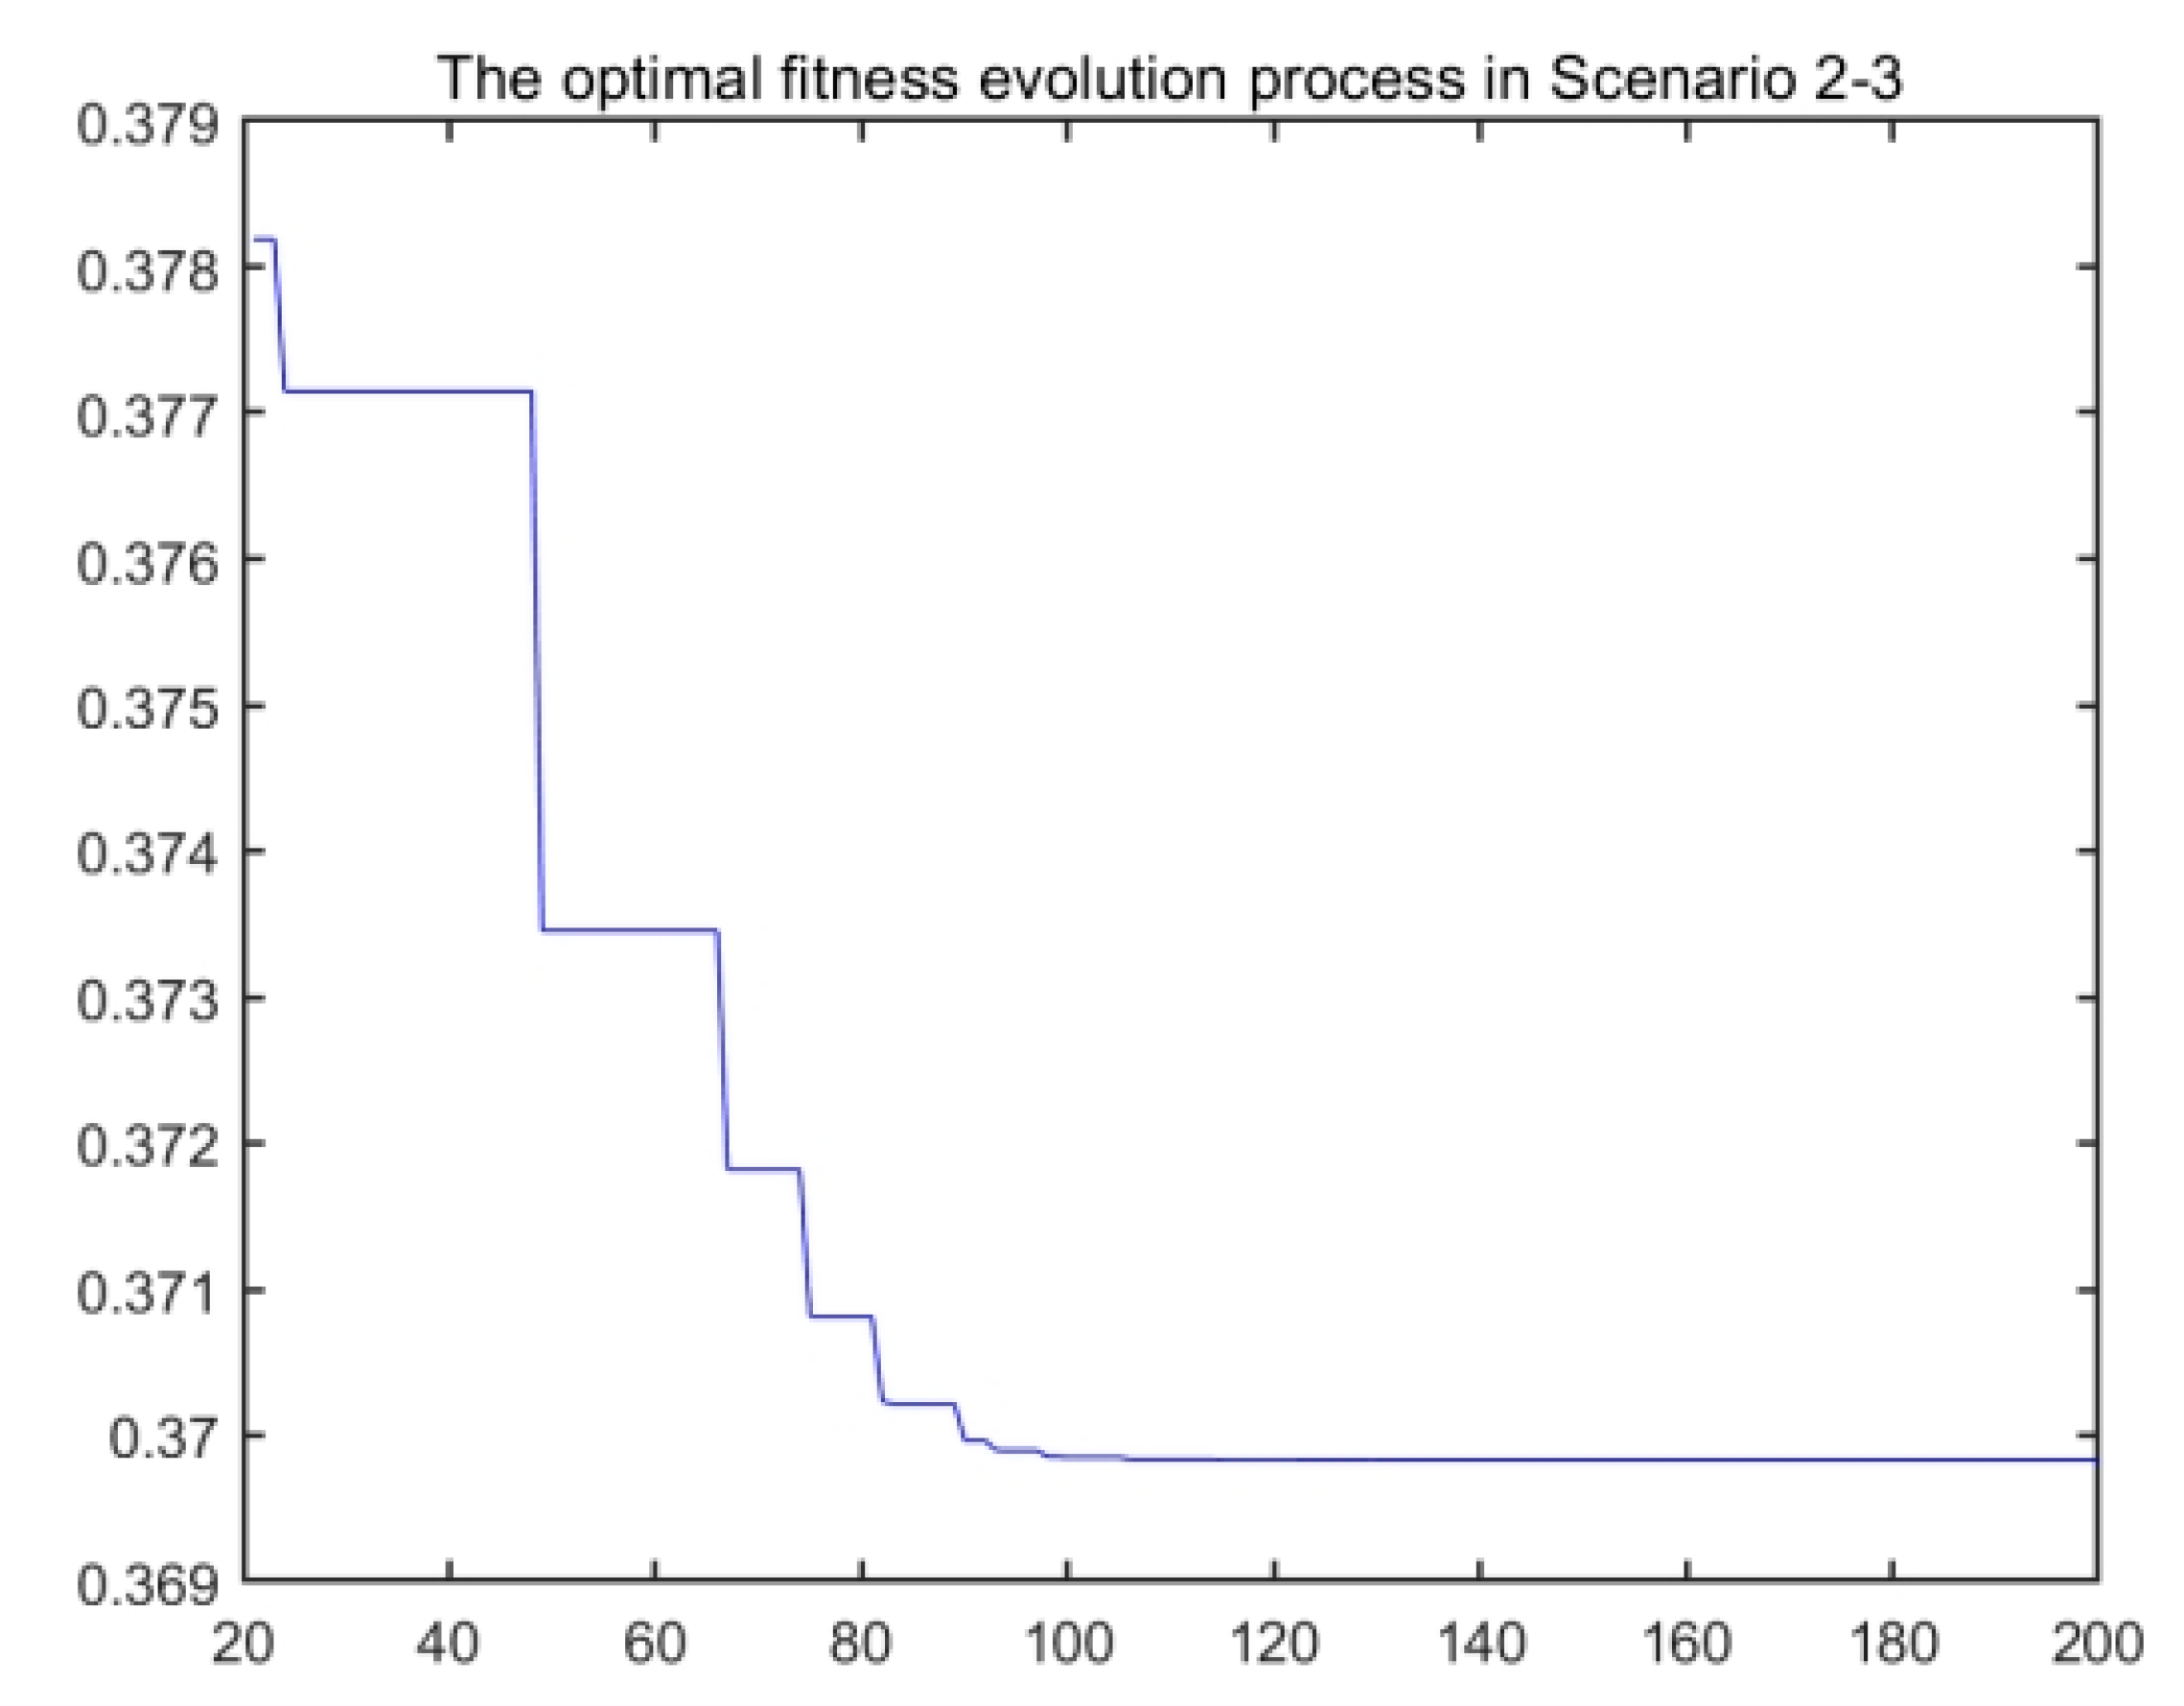
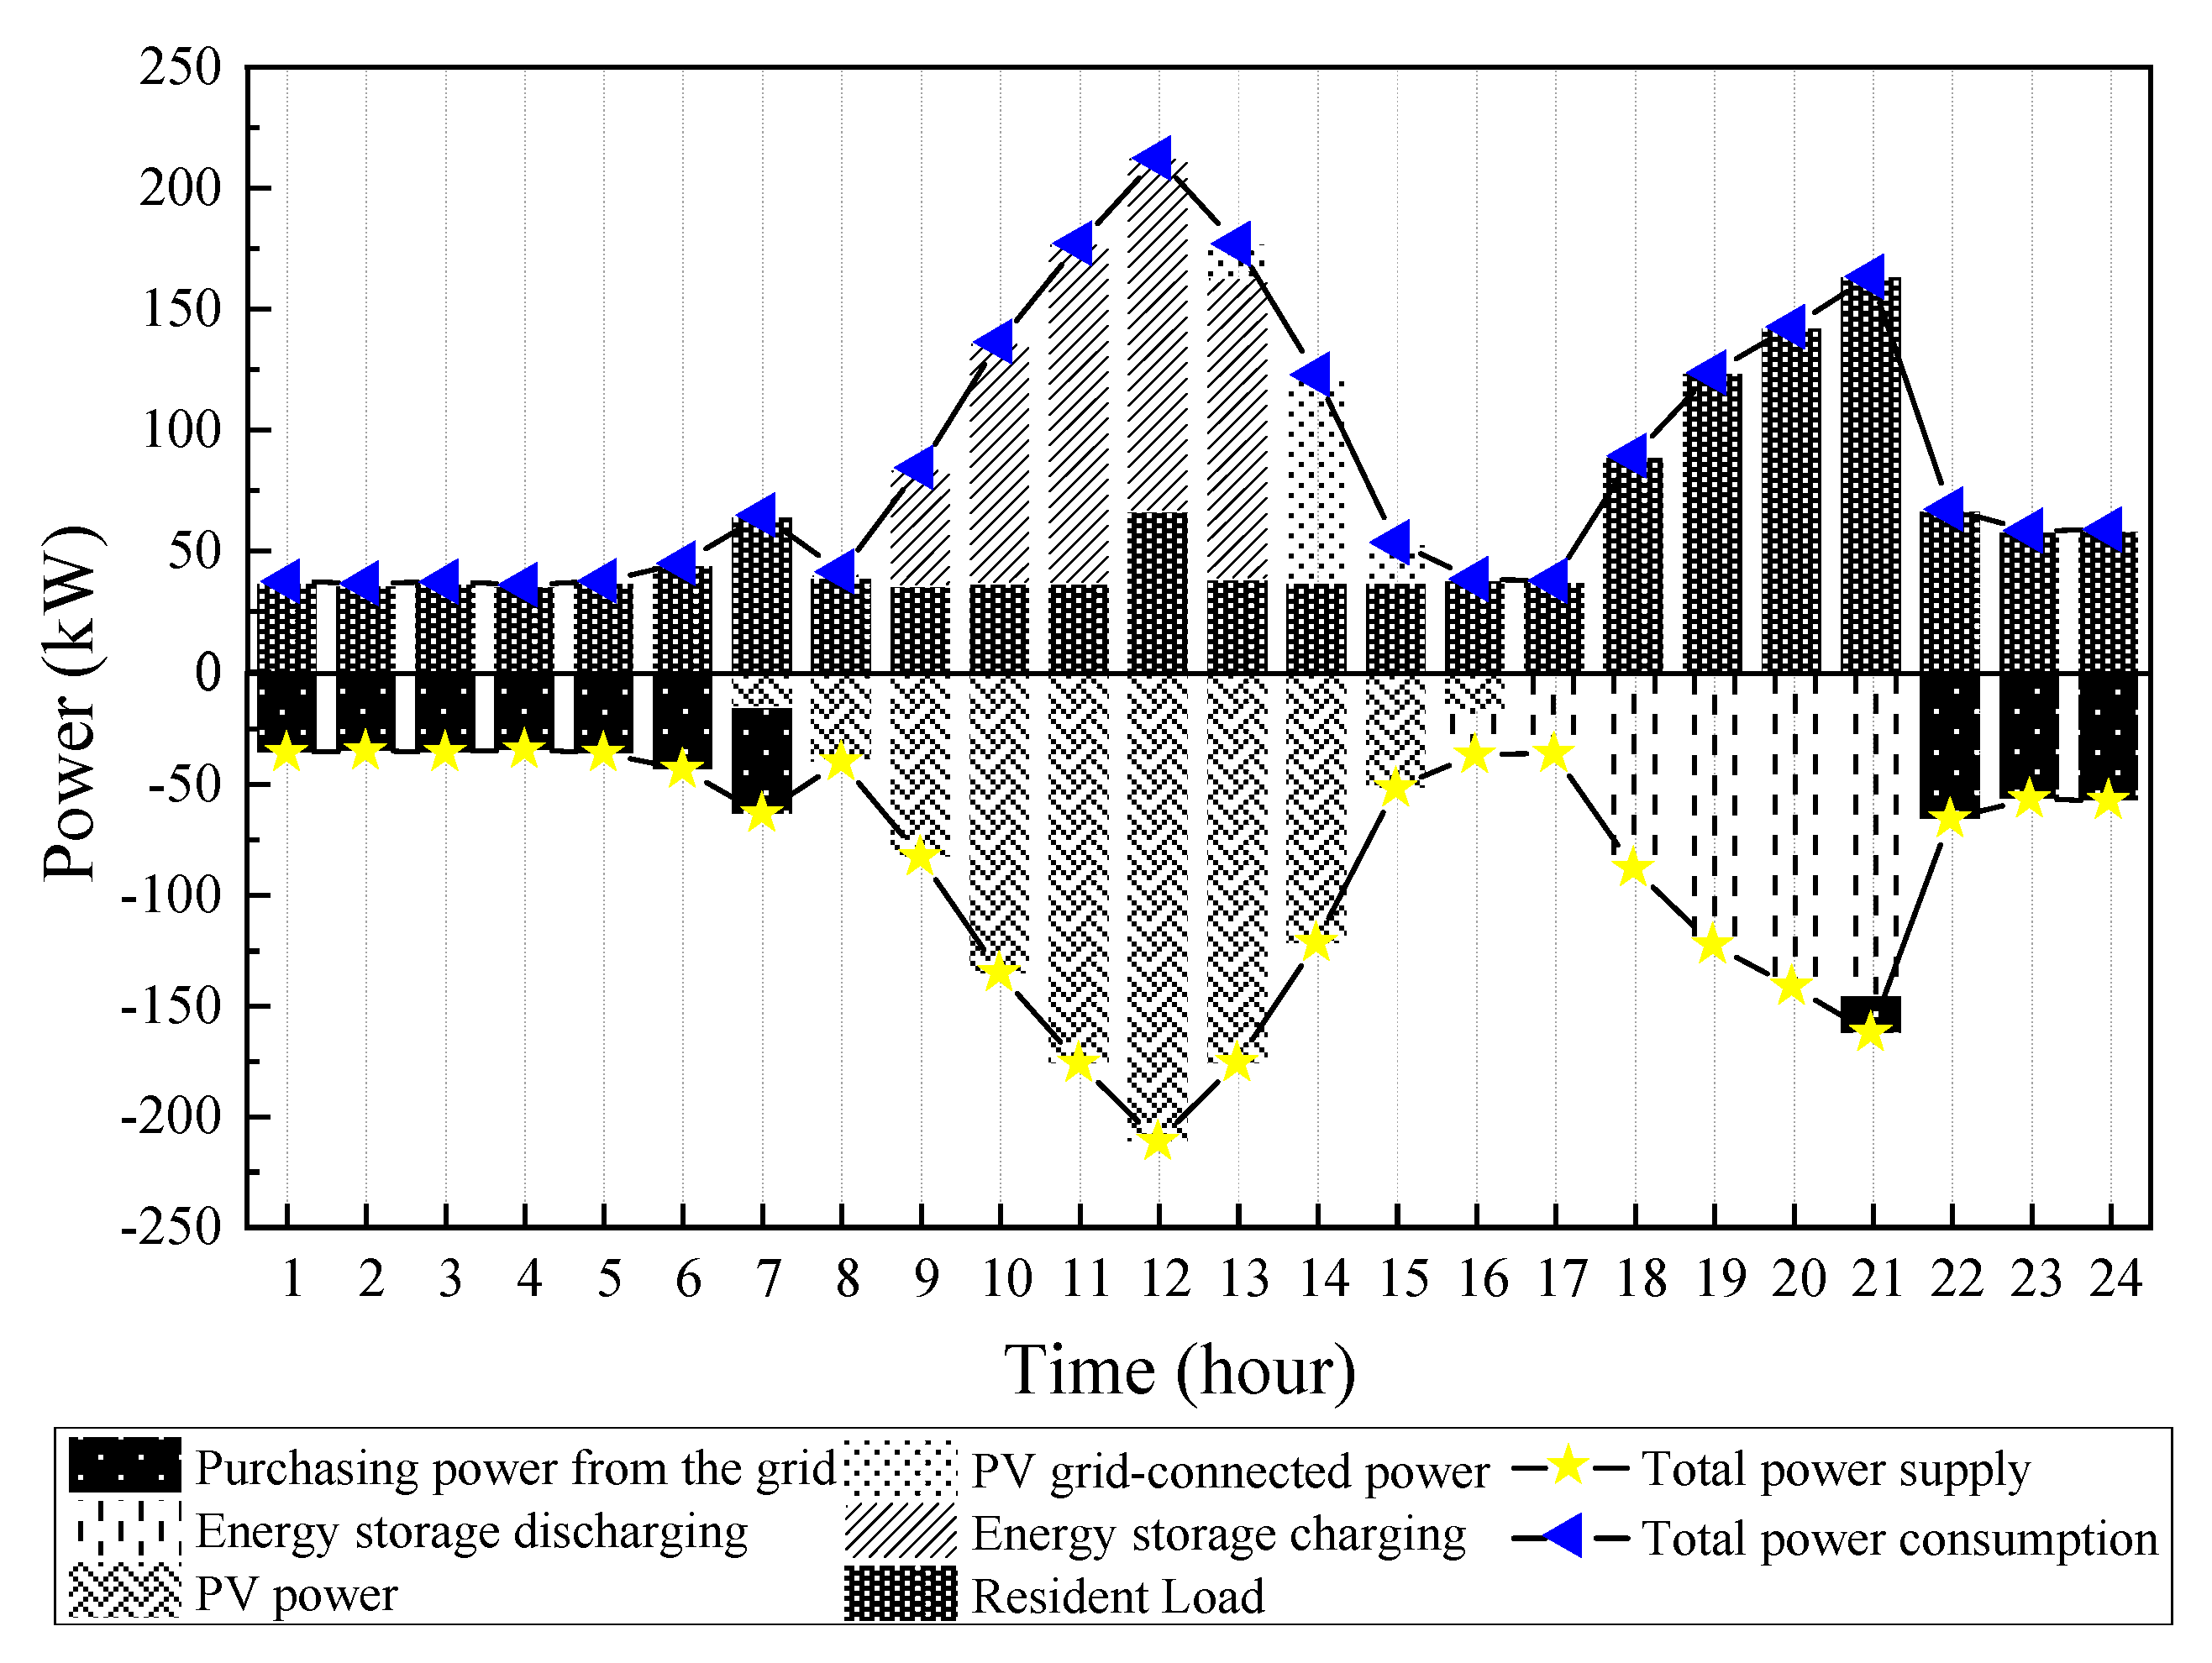
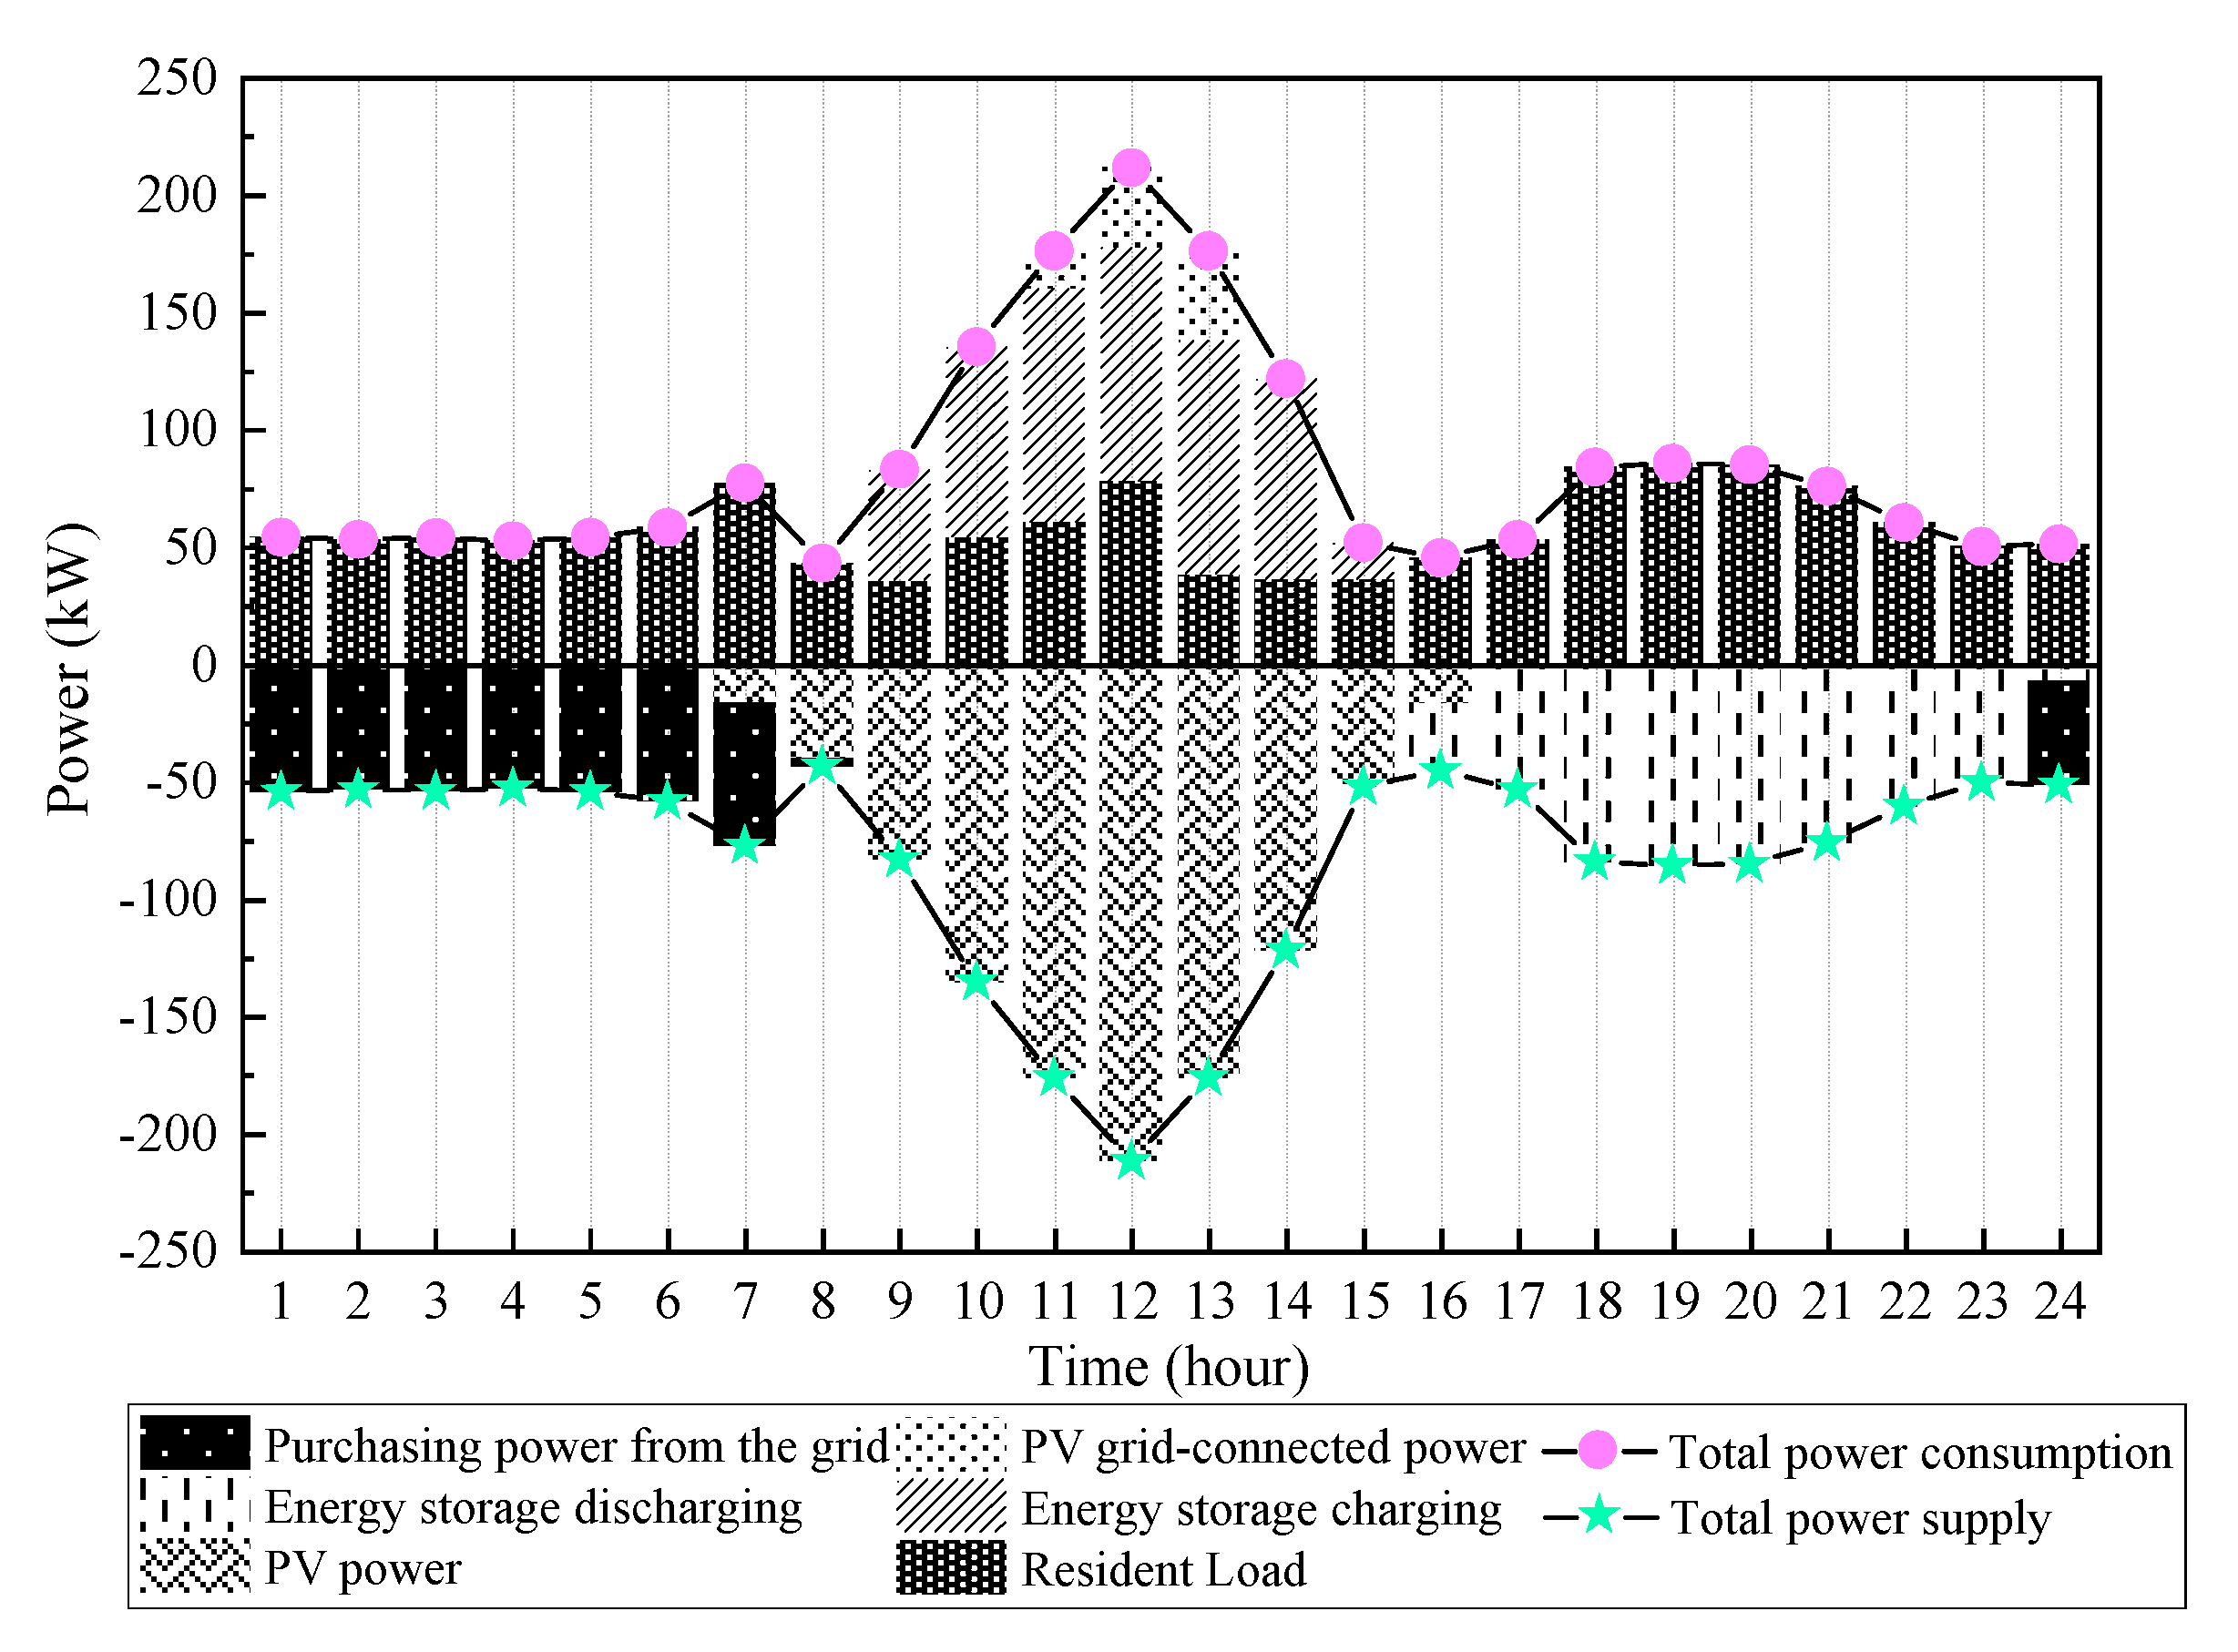
- Analysis of PV local consumption results in Scenario 2-3
4.5. Comparative Analysis of Economic Benefits
5. Conclusions
- Energy storage systems for distributed PV clusters significantly enhance the PV local consumption capacity. The energy storage system stores excess electricity during PV power generation and releases it during peak demand periods. After configuring the energy storage system, the proportion of distributed PV connected to the grid is reduced from 71.38% to 37.36%, which achieves smooth regulation of the output power of the PV and effectively alleviates the impact on grid operation when connected to the grid. Meanwhile, the proportion of PV local consumption of the distributed PV cluster with energy storage system reaches 62.64%, which is 34.02% more than the scenario without energy storage, proving that the local consumption level of PV power is greatly improved through energy storage discharge.
- Implementing a demand response mechanism for rural residents has a significant effect on reducing the configuration of energy storage systems. The calculation results show that participating in demand response can reduce the investment cost of the energy storage system by 7.15% at a PV local consumption proportion of 60%. This indicates that compared with rural residents not participating in demand response, the participation in demand response of rural residents can achieve the same PV local consumption effect while reducing the energy storage configuration, thereby reducing the initial investment of energy storage systems.
- According to calculations, the distributed PV energy storage system has a financial net present value of CNY 1,084,600. This indicates that the economic benefits of distributed PV energy storage systems throughout the entire life-cycle are appreciable, which is reflected in long-term operation. However, compared with distributed PV power generation systems without energy storage, distributed PV cluster energy storage systems still suffer from a long payback period, which will be a major challenge in promoting the application of the system.
Author Contributions
Funding
Data Availability Statement
Acknowledgments
Conflicts of Interest
Nomenclature
| Symbol | Definition |
| unit power cost for PV panel (CNY/kW) | |
| unit length cost for cable (CNY/km) | |
| construction cost for energy storage (CNY) | |
| installation cost of energy storage (CNY) | |
| unit power installation cost for distributed PV (CNY/kW) | |
| investment in equipment for energy storage (CNY) | |
| unit power cost for energy storage (CNY) | |
| rated power for energy storage (kW) | |
| operating and maintenance cost for energy storage (CNY) | |
| cost of battery and equipment replacement for energy storage during the project operation cycle (CNY) | |
| installation and dismantling cost of the i-th replacement component (CNY) | |
| number of components that need to be replaced | |
| rental price per square meter (CNY/m2) | |
| lease term (Years) | |
| management cost of coordinating the expenditure of each adjustable load user for each household (CNY) | |
| demand response compensation cost paid by independent operators to adjustable load users in the n-th year (CNY) | |
| compensation unit price for the response electricity provided by the independent operator to the adjustable load users (CNY/kWh) | |
| power generation of the distributed PV of the k-th power user on d-th day and t-th period of n-th year (kW) | |
| number of rural residents with unused roof resources | |
| charge power of energy storage on the d-th day and t-th period of n-th year (kW) | |
| subsidy period (Years) | |
| subsidy unit price for unit PV capacity (CNY/kW) | |
| discharge power of energy storage on the d-th day and t-th period of n-th year (kW) | |
| PV power sold directly by independent operators to electricity users with unused rooftop resources in the n-th year (kWh) | |
| price of selling PV electricity to electricity users with unused rooftop resources for independent operators (CNY/kWh) | |
| response electricity compensation unit price given by the power grid company to independent operators (CNY/kWh) | |
| residual value rate of fixed assets for distributed PV energy storage systems (%) | |
| actual PV output in the t-th period of s-th seasonal typical day (kW) | |
| volatility deviation of PV output in the t-th period of s-th seasonal typical day (kW) | |
| predicted volatility bias in the l-th scenario at t-th period of s-th seasonal typical day (kW) | |
| electricity transmitted from the energy storage system to the k-th user in distributed PV self-consumption mode on d-th day in t-th period of n-th year (kW) | |
| total load power of the k-th electricity user with unused roof resources on d-th day in t-th period of n-th year (kW) | |
| power level of the energy storage battery on the d-th day in t-th period of n-th year (kWh) | |
| maximum energy storage battery state of charge (%) | |
| 0,1 integer variable | |
| discharging efficiency for energy storage batteries (%) | |
| construction cost of distributed photovoltaic (PV) (CNY) | |
| equipment investment for distributed PV (CNY) | |
| total installation cost of distributed PV (CNY) | |
| cost of a single support bracket (CNY/piece) | |
| rated capacity of distributed PV (kWh) | |
| response electricity of adjustable load users in the n-th year (kWh) | |
| number of brackets | |
| operation and maintenance cost for distributed PV (CNY) | |
| unit capacity cost for energy storage (CNY/kW) | |
| maintenance rate for energy storage (%) | |
| rated capacity for energy storage (kWh) | |
| purchase cost of the i-th replacement component (CNY) | |
| perception of operation and maintenance costs for distributed PV to total investment (%) | |
| unit capacity installation cost for energy storage (CNY/kW) | |
| replacement frequency of the i-th replacement component during the project operation cycle | |
| total rental cost of distributed PV (CNY) | |
| rental area of the roof (m2) | |
| cost of demand response management for independent operators in the n-th year (CNY) | |
| length of cables connecting distributed PV and inverters, as well as inverters and the power grid (km) | |
| PV power purchased by the k-th electricity user from an independent operator on d-th day and t-th period of n-th year under self-consumption mode (kW) | |
| PV grid-connected electricity price on the d-th day and t-th period of n-th year (CNY/kWh) | |
| subsidy income for distributed PV (CNY/kWh) | |
| grid-connected revenue for distributed PV in the n-th year of project operation (CNY) | |
| subsidy income for energy storage (CNY) | |
| subsidy unit price for energy storage (CNY/kWh) | |
| electricity sales revenue for independent operator in the n-th year of project operation (CNY) | |
| PV power transmitted indirectly to electricity users with unused rooftop resources through energy storage systems in the n-th year (kWh) | |
| demand response compensation cost paid from the power grid company to independent operator in the n-th year (CNY) | |
| residual value of fixed assets for distributed PV energy storage system (CNY) | |
| predicted PV output in the t-th period of s-th seasonal typical day (kW) | |
| target for local consumption rate of distributed PV (%) | |
| expected PV output in the t-th period of s-th seasonal typical day (kW) | |
| probability of the occurrence of the l-th scenario at t-th moment of s-th seasonal typical day (%) | |
| electricity purchased by the k-th electricity user from the power grid company in the distributed PV self-consumption mode on the d-th day in t-th period of n-th year (kW) | |
| grid-connected power of distributed PV system on the d-th day in t-th period of n-th year (kW) | |
| power level for energy storage batteries on the d-th day in t − 1 period of n-th year (kWh) | |
| Minimum energy storage battery state of charge (%) | |
| charging efficiency for energy storage batteries (%) | |
| unit power cost of PV system inverter (CNY/kW) |
Appendix A

| Parameter Type | Parameter Name | Parameter Value |
|---|---|---|
| Basic parameters of PV system | Unit capacity investment (CNY/W) | 3.04 |
| Unit capacity installation cost (CNY/W) | 0.45 | |
| Grid-connected electricity price for PV (CNY/kWh) | 0.35 | |
| Service life of PV (Years) | 25 | |
| Proportion of annual operation and maintenance costs to initial investment (%) | 1 | |
| Fixed asset residual value rate (%) | 5 | |
| Initial subsidy for PV installation (CNY/W) | 0.2 | |
| Power of PV that can be installed per square meter of land (kW/m2) | 0.2 | |
| Roof rental fee for the PV system (CNY/m2) | 5 | |
| Discount on the grid sales price for rural residential users with unused roof resources (%) | 10 | |
| Basic parameters of lithium-ion battery energy storage | Life-cycle of energy storage (Years) | 10 |
| Unit capacity cost (CNY/kWh) | 800 | |
| Unit power cost (CNY/kW) | 300 | |
| Proportion of annual operation and maintenance costs to initial investment (%) | 3 | |
| Fixed asset residual value rate (%) | 5 | |
| Discharge depth of energy storage (%) | 90 | |
| Charge state of energy storage | 0.05–0.95 | |
| Charge–discharge efficiency (%) | 88 | |
| Subsidy provided for distributed PV energy storage systems from local government (CNY/kWh) | 0.3 | |
| Subsidy years (Years) | 5 | |
| Basic parameters of the demand response plan implemented by the independent operator | Annual management fee for the independent operator to implement demand response for users (CNY/Year) | 8000 |
| Demand response compensation unit price (CNY/kWh) | 0.306 | |
| Proportion of compensation income received by electricity users participating in the demand response plan (%) | 40 |
| Peak/Valley/Flat Periods | Time Frame | Electricity Price (CNY/kWh) |
|---|---|---|
| Peak periods | 9:00–12:00 18:00–22:00 | 0.846 |
| Flat periods | 7:00–8:00 13:00–17:00 | 0.534 |
| Valley periods | 00:00–6:00 23:00–24:00 | 0.312 |
References
- Lu, J.; Zhou, Q.; Qi, W.X.; Qu, S.; Bi, J. The heterogeneous effects of Chinese industrial parks on environmental pollution. Sci. Total Environ. 2023, 896, 9. [Google Scholar] [CrossRef] [PubMed]
- Dong, Y.; Zhang, Y.W.; Liu, S.J. The impacts and instruments of energy transition regulations on environmental pollution. Environ. Impact Assess. Rev. 2024, 105, 12. [Google Scholar] [CrossRef]
- Gao, Y.; Cai, Y.; Liu, C. Annual operating characteristics analysis of photovoltaic-energy storage microgrid based on retired lithium iron phosphate batteries. J. Energy Storage 2022, 45, 103769. [Google Scholar] [CrossRef]
- Xu, X.; Guan, C.; Jin, J. Valuing the carbon assets of distributed photovoltaic generation in China. Energy Policy 2018, 121, 374–382. [Google Scholar] [CrossRef]
- Construction Status of Photovoltaic Power Generation in 2023. Available online: https://www.nea.gov.cn/2024-02/28/c_1310765696.htm (accessed on 30 September 2024).
- Li, R.; Jin, X.; Yang, P.; Zheng, M.; Zheng, Y.; Cai, C.; Sun, X.; Luo, Z.; Zhao, L.; Huang, Z.; et al. Capacity optimization of a wind-photovoltaic-electrolysis-battery (WPEB) hybrid energy system for power and hydrogen generation. Int. J. Hydrogen Energy 2024, 52, 311–333. [Google Scholar] [CrossRef]
- Wang, Z.; Wang, Y.; Huang, F.; Shuai, C.; Li, J.; Ding, L.; Cheng, X. The environmental impact of household domestic energy consumption in rural areas: Empirical evidence from China’s photovoltaic poverty alleviation regions. Sustain. Prod. Consum. 2022, 30, 1019–1031. [Google Scholar] [CrossRef]
- Wang, C.; Zhang, L.; Zhang, K.; Song, S.; Liu, Y. Distributed energy storage planning considering reactive power output of energy storage and photovoltaic. Energy Rep. 2022, 8, 562–569. [Google Scholar] [CrossRef]
- Zhao, X.; Zeng, Y.; Zhao, D. Distributed solar photovoltaics in China: Policies and economic performance. Energy 2015, 88, 572–583. [Google Scholar] [CrossRef]
- Yu, S.; Han, R.; Zhang, J. Reassessment of the potential for centralized and distributed photovoltaic power generation in China: On a prefecture-level city scale. Energy 2023, 262, 125436. [Google Scholar] [CrossRef]
- Sun, T.; Shan, M.; Rong, X.; Yang, X. Estimating the spatial distribution of solar photovoltaic power generation potential on different types of rural rooftops using a deep learning network applied to satellite images. Appl. Energy 2022, 315, 119025. [Google Scholar] [CrossRef]
- Mulleriyawage, U.G.K.; Wang, P.; Rui, T.; Zhang, K.; Hu, C.; Shen, W.X. Prosumer-centric demand side management for minimizing electricity bills in a DC residential PV-battery system: An Australian household case study. Renew. Energy 2023, 205, 800–812. [Google Scholar] [CrossRef]
- Rehman, O.U.; Khan, S.A.; Javaid, N. Impact of photovoltaic self-consumption curtailment on building-to-grid operations. Int. J. Electr. Power Energy Syst. 2021, 124, 106374. [Google Scholar] [CrossRef]
- Fachrizal, R.; Munkhammar, J. Improved Photovoltaic Self-Consumption in Residential Buildings with Distributed and Centralized Smart Charging of Electric Vehicles. Energies 2020, 13, 1153. [Google Scholar] [CrossRef]
- Zhang, G.; Ren, H.; Ma, Z.; Wang, X.; Chen, J. County-wide distributed photovoltaic energy storage configuration method to improve the carrying capacity and regulation capacity of distribution network. Electr. Eng. 2022, 23, 49–57. [Google Scholar] [CrossRef]
- Wang, W.; Kang, K.; Sun, G.; Xiao, L. Configuration optimization of energy storage and economic improvement for household photovoltaic system considering multiple scenarios. J. Energy Storage 2023, 67, 107631. [Google Scholar] [CrossRef]
- Li, L.; Cao, X.; Zhang, S. Shared energy storage system for prosumers in a community: Investment decision, economic operation, and benefits allocation under a cost-effective way. J. Energy Storage 2022, 50, 104710. [Google Scholar] [CrossRef]
- Li, J.; Zhu, Y.; Xiao, Y.; Lan, X. Optimized configuration and operation model and economic analysis of shared energy storage based on master-slave game considering load characteristics of PV communities. J. Energy Storage 2024, 76, 109841. [Google Scholar] [CrossRef]
- Li, J.; Xiao, Y.; Lu, S. Optimal configuration of multi microgrid electric hydrogen hybrid energy storage capacity based on distributed robustness. J. Energy Storage 2024, 76, 109762. [Google Scholar] [CrossRef]
- Jiang, Y.; Kang, L.; Liu, Y. Multi-objective design optimization of a multi-type battery energy storage in photovoltaic systems. J. Energy Storage 2021, 39, 102604. [Google Scholar] [CrossRef]
- Nan, B.; Dong, S.; Tang, K.; Zhu, M.; Zhang, X.; Chen, W. Optimal Configuration of Energy Storage in PV-storage Microgrid Considering Demand Response and Uncertainties in Source and Load. Power Syst. Technol. 2023, 47, 1340–1352. [Google Scholar] [CrossRef]
- Chen, J.; Mo, R.; Dang, H.; Li, S.; Zhou, G. Battery Capacity Optimal Configuration and Economical Analysis of Energy Storage Photovoltaic System. Sci. Technol. Eng. 2019, 19, 165–171. [Google Scholar] [CrossRef]
- Zhang, J.; Ouyang, S.; Wu, H.; Xin, X.; Huang, Y. Optimal configuration of grid-side energy storage considering reliability and operation economy of distribution network. Electr. Autom. Equip. 2024, 44, 62–68. [Google Scholar] [CrossRef]
- Li, J.; Liu, Z.; Bai, Y.; Zhang, X.; Li, P.; Song, Z. Optimized configuration of electro-thermal hybrid energy storage capacity based on wind power scenario probabilistic. Electr. Power Eng. Technol. 2024, 43, 172–182. [Google Scholar] [CrossRef]
- Yuan, W.; Wang, C.; Li, Q.; Shi, Z. Multi-area Two-stage Optimal Allocation Method of Large-scale Energy Storage for Renewable Energy Consumption. J. Glob. Energy Interconnect. 2021, 4, 393–400. [Google Scholar] [CrossRef]
- Li, X.; Wang, H. Integrated energy system model with multi-time scale optimal dispatch method based on a demand response mechanism. J. Clean. Prod. 2024, 445, 141321. [Google Scholar] [CrossRef]
- Li, J.; Fang, Z.; Tan, Y.; Qi, Z.; Chen, M.; Ma, S. Application Prospect Analysis of Electrochemical Energy Storage Technology in County-widerooftop Photovoltaic System. J. Sol. Energy 2022, 43, 1–12. [Google Scholar] [CrossRef]
- Wei, C.; Wang, J.; Zhou, Y.; Li, Y.; Liu, W. Co-optimization of system configurations and energy scheduling of multiple community integrated energy systems to improve photovoltaic self-consumption. Renew. Energy 2024, 225, 120230. [Google Scholar] [CrossRef]
- Zhao, S.; Chen, J. Benefit Analysis of Photovoltaic + Energy Storage InvestmentBased on life cvcle Cost. Electr. Eng. 2022, 42–45. [Google Scholar] [CrossRef]
- Abdalla, M.A.A.; Min, W.; Bing, W.; Ishag, A.M.; Saleh, B. Double-layer home energy management strategy for increasing PV self-consumption and cost reduction through appliances scheduling, EV, and storage. Energy Rep. 2023, 10, 3494–3518. [Google Scholar] [CrossRef]
- Yang, Y.; Liu, T.; Jin, P.; Qi, C. A Method to Calculate the Peak Load Balancing Cost of PowerSystem for Mass Access of Renewable Energy. Electr. Drive 2024, 1–11. [Google Scholar] [CrossRef]
- Chen, X.; Liu, Z.; Wang, P.; Li, B.; Liu, R.; Zhang, L.; Zhao, C.; Luo, S. Multi-objective optimization of battery capacity of grid-connected PV-BESS system in hybrid building energy sharing community considering time-of-use tariff. Appl. Energy 2023, 350, 121727. [Google Scholar] [CrossRef]
- Ouyang, D.; Weng, J.; Chen, M.; Wang, J.; Wang, Z. Sensitivities of lithium-ion batteries with different capacities to overcharge/over-discharge. J. Energy Storage 2022, 52, 104997. [Google Scholar] [CrossRef]
- Zhang, H.; Li, G.; Wang, S. Optimization dispatching of isolated island microgrid based on improved particle swarm optimization algorithm. Energy Rep. 2022, 8, 420–428. [Google Scholar] [CrossRef]
- Wang, W.; Dong, Z. Economic benefits assessment of urban wind power central heating demonstration project considering the quantification of environmental benefits: A case from northern China. Energy 2021, 225, 120246. [Google Scholar] [CrossRef]
- Wang, H.; Zhao, X.; Zhang, K.; Wang, W. Economic assessment of a renewable energy-electricity-hydrogen system considering environmental benefits. Sustain. Prod. Consum. 2022, 33, 903–920. [Google Scholar] [CrossRef]
- GB/T 50239-2014; Urban Electricity Planning Specification. China Construction Industry Press: Beijing, China, 2014.
- GB/T 36558-2018; General Technical Requirements for Electrochemical Energy Storage System in Power System. National Power Energy Storage Standardization Technical Committee (SAC/TC 550): Beijing, China, 2022.


| Scenario | PV Power Generation First Generates and Consumes Power on Its Own, with Surplus Power Connected to the Grid | Configure Energy Storage | Rural Residents Participate in Demand Response |
|---|---|---|---|
| Scenario 2-1 | ✓ | / | / |
| Scenario 2-2 | ✓ | ✓ | / |
| Scenario 2-3 | ✓ | ✓ | ✓ |
| Classification of Power Consumption Levels for Rural Residents’ Daily Lives | Monthly Average Household Power Consumption (kWh) |
|---|---|
| Classification I (High level) | Above 500 |
| Classification II (Middle to high level) | 350~500 |
| Classification III (Middle level) | 200~350 |
| Classification IV (Low level) | Below 200 |
| Output Scenarios | 1 | 2 | 3 | 4 | 5 |
|---|---|---|---|---|---|
| Occurrence probability | 0.1875 | 0.2186 | 0.1793 | 0.2113 | 0.2021 |
| Optimized Indicators | Capacity (kWh) | Power (kW) | Maximum Annual Net Profit (CNY) | Proportion of PV Local Consumption (%) |
|---|---|---|---|---|
| Optimization results | 620 | 163 | 64,697 | 62.64 |
| Optimized Indicators | Capacity (kWh) | Power (kW) | Maximum Annual Net Profit (CNY) | Proportion of PV Local Consumption (%) |
|---|---|---|---|---|
| Optimization results | 591 | 113 | 59430 | 64.11 |
| Indicator | Spring and Autumn | Summer | Winter | Annual |
|---|---|---|---|---|
| Total power generation of distributed PV cluster (kWh) | 289,213 | 216,384 | 92,671 | 598,268 |
| Proportion of PV local consumption (%) | 27.37 | 27.74 | 34.59 | 28.62 |
| Proportion of PV power directly consumed by users with unused rooftop resources (%) | 27.37 | 27.74 | 34.59 | 28.62 |
| Proportion of PV power absorbed by energy storage system (%) | / | / | / | / |
| Proportion of PV grid connection (%) | 72.63 | 72.26 | 65.41 | 71.38 |
| User load of unused roof resources (kWh) | 222,277 | 140,603 | 123,974 | 486,854 |
| Proportion of load demand directly met by electricity generated by PV (%) | 35.62 | 42.69 | 25.86 | 35.17 |
| Proportion of load demand indirectly met by energy storage discharge (%) | / | / | / | / |
| Proportion of load demand met by grid electricity (%) | 64.38 | 57.31 | 74.14 | 64.83 |
| Indicator | Spring and Autumn | Summer | Winter | Annual |
|---|---|---|---|---|
| Total power generation of distributed PV cluster (kWh) | 289,213 | 216,384 | 92,671 | 598,268 |
| Proportion of PV local consumption (%) | 62.66 | 51.45 | 88.75 | 62.64 |
| Proportion of PV power directly consumed by users with unused rooftop resources (%) | 27.37 | 27.74 | 34.59 | 28.62 |
| Proportion of PV power absorbed by energy storage system (%) | 35.29 | 23.71 | 54.16 | 34.02 |
| Proportion of PV grid connection (%) | 37.34 | 48.55 | 11.25 | 37.36 |
| Proportion of PV electricity traded between surrounding users and PV power generators (%) | / | / | / | / |
| User load of unused roof resources (kWh) | 222,277 | 140,603 | 123,974 | 486,854 |
| Proportion of load demand directly met by electricity generated by PV (%) | 35.62 | 42.69 | 25.86 | 35.17 |
| Proportion of load demand indirectly met by energy storage discharge (%) | 45.91 | 36.49 | 40.48 | 41.82 |
| Proportion of load demand met by grid electricity (%) | 18.47 | 20.82 | 33.66 | 23.01 |
| Indicator | Spring and Autumn | Summer | Winter | Annual |
|---|---|---|---|---|
| Total power generation of distributed PV cluster (kWh) | 289,213 | 216,384 | 92,671 | 598,268 |
| Proportion of PV local consumption (%) | 64.33 | 52.1 | 91.46 | 64.11 |
| Proportion of PV power directly consumed by users with unused rooftop resources (%) | 29.19 | 28.49 | 39.84 | 30.59 |
| Proportion of PV power absorbed by energy storage system (%) | 35.14 | 23.61 | 51.62 | 33.52 |
| Proportion of PV grid connection (%) | 35.67 | 47.9 | 8.54 | 35.89 |
| Proportion of PV electricity traded between surrounding users and PV power generators (%) | / | / | / | / |
| User load of unused roof resources (kWh) | 222,277 | 140,603 | 123,974 | 486,854 |
| Proportion of load demand directly met by electricity generated by PV (%) | 37.98 | 43.84 | 29.78 | 37.59 |
| Proportion of load demand indirectly met by energy storage discharge (%) | 48.59 | 38.73 | 38.59 | 43.19 |
| Proportion of load demand met by grid electricity (%) | 13.43 | 17.43 | 31.63 | 19.22 |
| Indicator | Indicator List | Numerical Value |
|---|---|---|
| Income indicators | PV grid-connected revenue (CNY/Year) | 209,394 |
| Subsidy income (CNY) | 80,000 | |
| Residual value of fixed assets (CNY) | 69,800 | |
| Cost indicators | Initial investment of distributed PV cluster (CNY) | 1396,000 |
| Operation and maintenance costs (CNY/Year) | 13,960 | |
| Rental cost (CNY/Year) | 10,000 | |
| Revenue indicators | Equivalent annual return (CNY/Year) | 69,946 |
| Economic benefit indicators | Financial net present value (CNY) | 943,900 |
| Internal rate of return (%) | 15.96 | |
| Dynamic investment payback period (Years) | 9.23 |
| Indicator | Indicator List | Scenario 2-1 | Scenario 2-2 | Scenario 2-3 |
|---|---|---|---|---|
| Income indicators | PV grid-connected revenue (CNY/Year) | 149,460 | 78,212 | 75,146 |
| Subsidy income (CNY) | 80,000 | 385,664 | 381,295 | |
| Electricity sales revenue (CNY/Year) | 99,199 | 246,429 | 229,436 | |
| Compensation income for demand response (CNY/Year) | / | / | 13,077 | |
| Residual value of fixed assets (CNY) | 69,800 | 138,006 | 133,129 | |
| Cost indicators | Initial investment of distributed PV cluster (CNY) | 1,396,000 | 1,396,000 | 1,396,000 |
| One-time investment in the energy storage system (CNY) | / | 1,364,111 | 1,266,582 | |
| Operation and maintenance costs (CNY/Year) | 13,960 | 30,329 | 29,159 | |
| Rental cost (CNY/Year) | 10,000 | 10,000 | 10,000 | |
| Demand response management fee (CNY/Year) | / | / | 8,000 | |
| Revenue indicators | Equivalent annual return (CNY/Year) | 109,210 | 65,097 | 59,378 |
| Economic benefit indicators | Financial net present value (CNY) | 1,401,500 | 1,084,600 | 1,010,300 |
| Internal rate of return (%) | 20.36 | 12.48 | 12.31 | |
| Dynamic investment payback period (Years) | 7.14 | 11.97 | 12.16 |
Disclaimer/Publisher’s Note: The statements, opinions and data contained in all publications are solely those of the individual author(s) and contributor(s) and not of MDPI and/or the editor(s). MDPI and/or the editor(s) disclaim responsibility for any injury to people or property resulting from any ideas, methods, instructions or products referred to in the content. |
© 2024 by the authors. Licensee MDPI, Basel, Switzerland. This article is an open access article distributed under the terms and conditions of the Creative Commons Attribution (CC BY) license (https://creativecommons.org/licenses/by/4.0/).
Share and Cite
Liu, Y.; Liu, D.; Kang, K.; Wang, G.; Rong, Y.; Wang, W.; Liu, S. Research on Two-Stage Energy Storage Optimization Configurations of Rural Distributed Photovoltaic Clusters Considering the Local Consumption of New Energy. Energies 2024, 17, 6272. https://doi.org/10.3390/en17246272
Liu Y, Liu D, Kang K, Wang G, Rong Y, Wang W, Liu S. Research on Two-Stage Energy Storage Optimization Configurations of Rural Distributed Photovoltaic Clusters Considering the Local Consumption of New Energy. Energies. 2024; 17(24):6272. https://doi.org/10.3390/en17246272
Chicago/Turabian StyleLiu, Yang, Dawei Liu, Keyi Kang, Guanqing Wang, Yanzhao Rong, Weijun Wang, and Siyu Liu. 2024. "Research on Two-Stage Energy Storage Optimization Configurations of Rural Distributed Photovoltaic Clusters Considering the Local Consumption of New Energy" Energies 17, no. 24: 6272. https://doi.org/10.3390/en17246272
APA StyleLiu, Y., Liu, D., Kang, K., Wang, G., Rong, Y., Wang, W., & Liu, S. (2024). Research on Two-Stage Energy Storage Optimization Configurations of Rural Distributed Photovoltaic Clusters Considering the Local Consumption of New Energy. Energies, 17(24), 6272. https://doi.org/10.3390/en17246272