Article

Research on Transient Characteristics of an Aviation Starter Motor Under Low Temperature and Pressure

1
Key Laboratory of Fluid and Power Machinery, Ministry of Education, Xihua University, Chengdu 610039, China
2
Key Laboratory of Fluid Machinery and Engineering, Sichuan Province, Xihua University, Chengdu 610039, China
3
Engineering Research Center of Intelligent Space Ground Integration Vehicle and Control, Ministry of Education, Xihua University, Chengdu 610039, China
4
School of Energy and Power Engineering, Xihua University, Chengdu 610039, China
5
School of Automobile and Transportation, Xihua University, Chengdu 610039, China
*
Author to whom correspondence should be addressed.
Energies 2024, 17(24), 6258; https://doi.org/10.3390/en17246258
Submission received: 27 November 2024 / Revised: 9 December 2024 / Accepted: 10 December 2024 / Published: 11 December 2024
(This article belongs to the Section I: Energy Fundamentals and Conversion)

Abstract

:
To enhance the performance of aviation piston engine starters in high-altitude environments, this study investigated their transient starting characteristics under low-temperature and low-pressure conditions using a high-altitude simulation chamber. Experiments were conducted across ambient temperatures from −60 to 15 °C and pressures from 35 to 95 kPa. The results show that the ambient temperature significantly impacts the transient characteristics of the motor, particularly at the initiation stage, whereas pressure has a weaker effect. For every 5 °C drop in temperature, the peak starting current increases by 1.95 A. From 15 to −60 °C, the maximum difference in the starting current pulse width is 11.64 ms. Furthermore, as the ambient temperature decreases, the average current after the motor stabilizes increases, and the average speed decreases.

1. Introduction

Application scenarios for unmanned aerial vehicles (UAVs) are becoming increasingly diverse [1]. For example, UAVs have been employed for reconnaissance, deception, interference, electronic countermeasures, and direct combat engagements for military purposes [2,3]. Piston engines have emerged as a significant power source for UAVs in modern military operations, owing to their numerous benefits [4,5]. The permanent magnet brushless direct current (DC) motor has become the preferred starter motor for aviation piston engines because of its compact size, high power output, stable torque, and low noise level [6]. In some special application scenarios, such as high-altitude air-dropped UAVs and restarts, piston engines must be started at high altitudes [7,8]. Low-temperature and low-pressure environments significantly affect DC motor performance [9,10,11,12,13]. In addition, piston engines face challenges when starting at high altitudes [14]. Milojevi, S. et al. [15] indicated that engines require the use of variable systems, which can facilitate cold starts depending on the ambient temperature, the type and temperature of the fuel, etc. Hence, substantial adjustments had to be made to the compatibility requirements between the piston engine and starter motor under the aforementioned conditions.
Mo et al. [16] noted that low temperatures reduce the fit clearance between the engine crankshaft and bearing as well as that between the piston and cylinder, which leads to an increase in the frictional resistance torque of the engine. Kang et al. [17] confirmed that as the ambient temperature decreased, the viscosity of the lubricating oil increased, leading to significant friction losses. Skulić A et al. [18] pointed out that the increase in oil viscosity in low-temperature environments leads to the increase in engine transmission loss. Baranski, M et al. [19] studied the influence of temperature on the magnetic properties of the permanent magnets as well as on the electric and thermal properties of the materials. Agudelo et al. [20] studied the combustion characteristics of piston engines at different altitudes and found that the intake airflow of piston engines decreases with a reduction in atmospheric pressure, leading to an insufficient final pressure in the engine cylinder and a decrease in the performance of the starting process. The aforementioned research indicates that both the starting resistance torque and starting speed of a piston engine increase in high-altitude environments. Wang et al. [21] noted that sharp changes in the motor’s working environment temperature can cause rapid deformation of the motor material and result in a “breathing effect”. This will accelerate the aging and deformation of the material. Chen et al. [22] demonstrated that the impact of temperature on the initial permeability of a motor’s stator core is almost linear in low-temperature environments; specifically, the permeability decreases as the temperature decreases. The research conducted by Guobao Xu [23] indicates that the insulation material of motor windings is particularly susceptible to accelerated aging at ambient temperatures ranging from 20 °C to 40 °C. Hu et al. [24] investigated the starting parameters of single-phase capacitor start motors and three-phase induction motors at low temperatures. Their findings indicated that the starting voltage and current of the motors both increased as the ambient temperature decreased. Liu et al. [25] investigated the resistance torque of micro permanent magnet DC motors used in vehicles under low-temperature conditions. They concluded that the increases in the starting voltages and starting currents of these motors in such environments were attributable to increases in the bearing resistance and cogging torque. The literature [26,27,28,29,30] primarily investigates the impact of ambient temperature on various motor characteristics, including the efficiency, electromagnetic torque, overload performance, output power, cogging torque, maximum demagnetization points of permanent magnets, torque fluctuations, and motor service life. Hence, a low-temperature environment significantly affects motor performance, which leads to notable changes in the starting characteristics of the motor.
To improve the high-altitude starting performance of aviation piston UAVs, it is necessary to study the impact of low-temperature and low-pressure environments on the aviation starting motor performance. In contrast to data simulation technology [31], this study replicated and analyzed the starting processes of aviation starting motors under low-temperature and low-pressure conditions using a high-altitude environmental simulation chamber. The aim of this study is to investigate the starting transient characteristics of aviation starting motors in such environments, which can provide rules for matching aviation piston engines and starting motors [32,33,34].

2. Experimental Setup and Methodology

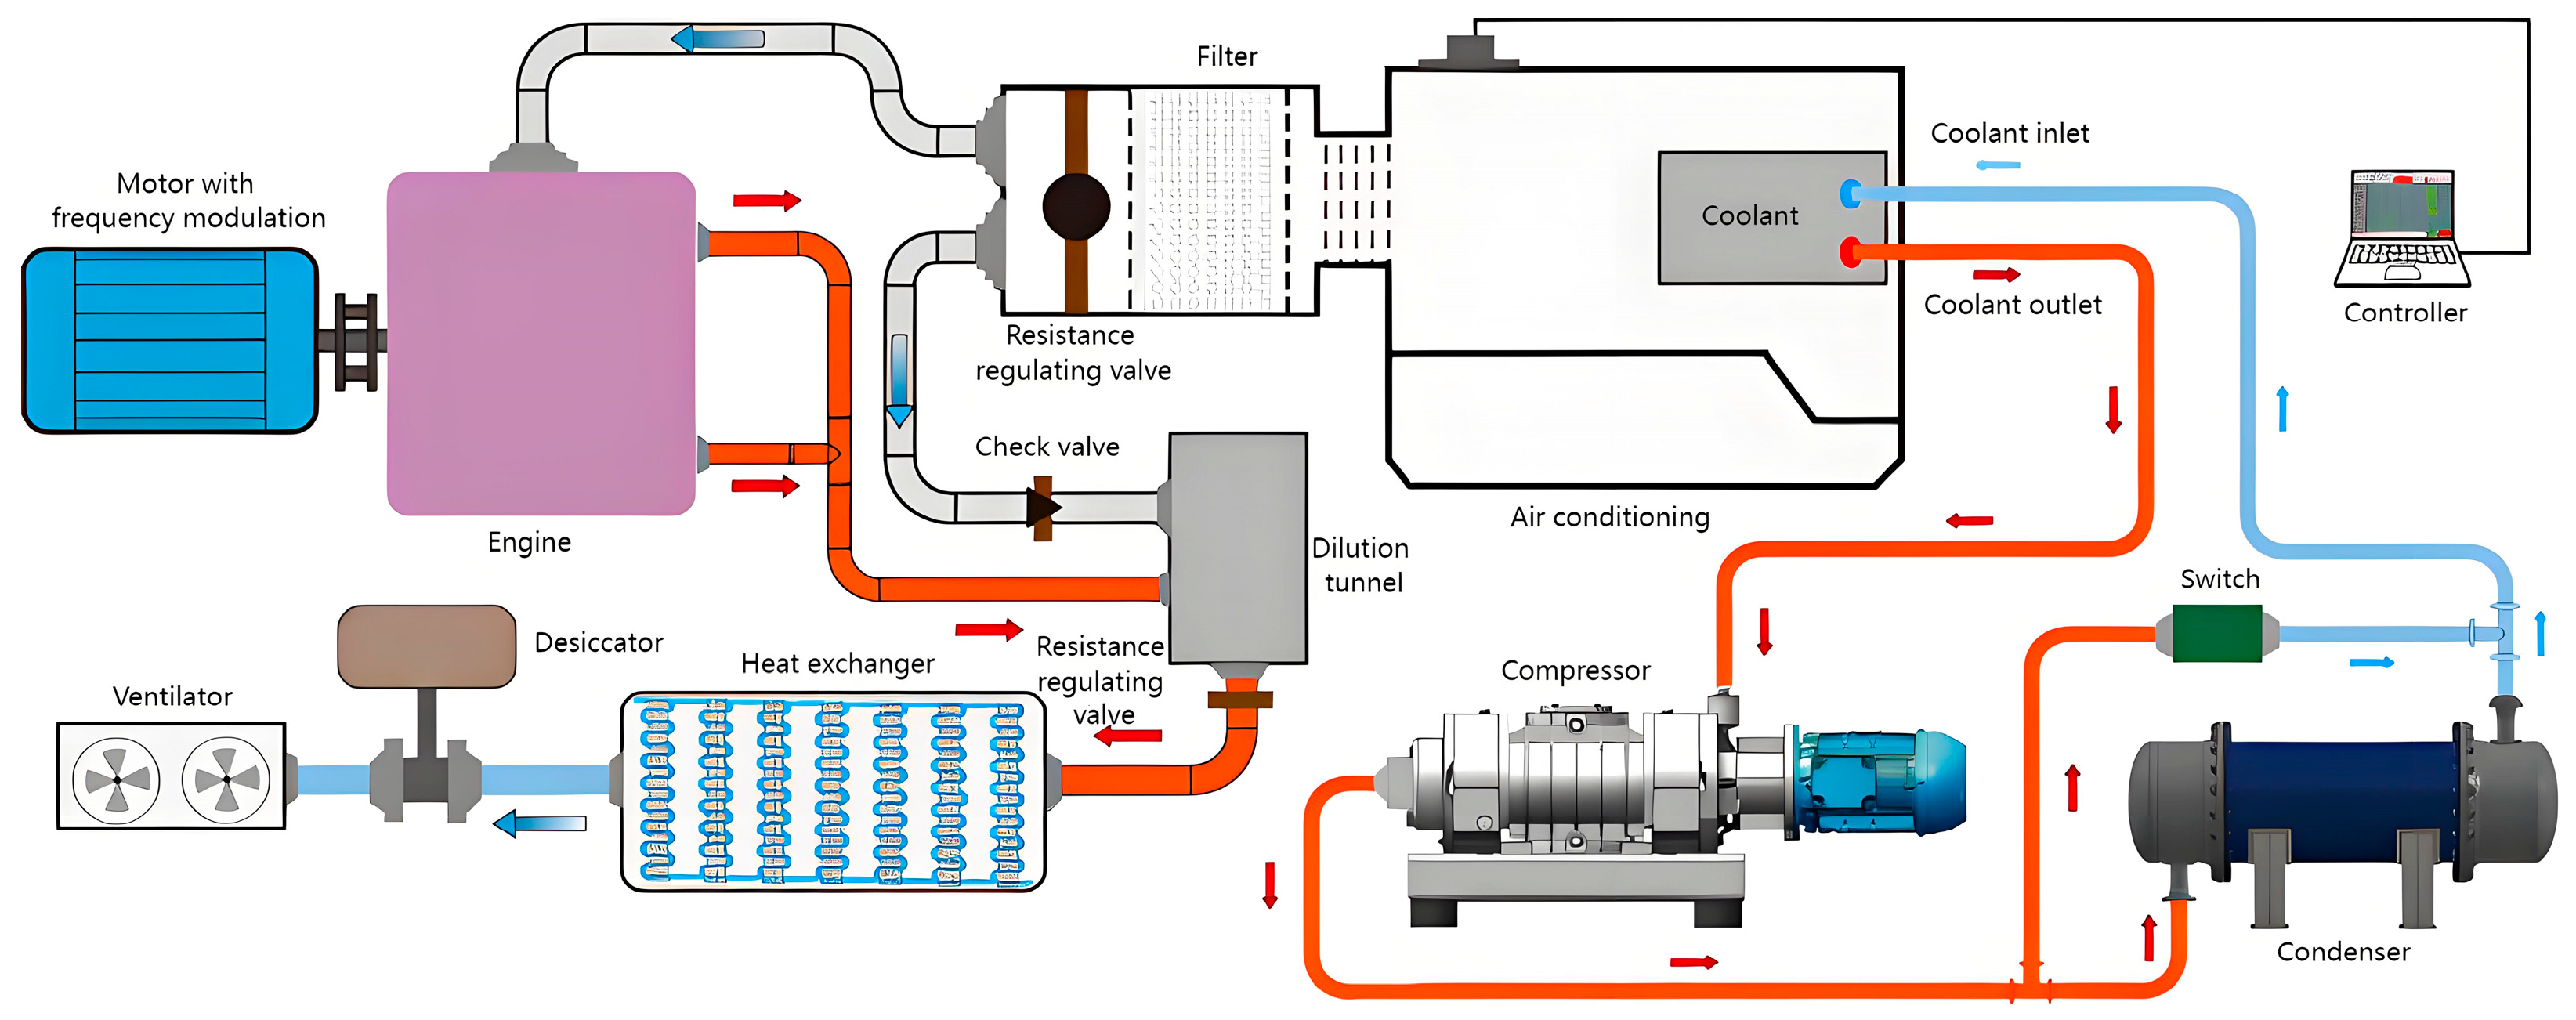
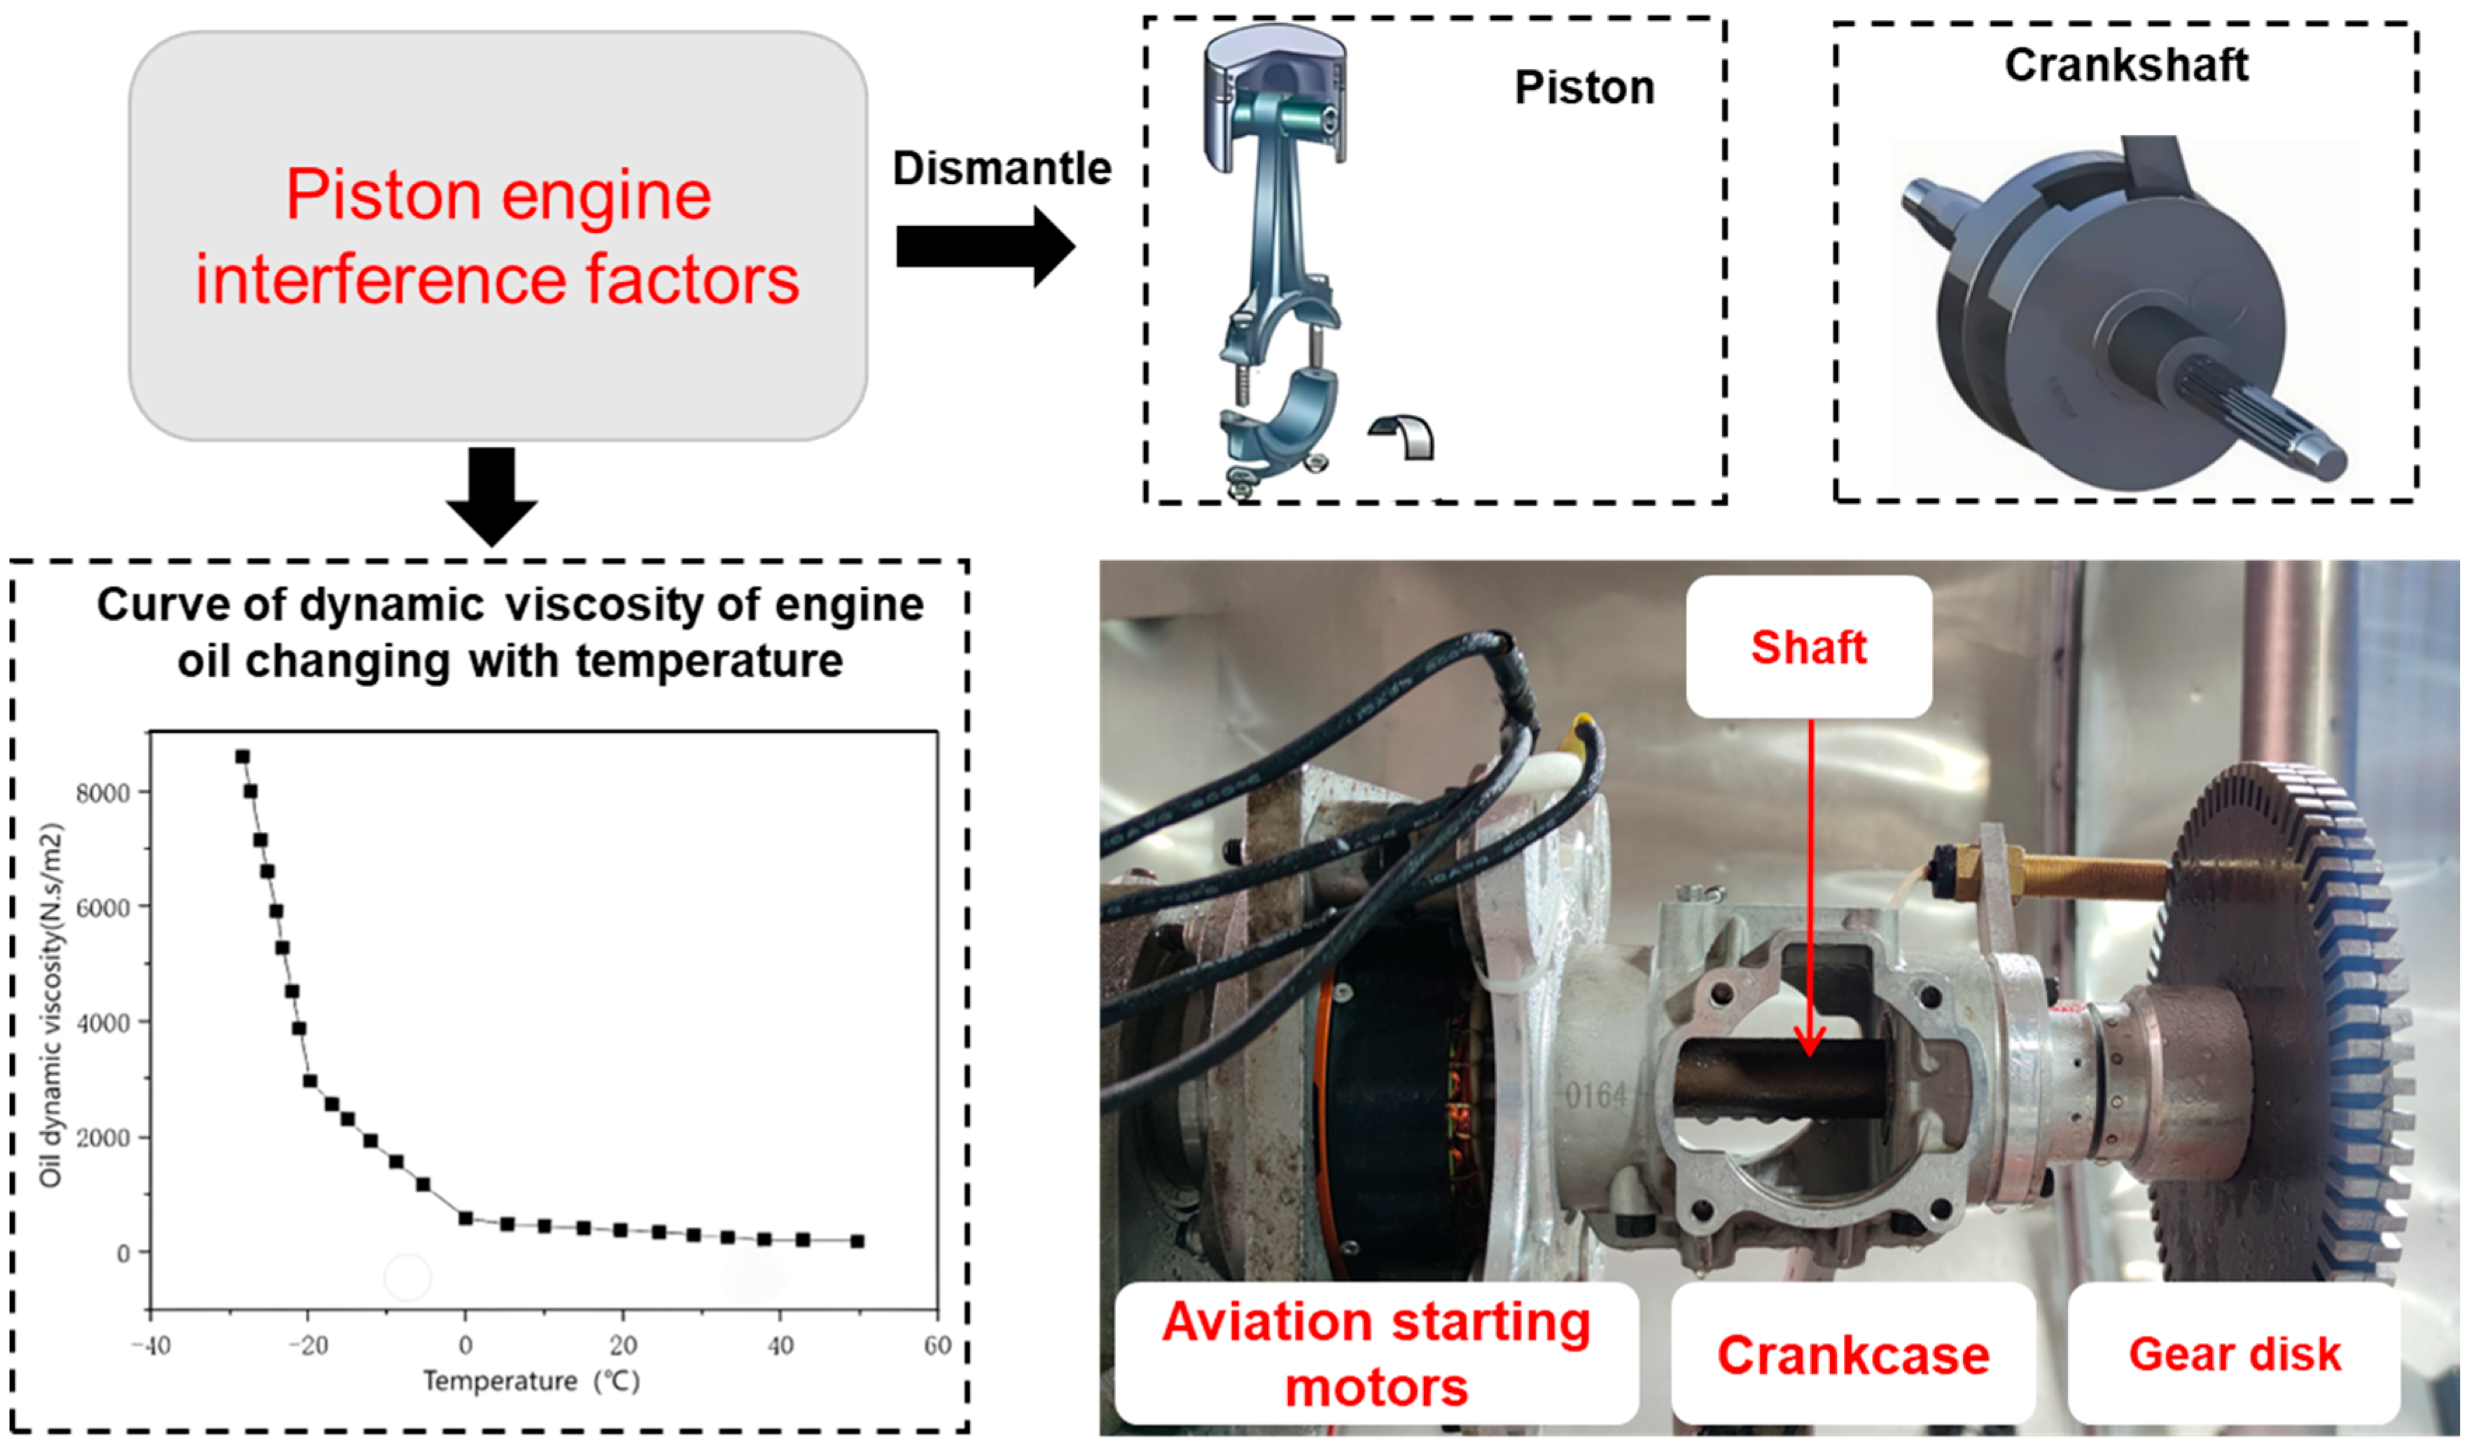
2.1. Experimental Apparatus

Figure 1 shows a schematic of the low-temperature, low-pressure test platform for aviation starting motors. The platform consists of a high-altitude environment simulation system, control system, motor starting system, and data acquisition system.
Figure 2 shows a schematic of the working principle of the high-altitude simulation chamber. The chamber features five main control systems, covering environmental pressure, ambient temperature, intake pressure, intake temperature, and intake flow. It also includes auxiliary systems, such as water circulation systems, electrical systems, safety detection systems, and drag control systems. The complete system of the high-altitude simulation chamber can ensure the stability of the experimental conditions, ensure the safety of the experimental bench, and warn of the fault in time.
The temperature of the introduced airflow within the high-altitude simulation chamber is regulated by an intake temperature system, and the temperature ranges from −60 °C to 50 °C. The cabin air pressure is determined by the airflow, which can be controlled by adjusting the vacuum pump system. The minimum air pressure in the high-altitude chamber is 20 kPa. During the experiment, the ambient temperature error is allowed to be within ±2 °C, and the ambient pressure error is within ±1 kPa. Table 1 lists the basic parameters of the aero-engine altitude simulation test chamber.
Figure 3 illustrates the low-temperature and low-pressure starting test platform for aviation starting motors. The starting system includes a permanent magnet brushless DC motor, crankcase, connecting shaft, and gear disk. The permanent magnet brushless DC motor used in this experiment has an outer rotor structure. Table 2 lists the DC motor parameters. The experimental setup employs an engine crankcase as a generator carrier. The crankshaft, piston, and other components of the aviation piston engine are removed from the crankcase. This modification prevents these components and their associated lubricating oils from influencing the transient characteristics of the aviation starting motor, thereby increasing the reliability of the experimental results. The test platform connects the motor and gear disk through a shaft. The gear disk simulates rotational inertia during the engine starting process in order to reproduce the transient process of the motor driving the engine during startup. In addition, a gear disk is used to capture the instantaneous rotational speed of the starting motor. Finally, an 18 kW spark-ignition two-stroke aviation piston engine is matched with the permanent magnet brushless motor used in the system. The main parameters are shown in Table 3.

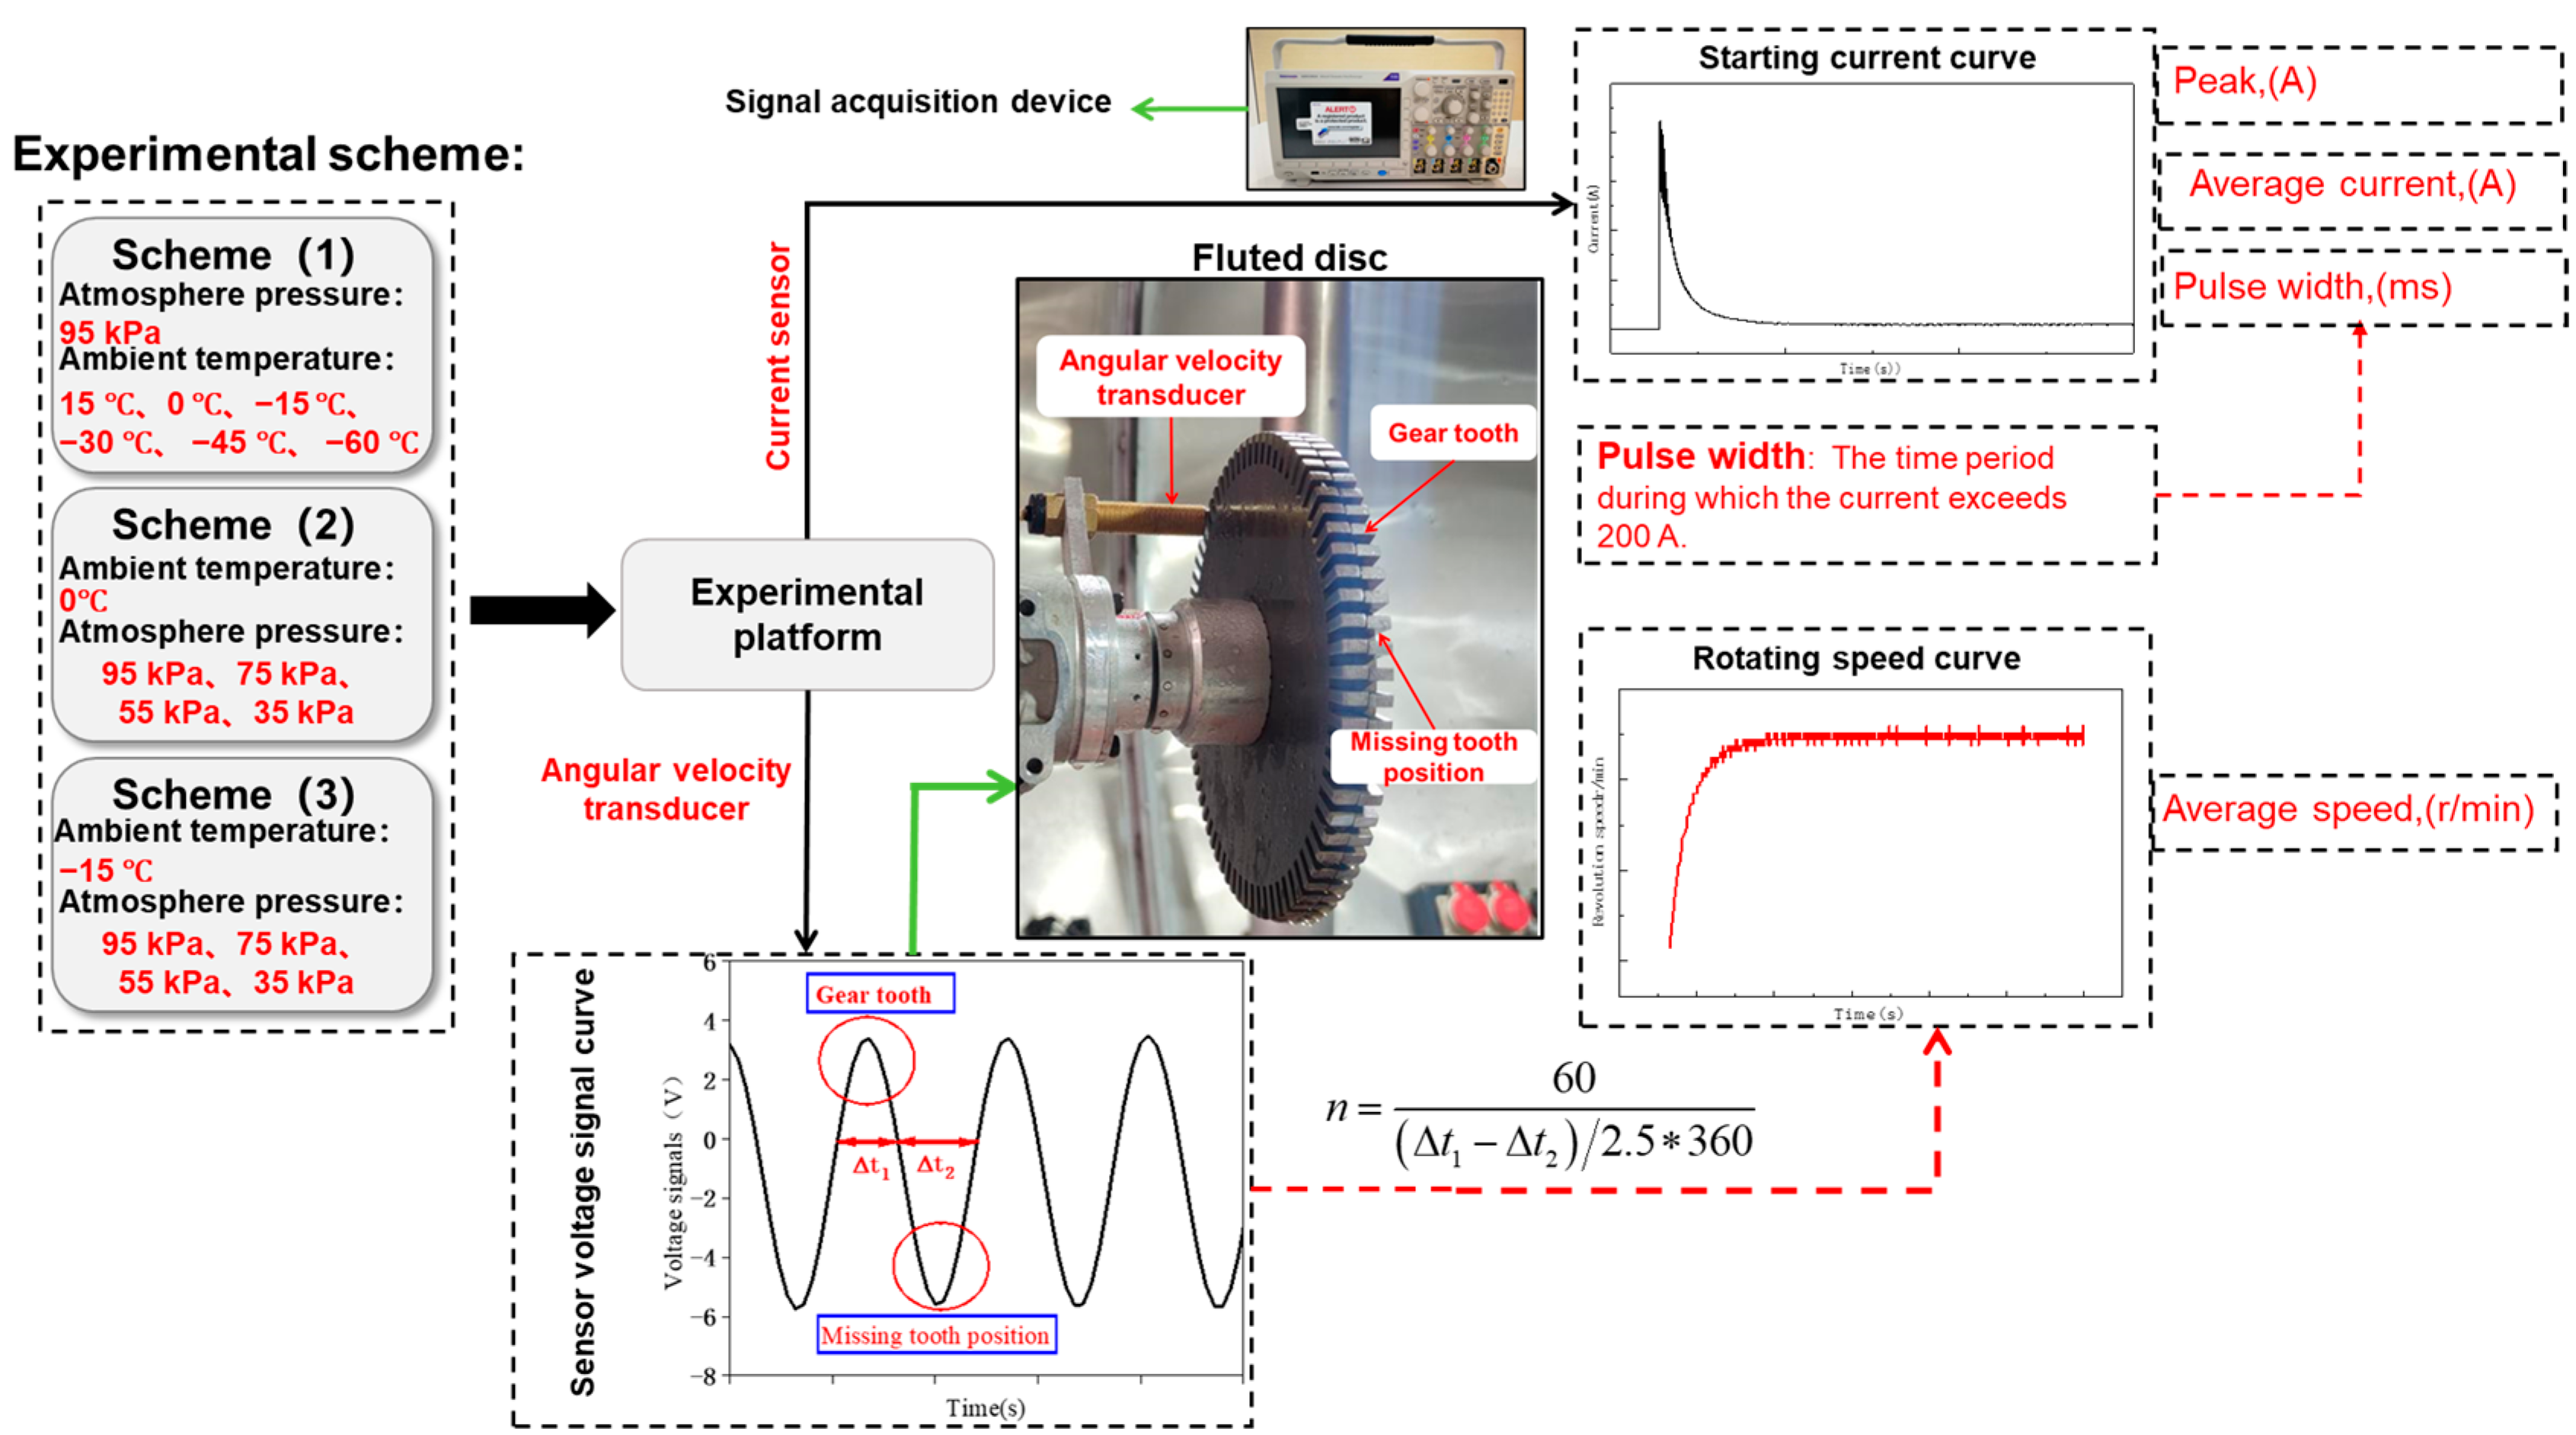
2.2. Experimental Conditions and Data Processing

Figure 4 shows the experimental setup, data acquisition, and processing diagram. The working conditions for the aviation starting motor experiment are configured as shown in the figure. These conditions were established based on the altitude starting requirements of an aviation piston engine. The data acquisition system of the test platform included the following components: a signal acquisition device, a current sensor, an angular velocity sensor, and temperature and pressure sensors. The main parameters of all sensors are shown in Table 4. The angular velocity sensor operates based on electromagnetic induction. The gear disk shown in Figure 4 is a physical representation of the angular velocity sensor and the gear disk itself. The gear disk had 72 teeth, and the tooth thickness was equal to the width of the space. The calculation formula for the speed of the aviation starting motor is also shown in Figure 4.

3. Results and Discussion

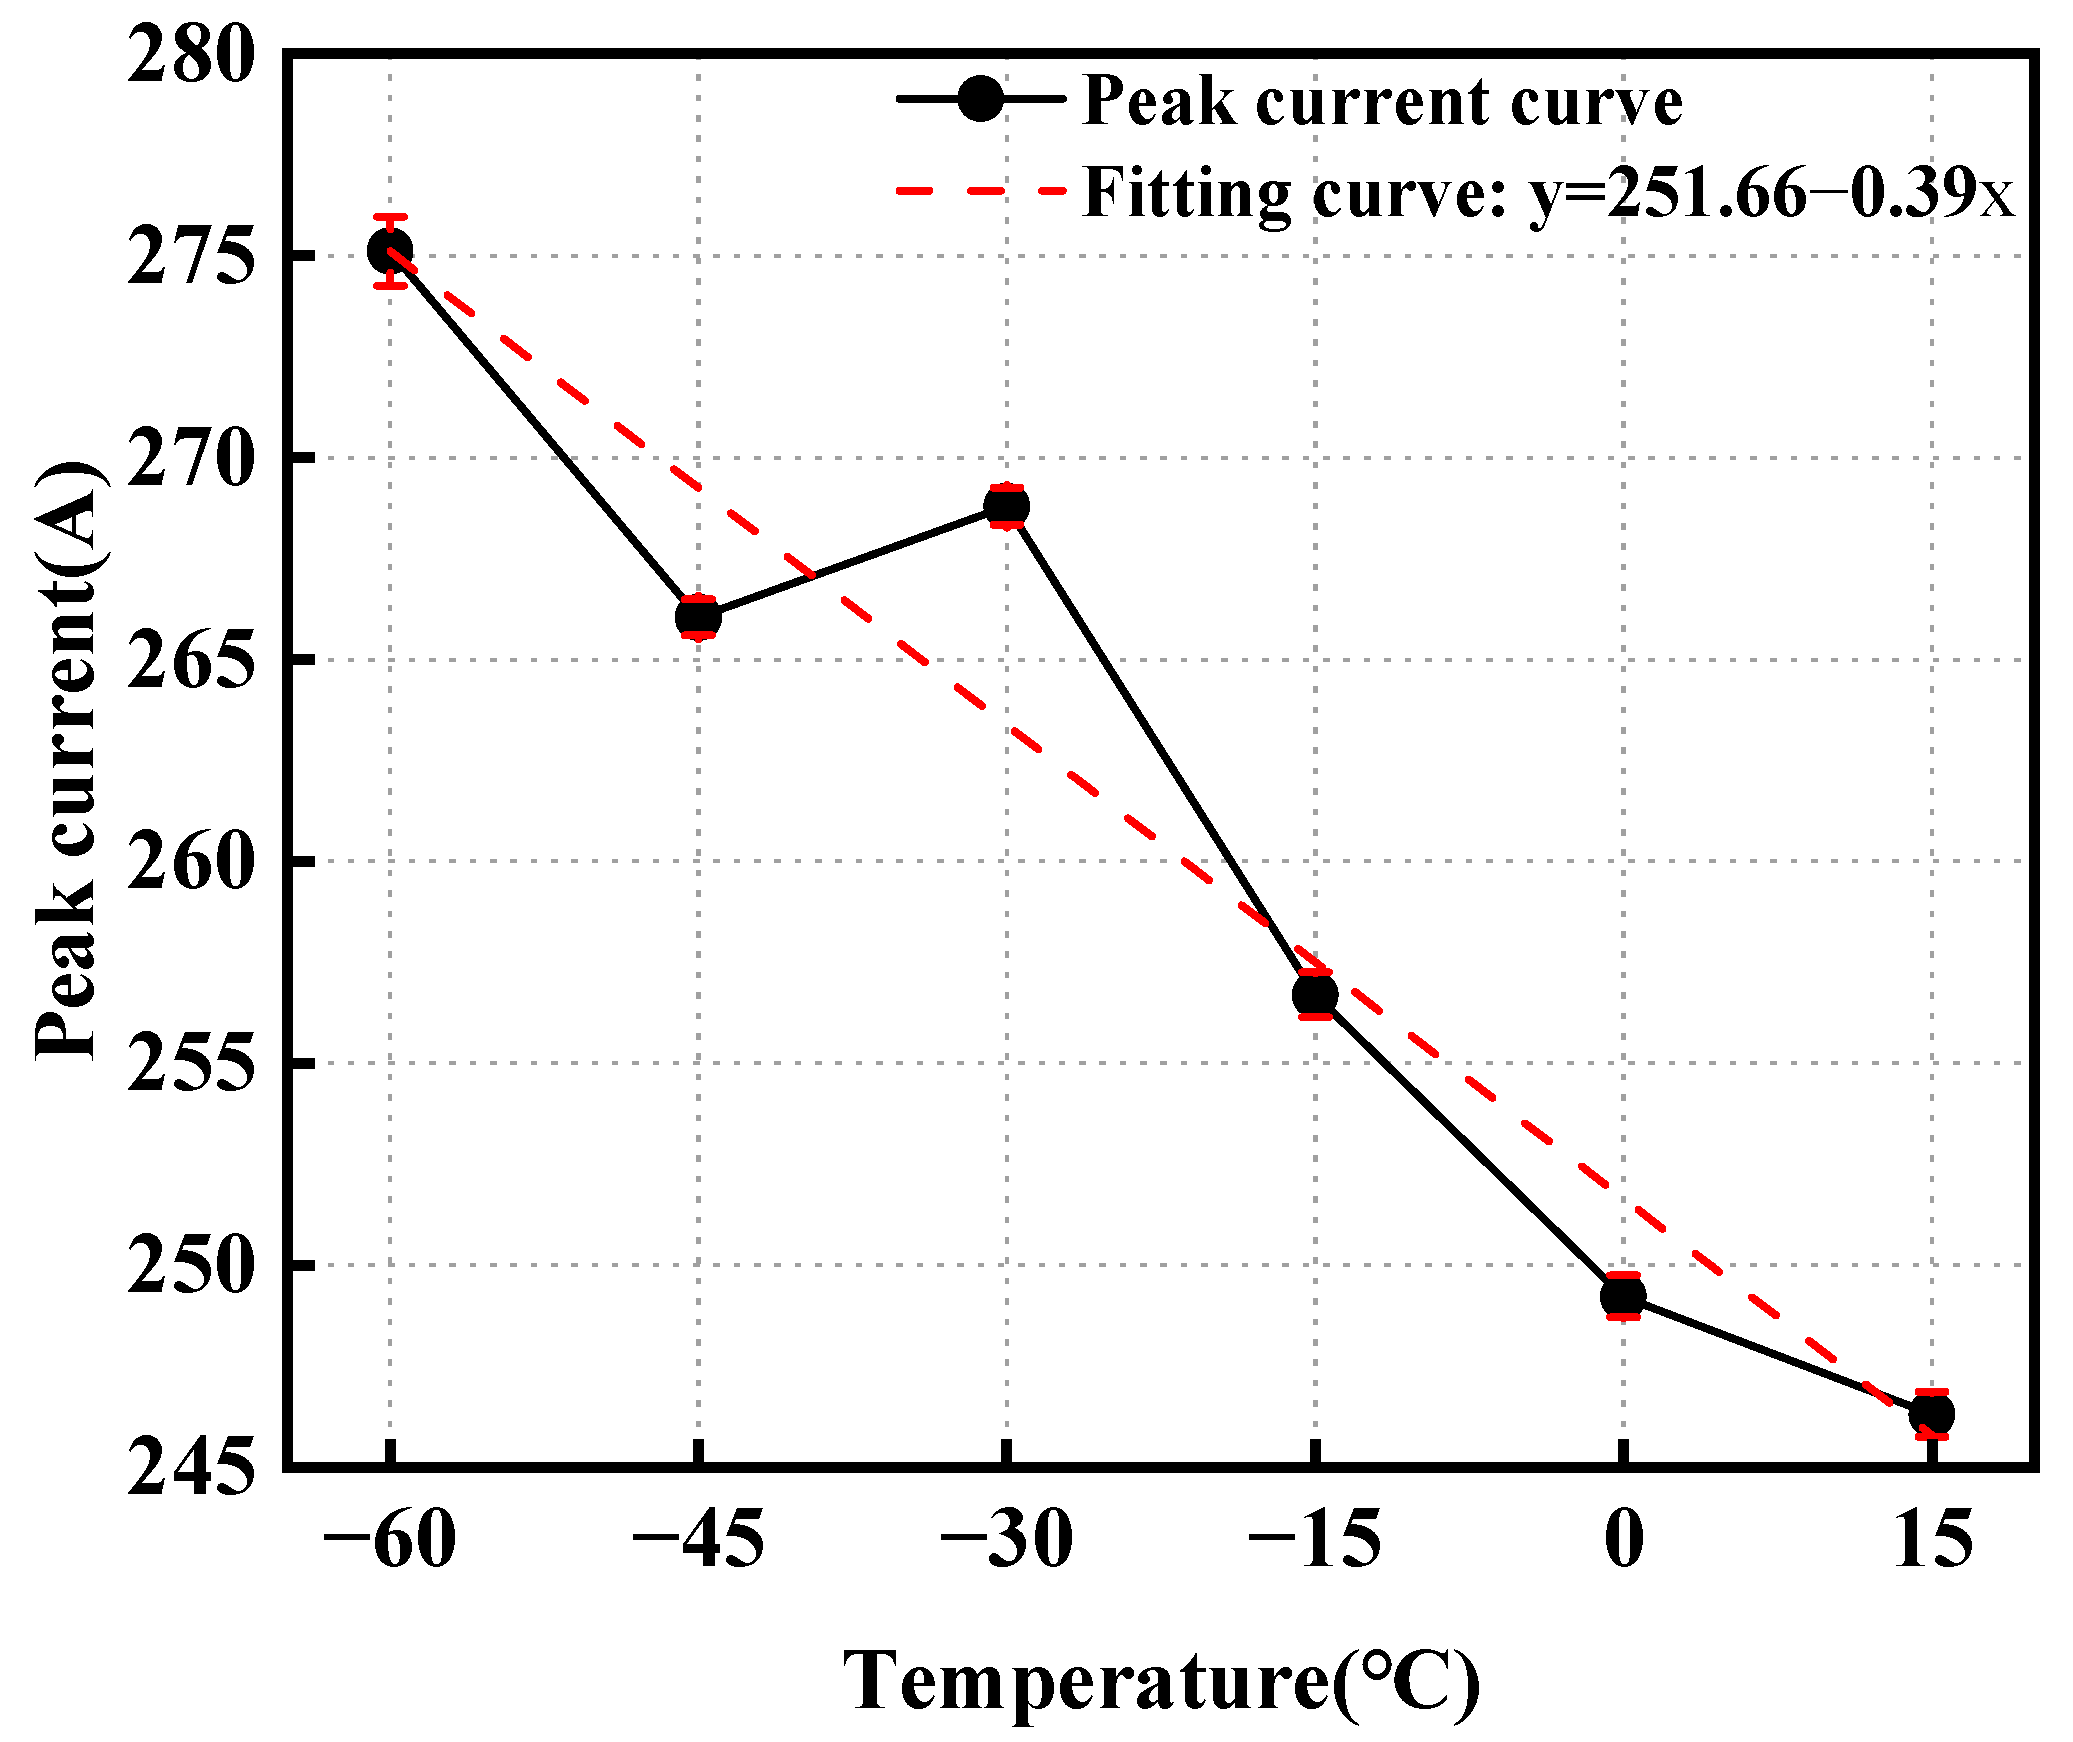
3.1. Impact of Low Temperature on Transient Startup Characteristics

When the ambient pressure is 95 kPa and the ambient temperature during the starting process of the aviation starting motor varies from −60 °C to 15 °C in 15 °C increments, the speed and current curves of the motor during startup are shown in Figure 5. Across different ambient temperatures, the trends in current and speed during the starting process of the aviation starting motor exhibited similar patterns. At startup, the motor experiences a peak in the starting current. As the speed increased, the current began to decrease and eventually stabilized within a certain range. Once the speed reached its peak, it stabilized within a specific range.
Figure 6 illustrates the relationship between the peak current of the aviation starting motor during the startup process and the ambient temperature, which ranges from −60 °C to 15 °C. As the ambient temperature decreases from 15 °C to −60 °C, the peak starting current rises from 246.50 A to 275.16 A. The fitting curve presented in the Figure 6 shows the correlation between the peak current and changes in the ambient temperature. These results indicate that on average, the peak starting current increases by 1.95 A for every 5 °C decrease in the ambient temperature.
Figure 7 shows the curve depicting the relationship between the average current of the aviation starting motor after it reaches stable operation and the ambient temperature, ranging from −60 °C to 15 °C. As the ambient temperature decreases from 15 °C to −60 °C, the average current increases from 5.31 A to 6.85 A. Figure 7 includes a fitting curve that illustrates how the average current varies with the ambient temperature. The average current of the aviation starting motor increases as the ambient temperature decreases. This occurs because the resistance of the copper windings in the motor stator decrease as the temperature decreases.
Figure 8 depicts the curve representing the starting current pulse width during the starting process of the aviation starting motor as a function of the ambient temperature, ranging from −60 °C to 15 °C. At an ambient temperature of 0 °C, the starting current pulse width is 19.28 ms, whereas it extends to 30.92 ms at −60 °C, resulting in a difference of 11.64 ms between the maximum and minimum pulse width. Moreover, Figure 8 includes a fitting curve that illustrates how the starting current pulse width changes with the ambient temperature. As the ambient temperature decreases, the starting current pulse width for the aviation starting motor increases progressively, and the rate of increase accelerates as the temperature decreases.
Figure 9 shows the curve illustrating the change in the average speed of the aviation starting motor as a function of the ambient temperature, ranging from −60 °C to 15 °C. The average speed of the motor decreases from 1350 r/min at an ambient temperature of 15 °C to 1243.80 r/min at −60 °C. When the aviation starter motor drives the engine under a larger load, the decrease in the motor speed becomes more pronounced as the ambient temperature decreases.

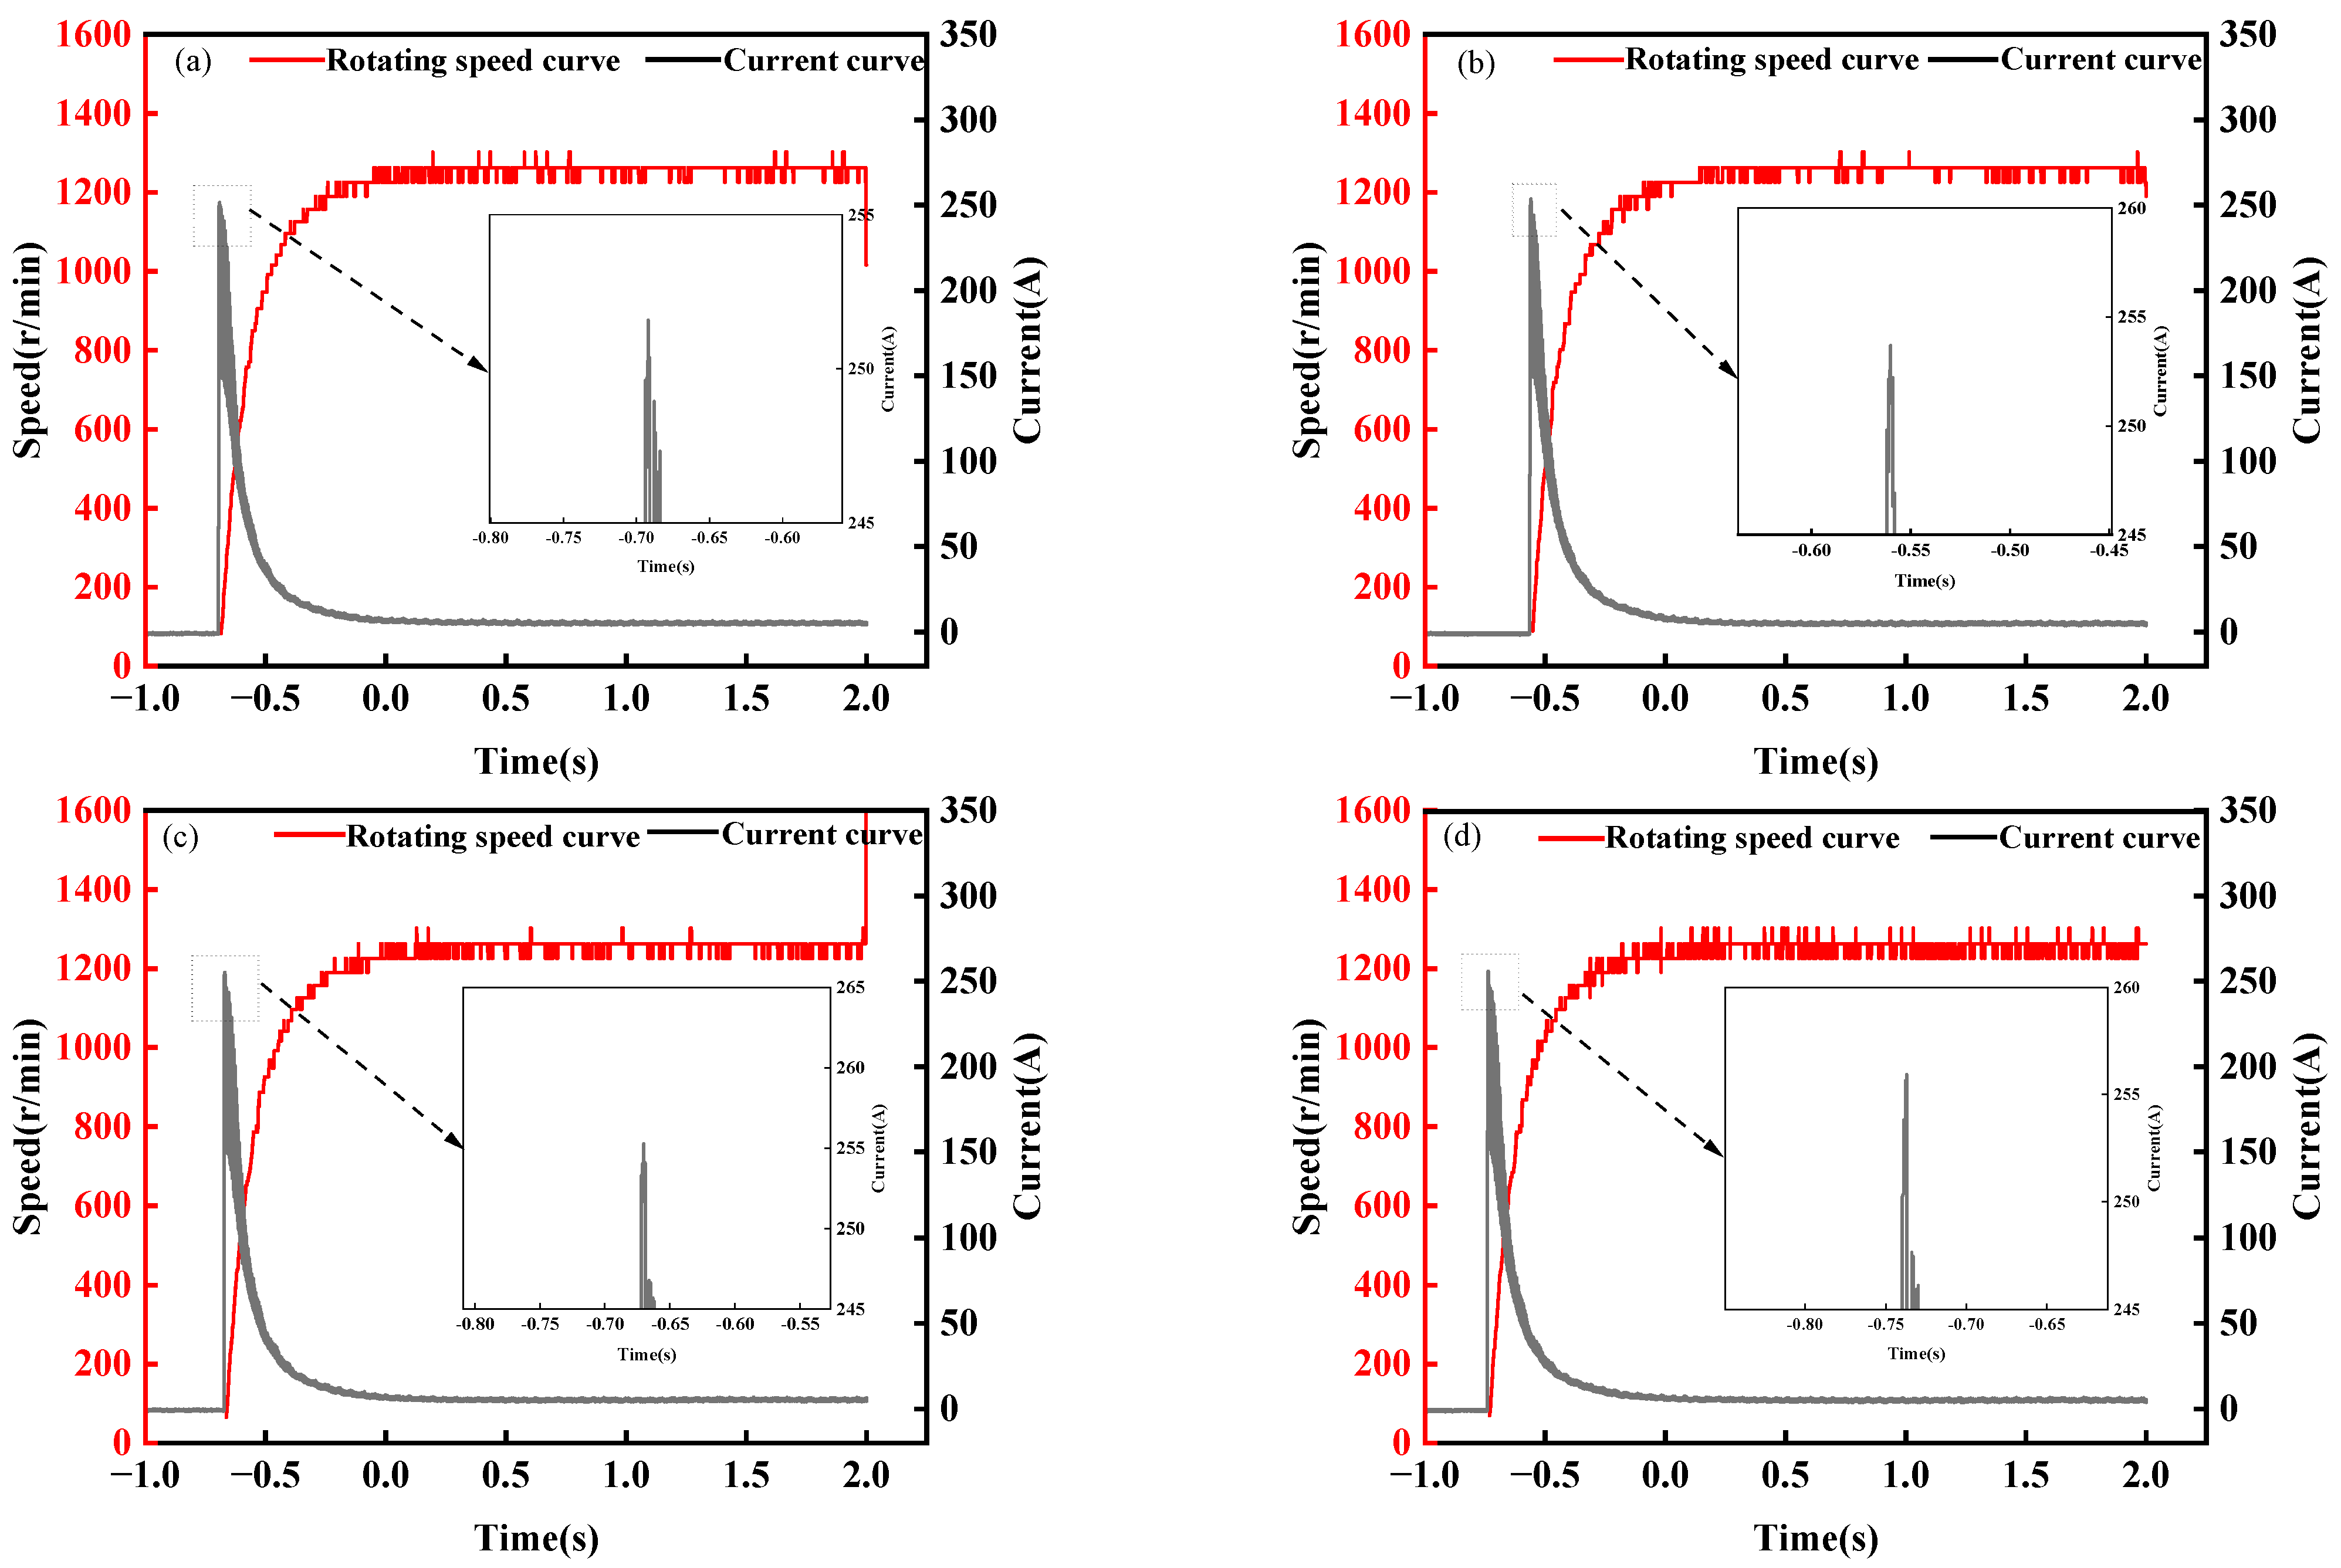
3.2. Impact of Low Pressure on Transient Startup Characteristics

Figure 10 depicts the corresponding speed and current curves of the aviation starting motor at an ambient temperature of 0 °C with an ambient air pressure that gradually increases from 35 kPa to 95 kPa in 20 kPa increments during the starting process of the motor.
Figure 11 illustrates the corresponding speed and current curves of the aviation starting motor at an ambient temperature of −15 °C as the ambient air pressure gradually increases from 35 kPa to 95 kPa in 20 kPa increments during the starting process of the motor.
Figure 12 illustrates the curve showing the variation in the peak current of the aviation starting motor with changes in the ambient pressure during the starting process under ambient temperatures of 0 °C and −15 °C and ambient pressures ranging from 35 kPa to 95 kPa. At an ambient temperature of 0 °C and an ambient pressure of 35 kPa, the peak starting current of the aviation starting motor is 252.28 A. When the ambient pressure increases to 95 kPa, the peak starting current decreases slightly to 249.11 A, resulting in a maximum difference of 3.17 A. At an ambient temperature of −15 °C and an ambient pressure of 35 kPa, the peak starting current is 252.53 A. When the ambient pressure increases to 95 kPa, the peak starting current rises to 256.78 A, with a maximum difference of 4.25 A.
Figure 13 presents the variation curve of the average current of the aviation starter motor as a function of the ambient pressure after achieving stable operation at ambient temperatures of 0 °C and −15 °C, with pressures ranging from 35 kPa to 95 kPa. The average current of the aviation starter motor shows minimal variation at both 0 °C and −15 °C across the different ambient pressures of 95, 75, 55, and 35 kPa. The rates of change between the maximum and minimum values are 1.21% and 1.98%, respectively.
Figure 14 illustrates the variation curve of the starting current pulse width of the aviation starter motor during the starting process, in relation to the ambient pressure, at ambient temperatures of 0 °C and −15 °C, with pressures ranging from 35 kPa to 95 kPa. At both 0 °C and −15 °C, the differences between the maximum and minimum values of the starting current pulse width during the starting process under varying ambient pressures are 1.08 ms and 0.88 ms, respectively.
Figure 15 shows the curve depicting the average speed of the aviation starting motor after reaching stable operation as a function of the ambient pressure at ambient temperatures of 0 °C and −15 °C. At both temperatures, the average speed fluctuation of the aviation starter motor remained minimal across ambient pressures of 95, 75, 55, and 35 kPa. The rates of change between the maximum and minimum values were 0.48% and 0.17%, respectively, compared with the average value.

4. Conclusions

When the ambient pressure is 95 kPa and the ambient temperature ranges from −60 °C to 15 °C, the starting current of the aviation starter motor increases as the temperature decreases, whereas the average speed decreases as the temperature decreases. When the ambient temperature is 0 °C or −15 °C, changes in ambient pressure between 35 kPa and 95 kPa have little effect on the starting current and starting speed.
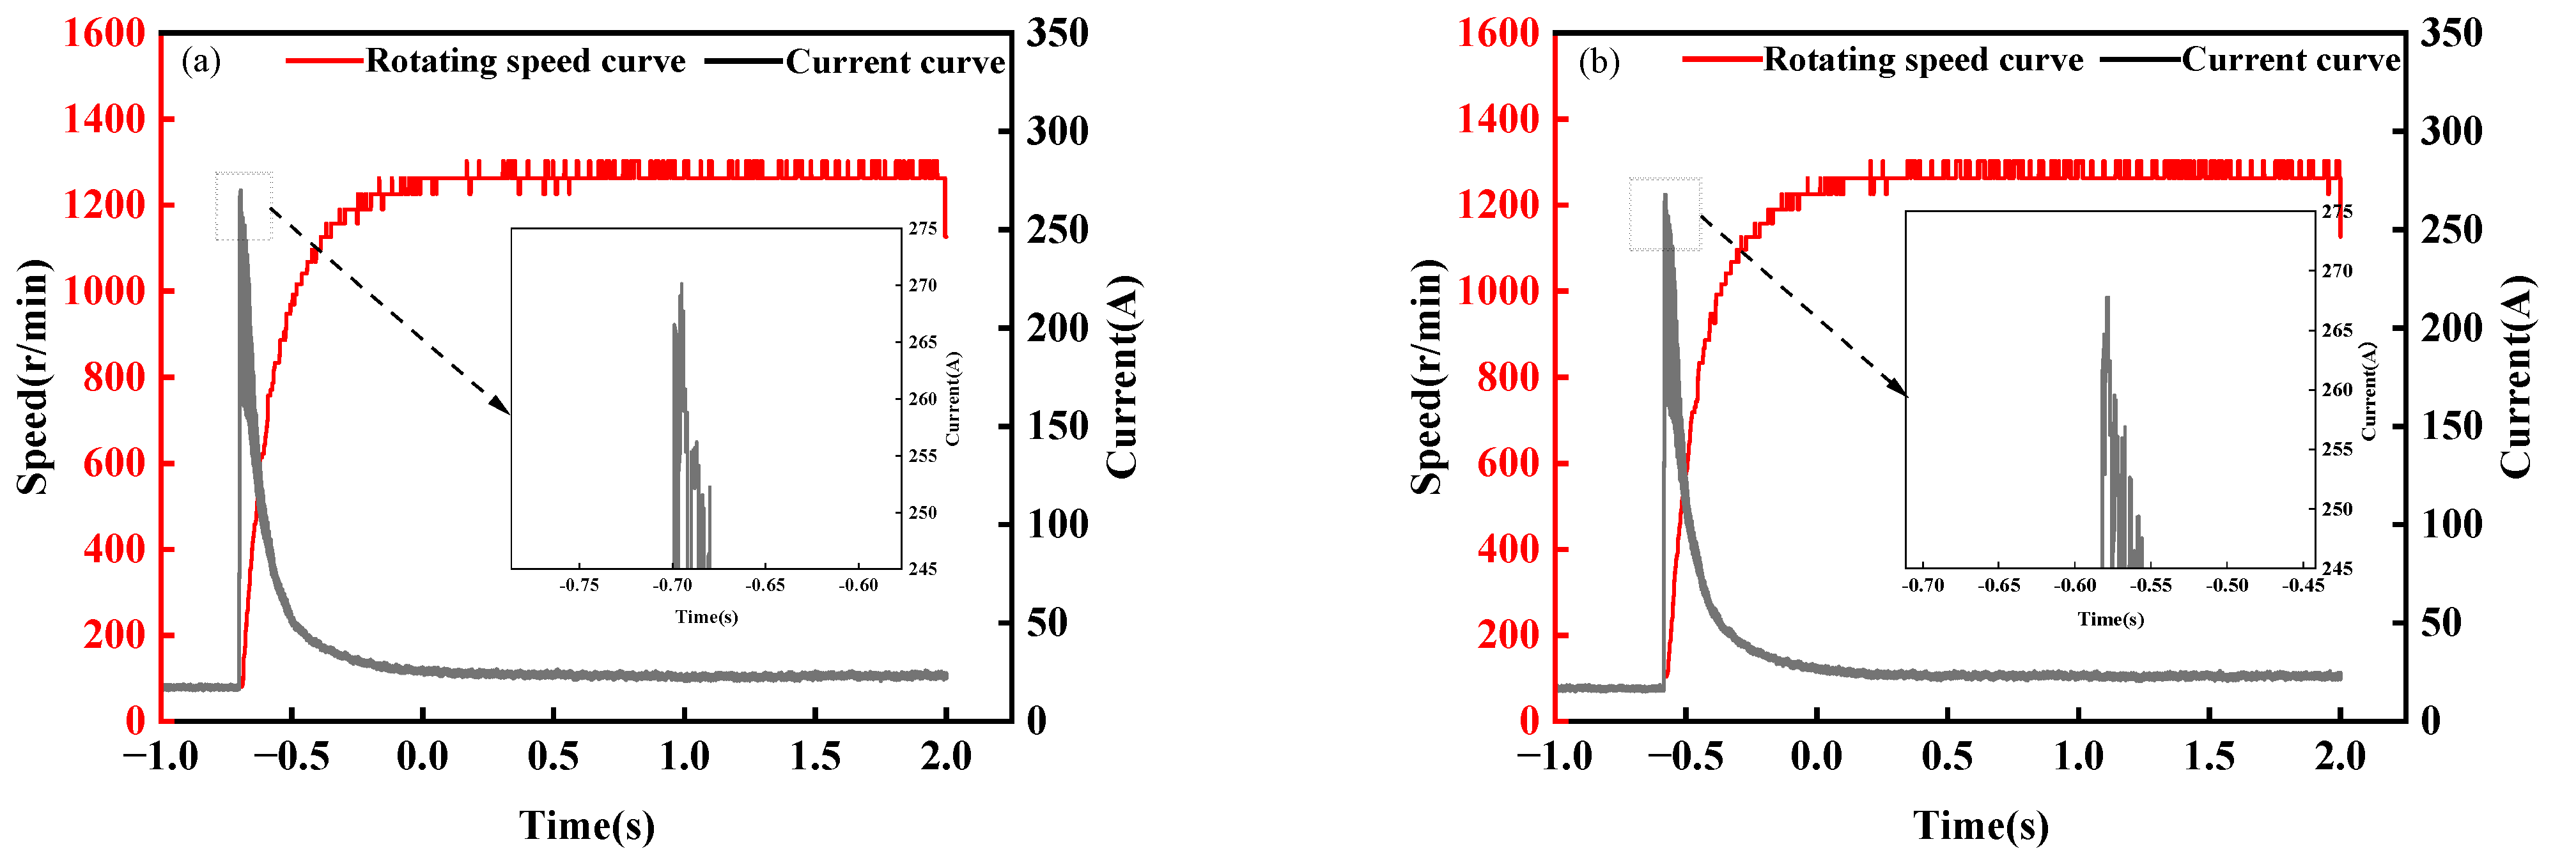
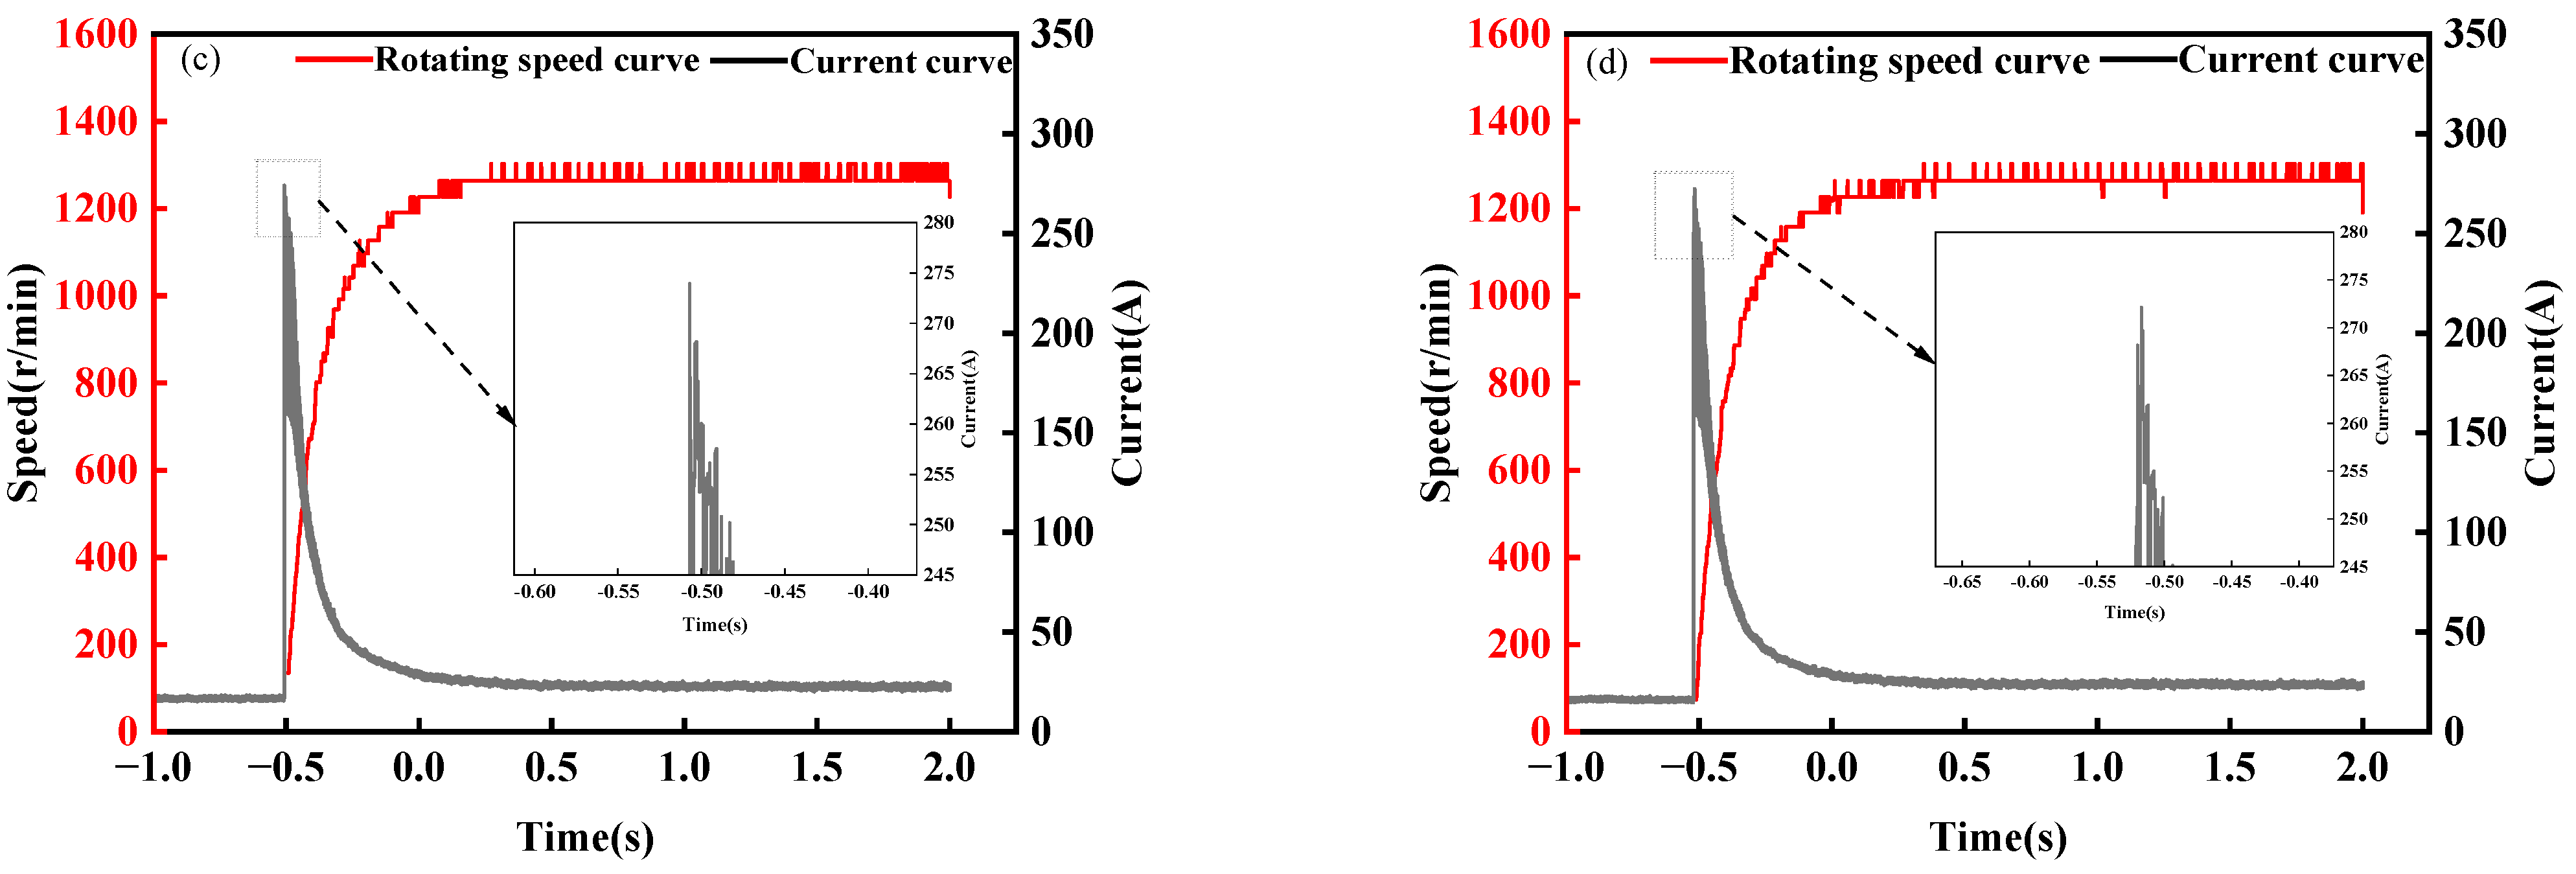
  • For every 5 °C decrease in ambient temperature, the peak starting current increases by 1.95 A. In contrast, the peak starting current was less affected by changes in ambient pressure, with a maximum difference of no more than 4.50 A.
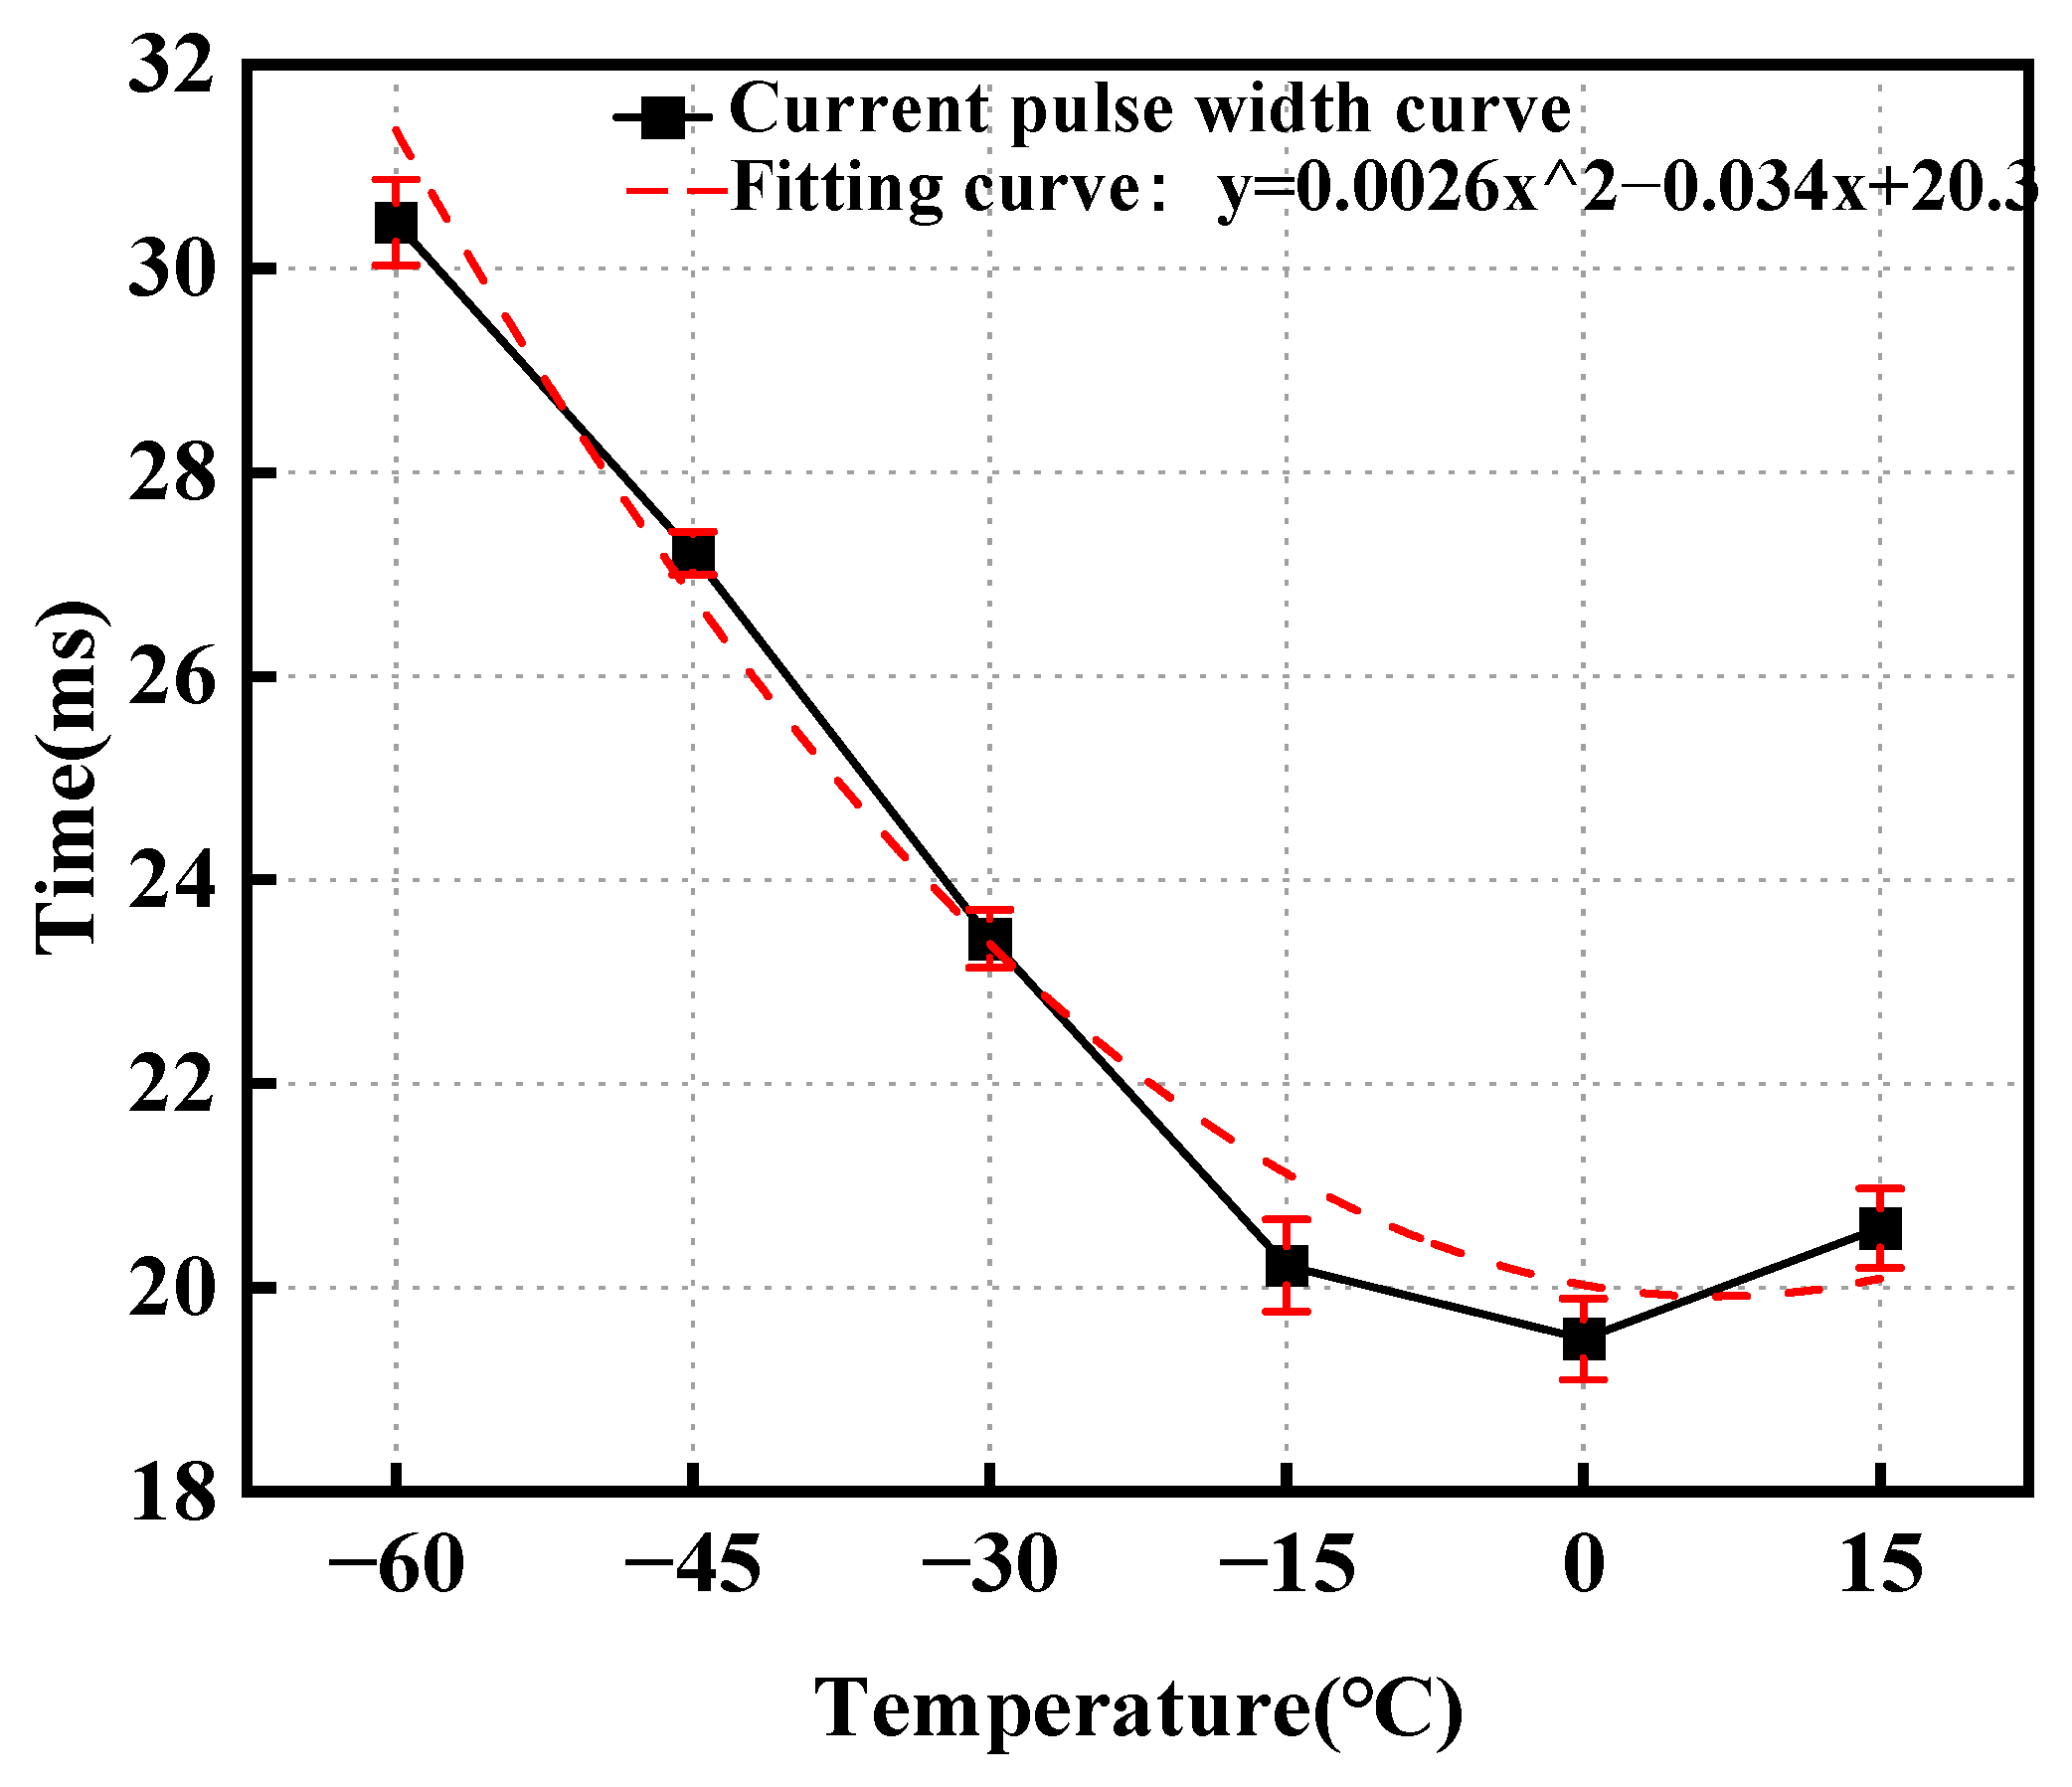
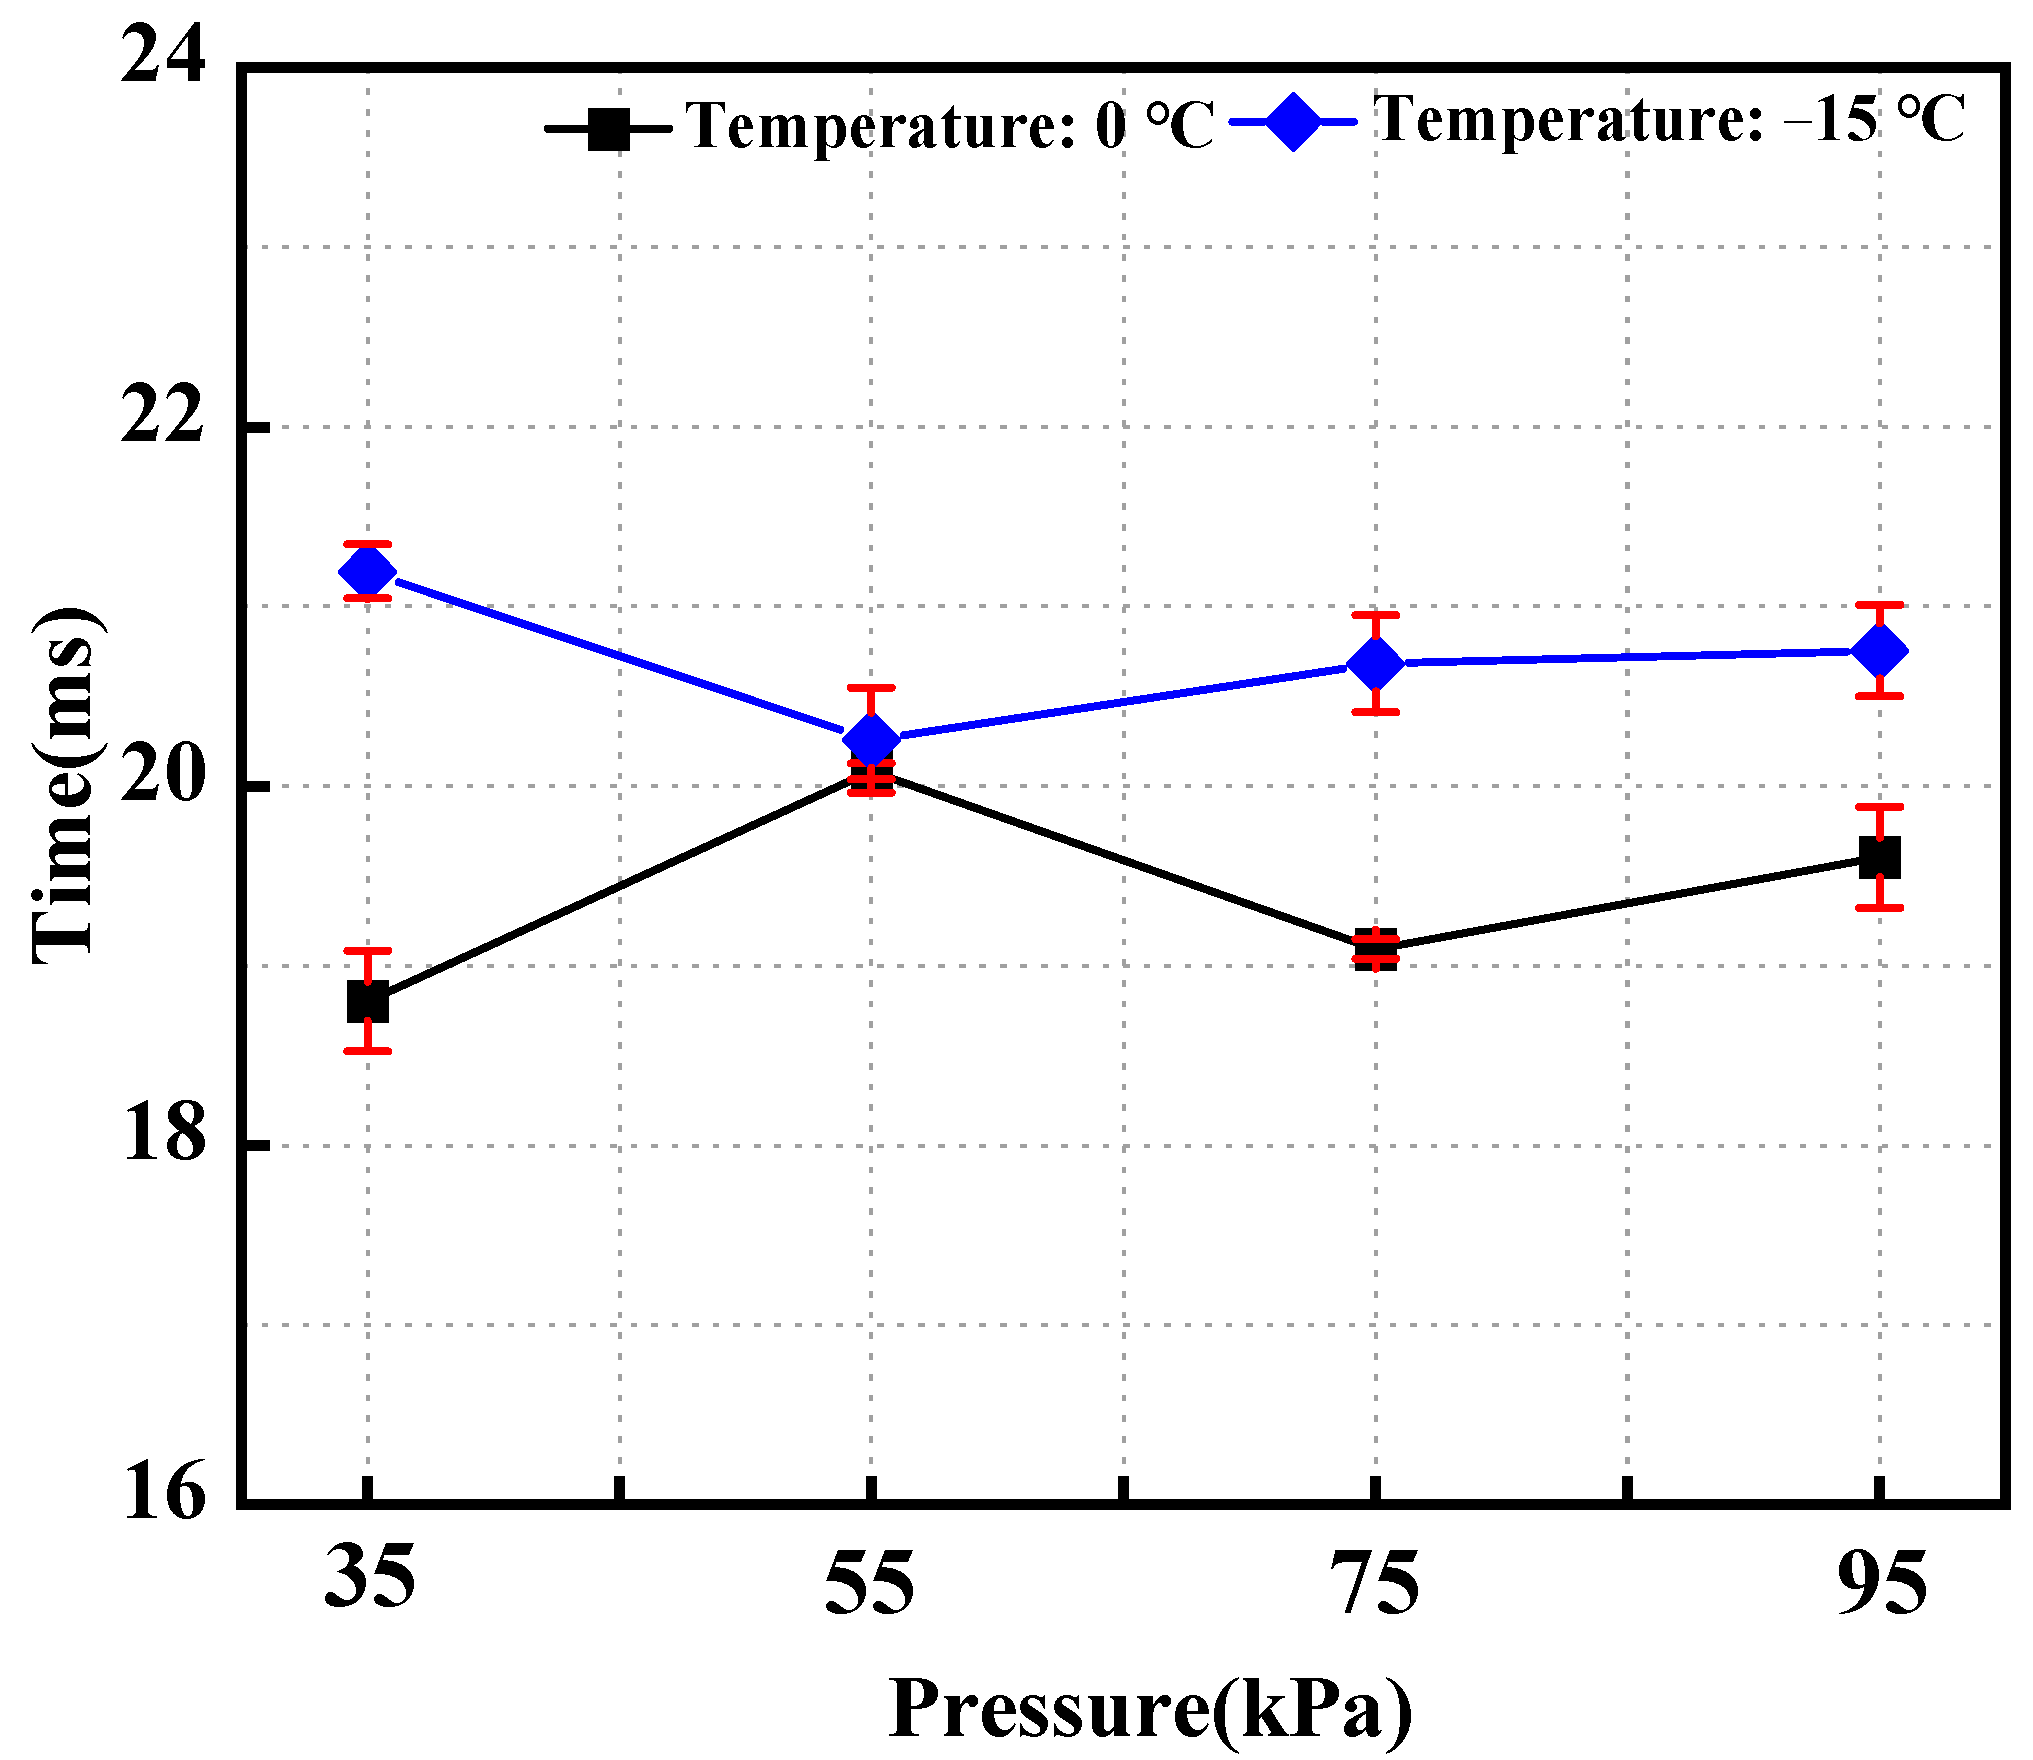
  • Within the temperature range of −60 °C to +15 °C, the maximum difference in the starting current pulse width is 11.64 ms, whereas the fluctuations in the starting current pulse width caused by changes in the ambient pressure do not exceed 2 ms.
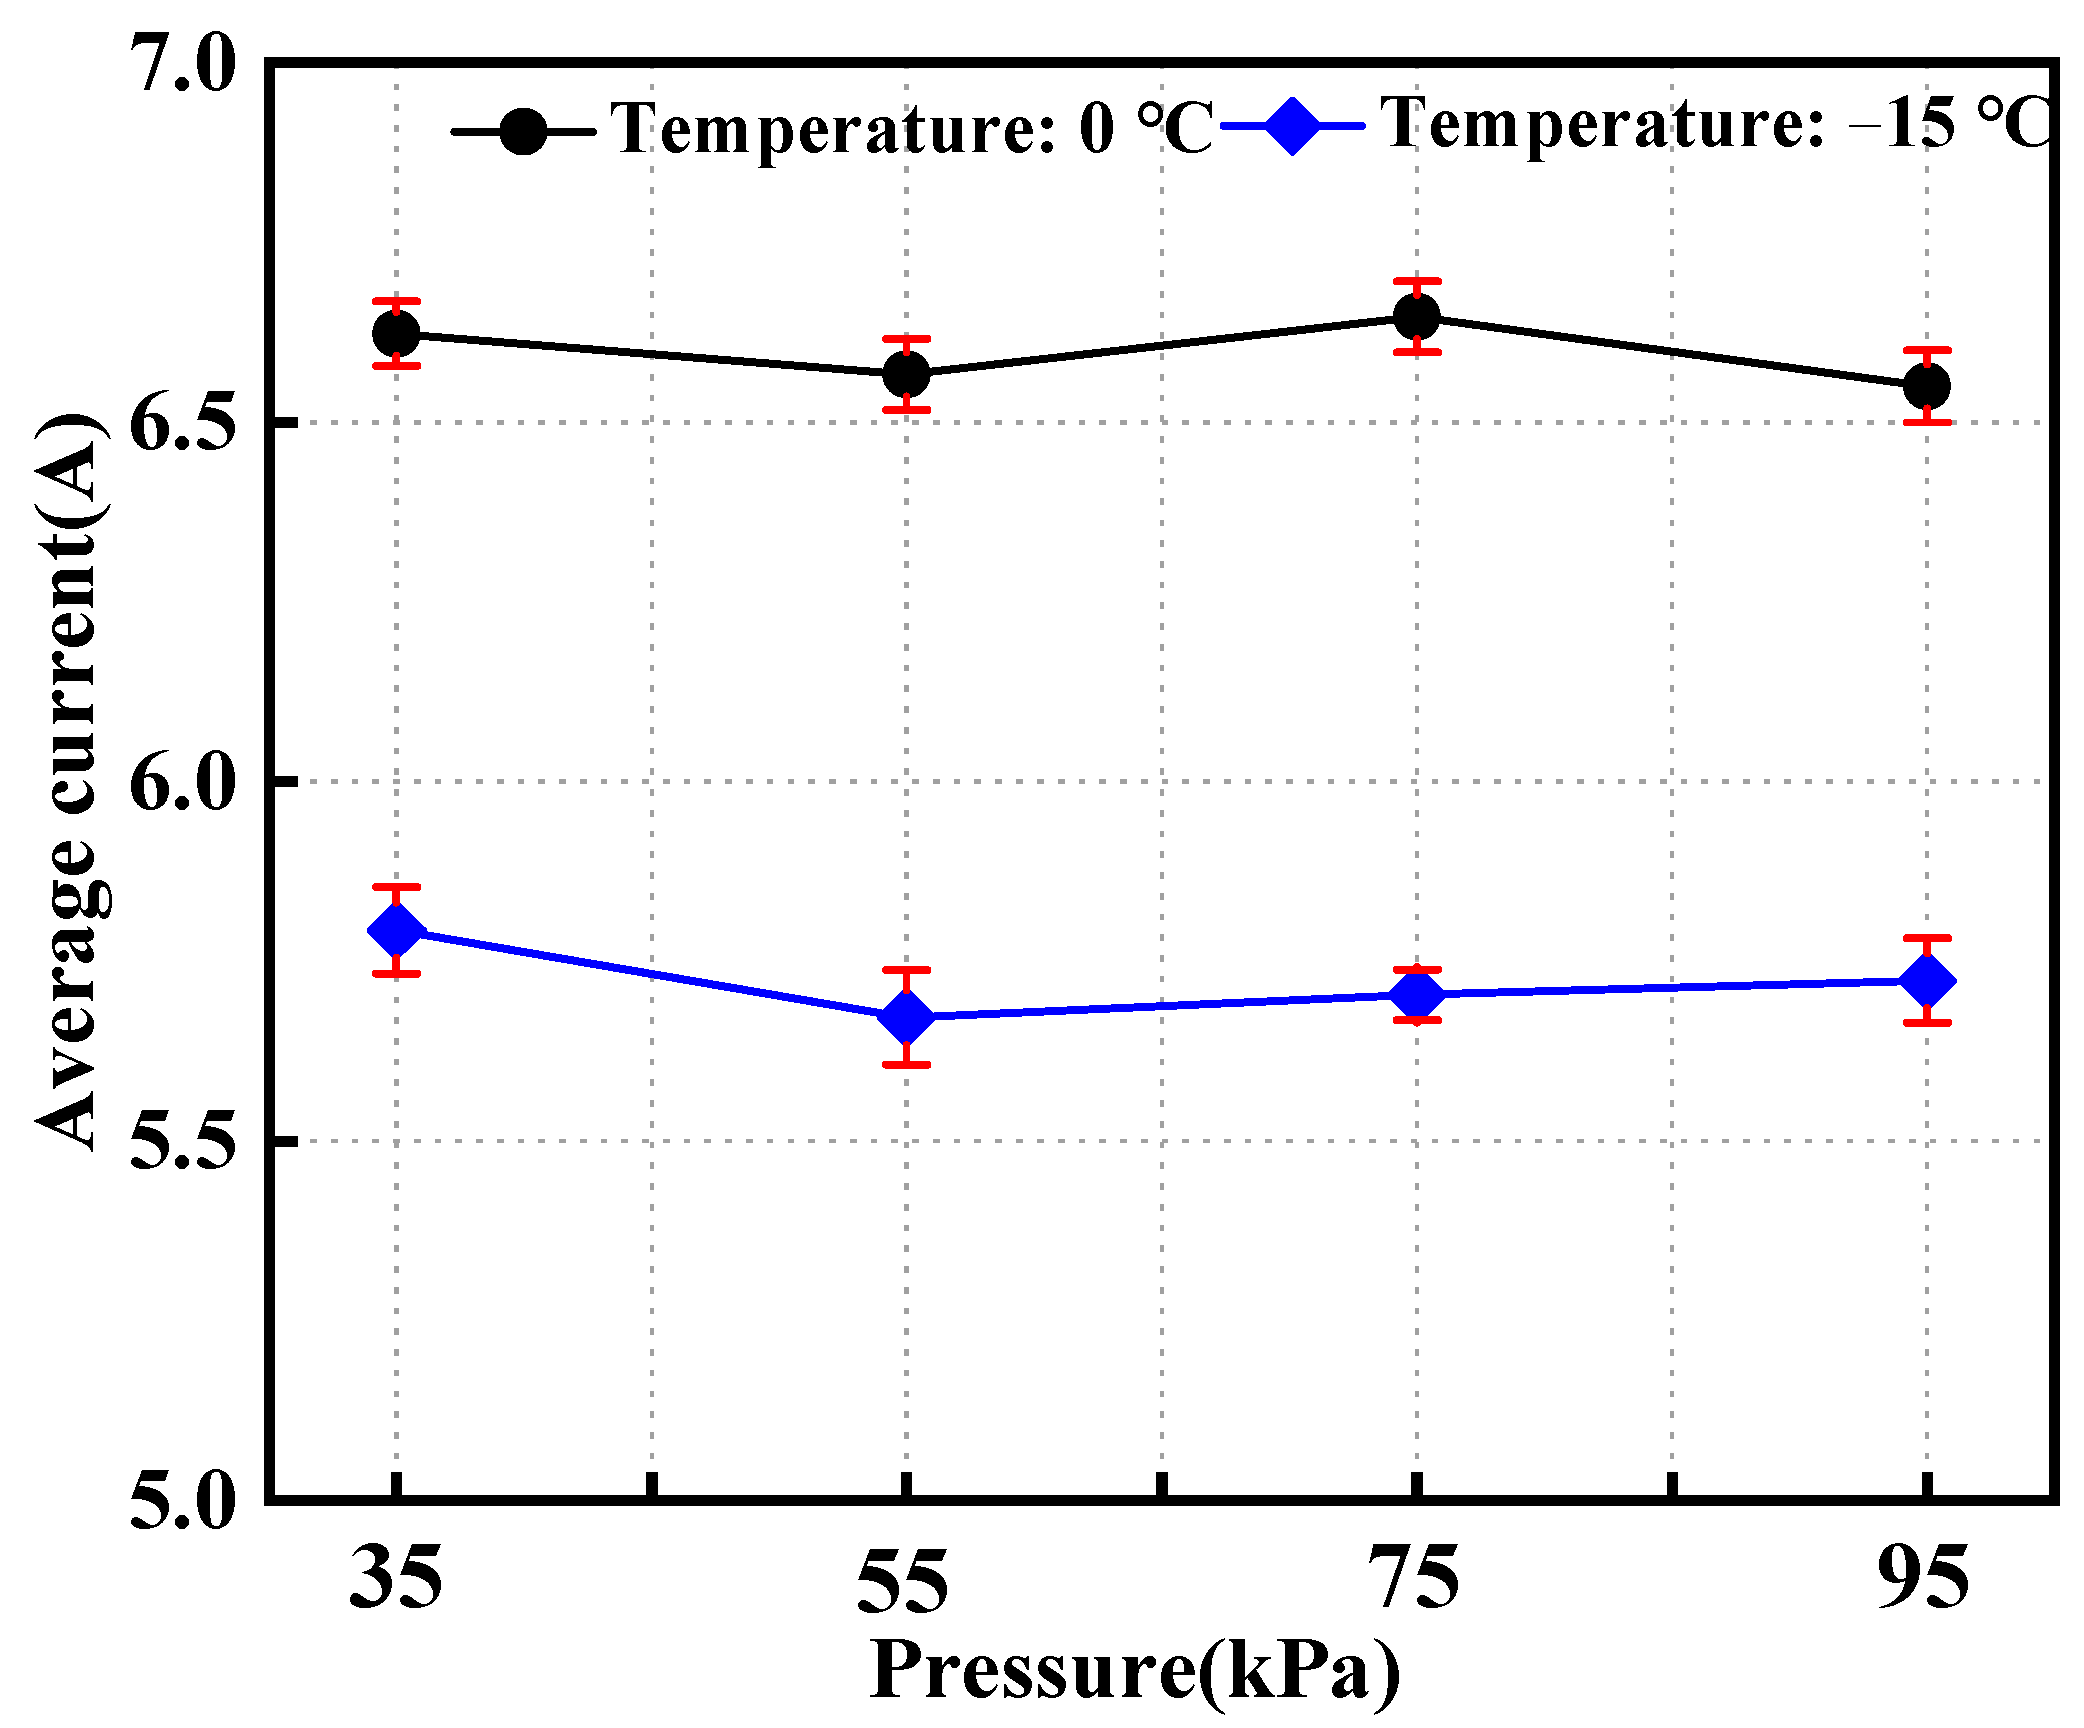
  • As the temperature decreased, the average current after the motor stabilized during startup increased. The changes in the ambient pressure had a relatively small impact on the average starting current, with a variation rate of no more than 2%.
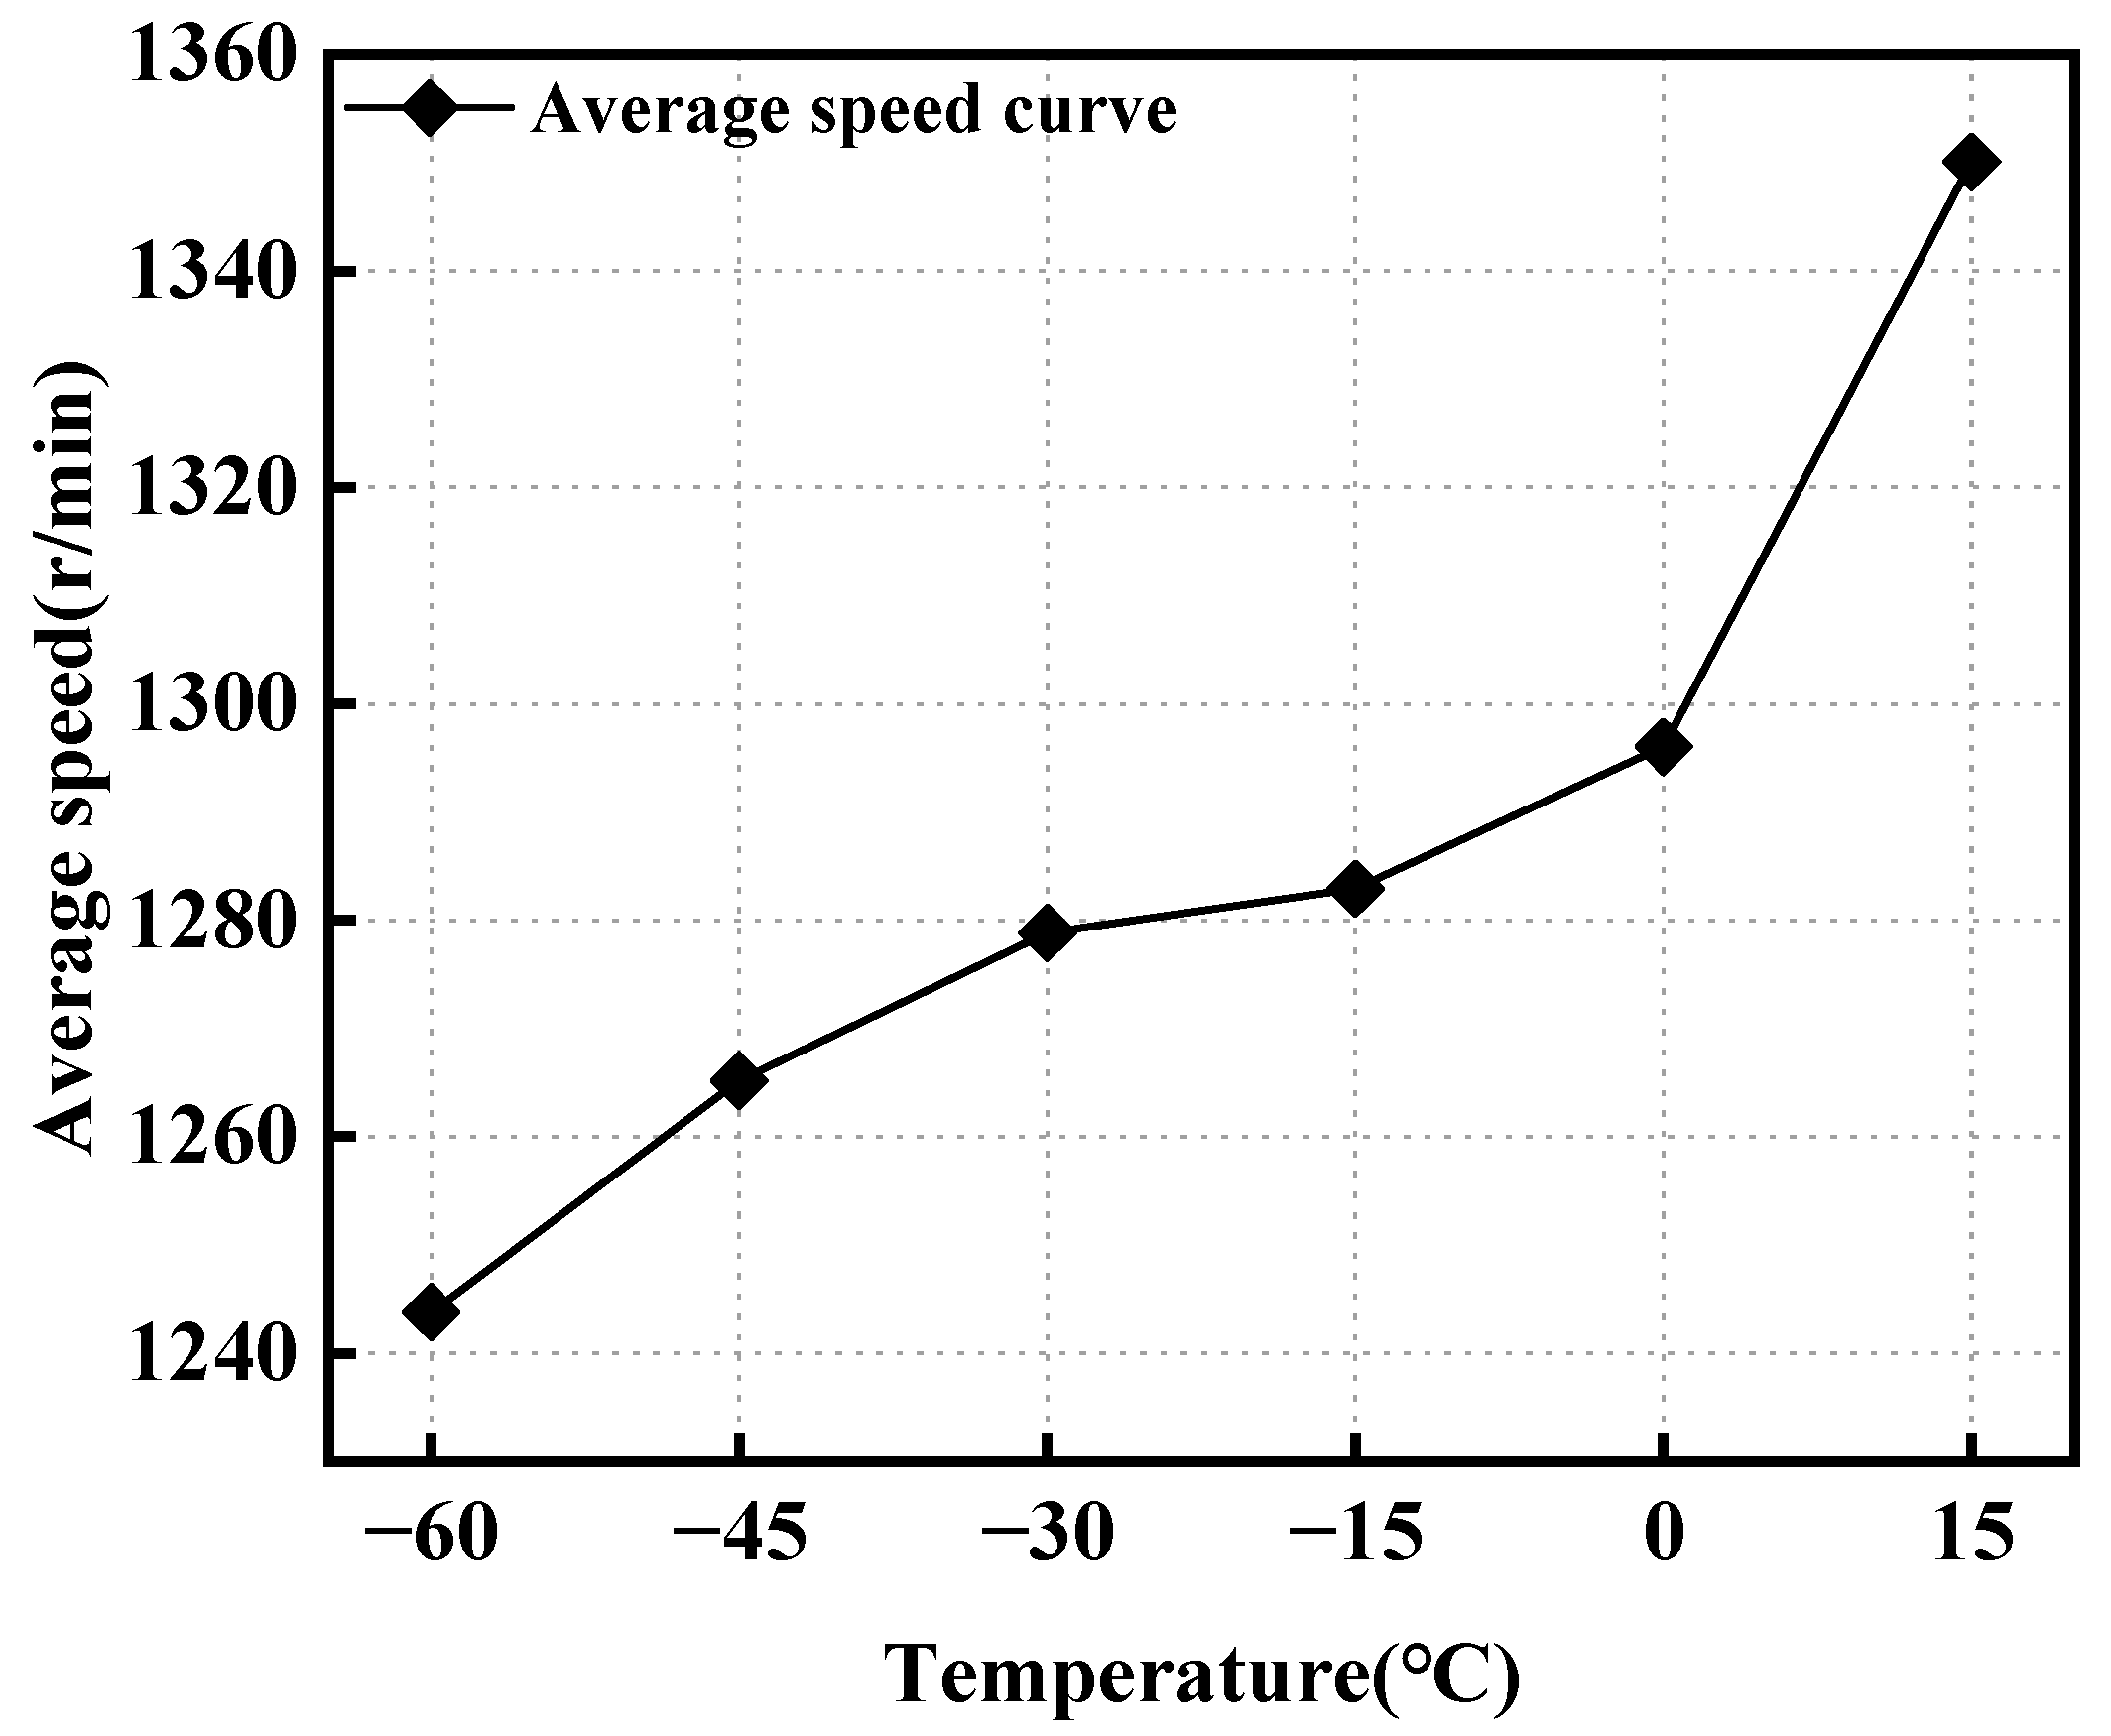
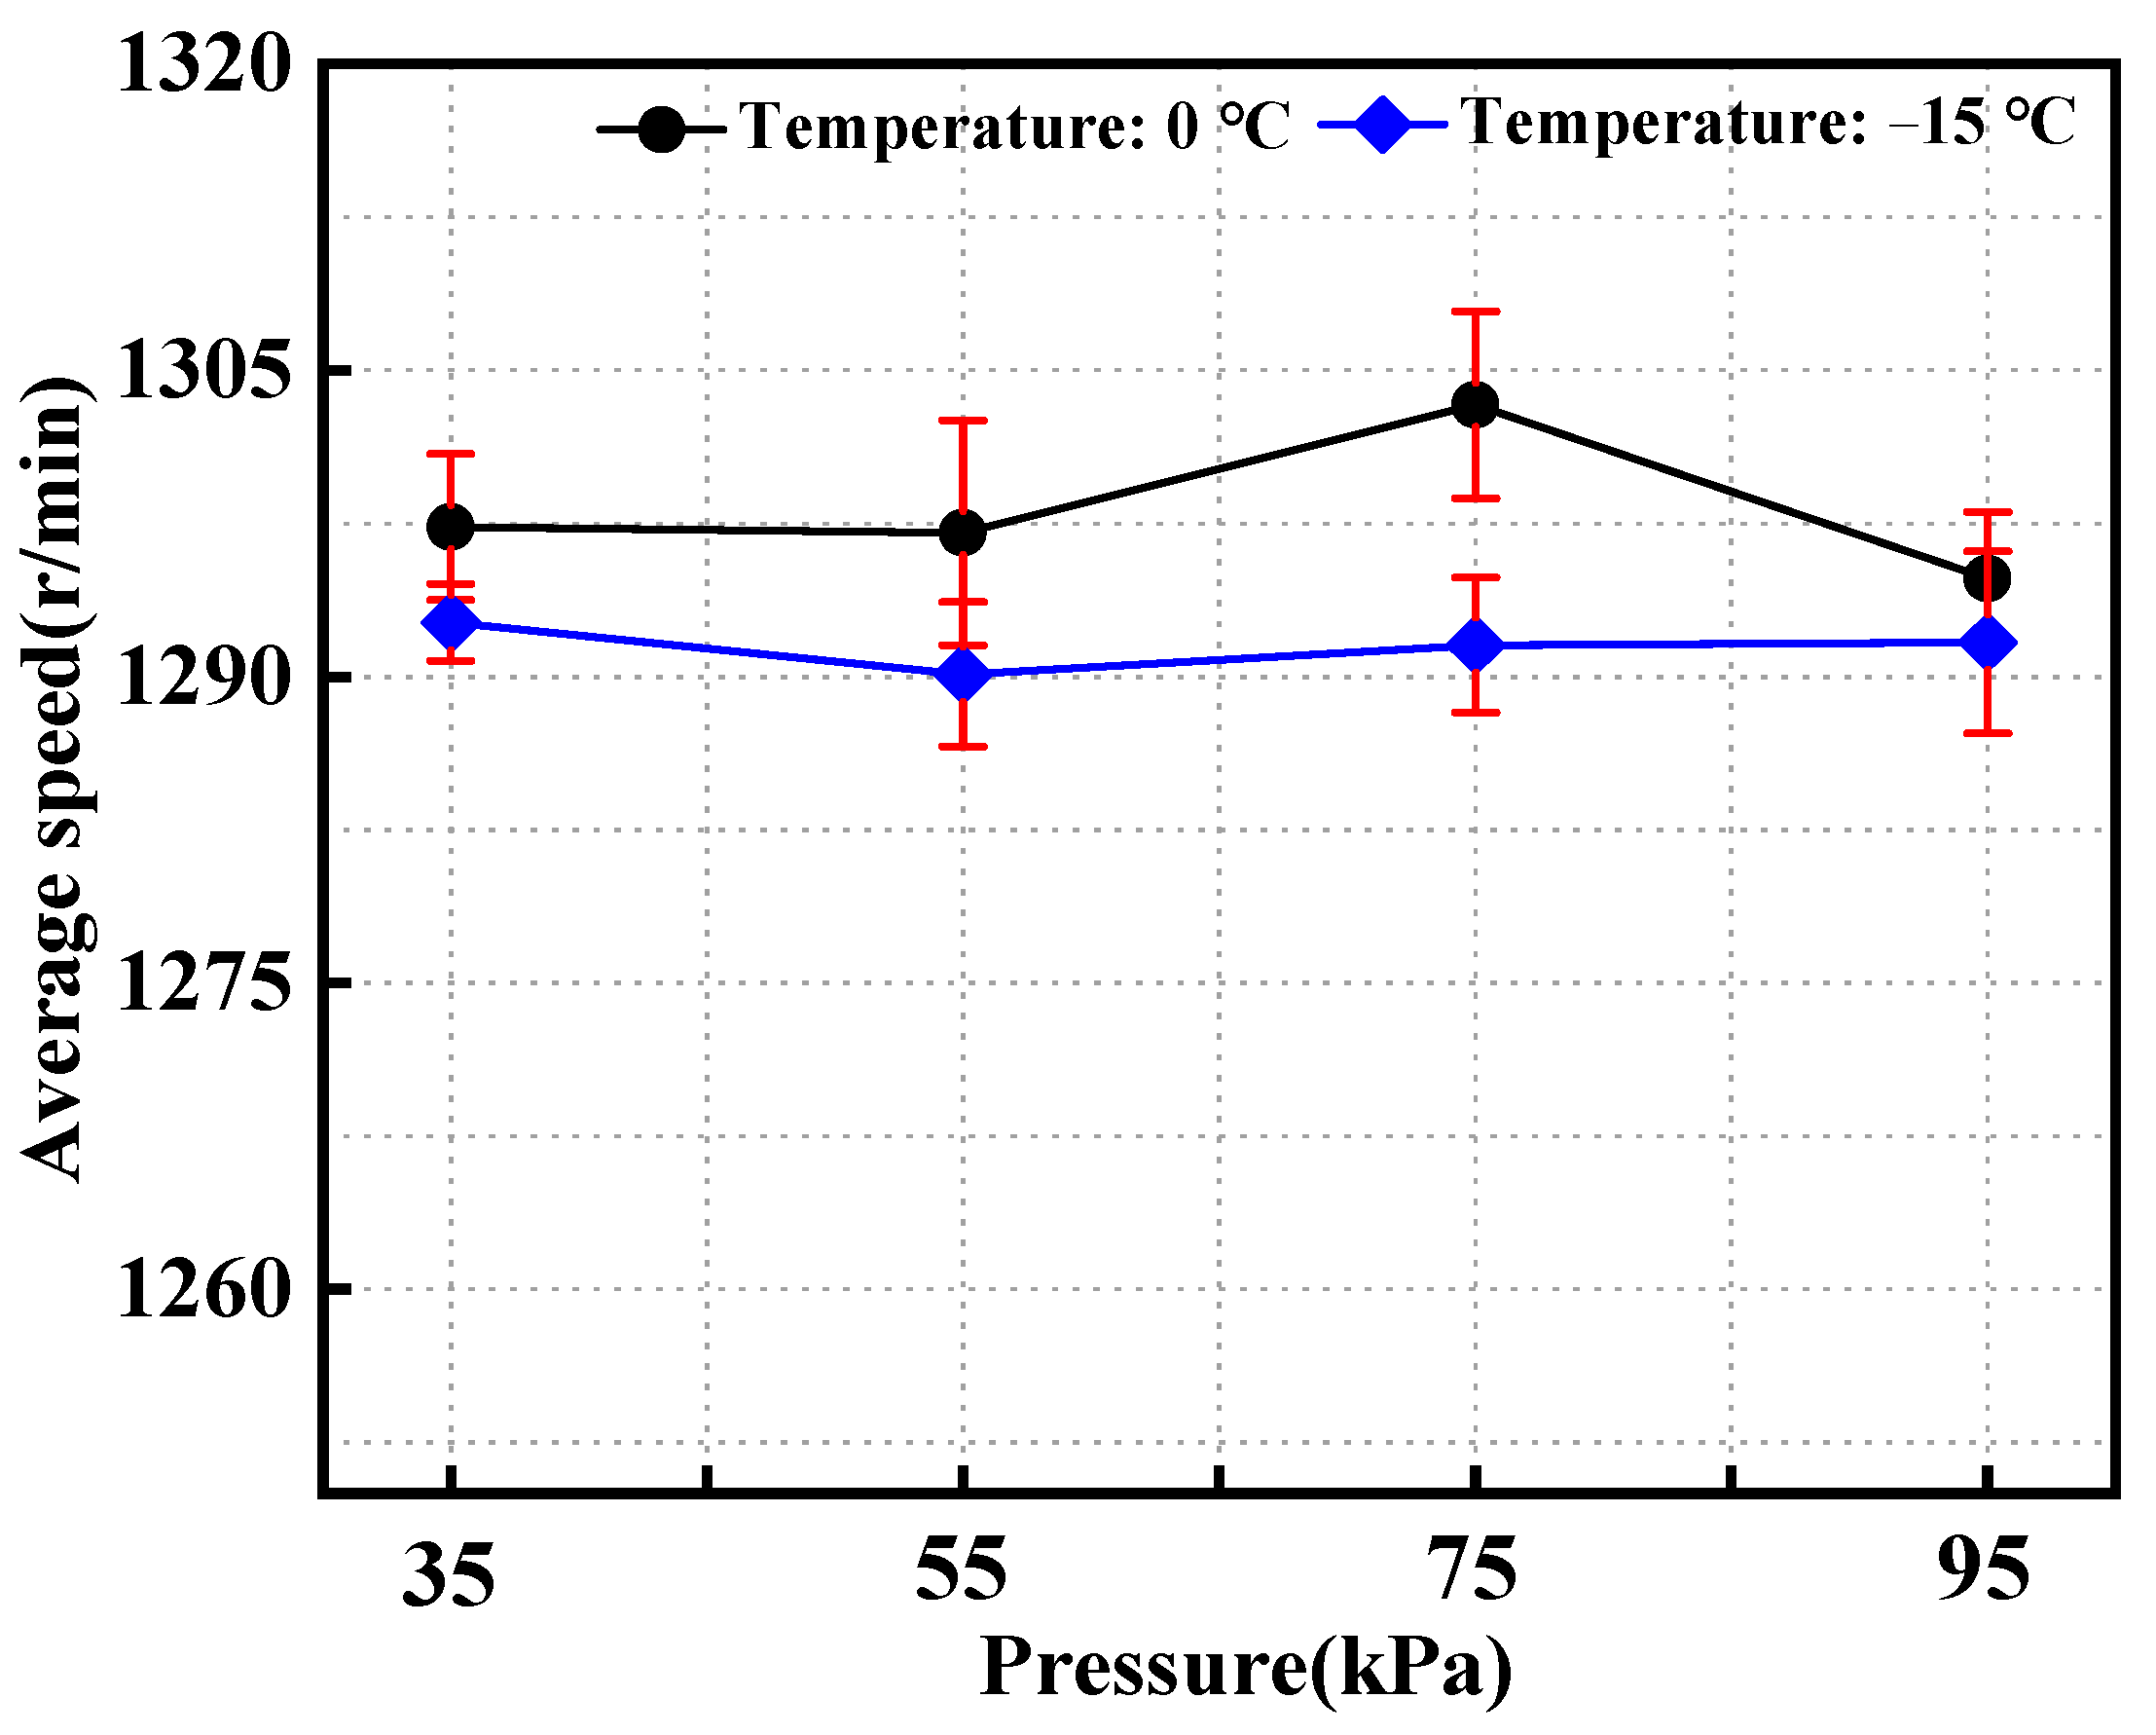
  • Within the temperature range of −60 °C to +15 °C, the average speed decreases by 106.20 r/min as the temperature decreases. The impacts of ambient pressure changes on the average starting speed were minimal, with a variation rate of no more than 0.5%.

Author Contributions

Data curation, X.B.; Funding acquisition, Z.H., Z.Z. and J.F.; Investigation, W.T. and L.W.; Methodology, W.T.; Project administration, Z.H.; Resources, Z.H. and Z.Z.; Software, X.W.; Supervision, X.W.; Writing—original draft, L.W.; Writing—review and editing, W.T., L.W., X.B., Z.H., Z.Z., Y.W., Y.Y. and J.F. All authors have read and agreed to the published version of the manuscript.

Funding

This research was funded by the Sichuan Science and Technology Program [grant number 2024ZDZX0042, 2023NSFSC0836], the Open Research Subject of Key Laboratory of Fluid Machinery and Engineering (Xihua University), Sichuan Province (grant number LTJX-2024005), and the Chunhui Plan of the Ministry of Education of the People’s Republic of China [grant numbers HZKY20220586, HZKY20220569].

Data Availability Statement

The data presented in this study are available on request from the corresponding author due to ethical and legal reasons.

Conflicts of Interest

The authors declare no conflicts of interest.

Nomenclature

UAVUnmanned air vehicle
DCDirect current
nSpeed of the aviation starting motor
Δ t 1 Time required for the position of the gear plate to pass through the sensor head
Δ t 2 Time required for the missing tooth on the gear plate to pass through the sensor head

References

  1. Liu, R.; Huang, K.; Qiao, Y.; Ji, H.; Wu, H. Atomization Characteristics of low-volatility heavy fuel for low-pressure direct injection aviation piston engines. J. Energy Resour. Technol. 2023, 145, 042304. [Google Scholar] [CrossRef]
  2. Lee, M.; Choi, M.; Yang, T.; Kim, J.; Kim, J.; Kwon, O.; Cho, N. A study on the advancement of intelligent military drones: Focusing on reconnaissance operations. IEEE Access 2024, 12, 55964–55975. [Google Scholar] [CrossRef]
  3. Mayer, M. The new killer drones: Understanding the strategic implications of next-generation unmanned combat aerial vehicles. Int. Aff. 2015, 91, 765–780. [Google Scholar] [CrossRef]
  4. Liu, G.; Ruan, C.; Li, Z.; Huang, G.; Zhou, Q.; Qian, Y.; Lu, X. Investigation of engine performance for alcohol/kerosene blends as in spark-ignition aviation piston engine. Appl. Energy 2020, 268, 114959. [Google Scholar] [CrossRef]
  5. Lei, J.; Xiao, S.; Liu, Y.; Deng, X.; Tian, A.; Dong, L. Multi-objective optimisation of heat transfer and structural strength of aero-piston air-cooled engine cylinder based on orthogonal test. Therm. Sci. Eng. Prog. 2024, 50, 2451–9049. [Google Scholar]
  6. Jiao, N.; Li, Z.; Mao, S.; Sun, C.; Liu, W. Aircraft brushless wound-rotor synchro-nous starter–generator: A technology review. IEEE Trans. Power Electron. 2023, 38, 7558–7574. [Google Scholar] [CrossRef]
  7. Zhou, Q.; Hu, X.; Hu, H.; Ye, B.; Wang, Z. Re-search on a low-cost small UAV technology that can be launched at high altitude. Arsenal Equip. Eng. J. 2022, 43, 128–133 + 203. [Google Scholar]
  8. Li, L.; Zheng, T. Low-cost consumable aircraft and its power development analysis. Aeronaut. Power 2021, 03, 11–14. [Google Scholar]
  9. Takahashi, N.; Morishita, M.; Miyagi, D.; Nakano, M. Examination of magnetic properties of magnetic materials at high temperature using a ring specimen. IEEE Trans. Magn. 2010, 46, 548–551. [Google Scholar] [CrossRef]
  10. Naumoski, H.; Riedmüller, B.; Minkowb, A.; Herr, U. Investigation of the influence of different cutting procedures on the global and local magnetic properties of non-oriented electrical steel. J. Magn. Magn. Mater. 2015, 392, 126–133. [Google Scholar] [CrossRef]
  11. Pronto, A.G.; Neves, M.V.; Rodrigues, A.L. Measurement and separation of magnetic losses at room and cryogenic temperature for three types of steels used in HTS transformers. J. Supercond. Nov. Magn. 2011, 24, 981–985. [Google Scholar] [CrossRef]
  12. Miyagi, D.; Otome, D.; Nakano, M.; Takahashi, N. Measurement of magnetic properties of nonoriented electrical steel sheet at liquid nitrogen temperature using single sheet tester. IEEE Trans. Magn. 2010, 46, 314–317. [Google Scholar] [CrossRef]
  13. Yan, C.; Hu, H.; Li, Z.; Zeng, L.; Pei, R. Performance study of high-speed permanent magnet synchronous motor with amorphous alloy considering temperature effect. Materials 2024, 17, 1928. [Google Scholar] [CrossRef]
  14. Jin, Q. Performance matching of starter and engine. J. Chongqing Univ. Technol. (Nat. Sci. Ed.) 2010, 24, 127–129 + 152. [Google Scholar]
  15. Milojević, S.; Savić, S.R.; Marić, D.; Stopka, O.; Krstić, B.; Stojanović, B. Correlation between emission and combustion characteristics with the compression ratio and fuel injection timing in tribologically optimized diesel engine. Teh. Vjesn. Tech. Gaz. 2022, 29, 1210–1219. [Google Scholar]
  16. Mo, W.; Jiangqiang, E.; Zhao, Y. Research on cold start performance of vehicle diesel engine under severe cold conditions. Intern. Combust. Engine Eng. 2022, 08, 65–67. [Google Scholar]
  17. Kang, J.; Cho, J.; Park, S. Investigation of friction loss characteristics of engine pistons for different engine operating conditions. Int. J. Automot. Technol. 2023, 24, 503–511. [Google Scholar] [CrossRef]
  18. Skulić, A.; Milojević, S.; Marić, D.; Ivanović, L.; Krstić, B.; Radojković, M.; Stojanović, B. The impact of lubricant viscosity and materials on power losses and efficiency of worm gearbox. Teh. Vjesn. 2022, 29, 1853–1860. [Google Scholar]
  19. Baranski, M.; Szelag, W.; Lyskawinski, W. Modelling and experimental verification of temperature effects on back electromotive force waveforms in a line start permanent magnet synchronous motor. COMPEL Int. J. Comput. Math. Electr. Electron. Eng. 2022, 41, 1491–1504. [Google Scholar] [CrossRef]
  20. Agudelo, J.; Agudelo, A.; Pérez, J. Energy and exergy analysis of a light duty diesel engine operating at different altitudes. Rev. Fac. Ing. Univ. Antioq. 2014, 48, 45–54. [Google Scholar] [CrossRef]
  21. Wang, J.; Cao, E. Hazard analysis and solution of temperature change on motor. Mot. Control Appl. 2009, 36, 42–44. [Google Scholar]
  22. Chen, M.; Qiu, M. Study on the magnetic properties of iron core materials at low temperature. China Electr. Energy New Technol. 2003, 22, 35–36. [Google Scholar]
  23. Xu, G. Performance of electrical machines at low temperatures. New Electr. Technol. 1986, 04, 11–13. [Google Scholar]
  24. Hu, M.; Wang, Z.; Qi, L.; Wei, C. Optimization of motor operating characteristics at low temperature based on RBF-CMGA. J. Mot. Control 2008, 12, 655–665. [Google Scholar]
  25. Liu, W.; Lin, H. Low-temperature constant resistance torque and improvement of permanent magnet micromotors. In Proceedings of the 10th Anniversary Celebration of the Establishment of Jiangsu Institute of Electrical Technology and the 2004 Academic Annual Meeting, Jiangsu, China, 22–23 October 2004. [Google Scholar]
  26. Sebastian, T. Temperature effects on torque production and efficiency of PM motors using Nd Fe B Magnets. IEEE Trans. Ind. Appl. 1995, 31, 353–357. [Google Scholar] [CrossRef]
  27. Kong, X.; Wang, F.; Xing, J. Temperature rise calculation of high-speed PM machine based on thermal-circuit method and 3D fluid field method. In Proceedings of the International Conference on Electrical Machines and Systems, Beijing, China, 20–23 August 2011. [Google Scholar]
  28. Capponi, F.G.; Terrigi, R.; De Donato, G. A synchronous axial flux PM machine d, q Axes model which takes into account iron losses, saturation and temperature effect on the windings and the permanent magnets. In Proceedings of the International Symposium on Power Electronics, Electrical Drives, Automation and Motion, 2006. SPEEDAM 2006, Taormina, Italy, 23–26 May 2006; pp. 38–44. [Google Scholar]
  29. Grauers, A.; Kasinathan, P. Force density limits in low-speed PM machines due to temperature and reactance. IEEE Trans. Energy Convers. 2004, 19, 518–525. [Google Scholar] [CrossRef]
  30. Liu, K.; Zhang, Q.; Chen, J. Online multiparameter estimation of nonsalient-pole PM synchronous machines with temperature variation tracking. IEEE Trans. Ind. Electron. 2011, 58, 1776–1788. [Google Scholar] [CrossRef]
  31. Kim, S.; Kim, K.; Son, C. Transient system simulation for an aircraft engine using a data-driven model. Energy 2024, 196, 117046. [Google Scholar] [CrossRef]
  32. Li, Y.; Tian, S.; Lu, Z. Starter matching. Auto Parts 2015, 7, 73–74 + 18. [Google Scholar]
  33. Zhang, L.; Zhang, X.I. Methods for determining the performance requirements of automobile starters. Automot. Electr. Appl. 2000, 3, 6–7. [Google Scholar]
  34. Wang, L. Technical requirements of matching starter for diesel engine. Shaanxi Coal 2008, 6, 98–99. [Google Scholar]
Figure 1. Schematic diagram of the low-temperature and low-pressure starting test platform for aviation starting motors.
Energies 17 06258 g001
Figure 2. Functional diagram of the high-altitude simulation cabin.
Energies 17 06258 g002
Figure 3. Physical drawing of low temperature and pressure starting test platform for aviation starting motor.
Energies 17 06258 g003
Figure 4. Experimental conditions and data processing diagram.
Energies 17 06258 g004
Figure 5. Speed and current curves during the starting process of the aviation starter motor at different ambient temperatures: (a) −60 °C, (b) −45 °C, (c) −30 °C, (d) −15 °C, (e) 0 °C, and (f) 15 °C.
Energies 17 06258 g005
Figure 6. Variation in the peak starting current of the aviation starter motor with temperature.
Energies 17 06258 g006
Figure 7. Variation in the average current of the aviation starter motor with temperature.
Energies 17 06258 g007
Figure 8. Variation in the starting current pulse width of the aviation starter motor with temperature.
Energies 17 06258 g008
Figure 9. Curve of the average speed of the aviation starting motor versus temperature.
Energies 17 06258 g009
Figure 10. Starting speed and current curves of the aviation starter motor at an ambient temperature of 0 °C under different ambient pressures: (a) 35 kPa, (b) 55 kPa, (c) 75 kPa, and (d) 95 kPa.
Energies 17 06258 g010aEnergies 17 06258 g010b
Figure 11. Starting speed and current curves of the aviation starter motor at an ambient temperature of −15 °C under different ambient pressures: (a) 35 kPa, (b) 55 kPa, (c) 75 kPa, and (d) 95 kPa.
Energies 17 06258 g011
Figure 12. Variation in the peak starting current of the aviation starter motor with ambient pressure.
Energies 17 06258 g012
Figure 13. Variation curve of the average starting current of the aviation starter motor with ambient pressure.
Energies 17 06258 g013
Figure 14. Variation curve of the starting pulse width of the aviation starter motor with ambient pressure.
Energies 17 06258 g014
Figure 15. Variation curve of the average speed of the aviation starter motor with ambient pressure.
Energies 17 06258 g015
Table 1. Basic parameters of the high-altitude simulation test cabin.
ItemParameter
ModelGY10000
Cabin size (mm)3500 × 3500 × 6000
Temperature range (°C)−60–50
Temperature fluctuation (°C)±0.5
Pressure limit (kPa)20–95
Total flow (m3/min)70
Mains voltage (V)380
Gross power (kW)150
Table 2. Main parameters of the aviation starting motor.
ItemParameterItemParameter
Starting voltage (V)26–32Power (Kw)1.25 (29 V)
Stator outer diameter (mm)138Length of air gap (mm)0.75
Rotor cooling diameter (mm)152Permanent magnet width (mm)7.9
Rotor inner diameter (mm)139.5Permanent magnet thickness (mm)4
Number of pole pairs20Core length (mm)26.5
Table 3. Main structural parameters of 18 kw class-ignited two-stroke aviation piston engine.
ItemParameter
Cylinder diameter/mm66
Stroke/mm54
Displacement/ml340
Effective compression ratio/-6.715
Crank radius/mm27
Connecting rod length/mm31/6000
Volume before compression/mm364,005.62
Volume after compression/mm39532.29
Table 4. The main parameters of the main test sensor.
EquipmentRangePrecision
Current sensor0–300 A0.01 A
Temperature sensor−200–+200 °C 1.00 °C
Pressure sensor0–100 kPa1.00 kPa
Angular velocity sensor50–5000 HZ1.00 HZ
Disclaimer/Publisher’s Note: The statements, opinions and data contained in all publications are solely those of the individual author(s) and contributor(s) and not of MDPI and/or the editor(s). MDPI and/or the editor(s) disclaim responsibility for any injury to people or property resulting from any ideas, methods, instructions or products referred to in the content.

