Article

Heat Transfer Mechanism Study of an Embedded Heat Pipe for New Energy Consumption System Enhancement

by
Yuanlin Cheng
1,
Hu Yu
1,
Yi Zhang
1,*,
Shu Zhang
1,
Zhipeng Shi
1,
Jinlin Xie
1,
Silu Zhang
1 and
Changhui Liu
2,*
1
China Energy Engineering Group, Hunan Electric Power Designing Institute Co., Ltd., Changsha 410007, China
2
School of Low-Carbon Energy and Power Engineering, China University of Mining and Technology, Xuzhou 221116, China
*
Authors to whom correspondence should be addressed.
Energies 2024, 17(23), 6162; https://doi.org/10.3390/en17236162
Submission received: 31 October 2024 / Revised: 21 November 2024 / Accepted: 3 December 2024 / Published: 6 December 2024
(This article belongs to the Collection Advances in Heat Transfer Enhancement)

Abstract

:
Aiming at the demand for new energy consumption and mobile portable heat storage, a gravity heat pipe with embedded structure was designed. In order to explore the two-phase heat transfer mechanism of the embedded heat pipe, CFD numerical simulation technology was used to study the internal two-phase flow state and heat transfer process of the embedded heat pipe under different working conditions. The evolution law of the internal working medium of the heat pipe under different working conditions was obtained. With the increase in heating power, it is easier to form large bubbles and large vapor slugs inside the heat pipe. When the heating power increases to a certain extent, the shape of the vapor slugs can no longer be maintained at the bottom of the adiabatic section, and the vapor slugs begin to break and merge, forming local annular flow. When the filling ratio (FR) is relatively low, the bubble is easy to break through the liquid level and rupture, unable to form a vapor slug. With the increase in FR, the possibility of projectile flow and annular flow in the heat pipe increases. Under the same heating power, the temperature uniformity of the heat pipe becomes stronger with the increase in heating time. The velocity distribution in the heat pipe is affected by the FR. The heating power has almost no effect on the distribution of the velocity field inside the heat pipe, but the maximum velocity is different. At an FR of 30%, there are two typical velocity extremes in the tube near positions of 120 mm and 160 mm, respectively, and the velocity in the tube is basically unchanged above a position of 200 mm. There are also multiple velocity extremes at an FR of 70%, with the maximum velocity occurring near 240 mm.

1. Introduction

The efficient development and utilization of new energy is important to achieving the goals of “carbon peak” and “carbon neutrality” in China. However, the intermittent fluctuation characteristics of new energy such as solar and wind power have led to the problem of “wind and light abandonment” [1,2,3]. Therefore, it is of great significance to improve the level of new energy consumption. The utilization of new energy power for local consumption has become a hot spot of research. Combining the richness of new energy resources and the real demand for clean heating in the western region, the development of clean and efficient heating systems that directly consume new energy resources has a broad prospect. A heat-pipe-based energy storage heating system can directly consume unstable new energy power to realize the efficient coupling of heating, heat transfer, heat storage and heat release processes. A gravity heat pipe is an efficient heat transfer element with simple structure, convenient manufacturing, reliable performance, and other advantages which is widely used in the fields of new energy thermal utilization [4,5,6], energy storage [6,7,8], thermal management, and thermal regulation [9,10,11].
The apparent heat transfer characteristics of a heat pipe can be reflected by parameters such as wall temperature, thermal resistance, and equivalent thermal conductivity [12]. The internal flow characteristics, which correspond to the heat transfer characteristics, are also an important characteristic of the heat pipe, and to some extent, the flow characteristics are the fundamental factors determining the heat transfer characteristics [13]. The heat transfer of a heat pipe mainly relies on the phase change cycle of the internal working medium, including evaporation and condensation, and also including single-phase forced convection and other processes. [14] The heat transfer mechanism is complex, and it is difficult to reproduce the real internal flow heat transfer characteristics only through the experimental method [15]. The rapid development of computer technology has promoted the development of computational fluid dynamics (CFD) and numerical heat transfer (NHT) [16]. CFD numerical simulation can visualize the two-phase flow process and parameter distribution inside the heat pipe [17], and it is an effective means to study its internal flow characteristics [18]. CFD numerical simulation can visualize the two-phase flow process and parameter distribution inside the heat pipe, and is an effective means to study its internal flow characteristics [19].
Zhan et al. [20] conducted CFD simulations on the evaporation and condensation processes inside inverted U-tubes and gravity heat pipes, and the results showed that CFD can achieve numerical simulation of vapor–liquid two-phase flow and the evaporation and condensation processes. Shen et al. [21] carried out numerical simulation of evaporation and condensation characteristics inside the parallel-flow heat pipe used for the recovery of building exhaust air conditioning based on the volume of fluid (VOF) model and the user-defined function (UDF) program for evaporation and condensation. It was found that evaporation mainly occurs inside the liquid pool, that condensation occurs mainly in the near-wall area of the condensing and adiabatic sections, and that the phase change mass transfer process is a key factor for ensuring the high-efficiency heat transfer of the heat pipe. Chen et al. [22] observed the phenomena of heat storage, subcooled boiling, superheated boiling, vapor eruption, and liquid replenishment in the intermittent flow process through the visualization method. The results show that the boiling period decreases dramatically with the increase in heat load until the boiling period is very low and then disappears completely, and intermittent boiling is more likely to occur at larger geometric ratios. Asghar et al. [23] simulated the vapor–liquid two-phase flow as well as simultaneous evaporation and condensation inside a gravity heat pipe by using the VOF model, and found good agreement between the temperature data and the experimental data in the wall temperature. Zhang et al. [24] simulated the effect of the length of the adiabatic section and condensing section on the two-phase flow and heat transfer process in a two-dimensional heat pipe, and the results showed that the optimal ratio of the lengths of the evaporating section, the adiabatic section, and the condensing section is 10:5:8, in which the heat pipe enters the stable operation for the shortest period of time, the thermal resistance is minimized, and the vortex phenomenon is weakest inside the heat pipe. Saïf et al. [25] simulated the evaporation and condensation processes inside the heat pipe and verified the simulation results with experiments, then analyzed the vapor distribution and velocity distribution at different locations inside the pipe, and finally optimized the structure of the heat pipe [26,27,28]. It was found that the efficiency was increased by 16.05%.
Many scholars have conducted extensive experimental and simulation studies on the designed heat pipes to explore their optimal performance. However, the novel-heat-pipe embedded and aided energy storage system for new energy consumption is still far from practical utilization [29,30,31]. The complexity and invisibility of a heat pipe in an energy storage unit are responsible for this immature research direction [32,33,34]. Herein, in this study, a CFD numerical visualization technique was used to investigate the two-phase flow state and heat transfer process of the embedded heat pipe with different filling ratios (FR) and heating powers with the aim of uncovering the insight behind the heat transfer characteristics of a heat-pipe-based energy storage unit. The evolution behavior of the working fluid of the heat pipe was obtained for the design and optimization of the embedded heat pipe in different working conditions towards providing a theoretical basis for the design and optimization of the embedded heat pipe.

2. Numerical Modeling and Validation

2.1. Physical Model and Meshing

Figure 1a shows the embedded heat pipe in the heat-pipe-based energy storage system. The evaporation and condensation sections of the embedded heat pipe are concentric ring structures, with diameters larger than those of the adiabatic section, and the heating and cooling surfaces are embedded in the heat pipe, with the dimensions as shown in Figure 1b. The total length of the heat pipe is 600 mm, the length of the heating section is 100 mm, the length of the cooling section is 150 mm, and the rest are adiabatic sections with a wall thickness of 1 mm. The motion of the mass inside the heat pipe is a three-dimensional trajectory, which should be simulated using a three-dimensional model, but considering the limited computational resources and the small diameter of the pipe, the motion inside the pipe is mainly along the axial and radial directions, and the tangential motion can be negligible. Therefore, a simplified two-dimensional cross-section is used for modeling, and a hybrid mesh technique is used to discretize the computational domain, as shown in Figure 1c, with a structural mesh in the solid domain of the pipe wall and an unstructured mesh in the fluid domain.

2.2. Materials and Methods

The interior of the heat pipe mainly consists of bubble flow, elastic flow, air plug flow, etc. The vapor–liquid two-phase has an obvious interface, and the volume is basically greater than 10%, which is suitable for use of the VOF model in the Eulerian–Eulerian method.
(1)
Continuity Equation
The volume fraction of the vapor phase is controlled by the vapor phase mass conservation equation [35], while the volume fraction of the liquid phase is solved by summing the total volume fractions to one.
t α v ρ v + · α v ρ v V v = m ˙ l v m ˙ v l
L = 1 n α L = 1
αv—vapor phase volume fraction
ρv—vapor phase density, kg/m3
V v —vapor phase transport rates in vapor–liquid mixed phases, m/s
m ˙ l v , m ˙ v l —Mass transfer rates for evaporation, condensation, kg/s/m3
(2)
Momentum Equation
The momentum equation in the VOF model solves the equation of motion in only one phase of the flow field, and its velocity is the same in both phases [35].
t ρ u + · ρ u u = P + · τ + ρ g + F C F S
The forces acting on the fluid include the traditional volumetric force gravity ρg, the surface force pressure −∇P, the viscous forces ∇·τ, and an additional interphase force surface tension, where the surface tension is modeled by the continuous surface tension model proposed by Brackbill et al. [36] with the addition of the source term FCFS to the momentum equation.
F C F S = 2 σ l v α l ρ l C v α v + α v ρ v C l α l ρ l + ρ v
where C is the surface curvature and σlv is the surface tension coefficient as a function of temperature [37].
σ l v = 0.09805856 1.845 × 10 5 T 2.3 × 10 7 T 2
ρ L = 859.0083 + 1.252209 × T 0.0026429 T 2
(3)
Energy Equation
The energy equation in the VOF model is governed by the temperature (T) and the energy (e) in its equilibrium [37].
t ρ e + · ρ e u = · k · T + · ρ u + S E
e = α l ρ l e l + α v ρ v e v α l ρ l + α v ρ v
e l = C p , l T T s a t
e v = C p , v T T s a t
where k is the thermal conductivity of the mixture, calculated from the phase volume fraction.
k = α l k l + 1 α l k v
where the subscript v refers to the vapor phase and l to the liquid phase.
The purpose of this paper is to analyze the evaporation and condensation phenomena of the work medium in the embedded heat pipe, and the evaporation and condensation models are chosen from the Lee model, in which the mass transfer between evaporation and condensation can be controlled by the equation of vapor phase mass conservation (1). In the Lee model, the evaporation mass transfer rate is defined as a positive value, while the condensation mass transfer rate is defined as a negative value, and the evaporation and condensation mass transfer rates are controlled by the saturation temperatures [37].
If T l > T s a t , then
m ˙ l v = r v α l ρ l T l T s a t T s a t
If T v < T s a t , then
m ˙ v l = r l α v ρ v T s a t T v T s a t
where the saturation temperature is a pressure-dependent parameter, and rv, rl is an adjustment factor that can be interpreted as the reciprocal of the hesitation time.
In this study, the commercial computational fluid dynamics package ANSYS FLUENT 2019 was utilized. The internal area of the heat pipe is set up as a fluid domain, which is made of water and water vapor, with water vapor as the main phase and water as the secondary phase. The wall area is set as solid domain, and the material of the solid domain is copper. The evaporation section is the second type of boundary conditions, the adiabatic section is set as the heat flow density of 0 W/m2, the condensation section is set as the first type of boundary conditions, the interface between the fluid domain and the solid domain is set as the couple boundary conditions, and the saturation temperature is set to 323 K. In order to save the computational resources, the initial temperature of the region is set as the saturation temperature of 323 K, the initial volume fraction of the liquid is set to 0, the liquid volume is computed by choosing the liquid charging rate, and the liquid volume is calculated by using the Mark liquid region and the Patch liquid region. The liquid occupancy rate is defined by filling the Mark liquid region and the Patch region. It is assumed that the tube is absolutely vacuum, and only has two phases including liquid water and water vapor. The above of the heat is filled with water vapor in the initial state.
The VOF two-phase flow model was selected. Considering the influence of gravity, the implicit cumulative force was chosen, and the inter-phase mass transfer mechanism was evaporation–condensation. The turbulence model standard k-e was chosen. The solution method chosen was SIMPLE algorithm with velocity-pressure coupling, and the discretization format of the momentum equation was second-order windward. In order to avoid the blurring phenomenon at the interface of the two phases, the geometric reconstruction method was used for the volume fraction, the PRESTO! algorithm was used for pressure interpolation, and the discretization format of the energy equation was second-order windward. In order to ensure the accuracy of the calculation, the residual convergence criterion was 10−6 for the energy equation and 103 for the rest of the energy equation. The time step was chosen according to the Courant number, which is calculated as follows.
C o = u Δ t Δ x
Under the constant Courant number, the time step is a function of the velocity and the mesh size, and since we do not know the velocity before the calculation, we can only try to calculate the time step, and the method is as follows: Given the maximum number of iterations within a step, as long as each step can converge within the maximum number of iterations, the time step is considered to be usable. We tried different time steps, starting from 0.1 s and gradually decreasing by orders of magnitude. When the time step is too large, the solution diverges. After several calculations, 0.0001 s was finally chosen as the time step.

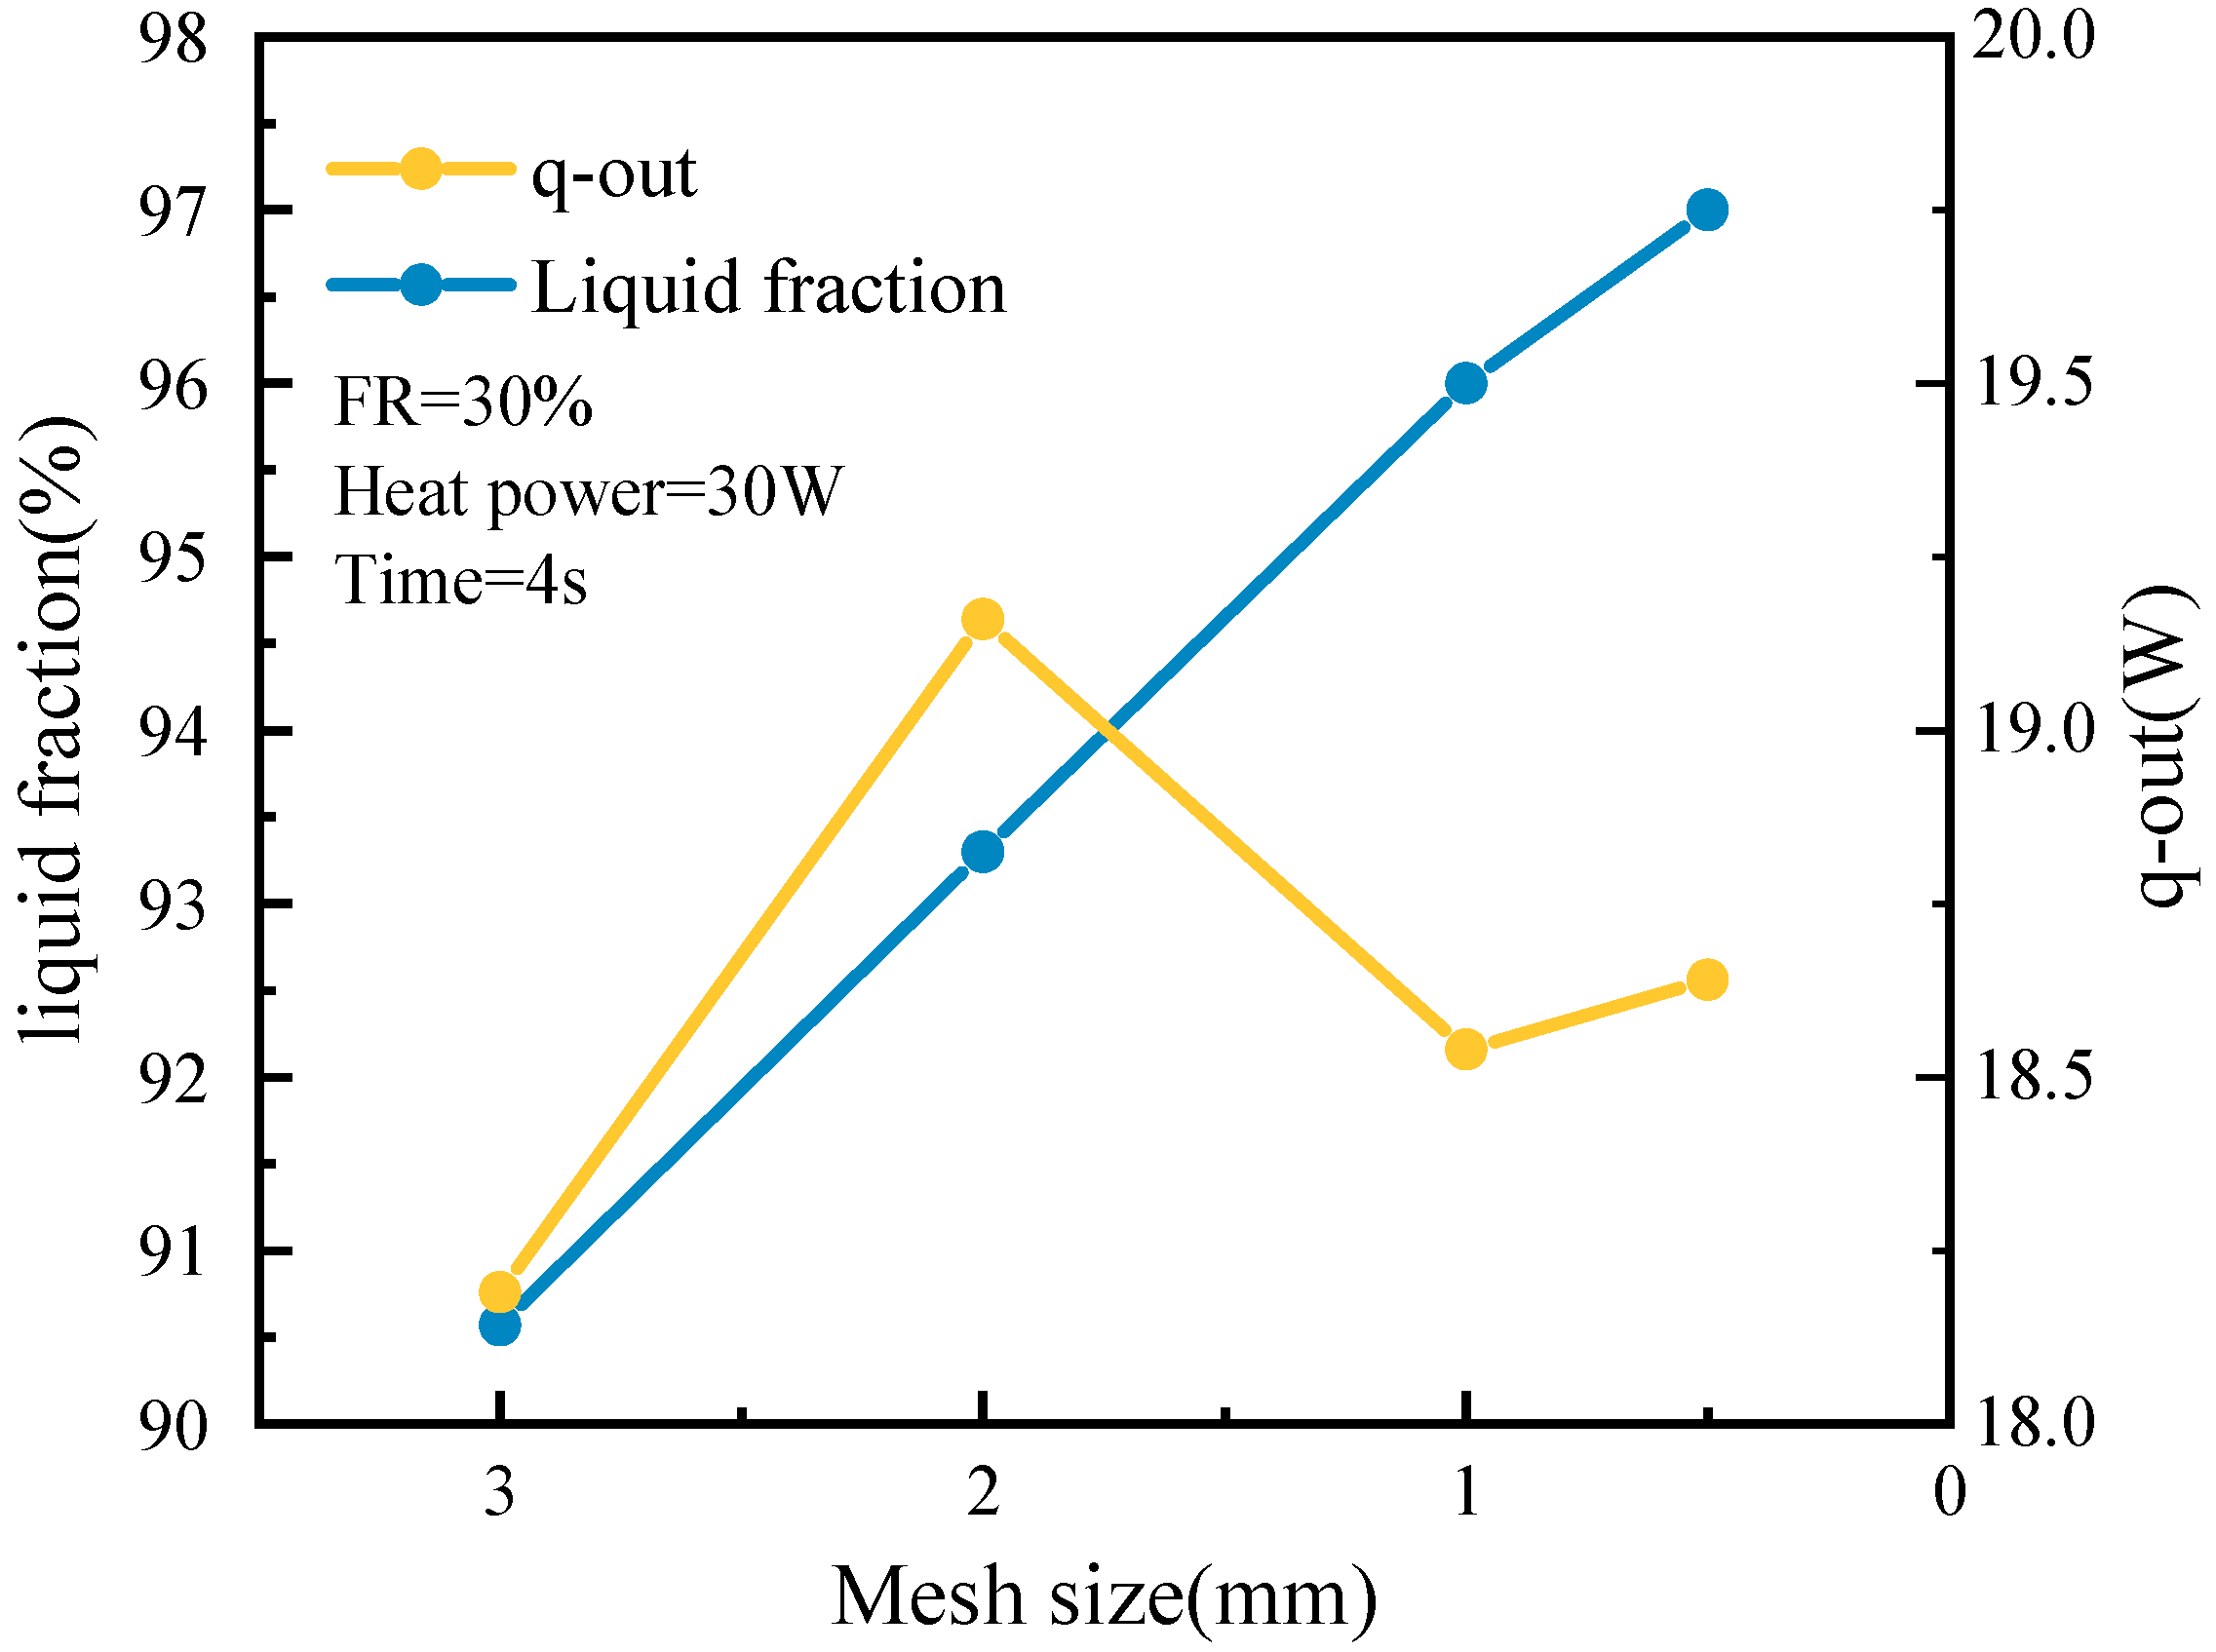
2.3. Grid Independence and Experimental Verification

In this study, different global grid sizes were used for the following calculations: 3 mm, 2 mm, 1 mm, and 0.5 mm. The solid domain, primarily involving heat conduction and thermal storage, showed minimal sensitivity to grid size. A 3-layer structured mesh was used for the solid domain, while in the fluid domain, the first layer of the boundary layer mesh was set to 0.1 mm with a growth rate of 1.2, resulting in a total of 4 mesh layers. With a FR of 30% and a heating power of 30 W, the calculation time was 4 s. As shown in Figure 2, by comparing the liquid phase fraction and the output power, it was observed that increasing the global grid size to 0.5 mm only slightly improved the numerical accuracy by 1.04% compared to the 1 mm grid. Therefore, to save computational resources, a global grid size of 1 mm was selected for subsequent calculations.
As shown in Figure 3a, a comparison between the simulated and experimental data of wall temperatures under a 70% FR and 30 W heating power reveals that the simulation results exhibit a similar trend to the experimentally measured wall temperatures, with a maximum temperature difference of 12 K and a relative error of only 3.9%. The larger temperature difference mainly occurs in the adiabatic section, which is due to the simulation setting the heat flux density of the adiabatic section to 0 W/m2, while in the experiment, it is difficult entirely to avoid heat loss.
The FR and heating power have a large influence on the heat transfer performance of the heat pipe. Figure 3b shows a comparison of the internal flow fields in the heat pipe between experiments and simulations under different FRs and heating power conditions. It can be observed that the internal flow states of both are similar, with the height of the liquid level rise being roughly the same at the same time, but there are slight differences in the number and position of bubbles. The simulation assumes that the heat pipe surface is perfectly smooth, whereas the glass heat pipe for the visualization experiment contains many pits. Additionally, the glass heat pipe is made of quartz, and the material properties such as thermal conductivity, density, and specific heat may vary slightly between different quartz products. Therefore, the material properties of the heat pipe wall cannot be precisely determined during the experiment; this is because the amount of heat obtained by the fluid inside the heat pipe in the experiment and the simulation differs slightly over the same time period. The location of the vaporization nuclei also differs, ultimately leading to differences in the number and position of bubbles. In summary, despite some discrepancies, the simulation results still show a certain degree of reliability. Therefore, this model will continue to be used for simulations under other conditions to analyze the two-phase flow and heat transfer patterns inside the heat pipe.

3. Results and Discussion

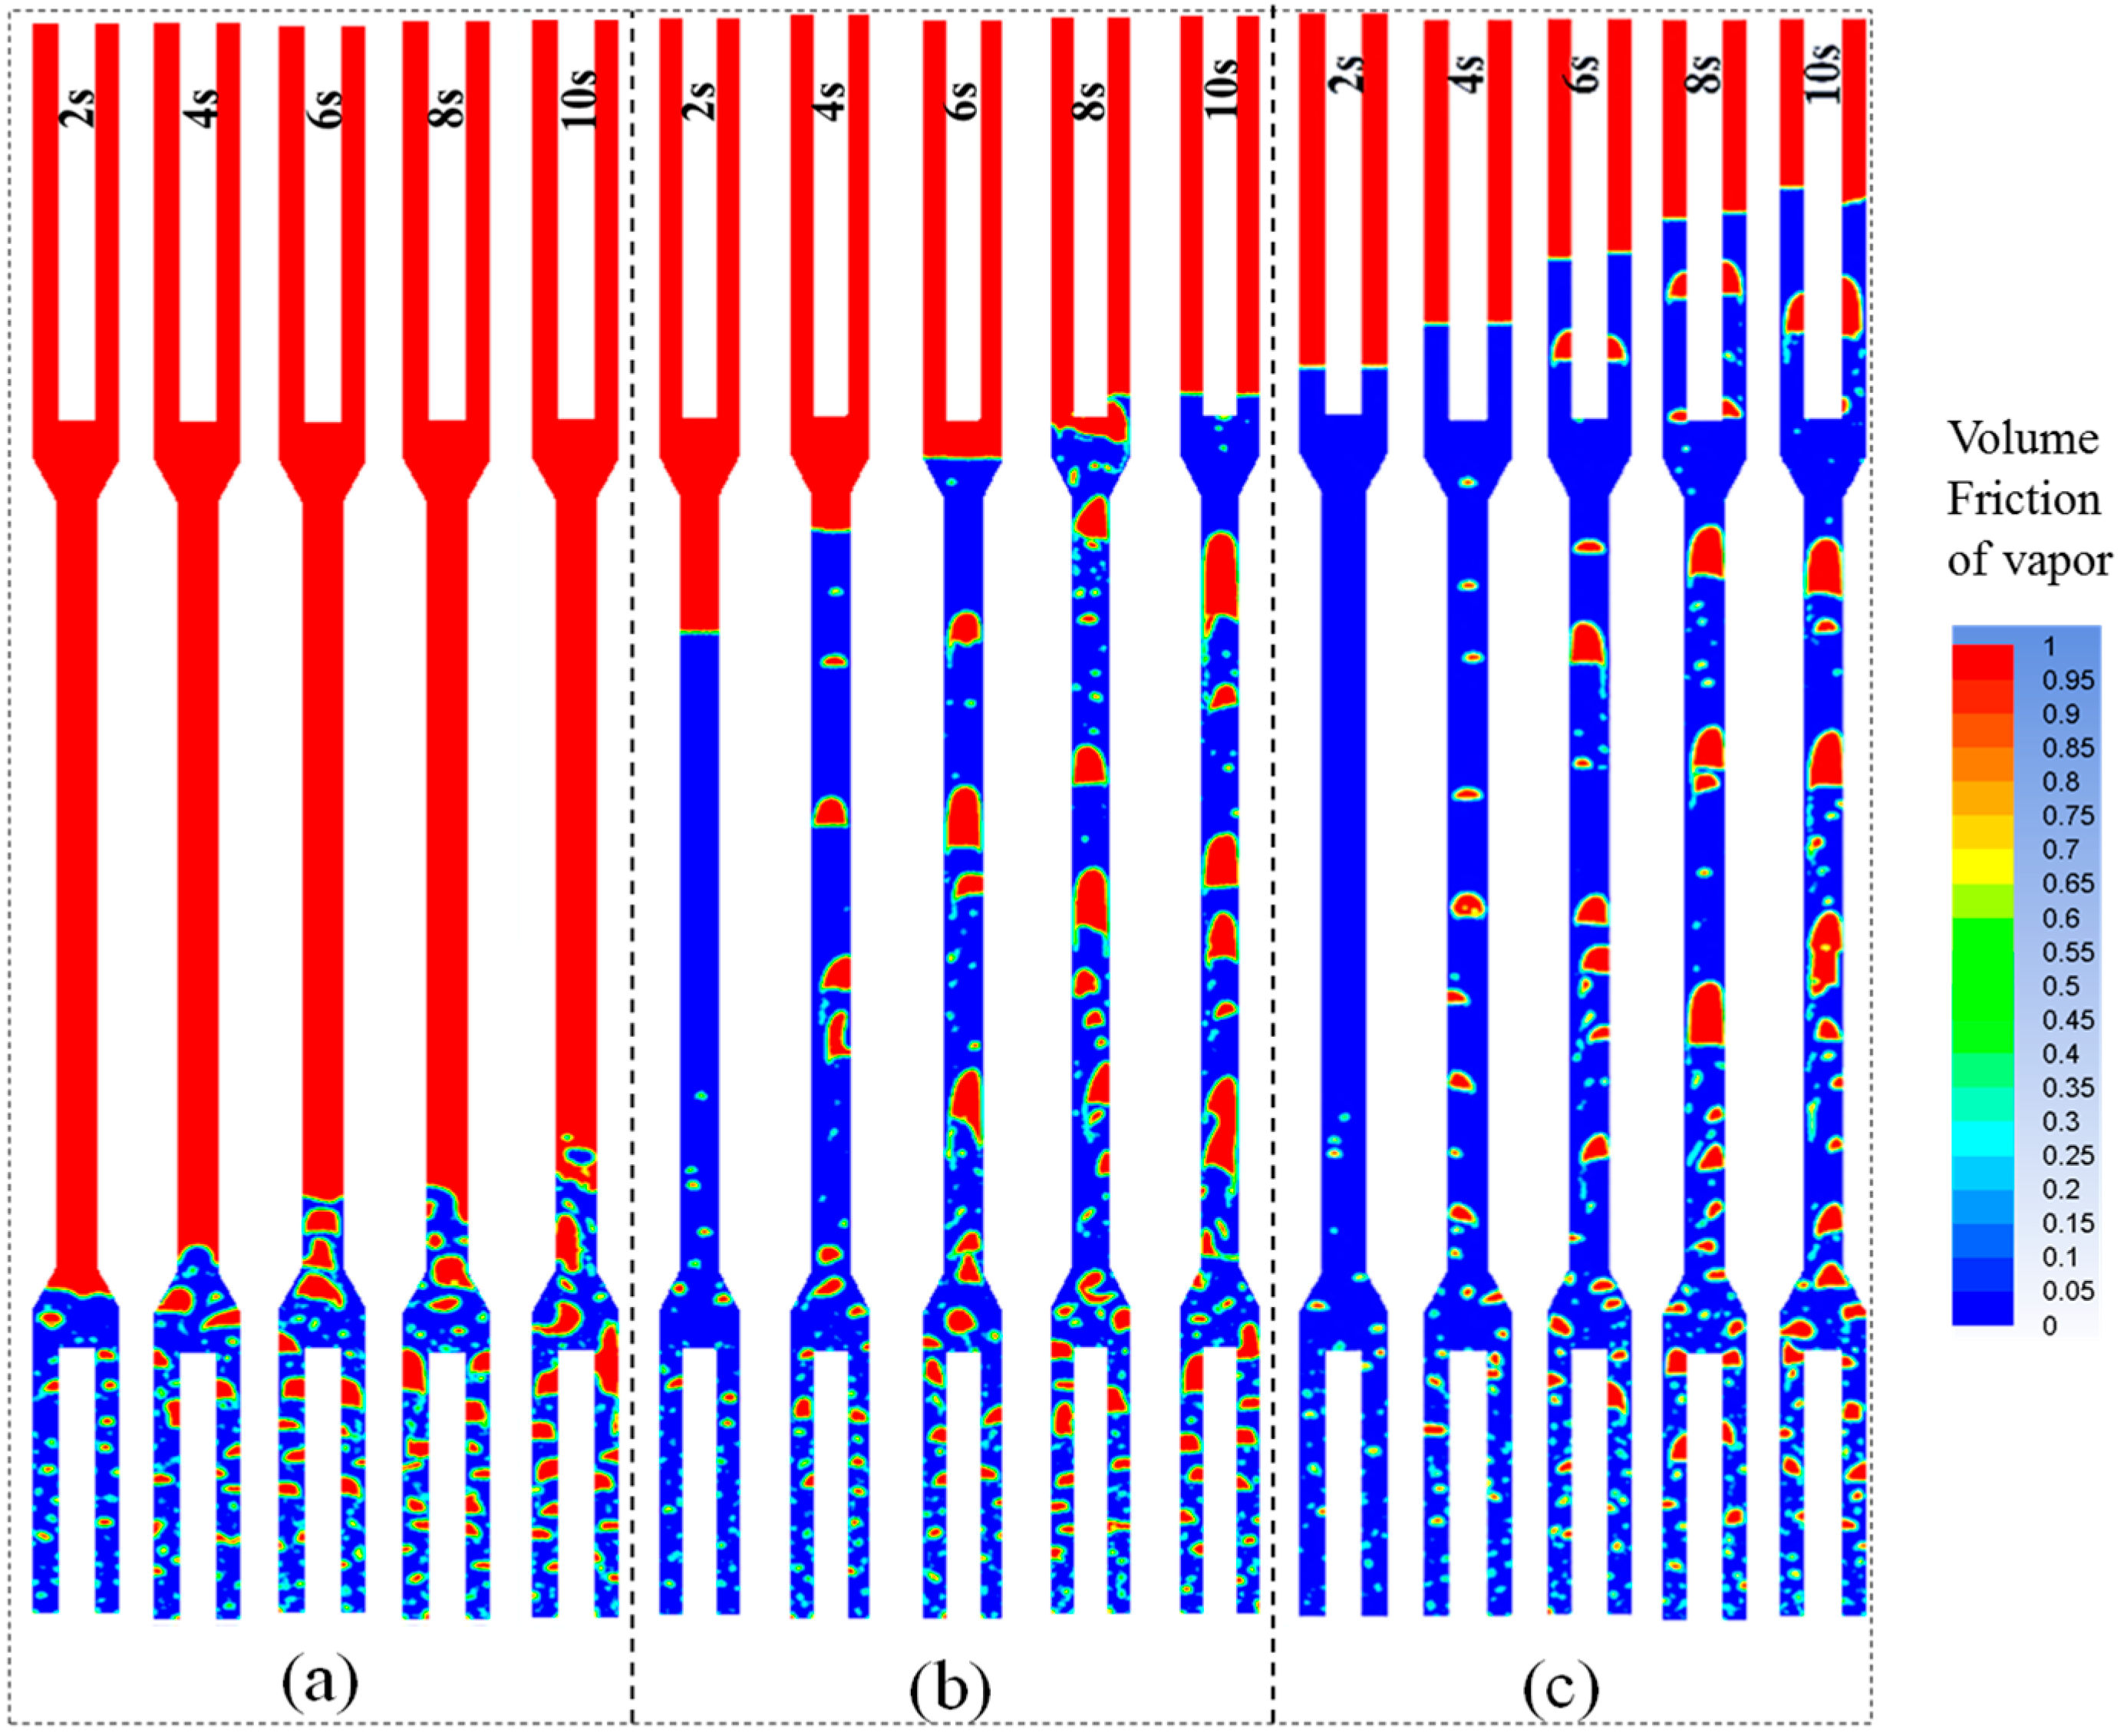
3.1. Flow State Evolution Inside the Heat Pipe

The bubble boiling heat transfer process in the evaporation section of a heat pipe primarily includes multiple stages such as bubble formation, growth, coalescence, detachment, and movement. The growth process of the bubble can be divided into two stages: the early stage and the later stage. In the early stage, when the bubble first forms, its radius is relatively small, and its growth is mainly influenced by inertial forces, surface tension at the vapor-liquid interface, and liquid shear forces. However, at this stage, due to the small size of the bubble, the surface tension is insufficient to balance the pressure difference between the inside and outside of the bubble, causing the bubble to start increasing in size. As the process enters the later stage, with the bubble volume increasing, the pressure inside the bubble weakens, and the pressure difference between the inside and outside of the bubble tends to balance. At this moment, the superheat degree at the bubble surface increases, and the bubble’s growth is primarily controlled by heat transfer. As the bubble continues to grow, its equilibrium state gradually destabilizes, eventually leading to its detachment from the wall. During the growth and movement of the bubble, lateral and vertical coalescence of bubbles may also occur.
Different liquid FRs of the heat pipe affect their internal vapor–liquid distribution. Figure 4a–c shows the vapor–liquid distribution and movement inside the heat pipe at different moments under liquid FRs of 30%, 50%, and 70% and a heating power of 30 W, where red represents the vapor phase and blue represents the liquid phase. From the figures, it can be observed that starting from the saturated state, small bubbles began to form at some vaporization cores at 2 s. These small bubbles grow, merge, and move, with bubbles gradually enlarging and moving upward by 4 s. By 6 s, large bubbles merge in the adiabatic section to form smaller vapor slugs, while the evaporator section continues to produce bubbles. These bubbles keep growing, merging, and moving upward. Once the vapor slugs are formed, they move upward quickly, impacting the bottom of the condenser section. The large vapor slug splits into two smaller vapor slugs, which continue to move upward along the condenser section. By 8 s, the number of vapor slugs increases and continues to rise, with small ring-shaped flows appearing by 10 s. The large vapor slug splits into two smaller vapor slugs, which continue to move upward along the condenser section. By 8 s, the number of vapor slugs increases and continues to rise, with small annular flows appearing by 10 s. Due to the formation and upward movement of the vapor slugs, the liquid level also rises continuously. Although the final liquid level was not reached within the short simulation time, visual experiments suggest that after a certain period, the liquid level will rise to the top of the heat pipe and remain there, with the middle section of the heat pipe being a mixture of vapor and air, and the two ends filled with liquid.

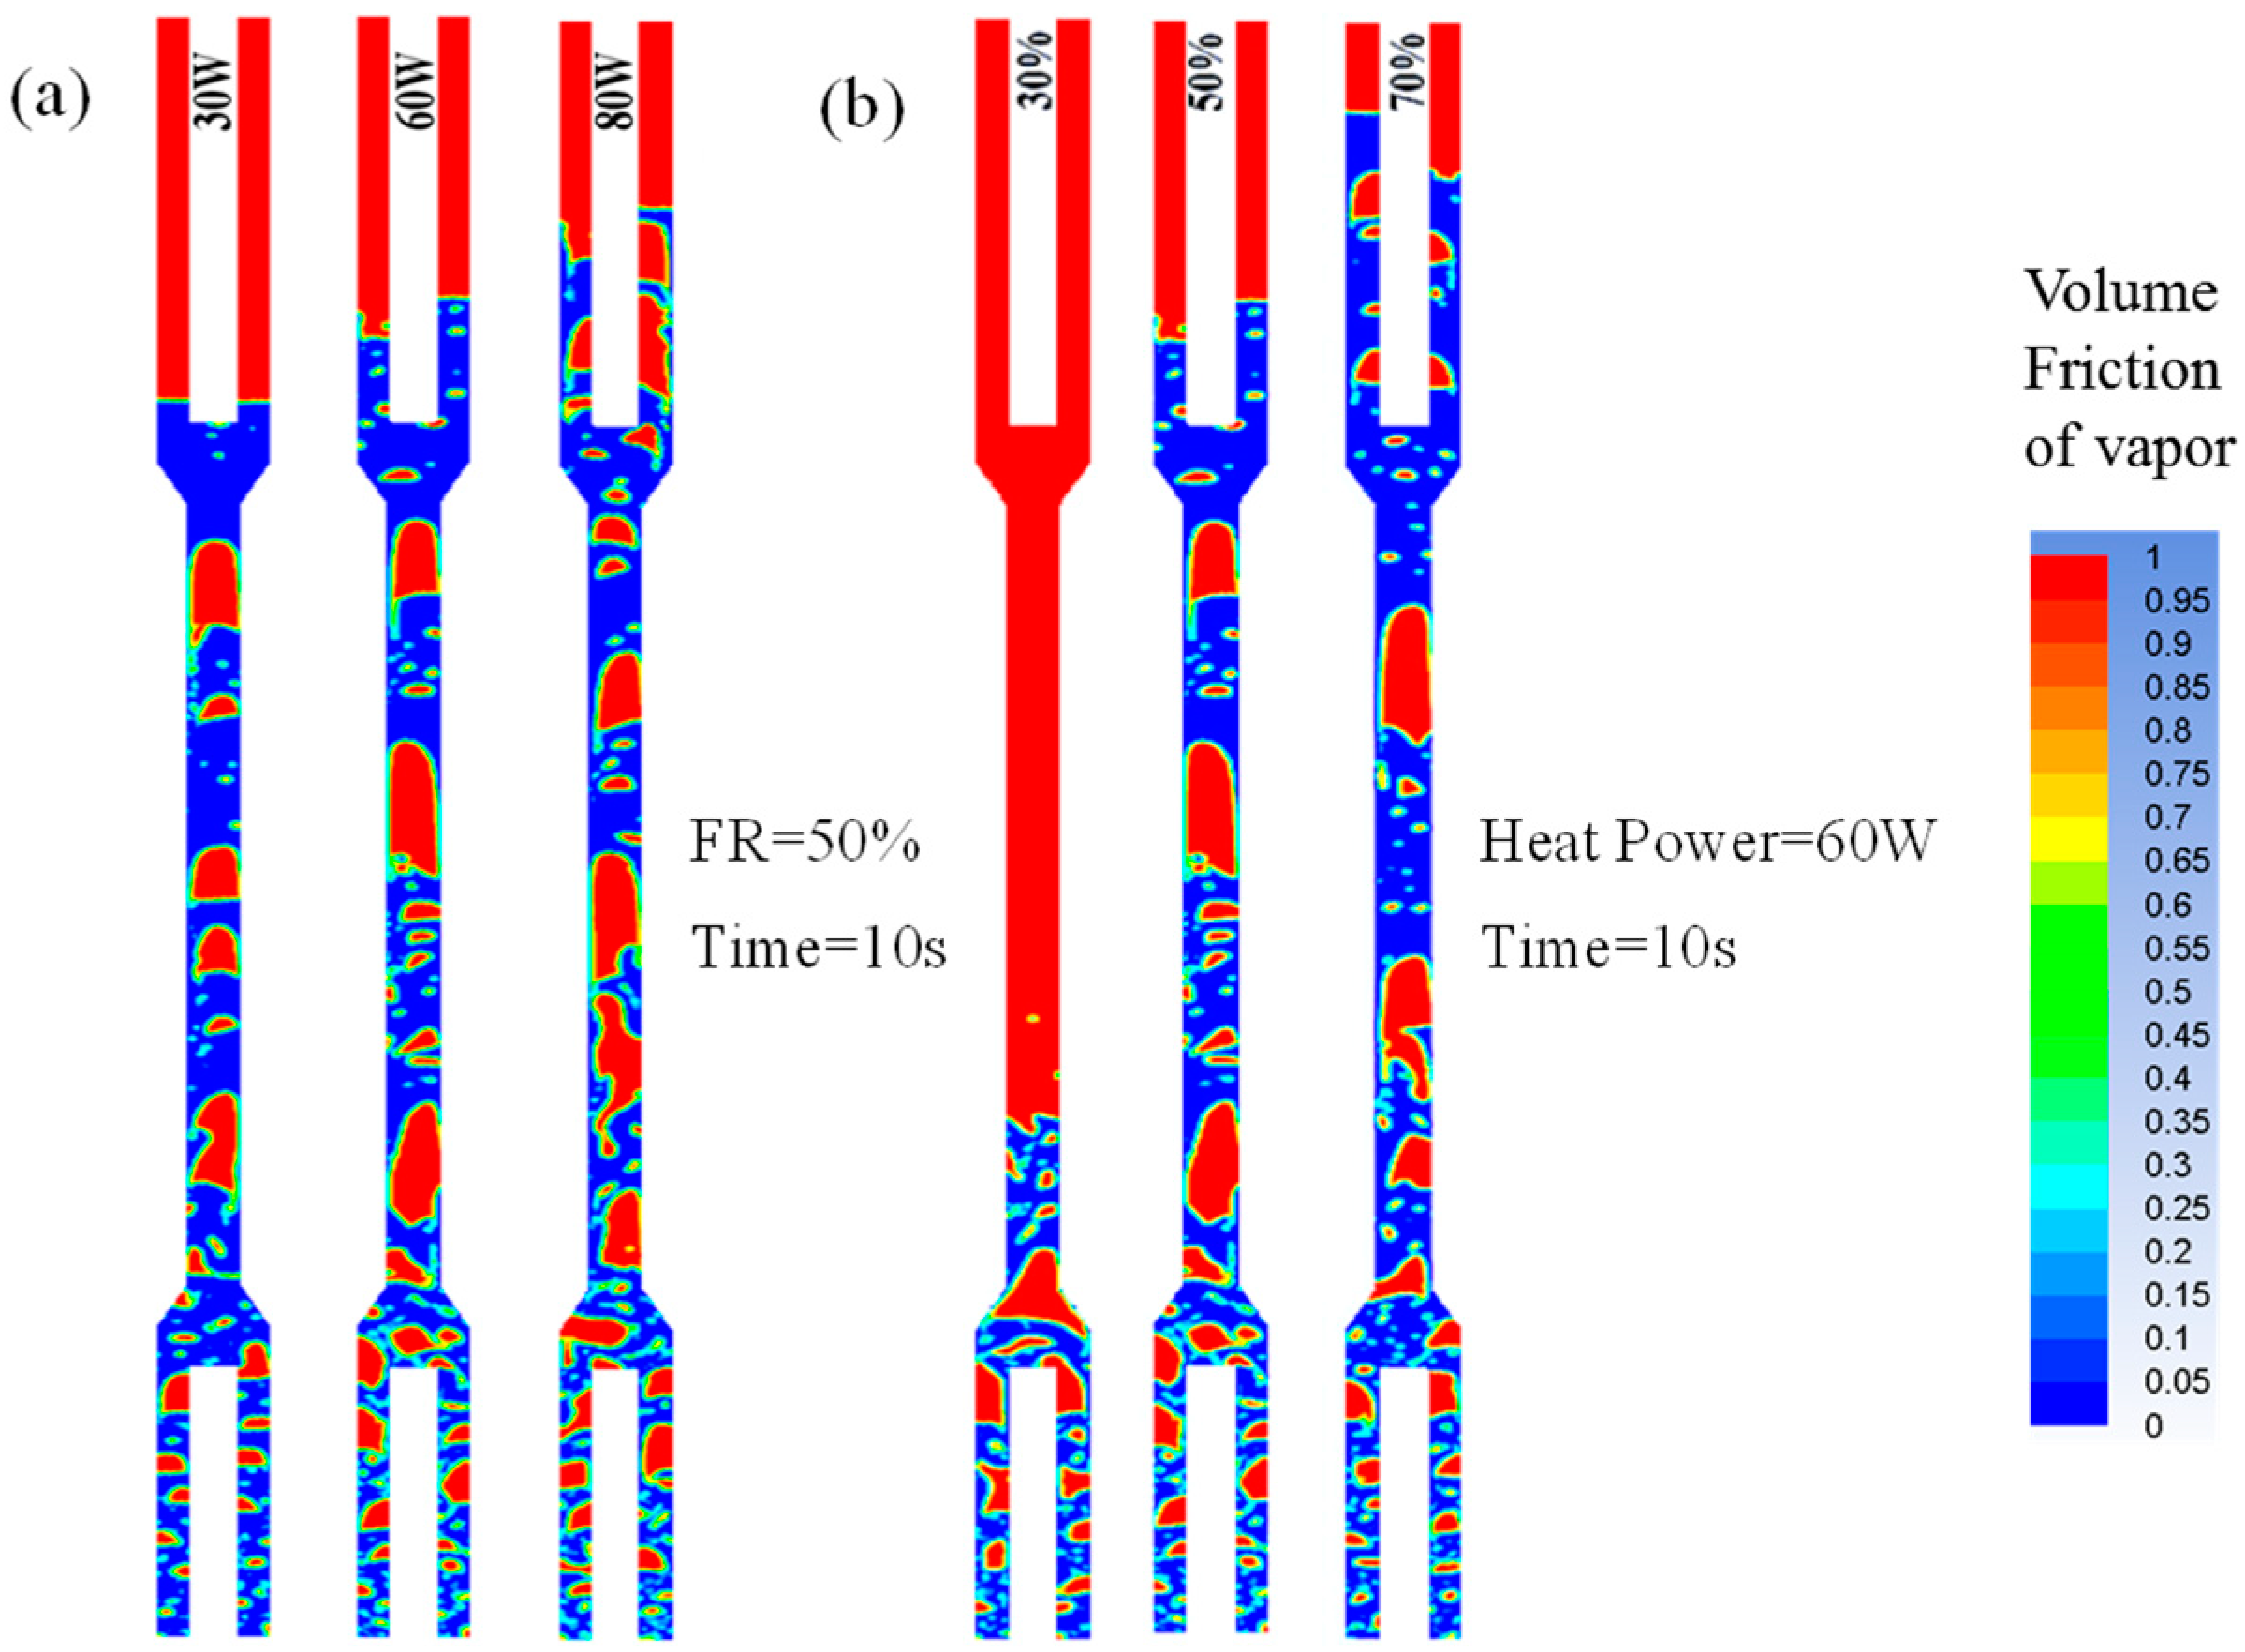
3.2. Comparative Analysis of Two-Phase Flow Patterns in Heat Pipe Under Different Working Conditions

The flow pattern of vapor–liquid two-phase flow inside the heat pipe and the change in the flow pattern have a great influence on the boiling heat transfer process. The development of two-phase flow inside the traditional adiabatic vertical or horizontal pipe generally passes through the bubble flow, elastic flow, annular flow, and atomized flow, and the two-phase flow pattern inside the heat pipe is no more than these. However, the circulation inside the heat pipe is in a closed and limited space, and evaporation and condensation will occur at the same time, so the two-phase flow pattern inside the heat pipe is different from the conditions under which it is generated; this paper analyzes and explains the phenomenon. However, the circulation inside the heat pipe occurs in a closed and limited space, and evaporation and condensation occur simultaneously, so the two-phase flow pattern inside the heat pipe is different from that of an adiabatic vertical or horizontal pipe.
The distribution of vapor and liquid phases in the heat pipe at 10 s under an FR of 50% and a heating power of 30 W, 60 W, and 80 W is shown in Figure 5a. As the heating power increases, the input heat flux in the evaporator section rises, causing the wall temperature to increase. This leads to a higher degree of boiling superheat, an increase in the number of nucleation sites, and a higher rate of bubble formation and detachment. The probability of bubble coalescence also increases, making it easier for larger bubbles and vapor slugs to form. With the increase in heating power, the vaporization rate rises, and the vapor slugs grow larger as they move upward until the surface tension is no longer sufficient to maintain their shape. The vapor slugs then break apart into smaller bubbles, which continue to rise. When the input power reaches 80 W, the vaporization rate further increases, and the bottom of the adiabatic section can no longer maintain the shape of the vapor slugs, leading to their breakup and coalescence, forming a localized annular flow. Additionally, with the increase in input power, the height of the liquid surface rises more within the same time frame, primarily due to the higher input power, increased vaporization rate, and faster movement of the vapor slugs, which more easily break through the liquid surface, causing an increase in the liquid surface height.
Under a heating power of 60 W, the vapor–liquid phase distribution within the heat pipe at the 10 s for FRs of 30%, 50%, and 70% is shown in Figure 5b. At an FR of 30%, the heat pipe is predominantly filled with bubbles, with almost no vapor slugs observed. This is likely due to the lower FR leading to a lower liquid level, where the bubbles generated easily break through the liquid surface, causing them to rupture and making it difficult for the bubbles to merge. At FRs of 50% and 70%, the bubbles are primarily distributed in the evaporator section, while vapor slugs and some smaller bubbles are present in the adiabatic section. The possible reason is that, as the FR increases, the liquid level also rises, allowing the bubbles to travel longer below the liquid surface, thereby increasing the probability of smaller bubbles merging into larger ones. These larger bubbles can then merge into vapor slugs, which during their movement may either break up into bubbles or combine into small vapor columns, resulting in a more chaotic flow pattern.

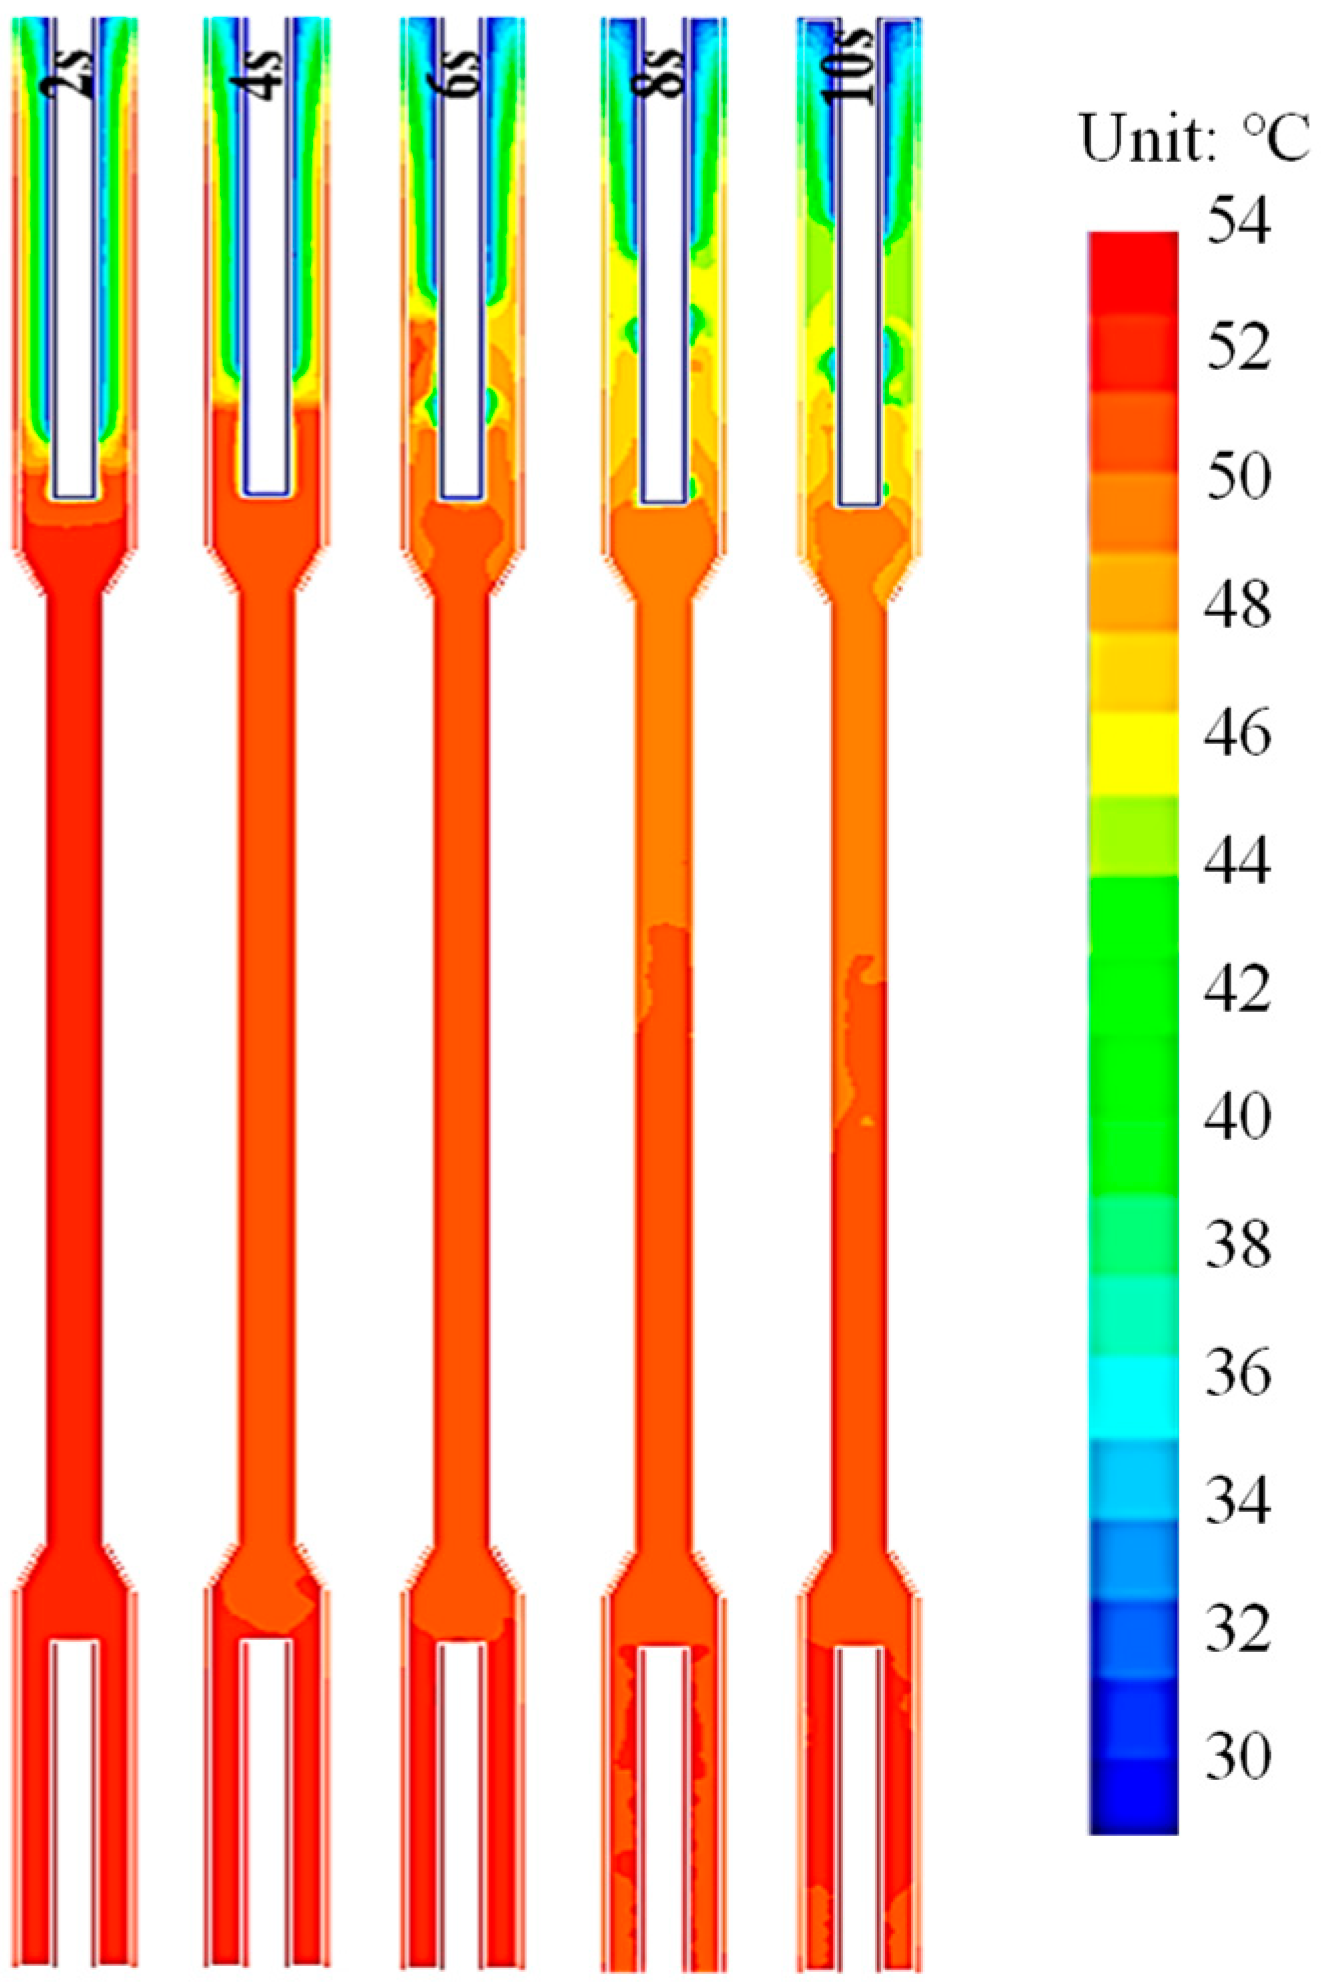
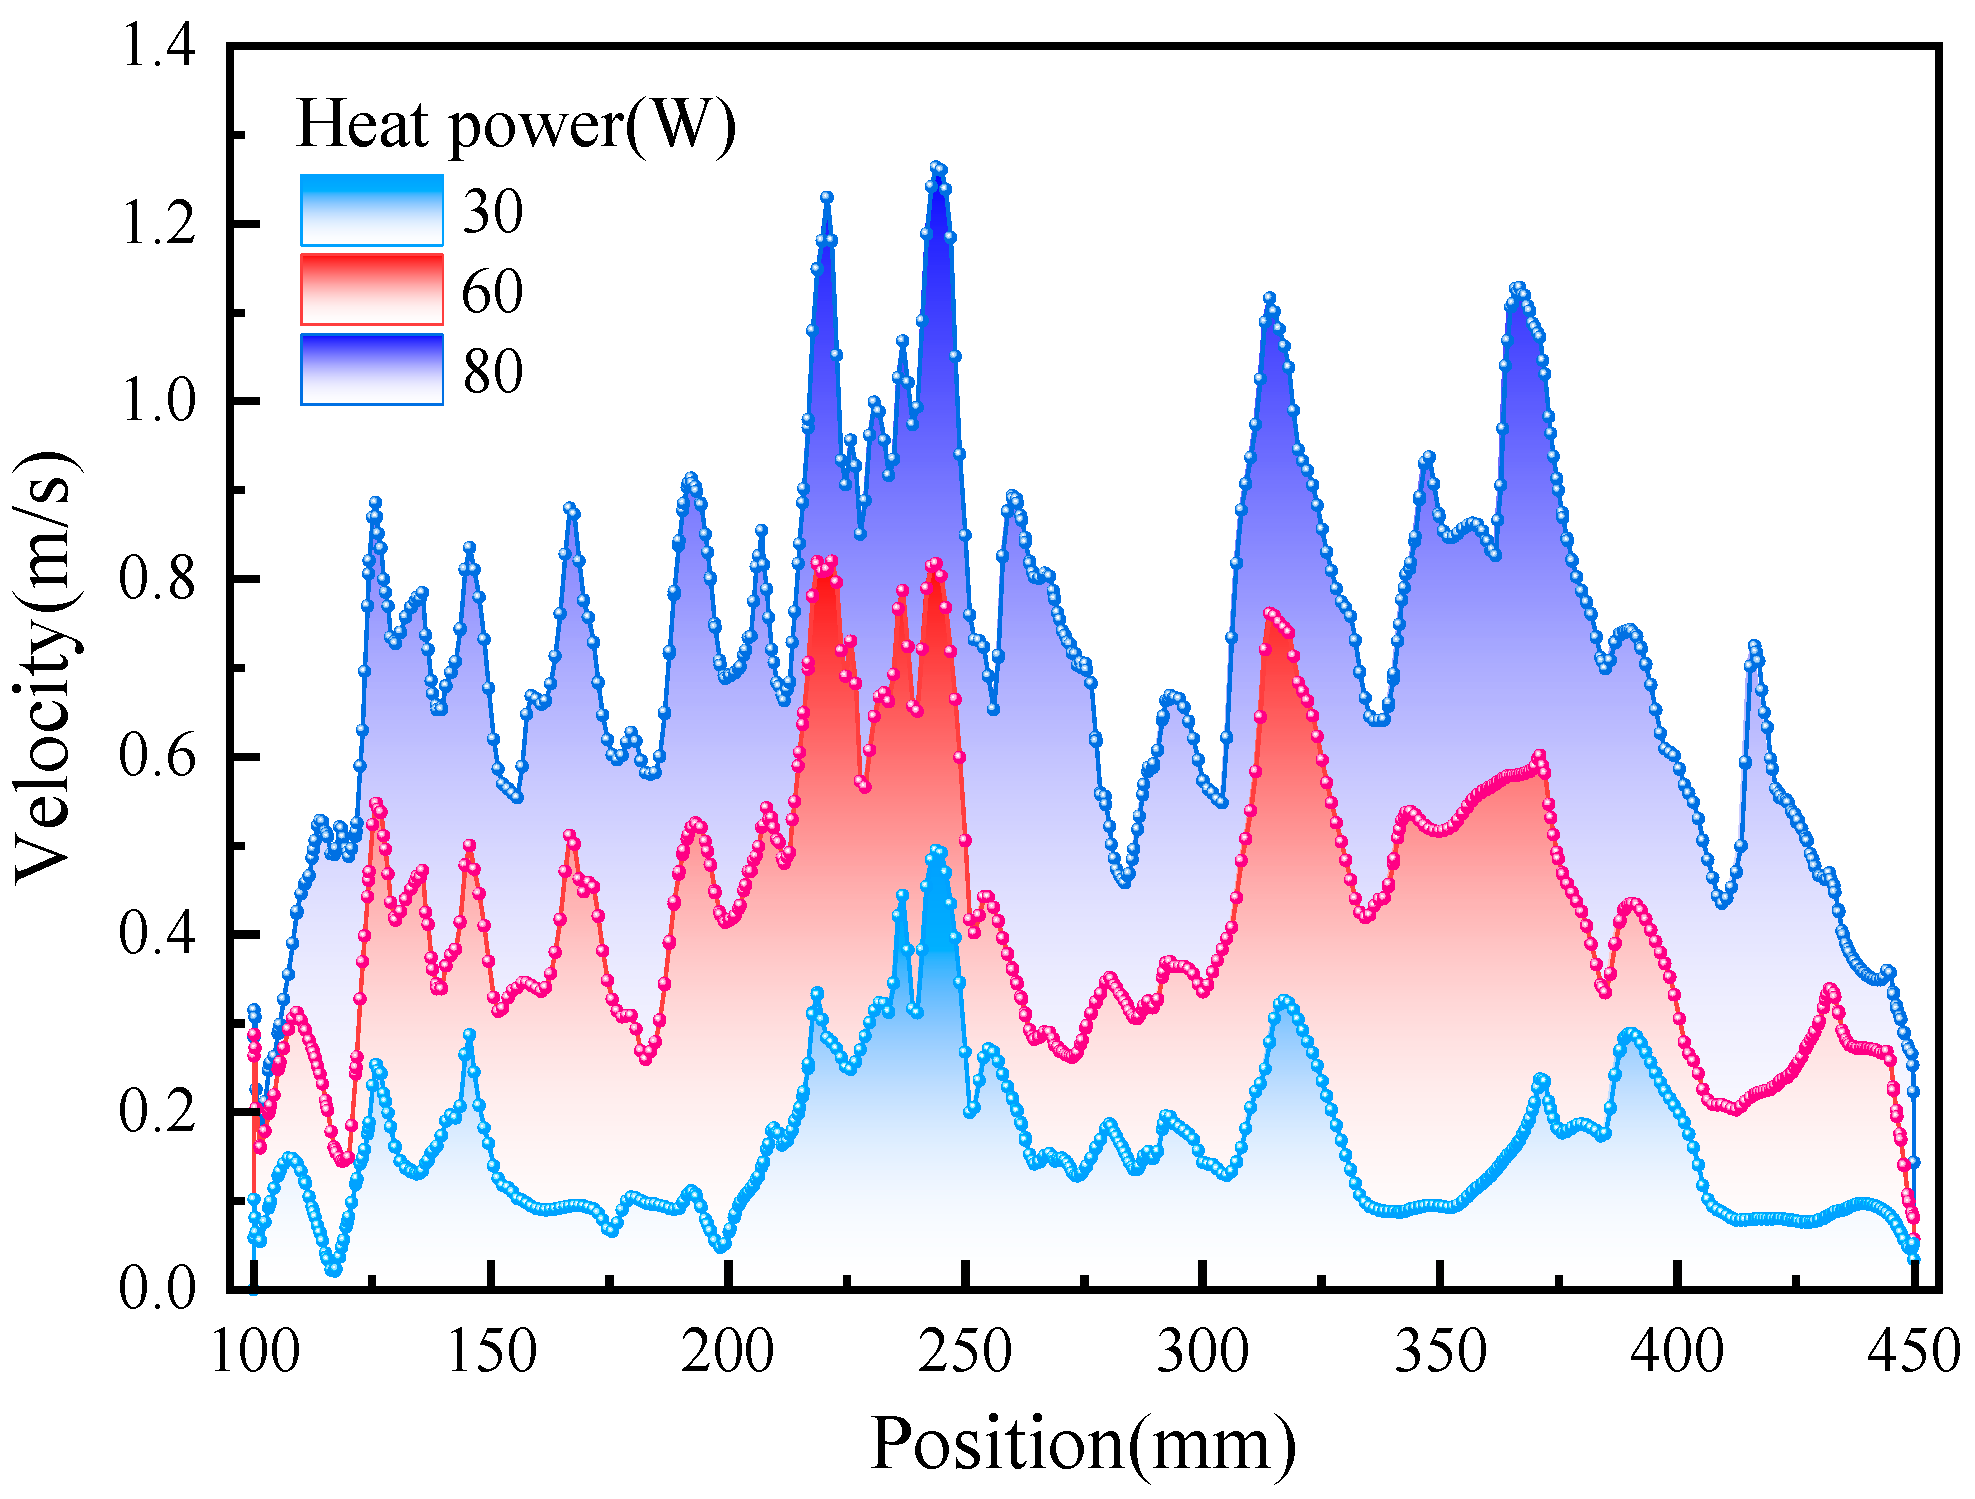
3.3. Temperature and Velocity Distribution Inside the Heat Pipe

The FR and heating power have a large influence on the temperature distribution inside the heat pipe. Figure 6 shows the temperature distribution of the heat pipe at different moments under a liquid FR of 70% and a heating power of 30 W. The initial conditions of the simulation are that the inside of the heat pipe is at saturation temperature. Due to the combined action of heat input in the evaporation section and heat release in the condensation section, the temperature in the evaporation section has increased more than the saturation temperature in 2 s, and the temperature in the condensation section has decreased. With the increase in time, the temperature of the evaporation section continued to rise. At 10 s, the wall temperature of the evaporation section reached 54 °C. With the generation and upward movement of the bubbles, the condensation section of the heat pipe temperature also rose. And the higher the liquid level is, the higher the temperature of the condensing section is. Overall, the temperature distribution inside the heat pipe was relatively uniform, especially between the evaporation section and the adiabatic section.
The distribution of the axial velocity of the heat pipe under heating power of 30 W, 60 W, and 80 W and a liquid FR of 70% is shown in Figure 7. Position 100 mm indicates the outlet position of the evaporation section, and position 450 mm indicates the inlet position of the condensing section. With the increase in heating power, the average axial velocity of the heat pipe gradually becomes larger. At the 245 mm position, the average speed of the internal working medium reaches the maximum, which is 0.5 m/s, 0.8 m/s and 1.3 m/s at 30 W, 60 W and 80 W, respectively. With the different axial positions, the speed of the working medium of the heat pipe shows the characteristics of fluctuation. Because the heat pipe is a closed system, when the working medium of the evaporation section moves upward by the pressure difference between the evaporation section and the condensing section, the bubbles or gas plug contained in the liquid working medium will exchange heat with the wall of the tube at different positions, resulting in pressure changes, similar to a multi-spring system. So, the speed fluctuates with different positions. The pulsation amplitude increases with the increase in heating power. At the 450 mm position, the average speed of the internal working medium reaches the minimum, which is almost the same, about 0.02 m/s at 30 W, 60 W and 80 W. Because the heat pipe is a closed system, when the FR is as high as 70%, the condensing section of the heat pipe will be filled with liquid working medium, which will hinder the flow of the working medium.
Figure 8 illustrates the axial velocity distribution of the heat pipe at a heating power of 30 W under different FRs (30%, 50%, and 70%). The axial velocity distribution inside the heat pipe shows different characteristics when the FR is low (30%) and high (50% and 70%). At 30% FR, the axial velocity presents pulsating characteristics below 200 mm position. Two typical velocity peaks occur near the position of 120 mm and 160 mm, and the maximum speed reaches 0.39 m/s. In a position higher than 200 mm, the axial velocity pulsation phenomenon disappears, showing a slow decrease characteristic. When the FR is 50% and 70%, the internal velocity of the heat pipe fluctuates along the axial position, and the maximum velocity is 0.51 m/s and 0.48 m/s, respectively. At 50% FR, the maximum velocity appears near 180 mm. At 70% FR, the maximum velocity is found near 240 mm. Due to the different FRs, there is a significant height difference in the liquid pool. The forces acting on the bubbles after their generation vary, leading to substantial differences in their movement trajectories. At a 30% liquid FR, the pool height is relatively low. Once the bubbles are generated, they quickly break through the liquid surface, limiting their upward movement. As a result, the speed of the bubbles is almost zero at heights above 200 mm.

4. Conclusions

In this paper, a gravity heat pipe with embedded structure was designed to meet the needs of new energy consumption and clean and efficient portable heating. In order to investigate the two-phase flow heat transfer mechanism of the embedded heat pipe, CFD numerical simulation method was used to study the two-phase flow state and heat transfer process of the embedded heat pipe under different FRs and heating powers. By obtaining the evolution law of the internal working fluid under different working conditions, it is possible to precisely regulate the heat transfer process of the heat pipe, thereby enhancing the heating uniformity of the PCM within the coupled system and ensuring efficient energy storage and release. Furthermore, these findings provide a basis for structural optimization, enabling improved heat transfer and thermal storage performance. The main conclusions are as follows:
(1)
As the heating power increases, large bubbles and slugs are more likely to form inside the heat pipe. When the heating power reaches a certain level, the bottom of the adiabatic section can no longer maintain the shape of the slug, causing the slug to break and merge, eventually forming a local annular flow.
(2)
Under low FRs, the liquid level is relatively low, and bubbles are likely to burst through the liquid surface after formation, preventing the formation of stable slugs. As the FR increases, the likelihood of slug flow and annular flow inside the heat pipe increases, and the liquid level rises.
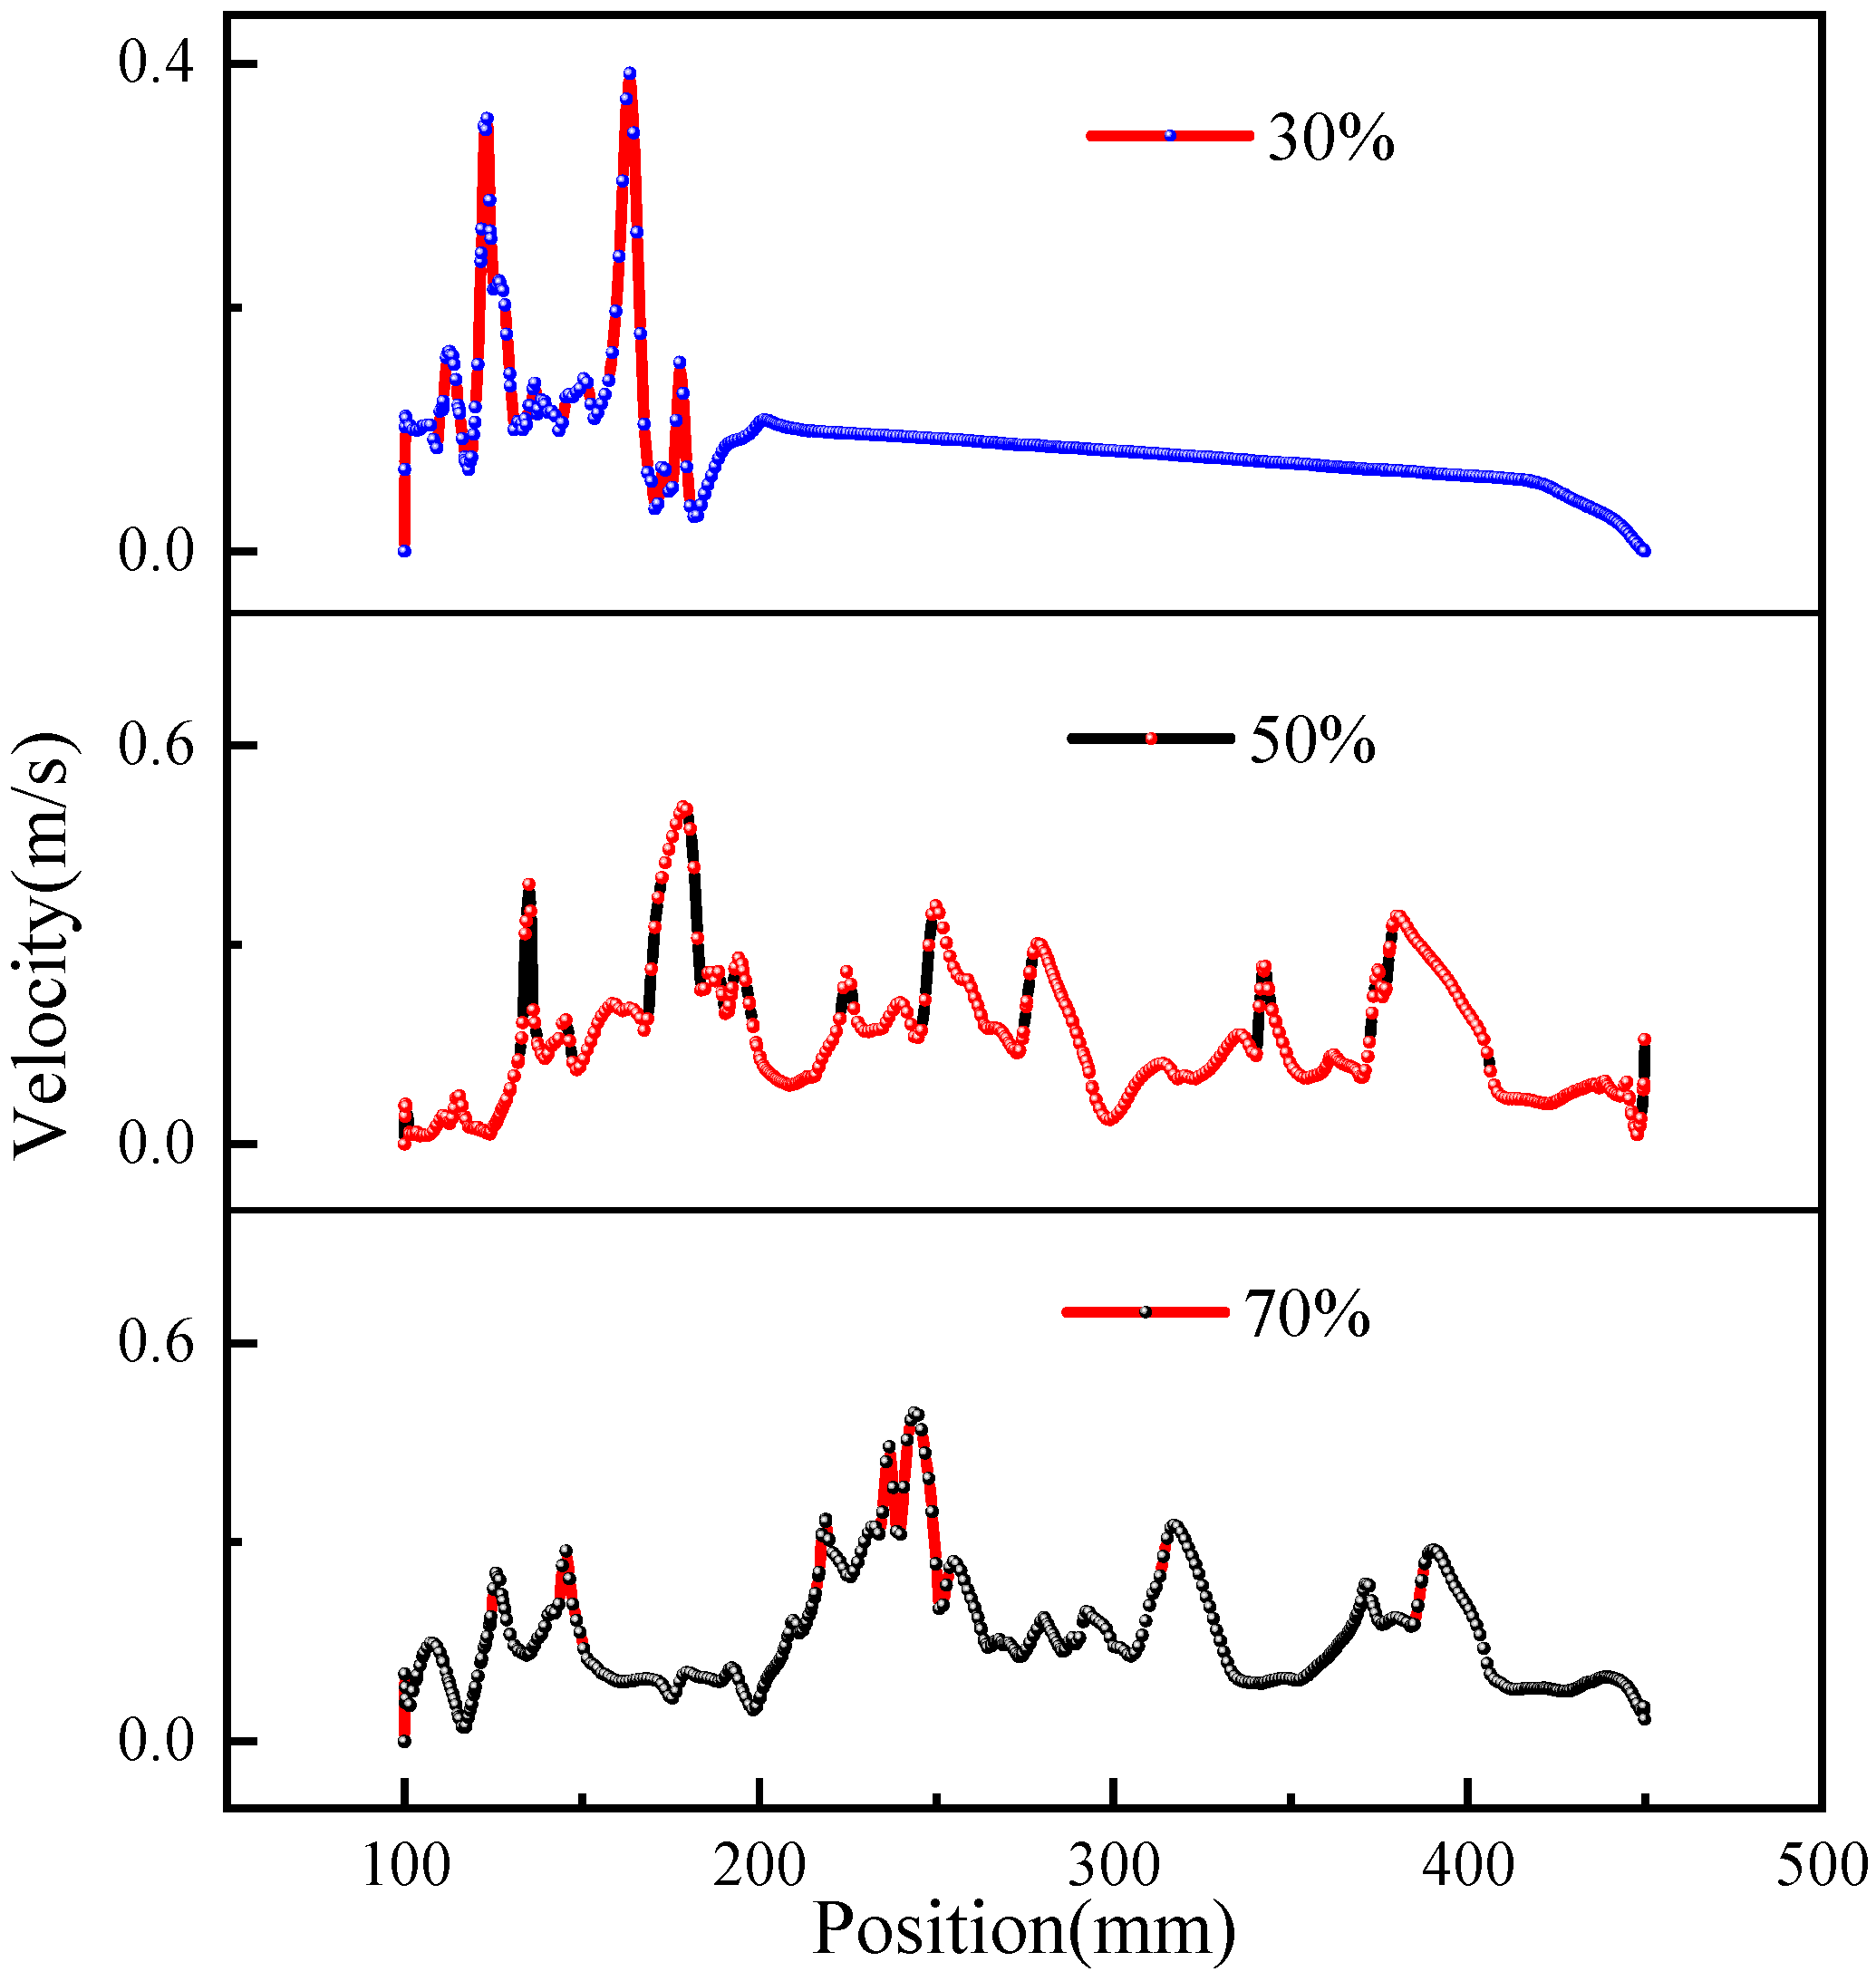
(3)
The FR affects the velocity field distribution within the heat pipe, with the location of the maximum velocity varying under different FRs. At FRs of 30%, 50%, and 70%, the maximum axial velocities are 0.39 m/s, 0.51 m/s, and 0.48 m/s, respectively. Therefore, choosing the appropriate heating power and liquid filling rate can optimize the heat transfer characteristics of the heat pipe.

Author Contributions

Conceptualization, Y.C. and H.Y.; methodology, S.Z. (Shu Zhang); software, Z.S.; validation, Y.C., H.Y. and Y.Z.; formal analysis, S.Z. (Silu Zhang); investigation, J.X.; project administration, C.L.; funding acquisition, Y.Z. All authors have read and agreed to the published version of the manuscript.

Funding

This study was supported by the Fundamental Research Funds for the Central Universities (NO. 2023ZDPY12) and Technology Project of China Power Engineering Consulting Group Limited (NO. DG3-F03-2023).

Data Availability Statement

The original contributions presented in this study are included in the article. Further inquiries can be directed to the corresponding authors.

Conflicts of Interest

Authors Yuanlin Cheng, Hu Yu, Yi Zhang, Shu Zhang, Zhipeng Shi, Jinlin Xie and Silu Zhang were employed by the China Energy Construction Group Hunan Electric Power Design Institute Co., Ltd. The remaining authors declare that the research was conducted in the absence of any commercial or financial relationships that could be construed as a potential conflict of interest.

Abbreviations

CFDComputational Fluid Dynamic
FRFilling ratio
NHTNumerical Heat Transfer
UDFUser Defined Function
VOFVolume of Fluid

References

  1. Geng, L.; Xiao, T.; Jiang, J.P.; Luo, K.F.; Yan, Y.B.; Liu, C.H. Wide temperature range phase change cold energy storage by using esterification between polyethylene glycol and lauric acid. Chem. Eng. J. 2024, 496, 154005. [Google Scholar] [CrossRef]
  2. Filina, O.A.; Martyushev, N.V.; Malozyomov, B.V.; Tynchenko, V.S.; Kukartsev, V.A.; Bashmur, K.A.; Pavlov, P.P.; Panfilova, T.A. Increasing the Efficiency of Diagnostics in the Brush-Commutator Assembly of a Direct Current Electric Motor. Energies 2024, 17, 17. [Google Scholar] [CrossRef]
  3. Wu, Q.; Yu, B.; Zhou, F.; Wu, J.; Xu, L. Numerical Simulation of Evaporation Section of Ultra-long Gravity Heat Pipe in Geothermal Energy Extraction System. Chem. Eng. Mach. 2022, 49, 642–647. [Google Scholar]
  4. Huang, W.; Cao, W.; Li, T.; Jiang, F. Numerical study and economic analysis of gravity heat pipe hot dry rock geothermal system. CIESC J. 2021, 72, 1302–1313. [Google Scholar]
  5. Zhao, J.; Wang, Z.; Dai, C.; Liu, C.; Rao, Z. Research on heat transfer performance of amphiphilic nanofluid solar gravity heat pipe. CIESC J. 2020, 71, 5461–5469. [Google Scholar]
  6. Peng, D.; Guo, Y.; Lu, Y.; Wu, Y. Experimental Study on Heat Transfer Characteristics of Naphthalene Gravity Heat Pipe in Molten Salt. Acta Energiae Solaris Sin. 2021, 42, 317–322. [Google Scholar]
  7. Ramos-Alvarado, B.; Li, P.; Liu, H.; Hernandez-Guerrero, A. CFD study of liquid-cooled heat sinks with microchannel flow field configurations for electronics, fuel cells, and concentrated solar cells. Appl. Therm. Eng. 2011, 31, 2494–2507. [Google Scholar] [CrossRef]
  8. Sundaram, A.S.; Bhaskaran, A. Thermal Modeling of Thermosyphon Integrated Heat Sink for CPU Cooling. J. Electron. Cool. Therm. Control. 2011, 1, 15–21. [Google Scholar] [CrossRef]
  9. Srikanth, R.; Nair, R.S.; Balaji, C. Thermosyphon assisted melting of pcm inside a rectangular enclosure: A synergistic numerical approach. J. Phys. Conf. Ser. 2016, 745, 032130. [Google Scholar] [CrossRef]
  10. Zhang, H.; Xie, G.; Zhan, H.; Bi, S. Progress of research on visualization of internal procedure of two-phase closed thermosyphon and its heat transfer enhancement. Chem. Ind. Eng. Prog. 2017, 36, 791–801. [Google Scholar]
  11. Han, C.; Zou, L. Study on the heat transfer characteristics of a moderate-temperature heat pipe heat exchanger. Int. J. Heat Mass. Transf. 2015, 91, 302–310. [Google Scholar] [CrossRef]
  12. Yue, C.; Zhang, Q.; Zhai, Z.; Ling, L. Numerical investigation on thermal characteristics and flow distribution of a parallel micro-channel separate heat pipe in data center. Int. J. Refrig. 2019, 98, 150–160. [Google Scholar] [CrossRef]
  13. Li, Y.; Qi, F.; Guo, H.; Guo, Z.; Xu, G.; Liu, J. Numerical investigation of thermal runaway propagation in a li-ion battery module using the heat pipe cooling system. Numer. Heat Transf. Part A Appl. 2019, 75, 183–199. [Google Scholar] [CrossRef]
  14. Zhang, Y.; Guo, K.; Wang, C.; Tang, S.; Zhang, D.; Tian, W.; Su, G.H.; Qiu, S. Numerical analysis of segmented thermoelectric generators applied in the heat pipe cooled nuclear reactor. Appl. Therm. Eng. 2022, 204, 117949. [Google Scholar] [CrossRef]
  15. Li, C.; Guan, Y.; Wang, X.; Li, G.; Zhou, C.; Xun, Y. Experimental and numerical studies on heat transfer characteristics of vertical deep-buried u-bend pipe to supply heat in buildings with geothermal energy. Energy 2018, 142, 689–701. [Google Scholar] [CrossRef]
  16. Zhang, L.; Jiang, Y.; Chen, W.; Zhou, S.; Zhai, P. Experimental and numerical investigation for hot water boiler with inorganic heat pipes. Int. J. Heat Mass. Transf. 2017, 114, 743–747. [Google Scholar] [CrossRef]
  17. Zheng, S.L.; Qiu, Z.N.; He, C.W.; Wang, X.L.; Wang, X.P.; Wang, Z.Y.; Zhao, X.D.; Shittu, S. Research on heat transfer mechanism and performance of a novel adaptive enclosure structure based on micro-channel heat pipe. Energy 2022, 254, 124237. [Google Scholar] [CrossRef]
  18. Ochi, A.; Saidi, A. Impact of governance quality, population and economic growth on greenhouse gas emissions: An analysis based on a panel VAR model. J. Environ. Manag. 2024, 370, 122613. [Google Scholar] [CrossRef]
  19. Faraji, H.; Teggar, M.; Arshad, A.; Arici, M.; Berra, E.; Choukairy, K. Lattice Boltzmann simulation of natural convection heat transfer phenomenon for thermal management of multiple electronic components. Therm. Sci. Eng. Prog. 2023, 45, 102216. [Google Scholar] [CrossRef]
  20. Zhan, H.; Li, C.; Wang, L.; Wu, Z.; Zhang, H. Simulation of the thermosyphon ebullition and condensation based on VOF model. Energy Metall. Ind. 2016, 35, 30–36. [Google Scholar]
  21. Shen, C.; Yu, P.; Zhang, D.; Lv, H.; Yang, J.; Yang, X. Numerical Simulation of Heat and Mass Transfer in a Parallel Flow Heat Exchanger. J. Eng. Thermophys. 2018, 38, 1309–1312. [Google Scholar]
  22. Chen, J.; Yang, S.; Liao, S.; Cao, X. Experimental investigation of effective parameters on geyser periodicity in a vertical heated system. Exp. Therm. Fluid Sci. 2015, 68, 163–176. [Google Scholar] [CrossRef]
  23. Alizadehdakhel, A.; Rahimi, M.; Alsairafi, A.A. CF-Dmodeling of flow and heat transfer in a thermosyphon. Int. Commun. Heat Mass. Transf. 2009, 37, 312–318. [Google Scholar] [CrossRef]
  24. Zhang, H.; Zhang, W. Numerical Study on Optimization of Gravity Heat Pipe Geometry. J. Tianjin Chengjian Univ. 2019, 25, 317–320. [Google Scholar]
  25. Fertahi, S.E.-D.; Bouhal, T.; Agrouaz, Y.; Kousksou, T.; El Rhafiki, T.; Zeraouli, Y. Performance optimization of a two-phase closed thermosyphon through CFD numerical simulations. Appl. Therm. Eng. 2018, 128, 551–563. [Google Scholar] [CrossRef]
  26. Buczyński, R.; Weber, R.; Szlęk, A. Innovative design solutions for small-scale domestic boilers: Combustion improvements using a cfd-based mathematical model. J. Energy Inst. 2015, 88, 53–63. [Google Scholar] [CrossRef]
  27. Zhao, J.; Dai, Y.; Wang, Z.; Liu, Y.; Xu, W.; Mao, Y.; Wang, C. Study on the thermal performance of thermal energy storage and heating module based on a novel embedded heat pipe. J. Energy Storage 2022, 52, 104743. [Google Scholar] [CrossRef]
  28. Geng, L.; Cui, J.P.; Zhang, C.L.; Yan, Y.B.; Zhao, J.T.; Liu, C.H. Chemistry in phase change energy storage: Properties regulation on organic phase change materials by covalent bond modification. Chem. Eng. J. 2024, 495, 153359. [Google Scholar] [CrossRef]
  29. Gajdzik, B.; Wolniak, R.; Nagaj, R.; Zuromskaite-Nagaj, B.; Grebski, W.W. The Influence of the Global Energy Crisis on Energy Efficiency: A Comprehensive Analysis. Energies 2024, 17, 947. [Google Scholar] [CrossRef]
  30. Wang, Z.Y.; Zhu, J.; Wang, M.X.; Gao, Q.L. Experimental study on heat transfer and storage of a heating system coupled with solar flat heat pipe and phase change material unit. J. Energy Storage 2023, 73, 108971. [Google Scholar] [CrossRef]
  31. Silaev, V.I.; Klyuev, R.V.; Eremeev, D.V.; Martynova, T.A.; Danilchenko, Y.V. Analysis of the carbon footprint created by mining enterprises. Min. Informational Anal. Bull. 2023, 11, 265–277. [Google Scholar]
  32. Geng, L.; Wang, J.P.; Yang, X.L.; Jiang, J.P.; Li, R.; Yan, Y.B.; Zhao, J.T.; Liu, C.H. Synergistic enhancement of phase change materials through three-dimensional porous layered covalent triazine framework/expanded graphite composites for solar energy storage and beyond. Chem. Eng. J. 2024, 487, 150749. [Google Scholar] [CrossRef]
  33. Geng, L.; Huang, W.B.; Jiang, J.P.; Zhang, C.L.; Cui, J.P.; Yan, Y.B.; Liu, C.H. Cold energy storage enhancement and phase transition temperature regulation. J. Energy Storage 2024, 97, 112903. [Google Scholar] [CrossRef]
  34. Ge, M.; Zheng, G.A. Fluid-Solid Mixing Transfer Mechanism and Flow Patterns of the Double-Layered Impeller Stirring Tank by the CFD-DEM Method. Energies 2024, 17, 1513. [Google Scholar] [CrossRef]
  35. Su, Z.; Li, Z.; Wang, K.; Kuang, Y.; Wang, H.; Yang, J. Investigation of improved VOF method in CFD simulation of sodium heat pipes using a multi-zone modeling method. Int. Commun. Heat Mass. Transf. 2024, 157, 107669. [Google Scholar] [CrossRef]
  36. Brackbill, J.; Kothe, D.B.; Zemach, C. A continuum method for modeling surface tension. J. Comput. Phys. 1992, 100, 335–354. [Google Scholar] [CrossRef]
  37. Fadhl, B.; Wrobel, L.C.; Jouhara, H. Numerical modelling of the temperature distribution in a two-phase closed thermosyphon. Appl. Therm. Eng. 2013, 60, 122–131. [Google Scholar] [CrossRef]
Figure 1. (a) Real picture, (b) dimensions and (c) mesh of the embedded heat pipe.
Energies 17 06162 g001
Figure 2. Mesh independence test.
Energies 17 06162 g002
Figure 3. The (a) temperature validation and (b) internal flow field validation of the embedded heat pipe.
Energies 17 06162 g003
Figure 4. Contours of vapor phase and liquid phase distribution at heating power of 30 W (a) FR = 30% (b) FR = 50% (c) FR = 70%.
Energies 17 06162 g004
Figure 5. Contours of vapor and liquid phase in heat pipe under different (a) heating power and (b) FRs.
Energies 17 06162 g005
Figure 6. Contours of temperature distribution in heat pipe at different moments (FR = 70%, Heat power = 30 W).
Energies 17 06162 g006
Figure 7. Comparison of axial velocity distribution of heat pipe under different heating powers.
Energies 17 06162 g007
Figure 8. Comparison of heat pipe axial velocity distribution under different FRs.
Energies 17 06162 g008
Disclaimer/Publisher’s Note: The statements, opinions and data contained in all publications are solely those of the individual author(s) and contributor(s) and not of MDPI and/or the editor(s). MDPI and/or the editor(s) disclaim responsibility for any injury to people or property resulting from any ideas, methods, instructions or products referred to in the content.

