Article

The Influence of Temperature on Rheological Parameters and Energy Efficiency of Digestate in a Fermenter of an Agricultural Biogas Plant

by
Maciej Filip Gruszczyński
1,
Tomasz Kałuża
2,*,
Wojciech Czekała
3,
Paweł Zawadzki
2,
Jakub Mazurkiewicz
3,
Radosław Matz
2,
Maciej Pawlak
2,
Paweł Jarzembowski
4,
Farokh Sahraei Nezhad
5 and
Jacek Dach
3
1
Institute of Environmental Engineering, Wrocław University of Environmental and Life Sciences, 50-363 Wrocław, Poland
2
Department of Hydraulic and Sanitary Engineering, Poznań University of Life Sciences, 60-637 Poznań, Poland
3
Department of Biosystems Engineering, Poznań University of Life Sciences, 60-637 Poznań, Poland
4
Institute of Environmental Biology, Wrocław University of Environmental and Life Sciences, 50-375 Wrocław, Poland
5
Department of Energy Technology, Royal Institute of Technology (KTH), 114 28 Stockholm, Sweden
*
Author to whom correspondence should be addressed.
Energies 2024, 17(23), 6111; https://doi.org/10.3390/en17236111
Submission received: 1 November 2024 / Revised: 25 November 2024 / Accepted: 27 November 2024 / Published: 4 December 2024
(This article belongs to the Section A4: Bio-Energy)

Abstract

:
This investigation specifically aims to enhance the understanding of digestate flow and mixing behavior across typical temperatures in bioreactors in agricultural biogas plants, facilitating energy-efficient mixing. Experimental tests confirmed that digestate exhibits non-Newtonian characteristics, allowing its flow behavior to be captured by rheological models. This study validated that digestate rheology significantly varies with temperature, which influences flow resistance, mixing efficiency and overall energy requirements. Two rheological models—the Bingham and Ostwald models—were applied to characterize digestate behavior, with the Ostwald model emerging as the most effective for Computational Fluid Dynamic (CFD) simulations, given its balance between predictive accuracy and computational efficiency. Specifically, results suggest that, while three-parameter models, like the Herschel–Bulkley model, offer high precision, their computational intensity is less suitable for large-scale modeling where efficiency is paramount. The small increase in the accuracy of the shearing process description does not compensate for the significant increase in CFD calculation time. Higher temperatures were found to reduce flow resistance, which in turn enables increased flow rates and more extensive mixing zones. This enhanced mass transfer and mixing potential at elevated temperatures are especially pronounced in peripheral areas of the bioreactor, farthest from the agitators. By contributing a model for rheological behavior under realistic bioreactor conditions, this study supports the optimization of energy use in biogas production. These findings emphasize that temperature adjustments within bioreactors could serve as a reliable control strategy to maintain optimal production conditions while minimizing operational costs.

1. Introduction

Methane fermentation is a complex process involving different interactions of microorganisms. The structure and diversity of microbial communities reflect the ecosystem function [1]. The methane fermentation process is influenced by several factors, such as pH, C/N ratio, hydraulic retention time or temperature [2,3,4], which directly determine the composition of fermentation products, methane content and the efficiency of biogas production. One of the key factors in methane production processes is temperature as it largely influences the biological aspect of the methane fermentation process, which is a complex microbial process in which anerobic microorganisms transform organic compounds into methane and carbon dioxide under anerobic conditions [3,5,6,7,8]. Temperature affects that process at several levels. The search for the optimal temperature range for fermenter operations has long been a task engaging both researchers and practitioners. This is primarily because the issue is highly complex, particularly as it requires balancing the influence of temperature on microbiological processes and their related rheological properties (which affect the economics of mixing, such as energy consumption, fermentation time, equipment wear, etc.).
(a)
The influence of temperature on microbiological processes:
Enzymatic activity: Temperature is one of the main factors influencing the activity of methanogen enzymes. An increase in temperature promotes an increase in the rate of enzymatic reactions and the metabolism of microorganisms, leading to increased methane production. Increased enzymatic activity at appropriate temperatures accelerates the breakdown of organic compounds and their transformation into methane. Furthermore, changes in microbial metabolism or community dynamics affect the performance of the anerobic digestion system [9,10,11,12]. Temperatures below or above the optimum range can lead to reduced enzyme activity and, in extreme cases, inhibition of the entire process [12]. In addition, the temperature of the fermentation process strongly influences the changes induced by pH, particularly in connection with the balance between NH4+ and NH3, which causes further negative effects, such as the ammonia inhibition of microorganisms [13]. Although microorganisms may have some ability to adapt to changing temperature conditions, this process may take some time and/or may result in a sharp decrease in biogas production until the number of necessary populations increases [14]. It has been shown that even small changes in temperature ±4 °C in mesophilic conditions—and only ±1 °C in thermophilic conditions—significantly reduce the rate of biogas production [2,15].
The selection of the optimal temperature range, for microbiological reasons, is not simple and unambiguous—different species of methanogens show different preferences as to the temperature range in which they operate optimally. There are methane-producing microorganisms that are active at lower or higher temperatures, depending on the specific environmental conditions (and substrate composition) in which they occur [16]. For example, studies conducted using cattle manure with the addition of corn straw showed that it is not possible to clearly determine the optimal conditions for methane fermentation [16]. Studies performed using cattle manure with the addition of maize straw have shown that the difference in the efficiency of the fermentation process at temperatures of 35 °C and 20 °C is over 70% [12]. Gannoun et al. [17], in turn, tested which thermal level (37 °C or 55 °C) enabled a higher biogas efficiency for combined wastewater from olive oil mills and slaughterhouses. The results of their studies indicated that the thermophilic reactor had a higher soluble chemical oxygen demand (SCOD) removal efficiency and biogas efficiency than the mesophilic reactor and was able to maintain that performance level at high organic matter concentrations. Similarly, the fermentation of vegetable waste and wood chips showed faster degradation of fatty acids at 55 °C than at 38 °C. Also, methane yield (95%) was obtained in thermophilic conditions after 11 days, whereas mesophilic conditions required an additional two weeks [18]. Moreover, the production from thermophilic digesters appeared to be significantly greater than the energy produced by mesophilic digesters [19]. Furthermore, Parawira et al. [20] compared two-stage digesters with mesophilic–mesophilic, mesophilic–thermophilic and thermophilic–thermophilic configurations treating potato waste and found that the methane yield was higher in the mesophilic second stage than in the thermophilic second stage. They noticed, however, that, in the thermophilic second stage, the reactors could guarantee a shorter retention time and, therefore, greater hydraulic efficiency. It is important to note the degree of degradation of organic matter in those conditions. In turn, in the studies of protein wastewater using upflow anerobic sludge blanket (UASB) laboratory reactors conducted under mesophilic (37 °C) and thermophilic (55 °C) conditions, it was shown that the mesophilic reactor removed approx. 84% COD, while the efficiency for the thermophilic reactor was only 69–83% [21]. Furthermore, temperature is crucial in the destruction of pathogenic organisms and weed seeds as well as the impact of antibiotics on methane fermentation processes [22].
(b)
The influence of temperature on mixing processes:
Energy consumption during the mixing process depends on the mixing regime and intensity, the rheological parameters of the carrier liquid, the dry matter content and the fiber dimensions [23]. The rheological properties of the digestate significantly influence the amount of energy used for mixing [24]. Temperature, in turn, influences the rheological parameters of digestate, the viscosity and flow limit of the fermentate and fermented sludge decrease with increasing temperature [25]. With identical mixer properties or mixing methods, different digestate flow rates in the bioreactor may be obtained depending on temperature. Caillet and Adelard [26] indicate that energy-optimal mixing properties are achieved at higher temperatures, i.e., the mesophilic regime. However, given the large amount of waste heat generated during the operation of power generators, it is easy to achieve thermophilic conditions without increasing the energy cost to heat digestate. This is the case of the biogas plant discussed in this article. The rheological properties of digestate are influenced by all the processes taking place in a biogas plant [27]; therefore, the temperature history of the fermentation process and the instantaneous temperature are important. The temperature history translates into rheological parameters through the products of biological and chemical processes, while a momentary change in temperature may affect the physical properties of digestate by changing the viscosity of its main component, which is water [28].
Analyzing the energy efficiency of the biogas production process in the bioreactor chambers, it can be seen that a certain part of the produced energy is consumed in the process of mixing the bio-feedstock. The mixing process is essential for the stable operation of a reactor, and disturbances in mixing can result in production-threatening phenomena, e.g., the formation of scum. Bioreactor operators often oversize mixers and increase mixing time not to disrupt the biogas production process. Knowledge of the rheological parameters of the bio-feedstock as a function of temperature may allow the optimization of the mixing process as a function of the following: temperature, range of effective mixing zones and mixing time, which may translate into a reduction in one’s own energy consumption during production and better control of the entire process.
Mixing controls the heat and mass flow in the reactor; therefore, it influences the physicochemical and biological reactions [29]. Insufficient mixing, e.g., due to an increase in the proportion of particles, can lead to deformation of the processes taking place in the reactor, e.g., the accumulation of volatile fatty acids, which leads to reduced biogas and methane production [30]. Hence, a better understanding of the mixing process, taking into account different rheological conditions, may contribute to finding optimal conditions. Numerous attempts have been made to model flow in digesters. Different mixing techniques have been considered, such as injected gas mixing, the mechanical pumping of recycled digestate and mechanical mixing [31].
Adequate mixing quality is difficult to define; hence, different criteria are used to assess it, e.g., taking into account the presence of dead zones in digester reactors [32,33,34], obtaining minimum flow rates in reactors, preventing particle stagnation and maintaining isolated turbulence zones [35]. Mixing efficiency can be expressed by achieving the required exchange rate of the fluid volume in a given zone, which ensures the proper feeding of microorganisms and proper access to the substrate. Baudez at al. [28] reports the need to maintain three to four reactor volume exchanges per hour. In turn, laboratory studies on the anerobic digestion of wastewater have shown that increasing the rotor speed from 140 1/min to 1000 1/min in continuous mixing systems did not improve but worsened biogas production [35,36]. With intensive mixing, methanogenic centers are destroyed, and biochemical reactions are inhibited [35]. Other studies indicate up to 7% improvement in productivity with intermittent mixing [37,38,39]. The negative impact of over-mixing on productivity and the benefits of intermittent mixing may encourage the use of low-speed mixers. Poor mixing does not translate into incomplete substrate homogeneity, which occurs at the feedstock preparation stage for the biogas plant. Instead, the secondary self-concentration of digestate is possible due to the sedimentation or flotation of particles and a local increase in the degree of dry matter concentration. A slight increase in the solid content, especially fibrous particles, leads to a significant disruption of the mixing process [25].
Due to the considerable size of digesters in biogas plants, mixing is supposed to induce a circulating current that covers all areas of the digester. However, the specific characteristics of digestate—a non-Newtonian fluid—make it difficult to transmit mixing currents through the rapid dissipation of momentum energy. One of the methods of assessing proper mixing, or blending, is to achieve the required number of digestate volume exchanges in a given reactor or to achieve specific flow rates in the reactor to prevent dead zones and particle stagnation. In real-scale reactor studies, Kress at al. [25] showed a significant correlation between dry matter (DM) content and velocity achieved inside the reactor for the same submersible mixer (SMM) parameters. In general, fermentation substrate flow velocity decreased with increasing dry matter content. Increasing dry matter content from 7.74 to 10.75% resulted in a decrease in the velocity from a range of 8.71–63.77 cm/s to 0.05–37.36 cm/s, i.e., an average reduction of approximately 70%. This may be the reason for the occurrence of preferential (shortened) flow paths between the suction and discharge sections of the mixer (short circuit). Then, the remaining zones of the reactor are not subject to mixing, which contributes to the creation of dead zones in the fermenter [40].
The high levels of energy consumption in biogas plants and the difficulties in choosing the right mixing methods and conditions indicate the need to conduct in-depth research on the mixing process, which is necessary to reduce energy consumption for the biogas plants’ own needs [30]. During the literature study, including a review of publications on rheological properties of liquids inside bioreactors, it was found that knowledge about the process of flow and the mixing of digestate in terms of temperature changes is very limited [41,42]. Therefore, it was decided to study the rheological properties of the carrier liquid as a function of temperature, in the range of the most common temperatures in bioreactors. The purpose of the performed research was to verify the hypothesis that the carrier fluid is a non-Newtonian fluid and that the selected rheological models can be used to describe it. Additionally, a hypothesis was put forward that temperature can significantly change the rheological parameters of digestate. The selection of the rheological model describing the fluid deformation process was made taking into account the possibility of using the results in computational fluid dynamics (CFDs). The results of this study are the input to CFD modeling, as knowledge of the rheological parameters of the carrier fluid during the mixing, flow and shear of a carrier liquid in the reactor chamber is essential at the stage of building the CFD model. One of the most important reasons that prompted the research team to undertake this research was the potential possibility of controlling the processes taking place in a bioreactor by monitoring the rheological parameters of the bio-feedstock in the context of liquid temperature. Controlling the biogas production process using rheological studies may contribute to maintaining more optimal conditions for biogas production and detecting significant deviations from the safe operating conditions. This publication is an analysis of the effect of biomass temperature in a digester of the “Przybroda” biogas plant operating at the Poznań University of Life Sciences, Poland [43], on the rheological parameters of selected rheological models. A precise description of the biomass deformation process as a function of temperature can be used to control the fermentation process and to optimize the process considering the energy used for mixing.

2. Materials and Methods

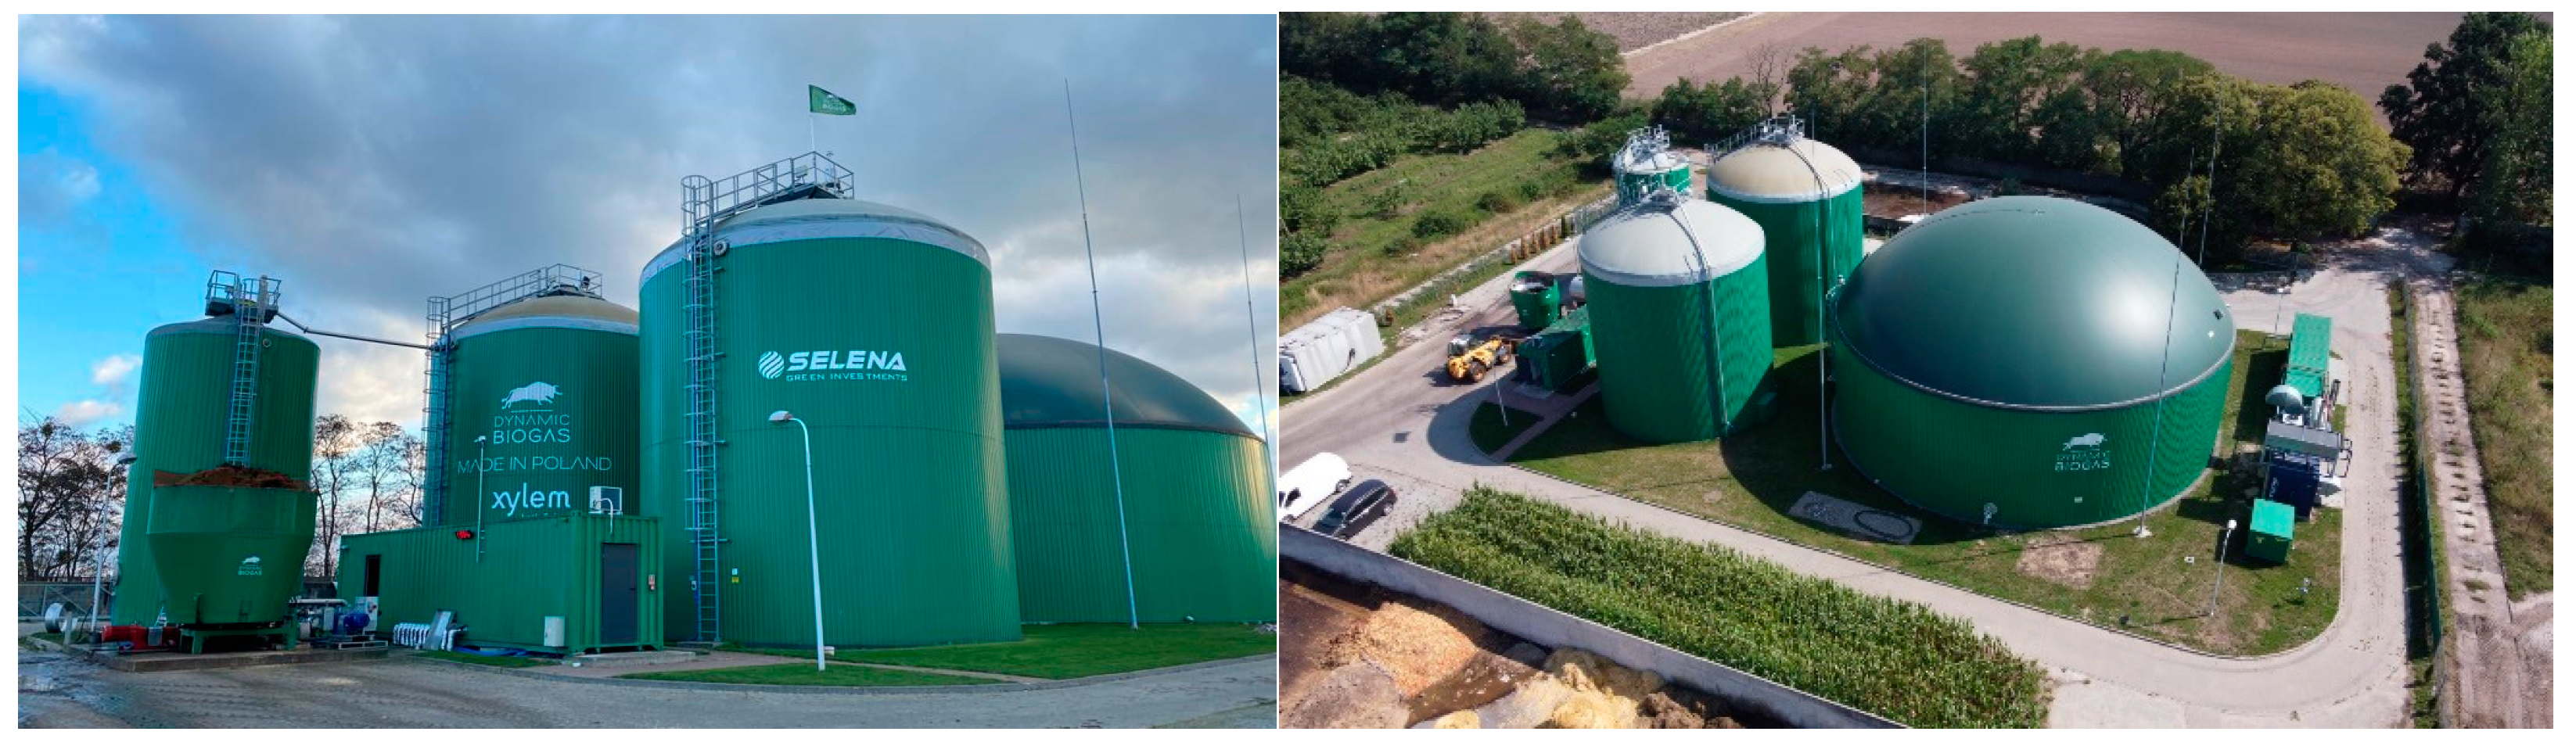
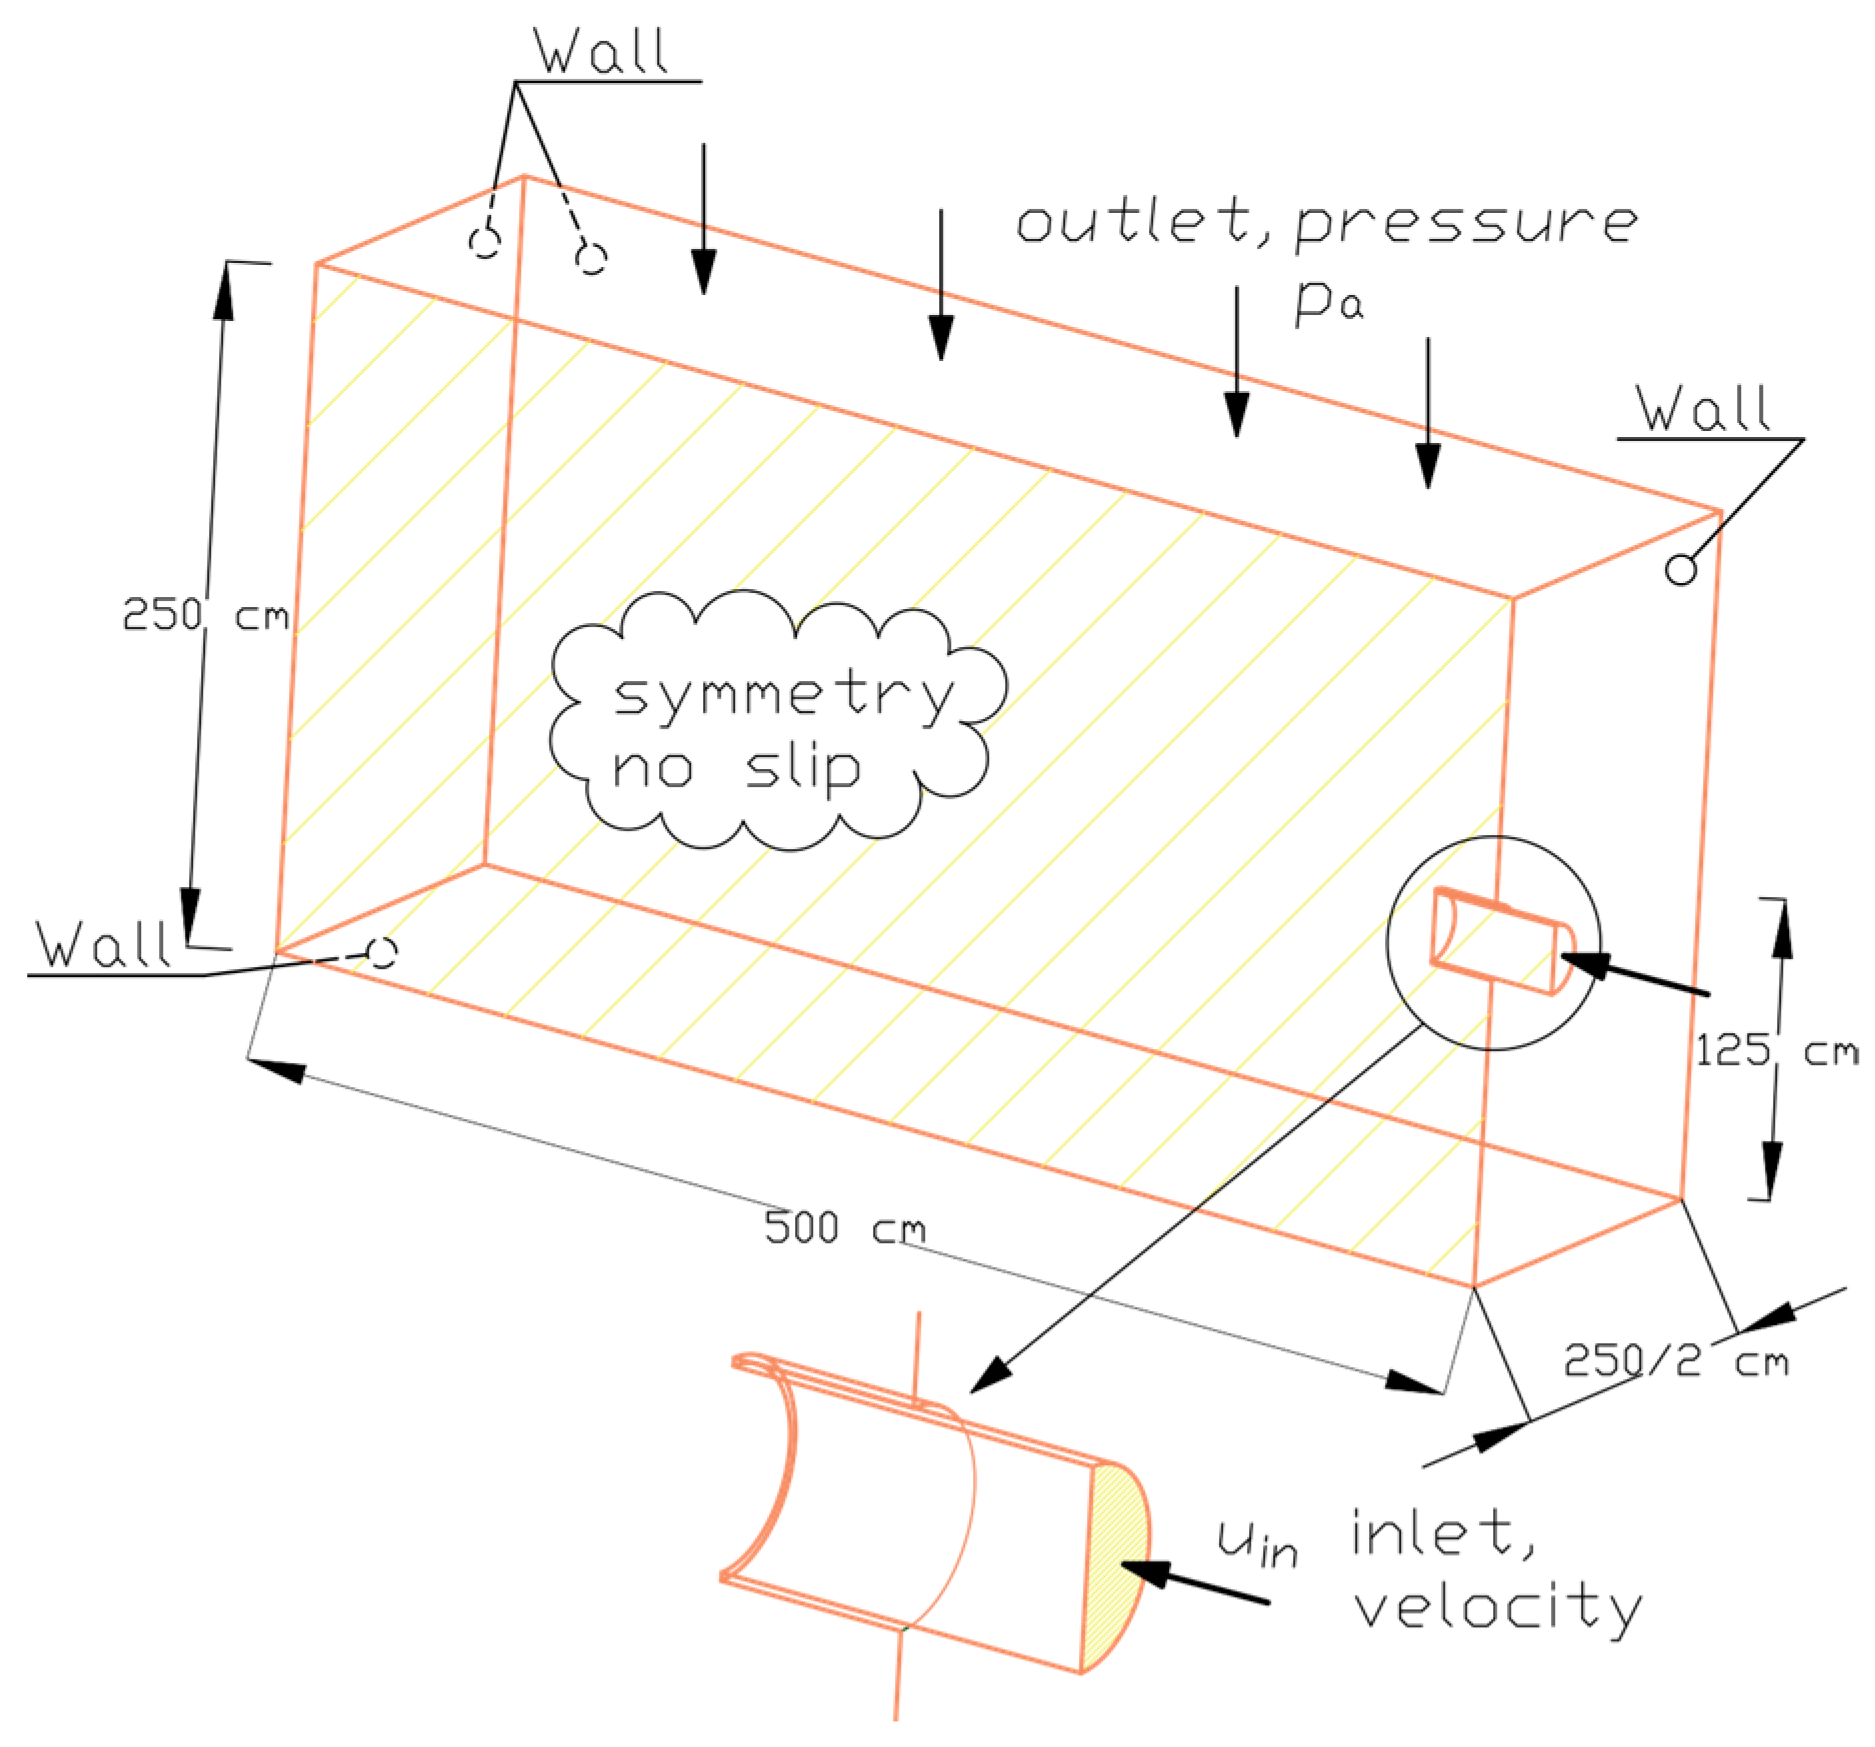
2.1. Description of the “Przybroda” Installation

The Przybroda agricultural Biogas plant with a capacity of 499 kWe/560 kWt is located outside of a village with the same name, in the Rokietnica commune (Wielkopolska Region), 26 km in the northwestern city of Poznań in Poland. This biogas plant and its experimental farm has been installed and operated by Dynamic Biogas since October 2019, owned and utilized as a research facility by the Poznań University of Life Sciences.
This biogas plant generated biogas and utilized it in CHP to generate 0.5 MW of electricity alongside the cogeneration of heat, supplying one-third of the village’s inhabitants heat demand. The plant had a feed maceration system, a hydrolysis tank with capacity, equipped with two fermenters (F1 and F2), each with a capacity of 1200 m3 equipped with Xylem, Flygt 4670 13 kW fast runner compact mixers and a post digester tank. The plant was fed with agricultural wastes (maize silage) and cow manure.

2.2. Physical and Chemical Parameters of the Digestate

The entire research campaign for the operation of fermentation reactors lasted 93 days. This was a period of intensive measurements of various technological parameters—from temperature, dry mass of the digestate, substrate retention periods and organic matter loading to biogas and methane production. During the study period, the average temperature in the reactor was 38.6 °C, ranging from 35.3 °C to 43.0 °C. The retention time, defined as the average residence time of the substrate in the reactor, was less than 63 days for the research campaign. The reactor load, i.e., the mass of organic matter placed inside the reactor, ranged from 1.85 to 4.38 kg of dry organic matter/(m3·d), giving an average of 3.98 kg of dry organic matter/(m3·d). This made it possible to achieve an average methane concentration of 64.72%, which corresponded to an average methane production of 190.58 m3/h from approx. 30.73 tons of substrate delivered daily. The average daily loading was as follows: food production sewage—3.84 t; feed—0.59 t; chaff—approx. 3.36 t; food production scraps—3.89 t; stomach content—4.57 t; turkey slaughterhouse sludge—8.55 t; distillery syrup—6.19 t and distillery stillage—18.55 t (throughout the study period, substrates were fed in different proportions, of which syrup and stillage accounted for an average of approximately 50% of the mass).
The characteristics of the samples used for rheological testing are summarized in Table 1. It should be noted that, with the sifting of particles larger than 0.5 mm, dry matter and dry organic matter decreased to 5.93%, respectively. Such an observation implies that, with the removal of larger particles by sifting, a significant proportion of suspended solids, including organic solids, was removed.

2.3. Determination of Rheological Parameters Taking into Account the Effect of Temperature

A particle analysis of the digestate was performed according to the methodology described in [42]. The adopted research procedures aim to avoid sample aging. Pseudo-flow curves of the samples were measured using the Thermo Electron Gmbh, Karlsruhe, Germany Haake Vt550 rotational viscometer set MV2. Control and calibration tests of the Haake Vt550 rheometer were performed by comparing the result for the same sample measured using the Anton Paar MCR 72 rheometer equipped with 39 mm coaxial cylinder systems according to DIN EN ISO 3219 [44] and DIN 53019 [45]. The measurement results using both rheometers differed by less than 1%, which was within the accuracy of the measurements performed by the instruments. It was decided to use the Haake Vt550 as the measuring instrument and portable, located as close as possible to the bioreactor, and the Anton Paar GmbH, Graz, Austria, Anton Paar MCR 72 as the control and stationary instrument.
In this study, the shear rate was controlled (CR test, Controlled Rate test) by adjusting the deformation gradient. Measurements were made in the range of 0–200 1/s of the apparent deformation gradient at a pace of 2.5 1/s. The range of the tested deformation gradient resulted from the estimated apparent deformation gradient observed in the bioreactor during the mixing process. For a bioreactor diameter of 10.0 m and a mixer tube diameter of 1.0 m, a maximum average velocity in the mixer tube of approximately 5.0 m/s was assumed, which translated into a flow rate of 3.92 m3/s. For the assumed mixer efficiency, the average speed in the reactor chamber was 0.05 m/s. Using the equation relating the mean velocity in the circular duct, the diameter of the duct and the apparent deformation gradient is as follows:
γ ˙ = 8 · V ¯ D
where
  • V ¯ —average velocity [m/s],
  • D—pipe diameter [m].
The values of the apparent deformation gradient were calculated γ ˙ :
  • in the mixer duct—50.9 1/s,
  • in the reactor chamber—0.04 1/s.
It was decided to assume the upper range of the measured apparent deformation gradient to be approx. four times the maximum estimated value, 200 1/s, in the reactor, as higher velocity and, thus, higher deformation gradient values occurred locally in the inlet, outlet and rotor regions. It should be noted that [46] assumed a test range of 0 to 85 and 330 1/s.
The rheological testing of biologically active materials requires precise determination of the conditions of collection, transport, storage, preparation, shelf life, test range and test apparatus. The test procedure described in [42] was followed in this study, which made it possible to achieve a satisfactory convergence of results for individual measurement campaigns.
For further interpretation, 28 pseudo-flow curves were used, converted from the apparent deformation gradient to the real one, which allowed for sketching the real flow curves. Figure 1 shows the course of the real and pseudo-flow curves and an attempt to describe the actual flow process of the sample using the Ostwald model.
The tested fluid can be accurately described using the power law model, and, in the case of a power fluid, the value of the parameter n can be determined as the slope of a straight line in the log η1 or log M coordinate system as a function of log N for finite changes in the values of M and N, and then used in the calculation of the corrected shear rate values. Failure to take into account the non-Newtonian nature of the fluid in rheometric measurements may lead to significant errors in determining the shear rate in the measurement system of two coaxial cylinders. Already with n parameter values of 0.7, the errors may amount to a high percentage [47]:
n = d log τ 1 d log N
γ ˙ r = 2 · Ω n r 2 n 1 R 1 2 n 1 R 2 2 n
where
  • γ ˙ r —shear rate at the tube wall [1/s],
  • Ω—angular velocity [rad/s],
  • n—flow behavior index [-],
  • τ 1 —shear stress at the wall [Pa],
  • R1—radius of inner cylinder [m],
  • R2—radius of outer cylinder [m],
  • N—rotational speed [rpm].
The value of the flow rate was determined using Formula (2) for the entire range of the analyzed deformation gradient, and then, using Formula (3), the values of the actual deformation gradient were determined, which made it possible to determine the real flow curve. Next, using the iteration process and the least squares method, the values of the rheological parameters of selected rheological models were determined by searching for the minimum of the residual sum of the squared deviations. Figure 2 shows the result of calculations for one curve for the test medium at 30 °C.
Then, knowing the course of real flow curves, the mean-square approximation method was used because it “eliminated” significant random errors, e.g., due to measurement errors, much better than the univariate approximation. The general notation of the method by minimizing the integral from Formula (3) for the interval <aa,ba> is as follows:
F x f ( x ) = a a b a w x i [ F x f ( x ) ] 2
The method involves searching for a minimum by successively substituting the values of the coefficients of the desired function:
F x f ( x ) = m i n i m u m
The method searches for the minimum of the approximation function of Formula (5), which comes down to minimizing the residual sum of squared deviations S (Formula (6)), where γ ˙ m e a —measured deformation gradient, and γ ˙ c a l —deformation gradient calculated for the adopted values of the rheological parameters of the selected model.
S = i = 1 n ( γ ˙ m e a γ ˙ c a l ) 2
Three rheological models were selected to describe the measurement results (Figure 3). The Newton model did not describe the deformation of the tested medium with acceptable accuracy as the tested fluid did not meet the requirements for the Newton model, i.e., it was a non-Newtonian fluid. For the description, after rejecting the Newton model, the two most frequently used two-parameter models were selected, i.e., the Bingham model and the Ostwald de Waele model (Figure 4). The used models are the most common ones in the CFD software, which was the reason for choosing the formulas below.
the   Newton   model     τ = η ( d u d r )
the   Bingham   model     τ = τ o + η B ( d u d r )
the   Ostwald   power   law   model   τ = k o ( d u d r ) n

2.4. Analysis Methodology—The Influence of Fluid Temperature on Energy Consumption During Mixing

Due to the use of different techniques for mixing the content of bio-fermenters, it is difficult to determine a reference method for assessing the influence of rheological parameters on the energy required for proper mixing. The designed mixing conditions are the result of many factors, e.g., the shape and size of the bioreactor, the adopted technological assumptions for the composition of the bio-feed and the mixing method, the mechanical mixer, the injected gas stream or recycled digestate. One of the approaches to assess mixing conditions is to numerically simulate the flow rates in reactors caused by mixing [31,34,48,49].
This research used the three-dimensional transient Eulerian model to simulate the flow of two gas–liquid phases in the Reynolds equations (Reynolds averaged Navier–Stokes—RANS). The equation system was closed with the standard k-ε turbulence model with standard functions for flow near the wall. The applied computational model enables defining the apparent viscosity for fluids. The fluid domain was discretized using a hexahedron mesh dominantly. The dimensions of the tank, and, in particular, the distance of the side walls from the inlet to the tank, were fitted to limit the impact of the walls on the fluid velocity distribution. The obtained y+ values for finite volumes in the wall layer in the range from 4.7 to 8.6 did not indicate the need to apply additional wall conditions. A 5 m long, 2.5 m deep and 2.5 m wide cuboidal tank was connected through the wall (dimensions 2.5 × 2.5 m) to a pipeline with a diameter of 250 mm and a length of 0.5 m, through which the digestate was introduced (Figure 5). The simulations included three inlet velocity uin of digestate added as the boundary condition, uniform on the surface of the inlet: 0.5, 1.0 and 1.5 m/s. The digestate was a continuous phase filling the whole tank. Initially, the digestate present in the tank was displaced with the incoming digestate, so that, in 20–30 s of simulation, the flow conditions were established. The excess fluid flowed freely through the upper boundary surface, with a given discharge condition to the atmosphere with standard sea-level conditions pa. Due to the symmetry of the geometry under study, calculations were performed on one half, taking into account the no-slip condition on the vertical division boundary.
CFD simulation was performed for three temperatures of the digestate, i.e., 30 °C, 42 °C and 56 °C, the non-Newtonian fluid rheological properties of which represented the apparent viscosity of the fluid in the Ostwald power law model. The flow rate and consistency coefficient were determined in rheological studies, and the minimum and maximum viscosity limits were 0.0001 and 1000 kg/(m·s), respectively; viscosity depended on the shear rate. The ANSYS Fluent 2023 R2 was used to solve the mathematical model of the flow.

3. Results

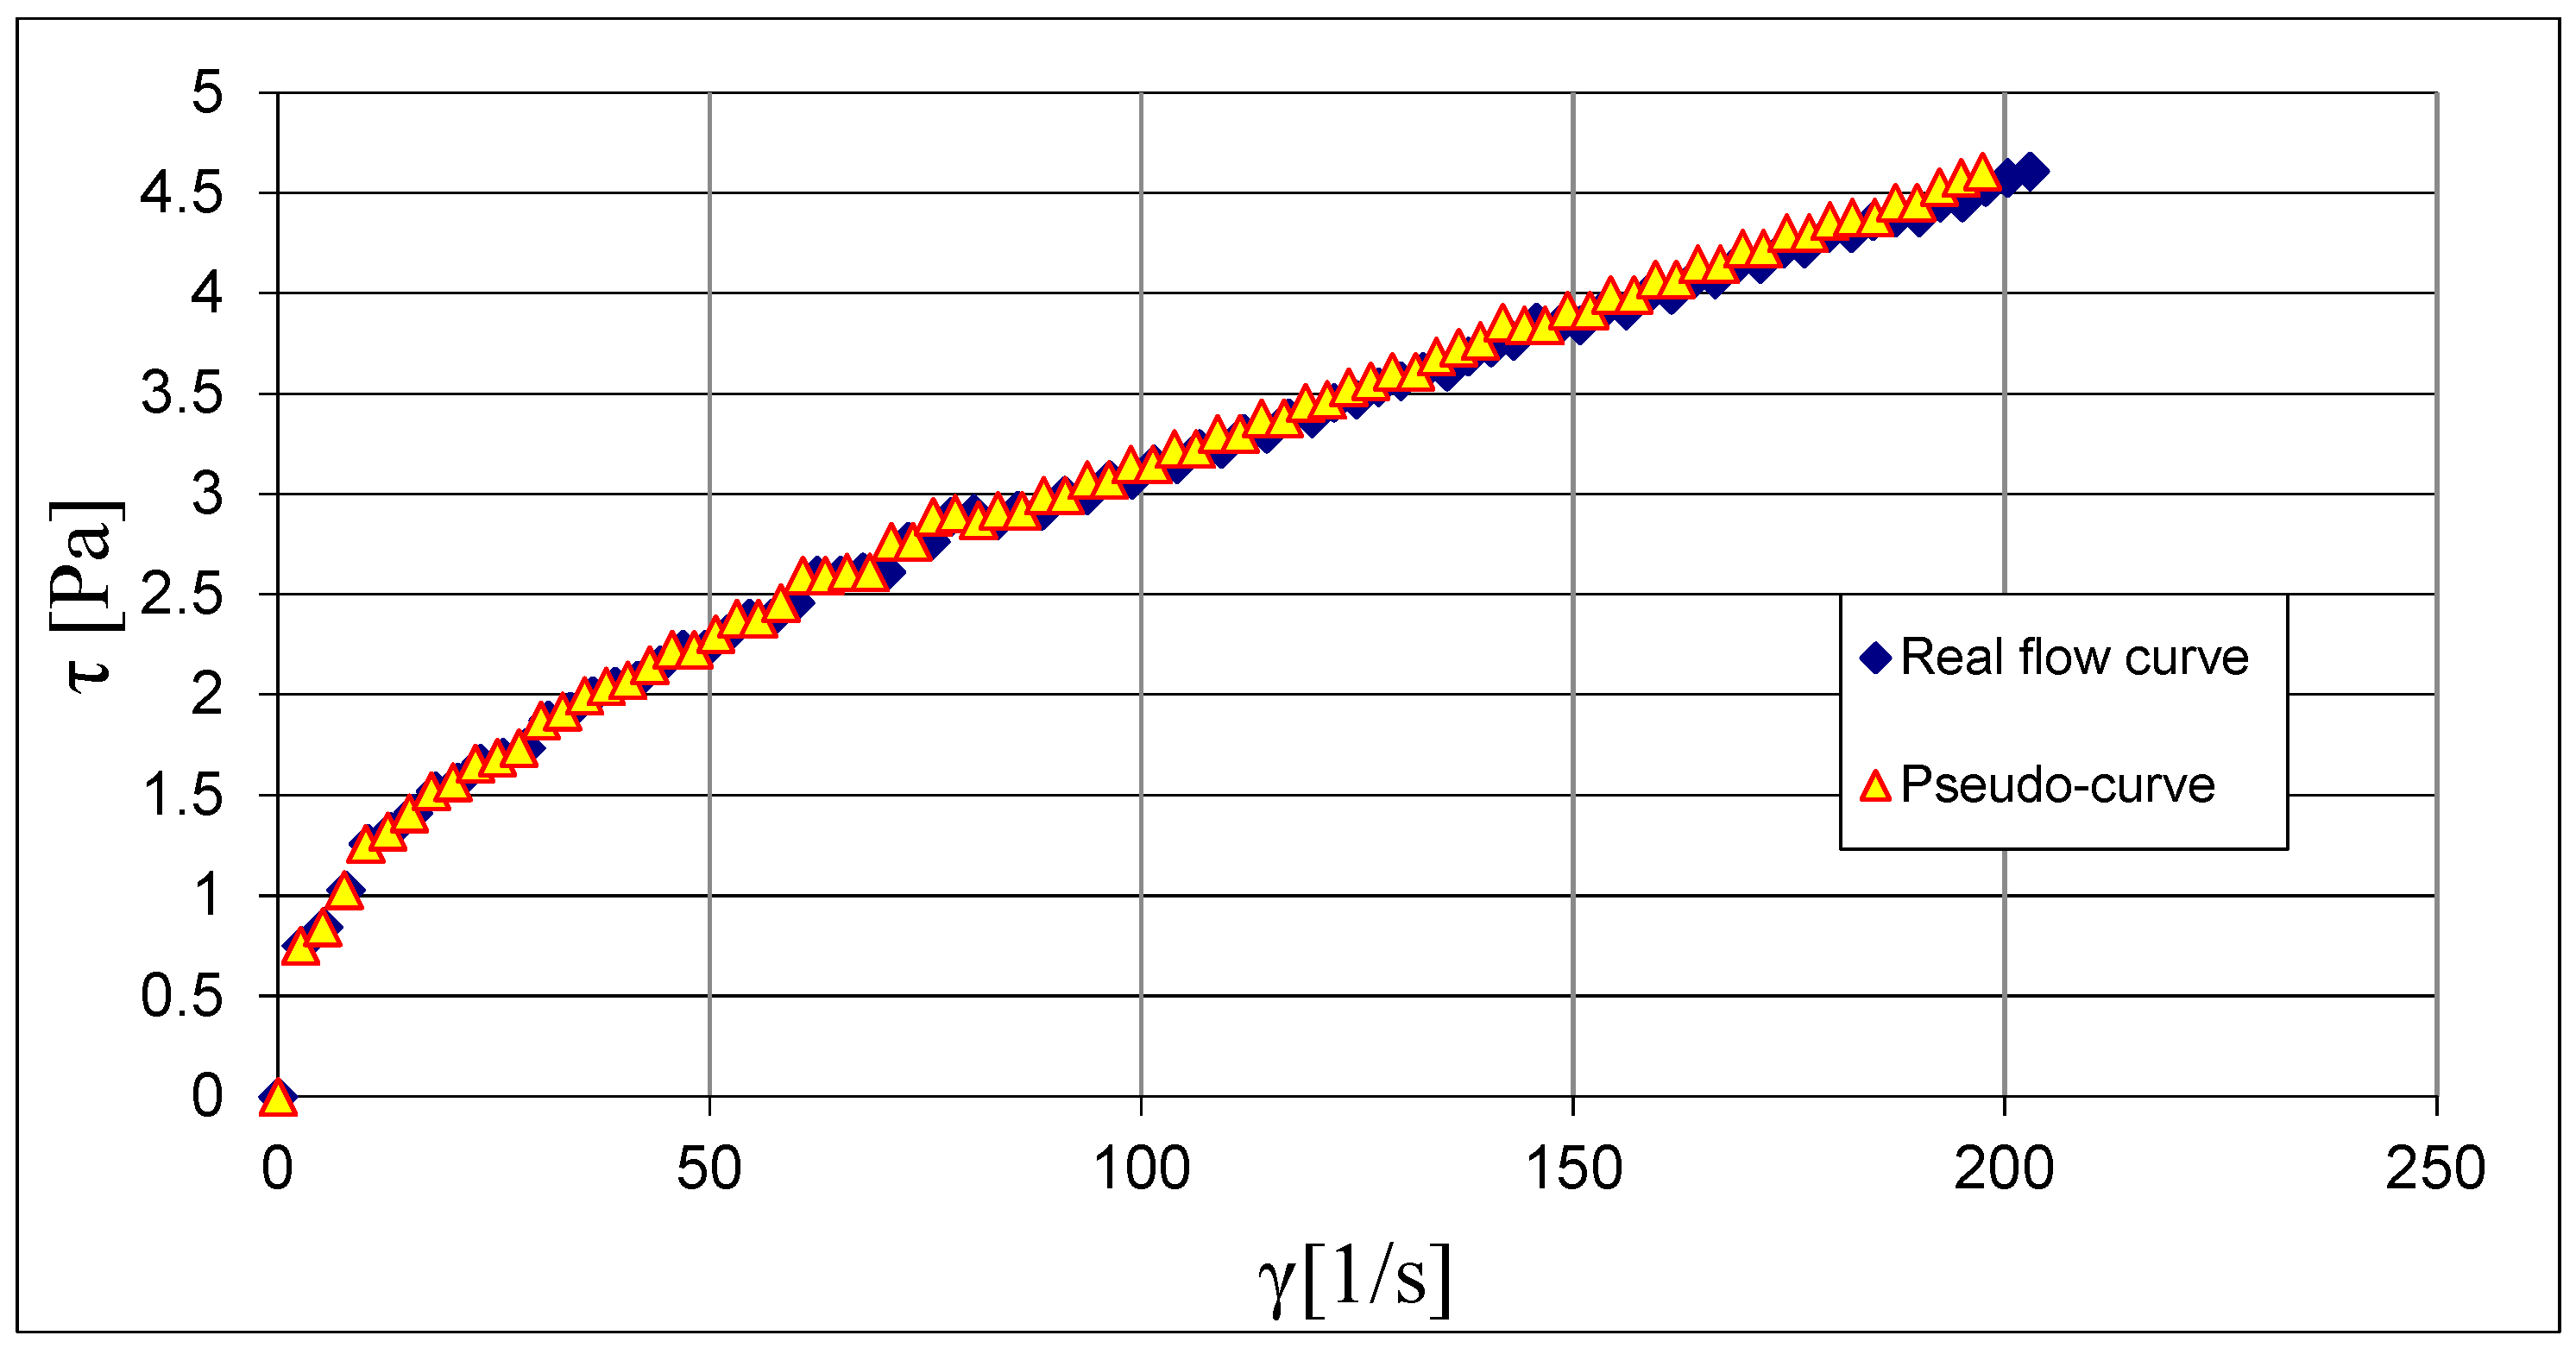
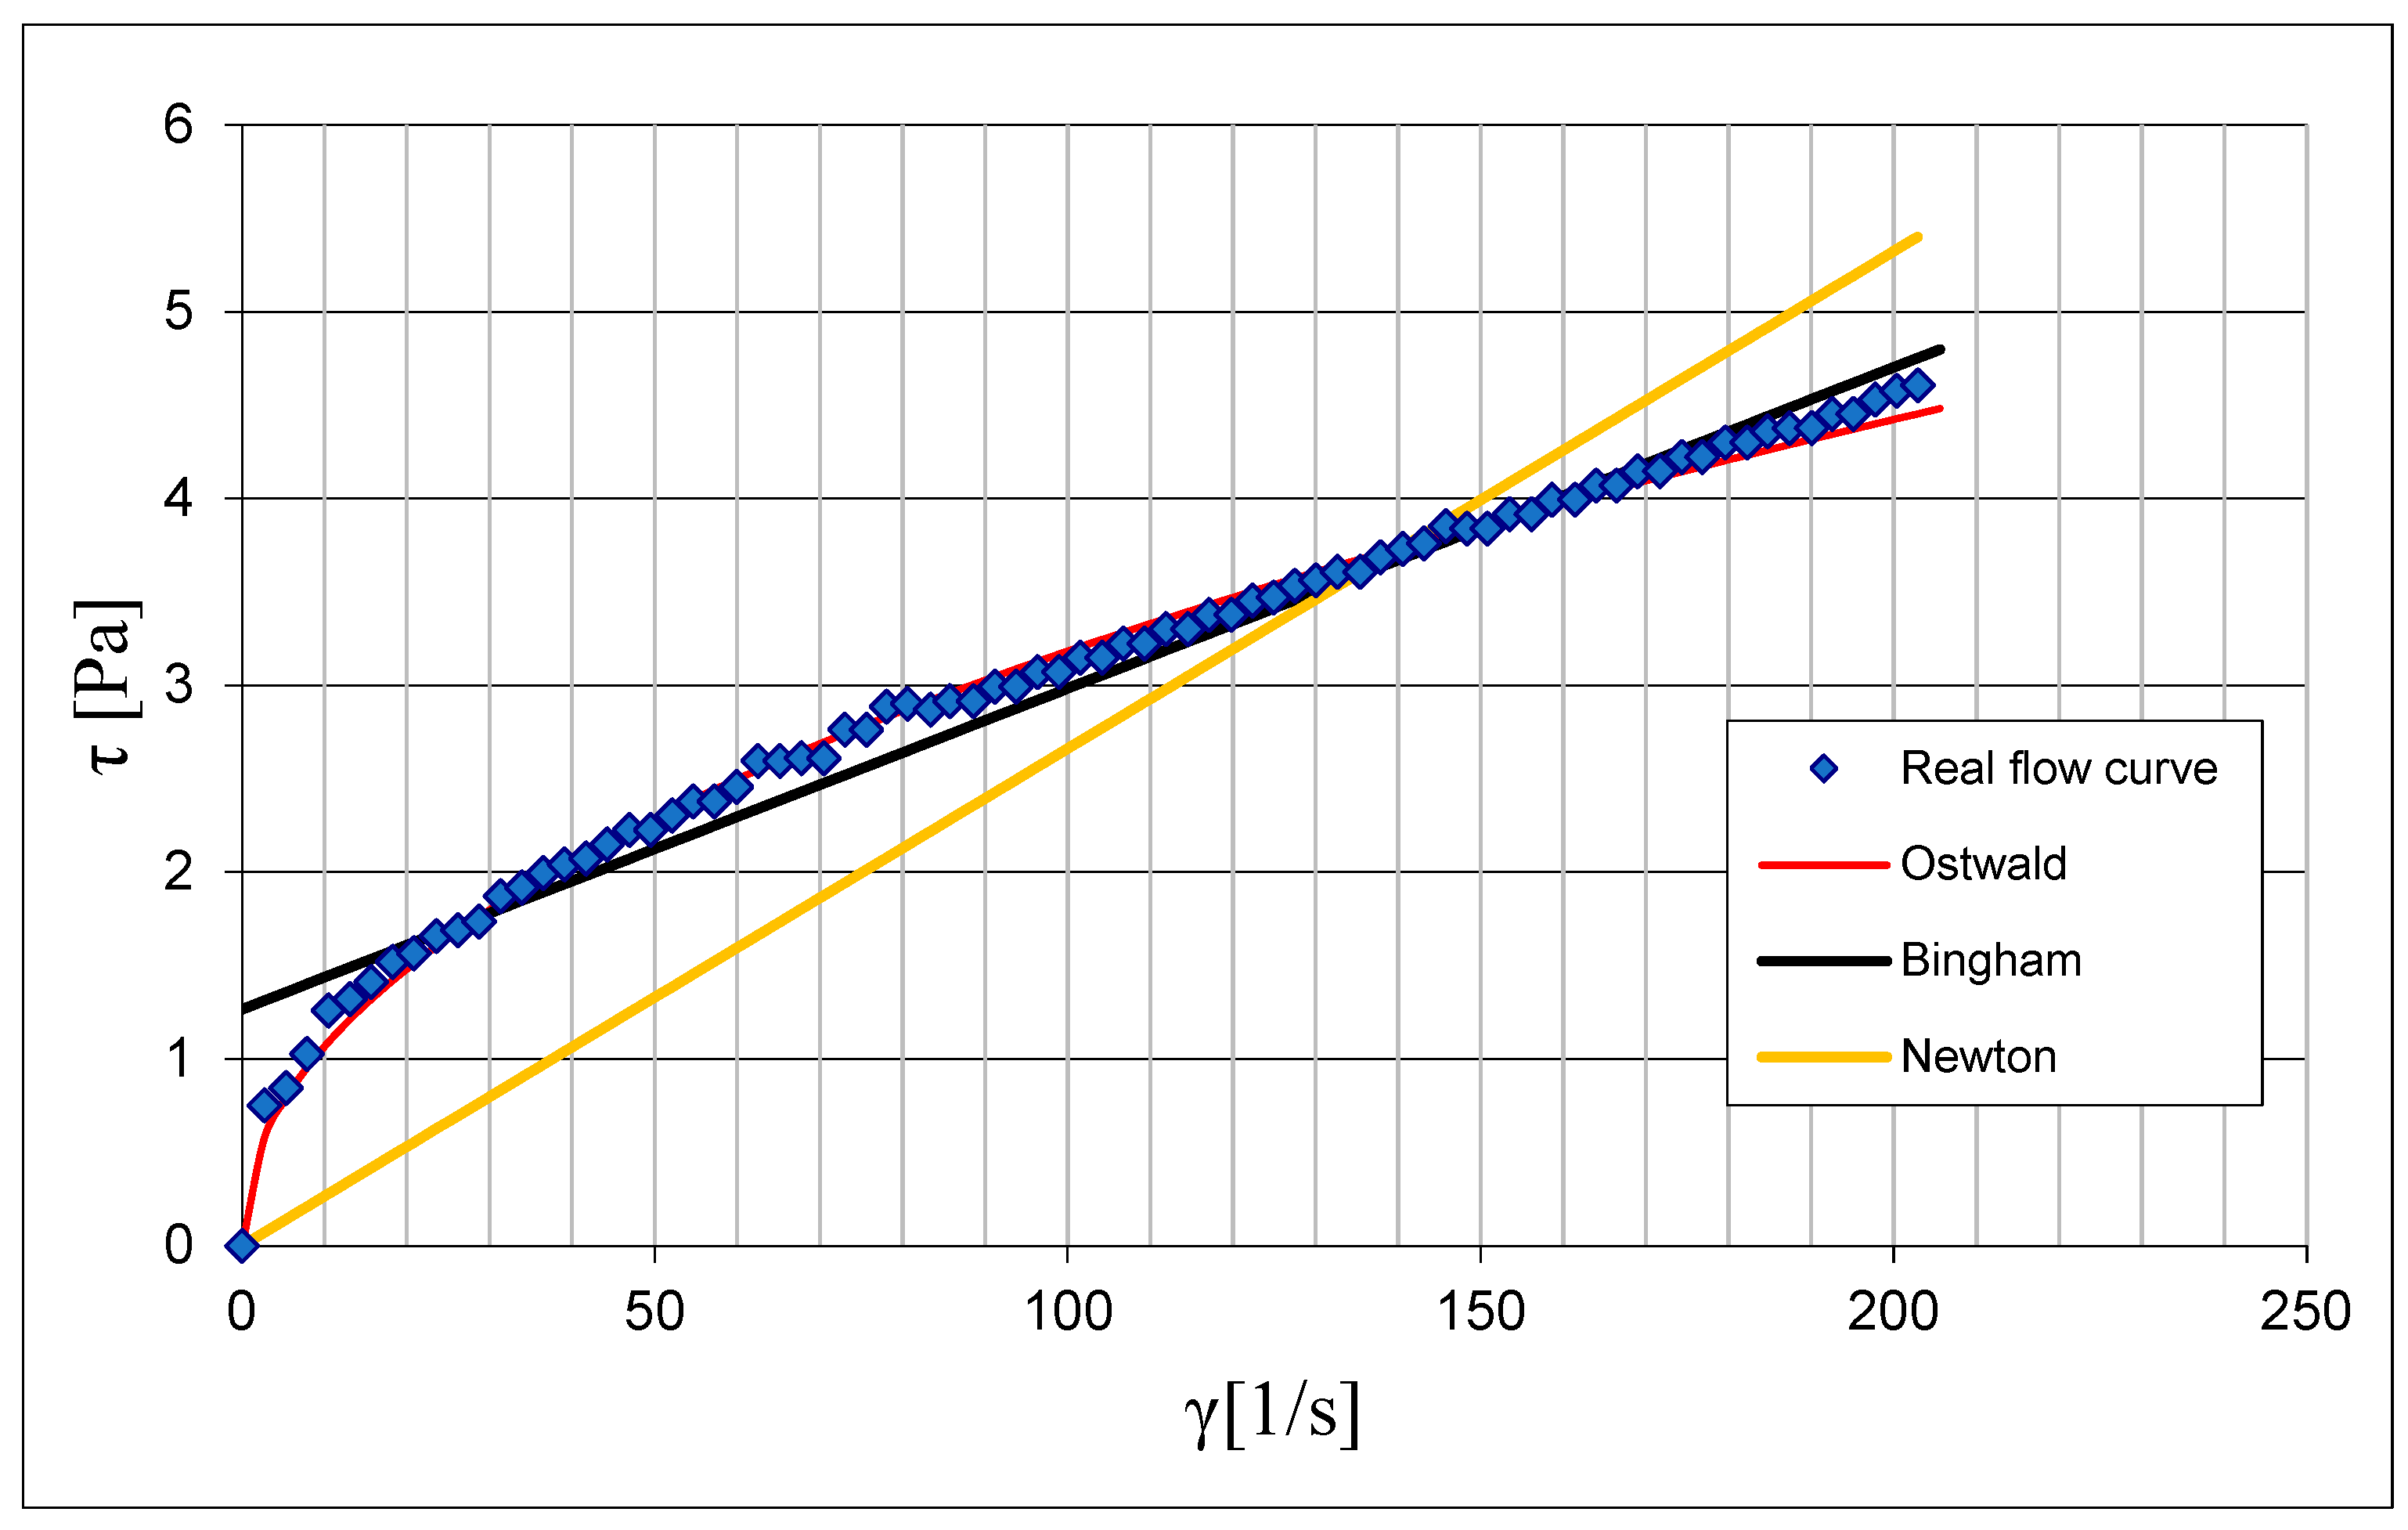
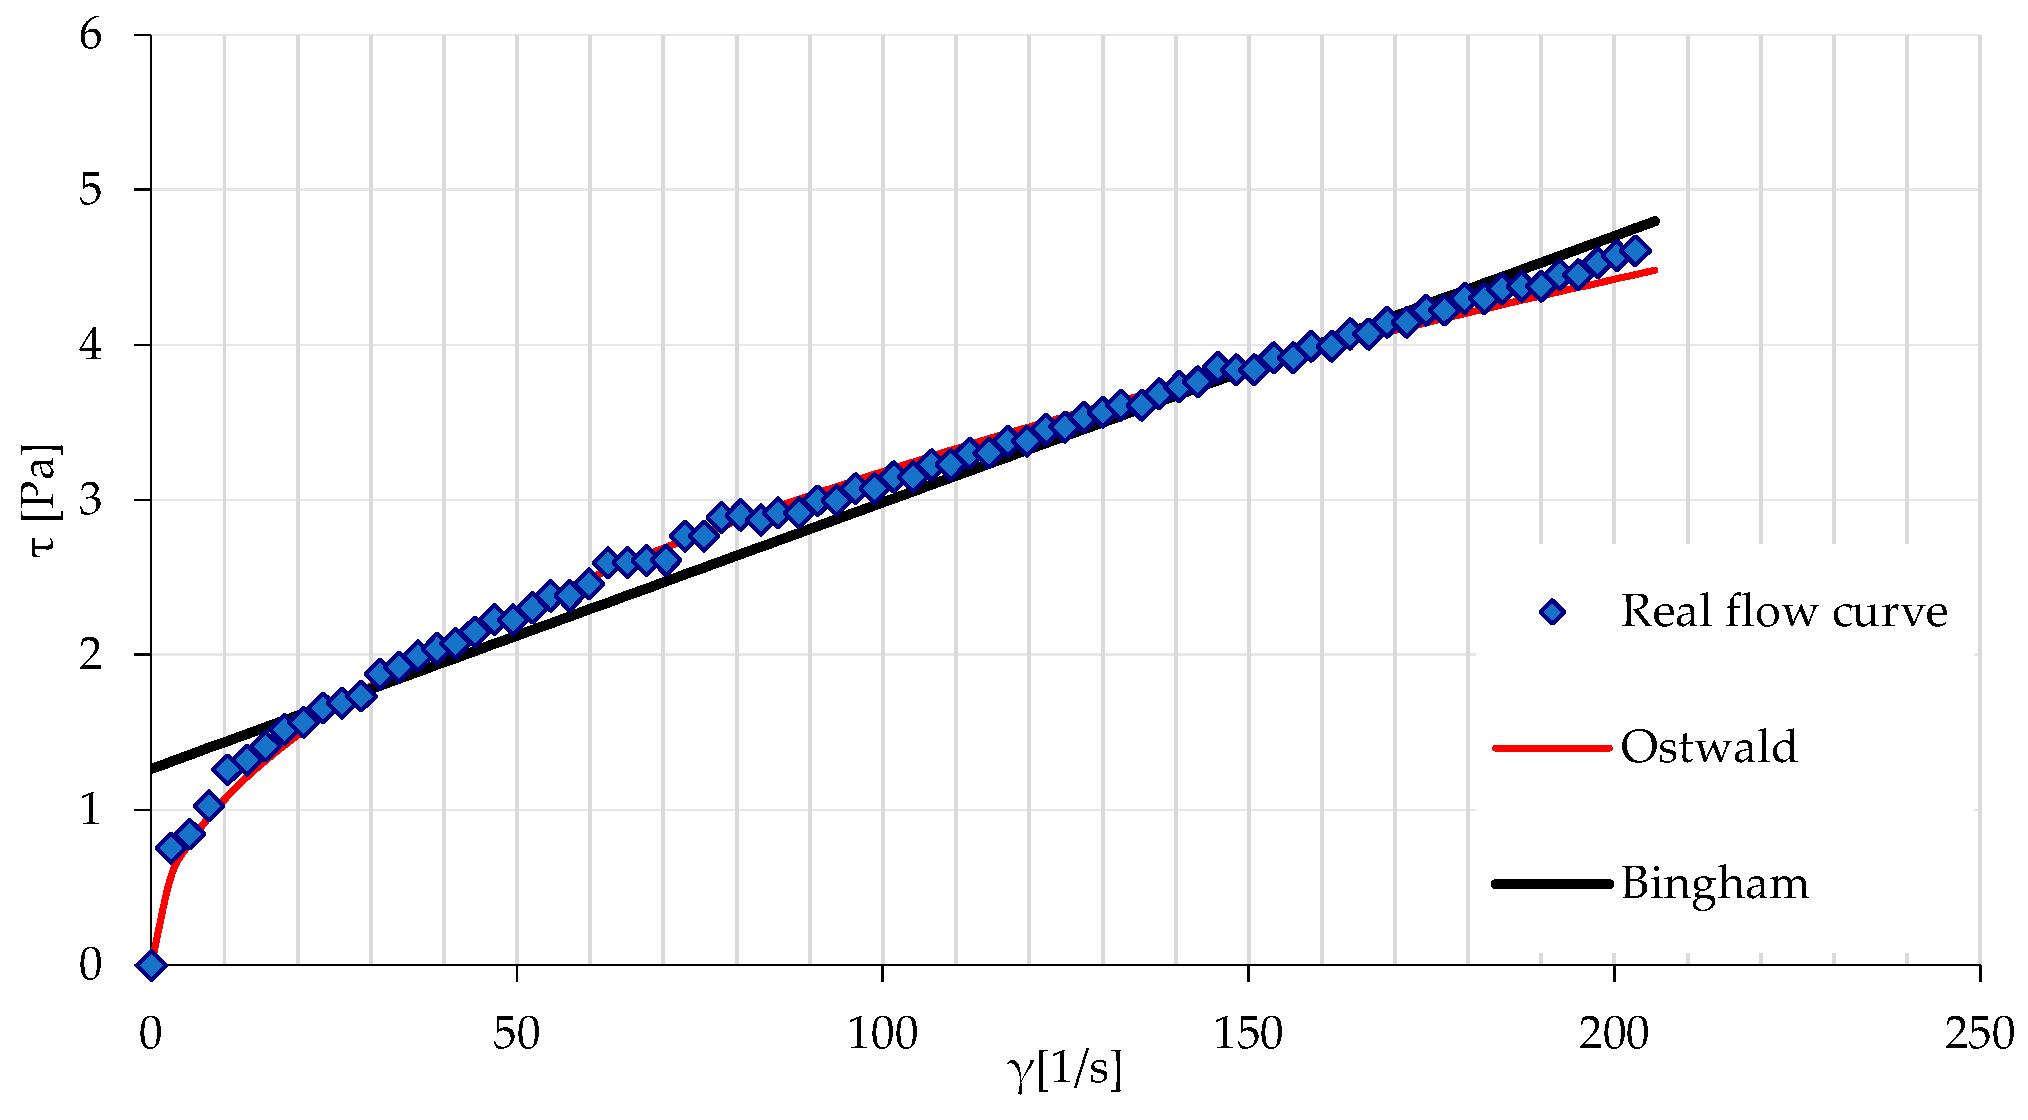
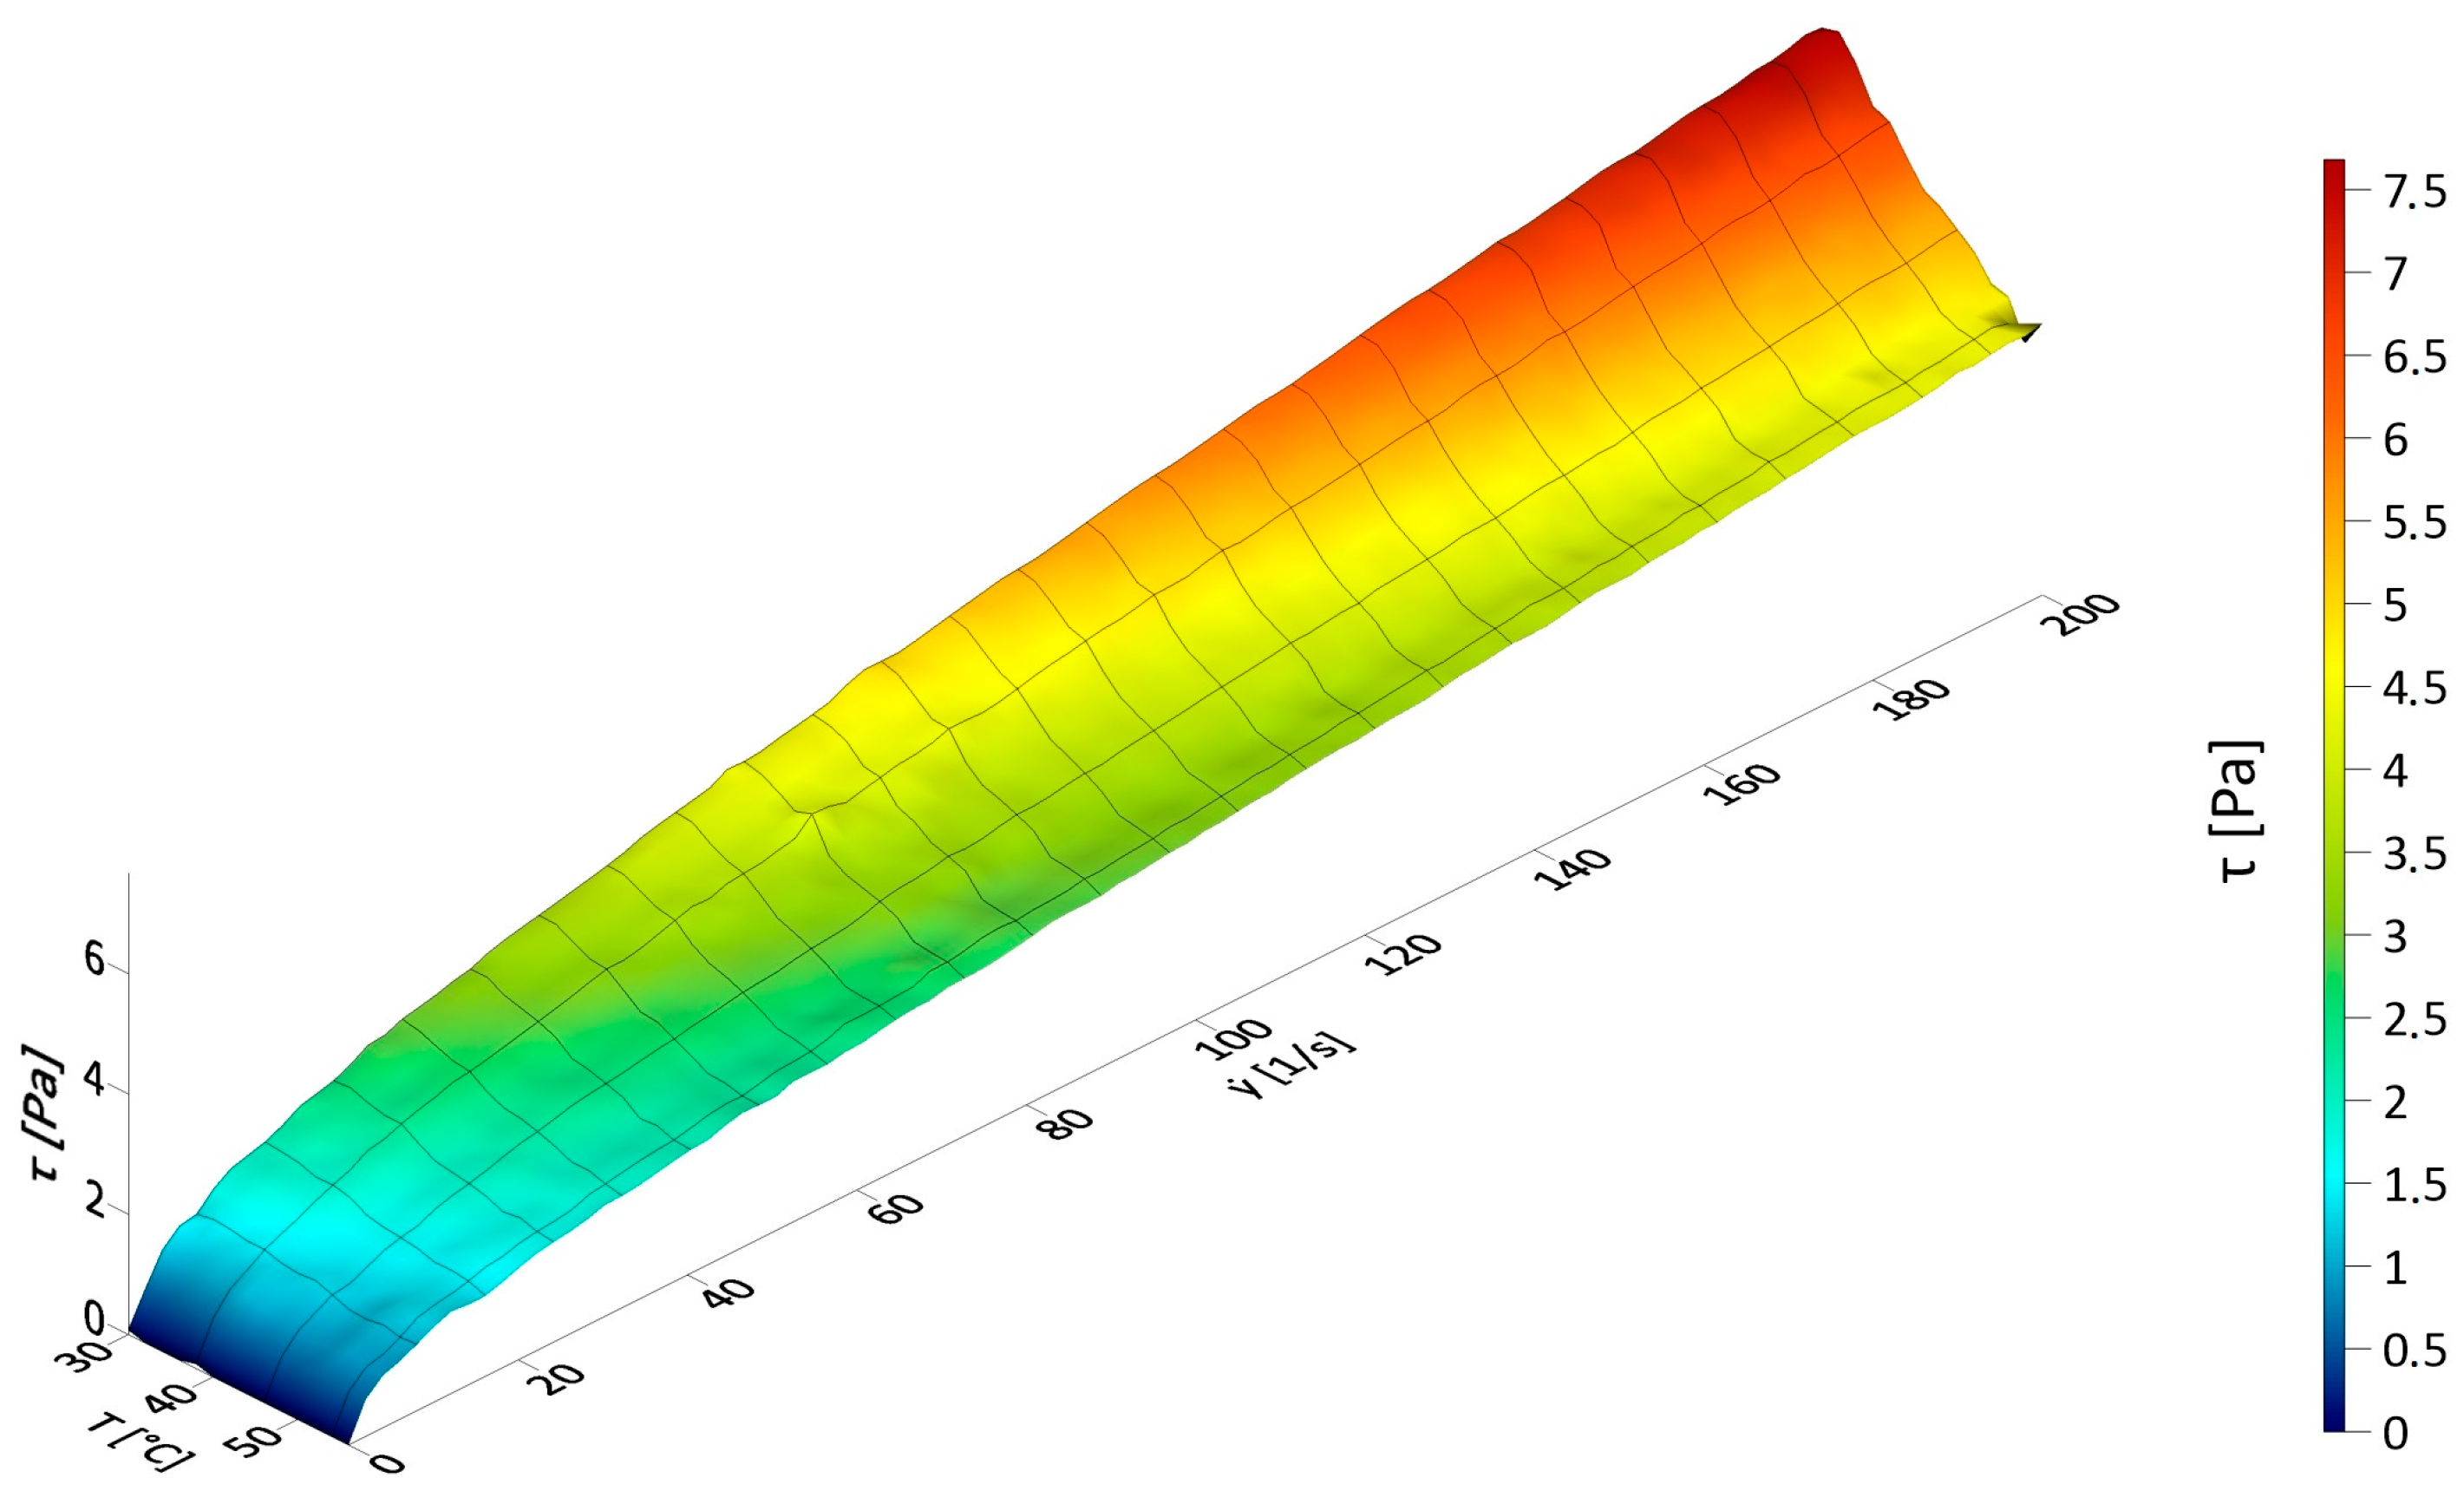
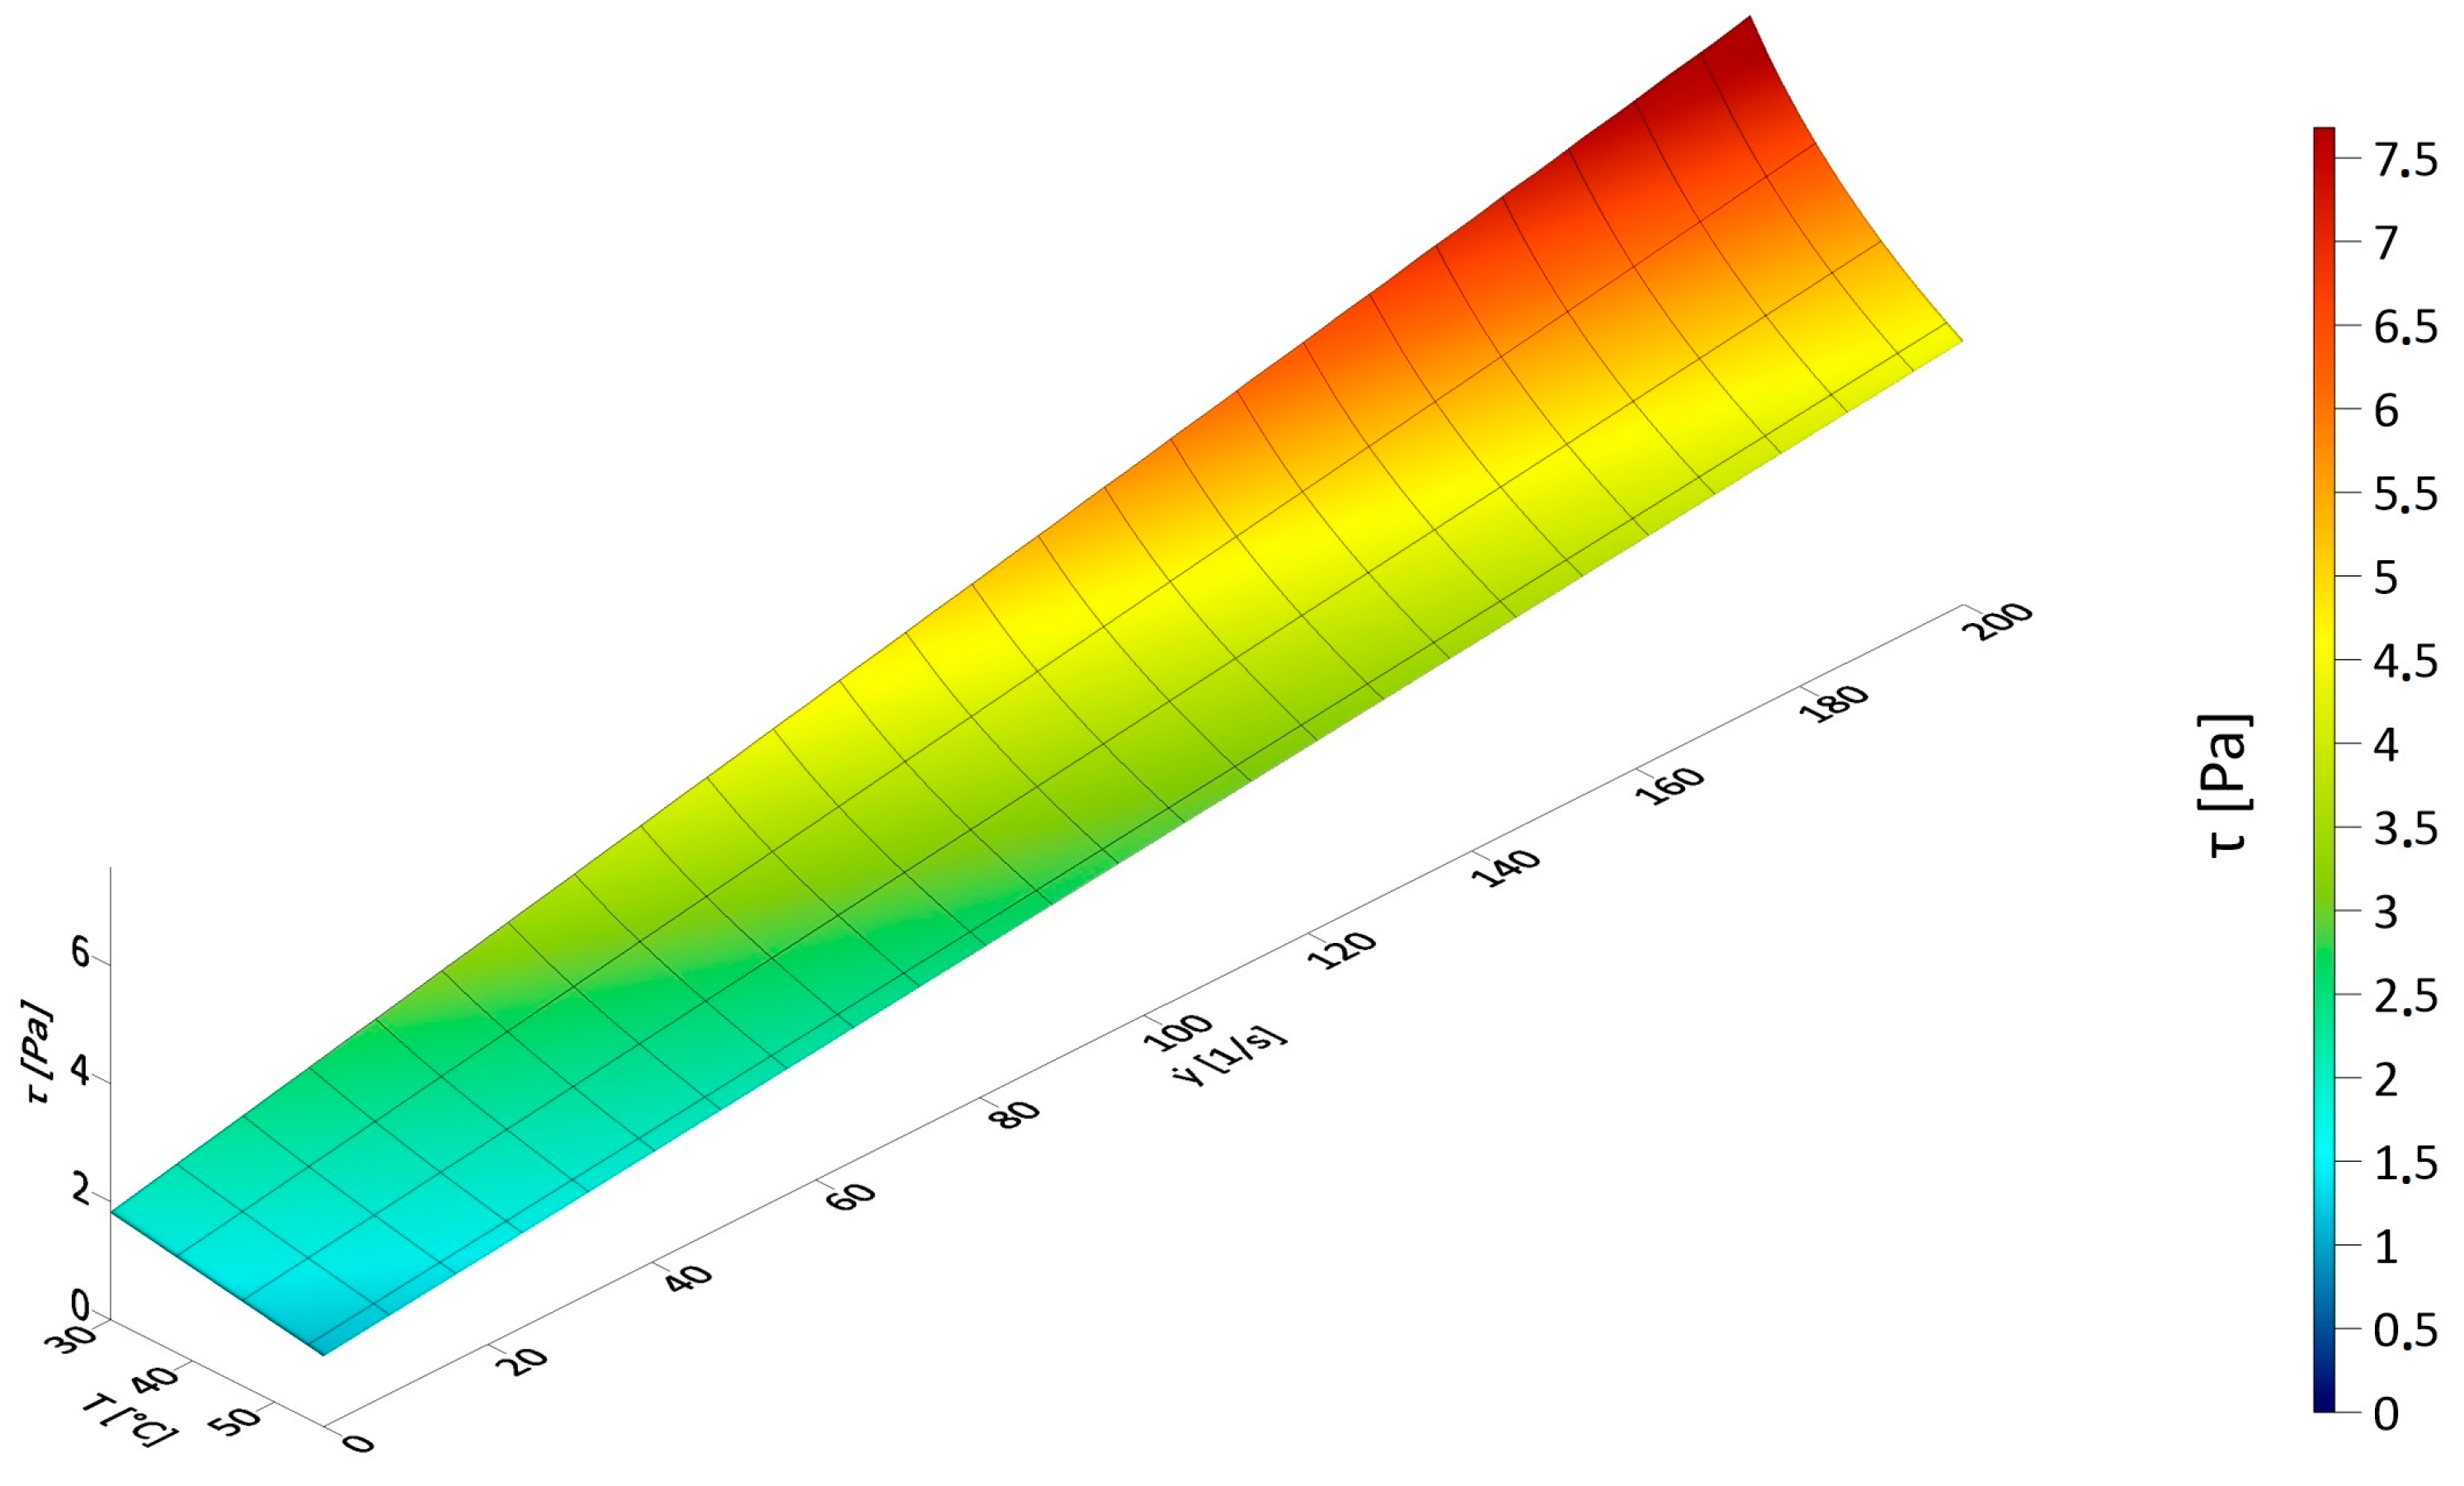
3.1. Results of Rheological Measurements

The tests were carried out in two campaigns (measurement and control), one day apart. In each campaign, 14 pseudo-flow curves were measured. The first sample measurement was taken at 30 °C, and each subsequent measurement at temperatures 2 degrees higher. The last measurement was taken at 56 °C—measurement no. 14. Then, the apparent deformation gradient was converted to the actual one. It was possible to present the results of each measurement campaign in the form of a solution plane, as presented in Figure 6. The plane describes the behavior of the test medium for three parameters: shear stress, actual deformation gradient and temperature.
Next, rheological parameters were determined for the two basic two-parameter rheological models: Bingham and Ostwald de Waele. Table 2 and Table 3 present the results of calculations of rheological parameters of selected models and the values of parameters describing the quality of fit. Three parameters were selected:
Coefficient of determination R2, in general, notation [50]
R 2 = i = 1 n ( y ^ n y ¯ ) 2 i = 1 n ( y n y ¯ ) 2
The mean absolute error (MAE) of estimation in the regression model is often used as a measure of fit in rheological studies [51,52]:
M E A = 1 n i = 1 n ( y n y ^ n )
The mean absolute percentage error (MAPE) is as follows:
M A P E = 1 n i = 1 n y n y ^ n y n · 100 %
Based on the analysis of the fit parameter values in Table 2 and Table 3, it can be concluded that the measurement results can be very accurately described using the Ostwald de Waele model, while the Bingham model describes the deformation process with lower accuracy.
The results of the measurement campaign, described using the Bingham rheological model, achieved flow threshold values ranging from 1.224 Pa to 1.825 Pa, while the viscosity ranged from 0.0156 N·s/m2 to 0.0301 N·s/m2. The values for the model fit parameters were achieved, showing a good representation of the research results with the Bingham model. The R2 reached values between 0.9552 and 0.9667, the MAE was in the range of 0.1194–0.2399%, while the MAPE (Mean Absolute Percentage Error) reached values in the range of 0.326–2.391%.
The measurement results were also described using the Ostwald model, which much more accurately describes the process of sample deformation under the influence of shear stress as a function of temperature. The resulting flow rate was in the range of 0.460–0.539, while the consistency coefficient was from 0.3413 Pa·sn to 0.4641 Pa·sn. The R2 reached values in the range of 0.992–0.999, the MAE was in the range of 0.0376–0.0723%, while the MAPE reached values in the range of 0.295–0.851%.
The values of rheological parameters and parameters describing the fit in the second control campaign reached very similar values; therefore, the values from measurement campaign 1 were used for further analyses.

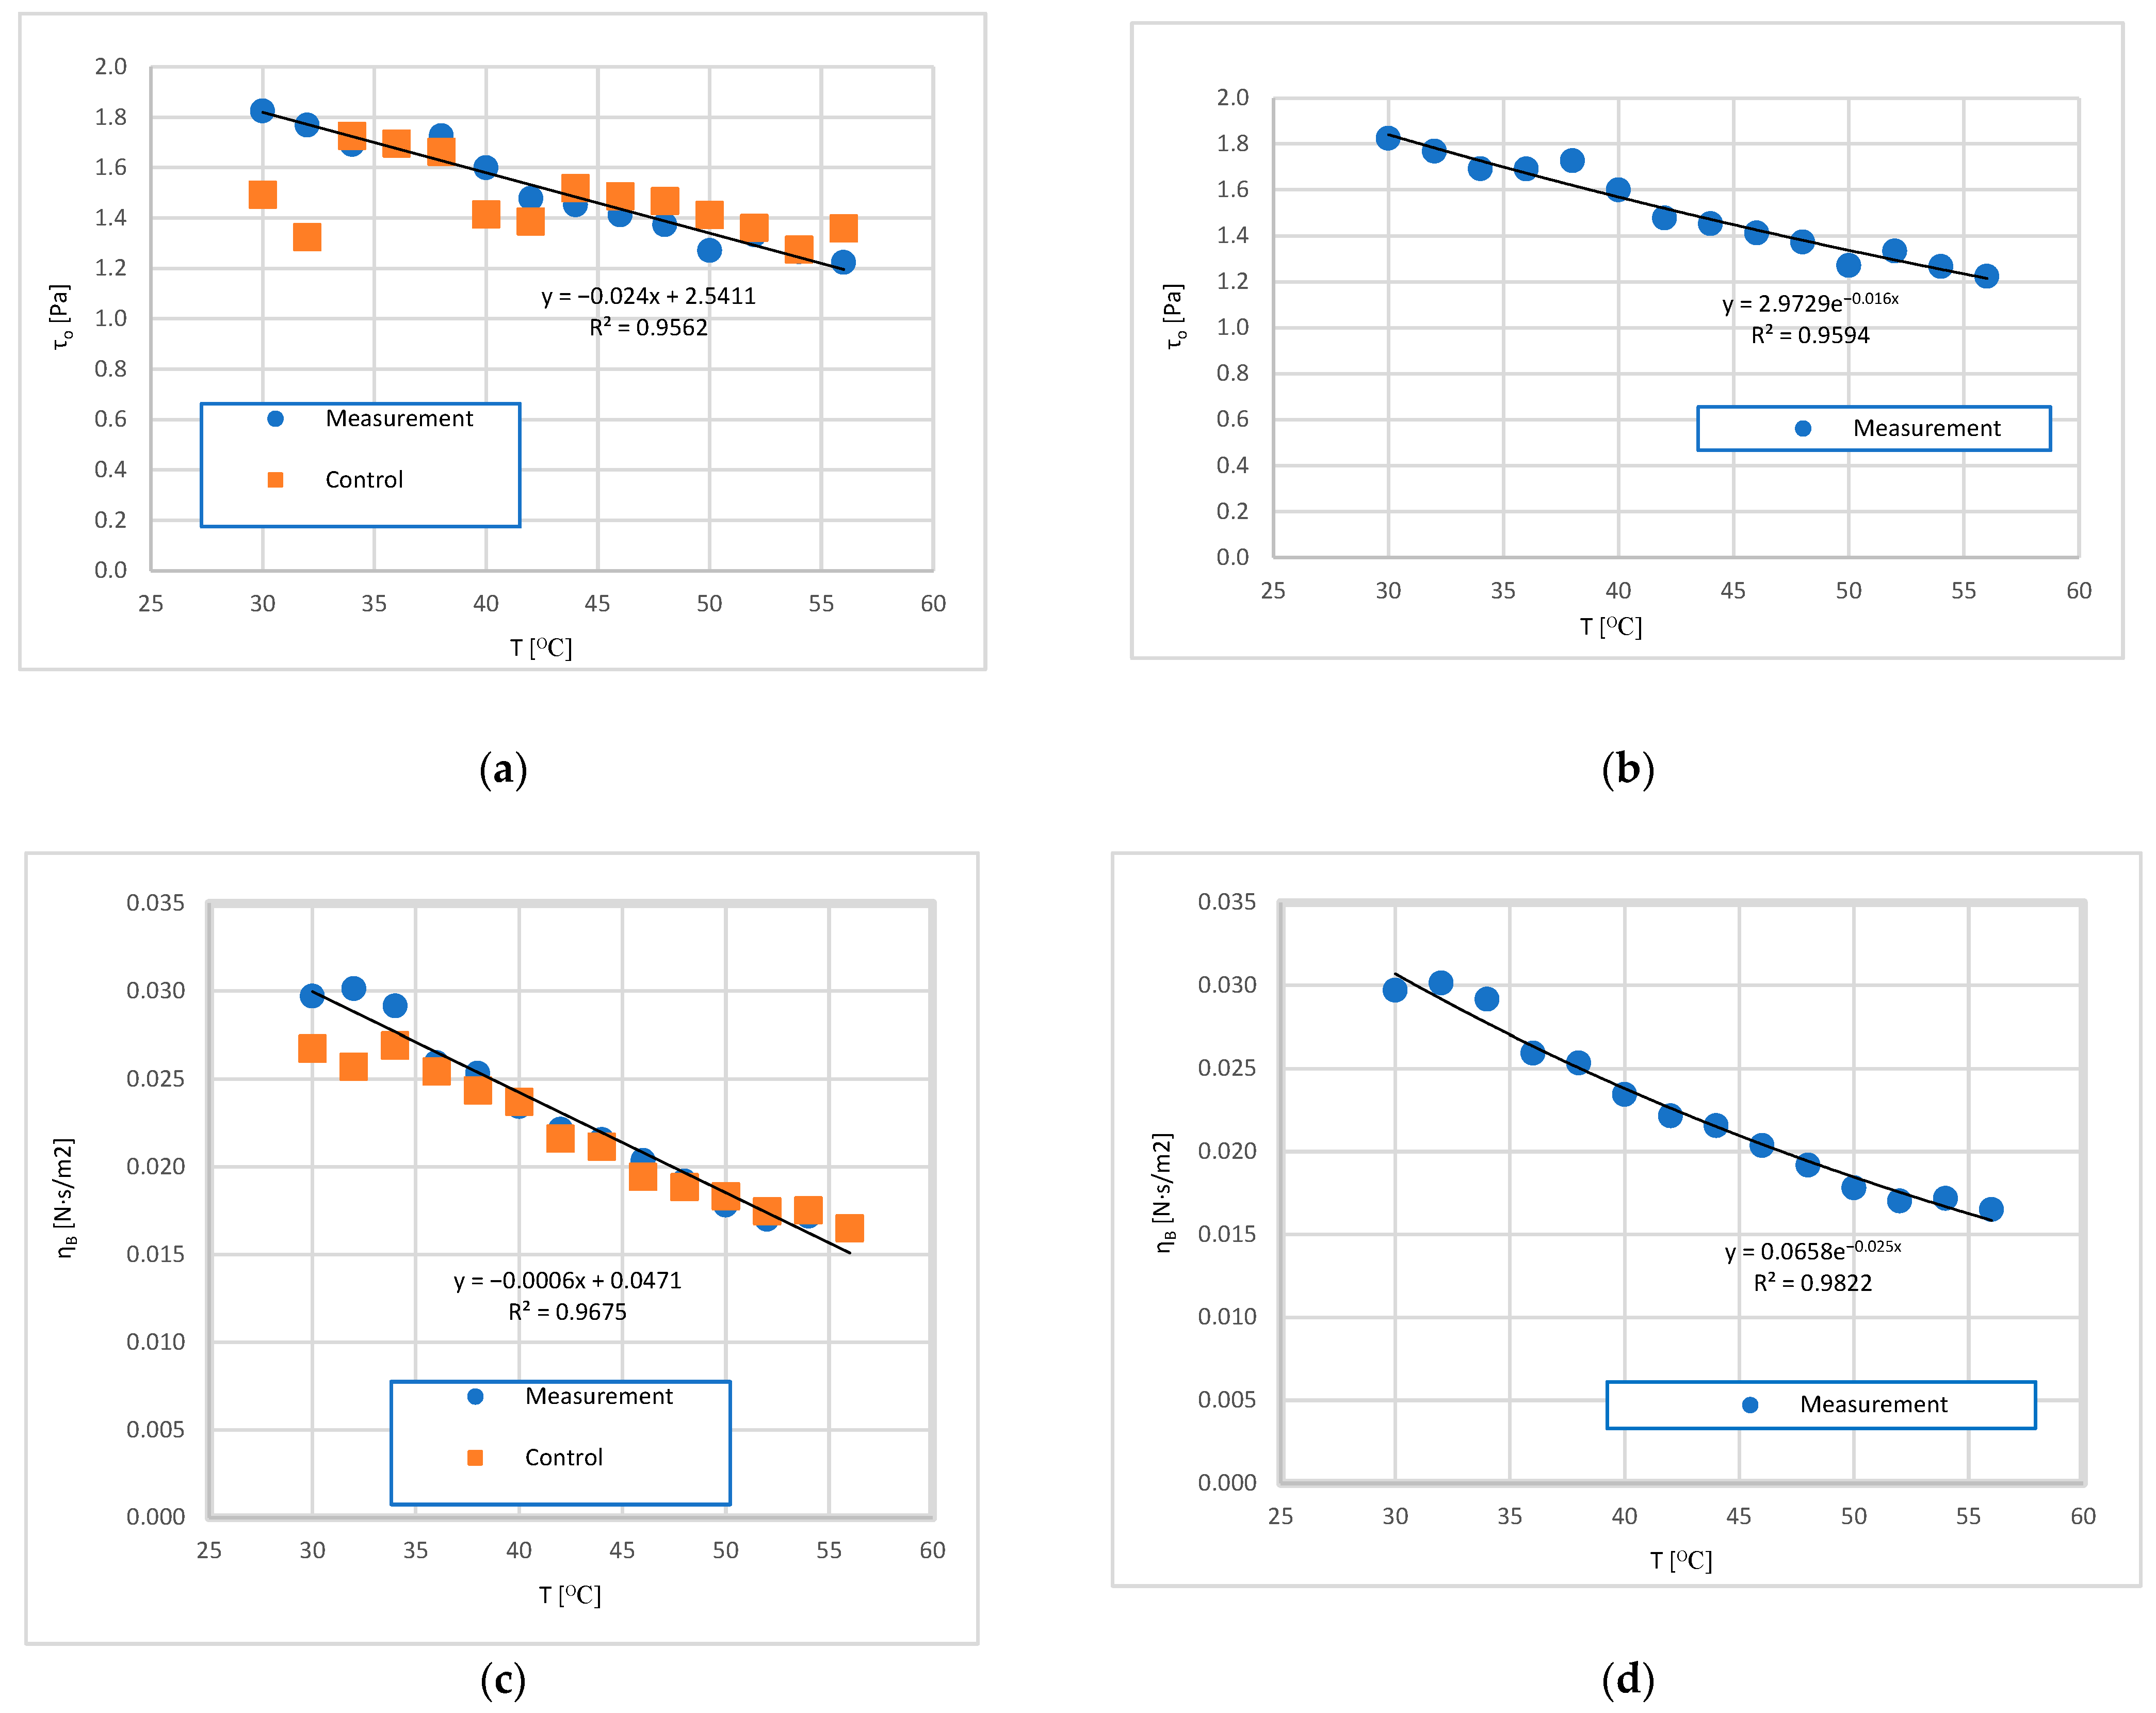
3.2. Analysis of the Influence of Mixture Temperature on the Values of the Bingham Model Parameters

During the course of this research, a problem was encountered related to the correct determination of the temperature of the test sample. Figure 7 shows the temperature change in the sample and the circulating fluid in the thermostatic bath. The temperature of the circulating fluid in the thermostatic bath is marked in a blue solid line. The temperature was measured continuously as it was possible in the case of the used bath, and the measurement did not interfere with the course of the experiment. The temperature change during the heating of the sample until the expected value was reached is marked in red. The measurement was performed “in situ” in the measuring cylinder of the rheometer and, for the duration of the sample shear, the thermometer head was removed so as not to interfere with the flow of the sample in the gap of the rheometer set. As can be seen, there was a significant difference between the sample and fluid temperature—from 2.5 °C to 3.0 °C. This study followed the guidelines found in [42]. The heating time of a sample must not be too long, as the concentration of fluid changes during heating. The sample temperature was taken as the value of the sample temperature measured after its collection.
For measurement campaign 1 and control campaign 2, the change in rheological parameter values as a function of temperature was determined. The mathematically correct and relatively simple model describing the change in the rheological parameter as a function of temperature was then used to model the feedstock flow in the bioreactor for different liquid temperatures. The two simplest models, the linear model and the exponential model, were chosen to describe the correlation:
f r h e o l o g i c a l   p a r a m e t e r = a T + b
where
  • a—directional coefficient of the function [-],
  • b—free expression of the function [-],
  • T—fluid temperature [°C],
  • and
f r h e o l o g i c a l   p a r a m e t e r = c e d T   b
where
  • c—base of the exponential function [-],
  • d—function parameter [-].
The process of calculating the values of the individual model parameters was similar to that used when describing flow curves using rheological models, i.e., using the least squares method, and, as in the case of rheological models, three parameters describing the fit were selected, i.e., the R2, the MAE and the MAPE.

3.2.1. Rheological Parameters of the Bingham Model as a Function of Temperature

The flow threshold and viscosity values of the Bingham model are described by a linear function (Figure 8a,b). The following parameter values were obtained: aBτo = −0.024 and bBτo = 2.5411; fit parameter values: R2 = 0.9562, MAE = 0.0328 Pa and MAPE = 2.243% for the flow threshold; aBh = −0.0006 and bBh = 0.0471; and fit parameter values: R2 = 0.9672, MAE = 0.0012 N·s/m2 and MAPE = 5.892% for viscosity in the Bingham model (Table 4).
Then, the course of the flow threshold and viscosity values in the Bingham model were described by an exponential function (Figure 8c,d). The following parameter values were obtained: cBτo = 2.9729 and dBτo = −0.016; fit parameter values: R2 = 0.9582, MAE = 0.0304 Pa and MAPE = 2.015% for the flow threshold; cBh = 0.0658 and dBh = −0.025; and fit parameter values: R2 = 0.9805, MAE = 0.0007 N·s/m2 and MAPE = 2.973 for viscosity in the Bingham model (Table 4).
A linear model was selected to describe the surface depicting the deformation gradient, shear stress as a function of temperature, as it is mathematically simpler, and, for the analyzed temperature range in the bioreactor chamber, the advantage of using the more difficult power law model is insignificant. This also applies to further analyses using CFD modeling, in the case of which the linear model is better due to its easier implementation in numerical fluid mechanic models. Figure 9 shows the solution surface using the linear model for the Bingham model.

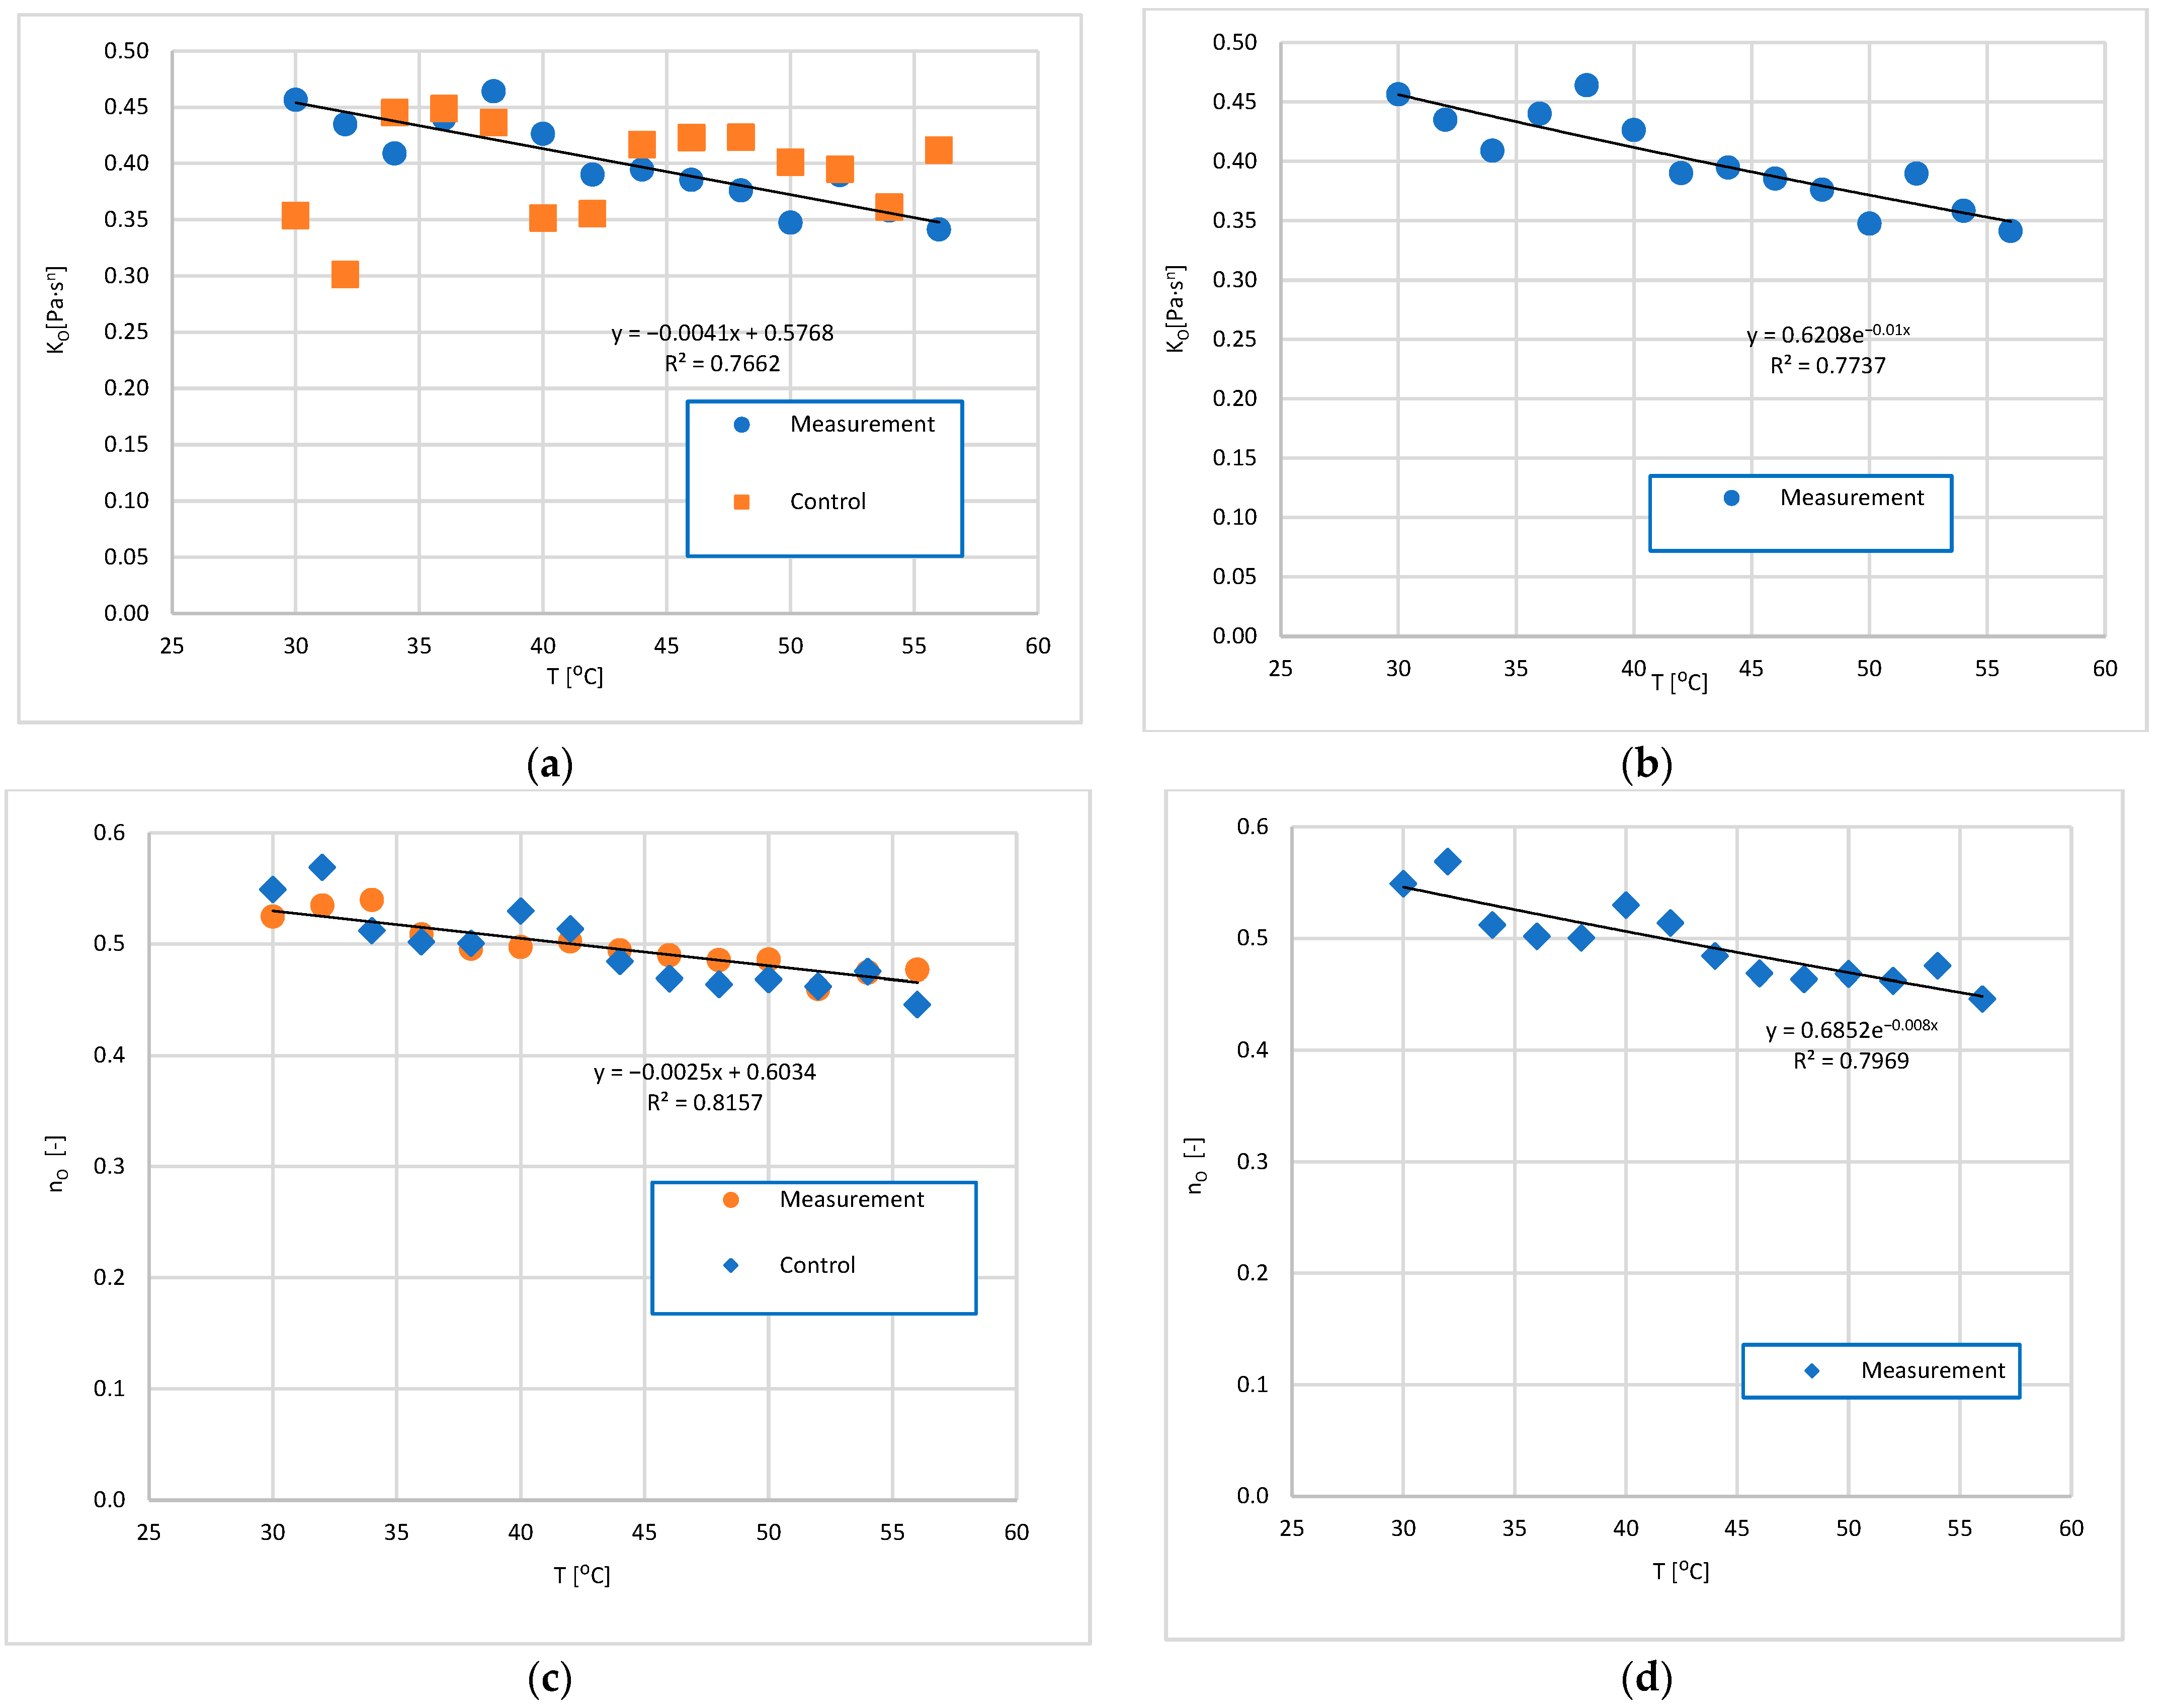
3.2.2. Rheological Parameters of the Ostwald Model as a Function of Temperature

The consistency coefficient and flow rate values in the Ostwald model are described by a linear function (Figure 10a,c). The following parameter values were obtained: aOK = −0.0041 and bOK = 0.5768; fit parameter values: R2 = 0.7662, MAE = 0.0137 Pa·sn and MAPE = 3.3647% for the consistency coefficient; aOn = −0.0025 and bOn = 0.6034; and fit parameter values: R2 = 0.8157, MAE = 0.0078 and MAPE = 1.5524 for the flow rate in the Ostwald model (Table 5).
Then, the course of the values of the consistency coefficient and the flow rate in the Ostwald model were described by an exponential function (Figure 10b,d). The following parameter values were obtained: cOK = 0.6208 and dOK = −0.01; fit parameter values: R2 = 0.7616, MAE = 0.0152 Pa·sn and MAPE = 3.8036% for the consistency coefficient; cOn = 0.6852 [-] and dOn = −0.008; and fit parameter values: R2 = 0.8221, MAE = 0.0153 Pa·sn and MAPE = 3.1064% for the flow rate in the Ostwald model (Table 5).
A linear model was chosen to describe the surface depicting the deformation gradient, shear stress as a function of temperature, as in the case of the Bingham model. Figure 11 shows the solution surface using the linear model for the Ostwald model.

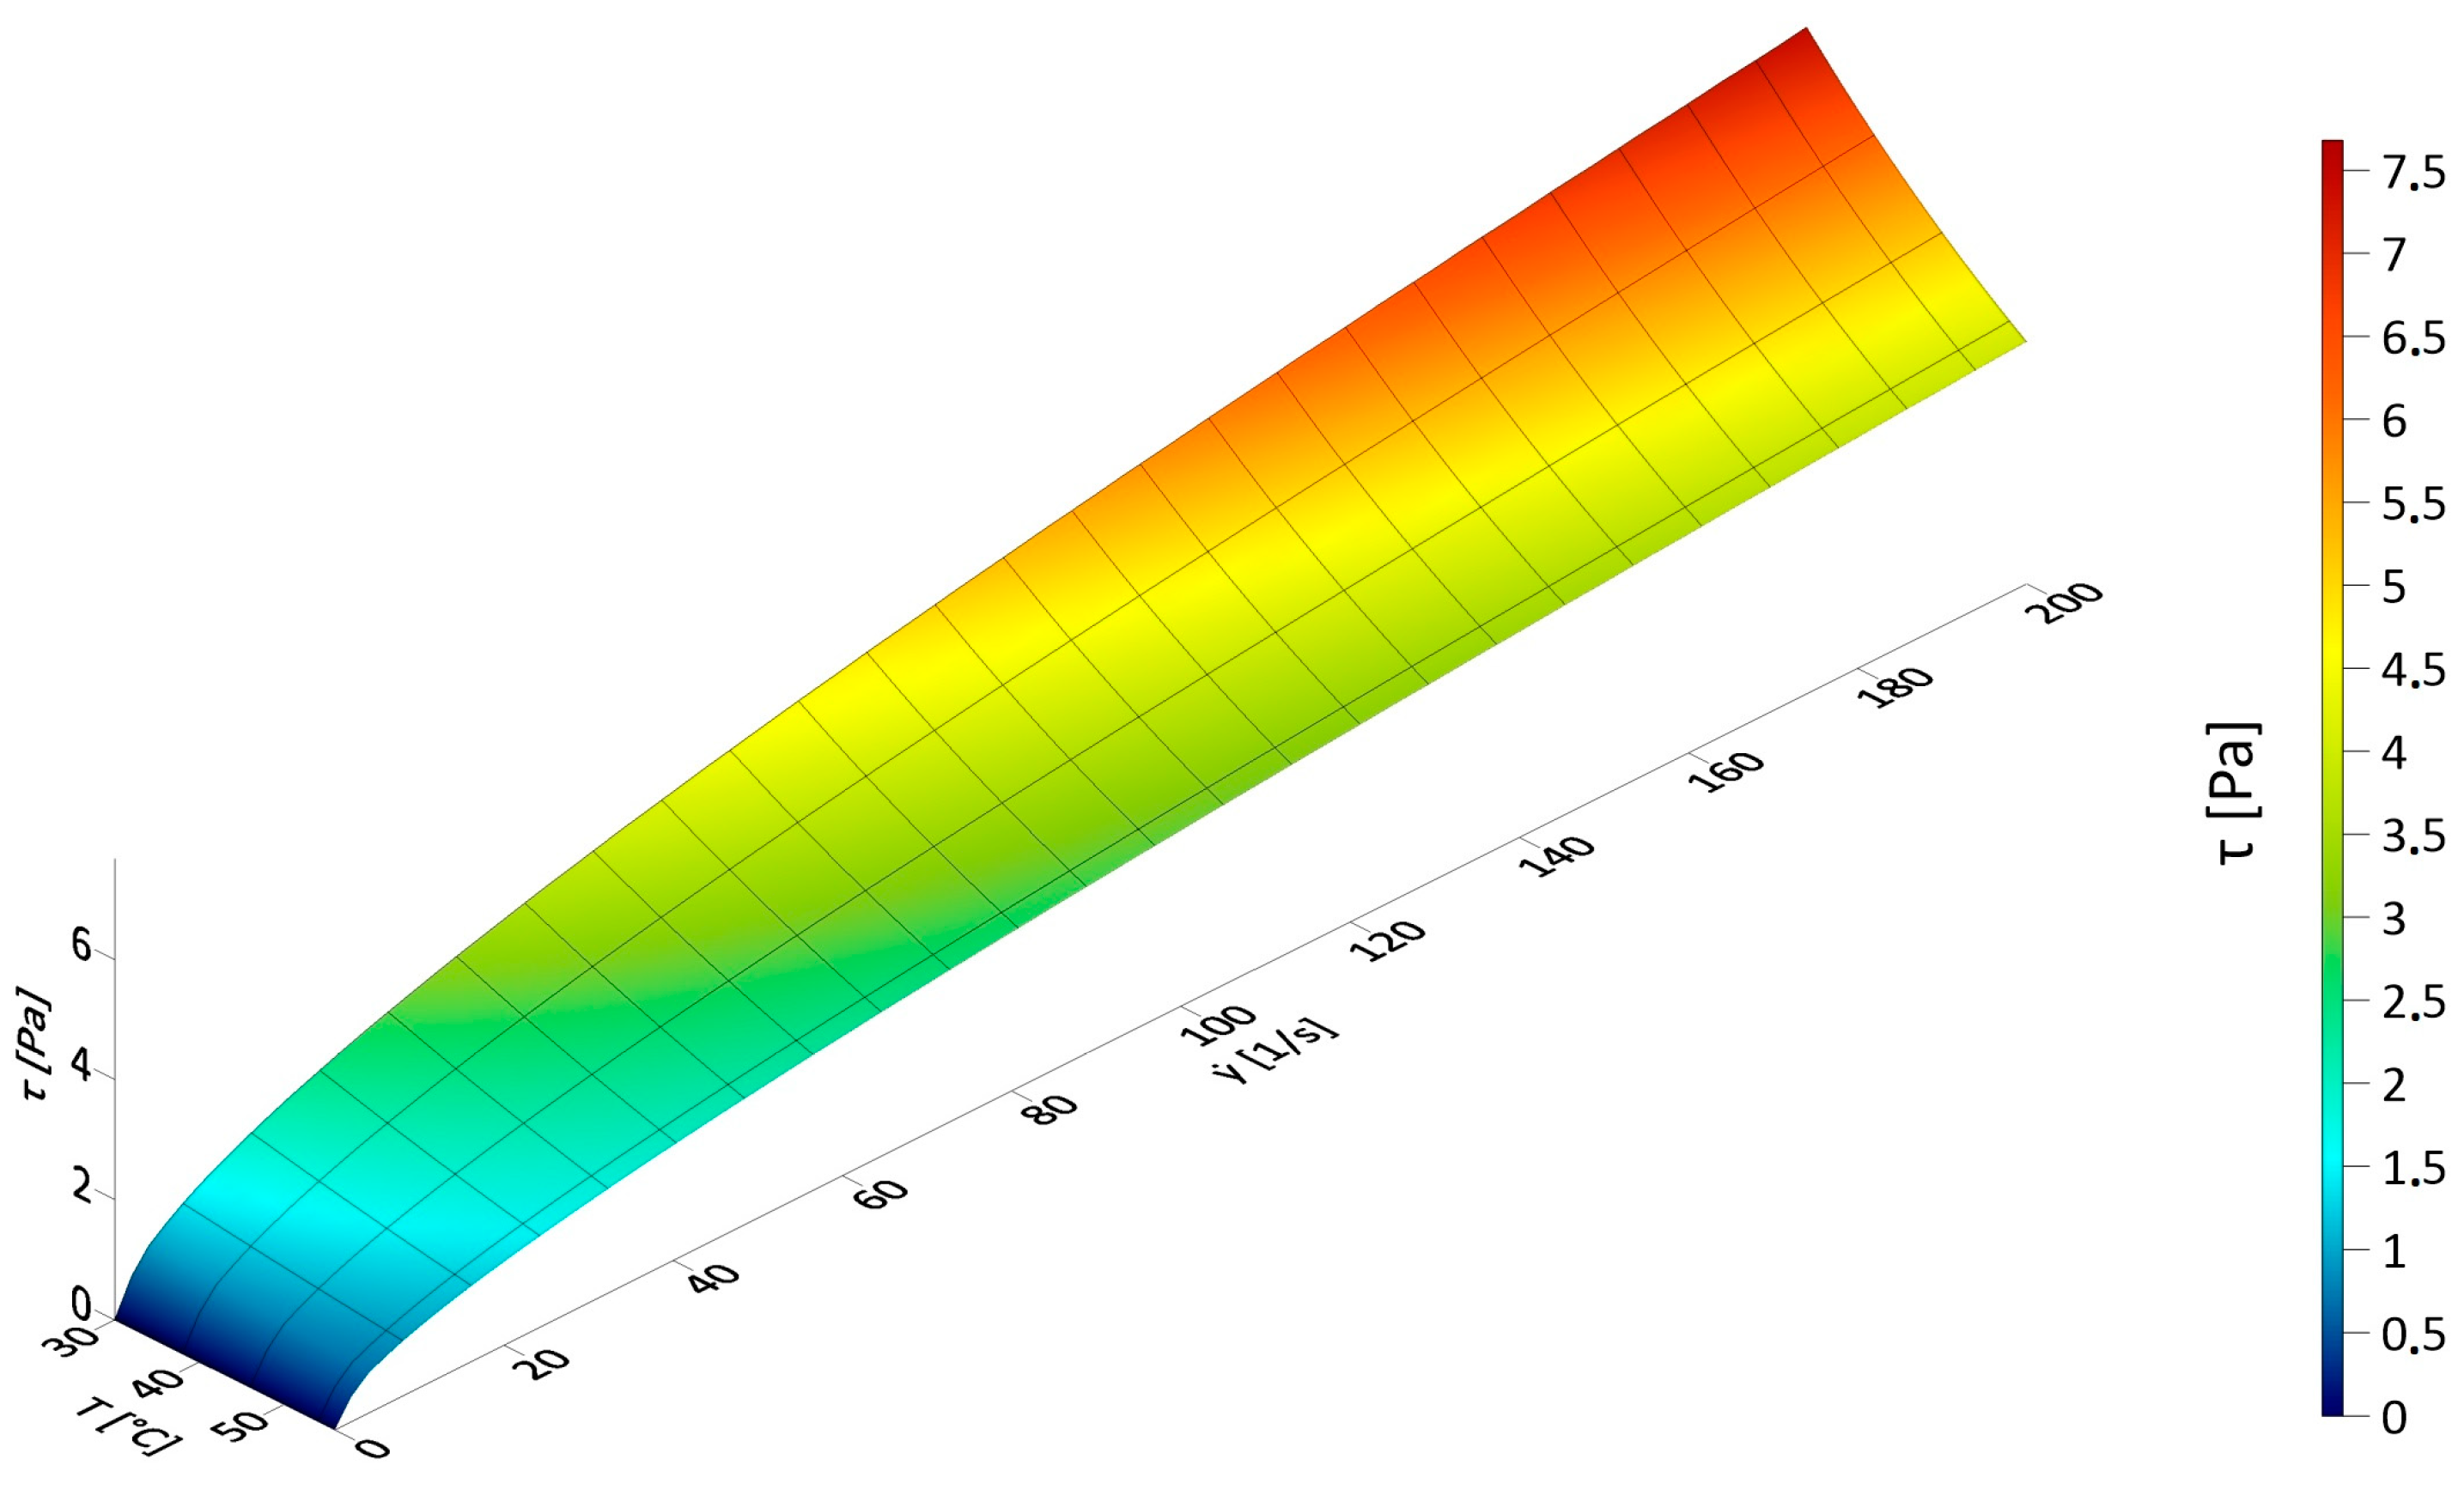
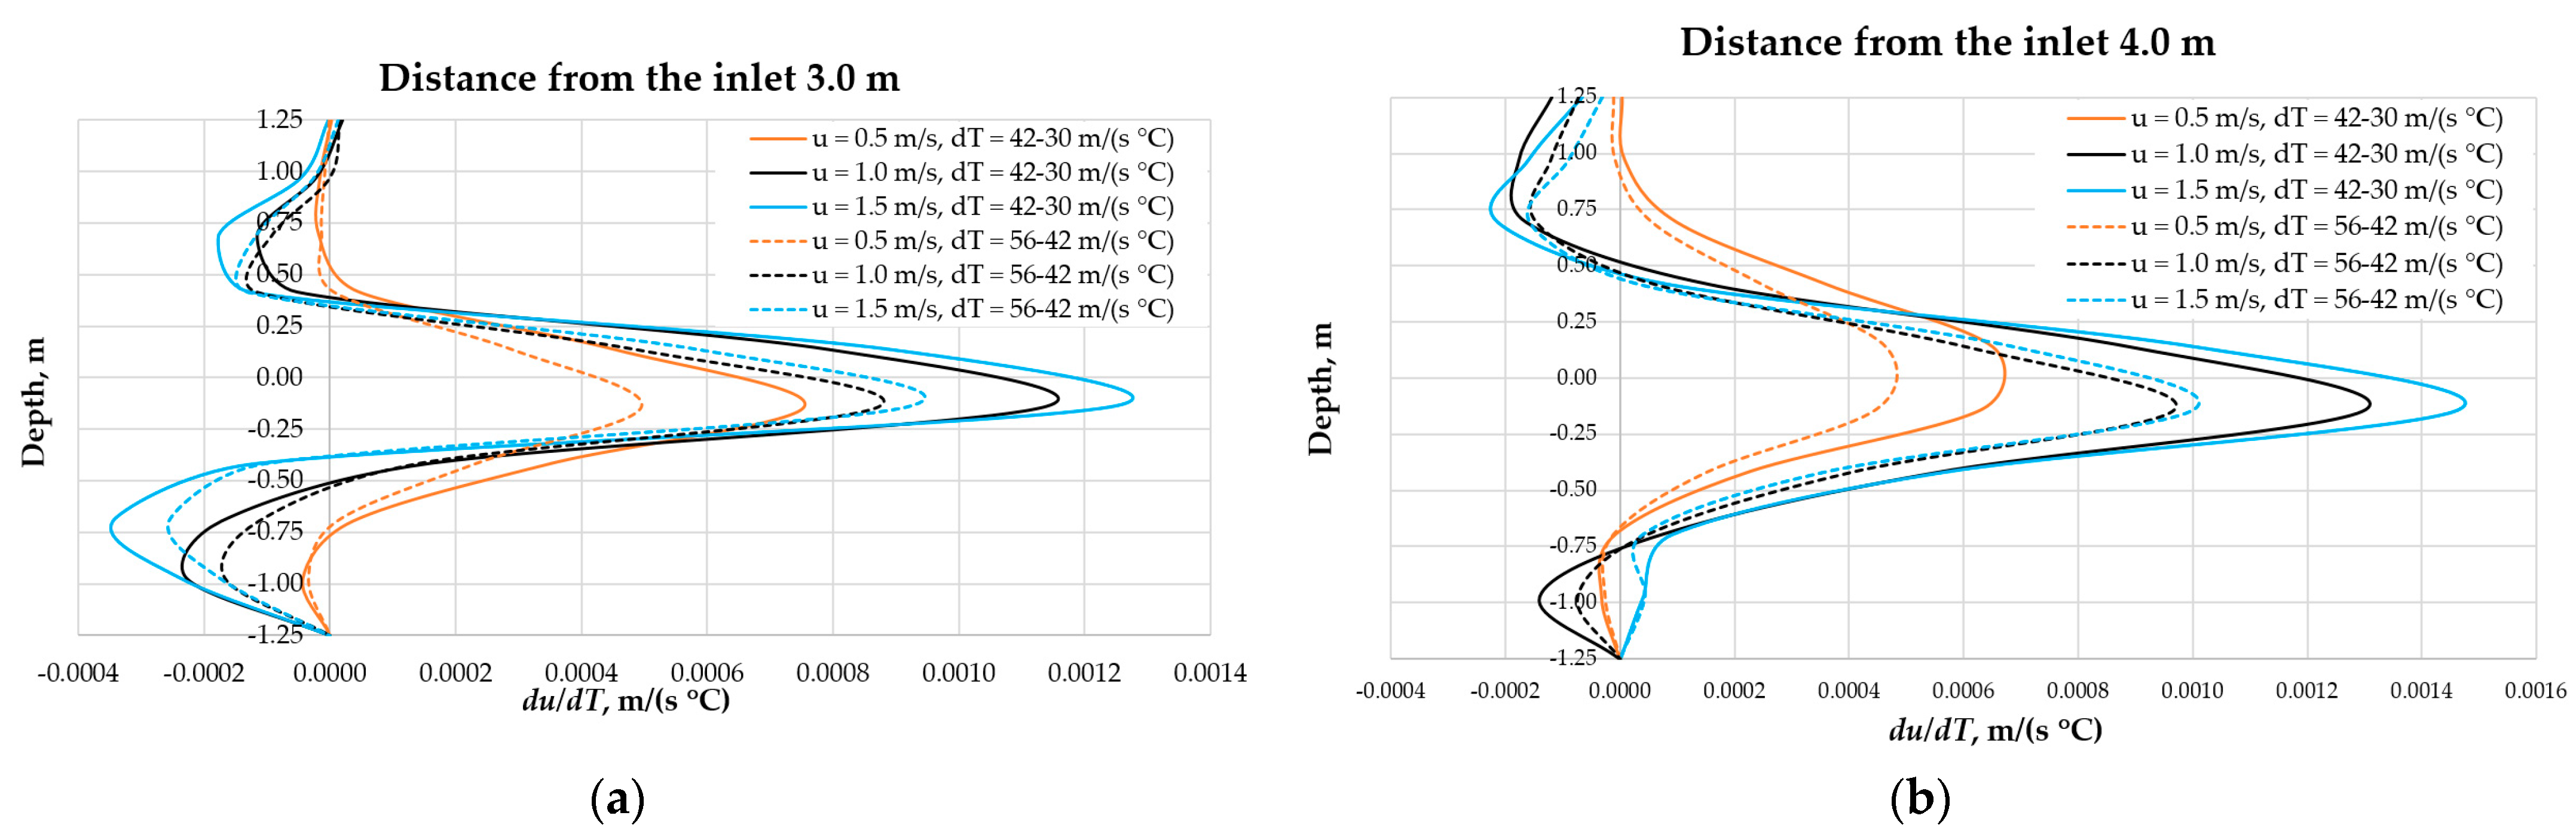
3.3. The Influence of Fluid Temperature on the Energy Intensity of Mixing in CFD Experiments

Through numerical simulations, the influence of the temperature-dependent rheological properties of the carrier fluid on the flow velocity distribution was analyzed. Three rheological variants of the carrier fluid described using the Ostwald de Waele model were assumed for temperatures of 30, 42 and 56 °C (Table 2) and three flow velocities at the tank inlet, i.e., 0.5, 1.0 and 1.5 m/s. Therefore, computational simulations were performed for nine scenarios. In the post-processing of results of the numerical calculations, flow velocity profiles were determined at selected cross-sections created at distances of 1, 2, 3 and 4 m from the reservoir inlet. Fluid flow velocity decreased to varying degrees while the distance from the edge of the inlet increased, depending on temperature. In the cross-section closest to the inlet, i.e., 1.0 m, the influence of fluid temperature (30 °C and 56 °C) on maximum velocity ranged from approx. 3 to 0.6% for the inlet flow velocity of 0.5 and 1.5 m/s, respectively (Figure 12a). The 56 °C fluid flowing over a distance of 4.0 m achieved a higher maximum velocity than the 30 °C fluid (Figure 12d). However, relative velocity decreased with increasing initial velocity and was 19.3, 11.7 and 7.1% for the flow at 0.5, 1.0 and 1.5 m/s, respectively. It follows that the greatest influence of temperature on mixing velocity occurs at a lower mixing velocity. Increasing flow velocity leads to an increase in turbulence, which affects the dissipation of energy to adjacent layers.
Based on the presented velocity profiles (Figure 12a–d), in the tested range, increasing the velocity of mixing at the inlet leads to a proportional increase in maximum velocity and increase in velocity across the cross-section to the main flow direction. Thus, acceleration of the layers adjacent to the main flow can be achieved, obtaining a better mass transfer throughout the volume. That phenomenon was noticed for the entire range of the analyzed inlet flow velocity.
Fluid flow velocity decreases more slowly in a warmer digestate. However, the relative increase in flow velocity as a result of increasing temperature is 40% greater in the lower temperature range, i.e., 30–42 °C, than in the higher temperature range, i.e., 42–56 °C (Figure 13). This corresponds to the rate of change in the dynamic viscosity of water relative to temperature.

4. Discussion

Agricultural biogas plants are distributed energy sources (with relatively low power) that may represent a new development direction in rural areas. Due to the limitation of areas intended for cultivation and problems related to waste management, agricultural waste is becoming an important raw material for the production of biofuels [53]. Unlike wind farms and photovoltaic systems, bio-substrate fermentation is one of the few ways to produce energy in a sustainable and controlled way [54]. Biogas generation may therefore be a promising alternative to other techniques for recovering energy from biomass [55,56].
In the structure of renewable energy production in Poland [57,58,59], the importance of biomass energy production is increasing [60,61,62]. Due to the significant potential and in the context of increasing the volume of renewable energy production, renewable energy produced from agricultural products plays a special role in Poland.
Research by many scientific centers indicates that it is difficult to characterize the rheological behavior of substances with a high content of total solids (TSs) [63]. Standard rheological measurement methods are poorly adapted to that due to the slip effects observed during measurements. In the work [63], a non-standard method was used to determine rheological parameters in dry anerobic digestion using the vane geometry. This made it possible to reduce slip effects. The influence of the increase in feedstock temperature on the reduction in shear stress and intrinsic viscosity was also demonstrated. A number of works (e.g., [64]) based on studies of the rheology of municipal sewage sludge have found that both biomass concentration and temperature affect sludge parameters. At comparable temperatures, the shear stress value, intrinsic viscosity and all Ostwald de Vaele parameters increased with increasing concentration. Problems with obtaining reliable rheological measurement results were observed due to sample aging, especially in this study of the effect of temperature.
Due to the considerable size of digesters in biogas plants, mixing is supposed to induce a circulating current that covers all areas of the digester. However, the specific characteristics of digestate—a non-Newtonian fluid—make it difficult to transmit mixing currents and rapid dissipations of energy. In real-scale reactor studies, Kress et al. [25] showed a significant correlation between dry matter (DM) content and velocity achieved inside the reactor for the same submersible mixer (SMM) parameters. However, an important consequence of the high biomass concentration (TSS) is its strong influence on sediment rheology [65]. In general, the fermentation substrate flow velocity decreased with increasing dry matter content. A slight increase in dry matter content from 7.74 to 10.75% resulted in a decrease in the velocity from a range of 8.71–63.77 cm/s to 0.05–37.36 cm/s, i.e., by an average of 70%. This may be the reason for the occurrence of preferential (shortened) flow paths between the suction and discharge sections of the mixer (short circuit). Thus, the remaining zones of the reactor are not subject to mixing, which contributes to the creation of dead zones in the fermenter [40].
In fluid mechanics, the joint flow of the liquid phase and solid phase is called a two-phase flow, while a mixture consisting of solid particles suspended in a liquid is defined as a hydro-mixture. Therefore, digestate may be referred to as a hydro-mixer. A mixture of solid particles and water can exhibit various non-Newtonian rheological properties but can also (under different conditions) behave rheologically—as a Newtonian fluid [66]. One of the parameters determining the rheological behavior of a hydro-mixture is the particle size and distribution. The measured particle sizes of the analyzed samples are shown in Table 6. The results of five measurements and an average value are also presented. The particle size distribution was characterized using three hydraulic diameters—d10, d50 and d90. The hydraulic diameter d10 was in the range of 4.31–4.59 μm, the diameter d50—in 27.50–29.60 μm and d90—in 125.1–170.1 μm. The mean values of the hydraulic diameter were as follows: d10 = 4.39 μm, d50 = 28.81 μm and d90 =149.9 μm.
The research performed within the scope of the presented work included rheological tests of the bio-feedstock carrier liquid, i.e., that part of the digestate that can be rheologically described as a homogeneous fluid using one of the selected rheological models. The results of this study may be used to model the carrier liquid in CFD tests with one of the selected rheological models and the solid particles as separate objects, the shape of which was also taken into account in this study. A different approach is presented in the study conducted by [67], where the results of measurements for the whole sample are presented, i.e., without separation into carrier liquid and particles. Breaking the rheological description of the biosolids into two components allows for an accurate representation of the flow and mixing conditions in the bioreactor.
The k-ε model used in the CFD simulations seems to be justified due to the geometrical features of the task, i.e., relative straightness of the inlet and streamlines, small influence of wall effects, small pressure gradients in the flows inside the volume of the tank.
Due to the large variation in flow velocities in the fluid domain (also under steady-state conditions), the evaluation of the flow regime based on the Reynolds numbers calculated for the average flow velocities in the cross-sections is insufficient. A more complete picture of the flow conditions can be obtained by calculating the Reynolds numbers in individual finite volumes of the fluid region [68].

5. Conclusions

The research performed within the scope of the presented work included rheological tests of the bio-feedstock carrier liquid, i.e., that part of the digestate that can be rheologically described as a homogeneous fluid using one of the selected rheological models. On the one hand, the studies are complex and time-consuming enough to be conducted during mixing. On the other hand, the parameters and correlations (e.g., temperature-related) are crucial from the perspective of peptizing processes in bioreactors. By comparing the value of the bio-feedstock flow threshold as a function of temperature, which has a decisive influence on the amount of energy required for mixing, and the correlation between process temperature and fermentation efficiency, it is possible to estimate the optimal operating point of the installation for the case under study. The tested carrier fluid in the bioreactor can be described as a fluid that does not meet Newton’s rheological model requirements, i.e., the tested samples were non-Newtonian fluids. Attempts to describe the actual flow curves using the Newton model led to an unacceptable error.
The two most popular rheological models describing the process of non-Newtonian fluid flow in numerical modeling were used in this study—the two-dimensional Bingham model and the Ostwald model. The use of those models allowed the optimization of computation time compared to three-parameter models, such as the Herschel model. The use of a third rheological parameter results in a negligible increase in the accuracy of the description of the real flow curve but significantly increases the numerical calculation time. Based on this conducted research, the Ostwald model is recommended for CFD modeling of the carrier liquid flow in bioreactor chambers.
The presented research was carried out in a wide range of temperatures, including the temperatures most popular in the biogas production process. The obtained results of the dependence of selected rheological parameters on temperature confirm the phenomenon of the inverse dependence of flow resistance to temperature, widely described in the literature. The effect of temperature on flow resistance translates into an increase in maximum flow rates resulting from mixing and the range of the mixing zone. Higher temperatures facilitate mass transfer within the fluid volume and have the greatest impact on flow velocity in the areas further away from the mixers.

Author Contributions

Conceptualization, M.F.G., T.K. and J.D.; methodology, M.F.G., J.D., J.M., P.Z. and R.M.; software, R.M. and M.F.G.; validation, J.D., W.C., P.Z. and P.J.; formal analysis, R.M. and P.J.; investigation, M.F.G. and J.M.; resources, M.F.G. and J.D.; data curation, M.F.G. and J.M.; writing—original draft preparation, M.P. and T.K.; writing—review and editing, F.S.N. and M.P.; visualization, R.M.; supervision, F.S.N.; project administration, T.K. and W.C.; funding acquisition, T.K. and M.F.G. All authors have read and agreed to the published version of the manuscript.

Funding

This publication was financed by the Polish Minister of Science and Higher Education as part of the Strategy of the Poznan University of Life Sciences for 2024–2026 in the field of improving scientific research and development work in priority research areas.

Data Availability Statement

The original contributions presented in this study are included in the article, and further inquiries can be directed to the corresponding author.

Conflicts of Interest

The authors declare no conflicts of interest.

References

  1. Di Capua, F.; Spasiano, D.; Giordano, A.; Adani, F.; Fratino, U.; Pirozzi, F.; Esposito, G. High-solid anaerobic digestion of sewage sludge: Challenges and opportunities. Appl. Energy 2020, 278, 115608. [Google Scholar] [CrossRef]
  2. Sarker, S.; Lamb, J.J.; Hjelme, D.R.; Lien, K.M. A Review of the Role of Critical Parameters in the Design and Operation of Biogas Production Plants. Appl. Sci. 2019, 9, 1915. [Google Scholar] [CrossRef]
  3. Corneli, E.; Dragoni, F.; Adessi, A.; De Philippis, R.; Bonari, E.; Ragaglini, G. Energy conversion of biomass crops and agroindustrial residues by combined biohydrogen/biomethane system and anaerobic digestion. Bioresour. Technol. 2016, 211, 509–518. [Google Scholar] [CrossRef]
  4. Harirchi, S.; Wainaina, S.; Sar, T.; Nojoumi, S.A.; Parchami, M.; Parchami, M.; Varjani, S.; Khanal, S.K.; Wong, J.; Awasthi, M.K.; et al. Microbiological insights into anaerobic digestion for biogas, hydrogen or volatile fatty acids (VFAs): A review. Bioengineered 2022, 13, 6521–6557. [Google Scholar] [CrossRef]
  5. Buan, N.R. Methanogens: Pushing the boundaries of biology. Emerg. Top. Life Sci. 2018, 2, 629–646. [Google Scholar] [CrossRef]
  6. Xiong, H.; Chen, J.; Wang, H.; Shi, H. Influences of volatile solid concentration, temperature and solid retention time for the hydrolysis of waste activated sludge to recover volatile fatty acids. Bioresour. Technol. 2012, 119, 285–292. [Google Scholar] [CrossRef] [PubMed]
  7. Rademacher, A.; Nolte, C.; Schonberg, M.; Klocke, M. Temperature increases from 55 to 75 degrees C in a two-phase biogas reactor result in fundamental alterations within the bacterial and archaeal community structure. Appl. Microbiol. Biotechnol. 2012, 96, 565–576. [Google Scholar] [CrossRef]
  8. Gruszczyński, M.; Błotnicki, J.; Czaban, S.; Tymiński, T. The effect of solid components on the rheological properties of copper ore tailings. In Proceedings of the 19th International Conference on Transport & Sedimentation of Solid Particles, Cape Town, South Africa, 24–27 September 2019; Sobota, J., Haklenwang, R., Eds.; pp. 269–276. [Google Scholar]
  9. Li, W.; Guo, J.; Cheng, H.; Wang, W.; Dong, R. Two-phase anaerobic digestion of municipal solid wastes enhanced by hydrothermal pretreatment: Viability, performance and microbial community evaluation. Appl. Energy 2017, 189, 613–622. [Google Scholar] [CrossRef]
  10. Meng, X.; Yuan, X.; Ren, J.; Wang, X.; Zhu, W.; Cui, Z. Methane production and characteristics of the microbial community in a two-stage fixed-bed anaerobic reactor using molasses. Bioresour. Technol. 2017, 241, 1050–1059. [Google Scholar] [CrossRef]
  11. Sanz, J.L.; Rojas, P.; Morato, A.; Mendez, L.; Ballesteros, M.; González-Fernández, C. Microbial communities of biomethanization digesters fed with raw and heat pre-treated microalgae biomasses. Chemosphere 2017, 168, 1013–1021. [Google Scholar] [CrossRef]
  12. Wang, S.; Ma, F.; Ma, W.; Wang, P.; Zhao, G.; Lu, X. Influence of Temperature on Biogas Production Efficiency and Microbial Community in a Two-Phase Anaerobic Digestion System. Water 2019, 11, 133. [Google Scholar] [CrossRef]
  13. Song, Y.; Qiao, W.; Zhang, J.; Dong, R. Process Performance and Functional Microbial Community in the Anaerobic Digestion of Chicken Manure: A Review. Energies 2023, 16, 4675. [Google Scholar] [CrossRef]
  14. Holm-Nielsen, J.B.; Al Seadi, T. Oleskowicz-Popiel, P. The future of anaerobic digestion and biogas utilization. Bioresour. Technol. 2009, 100, 5478–5484. [Google Scholar] [CrossRef] [PubMed]
  15. Chae, K.J.; Jang, A.; Yim, S.K.; Kim, I.S. The effects of digestion temperature and temperature shock on the biogas yields from the mesophilic anaerobic digestion of swine manure. Bioresour. Technol. 2008, 99, 1–6. [Google Scholar] [CrossRef] [PubMed]
  16. Ward, A.J.; Hobbs, P.J.; Holliman, P.J.; Jones, D.L. Optimisation of the anaerobic digestion of agricultural resources. Bioresour. Technol. 2008, 99, 7928–7940. [Google Scholar] [CrossRef]
  17. Gannoun, H.; Othman, N.B.; Bouallagui, H.; Moktar, H. Mesophilic and thermophilic anaerobic co-digestion of olive mill wastewaters and abattoir wastewaters in an upflow anaerobic filter. Ind. Eng. Chem. Res. 2007, 46, 6737–6743. [Google Scholar] [CrossRef]
  18. Hegde, G.; Pullammanappallil, P. Comparison of thermophilic and mesophilic one-stage, batch, high-solids anaerobic digestion. Environ. Technol. 2007, 28, 361–369. [Google Scholar] [CrossRef]
  19. Fezzani, B.; Cheikh, R.B. Thermophilic anaerobic co-digestion of olive mill wastewater with olive mill solid wastes in a tubular digester. Chem. Eng. J. 2007, 132, 195–203. [Google Scholar] [CrossRef]
  20. Parawira, W.; Murto, M.; Read, J.S.; Mattiasson, B. A study of two-stage anaerobic digestion of solid potato waste using reactors under mesophilic and thermophilic conditions. Environ. Technol. 2007, 28, 1205–1216. [Google Scholar] [CrossRef]
  21. Fang, H.H.P.; Chung, D.W.C. Anaerobic treatment of proteinaceous wastewater under mesophilic and thermophilic conditions. Water Sci. Technol. 1999, 40, 77–84. [Google Scholar] [CrossRef]
  22. Xiao, L.; Wang, Y.; Lichtfouse, E.; Li, Z.; Kumar, P.S.; Liu, J.; Feng, D.; Yang, Q.; Liu, F. Effect of Antibiotics on the Microbial Efficiency of Anaerobic Digestion of Wastewater: A Review. Front. Microbiol. 2021, 11, 611613. [Google Scholar] [CrossRef] [PubMed]
  23. Lemmer, A.; Nägele, H.; Sondermann, J. How Efficient are Agitators in Biogas Digesters? Determination of the Efficiency of Submersible Motor Mixers and Incline Agitators by Measuring Nutrient Distribution in Full-Scale Agricultural Biogas Digesters. Energies 2013, 6, 6255–6273. [Google Scholar] [CrossRef]
  24. Slatter, P. The Engineering Hydrodynamics of Viscoplastic Suspensions. Part. Sci. Technol. 2011, 29, 139–150. [Google Scholar] [CrossRef]
  25. Kress, P.; Nägele, H.J.; Lemmer, A.; Kolb, B. Flow velocities and flow profiles in a thoroughly mixed biogas fermenter. Landtechnik 2020, 75, 35–50. [Google Scholar] [CrossRef]
  26. Caillet, H.; Adelard, L. A Review on the rheological behavior of organic waste for CFD modeling of flows in anaerobic reactors. Waste Biomass Valoriz. 2023, 14, 389–405. [Google Scholar] [CrossRef]
  27. Collivignarelli, M.C.; Carnevale Miino, M.; Bellazzi, S.; Caccamo, F.M.; Durante, A.; Abbà, A. Review of rheological behaviour of sewage sludge and its importance in the management of wastewater treatment plants. Water Pract. Technol. 2022, 17, 483–491. [Google Scholar] [CrossRef]
  28. Baudez, J.C.; Slatter, P.; Eshtiaghi, N. The impact of temperature on the rheological behaviour of anaerobic digested sludge. Chem. Eng. J. 2013, 215–216, 182–187. [Google Scholar] [CrossRef]
  29. Lindmark, J.; Thorin, E.; Fdhila, R.B.; Dahlquista, E. Effects of mixing on the result of anaerobic digestion: Review. Renew. Sustain. Energy Rev. 2014, 40, 1030–1047. [Google Scholar] [CrossRef]
  30. Di Maria, F.; Sisani, F.; Norouzi, O.; Mersky, R.L. The effectiveness of anaerobic digestion of bio-waste in replacing primary energies: An EU28 case study. Renew. Sustain Energy Rev. 2019, 108, 347–354. [Google Scholar] [CrossRef]
  31. Caillet, H.; Bastide, A.; Adelard, L. Advances in computational fluid dynamics modeling of anaerobic digestion process for renewable energy production: A review. Clean. Waste Syst. 2023, 6, 100124. [Google Scholar] [CrossRef]
  32. López-Jiménez, P.A.; Escudero-González, J.; Martínez, T.M.; Montañana, V.F.; Gualtieri, C. Application of CFD methods to an anaerobic digester: The case of Ontinyent WWTP, Valencia, Spain. J. Water Process Eng. 2015, 7, 131–140. [Google Scholar] [CrossRef]
  33. Vesvikar, M.S.; Al-Dahhan, M. Flow pattern visualization in amimic anaerobic digester using CFD. Biotechnol. Bioeng. 2005, 89, 719–732. [Google Scholar] [CrossRef] [PubMed]
  34. Wu, B.; Chen, S. CFD simulation of non-Newtonian fluid flow in anaerobic digesters. Biotechnol. Bioeng. 2007, 99, 700–711. [Google Scholar] [CrossRef]
  35. Caillet, H.; Bastide, A.; Adelard, L. CFD simulations in mechanically stirred tank and flow field analysis: Application to the wastewater (Sugarcane Vinasse) anaerobic digestion. In Promising Techniques for Wastewater Treatment and Water Quality Assessment; Moujdin, I.A., Summers, J.K., Eds.; IntechOpen: London, UK, 2020; p. 93926. [Google Scholar] [CrossRef]
  36. Stafford, D.A. The effects of mixing and volatile fatty acid concentrations on anaerobic digester performance. Biomass 1982, 2, 43–55. [Google Scholar] [CrossRef]
  37. Stroot, P.G.; McMahon, K.D.; Mackie, R.I.; Raskin, L. Anaerobic codigestion of municipal solid waste and biosolids under various mixing conditions—I. Digester performance. Water Res. 2001, 35, 1804–1816. [Google Scholar] [CrossRef]
  38. Kaparaju, P.; Buendiaa, I.; Ellegaardb, L.; Angelidakiaa, I. Effect of mixing on methane production during thermophilic anaeroboc digestion of manure: Lab-scale and pilot-scale studies. Bioresour. Technol. 2007, 99, 4919–4928. [Google Scholar] [CrossRef]
  39. Singh, B.; Szamosi, Z.; Siménfalvi, Z. State of the art on mixing in an anaerobic digester: A review. Renew. Energy 2019, 141, 922–936. [Google Scholar] [CrossRef]
  40. Rostalski, K. Tauchmotorrührwerke in Biogasanlagen—Ein Beitrag zur Effizienzsteigerung. In Tagungsband zur 18. Jahrestagung des Fachverbandes Biogas e. V.—Biogas: Dezentral Erzeugen—Regional Profitieren—International Gewinnen; Fachverband Biogas e. V.: Hannover, Germany, 2009; pp. 59–65. [Google Scholar]
  41. Jankowska, H.; Dzido, A.; Krawczyk, P. Determination of Rheological Parameters of Non-Newtonian Fluids on an Example of Biogas Plant Substrates. Energies 2023, 16, 1128. [Google Scholar] [CrossRef]
  42. Gruszczyński, M.; Kałuża, T.; Mazurkiewicz, J.; Zawadzki, P.; Pawlak, M.; Matz, R.; Dach, J.; Czekała, W. Preparation of Samples for the Study of Rheological Parameters of Digested Pulps in a Bioreactor of an Agricultural Biogas Plant. Energies 2024, 17, 965. [Google Scholar] [CrossRef]
  43. Czekała, W.; Jasiński, T.; Grzelak, M.; Witaszek, K.; Dach, J. Biogas Plant Operation: Digestate as the Valuable Product. Energies 2022, 15, 8275. [Google Scholar] [CrossRef]
  44. DIN EN ISO 3219 International Standard ISO 3219-1:2021; Rheology—Part 1: Vocabulary and symbols for rotational and oscillatory rheometry. Deutsches Institut fur Normung E.V. (DIN): Berlin, Germany, 2021.
  45. DIN 53019 European Standards DIN 53019-1; Viscometry—Measurement of Viscosities and Flow Curves by Means of Rotational Viscometers—Part 1: Principles and Geometry of Measuring System. Deutsches Institut fur Normung E.V. (DIN): Berlin, Germany, 2008.
  46. Osadolor, O.A.; Jabbari, M.; Nair, R.B.; Lennartsson, P.R.; Taherzadeh, M.J. Effect of media rheology and bioreactor hydrodynamics on filamentous fungi fermentation of lignocellulosic and starch-based substrates under pseudoplastic flow conditions. Bioresour Technol. 2018, 263, 250–257. [Google Scholar] [CrossRef] [PubMed]
  47. Dziubiński, M.; Kiljański, T.; Sęk, J. Theoretical Foundations and Measurement Methods of Rheology, 1st ed.; Lodz University of Technology Publishing: Lodz, Poland, 2014; pp. 1–295. (In Polish) [Google Scholar]
  48. Leonzio, G. Study of mixing systems and geometric configurations for anaerobic digesters using CFD analysis. Renew. Energy 2018, 123, 578–589. [Google Scholar] [CrossRef]
  49. Bergamo, U.; Viccione, G.; Coppola, S.; Landi, A.; Meda, A.; Gualtieri, C. Analysis of anaerobic digester mixing: Comparison of long shafted paddle mixing vs gas mixing. Water Sci. Technol. 2020, 81, 1406–1419. [Google Scholar] [CrossRef] [PubMed]
  50. Wątroba, J. Straightforward About Fitting Straights, or Linear Regression Analysis in Practice; StatSoft Polska: Kraków, Poland, 2011; pp. 31–44. (In Polish) [Google Scholar]
  51. Lee, J.K.; Ko, J.; Kim, Y.S. Rheology of Fly Ash Mixed Tailings Slurries and Applicability of Prediction Models. Minerals 2017, 7, 165. [Google Scholar] [CrossRef]
  52. Czaban, S. Etermination of Parameters of Hydraulic Transport in Pipelines for Rheostable Diphase Mixtures; Scientific Papers of the Agricultural University No. 60; Wydawnictwo Akademii Rolniczej: Wrocław, Poland, 1987; pp. 1–76. (In Polish) [Google Scholar]
  53. Kozłowski, K.; Mazurkiewicz, J.; Chełkowski, D.; Jeżowska, A.; Cieślik, M.; Brzoski, M.; Smurzyńska, A.; Dongmin, Y.; Wei, Q. The effect of mixing during laboratory fermentation of maize straw with thermophilic technology. J. Ecol. Eng. 2018, 19, 93–98. [Google Scholar] [CrossRef]
  54. Annas, S.; Elfering, M.; Jantzen, H.; Scholz, J.; Janoske, U. Experimental analysis of mixing-processes in biogas plants. Chem. Eng. Sci. 2022, 258, 117767. [Google Scholar] [CrossRef]
  55. Das, P.; Khan, S.; AbdulQuadir, M.; Thaher, M.; Waqas, M.; Easa, A.; Attia, E.S.M.; Al-Jabri, H. Energy recovery and nutrients recycling from municipal sewage sludge. Sci. Total Environ. 2020, 715, 13677515. [Google Scholar] [CrossRef]
  56. Al-Saidi, M.; Das, P.; Saadaoui, I. Circular Economy in Basic Supply: Framing the Approach for the Water and Food Sectors of the Gulf Cooperation Council Countries. Sustain. Prod. Consum. 2021, 27, 1273–1285. [Google Scholar] [CrossRef]
  57. Kałuża, T.; Hämmerling, M.; Zawadzki, P.; Czekała, W.; Kasperek, R.; Sojka, M.; Mokwa, M.; Ptak, M.; Szkudlarek, A.; Czechlowski, M.; et al. The hydropower sector in Poland: Historical development and current status. Renew. Sustain. Energy Rev. 2022, 158, 112150. [Google Scholar] [CrossRef]
  58. Kałuża, T.; Hämmerling, M.; Zawadzki, P.; Czekała, W.; Kasperek, R.; Sojka, M.; Mokwa, M.; Ptak, M.; Szkudlarek, A.; Czechlowski, M.; et al. The hydropower sector in Poland: Barriers and the outlook for the future. Renew. Sustain. Energy Rev. 2022, 163, 112500. [Google Scholar] [CrossRef]
  59. Mazurkiewicz, J. Energy and Economic Balance between Manure Stored and Used as a Substrate for Biogas Production. Energies 2022, 15, 413. [Google Scholar] [CrossRef]
  60. Pochwatka, P.; Kowalczyk-Juśko, A.; Sołowiej, P.; Wawrzyniak, A.; Dach, J. Biogas plant exploitation in a middle-sized dairy farm in Poland: Energetic and economic aspects. Energies 2020, 13, 6058. [Google Scholar] [CrossRef]
  61. Mazurkiewicz, J. Loss of Energy and Economic Potential of a Biogas Plant Fed with Cow Manure due to Storage Time. Energies 2023, 16, 6686. [Google Scholar] [CrossRef]
  62. Mazurkiewicz, J. The Impact of Manure Use for Energy Purposes on the Economic Balance of a Dairy Farm. Energies 2023, 16, 6735. [Google Scholar] [CrossRef]
  63. Beugre, E.Y.-M.; Gnagne, T. Vane geometry for measurement of influent rheological behavior in dry anaerobic digestion. Renew. Sustain. Energy Rev. 2022, 155, 111928. [Google Scholar] [CrossRef]
  64. Cao, X.; Jiang, Z.; Cui, W.; Wang, Y.; Yang, P. Rheological Properties of Municipal Sewage Sludge: Dependency on Solid Concentration and Temperature. Procedia Environ. Sci. 2016, 31, 113–121. [Google Scholar] [CrossRef]
  65. Füreder, K.; Svardal, K.; Krampe, J.; Kroiss, H. Rheology and friction loss of raw and digested sewage sludge with high TSS concentrations: A case study. Water Sci. Technol. 2017, 1, 276–286. [Google Scholar] [CrossRef]
  66. Dhodapkar, S.; Jacob, K.; Hu, S. Fluid-solid flow in duct. In Multiphase Flow Handbook; Crowe, C.T., Ed.; CRC Press Taylor & Francis Group: Boca Raton, FL, USA, 2006; Chapter 4. [Google Scholar]
  67. Mönch-Tegeder, M.; Lemmer, A.; Hinrichs, J.; Oechsner, H. Development of an in-line process viscometer for the full-scale biogas process. Bioresour. Technol. 2015, 178, 278–284. [Google Scholar] [CrossRef]
  68. Ferrari, C.; Beccati, N. Mixing Phase Study of a Concrete Truck Mixer via CFD Multiphase Approach. J. Eng. Mech. 2022, 148, 0002042. [Google Scholar] [CrossRef]
Figure 1. Przybroda agricultural biogas plant in Przybroda village, Poland.
Energies 17 06111 g001
Figure 2. Comparison of the pseudo-curve and the real flow curve, and description of the real curve using the Ostwald power law model.
Energies 17 06111 g002
Figure 3. Comparison of the course of the real flow curve and the description using the Newton, the Bingham and the Ostwald de Waele models.
Energies 17 06111 g003
Figure 4. Comparison of the course of the real flow curve and description using the Bingham model.
Energies 17 06111 g004
Figure 5. View of the computational domain of the tank used in numerical simulations of the digestate flow range.
Energies 17 06111 g005
Figure 6. Area of measurement results for three parameters: shear stress, actual deformation gradient and temperature.
Energies 17 06111 g006
Figure 7. The sample and circulating fluid temperature change as a function of time during the measurements. Measurements for two temperature settings with an upward difference of 2 °C.
Energies 17 06111 g007
Figure 8. Graphs showing the fit of the models: linear (a,c) and exponential (b,d), describing the course of the rheological parameters of Bingham models: flow threshold and viscosity. Temperatures range from 30 °C to 56 °C.
Energies 17 06111 g008
Figure 9. Area of fluid deformation results as a function of temperature of the Bingham model for the linear model. Temperatures range from 30 °C to 56 °C.
Energies 17 06111 g009
Figure 10. Figures showing the fit of linear and exponential models: linear (a,c) and exponential (b,d), describing the course of rheological parameters of Ostwald models: consistency constant and flow rate. Temperatures range from 30 °C to 56 °C.
Energies 17 06111 g010
Figure 11. Area of fluid deformation results as a function of temperature of the Ostwald model for the linear model. Temperatures range from 30 °C to 56 °C.
Energies 17 06111 g011
Figure 12. Changes in fluid velocity profiles in the tank at distances of (a) 1 m, (b) 2 m, (c) 3 m and (d) 4 m from the inlet cross-section in the performed simulations.
Energies 17 06111 g012
Figure 13. Changes in fluid flow velocity depending on the temperature in the tank at distances of (a) 3 m and (b) 4 m from the inlet cross-section in the performed simulations.
Energies 17 06111 g013
Table 1. Summary of basic parameters of samples used in rheological tests.
Name/ParameterspHAverage Dry Matter,
%
Average Dry Organic Matter,
%
Whole sample before sieving8.28.3775.66
Sample after 0.5 mm sieving8.45.9366.89
Table 2. Values of rheological parameters and assessment of the fit of the measurement campaign 1.
MeasurementBingham ModelOstwald de Waele’s Model
TemperatureParametersFitParametersFit
TτoηBR2MAEMAPEKonoR2MAEMAPE
°CPaN·s/m2-Pa%Pa·sn--Pa%
301.82490.02970.96670.23991.83900.45650.52460.99860.05410.5157
321.76880.03010.96720.23552.39110.43490.53450.99840.06150.3602
341.69190.02920.97180.19411.39700.40890.53950.99730.08000.8707
361.69060.02590.96150.22731.71450.44010.50840.99890.04530.4300
381.72730.02530.95830.22771.61560.46410.49560.99820.04900.3741
401.60020.02340.96470.18310.83890.42630.49720.99660.06800.8123
421.47770.02220.96280.18361.22340.39010.50220.99780.05180.6435
441.45280.02160.95700.18991.15660.39470.49410.98960.06870.5828
461.41290.02040.95830.17711.14200.38530.48980.99330.06280.5918
481.37300.01920.95970.16421.12740.37600.48540.99700.05700.6008
501.27090.01780.96440.13720.62900.34750.48590.99520.06270.8735
521.33370.01700.96030.13180.36340.38970.45980.99250.07480.8741
541.26640.01720.95520.14140.83020.35820.47440.99390.06070.6535
561.22410.01650.96560.11940.32600.34130.47680.99290.07221.0031
MAE—mean absolute error; MAPE—mean absolute percentage error; R2—coefficient of determination.
Table 3. Values of rheological parameters and assessment of the fit of the measurement campaign 2 (control).
ControlBingham ModelOstwald de Waele’s Model
TemperatureParametersFitParametersFit
TτoηBR2MAEMAPEKonoR2MAEMAPE
°CPaN·s/m2-Pa%Pa·sn--Pa%
301.49390.02670.97250.19421.42770.35390.54900.99850.05460.8379
321.32480.02570.97590.16641.85240.30150.56880.99790.05790.8508
341.72790.02690.96550.21921.36910.44550.51200.99810.04920.6466
361.69710.02540.95940.22561.97850.44910.50180.99860.04940.2950
381.66420.02440.96380.21121.84550.43650.50050.99860.03760.3938
401.41520.02370.96730.18341.70970.35170.52980.99760.06220.5836
421.38690.02160.96460.17541.55710.35550.51370.99810.04710.5659
441.51950.02120.96080.18481.05290.41710.48430.99760.05060.6203
461.48800.01940.95530.17511.14390.42330.46890.99760.04840.4961
481.46810.01880.95280.17961.21590.42350.46380.99800.04210.3916
501.41270.01830.95690.16200.79050.40150.46840.99720.04930.6389
521.36190.01750.95710.15640.80940.39510.46220.99660.04950.6117
541.27620.01750.95520.14900.92860.36170.47530.99400.06000.6030
561.35960.01650.95440.13400.45610.41210.44590.99250.07230.7092
Table 4. Values of fit parameters of linear and exponential models, describing the course of rheological parameters of Bingham models: flow threshold and viscosity. Temperatures range from 30 °C to 56 °C.
Bingham Model
R2MAEMAPE
-Pa%
Linear modelτo0.95620.03282.243
-N·s/m2%
Linear modelηB0.96750.00125.892
-Pa%
Exponential modelτo0.95820.03042.015
-N·s/m2%
Exponential modelηB0.98050.00072.973
Table 5. Values of fit parameters of models: linear and exponential, describing the course of rheological parameters of Ostwald models: consistency constant and flow rate. Temperatures range from 30 °C to 56 °C.
Ostwald Model
R2MAEMAPE
-Pa·sn%
Linear modelKO0.95620.76620.0137
--%
Linear modelno0.96750.81570.0078
-Pa·sn%
Exponential modelKO0.95820.76160.0152
--%
Exponential modelno0.98050.82210.0153
Table 6. Sizes of analyzed particles.
d10d50d90
-µm
Sample 14.2328.36144.9
Sample 24.3229.12155.4
Sample 34.4129.45170.1
Sample 44.5929.60154.1
Sample 54.3127.50125.1
Average4.3928.81149.9
Disclaimer/Publisher’s Note: The statements, opinions and data contained in all publications are solely those of the individual author(s) and contributor(s) and not of MDPI and/or the editor(s). MDPI and/or the editor(s) disclaim responsibility for any injury to people or property resulting from any ideas, methods, instructions or products referred to in the content.

